How does a multi-representational mathematical ICT tool mediate teachers’ knowledge?
390
How does a multi-representational mathematical ICT tool mediate teachers’ mathematical and pedagogical knowledge concerning variance and invariance? Alison Clark-Wilson Institute of Education, University of London 2010
-
Upload
alison-clark-wilson -
Category
Documents
-
view
214 -
download
0
description
Doctoral Thesis Insitute of Education 2010
Transcript of How does a multi-representational mathematical ICT tool mediate teachers’ knowledge?
How does a multi-representational mathematical
ICT tool mediate teachers’ mathematical and
pedagogical knowledge concerning variance and
invariance?
Alison Clark-Wilson
Institute of Education, University of London
2010

How does a multi-representational mathematical ICT tool mediate teachers‟ mathematical and
pedagogical knowledge concerning variance and invariance?
2
ABSTRACT
This study aims to examine how teachers’ mathematical and pedagogical
knowledge develop as they learn to use a multi-representational technological tool,
the TI-Nspire handheld device and computer software. It is conducted as an
enquiry into the learning trajectories of a group of secondary mathematics teachers
as they begin to use the device with a focus on their interpretations of
mathematical variance and invariance. The research is situated within an English
secondary school setting and it seeks to reveal how teachers’ ideas shape, and are
shaped by, their use of the technology through a scrutiny of the lesson artefacts,
semi-structured interviews and lesson observations. Analysis of the data reveals the
importance of the idea of the ‘hiccup’; that is the perturbation experienced by
teachers during lessons stimulated by their use of the technology, which illuminates
discontinuities within teachers’ knowledge. The study concludes that the use of
such a multi-representational tool can substantially change the way in which both
the teachers and their students perceive the notions of variance and invariance
within dynamic mathematical environments. Furthermore, the study classifies the
types of perturbations that underpin this conclusion. The study also contributes to
the discourse on the design of mathematical problems and their associated
instrumentation schemes in which linked multiple representations offer a new
environment for developing mathematical meanings. This thesis makes an original
contribution to understanding what and how teachers learn about the concept of
mathematical variance and invariance within a technological environment.
KEYWORDS
Hiccup, instrumental genesis, mathematics education, mathematical generalisation,
multiple representational technology, teacher development, variance and
invariance.

How does a multi-representational mathematical ICT tool mediate teachers‟ mathematical and
pedagogical knowledge concerning variance and invariance?
3
ACKNOWLEDGEMENTS
I would like to acknowledge the contribution made to this research and thesis by:
Professor Richard Noss who, as my supervisor posed the challenging questions and
exhibited great patience in supporting the evolution of this study.
Professor Afzal Ahmed and Honor Williams, whose influences on my personal
research and scholarship have undoubtedly shaped the person that I am - and
whose friendship and ongoing support I appreciate greatly.
Professor Adrian Oldknow, whose unwavering enthusiasm for new technologies has
paved the way for many of my experiences and from whom I continue to learn.
The teachers involved in both phases of the research, and in particular the two
teachers involved in the Phase Two, who committed much personal time in
familiarising themselves with the technology, planning and evaluating their lessons
and making themselves available for interviews and discussions, and without whom
the research would not have been possible.
In addition, the data collection carried out during Phase One of the study (and
some of the data collection in Phase Two) was funded by Texas Instruments as part
of two evaluation research projects, subsequently reported in Clark-Wilson (2009,
2008). My thanks go to Andrea Forbes, Raffaella Fiz and Rob Foshay for their
support and for their confidence in me as a ‘new researcher’.
Finally, to my husband Alan, whose love and support, both intellectual and
practical, exemplifies that of a true critical friend and who undoubtedly enabled me
to manage the work-life imbalance necessary to complete this academic
achievement!

How does a multi-representational mathematical ICT tool mediate teachers‟ mathematical and
pedagogical knowledge concerning variance and invariance?
4
AUTHOR’S DECLARATION
I hereby declare that, except where explicit attribution is made, the work presented
in this thesis is entirely my own.
Word count (exclusive of appendices, list of references and bibliography):
77,345 words
The copyright of this thesis rests with the author and no quotation from it or
information derived from it may be published without prior written consent.

How does a multi-representational mathematical ICT tool mediate teachers‟ mathematical and
pedagogical knowledge concerning variance and invariance?
5
TABLE OF CONTENTS
Abstract ....................................................................................................... 2
Keywords ..................................................................................................... 2
Acknowledgements ........................................................................................ 3
Author’s Declaration ....................................................................................... 4
Table of Contents .......................................................................................... 5
List of Tables ............................................................................................... 10
List of Figures ............................................................................................. 12
Glossary ..................................................................................................... 22
Foreword .................................................................................................... 23
1 Introduction ......................................................................................... 27
1.1 Introduction ................................................................................... 27
1.2 A description of the study ................................................................ 27
1.3 Why this study is important ............................................................. 27
1.4 Context of the study ....................................................................... 28
1.5 Premises about teaching and learning mathematics ............................ 29
1.6 Outline aim for the research ............................................................ 31
1.7 Overview of the study ..................................................................... 31
2 The notion of a multi-representational technological tool for mathematics .... 33
2.1 Introduction ................................................................................... 33
2.2 Technological tools for mathematical learning .................................... 33
2.3 The mathematical focus for the study ............................................... 36
2.4 Multi-representational environments for mathematics ......................... 38
2.4.1 The selected multi-representational technology and its functionality 39
2.4.2 Calculator application ............................................................... 41
2.4.3 Graphs and Geometry application .............................................. 42
2.4.4 Lists and spreadsheet application............................................... 43
2.4.5 Data and statistics application ................................................... 43
2.4.6 Notes application ..................................................................... 44
2.4.7 Defining variables – functionality and pedagogical approaches ...... 44
2.5 Summary ...................................................................................... 46
3 Literature review ................................................................................... 47
3.1 Introduction ................................................................................... 47
3.2 Coming to know new technologies and the role of technology in
developing teachers’ subject and pedagogic knowledge ................................. 47
3.2.1 The process of instrumental genesis ........................................... 47
3.2.2 Teachers’ pedagogical maps ...................................................... 52

How does a multi-representational mathematical ICT tool mediate teachers‟ mathematical and
pedagogical knowledge concerning variance and invariance?
6
3.2.3 Teachers’ emergent practices with technology ............................. 56
3.2.4 Implications for my study ......................................................... 57
3.3 Mathematical variance and invariance ............................................... 57
3.3.1 The development of representation systems for mathematics ........ 58
3.3.2 Key research studies ................................................................ 60
3.3.3 Implications for my study ......................................................... 61
3.4 Interpreting mathematics teachers’ professional learning – what and how?
61
3.4.1 Teacher knowledge and interpretations of pedagogy .................... 62
3.4.2 Making sense of the process of teacher learning .......................... 67
3.4.3 Implications for my study ......................................................... 69
3.5 Summary and refined aims for the study. .......................................... 69
4 The research methodology ..................................................................... 70
4.1 Introduction ................................................................................... 70
4.2 Theoretical stance for the research process ....................................... 70
4.3 Phase one: Introducing the MRT to the teachers................................. 73
4.3.1 Selection of the teachers for the study ....................................... 74
4.3.2 Process of teacher development ................................................ 75
4.3.3 Methods of data collection during Phase One ............................... 76
4.3.4 My role as researcher/in-service teacher educator ....................... 85
4.3.5 Other support for the teachers during Phase One ......................... 88
4.3.6 Process of data analysis during Phase One .................................. 88
4.4 Ethical considerations ..................................................................... 94
4.5 Summary ...................................................................................... 94
5 Outcomes of Phase One and the design and methodology of Phase Two. ...... 96
5.1 Introduction ................................................................................... 96
5.2 Description of Phase One of the research........................................... 96
5.3 Analysis of the Phase One data ........................................................ 97
5.3.1 Designing activities that focus on variance and invariance – teachers’
emergent practices............................................................................... 102
5.3.2 Evidence of teacher learning – developing the research lens ........ 118
5.3.3 Establishing the validity of the pedagogical map ......................... 122
5.4 Designing the methodology for Phase Two ........................................ 124
5.4.1 Selection of the teachers for Phase Two of the study ................... 126
5.4.2 Methods of data collection in Phase Two .................................... 127
5.4.3 Summary of the Phase Two data .............................................. 130
5.4.4 Process of data analysis during Phase Two ................................. 135

How does a multi-representational mathematical ICT tool mediate teachers‟ mathematical and
pedagogical knowledge concerning variance and invariance?
7
5.4.5 My role during Phase Two ........................................................ 137
5.5 The emergence of the hiccup as an organising principle ..................... 137
5.6 Summary ..................................................................................... 139
6 Introducing the teachers and analysing their mathematics lessons ............. 140
6.1 Introduction .................................................................................. 140
6.2 Introducing Tim ............................................................................ 140
6.2.1 Tim’s participation during Phase One ......................................... 143
6.2.2 Observing Tim in the classroom - The lesson introducing Pythagoras’
theorem 144
6.2.3 Evidence of a hiccup ............................................................... 160
6.2.4 How is the description of the lesson activity informed by the
theoretical underpinning? ...................................................................... 162
6.3 Introducing Eleanor ....................................................................... 163
6.3.1 Eleanor’s participation during Phase One ................................... 164
6.3.2 Observing Eleanor in the classroom – The lesson introducing
simultaneous equations ........................................................................ 165
6.3.3 Evidence of a hiccup ............................................................... 180
6.3.4 How is the description of the lesson activity informed by the
theoretical underpinning? ...................................................................... 183
6.4 Methodological considerations for the coding of lesson hiccups ............ 185
6.5 Summary ..................................................................................... 186
7 Charting teachers’ trajectories: The case studies ...................................... 187
7.1 Introduction .................................................................................. 187
7.2 Tim’s trajectory ............................................................................. 187
7.2.1 Tim’s developing conceptions of variance and invariance ............. 189
7.2.2 Tim’s hiccups ......................................................................... 193
7.2.3 Tim’s situated learning ............................................................ 195
7.3 Eleanor’s trajectory ....................................................................... 197
7.3.1 Eleanor’s conceptions of variance and invariance ........................ 198
7.3.2 Eleanor’s hiccups .................................................................... 203
7.3.3 Eleanor’s situated learning ....................................................... 204
7.4 The emergence of new theoretical ideas ........................................... 208
7.5 Summary ..................................................................................... 208
8 Discussion ........................................................................................... 209
8.1 Introduction .................................................................................. 209
8.2 What did the teachers learn? .......................................................... 209
8.2.1 Mathematical knowledge development concerning variance and

How does a multi-representational mathematical ICT tool mediate teachers‟ mathematical and
pedagogical knowledge concerning variance and invariance?
8
invariance ........................................................................................... 209
8.2.2 Pedagogic knowledge development ........................................... 213
8.2.3 The process of instrumental genesis .......................................... 216
8.3 How did the teachers learn? - The emergence of the hiccup as an
ontological innovation .............................................................................. 218
8.3.1 Hiccups – the emergent classifications ....................................... 219
8.3.2 Hiccups – their role in teacher learning ...................................... 229
8.4 The impact of the classroom network technology on Eleanor and Tim’s
learning ................................................................................................. 232
8.5 Summary ..................................................................................... 235
9 Conclusions and implications ................................................................. 236
9.1 Introduction .................................................................................. 236
9.2 Summary of the findings ................................................................ 236
9.2.1 Reconsidering the triad of instrumented activity ......................... 236
9.2.2 How teachers’ mathematical ideas about variance and invariance
shaped and were shaped by their uses of the technology .......................... 240
9.2.3 Designing activities that privilege the exploration of variance and
invariance in a MRT environment ........................................................... 242
9.2.4 The significance of the hiccup in understanding and articulating
pedagogy ............................................................................................ 243
9.2.5 Peripheral findings from the research ........................................ 245
9.3 Rethinking mathematics teachers’ professional development concerning
multi-representational technology ............................................................. 246
9.3.1 The need for a clear mathematical focus .................................... 247
9.3.2 The role of the ‘significant other’ in supporting teachers’ situated
learning 247
9.3.3 The professional development timeline ...................................... 249
9.4 Limitations of the research design and methodology .......................... 250
9.5 Directions for further research ........................................................ 250
10 References .......................................................................................... 252
11 Appendices.......................................................................................... 259
Appendix 1: Project agreement .................................................................... 259
Appendix 2: Ethical Agreement ..................................................................... 260
Appendix 3: Summary of Phase One lesson data ............................................ 261
Appendix 4: Summary of activities submitted during Phase One ....................... 265
Appendix 5: Coding categories and sub-categories for teacher learning in Phase
One .......................................................................................................... 301

How does a multi-representational mathematical ICT tool mediate teachers‟ mathematical and
pedagogical knowledge concerning variance and invariance?
9
Appendix 6: Analysis of Tim’s Phase One lesson data ...................................... 302
Appendix 7: Analysis of Eleanor’s Phase One lesson data ................................. 312
Appendix 8: Summary of Tim’s Phase Two data .............................................. 327
Appendix 9: Detailed descriptions and analyses of Tim’s Phase Two activities ..... 330
STP6 Pythagoras exploration ................................................................. 330
STP7 Circles and lines ........................................................................... 334
STP8 Quadratic curves .......................................................................... 343
STP9 Equivalent quadratic equations ...................................................... 348
STP10 Linear graphs ............................................................................ 359
Appendix 10 Summary of Eleanor’s Phase Two data ........................................ 364
Appendix 11: Detailed descriptions and analyses of Eleanor’s Phase Two activities
................................................................................................................ 366
CEL6 Transforming graphs .................................................................... 366
CEL7 Generating circles ........................................................................ 373
CEL8 Triangles and squares ................................................................... 378
CEL9 Crossing linear graphs .................................................................. 383
Appendix 12: Eleanor’s lesson plan and lesson structure for ‘Crossing linear graphs’
[CEL9] ...................................................................................................... 385
Appendix 13: Tim’s repertoire of responses to his classroom hiccups................. 387
Appendix 14: Eleanor’s repertoire of responses to her classroom hiccups ........... 389

How does a multi-representational mathematical ICT tool mediate teachers‟ mathematical and
pedagogical knowledge concerning variance and invariance?
10
LIST OF TABLES
Table 3-1 The evidence for the pedagogical opportunities afforded by the classroom
layer within the pedagogical map (Stacey, 2008) ...................................... 55
Table 3-2 My exemplification of Shulman’s theory of teacher content knowledge for
the mathematical topic of linear function (Shulman, 1986) ......................... 64
Table 4-1 Questionnaire 1: Identifying the teachers’ backgrounds and experiences
as relevant to the study. ......................................................................... 77
Table 4-2 Questionnaire 2: Lesson evaluation form designed for Phase One of the
study. ................................................................................................... 80
Table 4-3 Questionnaire 3: Probing the process of each teacher’s activity design
during Phase One of the study. ................................................................ 81
Table 4-4 Questionnaire 4: Task cards designed to support the teachers to
understand the terminology of Q2-19 and Q2-20 when completing
Questionnaire 2. .................................................................................... 81
Table 4-5 Data codes for each school and teacher adopted throughout the study. 84
Table 4-6 Data labelling scheme adopted throughout the study. ........................ 85
Table 4-7 The summary data for Judith’s activity ‘Prime factorisation’ [SJK1]. ..... 90
Table 4-8 Key processes involved in learning mathematics as specified in the
English and Welsh National Curriculum. The shaded processes indicate those of
predominant interest to the study. ........................................................... 92
Table 5-1 The data analysis summary for Sam’s activity ‘Trial and improvement’
[LSM4]. ............................................................................................... 100
Table 5-2 The data analysis summary for Amie’s activity ‘Trial and improvement’
[GBA5] ................................................................................................ 101
Table 5-3 The broad categories of teacher learning as evidenced by the analysis of
the Phase One data. .............................................................................. 119
Table 5-4 The domains of teacher learning as evidenced by the analysis of the
Phase One data..................................................................................... 121
Table 5-5 The summary of raw data for the lesson ‘Pythagoras exploration’ [STP7]
.......................................................................................................... 131
Table 6-1 The design of Tim’s activity ‘Pythagoras exploration’ [STP6] .............. 147
Table 6-2 Tim’s revisions to the .tns file for the activity ‘Pythagoras exploration’
[STP6]. ................................................................................................ 161
Table 6-3 [CEL9] The lesson episodes ........................................................... 169
Table 7-1 The detailed analysis of Tim’s interpretation of variance and invariance
within the activity ‘Circles and lines’ [STP7] .............................................. 191
Table 7-2 A summary of Tim’s interpretations of variance and invariance for his

How does a multi-representational mathematical ICT tool mediate teachers‟ mathematical and
pedagogical knowledge concerning variance and invariance?
11
Phase Two activities. ............................................................................. 192
Table 7-3 Summary of Tim’s lesson hiccups ................................................... 194
Table 7-4 The detailed analysis of Eleanor’s interpretation of variance and
invariance within the activity ‘Generating circles’ [CEL7]. ........................... 201
Table 7-5 A summary of Eleanor’s interpretations of variance and invariance for all
of her Phase Two activities. .................................................................... 202
Table 7-6 Summary of Eleanor’s lesson hiccups .............................................. 204

How does a multi-representational mathematical ICT tool mediate teachers‟ mathematical and
pedagogical knowledge concerning variance and invariance?
12
LIST OF FIGURES
Figure F.0-1 The geometrical model of the paper folding activity where the point M
represents the initial point, point P is a chosen point on the circumference and
the dotted line indicates the line of fold. .................................................... 25
Figure F.0-2 The geometrical model showing the loci of all of the fold lines as the
point P was dragged around the circumference of the circle. ........................ 25
Figure 2-1 The chosen technology for the study – the TI-Nspire handheld v1.6 ... 40
Figure 2-2 A sample calculator screen using the TI-Nspire handheld .................. 41
Figure 2-3 A dynamic geometry model alongside the evaluation of related
measurements and the testing of mathematical statements ........................ 41
Figure 2-4 A sample graphing screen using the TI-Nspire handheld .................... 42
Figure 2-5 A geometric figure and related measurements and calculations. ......... 42
Figure 2-6 A sample spreadsheet screen using the TI-Nspire handheld ............... 43
Figure 2-7 A sample spreadsheet screen, statistical plot and corresponding
statistical calculation using the TI-Nspire handheld ..................................... 43
Figure 2-8 A sample spreadsheet screen, statistical plot and corresponding
statistical calculation showing the effect of dragging a point on the graph ..... 43
Figure 2-9 A sample notes screen using the TI-Nspire handheld ........................ 44
Figure 2-10 A sample dynamic geometric model with measurements and the
associated calculations used to test a conjecture ........................................ 45
Figure 2-11 A sample graphing screen illustrating how measurements can be taken
from two lines that have been constructed geometrically. ........................... 45
Figure 2-12 A sample spreadsheet page showing how captured data can be used as
the basis for a calculation of the product of the gradients of the lines in the
previous figure ....................................................................................... 45
Figure 3-1 The triad characteristic of Instrumented Activity Situations (Verillon and
Rabardel 1995 p.85) in which the Subject refers to the user, the Instrument
represents the chosen technology and the Object is the activity or purpose for
which the technology is being used. The arrows indicate the interactions
between Subject and Instrument (S-I), Instrument and Object (I-O) and, in the
case of the Subject and the Object, the direct interaction (dS-O) and the
mediated interaction (mI-O). ................................................................... 48
Figure 3-2 This is an adaptation of the previous figure in which the instrument is
the TI-Nspire handheld, the subject is ‘teachers as learners’ and the object is
teachers’ learning about the teaching and learning of mathematics through the
exploration of mathematical variance and invariance. ................................. 49

How does a multi-representational mathematical ICT tool mediate teachers‟ mathematical and
pedagogical knowledge concerning variance and invariance?
13
Figure 3-3 A second adaptation of Figure 3-1 in which the instrument remains as
the TI-Nspire handheld, the subject is now the students and the object is the
students’ learning of mathematics through the exploration of mathematical
variance and invariance. ......................................................................... 50
Figure 3-4 The pedagogical map for describing teaching with technology, which
considers the functional and pedagogical opportunities for technology within the
teaching and learning of mathematics (Stacey, 2008) ................................. 53
Figure 4-1 A set of triangles constructed within the dynamic geometry application
[CEL2(tns-T)] ........................................................................................ 86
Figure 4-2 A blank spreadsheet page in which the angle measurements would be
entered [CEL2(tns-T)page3] .................................................................... 86
Figure 4-3 A dynamic triangle constructed within the Geometry application ........ 87
Figure 4-4 The spreadsheet application showing the captured angle measurements
and associated angle sums when the vertices of the triangle in the previous
figure were dragged ............................................................................... 87
Figure 5-1 An example of an evidence source for Key Process A06, ‘Explore the
effects of varying values and look for invariance’ taken from Eleanor’s activity
‘Perpendicular functions’ [CEL5] ............................................................... 97
Figure 5-2 The IUS map developed to support the data analysis process, which
enables the flow of representations through each activity to be illustrated .... 104
Figure 5-3 The Instrument Utilisation Scheme for Eleanor’s activity ‘Triangle angles’
showing the flow of representational forms as indicated by the arrows [CEL1].
.......................................................................................................... 104
Figure 5-4 Instrument Utilisation Scheme 1 shown diagrammatically using the IUS
map showing the flow of representational forms as indicated by the arrows.. 105
Figure 5-5 Exemplification of IUS1 from the activity [SJK4] ............................. 105
Figure 5-6 Instrument Utilisation Scheme 2 shown diagrammatically using the IUS
map showing the flow of representational forms as indicated by the arrows.. 106
Figure 5-7 Exemplification of IUS2 [CHS2(tns-T)page1] ................................. 106
Figure 5-8 Exemplification of IUS2 [CHS2(tns-T)page2] ................................. 106
Figure 5-9 Instrument Utilisation Scheme 3 shown diagrammatically using the IUS
map showing the flow of representational forms as indicated by the arrows. As
not all activities involved a second output representation, the arrows on the
diagram are shown in grey. .................................................................... 107
Figure 5-10 Exemplification of IUS3 [PCT3] .................................................... 107
Figure 5-11 Instrument Utilisation Scheme 4 shown diagrammatically using the IUS
map showing the flow of representational forms as indicated by the arrows.. 108

How does a multi-representational mathematical ICT tool mediate teachers‟ mathematical and
pedagogical knowledge concerning variance and invariance?
14
Figure 5-12 Exemplification of IUS4 [STP2] .................................................... 108
Figure 5-13 Instrument Utilisation Scheme 5 shown diagrammatically using the IUS
map showing the flow of representational forms as indicated by the arrows.. 109
Figure 5-14 Exemplification of IUS5 [PCT4] .................................................... 109
Figure 5-15 Instrument Utilisation Scheme 6 shown diagrammatically using the IUS
map showing the flow of representational forms as indicated by the arrows.. 110
Figure 5-16 Exemplification of IUS6 [PSH3] ................................................... 110
Figure 5-17 Instrument Utilisation Scheme 7 shown diagrammatically using the IUS
map showing the flow of representational forms as indicated by the arrows.. 111
Figure 5-18 Exemplification of IUS7 [CEL5] .................................................... 111
Figure 5-19 Instrument Utilisation Scheme 8 shown diagrammatically using the IUS
map showing the flow of representational forms as indicated by the arrows.. 112
Figure 5-20 Exemplification of IUS8 [LMF5] ................................................... 112
Figure 5-21 Instrument Utilisation Scheme 9 shown diagrammatically using the IUS
map showing the flow of representational forms as indicated by the arrows.. 113
Figure 5-22 Exemplification of IUS9 [GBA5] ................................................... 113
Figure 5-23 Students’ comments about the gradient and intercept properties of
straight line graphs [BAK3(tns-S)page3] .................................................. 116
Figure 5-24 Students’ comments about the gradient and intercept properties of
straight line graphs [BAK3(tns-S)page4] .................................................. 116
Figure 5-25 Sophie’s activity design that required students to drag f1(x) and f2(x)
such that they appeared perpendicular as a means to generalising about the
gradient property of perpendicular lines. .................................................. 118
Figure 5-26 The pedagogical map showing the pedagogical opportunities provided
by mathematical software with the specific aspects on which my the study
focussed indicated by the pink shading (Stacey, 2008). ............................. 123
Figure 5-27 An extract from my research journal showing an incidental comment
relating to a teacher’s instrumentation scheme for a task [Journ] ................ 130
Figure 5-28 An example of how I produced a written analysis of an activity using
the themes provided by the pedagogical map for Tim’s ‘Pythagoras exploration’
[STP6]. ................................................................................................ 136
Figure 5-29 An example of the hiccups within Tim’s lesson ‘Equivalent quadratic
equations’ as coded within the Nvivo8 software [STP9]. ............................. 138
Figure 5-30 [STP9] An example of the Tim’s actions in response to the hiccups
within his lesson ‘Equivalent quadratic equations’ as coded within the Nvivo8
software [STP9]. ................................................................................... 139
Figure 6-1 The summary of Tim’s Instrument Utilisation Schemes produced from

How does a multi-representational mathematical ICT tool mediate teachers‟ mathematical and
pedagogical knowledge concerning variance and invariance?
15
the analysis of his Phase One lesson data. ................................................ 143
Figure 6-2 The opening view of Task 1 in which the students were asked to drag
different vertices to produce three squares of equal areas [STP6(tns-T)page1].
.......................................................................................................... 146
Figure 6-3 The opening view of Task 2 in which the students were asked to drag
different vertices to make a+b=c [STP6(tns-T)page2] ............................... 146
Figure 6-4 The opening view of Task 3 in which the students were asked to find the
lengths of as many of the lines in the diagram as they were able. [STP6(tns-
T)page3] .............................................................................................. 147
Figure 6-5 An image of the students’ handheld screens in response to Task 1
captured during the activity [STP6(ScreenCapt)]. ...................................... 148
Figure 6-6 Student’s handheld screen showing a response to Task 2 [STP6(tns-
S13)]................................................................................................... 150
Figure 6-7 Student’s handheld screen showing a response to Task 2 [STP6(tns-
S16)]................................................................................................... 150
Figure 6-8 Student’s handheld screen showing a response to Task 2 [STP6(tns-
S22)]................................................................................................... 151
Figure 6-9 Student’s handheld screen showing a response to Task 2 [STP6(tns-
S16)]................................................................................................... 151
Figure 6-10 Student’s handheld screen showing a response to Task 2 [STP6(tns-
S20)]................................................................................................... 152
Figure 6-11 The Instrument Utilisation Scheme map for Tim’s ‘Pythagoras
exploration [STP6]. ............................................................................... 155
Figure 6-12 Student’s handheld screen showing a response to Task 1 [STP6(tns-
s13)]. .................................................................................................. 156
Figure 6-13 Extract from Nvivo8 software showing the coded hiccups during Tim’s
‘Pythagoras exploration’ [STP6]. ............................................................. 160
Figure 6-14 Tim’s revised TI-Nspire file for Task 1 [STP6(tns-T)v.2].................. 161
Figure 6-15 Tim’s revised TI-Nspire file for Task 2 [STP6(tns-T)v.2] ................. 161
Figure 6-16 The summary of Eleanor’s Instrument Utilisation Schemes produced
from the analysis of her Phase One lesson data. ....................................... 165
Figure 6-17 The opening page of Eleanor’s Smart Notebook file displayed to the
students to introduce the activity. [CEL9(LessStruct)]................................ 167
Figure 6-18 The image of the students’ responses to Eleanor’s initial poll
[CEL9(Image1)] .................................................................................... 169
Figure 6-19 The opening screen of the .tns file for the activity ‘Crossing linear
graphs’ [CEL9(tns-T)page2] .................................................................. 169

How does a multi-representational mathematical ICT tool mediate teachers‟ mathematical and
pedagogical knowledge concerning variance and invariance?
16
Figure 6-20 A close-up of four students’ handheld screens showing their responses
to the activity [CEL9(ScreenCapt)]. ......................................................... 169
Figure 6-21 The image of the students’ responses to Eleanor’s initial poll which
asked for a ‘rule that connect the two numbers’ within the coordinate pair (3,6)
[CEL9(Image1)]. ................................................................................... 170
Figure 6-22 The opening screen of the .tns file for the activity ‘Crossing linear
graphs’ [CEL9(tns-T)page2] .................................................................. 171
Figure 6-23 Eleanor’s handheld screen after she had demonstrated how to enter the
function f1(x)=2x within her introduction of the activity ‘Crossing linear graphs’
[CEL9(tns-T)page2] ............................................................................... 172
Figure 6-24 Eloise’s response to the activity ‘Crossing linear graphs’ [CEL9(tns-S)].
.......................................................................................................... 173
Figure 6-25 Eloise’s functions, entered in response to the activity ‘Crossing linear
graphs’ [CEL9(tns-S)]. ........................................................................... 173
Figure 6-26 Rosie’s response to the activity ‘Crossing linear graphs’ [CEL9(tns-S)].
.......................................................................................................... 173
Figure 6-27 Emily’s response to the activity ‘Crossing linear graphs’ [CEL9(tns-S)].
.......................................................................................................... 173
Figure 6-28 Eleanor’s handheld screen displayed during her demonstration that
f1(3) = 6 [CEL(tns-T)] ........................................................................... 174
Figure 6-29 Eleanor’s handheld screen displayed during her demonstration that
f2(3) = 6 [CEL(tns-T)] ........................................................................... 174
Figure 6-30 Eleanor’s whiteboard annotations during the activity ‘Crossing linear
graphs’. [CEL9(Image2)] ....................................................................... 175
Figure 6-31 A students’ handheld screen showing a search for linear functions
which satisfy x=3 and y=6 [CEL9(tns-S)]. ............................................... 177
Figure 6-32 A diagram showing the representational route through Eleanor’s
activity ‘Crossing linear graphs’ [CEL9]. ................................................... 178
Figure 6-33 An extract from the ‘MyMaths’ resource which Eleanor normally used to
introduce simultaneous equations (Jackson and Jackson, 2010). ................. 179
Figure 6-34 Extract from Nvivo8 software showing the coded hiccups during
Eleanor’s activity ‘Crossing linear graphs’ [CEL9]. ..................................... 180
Figure 6-35 Emily’s response to the activity ‘Crossing linear graphs’ [CEL9(tns-S)].
.......................................................................................................... 181
Figure 7-1 The summary of Tim’s Instrument Utilisation Schemes produced from
the analysis of his Phase One lesson data. ................................................ 188
Figure 7-2 The summary of Tim’s Instrument Utilisation Schemes produced from

How does a multi-representational mathematical ICT tool mediate teachers‟ mathematical and
pedagogical knowledge concerning variance and invariance?
17
the analysis of his Phase Two lesson data................................................. 189
Figure 7-3 A student’s handheld screen[STP7(tns-S)]...................................... 191
Figure 7-4 The summary of Tim’s actions within the activity ‘Equivalent quadratics’
[STP9]. ................................................................................................ 195
Figure 7-5 The summary of Eleanor’s Instrument Utilisation Schemes produced
from the analysis of her Phase One lesson data. ....................................... 198
Figure 7-6 The summary of Eleanor’s Instrument Utilisation Schemes produced
from the analysis of her Phase Two lesson data. ....................................... 199
Figure 7-7 Eleanor’s Instrument Utilisation Scheme map developed for the activity
‘Generating circles’ [CEL7]. .................................................................... 200
Figure 7-8 [CEL7(tns-T)page3] ..................................................................... 201
Figure 7-9 The students’ handheld screens displayed as a Screen capture view
during the activity ‘Transforming graphs’ [CEL6]. ...................................... 206
Figure 8-1 Tim’s handheld screen showing the ‘measured’ linear functions which
resulted in a lesson hiccup during the activity ‘Linear graphs’ [STP10(tns-T)].
.......................................................................................................... 211
Figure 8-2 The ‘always-sometimes-never’ question included within Eleanor’s activity
‘Triangles and squares’ [CEL8(tns-T)page2.2] ........................................... 222
Figure 8-3 Tim’s measured circle function used in discussion with a student during
the activity ‘Circles and lines’ [STP7(tns-T)v2] .......................................... 224
Figure 8-4 An example of a student’s handheld screen in which the MRT’s authority
appears to be doubted during the activity ‘Circles and lines’ [STP7(tns-S)]. .. 228
Figure 8-5 Tim’s handheld screen that led to a student asking ‘Why didn't it say
false?’ within the activity ‘Equivalent quadratics’ [STP9(tns-T)]. .................. 228
Figure 8-6 Maria’s handheld screen showing her response to the activity ‘Crossing
linear functions’ [CEL9(tns-S)1]. ............................................................. 231
Figure 8-7 Maria’s corresponding functions for the graphs displayed in the previous
figure [CEL9(tns-S)1]. ........................................................................... 231
Figure 8-8 Maria’s handheld screen showing her response to the activity ‘Crossing
linear functions’ later in the same lesson [CEL9(tns-S)2]. .......................... 232
Figure 8-9 Maria’s corresponding functions for the graphs displayed in the previous
figure [CEL9(tns-S)2]. ........................................................................... 232
Figure 8-10 A student’s response to Task 2 within Tim’s lesson ‘Pythagoras
exploration’ [STP6(tns-S)] ...................................................................... 235
Figure 8-11 A student’s response to Task 2 within Eleanor’s lesson ‘Triangles and
squares’ [CEL8(tns-S]. ........................................................................... 235
Figure 9-1 My adaptation of Verillon and Rabardel’s triad of instrumented activity in

How does a multi-representational mathematical ICT tool mediate teachers‟ mathematical and
pedagogical knowledge concerning variance and invariance?
18
which the instrument is the TI-Nspire handheld, the subject is ‘teachers as
learners’ and the object is teachers’ learning about the teaching and learning of
mathematics through the exploration of mathematical variance and invariance.
.......................................................................................................... 237
Figure A6-1 [STP1(tns-T)] ........................................................................... 302
Figure A6-2 [STP2(tns-T)] ........................................................................... 304
Figure A6-3 STP2(StudWork) ....................................................................... 305
Figure A6-4 [STP3(tns-T)] ........................................................................... 306
Figure A6-5 [STP3(tns-S)1] ......................................................................... 307
Figure A6-6 [STP3(tns-S)2] ......................................................................... 307
Figure A6-7 [STP4(tns-T)page1] ................................................................... 308
Figure A6-8 [STP4(tns-T)page2] ................................................................... 308
Figure A6-9 [STP5(tns-T)page1] ................................................................... 310
Figure A6-10 [STP5(tns-T)page2] ................................................................. 310
Figure A6-11 [STP5(tns-T)page3] ................................................................. 310
Figure A7-1 [CEL1(tns-T)page1] ................................................................... 316
Figure A7-2 [CEL1(tns-T)page2] ................................................................... 316
Figure A7-3 [CEL1(Struct)] Eleanor’s supporting instructions for students .......... 316
Figure A7-4 [CEL1(tns-T)page1] ................................................................... 317
Figure A7-5 [CEL1(tns-T)page2] ................................................................... 317
Figure A7-6 [CEL2(Struct)] Eleanor’s activity instructions for students .............. 317
Figure A7-7 [CEL3(tns-T)page1] ................................................................... 318
Figure A7-8 [CEL3(tns-T)page2] ................................................................... 318
Figure A7-9 [CEL3(tns-T)v2page1] ............................................................... 319
Figure A7-10 [CEL3(tns-T)v2page2] .............................................................. 319
Figure A7-11 [CEL3(tns-T)v2page3] .............................................................. 319
Figure A7-12 [CEL3(tns-T)v2page4] .............................................................. 319
Figure A7.13 [CEL3(tns-T)v2page5] .............................................................. 320
Figure A7-14 [CEL4(tns-T)page1] ................................................................. 320
Figure A7-15 [CEL4(tns-T)page2] ................................................................. 320
Figure A7-16 [CEL4(tns-T)page3] ................................................................. 321
Figure A7-17[CEL4(tns-T)page4] .................................................................. 321
Figure A7-18 [CEL4(tns-S4)page1] ............................................................... 321
Figure A7-19 [CEL4(tns-S4)page2] ............................................................... 321
Figure A7-20 [CEL4(tns-S2)page4] ............................................................... 322
Figure A7-21[CEL4(tns-S2)page4] contd. ...................................................... 322
Figure A7-22 [CEL5(tns-T)] .......................................................................... 323
How does a multi-representational mathematical ICT tool mediate teachers‟ mathematical and
pedagogical knowledge concerning variance and invariance?
19
Figure A7-23 [CEL5(tns-S1)] ........................................................................ 324
Figure A7-24 [CEL5(tns-S2)] ........................................................................ 324
Figure A7-25 [CEL5(tns-S5)] ........................................................................ 324
Figure A7-26 [CEL5(tns-S6)] ........................................................................ 324
Figure A7-27 [CEL5(tns-S7)] ........................................................................ 324
Figure A7-28 [CEL5(tns-S3)] ........................................................................ 325
Figure A7-29 [CEL5(tns-S4)] ........................................................................ 325
Figure A9-1 IUS [STP6] Pythagoras exploration .............................................. 330
Figure A9-2 [STP6] Activity hiccups .............................................................. 331
Figure A9-3 [STP6] Evidence of teacher’s actions ............................................ 331
Figure A9-4 [STP6(tns-s19)] Student’s response ............................................ 332
Figure A9-5 [STP7] Students’ responses to ‘What is √(-25)?’ ........................... 335
Figure A9-6 [STP7(tns-T)] ........................................................................... 335
Figure A9-7 [STP7(tns-S1)] ......................................................................... 336
Figure A9-8 [STP7(tns-S2)] ......................................................................... 336
Figure A9-9 [STP7(tns-S3)] ......................................................................... 336
Figure A9-10 [STP7(tns-S4)] ........................................................................ 336
Figure A9-11 [STP7(tns-T)] .......................................................................... 336
Figure A9-12 [STP7(Activity1)] ..................................................................... 337
Figure A9-13 [STP7(Activity2)] ..................................................................... 338
Figure A9-14 [STP7(tns-S)] ......................................................................... 339
Figure A9-15 IUS [STP7] Circles and lines ...................................................... 340
Figure A9-16 [STP7] Activity hiccups ............................................................. 340
Figure A9-17 [STP7] Evidence of teacher’s actions .......................................... 341
Figure A9-18 [STP7(tns-S)] Cameron’s response to the activity ........................ 341
Figure A9-19 [STP8(tns-T)] Spreadsheet page ............................................... 344
Figure A9-20 [STP8(tns-T)] Graphing page ................................................... 344
Figure A9-21 [STP8(tns-T)] Graphing page with an incorrect ‘function match’
displayed ............................................................................................. 344
Figure A9-22 [STP8(tns-T)] Graphing page with the correct ‘function match’
displayed ............................................................................................. 344
Figure A9-23 Intended IUS [STP8] Quadratic graphs ....................................... 345
Figure A9-24 Revised IUS [STP8] Quadratic graphs......................................... 346
Figure A9-25 [STP8] Activity hiccups ............................................................. 346
Figure A9-26 [STP8(tns-S)page2] Spreadsheet values .................................... 347
Figure A9-27 [STP8(tns-S)page1] A correctly matched function ........................ 347
Figure A9-28 [STP8(tns-S)page2] An unresolved attempt ................................ 347
How does a multi-representational mathematical ICT tool mediate teachers‟ mathematical and
pedagogical knowledge concerning variance and invariance?
20
Figure A9-29 [STP8] Evidence of teacher’s actions .......................................... 347
Figure A9-30 [STP9(Activity)] Matching quadratic expressions.......................... 350
Figure A9-31 [STP9(tns-T)] Graphing f1(x)=(x+2)(x+5) ................................. 350
Figure A9-32 [STP9(Activity)L2] More matching quadratic graphs ..................... 352
Figure A9-33 [STP9(StudWork)L2] Grid multiplication strategy ......................... 353
Figure A9-34 [STP9(Activity)L3] TenTicks worksheet ....................................... 354
Figure A9-35 [STP9(tns-T)L3] Equivalent quadratic expressions ....................... 354
Figure A9-36 IUS [STP9] Equivalent quadratic expressions .............................. 356
Figure A9-37 [STP9] Activity hiccups ............................................................. 356
Figure A9-38 [STP9(tns-T)] Why didn't it say false? ........................................ 357
Figure A9-39 [STP9] Evidence of teacher’s actions .......................................... 358
Figure A9-40 [STP10(tns-T)1] Comparing gradient properties of lines ............... 359
Figure A9-41 [STP10(tns-T)2] The revealed equation ...................................... 360
Figure A9-42 [STP10(tns-T)3] Describing the linear function ............................ 360
Figure A9-43 IUS [STP10] Linear functions .................................................... 361
Figure A9-44 [STP10] Activity hiccups ........................................................... 362
Figure A9-45 [STP10] Evidence of teacher’s actions ........................................ 363
Figure A11-1 [CEL6(Activity)]....................................................................... 366
Figure A11-2 [CEL6(tns-S)] ......................................................................... 367
Figure A11-3 [CEL6] Function set selected for whole class display ..................... 367
Figure A11-4 [CEL6(ScreenCapt)] ................................................................. 368
Figure A11-5 [CEL6] Instrument utilisation scheme ......................................... 369
Figure A11-6 [CEL6] Activity hiccups ............................................................. 369
Figure A11-7 [CEL6] Evidence of teacher’s actions .......................................... 370
Figure A11-8 Using the MRT to explore the function table ................................ 371
Figure A11-9 [CEL6(Activityv2)] The student recording sheet ........................... 372
Figure A11-10 [CEL7(tns-S1)page1] ............................................................. 373
Figure A11-11 [CEL7(tns-S2)page1] ............................................................. 373
Figure A11-12 [CEL7(tns-S1)page2] ............................................................. 374
Figure A11-13 [CEL7(tns-S2)page2] ............................................................. 374
Figure A11-14 [CEL7(tns-S2)page3] ............................................................. 375
Figure A11-15 [CEL7] Instrument utilisation scheme ....................................... 376
Figure A11-16 [CEL7] Activity hiccups ........................................................... 376
Figure A11-17 [CEL7] Evidence of teacher’s actions ........................................ 377
Figure A11-18 [STP6(tns-T)page1] ............................................................... 378
Figure A11-19 [CEL8(tns-T)page1] ............................................................... 378
Figure A11-20 [CEL8(tns-T)page2] ............................................................... 379

How does a multi-representational mathematical ICT tool mediate teachers‟ mathematical and
pedagogical knowledge concerning variance and invariance?
21
Figure A11-21 [CEL8(ScreenCapt)] ............................................................... 379
Figure A11-22 [CEL8(tns-T)page2.2]............................................................. 380
Figure A11-23 [CEL8(tns-T)page3.1]............................................................. 380
Figure A11-24 [CEL8] Instrument utilisation scheme ....................................... 381
Figure A11-25 [CEL8] Activity hiccups ........................................................... 381
Figure A11-26 [CEL8(tns-S)] ‘Does Isla’s still work? ........................................ 382
Figure A11-27 [CEL8(tns-S)] ‘Does Lana’s work?’ ........................................... 382
Figure A11-28 [CEL8] Evidence of teacher’s actions ........................................ 382
Figure A11-29 [CEL9] Instrument utilisation scheme ....................................... 383
Figure A11-30 [CEL9] Activity hiccups ........................................................... 383
Figure A11-31 [CEL9(tns-S)] Maria’s graphs .................................................. 384
Figure A11-32 [CEL9(tns-S)] Maria’s functions ............................................... 384
Figure A11-33 [CEL9] Evidence of teacher’s actions ........................................ 384

How does a multi-representational mathematical ICT tool mediate teachers‟ mathematical and
pedagogical knowledge concerning variance and invariance?
22
GLOSSARY
BECTa British Educational and Communications Technology Agency
CAS Computer Algebra System
DCSF Department for Children, Schools and Families
DGS Dynamic Geometry System
GCSE General Certificate in School Education
ICT Information and Communications Technology
KS3 Key stage 3 (11-14 years)
KS4 Key stage 4 (14-16 years)
NC National Curriculum
NCET National Council for Educational Technology
NOF New Opportunities Fund
OFSTED Office for Standards in Education
PGCE Post Graduate Certificate in Education
QCA Qualifications and Curriculum Agency
SAT Standard Assessment Test
SSAT Specialist Schools and Academies Trust
TDA Training and Development Agency
.tns TI-Nspire file extension
TTA Teacher Training Agency

How does a multi-representational mathematical ICT tool mediate teachers‟ mathematical and
pedagogical knowledge concerning variance and invariance?
23
FOREWORD
In my own initial training to teach mathematics to students aged 11-18 years I was
undoubtedly influenced by the strong presence of technological tools. A graphical
calculator was loaned to me from the outset of my postgraduate certificate in
education (PGCE) course and many taught sessions and tutorials modelled the use
of mathematical software displayed to the group through TV screens. I also bought
my first personal computer during this period. Two of my lecturers, Adrian Oldknow
and Warwick Evans were particularly influential to me at this early stage. They both
clearly enjoyed the way in which this recently emerging technology allowed them to
experiment with new pedagogies and, perhaps more importantly, how it facilitated
a re-examination of our engagement with the mathematics. It was also very
apparent that the boundaries between the tutors, students, technology and
mathematics were overlapping with learning mathematics at the point of mutual
intersection.
Technology was used as a tool to enable problems to be explored quickly and
effectively, with plenty of scope for mathematical creativity, in terms of both the
depth and analyses of mathematical models. Learning mathematics was presented
as a progression of mathematical modelling activities in which tutors introduced
new mathematical content as demanded by students’ own questions. The domains
of mathematics were blurred as we moved between numerical, geometrical,
algebraic and statistical interpretations according to the context. I distinctly
remember the silhouette of a wine glass being projected onto a screen during a
numerical methods module as a starting point to develop mathematical methods to
estimate the capacity of the glass.
In 1993, during my first year as a secondary mathematics teacher, I was invited to
be a part of the National Council for Educational Technology’s (NCET) ‘Pilot
Evaluation of Portable Computer Technology’ project to evaluate the emerging role
of handheld technology in the secondary school mathematics classroom. This
project was subsequently reported in Stradling et al. (1994) and an example of my
personal contribution to the project is recorded in Oldknow and Taylor (2003). My
school was loaned a class set of Texas TI-81 graphing calculators, I received ten
(funded) days of school-release time and I had the opportunity to report my
contribution to the project and submit it as part of a Certificate in Advanced
Educational Studies, ‘Developing Mathematics with the Microcomputer’.

How does a multi-representational mathematical ICT tool mediate teachers‟ mathematical and
pedagogical knowledge concerning variance and invariance?
24
There are some key factors in my personal response to this initiative:
The technology was always available to myself and my students;
The timescale of the project gave me opportunities to explore, experiment,
reflect and report;
The project was linked to my own continuing professional development and
I wrote a journal of my classroom activities and reflections which formed the
basis for academic accreditation;
I was working with a group of teachers from similar schools;
The school had the equipment on ‘long-term loan’, which meant that both
during and beyond the project I was able to work collaboratively with my
colleagues to disseminate outcomes, activities and approaches and integrate
aspects within the schemes of work.
A couple of years later, a specific activity involving the use of technology also had a
profound influence on me. A module within my MA in Mathematics Education
course, ‘Geometry in a Contemporary Setting’, began with the following practical
activity.
Take a circle of paper, about 15cm in diameter.
Mark a dot on the paper – anywhere but at the centre.
Fold the edge of the circle so that the circumference just touches your marked
point. Make a firm crease.
Unfold the paper.
Fold the paper from a different place, again so that the circumference just touches
your mark.
Repeat this to produce an „envelope‟ of folds on the circle of paper.
What shape is beginning to emerge?
We then turned to the computers and opened a new file in Cabri-Géomètre (Baulac
et al., 1988), which was a new genre of computer software called dynamic
geometry software that had been developed at the University of Grenoble in
France.
We learned how to construct a circle.
… and a point inside it.
We then created an electronic version of the practical paper-folding activity with

How does a multi-representational mathematical ICT tool mediate teachers‟ mathematical and
pedagogical knowledge concerning variance and invariance?
25
which we had just engaged. A discussion then ensued about whether the fold lines
were each a perpendicular bisector of a line joining any point on the circumference
to the marked point.
A few minutes later we had the following picture.
Figure F.0-1 The geometrical model of the paper folding activity where the point M
represents the initial point, point P is a chosen point on the circumference and the
dotted line indicates the line of fold.
We explored what happened if we moved the point P around the circumference of
the circle and noticed the path that the ‘fold’ line took.
We then used the software to show a series of fold lines1, by constructing the locus
of the ‘fold’ line as the point P moved around the circumference.
Figure F.0-2 The geometrical model showing the loci of all of the fold lines as the
point P was dragged around the circumference of the circle.
This was fascinating enough…
But then we explored what happened if we moved the point M – something that we
could not do with the paper circle without starting again…
1 The number of lines displayed is a function of the software settings within Cabri-Géomètre.
How does a multi-representational mathematical ICT tool mediate teachers‟ mathematical and
pedagogical knowledge concerning variance and invariance?
26
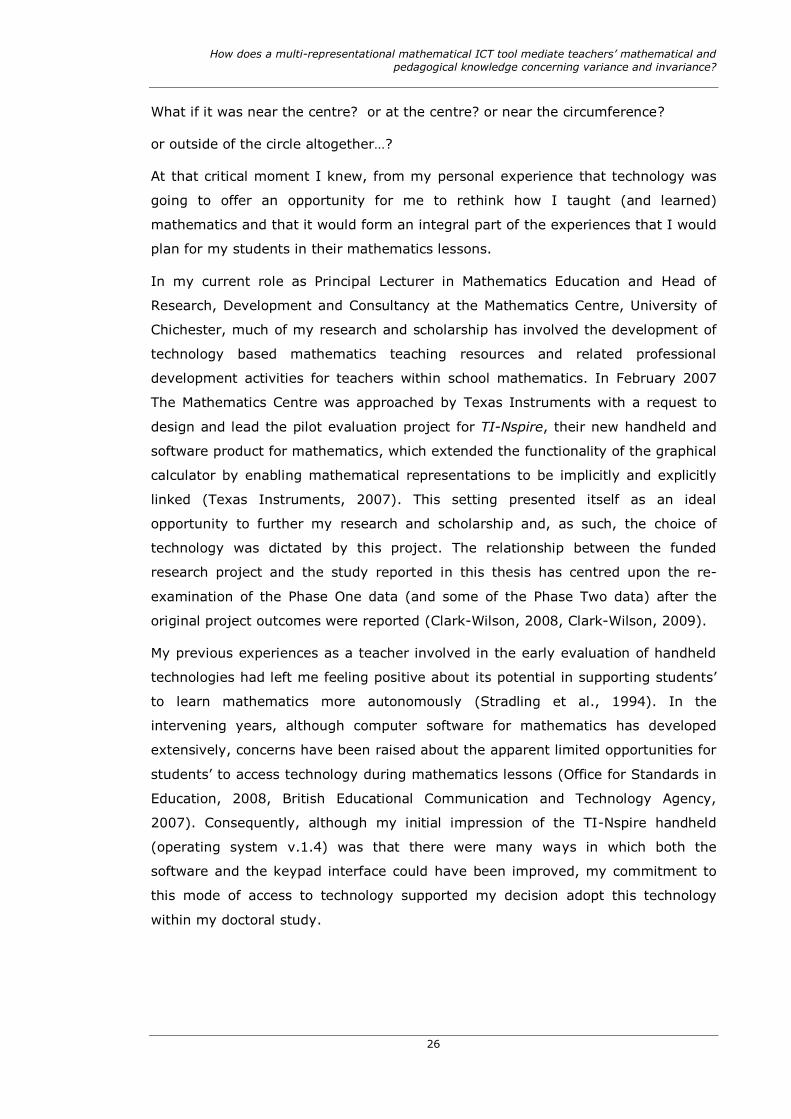
What if it was near the centre? or at the centre? or near the circumference?
or outside of the circle altogether…?
At that critical moment I knew, from my personal experience that technology was
going to offer an opportunity for me to rethink how I taught (and learned)
mathematics and that it would form an integral part of the experiences that I would
plan for my students in their mathematics lessons.
In my current role as Principal Lecturer in Mathematics Education and Head of
Research, Development and Consultancy at the Mathematics Centre, University of
Chichester, much of my research and scholarship has involved the development of
technology based mathematics teaching resources and related professional
development activities for teachers within school mathematics. In February 2007
The Mathematics Centre was approached by Texas Instruments with a request to
design and lead the pilot evaluation project for TI-Nspire, their new handheld and
software product for mathematics, which extended the functionality of the graphical
calculator by enabling mathematical representations to be implicitly and explicitly
linked (Texas Instruments, 2007). This setting presented itself as an ideal
opportunity to further my research and scholarship and, as such, the choice of
technology was dictated by this project. The relationship between the funded
research project and the study reported in this thesis has centred upon the re-
examination of the Phase One data (and some of the Phase Two data) after the
original project outcomes were reported (Clark-Wilson, 2008, Clark-Wilson, 2009).
My previous experiences as a teacher involved in the early evaluation of handheld
technologies had left me feeling positive about its potential in supporting students’
to learn mathematics more autonomously (Stradling et al., 1994). In the
intervening years, although computer software for mathematics has developed
extensively, concerns have been raised about the apparent limited opportunities for
students’ to access technology during mathematics lessons (Office for Standards in
Education, 2008, British Educational Communication and Technology Agency,
2007). Consequently, although my initial impression of the TI-Nspire handheld
(operating system v.1.4) was that there were many ways in which both the
software and the keypad interface could have been improved, my commitment to
this mode of access to technology supported my decision adopt this technology
within my doctoral study.

How does a multi-representational mathematical ICT tool mediate teachers‟ mathematical and
pedagogical knowledge concerning variance and invariance?
Chapter 1 Introduction
27
1 INTRODUCTION
1.1 Introduction
In this chapter I have outlined the broad theme and purpose of the study alongside
a description of the context that led me to become interested in this area. The
chapter also includes definitions of some of the terminology central to the study
and it concludes by giving the broad aim for the research which informed the basis
of the review of research contained in Chapter 2.
1.2 A description of the study
This is a situated exploratory study in which the unit of attention is secondary
mathematics teachers + educational technology + activity design and the research
sought to expand the discourse on teachers’ appropriation of a new technological
tool for secondary mathematics classrooms, or more explicitly, how they adapt and
mould the tool for their own use. The research lens is particularly trained on the
trajectory of their interpretation of the concepts of mathematical variance and
invariance. The selected technological tool for this study is TI-Nspire (Texas
Instruments, 2007) and an outline of its main features is provided in Section 2.4.
This tool offers the functionality to support a range of approaches for the design of
mathematical activities that demands a number of mathematical and pedagogical
decisions to be made by the subjects of the study, namely the teachers concerned
with the design and adaptation of pedagogical materials for secondary
mathematics. This setting offers a significant opportunity to progress an
understanding of the trajectory of the teachers’ learning and classroom practices.
1.3 Why this study is important
The discourse on the appropriation of technological tools for mathematics such as
LOGO, Computer Algebra Systems and dynamic geometry systems (DGS) is well-
developed in the research literature, and this will be expanded upon in Section 2.4
and the Literature Review in 3. The technological environment offered by the TI-
Nspire software and handheld device combines the functionality of a traditional
graphing calculator (with statistical functionality) with that of a dynamic geometric
environment in which variables defined from numerical, algebraic, geometric and
statistical domains can be linked. This leads to two important questions:
Why, when and how would we want to do this?
and

How does a multi-representational mathematical ICT tool mediate teachers‟ mathematical and
pedagogical knowledge concerning variance and invariance?
Chapter 1 Introduction
28
Which problems lend themselves to such approaches within the context of
secondary school mathematics?
The range of new possibilities that this introduced to the mathematics teaching
setting is of interest to the mathematics education community. Many researchers
have called for further studies into the process of integrating technology into
classroom practices (Laborde, 2001, Hoyles et al., 2004, Ruthven et al., 2004,
Kieran and Yerushalmy, 2004) to support the emerging theories and empirical
analysis.
This study has built on the existing discourse to propose an ‘ontological innovation’
(diSessa and Cobb, 2004) relating to the process of teachers’ appropriation in this
new environment. The notion of an ontological innovation concerns ‘hypothesizing
and developing explanatory constructs, new categories of things in the world that
help explain how it works’ (diSessa and Cobb, 2004, p.77). This is being interpreted
within this study in the same sense as the authors conceptualised ‘socio-
mathematical norms’, that is to say an ontological innovation that revealed an
element of the hidden curriculum in mathematics classrooms. Within the physical
sciences an ontological innovation can be exemplified by concepts such as friction
or luminosity, which have been readily adopted and validated by the scientific
community. However, within human sciences we do not have a set of concepts to
describe the process of teacher learning at a classroom level – something that this
thesis sought to develop.
1.4 Context of the study
In February 2007 The Mathematics Centre, University of Chichester was
approached by Texas Instruments with a request to design and lead the English
pilot evaluation research project for TI-Nspire. As Director of this project, a piece of
externally funded Evaluation Research, I worked in collaboration with Texas
Instruments to agree a methodology that satisfied their internal requirements,
whilst adopting a research-informed approach that did not compromise the need for
a substantial professional development experience for the teachers involved and a
robust set of research instruments that enabled a rich data set to be analysed. My
role was as the sole designer of the research evaluation framework and the
associated methodological tools. I was also solely responsible for the subsequent
data analysis and reporting I worked with members of the project team (including
the teachers) to triangulate my emergent interpretations and findings which
ultimately led to the research conclusions. The resulting exploratory study took
place in two phases between July 2007 and December 2009 and it involved the

How does a multi-representational mathematical ICT tool mediate teachers‟ mathematical and
pedagogical knowledge concerning variance and invariance?
Chapter 1 Introduction
29
case study of fifteen mathematics teachers, all of whom developed and evaluated
mathematical activities that involved their students in secondary classroom
settings.
1.5 Premises about teaching and learning mathematics
It is not possible to undertake research involving mathematics teachers without
confronting the difficulties associated with the body of knowledge we call
mathematics. The dual nature it exhibits as both a self-contained formal system or
a way of conceptualising the world (Noss and Hoyles, 1996) creates a dilemma for
mathematics teachers in striking a balance between teaching about the
mathematical objects and the relationships between them, and providing their
students with opportunities to encounter these objects and relationships and
construct their own meanings.
As a participant observer in this research, my own theories about mathematics as a
body of knowledge, and about its associated pedagogies, were highly relevant as I
entered into a research dialogue with teachers. As I move between my role as a
teacher of mathematics and that of a researcher, Alba Thompson’s seminal work on
teachers conceptions of mathematics came to mind and, in particular, her
comment,
Although the complexity of the relationship between conceptions and
practice defies the simplicity of cause and effect, much of the contrast in
the teachers‟ instructional emphases may be explained by differences in
their prevailing views of mathematics. (Thompson, 1984)
In considering Thompson’s phrase a ‘teacher’s view of mathematics’, I questioned
whether this was this their view of:
What mathematics as a body of knowledge is (or might be) about?
The overall cognitive goals and objectives of mathematics teaching and
learning?
The content of the school mathematics curriculum?
How mathematics should be taught and learned?
What mathematics is learnable?
What ‘appropriate’ mathematics looked like for different groups of students?
What evidenced mathematical understanding?
How students should express mathematics?
How tools and resources might be used in the learning of mathematics?
How to respond to students’ mathematical misunderstandings?

How does a multi-representational mathematical ICT tool mediate teachers‟ mathematical and
pedagogical knowledge concerning variance and invariance?
Chapter 1 Introduction
30
In my many and frequent discussions with mathematics teachers during which I
have sought to help them to articulate aspects of their views of mathematics, they
have unanimously found this a challenging activity. It is my belief that this is
because they have never questioned themselves or others on this subject.
Consequently, I cannot agree with simplistic classifications of teachers’ beliefs
about mathematics (Lerman, 1983, Ernest, 1991, Ernest, 1996) and prefer to adopt
Thompson’s view that it is conceivable that an individual teacher’s conceptions of
mathematics are much more fine-grained than Lerman and Ernest suggest and
might include aspects that conflict (Thompson, 1992a). By confronting the
contradictions, teachers begin to widen their perspective of mathematics as a
dynamic body of knowledge. If a dynamic mathematical tool is then introduced to
the teaching of a dynamic body of knowledge, how do we retain the sense of the
mathematics and what is the teacher’s new role in supporting their students’ sense-
making processes?
For me, mathematics is a language and a set of tools that enable humans to make
sense of and describe phenomena that exist in the world that we inhabit. These can
be mathematical models of tangible physical situations, such as Newtonian motion
or interpretations of natural shape and form as in a classic text such as D’Arcy
Thompson’s On Growth and Form (Thompson, 1917). With respect to the goals of
mathematics teaching and learning, as a teacher of mathematics I had the dual role
of: supporting my students to appreciate the world through a mathematical lens
whilst sharing with them some of the existing body of human mathematical
knowledge; enabling them to engage in and contribute to the society in which they
found themselves on leaving the formal school system. Having an awareness of the
students’ cultural setting was a key factor that enabled me to devise a relevant and
motivating school curriculum whilst still staying loyal to my beliefs.
As a practising teacher, I appreciated that there was a need for my own students to
both participate in and succeed in the formal examination system and that I could
not disadvantage them by not providing them with adequate preparation. In order
for my students to feel successful, irrespective of their level of attainment,
mathematical understanding had to be the central tenet for all that we did in and
outside of the classroom. I view mathematics as an essential human activity that is
best learned in a social setting and through genuine and interesting problem solving
activities, which stimulate us to ask and seek answers to our own mathematical
enquiries. My role as a teacher was to select the ideas to provide the initial
stimulation for my students, offer a supportive steer for them as they grappled with
new mathematical knowledge, and to facilitate their access to appropriate models

How does a multi-representational mathematical ICT tool mediate teachers‟ mathematical and
pedagogical knowledge concerning variance and invariance?
Chapter 1 Introduction
31
and tools. I tended not to see curriculum boundaries, only interesting problems, but
I was aware that, as students moved into the examination phase, I had the
responsibility to ensure that they were prepared in those areas in which they would
be formally assessed.
These personal beliefs underpin my approach when working with teachers, as I plan
and support teacher development sessions with a firm mathematical basis. My
premise is that, in order to discuss issues concerning mathematics pedagogy, it is
important for teachers to be actively working on mathematical ideas for
themselves. However, from time to time I encourage teachers to adopt a meta-
position as they look down on themselves and consider the implications of their
own experiences on their classroom role as a teacher. This widens the context to
include discussions of pedagogical approaches for mathematics and issues relating
to the leadership and management of the mathematics curriculum in the individual
classroom and the wider school setting.
1.6 Outline aim for the research
The outline aim for this research was to explore the nature of teachers’ cognitive
and pedagogical learning as they developed their use of a multi-representational
technology (MRT) with a focus on their conception of mathematical variance and
invariance. For the purposes of this study, the multi-representational system was
being used in a manner consistent with Noss and Hoyles (1996), as a window on
knowledge, on the conceptions, beliefs and attitudes of learners, teachers and
others involved in the meaning-making process (p. 5). This broad aim will be
further expanded as an outcome of the Literature review in Chapter 3.
1.7 Overview of the study
The remainder of the thesis is arranged as follows:
Chapter 2 introduces and defines the main terminology used within the thesis and
provides an overview of the chosen technology and its functionality.
Chapter 3 contains the literature review, which examines the processes involved in
the introduction of new technologies, mathematical variance and invariance and
interpretations of mathematics teachers’ professional learning. It begins by
outlining these themes, followed by a detailed review of selected studies and
concludes by stating the more detailed articulation of the aim for the research.
Chapter 4 outlines the two phases of the research and the rationale for its
methodology. It continues to detail the methodological actions used in the first

How does a multi-representational mathematical ICT tool mediate teachers‟ mathematical and
pedagogical knowledge concerning variance and invariance?
Chapter 1 Introduction
32
phase of the research and the associated data analysis processes.
Chapter 5 presents a summary of the outcomes of the first phase the study, which
includes the emergent instrument utilisation schemes and the teachers’ conceptions
of variance and invariance. It details the rationale for the design of the second
phase to incorporate the selection of the case study teachers, the adapted
methodology and the process of data analysis.
Chapter 6 introduces the two case study teachers who were studied during the
second phase, describes their starting points and includes a detailed analysis of one
mathematics lesson from each teacher to provide a deeper sense of the process of
data analysis from which the research conclusions evolved.
Chapter 7 details the outcomes of the research, presented as the two case studies
of the selected teachers. For each teacher a summary of the trajectory of their
learning and the associated classroom events experienced during the study, are
articulated.
Chapter 8 offers the discussion of the results in the form of an ontological theory
about the nature of teacher learning within the domain of mathematics education.
Chapter 9 concludes the study by summarising its findings and relating these to the
existing and emerging research on teacher learning.

How does a multi-representational mathematical ICT tool mediate teachers‟ mathematical and
pedagogical knowledge concerning variance and invariance?
Chapter 2 The notion of a multi-representational technological tool for mathematics
33
2 THE NOTION OF A MULTI-REPRESENTATIONAL TECHNOLOGICAL TOOL
FOR MATHEMATICS
Information technology will have its greatest impact in transforming the
meaning of what it means to learn and use mathematics by providing
access to new forms of representation as well as providing simultaneous
access to multiple, linked representations. (Kaput, 1986)
2.1 Introduction
This chapter will define and articulate the important terminology used within the
study: technological tools for mathematical learning; the concepts of mathematical
variance and invariance and the definition of a multi-representational mathematical
environment. A justification for the chosen multi-representational environment will
be put forward. The chapter concludes by establishing the basis for the choice of
themes included in the Literature Review, which is elaborated within Chapter 3.
2.2 Technological tools for mathematical learning
Mathematical learning tools encompass the whole range of physical, visual and
mental resources that have the common purpose to support learners to construct
mathematical understandings. In each case the mathematical meaning ‘for and
with’ each tool is constructed by the user, shaping the way in which it is used.
Starting from the Russian psychological perspective, which interpreted the notion of
activity as ‘a unit of analysis that included both the individual and his/her culturally
defined environment’ (Wertsch, 1981), the work of Lev Vygotsky (which pre-dated
technological tools) provided a foundation for the interpretation of human-tool
interaction. Vygotsky defined tools or instruments as ‘artificial devices for mastering
mental processes’ and offered a list of examples, which included language, counting
systems, algebraic symbol systems and diagrams. Vygotsky suggested that human
instrumental processes enabled many more paths to the same epistemological
outcome to be facilitated, stating,
The most important fact about the instrumental act – a fact that
undergirds the instrumental method – is the simultaneous presence of
stimulus of both types (i.e. the object and the tool). Each stimulus plays
a qualitatively and functionally distinct role. Thus, in the instrumental
act, a new intermediate link – the psychological tool, which becomes the
structural centre (i.e. the feature that functionally determines all the
processes that form the instrumental act) - is inserted between the

How does a multi-representational mathematical ICT tool mediate teachers‟ mathematical and
pedagogical knowledge concerning variance and invariance?
Chapter 2 The notion of a multi-representational technological tool for mathematics
34
object and the psychological operation towards which it is directed. Any
behavioural act then becomes an intellectual operation.
(Vygotsky, 1981, p.139)
With the advent of technological tools for learning, a number of researchers
revisited Vygotsky’s socio-constructivist theories with a view to reconceptualising
them within the emerging research field of technology within mathematics
education. (Ridgeway, 1997, Verillon and Rabardel, 1995)
The French mathematics education discourse on this theme drew its theoretical
framework from the work of Verillon and Rabardel (1995), who elaborated on the
instrumental approach and offered a new perspective on the effect that
technological tools have on learning processes. Verillon and Rabardel proposed the
triad characteristic of Instrumented Activity Situations. Locating such a theoretical
framework within the context of this study led to the refined interpretation of the
Subject, Instrument and Object that has been adopted as the overarching
theoretical framework for the study. The justification of this decision, which includes
a discussion concerning the evolution of the refined triad, is considered more
deeply within Chapter 3.
An extensive research base exists concerning the development and use of individual
technologies for mathematics education (See, for example, Fey, 1989, Kaput, 1992,
Hoyles et al., 2004, Hoyles and Lagrange, 2009). Genres of technological tools
have been developed, which can be broadly categorised as graphing software,
dynamic geometry environments, programming languages, spreadsheets and
statistical packages. Most recently there has been a move to develop multi-
representational environments that allow for simultaneous movement between the
numeric, algebraic, graphical, geometric and statistical domains. The access to
these tools has been facilitated through traditional desk top personal computers
and more portable technology, such as laptop computers and networkable handheld
devices.
Over time, as the implications for teacher development for the integration of
technology into ‘normal’ classrooms has became more understood, researchers
have concentrated on particular cases in an attempt to conceptualise the processes
involved in assimilating technology into classroom practices. Research has
repeatedly highlighted teachers’ own dispositions towards mathematics and its
pedagogies as a major factor in determining the way in which teachers made sense
of the technological tool and created legitimised uses for technology in their
classrooms (See, for example Noss et al., 1991, Artigue, 1998, Ruthven et al.,

How does a multi-representational mathematical ICT tool mediate teachers‟ mathematical and
pedagogical knowledge concerning variance and invariance?
Chapter 2 The notion of a multi-representational technological tool for mathematics
35
2004, Mousley et al., 2003).
My own observations and experiences have led me to believe that exposing
students to a technological resource alone is not necessarily enough to guarantee
that any individual will construct mathematical meanings that resonate with those
that are legitimised within the school mathematics curriculum. In the classroom
setting, the teachers have a role in supporting the process of instrumental genesis
and it is the teachers’ actions that are of primary interest to this study. By focusing
teachers’ attentions on the meanings that they (and their pupils) construct, it is
anticipated that teachers will begin to consider the nature of useful settings within
which their pupils will begin to use a multi-representational system as a tool for the
purposeful learning of mathematics.
If the purpose for the use of the technology is to maximise opportunities for
teachers to enable pupils to arrive at their own mathematical meanings in relation
to the body of knowledge we call mathematics, teachers are immediately faced with
a problem. What does a teacher do when the meaning that the pupil has
constructed is, in the teacher’s view, an ‘incorrect’ one? Can a meaning be wrong?
And if a meaning is ‘correct’, has it then become an understanding? Is an
understanding only valid if it is judged to be correct? These questions epitomise the
dilemma that teachers face in the classroom on a day-to-day basis. However,
starting from a premise that the use of technology may make these meanings more
visible, that is to say providing the ‘window’ as described by Hoyles and Noss, how
do teachers respond to these occurrences, and what do teachers learn from their
experiences? This study is designed to explore such scenarios.
For mathematics teachers, the questions above highlight the pedagogical
complexities that they face within their role. Moreover, does the technology offer an
opportunity for teachers to support their pupils in the process of meaning-making,
or does it have the adverse effect, creating more problems than solutions in the
eyes of the teachers? Early research by Artigue into the adoption of handheld
technology for mathematics concluded that the teacher development process was
crucial to its integration (Artigue, 1998). She raised questions about the
discrepancies and conflicts between the process of instrumentation of the
technology and the institution’s underlying philosophy for the way that students
engage with mathematics.
The Literature Review will expand on existing research concerning the processes of
technology integration and, as a result, articulate the theoretical framework for this
study.

How does a multi-representational mathematical ICT tool mediate teachers‟ mathematical and
pedagogical knowledge concerning variance and invariance?
Chapter 2 The notion of a multi-representational technological tool for mathematics
36
2.3 The mathematical focus for the study
On commencing the research, the more tangible mathematical focus appeared to
be that of the mathematical variable. In Seymour Papert’s words, a mathematical
variable is defined as ‘The idea of using a symbol to represent an unknown entity’,
describing ‘the concept of symbolic naming through a variable – one of the most
powerful mathematical ideas ever invented’ (Papert, 1980, p.69). Other definitions
of variable differ from an ‘algebraic object that can be replaced by a number’
(Bardini et al., 2005) to a ‘plurality of conceptions: generalised number, unknown,
totally arbitrary sign, register of memory’ (Malisani and Spagnolo, 2009).
Alphabetic symbol naming results in a number of conflicting interpretations, with
the symbol representing an unknown, a variable or a parameter. Within school
mathematics the subtle use of particular letters is often intended to impart to the
students the various roles of alphabetic labelling. For example, presented with the
syntax 4a + 3 = 12, the inference is that the letter a probably represents an
unknown, the value for which is to be found. Whereas, presented with y = mx + c,
the implication is that y and x represent the variables and the letters m and c
represent parameters (which can also vary), with the complete form representing
the family of linear functions within a Cartesian coordinate system. The relationship
between the concept of variable and the process of algebraic reasoning has been
extensively researched by a number of researchers and theorists (Bednarz et al.,
1996, Kaput, 1998, Kieran and Wagner, 1989). What is evident from this research
is that most interpretations of variable are firmly situated in the algebraic domain.
An earlier consideration of the role that geometric contexts might have in
developing understanding of the concept of a mathematical variable was given by
Radford (1996), who adopted a historical perspective to the epistemology of
mathematical variables in an attempt to locate possible opportunities for school
mathematics. Emanating from this discourse is the notion of mathematical variable
as a fundamental building block to support reasoning in mathematics, which is not
limited to the domain of number and algebra. Emerging technologies have enabled
the creation of dynamic variability and the exploration of relationships in a way that
was previously a mental exercise or concept. The process of converting these
observations and relationships into a communicable language is something Kaput
described as ‘algebrafying, a complex composite of five interrelated forms of
reasoning’ (Kaput, 1998, p.3). Kaput offers a broad definition of algebra as:
generalizing and formalizing patterns and regularities, in particular,
algebra as generalised arithmetic; syntactically guided manipulations of

How does a multi-representational mathematical ICT tool mediate teachers‟ mathematical and
pedagogical knowledge concerning variance and invariance?
Chapter 2 The notion of a multi-representational technological tool for mathematics
37
symbols; the study of structure and systems abstracted from
computations and relations; the study of functions, relations and joint
variations; modelling. (Kaput, 1998, p.26)
Recent curriculum reviews and reports have highlighted that, in English classrooms,
school algebra has been focused upon what Kieran (1996) described as
generational activities in which variables are used to form expressions and
equations, describe quantitative situations and express generality from numeric or
geometric contexts. Such generational activities are emphasised over
transformational and global meta-level activities, which focus more on the
equivalence and relationships between algebraic representations. Again, most of
these activities have taken place within the traditional topic of algebra, although
more recent curriculum guidance documents in England have sought to promote a
broader interpretation, extending to geometry (Qualifications and Curriculum
Authority, 2001, Brown et al., 2003, Ruthven, 2003, Qualifications and Curriculum
Authority, 2004).
My early work suggested that variable was an inadequate basis on which to focus
as variable had historically and ontologically been connected with the realm of
algebra within mathematics and the teachers involved in this study would be
developing activities that spanned the full curriculum. So, I have taken the decision
to train the mathematical lens on the more dynamic conception, ‘variance and
invariance’ for the reasons for which are explained below.
Firstly, the study of variance and invariance, namely responding to the question,
‘what is the same and what is different about?’ is a fundamental thought process
that humans apply in making sense of their surroundings. The process of aligning,
reflecting and realigning our thinking is a continuous one, which seems elemental to
the way we learn. Within the learning of mathematics, exploring variance and
invariance is central to the process of generalisation within both the socio-
constructivist and constructionist paradigms and the advent of technological tools
has facilitated this process by allowed multiple views and situations to be quickly
explored. In a technological setting, the exploration of variance and invariance
could imply that dynamic objects will be created and manipulated, allowing
generalisations to be hypothesised with a view to formalising mathematical
knowledge.
Secondly, the English and Welsh statutory curriculum for secondary mathematics1
1 The statutory secondary curriculum is for all students in English state funded schools aged
11-16 years.

How does a multi-representational mathematical ICT tool mediate teachers‟ mathematical and
pedagogical knowledge concerning variance and invariance?
Chapter 2 The notion of a multi-representational technological tool for mathematics
38
has explicitly stated that all students should be given opportunities to use
mathematical reasoning within the context of analysing a mathematical situation in
order to ‘explore the effects of varying values and look for invariance and
covariance’ (Department for Children Schools and Families, 2007). This process skill
transcends the mathematics topic boundaries and offers a relevant focus for
teacher development activities as they begin to adopt the new curriculum. This
offers an element of legitimacy for teachers in developing approaches which
resonate with the statutory curriculum.
A number of other researchers have observed that many of the uses of technology
featured in and reported by the mathematics education literature have commonly
offered students the opportunity to ‘explore regularity and variation’ (Stacey, 2008,
Hennessy, 2000, Wilson et al., 2005). This could be explained in two ways. Firstly,
that teachers are identifying these sorts of activities as being important within the
mathematics curriculum they offer and secondly that the researchers or experts
involved in these studies might be promoting such use, thereby distorting the
picture. Classroom based case studies reported by Ruthven et al would seem to
substantiate the second interpretation. Their observations and interpretations of the
natural use of dynamic geometry software by three secondary mathematics
teachers revealed that ‘more occasionally, and less explicitly, it was a matter of
dragging to examine dynamic variation’ (Ruthven et al., 2004). This highlighted an
area for my study to probe during both Phase One and Phase Two.
2.4 Multi-representational environments for mathematics
In the introduction of his seminal paper of 1986, James Kaput began by offering his
own definition of mathematics to embody both a body of knowledge and a language
within which exists ‘a network of representational systems which interlock, not only
with each other, but interact differently with different kinds of mathematical
knowledge as well as with non-mathematical representation systems such as
natural language and pictures’ (Kaput, 1986). In this paper, Kaput presented a
vision for the way in which technology might support higher-level engagement with
mathematics and he emphasised the role that multi-representational environments
might have in this process.
The subsequent discourse on the nature and role of representational environments
is well-established, with several key texts devoted solely to this theme (Confrey,
1990, Janvier, 1987, Kaput, 1989). A number of researchers and theorists
conceived and developed technological environments for mathematics in which
several representations were offered simultaneously alongside the functionality to

How does a multi-representational mathematical ICT tool mediate teachers‟ mathematical and
pedagogical knowledge concerning variance and invariance?
Chapter 2 The notion of a multi-representational technological tool for mathematics
39
vary values, objects and graphical or figural images in various ways. In early
technologies, the changes were made through a keyboard input. However the
advent of the on-screen pointer and mouse facilitated a new way of interacting,
through dragging.
It is not surprising that, as the early opportunities to develop multi-representational
systems for mathematics were often influenced by the pragmatic need to improve
the school experience for learners, much of the research was polarised into the
multi-representational ‘families’ of:
graphical, tabular, function, coordinates;
geometric figure, calculated and/or measured values;
statistical data, graphs, calculated and or measured values.
The Literature Review provided in Chapter 3 will expand on the published research
with a view to identifying the features of the existing knowledge and theories that
have relevance for this study. Of interest will be studies that have considered the
nature of teachers’ uses of multi-representational software within the design of
classroom activities and the way in which this has, or has not, provided
opportunities for substantial teacher learning about the broader concept of
mathematical variance and invariance.
As previously stated, the choice of the handheld technology for this study was in
part opportunistic. However, it offered an instantiation of a multi-representational
environment for mathematics with the additional possibility of the development of
wireless connectivity within the research timeline.
2.4.1 The selected multi-representational technology and its
functionality
TI-Nspire incorporates a set of ‘applications’ that has been developed from a suite
of existing educational technologies for mathematics: Cabri-Géomètre (Baulac et
al., 1988); Fathom (Finzer, 2007); Derive (Soft Warehouse, 1988); and a
spreadsheet. It utilises a directory file management structure within which
collections of pages (in the form of the applications described in Sections 2.4.2 to
2.4.6 below) are saved as software files. The facility for selecting and dragging on-
screen objects is interfaced by a mouse within the computer software and a
navigation pad (often referred to as the NavPad or Donut2) on the handheld device
2 Throughout the study the teachers also refer to the NavPad as the Navigational Pad and the
Donut.

How does a multi-representational mathematical ICT tool mediate teachers‟ mathematical and
pedagogical knowledge concerning variance and invariance?
Chapter 2 The notion of a multi-representational technological tool for mathematics
40
(v.1.6 and v.1.7).
Figure 2-1 The chosen technology for the study – the TI-Nspire handheld v1.6
A brief description follows of the functionality within each of the environments
alongside an exemplification of its use within the context of a multi-representational
media for mathematics. A more detailed technical description of TI-Nspire can be
found in the product manual (Texas Instruments, 2007a, 2007b).

How does a multi-representational mathematical ICT tool mediate teachers‟ mathematical and
pedagogical knowledge concerning variance and invariance?
Chapter 2 The notion of a multi-representational technological tool for mathematics
41
2.4.2 Calculator application
Within the Calculator application, it is possible to
execute calculations, define and evaluate
functions, display and calculate fraction
calculations, define variables and evaluate
associated expressions (not shown).
Figure 2-2 A sample calculator screen using the TI-Nspire
handheld
Data that has been stored as a variable within
another application can be evaluated and
manipulated within this application, as can the
validity of statements. Figure 2-3 shows the
output of a students’ response to an activity
[GBA5], which also demonstrates how the screen
can be split to show more than one application
simultaneously.
Figure 2-3 A dynamic geometry
model alongside the evaluation of related measurements and
the testing of mathematical
statements

How does a multi-representational mathematical ICT tool mediate teachers‟ mathematical and
pedagogical knowledge concerning variance and invariance?
Chapter 2 The notion of a multi-representational technological tool for mathematics
42
2.4.3 Graphs and Geometry application
The Graphs and Geometry application integrates
a function graphing environment with a dynamic
geometry application.
In Figure 2-4, a quadratic function has been
defined on the entry line and displayed in the
graphing pane. Standard linear and quadratic
functions can be transformed by dragging as well
as by editing the function.
Figure 2-4 A sample graphing
screen using the TI-Nspire handheld
In Figure 2-5, a Graphs and Geometry page is
shown (in plane analytic view with the axes and
function entry line hidden) on which a dynamic
geometric figure has been constructed and some
angle measurements made. The measurements
have been saved as variables, which enabled
calculations to be carried out on this page (or
others) in the file.
Figure 2-5 A geometric figure
and related measurements and
calculations.

How does a multi-representational mathematical ICT tool mediate teachers‟ mathematical and
pedagogical knowledge concerning variance and invariance?
Chapter 2 The notion of a multi-representational technological tool for mathematics
43
2.4.4 Lists and spreadsheet application
Figure 2-6 shows an example of a Lists and
Spreadsheet page, containing the data for 20
throws of a standard dice. The spreadsheet
adheres to conventional layout and functionality.
Labelling the columns facilitates the construction
of statistical graphs based on the data in the
columns and statistical calculations to be made.
In addition, the cells in the row marked can be
used to define functions for the data in the
column, which includes a data capture facility
from dynamic variables that have been defined
elsewhere in the document.
Figure 2-6 A sample spreadsheet screen using the
TI-Nspire handheld
2.4.5 Data and statistics application
A full range of statistical plots and associated
statistical calculations can be produced from
variables defined anywhere in the file. Statistical
graphs can be dynamically explored by dragging
individual data points within the data set. For
example, in Figure 2-7, any of the data points in
the plot can be dragged, with the effect on the
calculated mean being displayed simultaneously
in the bottom pane.
The effect on the calculated mean after a data
point has been dragged from a 6 to a 4 is seen in
Figure 2-9. The corresponding value in the
Spreadsheet would also have been
simultaneously changed.
Figure 2-7 A sample
spreadsheet screen, statistical
plot and corresponding
statistical calculation using the TI-Nspire handheld
Figure 2-8 A sample
spreadsheet screen, statistical
plot and corresponding statistical calculation showing
the effect of dragging a point
on the graph

How does a multi-representational mathematical ICT tool mediate teachers‟ mathematical and
pedagogical knowledge concerning variance and invariance?
Chapter 2 The notion of a multi-representational technological tool for mathematics
44
2.4.6 Notes application
The Notes application supports text input, with
some basic mathematical formatting and symbols
in addition to the functionality to write
mathematical expressions and draw some
standard shapes. It also has a comment facility
for the teacher or reviewer.
Figure 2-9 A sample notes screen using the TI-Nspire
handheld
2.4.7 Defining variables – functionality and pedagogical approaches
The ability to provide simultaneously linked multiple representations within a
mathematical model is a significant new feature of mathematical interest to the
research study. This multiple representation capability can dynamically link
variables from a range of mathematical sources whereby a change in one
representation is observable in others, with a draggable interface that can be
employed to change geometric figures, statistical plots and certain families of
functions. Within the chosen MRT there are a number of ways in which the users
can achieve this, all of which have implications for the teachers’ pedagogic uses
with learners in classrooms.
Some of the links between representations are ‘built in’ explicitly to the technology.
For example, the generation of a graph and table of values from a defined
mathematical function, or the generation of a statistical plot from a set of named
data within the spreadsheet. In addition, a numerical output from any of the
applications can be stored as a variable and then manipulated in any other
application. So a measured value in the geometry application could be used to test
a conjecture, define a graph or be captured as tabulated ‘real’ data. (See examples
in Figure 2-10 and Figure 2-11).

How does a multi-representational mathematical ICT tool mediate teachers‟ mathematical and
pedagogical knowledge concerning variance and invariance?
Chapter 2 The notion of a multi-representational technological tool for mathematics
45
Measured values of angles are saved as
variables a and b to enable conjectures about
their relationship to be tested.
Figure 2-10 A sample dynamic
geometric model with
measurements and the
associated calculations used to test a conjecture
There is a subtlety in the construction of this
environment that is relevant to the usefulness
of this functionality. In Figure 2.12 the starting
point for the construction was the definition of
the parallel lines, followed by the construction
of the transversal. Had the environment been
constructed with two ‘free’ lines and a
transversal, the purpose of which was to enable
the students to drag the ‘free’ lines to discover
the equality, the accuracy of the angles
measurements would be insufficient to test the
truth of any conjecture concerning the angle
sum.
Figure 2-11 A sample graphing screen illustrating how
measurements can be taken from
two lines that have been
constructed geometrically.
Measured values that have been saved as data
variables enable manual or automated data
capture within the spreadsheet application.
Figure 2-12 A sample spreadsheet page showing how
captured data can be used as the
basis for a calculation of the
product of the gradients of the lines in the previous figure

How does a multi-representational mathematical ICT tool mediate teachers‟ mathematical and
pedagogical knowledge concerning variance and invariance?
Chapter 2 The notion of a multi-representational technological tool for mathematics
46
Variables are most usefully defined within subsets of the file, called problems, to
prevent global definitions from affecting subsequent activities within the file and, as
indicated previously, there are a range of approaches for their definition.
2.5 Summary
This chapter provided a more detailed description of the context for the study,
described the main functionality of the technology being used within the study and
defined the terminology most relevant to what follows. It has introduced the
themes for the Literature Review, which follows in Chapter 3.

How does a multi-representational mathematical ICT tool mediate teachers‟ mathematical and
pedagogical knowledge concerning variance and invariance?
Chapter 3 Literature review
47
3 LITERATURE REVIEW
The pedagogy of mathematics in a virtual culture should logically shift
towards fluency in representing problem situations in a variety of
systems, and towards students‟ ability to coordinate among
representations as well as create and interpret novel ones.
(Shaffer and Kaput, 1998)
3.1 Introduction
This chapter provides a review of the research relevant to the study, as signalled in
Chapter 2, to include the following themes:
Coming to know new technologies and the role of technology in developing
teachers’ subject and pedagogic knowledge;
The concept of mathematical variance and invariance in a multi-
representational technological setting;
Making sense of the process of teacher learning.
More broadly, the literature review aims to: bring together empirical and theoretical
research findings from the wider body of published resources and identify areas or
issues as relevant to the topic of the study requiring further research; identify key
research ideas which could support the development of an interpretive framework
for the research data.
The chapter concludes by revisiting the outline aim for the research described in
Chapter 1 and expanding this into a refined set of aims in the light of the review of
research.
3.2 Coming to know new technologies and the role of technology
in developing teachers’ subject and pedagogic knowledge
3.2.1 The process of instrumental genesis
During the 1990s, the advent of computational technology prompted a research
discourse in education, which has focused on the nature of human appropriation of
such technologies within educational settings. A particular strand of this discourse,
emanating from various French research teams, has been greatly influenced by the
theory of ‘Instrumented Activity Situations’ first proposed by Verillon and Rabardel
(1995), which offered a model to describe how the human-instrument process

How does a multi-representational mathematical ICT tool mediate teachers‟ mathematical and
pedagogical knowledge concerning variance and invariance?
Chapter 3 Literature review
48
operated (Figure 3-1).
Figure 3-1 The triad characteristic of Instrumented Activity Situations (Verillon and
Rabardel 1995 p.85) in which the Subject refers to the user, the Instrument represents the chosen technology and the Object is the activity or purpose for
which the technology is being used. The arrows indicate the interactions between
Subject and Instrument (S-I), Instrument and Object (I-O) and, in the case of the
Subject and the Object, the direct interaction (dS-O) and the mediated interaction (mI-O).
Adopting a Vygotskian perspective for an artefact (i.e. the tool) as both a physical
and psychological construct, Verillon and Rabardel consider an artefact as
something that has been designed and realised for the purpose of accomplishing a
particular activity. The user engages with the artefact and, in doing so, constructs a
scheme for its use, with different users constructing different schemes. Over
successive elaboration by different users, the instrumental genesis of the artefact
takes place and, within this process, the user constructs meanings from the activity
that they have carried out. Subsequent Franco-European research in this area has
focused further on how this process of ‘instrumentation’ applies within the domain
of technological tools and mathematics (Artigue, 2001, Guin and Trouche, 1999,
Trouche, 2004, Drijvers and Trouche, 2008). In the majority of these studies the
subjects of the research have been school-age learners, the instrument has been
CAS technology and the object has been the accomplishment of mathematical
activities. In addition, the majority of these studies have been placed within the
French cultural setting in which handheld technology has been promoted by the
Ministry of Education since the mid 1990s.

How does a multi-representational mathematical ICT tool mediate teachers‟ mathematical and
pedagogical knowledge concerning variance and invariance?
Chapter 3 Literature review
49
The question is raised as to whether Verillon and Rabardel’s model for instrumented
activity is sufficient to accommodate situations where the subject is the teacher and
the object of the activity is the interlinked process of both ‘designing activities for’
and ‘teaching with’ technology. Consequently, an understanding of the process of
instrumental genesis as the teacher appropriates a multi-representational
technological tool for classroom use is of significant interest to the mathematics
education research community. So, in considering Verillon and Rabardel’s model as
an initial theoretical framework, this study began by proposing an adapted model
(Figure 3-2) which considered the position of the teacher as subject.
Figure 3-2 This is an adaptation of the previous figure in which the instrument is the TI-Nspire handheld, the subject is ‘teachers as learners’ and the object is
teachers’ learning about the teaching and learning of mathematics through the
exploration of mathematical variance and invariance.
This research intended to probe how the nature of the design of activities and the
experience and evaluation of the subsequent classroom teaching related to the
trajectory of the teacher’s journey, that is to develop a greater understanding about
the nature of the ‘object’ within the triad when the subject is secondary
mathematics teachers.
However, an added complexity concerns the definition of the object within this
particular triad. If the context for the research is concerned with the process of
teacher learning through the design, implementation and evaluation of technology
based learning opportunities, then it reasonable to suggest that an aspect of this
learning occurs in the classroom with students.

How does a multi-representational mathematical ICT tool mediate teachers‟ mathematical and
pedagogical knowledge concerning variance and invariance?
Chapter 3 Literature review
50
Hence it is also possible to conceive a second triad characteristic of Instrumented
Activity Situations, from the perspective of the students, which exists alongside that
of the teacher (Figure 3-3).
Figure 3-3 A second adaptation of Figure 3-1 in which the instrument remains as
the TI-Nspire handheld, the subject is now the students and the object is the students’ learning of mathematics through the exploration of mathematical variance
and invariance.
In this respect the technology could be conceived as having two roles: mediating
teachers’ learning in the classroom; and mediating the transformation of knowledge
through the way teachers reflect upon students’ learning and develop their own
theoretical pedagogic ideas. This perspective offers an opportunity to try to
conceptualise the notion of pedagogy as an internalisation of these processes and
to try to articulate how these two triads might relate to each other.
Verillon and Rabardel define several concepts to support the analysis of
instrumented activity, suggesting that artefacts offer both new possibilities and new
conditions for organising the action. In relocating these concepts to the situation of
this study, for the teachers this involves the process of learning about the
affordances of the new technology and then devising the teaching activities and
approaches that utilise them. This cycle is described by Verillon and Rabardel as an
instrument utilisation scheme (IUS). It was anticipated that, for the teachers
involved in the study, the observation of the evolution of the individual instrument
utilisation schemes would provide a platform from which to observe and evidence
teacher learning.

How does a multi-representational mathematical ICT tool mediate teachers‟ mathematical and
pedagogical knowledge concerning variance and invariance?
Chapter 3 Literature review
51
Furthermore, an important aspect of instrumental utilisation schemes is the ‘social
utilization scheme’, within communities of practitioners, through which a stable
base for the tool use emerges (Verillon and Rabardel, 1995, p. 86-7). Developing a
theoretical understanding of these social utilisation schemes has been a
predominant feature of the research by Ruthven and colleagues at the University of
Cambridge, which has sought to articulate the emergent practices of secondary
teachers’ uses of technology (Ruthven and Hennessy, 2002, Ruthven et al., 2004,
Ruthven, 2008, Ruthven et al., 2008, Ruthven et al., 2009). Whilst not a primary
consideration for this research, the study may elicit evidence of emergent social
utilisation schemes amongst the participating teachers.
Reflecting on the French research studies, Artigue comments on the emergence of
new instrumented techniques within school settings and the need for teachers both
to be aware of, and to act to stabilise them, within the institutional setting (Artigue,
1998). Whilst my study is not seeking to illuminate the process of the wider
integration of the MRT into the school setting, the development of teachers’
awareness of evolving utilisation schemes could be a pre-cursor to the stabilisation
of practice to which Artigue refers.
Guin and Trouche (1999) contributed to the growing discourse on the process of
instrumental genesis within the school mathematics setting, albeit by learners of
mathematics, with a set of behaviour profiles that related to the students’ use of
CAS. They arrived at these profiles through a description of two phases in the
students’ instrumental genesis, an initial phase of discovery in relation to the
affordances of the tool and an organisational phase in which the students sought
mathematical consistency between different sources of information. The student
behaviour profiles were described as ‘work methods’ and classified as: random;
mechanical; resourceful; rational and theoretical. Although Guin and Trouche do
not write explicitly on the role of the teacher in mediating the students’
instrumentalisation process, they imply that the teacher needs to:
make explicit to students the connections between their new knowledge and
the National Curriculum;
highlight to students the important mathematical connections they are
making within the broader web of mathematical and technological
knowledge;
have an awareness of existing knowledge concerning mathematics-with–
technology to enable the teacher to pre-empt common classroom issues;

How does a multi-representational mathematical ICT tool mediate teachers‟ mathematical and
pedagogical knowledge concerning variance and invariance?
Chapter 3 Literature review
52
consciously mediate whole class discourse with a view to arriving at
consensus with respect to new mathematical knowledge.
These initial observations by Guin and Trouche were the outcomes of a study that
had focused on the introduction of handheld technology to a class of students. The
unit of analysis was the students and the study did not focus upon the teacher’s
trajectory with the technology. By contrast, my own study seeks to substantially
develop the discourse concerning teachers’ utilisation schemes with handheld
technology and build upon initial observations, such as those of Guin and Trouche,
to try to understand the process through which these utilisation schemes evolve.
In concluding this section, whilst Verillon and Rabardel’s triad has been selected
and refined as an overarching theoretical framework for the study, it is not detailed
enough to provide a useful analytical tool to support the interpretation of the
research data. A contrasting perspective involves looking more holistically at what
teachers do with technology in the classroom with the intention to identify a
framework that would act as a more analytic tool and enable a deeper analysis and
interpretation of what happens in classrooms.
3.2.2 Teachers’ pedagogical maps
A substantial theoretical framework to describe mathematics teachers’ teaching
with technology has been developed by Stacey, Pierce and colleagues at the
University of Melbourne, the result of their extensive work in this area over the last
twenty years (see summary in Pierce and Stacey, 2008). This framework, which the
authors describe as a ‘pedagogical map’, is shown in Figure 3-4.

How does a multi-representational mathematical ICT tool mediate teachers‟ mathematical and
pedagogical knowledge concerning variance and invariance?
Chapter 3 Literature review
53
Figure 3-4 The pedagogical map for describing teaching with technology, which
considers the functional and pedagogical opportunities for technology within the teaching and learning of mathematics (Stacey, 2008)
The framework emanated from the broad evidence base for the development of the
use of technology in mathematics in Australia, the initial focus being on the use of
Computer Algebra Software (CAS). In a presentation given in 2008, Stacey argued
that, with the facility to use CAS software within a more comprehensive package
such as TI-Nspire, rather than as a standalone tool (i.e. Derive or Maple), the
boundaries between the various software packages have become less distinct. Also,
the Melbourne research team have begun to interpret CAS within the secondary
school setting as being ‘mathematically able’ software (Stacey, 2008). This
development has two significant implications for my own study. The first is that the
version of TI-Nspire software and handhelds that is available to the teachers in my
study is the non-CAS version. In adopting Stacey and Pierce’s pedagogical map as
an analytical tool for this research, I would need to establish the validity of the map
in my own research setting. Secondly, much of the research base for Stacey and
her colleagues has been predominantly within the upper secondary and university
settings, whereas my own study is within the compulsory secondary phase.
Therefore, in order to ensure an element of validity, the first phase of the study
would need to establish prior to commencing the main study that there are enough
similarities between the research subjects and their settings.
The pedagogical map (Figure 3-4) is divided into four layers and is interpreted from

How does a multi-representational mathematical ICT tool mediate teachers‟ mathematical and
pedagogical knowledge concerning variance and invariance?
Chapter 3 Literature review
54
the bottom upwards. The base of the map concerns the affordances of the
mathematically able software, which Stacey defines as 'functional opportunities',
i.e. those which are dependent on its intrinsic characteristics. She argues that these
have the potential to influence both curriculum and assessment change, although
she does not address these issues within the paper (Stacey, 2008). In my own
study, I will be examining these potential opportunities through the eyes of the
teachers, based on their classroom experiences and professional insights. For
example, the teachers’ emergent instrument utilisation schemes would provide a
tangible source of evidence for the perceived functional opportunities.
Working in an upwards direction, the second layer of the map concerns the nature
of the mathematical activities in which the students engage, and Kaye and Pierce
describe the pedagogical opportunities at the activity level as primarily being about
offering improved speed, access and accuracy. This layer is sub-divided into five
activity types: scaffold by-hand skills; use real data; explore regularity and
variation; simulate real situations and link representations. Stacey comments that
the most common pedagogical use for technology observed in Australian
classrooms involved activities that explored regularity and variation (Stacey, 2008).
This relates strongly to, and provides external validity for, my own mathematical
focus on variance and invariance.
The third level of the pedagogical map relates to the ‘classroom layer’ and the way
in which the introduction of mathematically able software can be a catalyst for
change in the classroom dynamic through improved shared displays and the
students’ personal access to an authority other than the teacher. Stacey and Pierce
sub-divide this theme by separately considering the changed classroom dynamic
and the changed didactic contract, and provide the evidence for each as outlined in
Table 3-1.

How does a multi-representational mathematical ICT tool mediate teachers‟ mathematical and
pedagogical knowledge concerning variance and invariance?
Chapter 3 Literature review
55
Changed classroom dynamic Changed didactic contract
the students' work becoming the focus of discussion;
the empowering of students to become source of information to
share about mathematics and
technology;
the teacher seeding questions and pointing out features;
the CAS acting as another classroom authority -
frustratingly with a mind of its
own;
the use of shared technology
encouraging the use of group
work;
an explosion of methods, which
gives students more to
contribute.
the technology acting as another authority in the classroom -
providing issues to explore and
puzzles to resolve;
the technology becoming another member of the class or group –
what does the technology think?
Table 3-1 The evidence for the pedagogical opportunities afforded by the classroom
layer within the pedagogical map (Stacey, 2008)
The top (and final) layer of the pedagogical map concerns the reassessment of the
goals and methods for the mathematics teaching and this is sub-divided into three
themes:
the exploitation of the contrast between the ideal and machine mathematics,
which in practice relates to the use of anomalies and limitations within
activities and approaches;
a re-balancing of the emphasis on learning skills, concepts and applications,
which could include the order of teaching these elements or the earlier
introduction of real-world problems that are scaffolded by the technology;
building metacognition and overview by offering students a bird's eye view
of a new topic before looking at the details or a macro view of mathematics
by encapsulating a multi-step process as a single command within CAS.
Stacey and Pierce argue that, as teachers develop their use of technology, most
initially adopt an approach that they describe as ‘functional’, which focuses on the
technology being used to accelerate routine activities and to compensate for by-
hand skills. In both of these usage cases the teachers do not fundamentally change
what they teach or how they teach it. Stacey and Pierce provide vignettes for four
further types of teachers, namely ‘progressive, radical, conservative and

How does a multi-representational mathematical ICT tool mediate teachers‟ mathematical and
pedagogical knowledge concerning variance and invariance?
Chapter 3 Literature review
56
concerned’, and pose the questions, ‘are there common paths through the
pedagogical maps?’ and ‘what are the major considerations when exploiting each of
these pedagogical opportunities?’ (Stacey, 2008). The context for my own study
offers an opportunity to consider the second question in detail, particularly in
relation to the opportunity for ‘exploring regularity and variation’.
Furthermore, Stacey makes the following comments about the map, which highlight
its particular relevance to this research study:
The context for the development of this framework has been predominantly
the introduction of CAS into mathematics classrooms, but more recently
considers the MRT selected for my own study (TI-Nspire);
In categorising the types of mathematical activities developed with
technology, ‘Explore regularity and variation’ and ‘Link representations’
resonate strongly with my own research topic.
The pedagogical map has been adopted as an organisational framework to support
the data analysis process during the second phase of the study, which is described
more fully in Chapter 5.
3.2.3 Teachers’ emergent practices with technology
The third area of existing research of direct relevance to this study concerns the
emergent practices of secondary mathematics teachers with technology. A number
of research studies have focused on the practices of secondary mathematics with
technology with the explicit aim to offer theories concerning legitimised uses within
school settings (Monaghan, 2001b, Ruthven et al., 2008, Ruthven et al., 2004,
Ruthven and Hennessy, 2002, Rodd and Monaghan, 2002, Monaghan, 2001a,
Monaghan, 2004, Godwin and Sutherland, 2004, Noss et al., 1991). The earlier
research tended to focus on specific technologies, for example LOGO, spreadsheets,
dynamic geometry software or graphing software (and calculators), resulting in
theories of use with mathematics specificity. More recent research is seeking to
validate these emergent theories across a broader range of mathematics education
technologies (Ruthven, 2008, Ruthven et al., 2009). The research approaches have
predominantly fallen between two methodological paradigms, which concern what
teachers say about their classroom uses of technology alongside what teachers do
in their classrooms with technology.
Ruthven and colleagues at the University of Cambridge have focused on eliciting
the nature of teachers’ ‘craft knowledge’ through a number of studies. They have
developed what they describe as a ‘practitioner model’ that has evolved from the

How does a multi-representational mathematical ICT tool mediate teachers‟ mathematical and
pedagogical knowledge concerning variance and invariance?
Chapter 3 Literature review
57
analysis of teachers’ own descriptions of their technologically enhanced classroom
practices, supported by selected classroom observations. Participants in their
studies were identified for their ‘successful practice’ and the resulting categories,
which constitute the practitioner model, include: effecting working processes and
improving production; supporting processes of checking, trialling and refinement;
overcoming pupil difficulties and building assurance; focusing on overarching issues
and accentuating important features; enhancing the variety and appeal of
classroom activity and fostering pupil independence and peer exchange (Ruthven et
al., 2004, Ruthven et al., 2009).
However, there is a tension in the design of studies that seek to research teachers’
practices in a more naturalistic way, which relates to the difficulty in locating
embedded practices that use the more mathematically interesting technology in
English secondary schools. Small surveys into secondary mathematics teachers’ use
and perceptions provide localised snapshots, however, fail to uncover the finer
nuances of classroom practices (Hyde, 2004, Knights, 2009). The implications of
this for the design of my own study are addressed more substantially in Chapters 4
and 5, which detail the research methodologies in each phase.
3.2.4 Implications for my study
In considering the three research perspectives concerning the evolution of
educational technology in mathematics classrooms that have just been described I
observed some distinct similarities in some of the ideas that have emerged. For
example, the processes of instrumentation and instrumentalisation are an inherent
element of most studies. In addition, Verillon and Rabardel’s ‘social utilisation
schemes’ resonate strongly with the notion of ‘archetypical practice’ uncovered by
Ruthven et al’s lesson case studies (Ruthven et al., 2009, 2004).
However, none of the studies cited have explored the nature of the teachers’
individual learning that occurs over time as they begin to use technology in their
classrooms. Although Stacey et al use their pedagogical map to classify teachers’
uses of technology and suggest aspects of their map in which teachers’ practices
develop over time; their research has not specifically probed the process by which
this occurs. My own study seeks to address this gap in the research by adopting a
longitudinal case study approach over a three-year period.
3.3 Mathematical variance and invariance
The justification for the choice of the mathematical focus for the research, the
concept of variance and invariance in a multi-representational technological setting,

How does a multi-representational mathematical ICT tool mediate teachers‟ mathematical and
pedagogical knowledge concerning variance and invariance?
Chapter 3 Literature review
58
has already been presented in Sections 2.3 and 2.4. This Section aims to
summarise the existing research on this topic to highlight interpretive theories,
insightful methodologies and emergent classroom teaching approaches in terms of
their relevance to this study.
3.3.1 The development of representation systems for mathematics
Early multiple representation technologies for mathematics focused on traditional
mathematics topic clusters. For example, the representational cluster of functions-
graphs-tables-coordinates that tends to reside within the algebra curriculum results
in a number of graphing software environments, many of which had common
functionality that allowed the user to:
enter a function and observe the resulting graph being plotted on the
screen;
observe a table of x and y values, and in some cases select the initial values
displayed and change the increment between them;
observe particular values for the defined function on the graph itself, often
through a trace facility;
enlarge or reduce a graph’s appearance by either rescaling the axes or using
a ‘zoom’ facility.
Within this type of representational system, the starting point was predominantly
the definition of the function (often requiring a particular syntax) and, in order to
explore the variance and invariance of a situation, the teacher would need to devise
activities in which students were required to focus on particular objects and/or
values within the system. However, researchers such as Kaput have been careful to
point out that,
Our initial attention to symbol systems should not be misread as an
assertion that mathematics is, and hence the curriculum should be,
about symbols and syntax. On the contrary, our ultimate aim is to
account for the building and expressing of mathematical meaning
through the use of notational forms and structures. (Kaput, 1989, pp
167-8)
The broader ideal that representational systems might form part of the
environment in which learners can experience and express mathematical
generalities is one that has underpinned the work of researchers in the field
(Moreno-Armella et al., 2008, Sutherland and Mason, 1995). Mason writes about

How does a multi-representational mathematical ICT tool mediate teachers‟ mathematical and
pedagogical knowledge concerning variance and invariance?
Chapter 3 Literature review
59
the dual processes of 'seeing a generality through the particular and seeing the
particular through the general' as being integral to the learning of mathematics
(Mason, 1996, p.65).
A number of ‘typical’ pedagogical approaches have become evident in English
secondary classroom practices, which attempt to adopt such an approach, for
example using a suitable technology to vary the values of the parameters m and c
within the generalised linear function y = mx + c (Ruthven et al., 2009). However,
the research evidence also suggests that this approach falls short of the ideal as
students will often make generalisations that, although correct, are not those which
the teacher intended.
Mason writes extensively about the subtle decisions and actions that teachers
should make in order to support the students to move fluently from the example
that forms the particular to consider the generality and then, from a consideration
of the generality, find examples of the particular. He argues that the teacher’s
choice of mathematical examples that initiate this process in the classroom is
crucial, with students often assuming generalities from the examples teachers
provide, which are not those that the teacher had intended (Mason, 1996). In my
own study I am interpreting variance and invariance in the sense that, through the
examples that the teachers select and develop, I am able to gain an insight into
their perceptions of the exploration of generality as the central act within their
mathematics classroom. Mason poses the question ‘Does software that provides
particular instances necessarily lead pupils to awareness of generality?’ (Mason,
1996, p.70). Within the context of this study I would rephrase this question to read,
how do teachers develop activities and approaches that privilege students’
awareness of generality within such software environments?
In the mid 1980s, what we know now as dynamic geometry systems began to
emerge and these were initially concerned with the construction and manipulation
of geometrically defined figures in a pure Euclidian sense (Baulac et al., 1988, Key
Curriculum Press, 2003, Schwartz and Yerushalmy, 1985). Such software adopted a
notional concept of scale and included measurement functionality. The original
intention was that ‘measurement can play only a suggestive function, not a
conclusive one’ (Kaput, 1986), which in some cases led the designers to limit the
accuracy of measurement to just two decimal places (Schwartz and Yerushalmy,
1985). Later developments led to the overlaying of a Cartesian graphing plane to
the geometric plane, enabling mathematical activities to be designed that allow the
measurements from dynamic figures to be output to tables and graphs. This has led

How does a multi-representational mathematical ICT tool mediate teachers‟ mathematical and
pedagogical knowledge concerning variance and invariance?
Chapter 3 Literature review
60
to what Lakatos described as a ‘quasi-empirical’ approach to be developed within
mathematical activity design and an expansion and redefinition of the
epistemological context (Lakatos, 1976). The collection of ‘experimental data’,
generated from dragging objects or varying values with a view to arriving at
generalities using mathematical modelling approaches, has become a recognised
genre of technology use in mathematics classrooms (Oldknow, 2009, Arzarello and
Robutti, 2008).
3.3.2 Key research studies
James Kaput’s seminal paper of 1986 speculated about how the software that was
emerging at that time offered new insights into the nature of mathematics as a
body of knowledge (i.e., its content and processes) and the possibilities for the
resulting human engagement (Kaput, 1986). The primitive mathematical definitions
that are designed into mathematical software have a fundamental influence on the
resulting mathematical interactions and Kaput was intuitive in his description of
how technology might ‘open new representational windows’ (ibid. p187). Kaput
gave teacher training support the highest priority with respect to whether or not
new representational forms for mathematics within technological environments
would shape the direction of mathematics teaching and learning, saying, ‘Limited
imagination, lack of confidence, or a totalitarian or almost negative attitude towards
students’ intellect can close the shades on any representational window’ (ibid.
p.199). Whilst this might seem negative and judgemental, the intervening twenty-
five years had not revealed any groundbreaking developments in the role and use
of technology within the English mathematics classroom setting to suggest that
Kaput’s prediction was inaccurate.
A recent systematic review of the research into the use of technology to support
the teaching and learning of algebra by Goulding and Kyriacou (2008) on behalf of
the Evidence for Policy and Practice Information and Coordinating Centre (EPPI)
concluded that further research was needed on:
the links between tables of values, symbolic representation and graphical
representation, which could provide the bridge between functions and the
solution of equations;
critical use of graph-plotters, including how changing the scale can alter the
appearance of the graph, how to use the zoom function, how to change
windows, and how to interpret pixel displays.
The first recommendation suggests the need for investigations into particular

How does a multi-representational mathematical ICT tool mediate teachers‟ mathematical and
pedagogical knowledge concerning variance and invariance?
Chapter 3 Literature review
61
pedagogical approaches for the use of the technology, for example the design and
support for activities that privilege the links between the different representations.
However, the second recommendation resonates with the processes of
instrumentation and instrumentalisation in that the teacher and students are
required to be aware of the various functional techniques suggested, before then
being able to utilise this functionality within activities to achieve the criticality that
is demanded. This implies the need for design experiments in which researchers
and teachers co-construct classroom activities that are valid within and relevant to
the school curriculum.
3.3.3 Implications for my study
This element of the literature review, concerning the mathematical focus for the
study, has led me to clearly define how mathematical learning is predominantly
concerned with the privileging of students’ opportunities to generalise and
specialise as a means to constructing their own mathematical meanings. Within the
context of this study, the teacher’s role is to design and orchestrate classroom
activities and approaches, which use the various functionality of the MRT to achieve
this. However, as teachers’ individual belief systems about mathematical learning
(and the role of technology within this) will undoubtedly influence their decisions
and actions, the trajectory of teacher development to which I refer will reveal
evidence of these preconceptions. The section of the literature that follows will
examine the process and content of mathematics teacher learning in an attempt to
develop a research methodology that will enable teachers’ learning to be fore-
grounded.
3.4 Interpreting mathematics teachers’ professional learning –
what and how?
As this study concerns mathematics teachers’ professional learning, a consideration
of the literature needs to include the following two aspects:
Definitions and interpretations concerning the nature of mathematics
teachers’ content knowledge to encompass personal subject knowledge,
subject knowledge for teaching and pedagogic knowledge.
Constructs concerning the process of teacher learning.
The outcomes of this element of the literature review will significantly inform the
development of the methodology for the research, particularly concerning tools and
structures developed to evidence teachers’ learning as appropriate to the two

How does a multi-representational mathematical ICT tool mediate teachers‟ mathematical and
pedagogical knowledge concerning variance and invariance?
Chapter 3 Literature review
62
phases of the study.
3.4.1 Teacher knowledge and interpretations of pedagogy
Much has been written about the tacit, implicit or craft knowledge of teaching
mathematics, particularly within initial teacher education and the first few years of
teaching. This discourse has been greatly influenced by Lee Shulman’s presidential
address to the American Educational Research Association in 1985 (Shulman, 1986)
in which he suggested three categories of content knowledge for teaching: subject
matter content knowledge, pedagogical content knowledge and curricular
knowledge.
Shulman’s definition of subject matter content knowledge extends beyond facts and
concepts to encompass the following aspects:
Substantive structures - the organisation of concepts and principles to
incorporate facts.
Syntactic structures - ‘the set of ways in which truths, falsehoods, validity
and invalidity are established… …like a grammar’ (Shulman, 1986, p.9).
Incorporation of an understanding of the importance of the substantive and
syntactic structures within the discipline.
Why particular topics are central to the discipline.
Shulman argued that all of these areas of knowledge are essential for teachers in
contrast to the lay person who is probably only concerned with the subject matter
alone. He considered pedagogical content knowledge as a second form of content
knowledge, which ‘embodies the aspects of its content most germane to its
teachability’ (Shulman, 1986, p.9). Such knowledge is defined by:
The most useful forms of representations for a given topic idea and the
explanatory structures that support others to understand the topic through
these representations. This requires teachers to stay abreast with new
insights and developments, a particularly relevant aspect when considering
the rapid developments within educational technology.
Aspects of the topic that make it easy or difficult for students at different
levels of progress (to include those commonly accepted or misunderstood)
and teaching strategies for responding to these.
Shulman calls directly for teachers to have an awareness of research-based
knowledge in this area, describing it as being ‘at the heart of our definition of

How does a multi-representational mathematical ICT tool mediate teachers‟ mathematical and
pedagogical knowledge concerning variance and invariance?
Chapter 3 Literature review
63
needed pedagogical knowledge’ (ibid. p.10). This seems highly relevant in my own
study, which calls for teacher to build an awareness of how research-informed
approaches with technology might support the teaching of particular topics in
mathematics.
Shulman’s final category of subject content knowledge, namely curricular
knowledge, is concerned with a teacher’s knowledge of the landscape from which
teaching resources and approaches are selected and the resulting student pathways
created (or inferred) by these actions. Such resources would typically include the
teaching materials, practical resources, assessment approaches and in more recent
years, ICT resources to support both teaching and learning. This landscape takes
account of the students’ own perspectives in that Shulman expects teachers to be
aware of the students’ wider curriculum, not just the teacher’s own subject area.
Shulman furthers his concept of teacher knowledge by conceptualising the forms of
representation of the content knowledge that have previously been described. He
labels these as ‘propositional knowledge, case knowledge and strategic knowledge’
and, as all three elements of content knowledge can be described in these forms,
this suggests the existence of a three by three matrix. To aid the interpretation of
Shulman’s theory within the context of this study, and as a means to establishing
its usefulness as an overarching interpretation of teacher knowledge, I have
attempted to locate possible elements of a secondary teacher’s mathematics
knowledge concerning the topic ‘learning about linear functions using technology’ to
each of the nine cells (see Table 3-2).

How does a multi-representational mathematical ICT tool mediate teachers‟ mathematical and
pedagogical knowledge concerning variance and invariance?
Chapter 3 Literature review
64
subject matter
content knowledge
pedagogical
content knowledge
curricular
knowledge
propositional
knowledge
(principles,
maxims and
norms)
Knowledge of
commonly used aide
memoire such as
„change in y over
change in x‟ for
calculating the
gradient of a linear
function. (maxim)
Knowledge of a
systematic variation
approach to the
values of „m‟ and „c‟
within graph plotting
software. (principle)
Knowledge of the
real data collection
approach for the
purpose of linear
modelling for data
analysis. (norm)
case knowledge1
(prototypes,
precedents and
parables)
Knowledge of
existing classroom
approaches for
teaching linear
function with
technology.
(precedent)
Knowledge of
empirical research
studies, which have
reported on the
teaching of linear
function with
technology.(parable)
Knowledge of cross-
curricular approaches
for the teaching of
linear function
through
interpretations of
speed-distance-time.
strategic
knowledge
Knowledge of
machine constraints
when working on
linear functions with
technology.
Knowledge of the
way in which
students make sense
of their interactions
with technology
concerning linear
functions.
Knowledge of the
way in which
students relate the
modelling of a „line
of best fit‟ from real
data to the
mathematical
definition of
function.
Table 3-2 My exemplification of Shulman’s theory of teacher content knowledge for
the mathematical topic of linear function (Shulman, 1986)
Shulman’s definition of ‘strategic knowledge’, namely the knowledge the teacher
draws upon when confronted by ‘particular situations or problems, whether
theoretical, practical, or moral, where principles collide and no simple solution is
possible’ (ibid. p.13), offered the closest interpretation of the type of knowledge
developed through situated experiential learning within the context of my own
study. This would rely on my interpretations of the evidence from teachers that
1 Shulman argues that case knowledge refers to ‘specific, well documented and richly
described events’ (ibid. p. 11).

How does a multi-representational mathematical ICT tool mediate teachers‟ mathematical and
pedagogical knowledge concerning variance and invariance?
Chapter 3 Literature review
65
would be located within each of the cells on the bottom row of Table 3-2. In
completing this non-trivial mapping activity, I very quickly concluded that,
illuminating as Shulman’s theory was, it offered far too complex an interpretation of
teacher knowledge to be useful for my own research purposes, particularly as
Shulman’s further sub-divisions of propositional knowledge and case knowledge
suggested even more cells within the matrix. Besides, I was looking to develop my
own ontological innovation for an interpretation of teacher knowledge and learning
based on the empirical evidence from my own study.
Consequently, I looked to the research of Rowland, Husktep and Thwaites which,
although located within their work with pre-service primary teachers, developed an
alternative interpretation of teacher knowledge through a grounded methodological
approach (Rowland et al., 2005). By analysing lesson observation data and video
tapes relating to twenty four lessons (from twelve different trainees), they
identified a ’knowledge quartet’ to describe the four dimensions through which the
teacher’s mathematics-related knowledge could be observed, namely, ‘foundation,
transformation, connection and contingency’ (ibid. p.259). Whilst it could be argued
that primary trainees are a very different group of research subjects to the more
experienced secondary teachers involved in my own study, it was the researchers’
classroom-situated, grounded approach that sought to develop a framework that
was ‘manageable and not overburdened with structural complexity’ that attracted
me to it. Rowland et al’s aim was to find out what their subjects did know, rather
than articulating what they ought to know, an element of their research in contrast
with Shulman’s work. Rowland et al focussed their data analysis on the elements
they identified as concerning subject matter knowledge and pedagogic content
knowledge2 and, through a robust process arrived at eighteen codes which were
then grouped into the four previously mentioned ‘units’ (Rowland et al., 2005,
p.258). On reviewing closely the descriptions of each unit, the first of these,
‘foundation knowledge’, concerned the teacher’s underlying knowledge and beliefs
about mathematics and its pedagogies. The descriptions of the units of
‘transformation’ and ‘connection’ linked with ‘knowledge-in-action’ were related to
‘deliberation and choice in planning and teaching’. However, I was particularly
interested in the notion of contingent knowledge, which Rowland et al define as:
Knowledge-in-interaction as revealed by the ability of the teacher to
„think on her feet‟ and respond appropriately to the contributions made
2 Rowland et al offered no explanation as to why they omitted to code their data for
curriculum knowledge, a surprising decision as primary teachers could possibly be expected
to have a wider perspective on this compared to their secondary counterparts.

How does a multi-representational mathematical ICT tool mediate teachers‟ mathematical and
pedagogical knowledge concerning variance and invariance?
Chapter 3 Literature review
66
by her students during a teaching episode. On occasion this can be seen
in the teacher‟s willingness to deviate from her own agenda to develop a
student‟s unanticipated contribution:
• might be of special benefit to that pupil, or
• might suggest a particularly fruitful avenue of enquiry for others.
(Rowland et al., 2005, pp. 265-6)
It was the inclusion of the phrase ‘knowledge-in-interaction’ which resonated
strongly with my own insightful observations of teachers using technology in
mathematics classrooms. The interactions, as described by Verillon and Rabardel’s
adapted triad offered a broader range than that proposed by Rowland et al, who
were observing teaching that did not involve the use of technology. This provided a
worthwhile line of enquiry for the study as I sought to expand upon this notion of
contingency in the secondary setting with the added complexity of a multi-
representational tool. However, researching the occurrence and nature of the
contingent moments would require systematic, focussed lesson observations, which
would form part of the methodology developed for the second phase of the study.
Other researchers have alluded to the existence of such ‘moments’ in lessons and
commented on their contribution to teachers’ epistemological development. For
example, Zodik and Zaslavszky researched teachers’ uses of mathematical
examples in lessons and concluded that the teachers’ reflections on the outcomes
of their use of spontaneous3 examples had the potential to provide learning
opportunities for the teachers (Zodik and Zaslavsky, 2008). However, this looked to
be an under-researched area within the domain of technology use in secondary
mathematics classrooms.
In concluding this section, a consideration of the nature of ‘tacit knowledge’ seemed
to be a central idea when investigating teachers’ professional development (Polanyi,
1962, Polanyi, 1966). Polanyi justified the existence of tacit knowledge by saying
‘we know more than we can tell’. With respect to the craft of teaching secondary
mathematics, it is the teacher’s insightful knowledge that underpins their thoughts
and actions. In my study, researching the acquisition of this tacit knowledge
required a subsidiary awareness to the subtleties of teachers’ thoughts and actions
within their practice. One of the challenges for the design of my research
methodology, particularly during the second phase would be to develop a robust set
of research tools and strategies that would reveal teachers’ tacit knowledge in
3 Zodik and Zaslavsky define spontaneous examples as those ‘for which there is evidence
that choosing it involved to some extent in-the-moment decision making’ (ibid p.171)

How does a multi-representational mathematical ICT tool mediate teachers‟ mathematical and
pedagogical knowledge concerning variance and invariance?
Chapter 3 Literature review
67
relation to the research topic.
3.4.2 Making sense of the process of teacher learning
The process of teacher learning is a relatively under-defined area within
mathematics education and a central construct that has emerged from the
literature is the notion of reflective practice. This was first proposed by Schön
(1984) who examined the practices of different professionals in situ. In defining the
starting point for his research, Schön seems to build upon Polanyi’s earlier concept
of tacit knowledge when he stated,
I begin with the assumption that competent practitioners usually know
more than they can say. They exhibit a kind of knowing-in-practice,
most of which is tacit. (Schön, 1984, p.viii)
Following Schön’s early research the concept of ‘teachers as reflective practitioners’
was taken up by a number of researchers within the context of mathematics
education (Thompson, 1992b, Mason, 2002, Jaworski, 1994, Ahmed and Williams,
1997). Mason (2002) critiqued Schön’s classifications of ‘reflection-on-action’ and
‘reflection-in-action’ stating that neither takes account of the quality or depth of the
reflection that may be taking place. Mason added the classification ‘reflection-
through-action,’ which he described as ‘becoming aware of one’s practice through
the act of engaging in that practice’ (ibid, p.15). Mason also introduced the idea of
the ‘professional incident’ as the starting point for the reflection, claiming that these
starting points can lie within,
psychological-historical-structural aspects of a specific topic or practice,
on processes of learning-teaching, on institutional forces in which I4 am
embedded, or on socio-cultural-political forces which constitute the
encompassing system. (Mason, 2002, p15)
Mason argues that the reflective accounts of such incidents would form the basis for
the enhanced communication of insights and analyses as appropriate to the
community within which the incident is located. I have a strong personal resonance
with this notion as I can recall many ‘incidents’, which have been triggered by all of
the starting points identified by Mason and which led me to take actions in my own
professional practice.
Several researchers have developed strategies for stimulating and encouraging
reflective practice by mathematics teachers, which have served as part of the
4 Mason refers to this in the first person – I interpret this as ‘institutional forces in which the
teacher is embedded’.

How does a multi-representational mathematical ICT tool mediate teachers‟ mathematical and
pedagogical knowledge concerning variance and invariance?
Chapter 3 Literature review
68
research methodology (Britt et al., 2001, Cooney and Krainer, 1996) or have been
developed as outcomes of the research process (Jaworski, 1994). These strategies
have focussed on:
Structures to support the reflective process such as the Jaworksi’s ‘teaching
triad’ - management of learning; sensitivity to students and mathematical
challenge’ (Jaworski, 1994).
The existence and nature of ‘professional conversations’ as being central to
the reflective process - discussions among those who share a complex
activity or profession in order to improve their understanding of, and efficacy
in what they do. (Britt et al., 2001, p.31).
The development of ‘teachers’ logs’ as an integral part of the reflection
process to include lesson evaluation structures and prompts. (Ahmed, 1987,
Ahmed and Williams, 1997)
Cooney and Krainer (1996) reiterate the importance of recording and analysing
experiences through the written word as part of the reflective process. They
contrast the differences between the different types of writing, for example writing
for oneself as opposed to writing something for the public domain, and argue that
the latter places an expectation above ‘normal’ teacher’s practises as they have to:
gather data, analyze and reflect on the data and take action; write down
their findings (and not just communicate them orally), and formulate
these results for other people (and not just practise something in their
own classrooms).(Cooney and Krainer, 1996, p.1174)
Within the context of teachers’ professional learning, their expectations as to the
nature of the programme of activity are of some significance. Schielack and
Chancellor (1994) described the frustrations they felt when teachers participating in
their professional development courses seemed to be interested only in
accumulating activities to take back to the classroom. They responded by changing
the balance of the sessions to give a much longer proportion of time for reflection,
acknowledging that ‘stopping time for reflection’ was likely to be viewed critically by
the teachers who might not have seen this as a valid form of professional activity.
Schielack and Chancellor noted that they ‘would need to offer a supportive
environment until they began, as individuals, to reap the benefits of a reflective
attitude towards their teaching’ (ibid, p.305).
Several studies that have focused on teacher learning involving technology have
included the role of teacher reflection within discussions and writings following

How does a multi-representational mathematical ICT tool mediate teachers‟ mathematical and
pedagogical knowledge concerning variance and invariance?
Chapter 3 Literature review
69
classroom teaching as an implicit element of the research methodologies (Noss et
al., 1991, Laborde, 2001, Norton et al., 2000). However, none of these particular
studies included a discussion of the role of active reflection as an integral element
of the research design. In most cases the teachers’ comments and notes were part
of the data collection process and not seen as fundamental to their teachers’
subsequent learning. The opportunity for teachers’ reflections to be heard through
their writings in addition to their oral contributions is of significant value within any
research process, which focuses on aspects of teacher learning and, as this was the
main aim for this study my methodology would need to take account of these
issues.
3.4.3 Implications for my study
The review of literature referring to the content, nature and process of teacher
learning led me adopt a broad interpretation of knowledge as proposed by
Shulman’s ‘knowledge for teaching’. It also highlighted the complexities of the
process of teacher learning and the methodologies that would be needed to capture
this in line with my desire to describe teachers’ trajectories of development within
the domain of the study.
3.5 Summary and refined aims for the study.
Chapter One concluded with the description of the broad aim for the study, which
was to explore the nature of teachers’ cognitive and pedagogical learning as they
developed their use of a MRT with a focus on their conception of mathematical
variance and invariance. The literature review has expanded this question to
incorporate the following subsidiary aims:
What are the trajectories in the teachers’ learning and how can these be
described in terms of the activity, classroom and subject layers?
What do the emergent practices say about the teachers’ conceptions of
mathematical variance and invariance?
What form of instrument utilisation schemes emerge?
How does a multi-representational mathematical ICT tool mediate teachers‟ mathematical and
pedagogical knowledge concerning variance and invariance?
Chapter 4 The research methodology
70
4 THE RESEARCH METHODOLOGY
4.1 Introduction
In concluding their research study into teachers’ perceptions of the use of
technology, which involved secondary mathematics departments in seven English
schools, Ruthven and Hennessy (2002), highlighted the need for,
naturalistic studies which provide analyses of the perspectives and
practices of groups of teachers across different settings within the
context of using technology to support teaching and learning of
mathematics. (p.50)
Although this study cannot claim to be wholly naturalistic, the reasons for which are
explained later in this chapter, it did aim to gain a deep insight into the
perspectives and practices of secondary mathematics teachers as they developed
their use of the MRT in the classroom. In particular, it sought to explore the process
through which the teachers’ perceptions, mathematical and pedagogical knowledge
concerning variance and invariance evolved over the period of the study. The study
adopted a broad interpretation of a mathematical variable as a mathematical object
that can be varied within a static and dynamic setting through the process of
changing an input or dragging an object (in a dynamic context). This extended the
concept from the more traditional numerical and algebraic domains to include the
geometric domain, and also resonated with recent changes to the English
curriculum (Department for Children Schools and Families, 2007), offering an
element of legitimacy for the teachers involved.
The research was carried out in two phases, the first between July 2007 –
November 2008 and the second between April 2009 and December 2009. In each
of these phases, a group of teachers was selected and a series of methodological
tools developed to capture rich evidence of their use of the technology in
classrooms to enable the aims of the study to be realised. The methodological
approaches for each phase were distinct and these are described in detail in
Chapter 4 and Chapter 5, accompanied by a justification of the decisions that were
made.
4.2 Theoretical stance for the research process
My research adopts the perspective that reality is socially constructed and that the
‘activity of the researcher is to understand the multiple social constructions of
meaning and knowledge’ (Robson, 2001, p. 27). Consequently I have sought to

How does a multi-representational mathematical ICT tool mediate teachers‟ mathematical and
pedagogical knowledge concerning variance and invariance?
Chapter 4 The research methodology
71
privilege the voices, actions and meanings of the teachers as the main data sources
and ensure the reliability of the study through a robust process of data analysis
leading to a valid set of conclusions.
One of the difficulties encountered in designing research studies that focus on
secondary mathematics teachers’ uses of technology is that, despite the wide range
of technologies available, inspection reports and large scale surveys have
concluded that there is limited use in classrooms of the type that fully exploits the
potential of the available technology (see for example, British Educational
Communication and Technology Agency, 2007, Office for Standards in Education,
2008, Office for Standards in Education, 2006). It is very difficult to identify a group
of teachers who are consistently using any given technology and further problems
arise in designing and funding longitudinal research into their trajectories of
practice. By their nature they would be a disparate group and it would be time-
consuming, managerially difficult and geographically challenging to research their
personal learning concerning technology over a realistic timescale.
Consequently, there were two naturalistic features within both phases of my study.
Firstly the teachers were developing and evaluating activities and approaches that
used technology in their own classrooms with learners, as opposed to in a research
environment. Although the selected technology was new to each classroom setting,
it had to be assumed that the ‘non technology’ practices and classroom ethos were
already established in each classroom. Therefore both the teacher’s and students’
responses would be naturalistic within the context of the introduction of a new
technological environment.
Secondly, the responsibility to determine the curriculum content of the activities
and approaches that were developed lay with the teachers themselves. The
teachers were not all provided with the same set of pre-designed activities and
approaches for them to use and evaluate, although the professional conversations
that would ensue during the study would be expected to lead to opportunities for
the teachers to learn about (and share) activities and approaches that used similar
technologies in addition to developing new ideas.
My research approach was similar to that of ‘design experiments in educational
research’ as described by Cobb et al (2003), which is consistent with the desire to
arrive at an ontological innovation (diSessa and Cobb, 2004) as outlined in Section
1.3.
Cobb et al describe design experiments thus,

How does a multi-representational mathematical ICT tool mediate teachers‟ mathematical and
pedagogical knowledge concerning variance and invariance?
Chapter 4 The research methodology
72
Prototypically, design experiments entail both engineering particular
forms of learning and systematically studying those forms of learning
within the context defined by the means of supporting them. (Cobb et
al., 2003, p.9)
My experiment was primarily concerned with the ‘design and ecology’ of teacher
learning and my methodology is of the type and scope that Cobb et al describe as
pragmatic, ‘In-service teacher development studies in which researchers collaborate
with teachers to support the development of the professional community’ (ibid p.9).
The purpose of the research was to develop a class of theories about the process of
teacher learning. This required me to adopt an interventionist approach by
engineering situations in which I was both supporting the teachers to develop their
uses of the technology, whilst also researching the underlying processes and
resulting outcomes. The research was also prospective in that its design was
implemented with a hypothesised learning process. I had my own research-
informed idea of the nature of the activities that might use the MRT to support
learners to make sense of mathematical situations concerning variance and
invariance. The research was also reflective in that it fostered the emergence of
other potential pathways for learning and development by capitalising on the
research outcomes that arose as the research was underway. Examples of this
occurred during the sharing of mathematical activities and pedagogical approaches
between the participating teachers involved in the first phase of the research.
However, in my study there was not going to be a clear single ‘product’ in
development, a commonly interpreted pre-requisite for a piece of design research
in the form of a final design of an artefact or an exemplar set of materials.
However, the teachers and I were all working together to further our understanding
of the technology and its role and use in mathematics education. There would be
some examples of iterative design as activities and approaches underwent ‘cycles of
invention and revision’ (Cobb et al., 2003, p.8) through an initial design process,
classroom implementation, review and sharing process with other teachers and, in
some cases, re-design and re-implementation in another classroom setting. This
could not be a planned aspect of the methodology as it would be dependent on how
the initial ideas resonated with the individual teachers and whether they had an
appropriate class of students with which they might be able to use that idea. In
addition, the imposition on teachers of a set of ideas and approaches using the
technology would have jeopardised the naturalistic aspect of the study. This could
indicate a tension between the interpretation of a design experiment methodology

How does a multi-representational mathematical ICT tool mediate teachers‟ mathematical and
pedagogical knowledge concerning variance and invariance?
Chapter 4 The research methodology
73
as ‘highly interventionalist’ when working within the in-service education of a
professional learning community where the participants need to have some
autonomy within the decision making processes. To some extent, the responsibility
for elements of the design became a shared activity between the researcher and
the participants. This demanded a methodology in which the participants’ views and
decisions were made as explicit as possible to enable them to be central to the
research data.
Finally, in accordance with the definition of a design experiment methodology in
education described by Cobb et al,
Any theories developed from the research are humble not merely in the
sense that they are concerned with a domain specific learning processes
but also that they are accountable to the activity of the design. (Cobb et
al., 2003, p.8)
The research was phenomenological in its approach as it sought to explore one
particular phenomenon, namely the trajectory of teachers’ knowledge and practice
concerning mathematical variance and invariance as they learned to use a multi-
representational technological tool (Vandenberg, 1997). The study was situated
within the English secondary school mathematics classroom setting, alongside
teachers who were beginning to use a multi-representational technological tool.
4.3 Phase one: Introducing the MRT to the teachers
The first phase of the research included the introduction of the chosen MRT to the
teachers involved in the study, which took place from July 2007 to November 2008.
During this period, the teachers engaged in seven days of face-to-face support
when they learned to use the different functionality of the technology and devised
activities and approaches to use in their classrooms with learners. The teachers
were introduced to the methodological tools that had been designed to support
them to capture and describe their classroom outcomes, with an emphasis on how
they were using the functionality of the MRT to provide a substantial learning
environment in which their students might learn mathematics. Opportunities were
provided for the teachers to discuss and present their classroom outcomes and,
over the course of this phase of the research, share the emerging practices, which
involved the considered use of the multi-representational environment.
Through the analysis of the Phase One data I anticipated that I would arrive at:
a clearer understanding of the ways that the teachers used the multi-
representational environment to emphasise different conceptions of variance
How does a multi-representational mathematical ICT tool mediate teachers‟ mathematical and
pedagogical knowledge concerning variance and invariance?
Chapter 4 The research methodology
74
and invariance in ways that demonstrated educational legitimacy for
teachers within the secondary school mathematics context;
an insight into what the process of teacher learning might involve, elicited
from the teachers’ perceptions of the lesson (as evidence by their lesson
evaluation data);
a decision concerning the validity of the pedagogical map (Stacey, 2008)
within the setting;
the identification of the teachers who would become the subjects of the
research in its second phase.
In common with other teacher development projects, with and without ICT, there
was a clear rationale underpinning the approach taken to establish the ethos and
ways of working within the project (Ahmed, 1987, Watson et al., 2003). There was
a clear sense of ‘researching-with’, which resulted from privileging the teachers’
classroom stories and by supporting teachers to substantiate their own claims of
changed mathematical experiences and outcomes on the part of their students.
4.3.1 Selection of the teachers for the study
Pairs of teachers were selected from seven English state schools that were part of
the Specialist Schools and Academies Trust (SSAT) network. The review of
literature had revealed that the teachers would have a better support network away
from the face-to-face elements of the project if they had a colleague in their school
who was also actively involved (Office for Standards in Education, 2008, Ahmed
and Williams, 1997). However existing literature had also indicated that it would be
important that at least one of the pair of teachers in each school had a level of
confidence and competence with the use of technology in the mathematics
classroom. Consequently, the initial selection of schools was based on information
provided by colleagues in the SSAT and Teachers Teaching with Technology (T3)
networks.
Obviously, in agreeing to participate in a pilot project seeking to implement a new
technology, the lead project teachers in each school demonstrated a sense of
‘pioneer militancy‟ (Artigue, 1998), immediately placing this project in the category
of similar studies, which sought to research ordinary teachers but, by their nature,
only involved extraordinary teachers. In an attempt to mitigate this position, each
lead project teacher was asked to involve a second teacher in their school and, in
some cases, the second teacher was asked to participate because they said they
lacked confidence with technology. This approach resonates with Ofsted evidence in

How does a multi-representational mathematical ICT tool mediate teachers‟ mathematical and
pedagogical knowledge concerning variance and invariance?
Chapter 4 The research methodology
75
relation to the development of ICT expertise in secondary mathematics department.
Where a department has at least one member who is a confident and
enthusiastic user of ICT, this enables others to share their expertise and
take the first steps; before long this becomes self-perpetuating and the
department as a whole develops a momentum which benefits all pupils.
In contrast, schools with limited facilities or resident expertise need
external support, often of a sustained nature, in order for teachers to
become effective users of a range of appropriate ICT mathematics
applications. (Office for Standards in Education, 2008)
The head teachers from each of the selected schools signed an agreement, which
outlined the expectations of both the school and the teacher involved (Appendix 1).
At this stage, I did not make it explicit to the teachers that my specific research
focus concerned how they made sense of the concepts of mathematical variance
and invariance, as I did not want to jeopardise their engagement in the project.
There was a danger that, if the teachers felt that they were being treated as
research subjects, they would not perceive a personal relevance for them in their
involvement and this might have caused them to be de-motivated or less engaged.
I felt confident that I would be able to embed my own research within a broader
project concerning the mathematics curriculum holistically in the spirit of a more
naturalistic enquiry. Whilst this could be interpreted as a lack of focus or weakness
in the research design, I would argue that it strengthened the approach as the
teachers engaged fully with the study. From their perspective it related strongly to
the National Curriculum for secondary mathematics, which they were all expected
to be implementing from September 2008. In making this decision, it also enabled
me to explore how a multi-representational technology, which facilitated the linking
of algebra with geometry, would add to the existing research on MRT that had
mainly concerned the algebraic and numeric domain, often focussing on the
concept of function.
4.3.2 Process of teacher development
The teachers involved in the first phase of the project engaged in thirty hours of
face to face professional development over seven days, the objectives of which
were to:
introduce them to the technical features of the MRT and develop their
personal confidence and competence to use it in their classrooms;
consider how these features might be useful to them in supporting students’

How does a multi-representational mathematical ICT tool mediate teachers‟ mathematical and
pedagogical knowledge concerning variance and invariance?
Chapter 4 The research methodology
76
learning experiences in their mathematics lessons;
enable the teachers to design activities and develop the necessary support
materials, for example students’ files and activity sheets;
provide opportunities for the teachers to reflect upon the outcomes of their
own and their students’ classroom experiences with the MRT and use a
range of research tools to support them to evaluate this.
The teachers were encouraged to behave as action researchers by adopting a
cyclical approach to evaluating their classroom experiences of using the MRT with
their learners. They were each asked to submit a minimum of five activities, which
they felt exemplified their ‘best’ use of the MRT during first phase of the study.
4.3.3 Methods of data collection during Phase One
The qualitative nature of the study required a range of data collection instruments
and strategies to be developed. In some cases these evolved in response to
unplanned incidents or observations within the research as a direct consequence of
an iterative design methodology. This section describes the data collection
strategies used and links them to the research aims.
4.3.3.1 Teacher questionnaires
During Phase One four separate questionnaires were designed and administered at
different times during the study.
At the beginning of the study, the teachers were asked to complete the
questionnaire shown in Table 3-1 which was designed to obtain information about:
their professional backgrounds and related qualifications and experience; their
previous uses of technology for mathematics and the ICT resources for
mathematics to which they currently had access, and how they used them.
Q1-1 Name
Q1-2 Date of Birth
Q1-3 What is the highest qualification you hold in mathematics?
i.e. O level/GCSE, A level, degree
Q1-4 What teaching qualification do you hold?
i.e. Cert Ed, PGCE, GTP
Q1.5 What subject and age range did you originally train to teach?
Q1.6 What year did you originally qualify to teach?
Q1.7 How many years teaching experience do you consider you have?
Q1.8 Are you currently studying or do you hold a Master’s Degree in a mathematics
education related area?

How does a multi-representational mathematical ICT tool mediate teachers‟ mathematical and
pedagogical knowledge concerning variance and invariance?
Chapter 4 The research methodology
77
Q1.9 If so, please describe your study.
Q1-10 Are you are Member of any professional education bodies?
i.e. the ATM or MA
Q1-11 If so, please state which one(s) and describe your level of activity.
i.e. read journals, attend conferences, go to branch meetings etc.
Q1-12 If you are (or have been) involved in any ICT related projects, pilots or network
groups, please describe them and your level of activity.
Q1-13 How would you describe your previous experience with handheld technology for
learning mathematics?
Q1-14 Please be as specific as possible – include dates, CPD or projects you have been
involved in, resources developed or used etc.
Q1-15 How would you describe your level of confidence to use handheld technology in
mathematics lessons?
Q1-16 Please add any other background details about yourself that you think might be relevant to the project.
i.e. My previous career was a software designer!
Table 4-1 Questionnaire 1: Identifying the teachers’ backgrounds and experiences
as relevant to the study.
The information that the teachers provided in their responses to Questionnaire 1
helped me to contextualise each teacher’s actions and activity within the project in
relation to their background, experience and starting points. Also, as the processes
of designing activities using the MRT began, it would enable me to challenge the
individual teachers to develop their mathematical and pedagogical approaches. For
example, a teacher who had prior experience with the use of graphing calculators
would be encouraged to develop activities, which built on this experience and
consider how the explicit linking of representations or the use of different
representations might complement previously developed approaches.
A second questionnaire was designed as a common structure for the teachers’ to
provide detailed descriptive accounts of their classroom uses of the MRT throughout
Phase One of the study (see Table 4-2). Only the MRT activities which included a
completed Questionnaire 2 were included in research data.

How does a multi-representational mathematical ICT tool mediate teachers‟ mathematical and
pedagogical knowledge concerning variance and invariance?
Chapter 4 The research methodology
78
Name: Date:
School: Class (and year):
Approx NC level Number of students: Q2-1
During this mathematics lessons my students used: (please circle)
Only handheld device Only software on a PC
Handheld and Software
Neither
Q2-2
For the follow up mathematics homework my students used: (please circle)
Only handheld device Only software on a PC
Handheld and Software
Neither
Q2-3 What did you want the students to learn?
Q2-4 What activity did you choose (or develop)?
Q2-5 And what mathematical learning took place?
Q2-6 How did you introduce the activity?
Q2-7 What were students’ initial reactions/questions?
Q2-8 Approximately how many of the students could develop strategies to fully pursue the
activity with little or no guidance from you?
Q2-9 What, if any, guidance did you have to give to the other students?
Please indicate how many students approximately needed additional guidance?
Q2-10 Give examples of the sort of interventions you made
Q2-11 How did the activity enable students to take more responsibility for their mathematical
learning?
Q2-12 Give a brief summary of the students’ work/conclusions
Q2-13 How did the idea influence further work?
Q2-14 What aspect(s) of the idea would you use again?
Q2-15 What changes would you make?
Q2-16 Any other observations…? pupils’ comments…? other teachers’ comments…?
Q2-17 In your view, did the use of the technology enhance the mathematical understanding of
the students? If yes, what evidence would you use to support this?
Q2-18 Feedback from pupils Did you enjoy the lesson?
Did you have any problems using TI-Nspire?
Did you have any mathematical surprises in the lesson?
How was the lesson different for you as a pupil?
Q2-19
Key process Example
Repre
senting identify the mathematical aspects of the situation or problem
choose between representations
simplify the situation or problem in order to represent it
mathematically using appropriate variables, symbols, diagrams and models
select mathematical information, methods and tools for use

How does a multi-representational mathematical ICT tool mediate teachers‟ mathematical and
pedagogical knowledge concerning variance and invariance?
Chapter 4 The research methodology
79
Analy
sin
g
make connections within mathematics
use knowledge of related problems
visualise and work with dynamic images
look for and examine patterns and classify
make and begin to justify conjectures and generalisations, considering special cases and counter examples
explore the effects of varying values and look for invariance
take account of feedback and learn from mistakes
work logically towards results and solutions, recognising the impact of constraints and assumptions
appreciate that there are a number of different techniques that can
be used to analyse a situation
reason inductively and deduce
Use a
ppro
priate
math
em
atical
pro
cedure
s
make accurate mathematical diagrams, graphs and constructions on
paper and on screen
calculate accurately, using a calculator when appropriate
manipulate numbers, algebraic expressions and equations and apply
routine algorithms
use accurate notation, including correct syntax when using ICT
record methods, solutions and conclusions
estimate, approximate and check working
Inte
rpre
ting a
nd e
valu
ating
form convincing arguments based on findings and make general
statements
consider the assumptions made and the appropriateness and accuracy of results and conclusions
be aware of strength of empirical evidence and appreciate the difference between evidence and proof
look at data to find patterns and exceptions
relate findings to the original context, identifying whether they
support or refute conjectures
engage with someone else's mathematical reasoning in the context
of a problem or particular situation
consider whether alternative strategies may have helped or been better
Com
munic
ating
and r
eflecting communicate findings in a range of forms
engage in mathematical discussion of results
consider the elegance and efficiency of alternative solutions
look for equivalence in relation to both the different approaches to
the problem and different problems with similar structures
make connections between the current situation and outcomes, and ones they have met before
Q2-20
Pers
onal qualities
Develo
pin
g g
ood w
ork
habits
Being imaginative, creative or flexible
Being systematic
Being independent in thought and action
Being cooperative
Being persistent
Develo
pin
g a
positiv
e
att
itude t
o
math
em
atics Developing a fascination for mathematics
Showing interest and motivation
Showing pleasure and enjoyment from mathematical
activities

How does a multi-representational mathematical ICT tool mediate teachers‟ mathematical and
pedagogical knowledge concerning variance and invariance?
Chapter 4 The research methodology
80
Showing an appreciation of the purpose, power and
relevance of mathematics
Showing satisfaction derived from a sense of achievement
Showing confidence in an ability to do mathematics at an
appropriate level
Table 4-2 Questionnaire 2: Lesson evaluation form designed for Phase One of the
study.
In designing Questionnaire 2, the response section Q2-19 was adapted from the
draft National Curriculum for mathematics (Qualifications and Curriculum Authority,
2007), the justification for which is provided later in this chapter. The questionnaire
response section Q2-20 was adapted from an early guidance document for
mathematics which pre-dated the introduction of the first National Curriculum but
offered a useful set of probes that acknowledged the students’ personal qualities
when engaging in mathematical activity (Her Majesty's Inspectorate, 1985).
Questionnaire 3 was designed and administered during Phase One to capture some
of the more subtle information concerning the design of each of the teacher’s TI-
Nspire activities (Table 4-3).
Name:
Lesson title and code:
About your planning and preparation....
Q3-1 If the activity was pre-constructed for this lesson, outline the story of its development
i.e. did you work with colleagues and/or mentors?
Q3-1 If the TI-Nspire file was constructed as an outcome of the lesson, outline how you did
this, or supported this to happen.
Q3-3 On reflection, was the planning and preparation for this lesson sufficient?
If not, how could you have improved on this?
About the TI-Nspire activity itself
Q3-4 Did the TI-Nspire activity include linked multiple representations?
If so, what specifically did you link? (be specific to the activity please).
Q3-5 Did your TI-Nspire activity include curriculum content from more than one NC
Attainment area?
Which ones?

How does a multi-representational mathematical ICT tool mediate teachers‟ mathematical and
pedagogical knowledge concerning variance and invariance?
Chapter 4 The research methodology
81
Table 4-3 Questionnaire 3: Probing the process of each teacher’s activity design
during Phase One of the study.
The final questionnaire designed during Phase One, Questionnaire 4 (Table 4-4),
was administered as a task during one of the face-to-face meetings in which the
teachers were asked to consider one classroom activity where they felt that the use
of the MRT had enriched their students’ mathematical experiences.
Representing
mathematics
Analysing
Use appropriate
mathematical procedures
Interpreting and evaluating
Personal Qualities Communicating and reflecting
Table 4-4 Questionnaire 4: Task cards designed to support the teachers to
understand the terminology of Q2-19 and Q2-20 when completing Questionnaire 2.
The six categories were accompanied by a set of statements (aligned with each
category using colour coded card) and each teacher worked with a colleague
involved in the project to identify those that they felt had been privileged within
their chosen MRT activity.
For example, the category Representing mathematics was accompanied with cards
stating:
identify the mathematical aspects of the situation or problem;
choose between representations;
simplify the situation or problem in order to represent it mathematically
using appropriate variables, symbols, diagrams and models;
select mathematical information, methods and tools for use.
These categories and the supporting statements included identical text to that
within sections Q2-19 and Q2-20 of Questionnaire 2 (Table 4-2). The teachers then
recorded the evidence from the activity that they felt substantiated a claim.
Questionnaire 4 was designed in response to my realisation that, although the
teachers were conscientiously completing Questionnaire 2 (Table 4-2), the depth of

How does a multi-representational mathematical ICT tool mediate teachers‟ mathematical and
pedagogical knowledge concerning variance and invariance?
Chapter 4 The research methodology
82
their responses to sections Q2-19 and Q2-20 was not detailed enough for me to
begin to analyse them in the way I had originally anticipated in my methodology.
This supported Polanyi’s claim that ‘we know more than we can tell’ (Polanyi,
1966). My individual discussions with a few of the teachers had intimated that they
were not completely confident with their interpretations of the terminology within
this part of the questionnaire and so were reluctant to record anything. The
subsequent design of Questionnaire 4 allowed them to identify a lesson and discuss
in depth each of the Key Process statements in relation to that lesson. A group
discussion at the end of the task elicited the particular terminology that had
challenged the group and between us we were able to arrive at a better group
understanding, including exemplification from familiar activities using the MRT.
Questionnaires 2, 3 and 4 were designed to gather as much information as possible
from the teachers about the activities they designed using the MRT throughout the
study. As the lessons during Phase One were not observed by myself, it was
important that the responses to Questionnaire 2 included the finer nuances of the
lesson and that the teachers were encouraged to submit supportive evidence in the
form of their students’ work, comments and feedback, in addition to the teachers’
own post-lesson reflections. In this respect the data represented the teachers’
perceptions of what had happened in their classrooms and, consequently, provided
an insight into each teacher’s underlying beliefs, classroom actions and reflections.
For example, behind each of the reported activities, the teacher would have made
decisions about what mathematics they wanted the students to learn through the
use of the MRT. In probing each teacher’s thinking about the design of the activity
and how they had introduced and developed it through the course of the lessons, it
would be possible to gain a perspective on how the teacher perceived the
mathematical content alongside their pedagogical approaches. I was particularly
focused on eliciting evidence concerning their interpretations of variance and
invariance in addition to evidence that might indicate some form of teacher learning
through the activity design, implementation and evaluation processes.
4.3.3.2 Personal research journal
My personal research journal formed a significant evidence base within this study
as it documented my decisions and reflections within the iterative design and
described the incidental and unplanned interactions, which had implications on
subsequent activities and interpretations. These notes recorded my own reflections
relating to my progress through the research and, in doing so, highlighted the

How does a multi-representational mathematical ICT tool mediate teachers‟ mathematical and
pedagogical knowledge concerning variance and invariance?
Chapter 4 The research methodology
83
struggles within my own learning as I sought to overcome frustrations, identify
issues and note successes. These research notes fully described my own personal
journey. In addition I kept notes of my informal discussions with the teachers and
the content of email exchanges between us. Extracts from my research journal
provided additional data that enabled me to triangulate other data sources and give
external validity to the research findings.
4.3.3.3 Teachers’ lesson plans, pupil resources and software files
For each of the lessons designed by the teachers, there was a significant amount of
supplementary materials, which comprised the data for that lesson. These materials
might include some or all of the following:
an activity plan in the form of a school lesson planning proforma or a hand-
written set of personal notes;
a lesson structure for use in the classroom (for example a Smart NoteBook
or PowerPoint file);
A software file developed by the teacher for use by the teacher (to introduce
the activity or demonstrate an aspect of the activity);
a software file developed by the teacher for use by the students, which
would normally need to be transferred to the students’ handhelds in advance
or at the beginning of the lesson;
a activity or instruction sheet developed by the teacher for students’ use;
students’ written work resulting from the activity;
students’ software files captured during and/or at the end of the activity.
A summary of the actual reported data for each of the lessons submitted by the
teachers during Phase One is included in (Appendix 3).
The teachers were encouraged to seek ways to capture the students work during
and at the end of the lesson. However, during Phase One there was no easy
method for them to do this, as the prototype teacher software only facilitated a
maximum of four handhelds to be connected to the teacher’s computer at any one
time. If the teachers chose to use the software, they were more able to manage file
distribution and collection. The teachers were also encouraged to obtain their
students’ feedback and views about the activities. This data was collected through
questionnaires and interviews designed and implemented by the teachers, which
they then reported to the study.
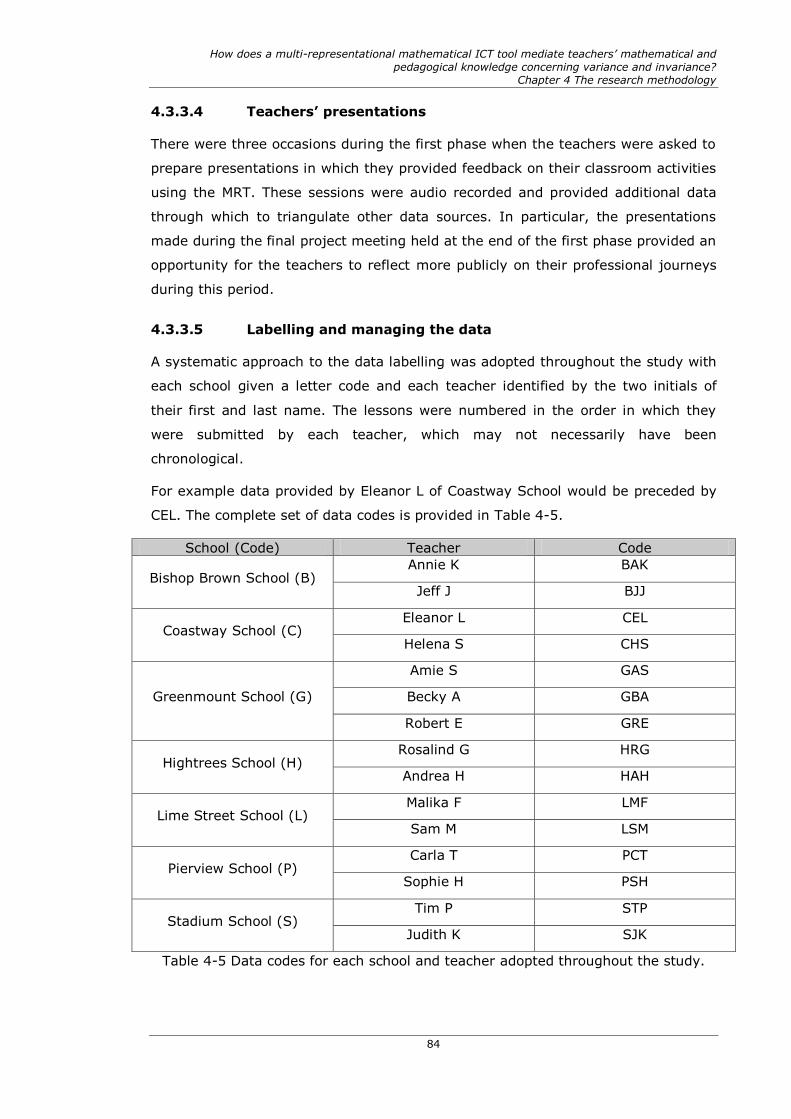
How does a multi-representational mathematical ICT tool mediate teachers‟ mathematical and
pedagogical knowledge concerning variance and invariance?
Chapter 4 The research methodology
84
4.3.3.4 Teachers’ presentations
There were three occasions during the first phase when the teachers were asked to
prepare presentations in which they provided feedback on their classroom activities
using the MRT. These sessions were audio recorded and provided additional data
through which to triangulate other data sources. In particular, the presentations
made during the final project meeting held at the end of the first phase provided an
opportunity for the teachers to reflect more publicly on their professional journeys
during this period.
4.3.3.5 Labelling and managing the data
A systematic approach to the data labelling was adopted throughout the study with
each school given a letter code and each teacher identified by the two initials of
their first and last name. The lessons were numbered in the order in which they
were submitted by each teacher, which may not necessarily have been
chronological.
For example data provided by Eleanor L of Coastway School would be preceded by
CEL. The complete set of data codes is provided in Table 4-5.
School (Code) Teacher Code
Bishop Brown School (B) Annie K BAK
Jeff J BJJ
Coastway School (C) Eleanor L CEL
Helena S CHS
Greenmount School (G)
Amie S GAS
Becky A GBA
Robert E GRE
Hightrees School (H) Rosalind G HRG
Andrea H HAH
Lime Street School (L) Malika F LMF
Sam M LSM
Pierview School (P) Carla T PCT
Sophie H PSH
Stadium School (S) Tim P STP
Judith K SJK
Table 4-5 Data codes for each school and teacher adopted throughout the study.

How does a multi-representational mathematical ICT tool mediate teachers‟ mathematical and
pedagogical knowledge concerning variance and invariance?
Chapter 4 The research methodology
85
In addition, the range of different types of data that was contributed to the study
necessitated a second level of labelling to be developed. The data labelling scheme
adopted throughout the study is shown in Table 4-6.
Data source Code Example in thesis
My personal PhD Journal, which
included: meeting notes; lesson observation notes; personal
correspondence; ongoing thoughts and
reflections and research action plan.
Journ [Journ]
Student’s lesson evaluation Eval-S CEL1(Eval-S)
Interviews with teacher Int CEL1(Int)
Teacher’s plan for the activity Plan CEL1(Plan)
Teacher’s response to Questionnaire N
i.e. Teacher’s lesson evaluation
QuestN-T
CEL(QuestN-T)
Screen capture of students’ responses
(by activity)
ScreenCapt-
Activityn
CEL(ScreenCapt-
Activity1)
Teacher’s activity structure for use in
the classroom (for example a Smart
NoteBook or PowerPoint file);
Struct CEL1(Struct)
Student’s work (by activity) StudWork-
Activityn
CEL1(StudWork-Activityn)
Activity or instruction sheet developed
by the teacher for students’ use
Activity-S CEL1(Activity-S)
Software file developed by the teacher
for use by the students.
tns-S CEL1(tns-S1), STP1(tns-
S2) etc
Software file developed by the teacher
for use by the teacher (to introduce the
activity or demonstrate an aspect of the activity);
tns-T CEL1(tns-T)
Transcript of the lesson audio recording Trans CEL1(Trans)
Video clip of activity Videon CEL1(Video1)
Digital image of the teacher’s
handwritten whiteboard notes.
Imagen CEL1(Image1)
Table 4-6 Data labelling scheme adopted throughout the study.
Throughout the study Nvivo8 software (QSR International, 2008) was used to
support both the management of the data and its subsequent analysis.
4.3.4 My role as researcher/in-service teacher educator
As mentioned in Section 4.2 this was an interventionist study in which I had dual
roles as both a researcher and an in-service teacher educator. Each role carried its
own responsibilities of which I was acutely aware, and I sought throughout to

How does a multi-representational mathematical ICT tool mediate teachers‟ mathematical and
pedagogical knowledge concerning variance and invariance?
Chapter 4 The research methodology
86
maintain the objectivity of the research process alongside managing the
participating teachers’ expectations of me in supporting their development.
During the first phase, whilst my knowledge and experience of a range of
technologies for mathematics education put me in a position that was ahead of
most of the teachers involved in the project, I was wary of imposing my own
knowledge on the teachers. I was aware of many of the issues and obstacles that
teachers faced when developing their use of a new technological tool but also
appreciated how there were opportunities for substantial learning when teachers
took risks by trying approaches that were new for them. A simple example of this
was an early tendency for teachers to attempt to translate traditional paper and
pencil mathematical activities into those involving technology, resulting in activities
that do not utilise the functionality in a way that might support learners to
understand the underlying mathematics. Indeed exactly this scenario took place
during Phase One of the study when Helena and Eleanor devised the activity
Triangle angles [CEL2], which emulated a ‘traditional’ exploratory activity whereby
students draw a series of different triangles on paper, measure the interior angles
and tabulate and sum each triangle’s interior angles to arrive at a generalisation for
all triangles.
Figures 4.3.1 and 4.3.2 below show the screens of the activity they designed, which
required the students to use the technology to measure the interior angles and then
input these measurements into a spreadsheet page to observe the resulting angle
sums for each of the four given triangles. The teachers were seeking to overcome
the difficulties students often have with accurately measuring angles in the paper
and pencil environment. However they did not anticipate the potential of rounding
errors as their students measured the angles to a degree of accuracy they had fixed
to one decimal place.
Figure 4-1 A set of triangles constructed
within the dynamic geometry application
[CEL2(tns-T)]
Figure 4-2 A blank spreadsheet page in
which the angle measurements would be
entered [CEL2(tns-T)page3]
So the transition to the technology had automated the angle measuring process but

How does a multi-representational mathematical ICT tool mediate teachers‟ mathematical and
pedagogical knowledge concerning variance and invariance?
Chapter 4 The research methodology
87
it did not take into account how, by drawing a single triangle and measuring its
angles, students could have explored many different cases by dragging its vertices
and observing the data, captured and displayed in the spreadsheet as shown in
Figure 4-3 and Figure 4-4.
Figure 4-3 A dynamic triangle constructed within the Geometry
application
Figure 4-4 The spreadsheet application
showing the captured angle measurements and associated angle
sums when the vertices of the triangle in
the previous figure were dragged
However, I judged that, through the process of evaluating and reflecting on the
original activity and considering alternative approaches to its design, the two
teachers involved would experience significant learning regarding the adaptation of
familiar activities within a technological context that they would be able to apply in
future contexts.
In my role as the researcher, whilst I cannot claim to have held an equal stance, I
worked hard to ensure the sense of ‘researching-with’ by developing a relationship
with the teachers (and wider project group) that valued the teachers’ unique
contributions and used these to arrive at a non-judgemental view of how teachers’
conceptions of variance and invariance had emerged through the project. There
were features of the MRT selected for the study that presented new mathematical
and pedagogical opportunities, so in some respect I was on a parallel learning
journey with the teachers. However, these journeys had not started from the same
position, nor were the learning velocities the same. However, by problematising the
process of developing, teaching and evaluating the classroom experiences, we were
all involved in a genuine professional discourse.
My experiences as a teacher researcher in previous projects (Stradling et al., 1994,
National Council for Educational Technology, 1998) had undoubtedly influenced my
own behaviours and actions during the study. I wanted to establish a culture within
our project community where we were all actively involved in the research process
whilst also engendering an atmosphere that valued open discussion, individual

How does a multi-representational mathematical ICT tool mediate teachers‟ mathematical and
pedagogical knowledge concerning variance and invariance?
Chapter 4 The research methodology
88
views and honesty. Although I clearly had personal goals embedded in the project,
I did not want these to override those of the individual teachers. Consequently, I
planned carefully each of the professional activities that we undertook, ensuring
that I was clear about what we were doing, why we were doing it and how the
outcome would support all of us to learn more about the situation. For example, the
development of Questionnaire 4 (Table 4-4) in response to the teachers’ reluctance
to respond to Q2-19 and Q2-20 within Questionnaire 2 (Table 4-2). It would have
been easy for me to provide a prompt sheet with more detailed descriptions and
exemplifications but I felt it important that I was seen to be part of this struggle
rather than having the answers at my fingertips.
Throughout the study, I saw myself as the bridge between the existing knowledge
and research in this domain that would influence my own decisions, actions and
interpretations whilst respecting the professional learning of the teachers involved.
4.3.5 Other support for the teachers during Phase One
During Phase One, the teachers also had access to technical, mathematical and
pedagogic support from the wider project team, which included both staff from
Texas Instruments’ and consultants employed by them to stimulate teaching ideas
and approaches appropriate to the secondary (11–16 years) mathematics
curriculum. The project team were in agreement that the onus was on the teachers
to seek out this support where needed, although during the face to face sessions,
some whole-group activities were planned to introduce the teachers to new
pedagogic approaches and technical functionality, for example the instrumentation
processes of defining and linking variables within the different applications (see
Section 2.4.7) or selecting and dragging objects within the different applications. At
the initial project meeting when the whole project team had access to the handheld
and software for the first time, one activity was designed that I used with the
teachers to overcome some of the early instrumentation issues relating to moving
between different pages and recognising the different applications. There is
evidence that this activity, ‘Four fours’, was viewed by the teachers as a valid
classroom activity to introduce their learners to the technology, since seven of them
decided to use it as an introductory activity with their learners.
4.3.6 Process of data analysis during Phase One
The initial analysis of the Phase One data required the identification of activities in
which the teachers had privileged the students’ explorations of variance and
invariance as an explicit act in the activity design or pedagogical approach. Having

How does a multi-representational mathematical ICT tool mediate teachers‟ mathematical and
pedagogical knowledge concerning variance and invariance?
Chapter 4 The research methodology
89
identified these lessons, it would then be possible to probe deeper into how this had
been interpreted within the activity design and implementation from the teachers’
descriptions.
The evidence for this was sought from the multiple data sources provided by the
teachers concerning the activities and approaches they had developed. By
contrasting the teachers’ different mathematical interpretations and the resulting
pedagogical implications, it was anticipated that a greater insight would be gained
that could suggest a broader definition of the teachers’ interpretations of the
concepts of variance and invariance within the multi-representational technological
environment. It was also anticipated that a number of teachers would be selected
to participate in the second phase of the study on the basis of their response to this
first phase.
The process involved collating and labelling all of the different data sources
submitted by the teachers to the study for each activity. This raw data was
imported to Nvivo8 where it was subsequently scrutinised and coded to elicit three
elements:
a broad description of the lesson;
an inference concerning the teacher’s interpretation of variance and
invariance within the designed activity;
the suggested instrument utilisation scheme.
So, for Judith’s lesson ‘Prime factorisation’ [SJK1], the summary shown in Table 4-7
was produced.
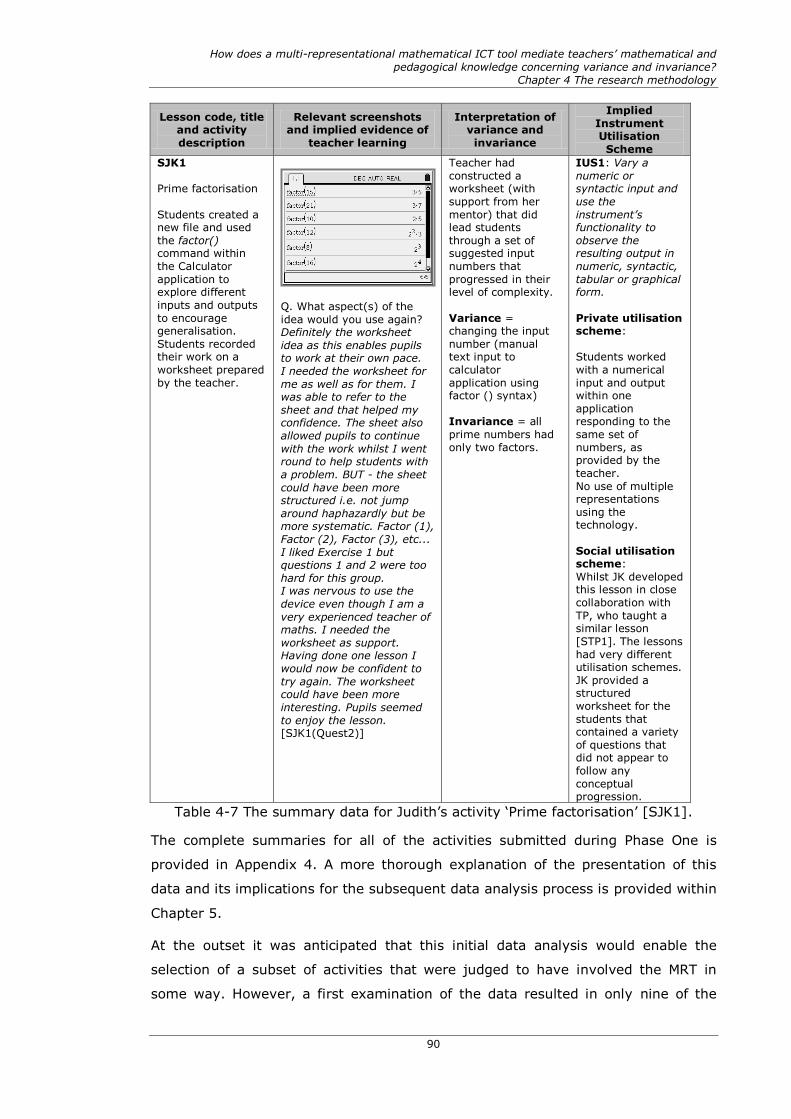
How does a multi-representational mathematical ICT tool mediate teachers‟ mathematical and
pedagogical knowledge concerning variance and invariance?
Chapter 4 The research methodology
90
Lesson code, title and activity
description
Relevant screenshots and implied evidence of
teacher learning
Interpretation of variance and
invariance
Implied
Instrument Utilisation
Scheme
SJK1
Prime factorisation
Students created a new file and used
the factor() command within
the Calculator
application to explore different
inputs and outputs
to encourage generalisation.
Students recorded their work on a
worksheet prepared
by the teacher.
Q. What aspect(s) of the
idea would you use again? Definitely the worksheet
idea as this enables pupils to work at their own pace.
I needed the worksheet for
me as well as for them. I was able to refer to the
sheet and that helped my confidence. The sheet also
allowed pupils to continue
with the work whilst I went round to help students with
a problem. BUT - the sheet
could have been more structured i.e. not jump
around haphazardly but be more systematic. Factor (1),
Factor (2), Factor (3), etc...
I liked Exercise 1 but questions 1 and 2 were too
hard for this group. I was nervous to use the
device even though I am a
very experienced teacher of maths. I needed the
worksheet as support. Having done one lesson I
would now be confident to
try again. The worksheet could have been more
interesting. Pupils seemed
to enjoy the lesson. [SJK1(Quest2)]
Teacher had
constructed a worksheet (with
support from her
mentor) that did lead students
through a set of suggested input
numbers that
progressed in their level of complexity.
Variance = changing the input
number (manual text input to
calculator
application using factor () syntax)
Invariance = all
prime numbers had
only two factors.
IUS1: Vary a
numeric or syntactic input and
use the
instrument‟s functionality to
observe the resulting output in
numeric, syntactic,
tabular or graphical form.
Private utilisation scheme:
Students worked
with a numerical
input and output within one
application responding to the
same set of
numbers, as provided by the
teacher.
No use of multiple representations
using the technology.
Social utilisation scheme:
Whilst JK developed this lesson in close
collaboration with
TP, who taught a similar lesson
[STP1]. The lessons
had very different utilisation schemes.
JK provided a structured
worksheet for the
students that contained a variety
of questions that did not appear to
follow any
conceptual progression.
Table 4-7 The summary data for Judith’s activity ‘Prime factorisation’ [SJK1].
The complete summaries for all of the activities submitted during Phase One is
provided in Appendix 4. A more thorough explanation of the presentation of this
data and its implications for the subsequent data analysis process is provided within
Chapter 5.
At the outset it was anticipated that this initial data analysis would enable the
selection of a subset of activities that were judged to have involved the MRT in
some way. However, a first examination of the data resulted in only nine of the

How does a multi-representational mathematical ICT tool mediate teachers‟ mathematical and
pedagogical knowledge concerning variance and invariance?
Chapter 4 The research methodology
91
sixty three reported lessons utilising the technology in this way, which led me to
decide that the complexities of the instrumentation process on the part of the
teachers made this an unrealistic expectation in this first phase of the research. For
example, one activity was submitted [STP1] that used the calculator application to
explore the output of the built-in command ‘factor(n)’ for different integer inputs.
The underlying purpose to this activity was that the students would be encouraged
to vary the inputs with the intention that they look for variance and invariance in
the outputs, an activity that did not involve other mathematical representations
other than the syntactical and numerical. However, it was a valid activity within the
domain of the project as a ‘first activity’ for both teachers and learners within the
project. For this reason I decided that it was not essential for activities to involve
multiple representations as it would have excluded a number of activities that
provided strong evidence of teachers’ conceptions of variance and invariance within
the multi-representational environment. In addition, the complexity of the selected
technology meant that there was a range of applications available to the teachers.
Hence it was predictable that the initial activities would focus on single applications
whilst both the teachers (and their learners) were engaged in the instrumentation
phase with the new technology.
The Nvivo8 data coding process required a close scrutiny of the teachers’ written
evaluations for the submitted activities. This led to the development of a section of
the teachers’ activity evaluation form (Questionnaire 2) around the draft curriculum
statements concerning the mathematical Key Processes (Qualifications and
Curriculum Authority, 2007), which are shown in Table 4-8. Each process has been
coded to ease its identification purposes.
Code Key process (KP)
Repre
senting
KPR1 identify the mathematical aspects of the situation or problem
KPR2 choose between representations
KPR3 simplify the situation or problem in order to represent it mathematically
using appropriate variables, symbols, diagrams and models
KPR4 select mathematical information, methods and tools for use
Analy
sin
g
KPA1 make connections within mathematics
KPA2 use knowledge of related problems
KPA3 visualise and work with dynamic images
KPA4 look for and examine patterns and classify
KPA5 make and begin to justify conjectures and generalisations, considering
special cases and counter examples
KPA6 explore the effects of varying values and look for invariance
KPA7 take account of feedback and learn from mistakes
KPA8 work logically towards results and solutions, recognising the impact of constraints and assumptions

How does a multi-representational mathematical ICT tool mediate teachers‟ mathematical and
pedagogical knowledge concerning variance and invariance?
Chapter 4 The research methodology
92
Code Key process (KP)
KPA9 appreciate that there are a number of different techniques that can be used
to analyse a situation
A10 reason inductively and deduce
Use a
ppro
priate
math
em
atical
pro
cedure
s
KPMP1 make accurate mathematical diagrams, graphs and constructions on paper and on screen
KPMP2 calculate accurately, using a calculator when appropriate
KPMP3 manipulate numbers, algebraic expressions and equations and apply routine algorithms
KPMP4 use accurate notation, including correct syntax when using ICT
KPMP5 record methods, solutions and conclusions
KPMP6 estimate, approximate and check working
Inte
rpre
ting a
nd e
valu
ating KPIE1 form convincing arguments based on findings and make general statements
KPIE2 consider the assumptions made and the appropriateness and accuracy of
results and conclusions
KPIE3 be aware of strength of empirical evidence and appreciate the difference
between evidence and proof
KPIE4 look at data to find patterns and exceptions
KPIE5 relate findings to the original context, identifying whether they support or
refute conjectures
KPIE6 engage with someone else's mathematical reasoning in the context of a
problem or particular situation
KPIE7 consider whether alternative strategies may have helped or been better
Com
munic
ating a
nd
reflecting
KPCR1 communicate findings in a range of forms
KPCR2 engage in mathematical discussion of results
KPCR3 consider the elegance and efficiency of alternative solutions
KPCR4 look for equivalence in relation to both the different approaches to the problem and different problems with similar structures
KPCR5 make connections between the current situation and outcomes, and ones they have met before
Table 4-8 Key processes involved in learning mathematics as specified in the
English and Welsh National Curriculum. The shaded processes indicate those of
predominant interest to the study.
Whilst all of these key processes have a role in mediating the mathematical
activities of the teacher and students, some of these processes resonate more
strongly with mathematical activity within the context of engagement with a MRT.
What follows is the justification for the key processes that have been shaded within
Table 4-8 as they are of predominant interest to the study.
Within a multi-representational environment, the key process of representing
mathematics is of fundamental importance. For example, within work on arithmetic
sequences, the sequence can be represented as a list in a spreadsheet, be plotted
as coordinate pairs or generated using the built in command ‘Seq’. Depending on
this choice of representation, the resulting mathematical opportunities for both the
teacher and learners would differ. Within the context of the research study, the

How does a multi-representational mathematical ICT tool mediate teachers‟ mathematical and
pedagogical knowledge concerning variance and invariance?
Chapter 4 The research methodology
93
teachers would make the initial decisions regarding the design of the activity and,
based on this design or intention, the students would have the opportunity to
interact with the activity within the multi-representational environment in a number
of ways. In order to engage with the mathematical scenario, the student would
need to be able to identify the mathematics of the problem, albeit by focussing in
on the important or relevant representation. Within a multi-representational
environment, this initial engagement is crucial to the student being able to engage
with the mathematics in the way that the teacher intended. The extent to which the
students would engage in Key Processes KPR2, KPR3 and KPR4 would be highly
dependent on the teachers’ plan for the progression of the activity and the amount
of autonomy they gave to their students. For example, although an activity might
use multiple representations in its design, if the teacher had not provided the
students with the opportunity to make choices, then it would not be possible to
conclude that the students had engaged in such decision making. However, from
the research perspective, this would provide some rich topics for discussion with
the teachers as they began to engage in the terminology and vocabulary of the
draft curriculum document and make sense of it in relation to their own students’
mathematical experiences.
The process of initially engaging in a mathematical activity through KPR1 is closely
linked with that of analysing the mathematical context or situation provided by the
teacher within the multi-representational environment. Depending on the nature of
the activity and the accompanying guidance or instructions provided by the teacher,
the students would then respond to the activity in a way that could involve all of
the processes of analysis as listed in Table 4-8.
The teachers’ individual activity designs evidenced their expectations with respect
to their students’ interactions with the MRT, with respect to the extent to which
students would engage in the key processes. For example, if the teacher had
designed or selected an activity, which required the students to manipulate and
investigate a dynamic image with a view to identifying patterns, both KPA3
(visualise and work with dynamic images) and KPA4 (look for and examine patterns
and classify) would be inherent in the students’ response to the activity. The wider
research literature resoundingly concludes that technology has a fundamental role
in facilitating KPA7 (take account of feedback and learn from mistakes) and this
study was particularly concerned with how the MRT mediates this from the
teachers’ perspective, both in designing activities and making sense of their
students’ responses to activities. On a personal note, I am uneasy with the phrase
‘learn from mistakes’, which holds a negative connotation with respect to the
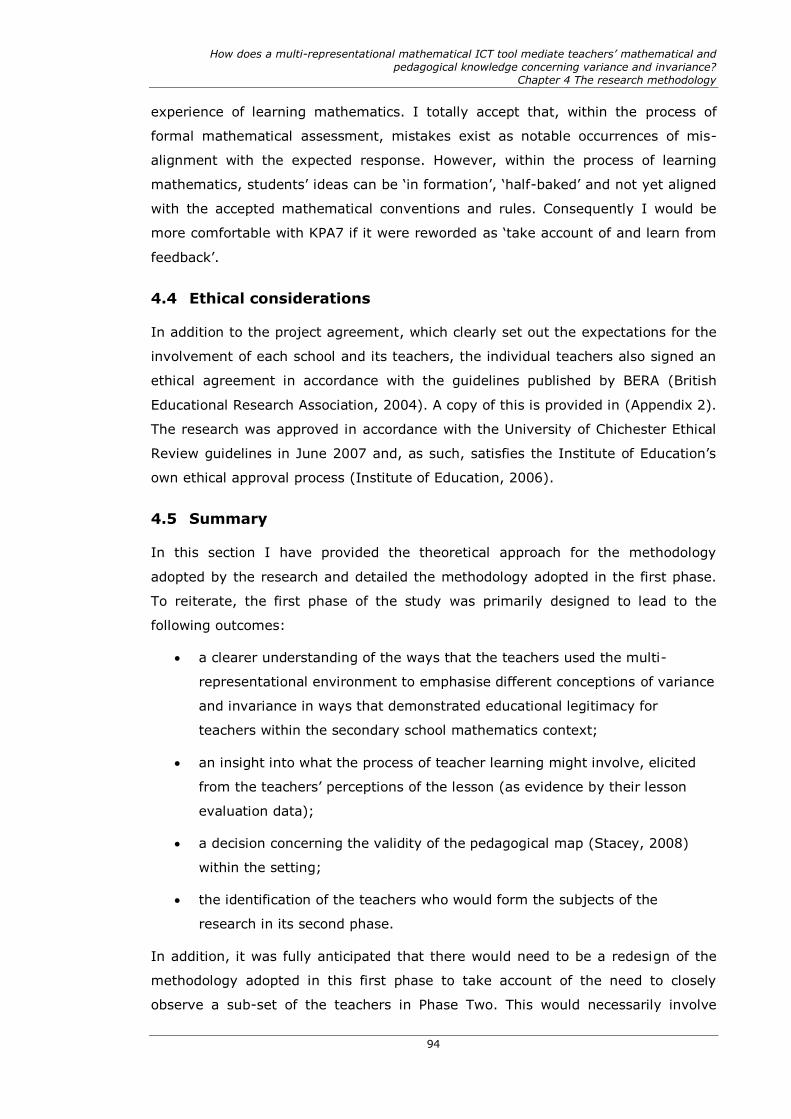
How does a multi-representational mathematical ICT tool mediate teachers‟ mathematical and
pedagogical knowledge concerning variance and invariance?
Chapter 4 The research methodology
94
experience of learning mathematics. I totally accept that, within the process of
formal mathematical assessment, mistakes exist as notable occurrences of mis-
alignment with the expected response. However, within the process of learning
mathematics, students’ ideas can be ‘in formation’, ‘half-baked’ and not yet aligned
with the accepted mathematical conventions and rules. Consequently I would be
more comfortable with KPA7 if it were reworded as ‘take account of and learn from
feedback’.
4.4 Ethical considerations
In addition to the project agreement, which clearly set out the expectations for the
involvement of each school and its teachers, the individual teachers also signed an
ethical agreement in accordance with the guidelines published by BERA (British
Educational Research Association, 2004). A copy of this is provided in (Appendix 2).
The research was approved in accordance with the University of Chichester Ethical
Review guidelines in June 2007 and, as such, satisfies the Institute of Education’s
own ethical approval process (Institute of Education, 2006).
4.5 Summary
In this section I have provided the theoretical approach for the methodology
adopted by the research and detailed the methodology adopted in the first phase.
To reiterate, the first phase of the study was primarily designed to lead to the
following outcomes:
a clearer understanding of the ways that the teachers used the multi-
representational environment to emphasise different conceptions of variance
and invariance in ways that demonstrated educational legitimacy for
teachers within the secondary school mathematics context;
an insight into what the process of teacher learning might involve, elicited
from the teachers’ perceptions of the lesson (as evidence by their lesson
evaluation data);
a decision concerning the validity of the pedagogical map (Stacey, 2008)
within the setting;
the identification of the teachers who would form the subjects of the
research in its second phase.
In addition, it was fully anticipated that there would need to be a redesign of the
methodology adopted in this first phase to take account of the need to closely
observe a sub-set of the teachers in Phase Two. This would necessarily involve

How does a multi-representational mathematical ICT tool mediate teachers‟ mathematical and
pedagogical knowledge concerning variance and invariance?
Chapter 4 The research methodology
95
classroom observations and individual interviews. The way in which the Phase Two
methodology was developed and the justifications for the decisions taken are
included in Chapter 5 which follows.

How does a multi-representational mathematical tool mediate teachers‟ mathematical and pedagogical
knowledge about variance and invariance?
Chapter 5 Outcomes of Phase One and the design and methodology of Phase Two
96
5 OUTCOMES OF PHASE ONE AND THE DESIGN AND METHODOLOGY OF
PHASE TWO.
5.1 Introduction
This chapter provides a brief analysis of the first phase of the research, its main
outcomes and how these informed: a deeper understanding of teachers’
conceptions of variance and invariance; a greater insight into process of associated
teacher learning; the establishment of the validity of the pedagogical map (Stacey,
2008) within the setting; and the identification of the teachers who would form the
subjects of the research in its second phase. The chapter concludes by describing
how it was envisaged that the data analysis process during the second phase would
enable the research questions to be more fully addressed.
5.2 Description of Phase One of the research
During the first phase of the study the teachers developed and evaluated their
classroom uses of the MRT with learners aged 11-16 years. This was carried out
with support from the wider project community and the teachers were encouraged
to exchange emerging activities and approaches. As described previously it was
anticipated that the data provided by the teachers would give a clearer
understanding of the activities that had educational legitimacy within the classroom
setting and contain examples in which the teachers privileged explorations of
variance and invariance within the multi-representational environment. The insight
gained from the analysis of the selected lessons would also support the
development of a broader understanding of the teachers’ interpretations of variance
and invariance. The data analysis process provided an important opportunity to
describe some of the emergent instrument utilisation schemes, which would be
probed further during the second phase.
In addition, I trialled the use of the pedagogical map as a means to illuminate
aspects of the teachers’ uses of the MRT in the classroom context. I was very aware
that in order to be able to achieve the aims of the research and articulate a deeper
understanding of the nature of the object within the revised triad of instrumented
activity (Figure 3-2) I would be required to develop some intermediary tools and
techniques.
As I began the data analysis process, whilst the evidence began to emerge
concerning the teachers’ perceptions of mathematical variance and invariance,

How does a multi-representational mathematical tool mediate teachers‟ mathematical and pedagogical
knowledge about variance and invariance?
Chapter 5 Outcomes of Phase One and the design and methodology of Phase Two
97
another obvious trend in the data also became apparent. Within their lesson
evaluations, reflective writings and conversations the teachers made noticeable
comments about their own learning. They were describing much broader
observations, incidents and reflections that had come about through their uses of
the technology in the classroom. In my role as a teacher educator, I had a moment
of realisation as I hypothesised that it was most likely that these instances would
influence the conceptions that the teachers were evolving concerning the role of the
technology within their secondary mathematics classrooms. Consequently, I began
to consider how it might be possible to research this element of teachers’ learning
more closely during the second phase of the study.
5.3 Analysis of the Phase One data
During the first phase of the research the fifteen teachers reported sixty-six
activities, all of which had been used in the classroom to support students’
mathematical learning, mostly within single one hour lessons. A very small number
of the reported activities spanned more than one lesson. Also, as many of the
teachers planned the lessons together, the same lesson activities sometimes
occurred more than once. Some teachers worked as a ‘school pair’ to evaluate the
classroom activities and, particularly in the early stages in the project, the wider
project team supported this process. They did this through a deeper questioning of
teachers’ initial responses to Questionnaire 2 (Table 4-2) and by asking the
teachers to substantiate their claims by providing tangible evidence, particularly in
relation to how the students were engaging with the technology during the
activities. The data for each lesson was imported into Nvivo8 software and initially,
the National Curriculum mathematical processes identified to be most relevant to
the study (Table 4-8) were used to highlight the evidence concerning each of these
key processes, an example of which is shown in Figure 5-1.
Figure 5-1 An example of an evidence source for Key Process A06, ‘Explore the
effects of varying values and look for invariance’ taken from Eleanor’s activity
‘Perpendicular functions’ [CEL5]
Taking this particular code as an example, in some cases it was very easy to
identify the teacher’s intention to focus the activity towards an exploration of

How does a multi-representational mathematical tool mediate teachers‟ mathematical and pedagogical
knowledge about variance and invariance?
Chapter 5 Outcomes of Phase One and the design and methodology of Phase Two
98
variance and invariance as, in devising the activity, the teacher had explicitly stated
that this was one of the lesson objectives. For example, Judith wrote about a lesson
that had focused on ‘straight line graphs’, stating,
I wanted the students to know about the straight line graph, y=mx+c -
what effect changing the „m‟ has on the straight line , keeping „c‟
constant and what effect changing the „c‟ has on the straight line,
keeping the „m‟ constant. Trying to get from them what the „m‟ is and
what the „c‟ is. [SJK4(Quest2)]
In other activities, although the teachers described the mathematical content of the
lesson, they were less explicit about how the learners would use the technology to
engage with the mathematics. Consequently, the teacher’s interpretation of
variance and invariance was gleaned from the implied instrument utilisation
schemes as evidenced by the lesson data they had submitted to the research
project.
For example, in her lesson ‘circle theorems’ [GBA5], Amie stated her lesson
objectives thus:
I wanted them to discover two circle theorems – “opposite angles in a
cyclic quadrilateral make 180” and “angles in the same segment are
equal”. [GBA5(Quest2)]
Whereas in her description of her students’ main activity she wrote,
I got the students to construct a cyclic quadrilateral in a geometry page.
I used a spilt page layout to enable them to have a calculator in the
other half of the page. I got them to measure each of the angles within
the cyclic quadrilateral and store them as variables. This enabled them
to move the quadrilateral and/or the circle around and see what
happened to the angles. I asked them to calculate various sums each
time they had adjusted the diagram and then note down what they
noticed. [GBA5(Quest2)]
Another complexity within this aspect of the data analysis was that, although
Questionnaires 2 and 4 (Table 4-2 and Table 4-4) had been constructed to support
the teachers to report on whether their designed activities provided their students
with opportunities to explore variance and invariance, there were only a few
teachers who responded consistently to this question. This did not mean that such
opportunities had not existed within the reported activities, but it merely signified
that the teachers had not decided to comment on that aspect specifically within

How does a multi-representational mathematical tool mediate teachers‟ mathematical and pedagogical
knowledge about variance and invariance?
Chapter 5 Outcomes of Phase One and the design and methodology of Phase Two
99
their written evaluations. Consequently, the evidence was extracted more often
from the instrument utilisation scheme for the activity rather than the teacher’s
explicit comments within their written or oral reflections.
It was appreciated that, within the context of any single activity or approach there
would be a number of instrument utilisation schemes in use. These might include:
the teacher’s intended instrument utilisation scheme for the students’
participating in the activity;
the teacher’s actual instrument utilisation scheme as evident from the
introductory or demonstration phase of the activity;
the students’ many individual instrument utilisation schemes adopted in
response to the activity.
As the latter two instrument utilisation schemes could only be elicited through
systematic classroom observation, possibly supported by the automated recording
of real-time actions, it was not possible to comment on these from the data
collected during Phase One. Consequently, the instrument utilisation schemes that
were elicited are implied from the teachers’ descriptions of the mathematical
activities and approaches as evidenced by the data they submitted to the study.
They represented my objective interpretations of the teachers’ intentions. As part of
the data validation process, and in keeping with the ethical agreement, the
teachers were invited to amend these descriptions and, where the teachers
responded, their suggested changes have been incorporated.
For each of the activities and approaches submitted by the teachers during the first
phase, a summary text was written which included:
the lesson code and title and a brief description;
relevant screenshots from the MRT;
extracts from the data that evidenced aspects of the teacher’s learning;
a commentary on the inherent interpretation of variance and invariance;
the implied instrument utilisation scheme.
The complete data set for the Phase One activities and approaches is provided in
Appendix 4 and examples of the summary text relating to two activities submitted
by Sam and Amie are shown in Table 5-1 and Table 5-2 which follow.

How does a multi-representational mathematical tool mediate teachers‟ mathematical and pedagogical
knowledge about variance and invariance?
Chapter 5 Outcomes of Phase One and the design and methodology of Phase Two
100
Lesson code, title and activity
description
Relevant screenshots and implied evidence of
teacher learning
Interpretation of variance and
invariance
Implied
Instrument Utilisation
Scheme
LSM4
Trial and
Improvement
Students created a
new file and used the Calculator
application to define
a given quadratic function using
function notation.
They then evaluated the
function by substituting
different values of x
to try to find the solutions of the
equation. Students then used a
Spreadsheet page
to automate the process. They then
added a Graph and
geometry page to construct a scatter
plot of the values of x and f(x). Students
recorded their
observations in their exercise
books.
When students started to look for values to fill into
their tables, it would have
been better to tell them to use f(x) notation. In fact it
was left open to students to find a method, but the f(x)
idea was explained to a few
and spread, which was inefficient. It could be that
not suggesting anything would have led to
interesting discussion about
the efficiency of different methods, but in this case it
would be important for the
teacher to avoid giving any method.
It was difficult to explain how to set up the
spreadsheet in the middle of
the lesson. Student data collection is
vital – the table in the book ensured students could
reflect on their values.
Very clear activity instructions are vital for the
smooth running of the lesson.
[LSM4((Quest2)]
Variance = the
change in the evaluated y-values
for different inputted
x-values for a defined function.
This was also shown in a tabulated form
and graphical form.
Invariance = that
the x-value for the
particular case where the y-value
equalled zero – is called the ‘solution’.
This was observable
as the point of intersection between
the function and the x-axis within the
graphing
representation.
IUS5: Vary a
numeric or syntactic input and
use the
instrument‟s functionality to
observe the resulting output in
numeric, syntactic,
tabular or graphical form. Use another
representational
form to add insight to or justify/prove
any invariant properties.
Table 5-1 The data analysis summary for Sam’s activity ‘Trial and improvement’
[LSM4].

How does a multi-representational mathematical tool mediate teachers‟ mathematical and pedagogical
knowledge about variance and invariance?
Chapter 5 Outcomes of Phase One and the design and methodology of Phase Two
101
Lesson code, title and activity
description
Relevant screenshots and implied evidence of
teacher learning
Interpretation of variance and
invariance
Implied
Instrument Utilisation
Scheme
GBA5
Circles theorems
Students created a
new .tns file and inserted a split page
with a Graphs and Geometry (analytic
window) alongside
a Calculator page. They constructed a
circle and an
inscribed quadrilateral,
measuring the four interior angles and
saving the
measurements explicitly as
variables. They used the calculator
page to check angle
sums using the variable notation
and made
generalisations relating to their
explorations.
(In the subsequent
lesson they explored the angle
properties of a quadrilateral with
three vertices on
the circle’s circumference and
the fourth vertex
positioned at the centre of the circle.)
[GBA5 (tns-S2)]
[GBA5 (tns-S3)]
Getting the pupils to
construct the situation and play about with it
themselves is definitely a
valuable activity that I would use again.
[GBA5((Quest2)]
I feel that my teaching of
this topic has been enhanced by this activity.
Although it could have been
done on a geometry program in a computer
room, the use of the TI-Nspire was less disruptive
and as this class have used
them before it was easier for them to access.
I feel that the pupils will
remember these circle theorems as they have had
a practical lesson to discover them rather than
being shown or told them
and then simply applying them. [GBA5(Quest2)]
Having discovered one circle
theorem in the previous
lesson they now seemed more confident in making
generalisations about the
angles that they had measured and any
connections they were noticing. They were again
able to move things around
and see what happened to the angles. [GBA5(Quest2)]
Variance = the size
of the circle, the position of the
vertices of the
quadrilateral or ‘bow’ shape.
Invariance =
opposite angles of a
cyclic quadrilateral sum to 180°; angles
subtended on the
same arc are equal.
IUS9: Construct a
graphical or geometric scenario
and then vary the
position of a geometric object by
dragging to observe the
resulting changes.
Save measurements as
variables and test
conjectures using a syntactic form.
Table 5-2 The data analysis summary for Amie’s activity ‘Trial and improvement’
[GBA5]

How does a multi-representational mathematical tool mediate teachers‟ mathematical and pedagogical
knowledge about variance and invariance?
Chapter 5 Outcomes of Phase One and the design and methodology of Phase Two
102
Whilst coding the data for the selected key processes (Table 4-8), I also coded the
data using a second set of thick codes: ‘activity aims’ and ‘instrument utilisation
scheme’. This was because I had begun to notice the more implicit evidence in
these two areas that appeared to substantiate some evolution of teachers’ practices
coinciding with the project timeline. For example, over time the lesson aims
appeared to be becoming more thoughtful, particularly around supporting the
students’ instrumentation phase, as did aspects of the teachers’ implied instrument
utilisation schemes with respect to exploring variance and invariance. A full analysis
of the data concerning teachers’ interpretations of variance and invariance (as
evidenced by the activity design and implied instrument utilisation schemes) and
the implications of this for the design of Phase Two of the study are presented later
in the chapter in Section 5.3.1.
Finally, as I continued to scrutinise the data, a third thick coding category emerged,
which I called ‘teacher learning’. The data analysis process then took on a more
grounded approach. A fuller description of this data category; its subsequent sub-
analysis; and implications for the Phase Two methodology are provided in Section
5.3.2.
5.3.1 Designing activities that focus on variance and invariance –
teachers’ emergent practices
The initial lesson coding revealed that, of the sixty-six activities reported to the
study, eight activities provided insufficient data to ascertain precisely how the
students were expected to engage with the mathematics using the technology
during the activity, or were judged not to have given students sufficient opportunity
to explore variance and invariance during the lessons. For those with insufficient
data, often the teachers had described the lesson aims and some of the outcomes
but they did not actually report in enough detail the progression in mathematical
activity in which they expected their students to engage, nor the way in which the
technology was to be used (by themselves or their students). Consequently, the
following activities were rejected from the Phase One data analysis process:
[LMF6], [HAH2], [HAH5], [HRG1], [HRG3], [BAK2], [BJJ7] and [BAK10/BJJ10]
The detailed descriptions of the interpretation of variance and invariance from each
of the selected activities (as exemplified by Table 5-1), and the subsequent analysis
of these descriptions led to the nine implied instrument utilisation schemes that
follow. The schemes are described with respect to the mathematical representation
of the ‘input’, which were classified as being ‘numeric’, ‘syntactic’ or ‘geometric’.

How does a multi-representational mathematical tool mediate teachers‟ mathematical and pedagogical
knowledge about variance and invariance?
Chapter 5 Outcomes of Phase One and the design and methodology of Phase Two
103
A numeric input might involve entering numeric values into a spreadsheet or
changing an input for a numeric variable, for example the value of the fraction in
[STP2] (see Appendix 6).
A syntactic input is considered to encompass both the syntactic forms of
conventional mathematical notation in addition to the syntax required when using
specific functionalities of the MRT. For example, the need to use function notation
when generating a graph or to use the specific syntax of the built-in ‘Factor’
command. In this respect the word syntactic is not being interpreted in a wholly
linguistic sense but it does embrace Shulman’s sense of ‘syntactic structures’
(Shulman, 1986).
The classification of geometric inputs initially encompassed the ‘positional’ aspects
of objects defined within both two-dimensional geometric representations and those
with an underlying representational construct such as a Cartesian coordinate
system. This was because these were both accessed from the same TI-Nspire
application ‘Graphs and geometry’. As I began to classify the nature of the ‘outputs’
representational system I initially used the same three categories. However, it
quickly became apparent that the analysis became more informative if some sub-
divisions of the initial three categories were made. Hence the ‘numeric’ category
was sub-divided into ‘measured’, ‘calculated’ and ‘tabulated’ and the ‘geometric’
category was subdivided into ‘graphical (data points)’, graphical (function graphs)
and geometric (positional).
The resulting scheme map in Figure 5-2 is used throughout the study to illuminate
the flow of the representational input(s) and outputs of the mathematical objects
under scrutiny in a diagrammatic form.
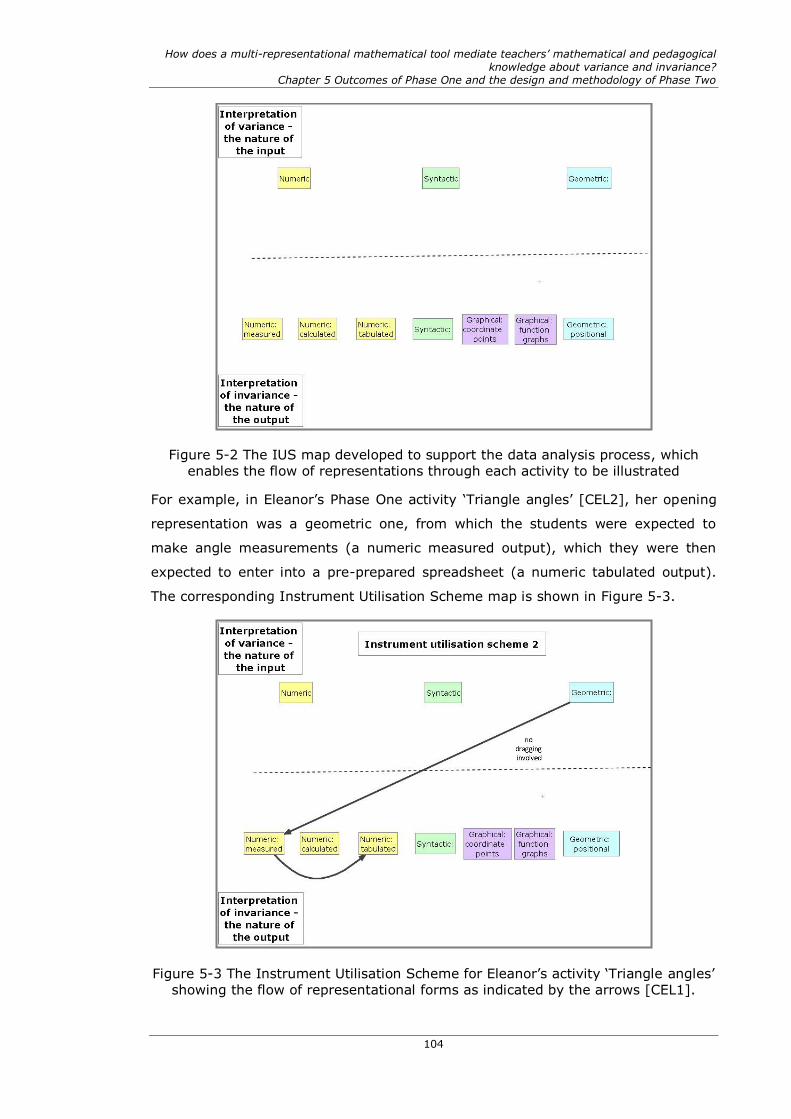
How does a multi-representational mathematical tool mediate teachers‟ mathematical and pedagogical
knowledge about variance and invariance?
Chapter 5 Outcomes of Phase One and the design and methodology of Phase Two
104
Figure 5-2 The IUS map developed to support the data analysis process, which
enables the flow of representations through each activity to be illustrated
For example, in Eleanor’s Phase One activity ‘Triangle angles’ [CEL2], her opening
representation was a geometric one, from which the students were expected to
make angle measurements (a numeric measured output), which they were then
expected to enter into a pre-prepared spreadsheet (a numeric tabulated output).
The corresponding Instrument Utilisation Scheme map is shown in Figure 5-3.
Figure 5-3 The Instrument Utilisation Scheme for Eleanor’s activity ‘Triangle angles’
showing the flow of representational forms as indicated by the arrows [CEL1].

How does a multi-representational mathematical tool mediate teachers‟ mathematical and pedagogical
knowledge about variance and invariance?
Chapter 5 Outcomes of Phase One and the design and methodology of Phase Two
105
For each scheme that follows, an example from the Phase One research data is
provided along with the activity codes for the other activities classified as being of
the same type.
IUS1: Vary a numeric or syntactic input and use the instrument‟s functionality to
observe the resulting output in numeric, syntactic, tabular or graphical form.
Figure 5-4 Instrument Utilisation Scheme 1 shown diagrammatically using the IUS map showing the flow of representational forms as indicated by the arrows.
Example: SJK4 – Students manually entered a function into the entry line of the
Graphing application in the form ‘mx +c’ with the aim of observing the invariant
properties.
Figure 5-5 Exemplification of IUS1 from the activity [SJK4]
Other similar activities were: BAK1/BJJ1 BAK3/BJJ3 BAK5/BJJ5 CHS1 CHS3 GBA1
GBA2 GRE1 GRE2 HAH1 HAH3 HAH4 HRG2 LSM1 LSM2/LMF1 LSM3 LMF2 LMF3
LMF4 PCT1 PSH1 STP1 SJK1 SJK3 SJK5

How does a multi-representational mathematical tool mediate teachers‟ mathematical and pedagogical
knowledge about variance and invariance?
Chapter 5 Outcomes of Phase One and the design and methodology of Phase Two
106
IUS2: From a given set of static geometric objects, make measurements and
tabulate data to explore variance and invariance within the measured data in
numeric and tabular forms.
Figure 5-6 Instrument Utilisation Scheme 2 shown diagrammatically using the IUS map showing the flow of representational forms as indicated by the arrows.
Example: CHS2 - Students measured the interior angles of different triangles and
entered the values into a spreadsheet, which calculated the angle sum.
Figure 5-7 Exemplification of IUS2
[CHS2(tns-T)page1]
Figure 5-8 Exemplification of IUS2
[CHS2(tns-T)page2]
Other similar activities were: CEL1 CEL2 PSH5

How does a multi-representational mathematical tool mediate teachers‟ mathematical and pedagogical
knowledge about variance and invariance?
Chapter 5 Outcomes of Phase One and the design and methodology of Phase Two
107
IUS3: Vary the position of an object (by dragging) that has been constructed in
accordance with a conventional mathematical constraint and observe the resulting
changes. (Use another representational form to add insight to or justify/prove any
invariant properties).
Figure 5-9 Instrument Utilisation Scheme 3 shown diagrammatically using the IUS map showing the flow of representational forms as indicated by the arrows. As not
all activities involved a second output representation, the arrows on the diagram
are shown in grey.
Example: PCT3 – Students dragged a specified point fixed onto the circumference
of a given circle (of variable size) with the aim of observing invariant angle
properties: equality of vertically opposite angles; sum of angles around the centre
point.
Figure 5-10 Exemplification of IUS3 [PCT3]
Other similar activities were: BAK4/BJJ4 BAK9/BJJ9 CEL3 CEL4 CHS4 PCT2 PCT3
PSH2 STP3 SJK2

How does a multi-representational mathematical tool mediate teachers‟ mathematical and pedagogical
knowledge about variance and invariance?
Chapter 5 Outcomes of Phase One and the design and methodology of Phase Two
108
IUS4: Vary a numeric input and drag an object within a related mathematical
environment and observe the resulting visual output.
Figure 5-11 Instrument Utilisation Scheme 4 shown diagrammatically using the IUS
map showing the flow of representational forms as indicated by the arrows.
Example: STP2 – Students input the numeric values of the numerators and
denominators for two different fractions and the value of a common denominator
and observed the resulting fraction pictures. Students then dragged a point on a
line segment (from left to right) to simulate adding one fraction to the other and
observed the resulting fraction picture.
Figure 5-12 Exemplification of IUS4 [STP2]
Other similar activities were: STP5

How does a multi-representational mathematical tool mediate teachers‟ mathematical and pedagogical
knowledge about variance and invariance?
Chapter 5 Outcomes of Phase One and the design and methodology of Phase Two
109
IUS5: Vary a numeric or syntactic input and use the instrument‟s functionality to
observe the resulting output in numeric, syntactic, tabular or graphical form. Use
another representational form to add insight/justify/prove any invariant properties.
Figure 5-13 Instrument Utilisation Scheme 5 shown diagrammatically using the IUS map showing the flow of representational forms as indicated by the arrows.
PCT4 – Students defined a given linear and a given quadratic function and used the
instrument’s functionality to graph these and find the point(s) of intersection.
Students then substituted the solutions using function notation within the Calculator
application to ascertain their significance.
Figure 5-14 Exemplification of IUS5 [PCT4]
Other similar activities were: BAK6/BJJ6 GBA3/GAS1 GRE3 LSM4 PSH4

How does a multi-representational mathematical tool mediate teachers‟ mathematical and pedagogical
knowledge about variance and invariance?
Chapter 5 Outcomes of Phase One and the design and methodology of Phase Two
110
IUS6: Vary the position of an object that has previously been defined syntactically
(by dragging) to satisfy a specified mathematical condition.
Figure 5-15 Instrument Utilisation Scheme 6 shown diagrammatically using the IUS
map showing the flow of representational forms as indicated by the arrows.
PSH3 – Students entered two linear functions and measured the angle between
them. They then dragged the second function such that it was perpendicular to the
first and observed the resulting gradient properties.
Figure 5-16 Exemplification of IUS6 [PSH3]
No other activities used this IUS.

How does a multi-representational mathematical tool mediate teachers‟ mathematical and pedagogical
knowledge about variance and invariance?
Chapter 5 Outcomes of Phase One and the design and methodology of Phase Two
111
IUS7: Construct a graphical and geometric scenario and then vary the position of
geometric objects by dragging to satisfy a specified mathematical condition. Input
syntactically to observe invariant properties.
Figure 5-17 Instrument Utilisation Scheme 7 shown diagrammatically using the IUS
map showing the flow of representational forms as indicated by the arrows.
CEL5 – Students defined a linear function in the Graphs application using f(x)
syntax. They then constructed a geometric line that appeared to be perpendicular,
measured the angle between the two lines and dragged the geometric line such
that the measurement was close to 90°. Students then defined families of functions
that appeared to be parallel to the geometric line and observed patterns in the
resulting gradients.
Figure 5-18 Exemplification of IUS7 [CEL5]
No other activities used this IUS.

How does a multi-representational mathematical tool mediate teachers‟ mathematical and pedagogical
knowledge about variance and invariance?
Chapter 5 Outcomes of Phase One and the design and methodology of Phase Two
112
IUS8: (Construct a geometric scenario and then) vary the position of objects (by
dragging) and automatically capture measured data. Use the numeric, syntactic,
graphical and tabular forms to explore, justify (and prove) invariant properties.
Figure 5-19 Instrument Utilisation Scheme 8 shown diagrammatically using the IUS map showing the flow of representational forms as indicated by the arrows.
LMF5 – Students constructed a circle and its diameter. They measured the lengths
of the radius, diameter, circumference and area and used the data capture
functionality to calculator application to calculate the ratio for different
instantaneous values.
Figure 5-20 Exemplification of IUS8 [LMF5]
Other similar activities were: BAK8

How does a multi-representational mathematical tool mediate teachers‟ mathematical and pedagogical
knowledge about variance and invariance?
Chapter 5 Outcomes of Phase One and the design and methodology of Phase Two
113
IUS9: (Construct a graphical or geometric scenario and then) vary the position of a
geometric object by dragging to observe the resulting changes. Save
measurements as variables and test conjectures using a syntactic form.
Figure 5-21 Instrument Utilisation Scheme 9 shown diagrammatically using the IUS
map showing the flow of representational forms as indicated by the arrows.
Example: GBA5 - Students created a new .tns file and inserted a split page with a
Graphs and Geometry page alongside a Calculator page. They constructed a circle
and an inscribed quadrilateral, measuring the four interior angles and saved the
measurements as variables. They used the calculator page to check angle sums
using the syntactic notation and made generalisations relating to their explorations.
Figure 5-22 Exemplification of IUS9 [GBA5]
Other similar activities were: GBA4/GAS2

How does a multi-representational mathematical tool mediate teachers‟ mathematical and pedagogical
knowledge about variance and invariance?
Chapter 5 Outcomes of Phase One and the design and methodology of Phase Two
114
This analysis of the activities led to some very clear patterns in the data.
The propensity for teachers, particularly in the early stage of the project, to
use activities of type IUS1 was very high, with just under half of the
reported lessons during this first phase adopting this approach. This implied
strongly that, in the early stages of adoption of a complex new educational
technology, the teachers’ instincts were to familiarise themselves with its
inherent functionality within one representational domain and then develop
uses for identified elements of this functionality within the classroom setting.
Some teachers did not develop instrument utilisation schemes outside of
IUS1 for the duration of the project, although they expanded the range of
applications and functionalities used.
In some activities, following an initial approach of type IUS1, the output
data was then used within another application to include another
mathematical representation. This was defined as a new instrument
utilisation scheme, IUS5.
There were a few teachers who not only used a diverse range of instrument
utilisation schemes during the project but actively sought to design activities
and approaches that combined aspects of the tools functionalities in new and
interesting ways.
The instrument utilisation schemes are presented in an order that intimates a sense
of progression alongside the project timescale, but these cannot be interpreted in a
linear way. A metaphor to help make sense of the way in which the instrument
utilisation schemes evolved during the first phase of the project is one that relates
to seed dispersal and germination. All except two of the teachers were present at
all of the face to face meetings when activities and approaches were shared within
the project group1. In that sense the seeds of the ideas could be considered to have
been widely dispersed amongst the group. However, the rate at which these ideas
were carried forward by the teachers varied. If the seed was successfully
germinated, the idea or approach appeared in a later lesson evaluation from the
teacher. The Phase One data analysis seems to support a hypothesis that for most
teachers, the propensity of their later instrument utilisation schemes involving a
diversification of earlier schemes was a function of time. If this was the case, it
would strongly indicate that the timescale of Phase One was insufficient for the
majority of the teachers to develop a wider repertoire of instrument utilisation
1 A change in teaching staff at Greenmount School led to Becky replaced Robert in January
2008.
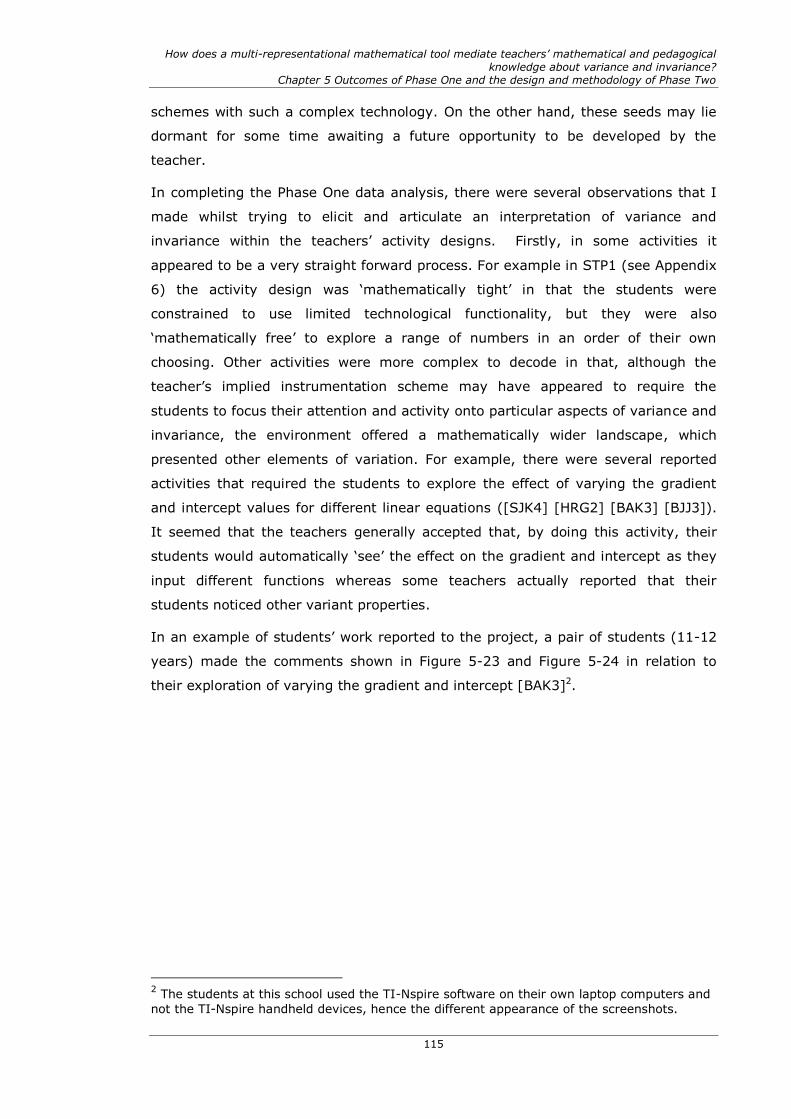
How does a multi-representational mathematical tool mediate teachers‟ mathematical and pedagogical
knowledge about variance and invariance?
Chapter 5 Outcomes of Phase One and the design and methodology of Phase Two
115
schemes with such a complex technology. On the other hand, these seeds may lie
dormant for some time awaiting a future opportunity to be developed by the
teacher.
In completing the Phase One data analysis, there were several observations that I
made whilst trying to elicit and articulate an interpretation of variance and
invariance within the teachers’ activity designs. Firstly, in some activities it
appeared to be a very straight forward process. For example in STP1 (see Appendix
6) the activity design was ‘mathematically tight’ in that the students were
constrained to use limited technological functionality, but they were also
‘mathematically free’ to explore a range of numbers in an order of their own
choosing. Other activities were more complex to decode in that, although the
teacher’s implied instrumentation scheme may have appeared to require the
students to focus their attention and activity onto particular aspects of variance and
invariance, the environment offered a mathematically wider landscape, which
presented other elements of variation. For example, there were several reported
activities that required the students to explore the effect of varying the gradient
and intercept values for different linear equations ([SJK4] [HRG2] [BAK3] [BJJ3]).
It seemed that the teachers generally accepted that, by doing this activity, their
students would automatically ‘see’ the effect on the gradient and intercept as they
input different functions whereas some teachers actually reported that their
students noticed other variant properties.
In an example of students’ work reported to the project, a pair of students (11-12
years) made the comments shown in Figure 5-23 and Figure 5-24 in relation to
their exploration of varying the gradient and intercept [BAK3]2.
2 The students at this school used the TI-Nspire software on their own laptop computers and
not the TI-Nspire handheld devices, hence the different appearance of the screenshots.

How does a multi-representational mathematical tool mediate teachers‟ mathematical and pedagogical
knowledge about variance and invariance?
Chapter 5 Outcomes of Phase One and the design and methodology of Phase Two
116
Figure 5-23 Students’ comments about the gradient and intercept properties of
straight line graphs [BAK3(tns-S)page3]
Figure 5-24 Students’ comments about the gradient and intercept properties of straight line graphs [BAK3(tns-S)page4]
The students’ description of the lines being ‘stretched’ offers a legitimate line of
enquiry concerning their observation of variation. However, without having been
present in the classroom to view whether the students’ response was noticed by the
teacher (or their peers) and if so, the nature of the discourse that ensued, I am

How does a multi-representational mathematical tool mediate teachers‟ mathematical and pedagogical
knowledge about variance and invariance?
Chapter 5 Outcomes of Phase One and the design and methodology of Phase Two
117
unable to comment upon whether the role of technology in this scenario influenced
the teacher’s professional knowledge in any way. The need to research such
situations more closely through systematic classroom observation was becoming
increasingly apparent.
Staying within the context of activities that required students to ‘vary m and c’,
another reported response was for students to notice variation in the lengths of the
resulting lines. This offered another potential route for mathematical enquiry that
could lead to a discussion concerning the meaning of gradient. However this
opportunity did not seem to be construed as a ‘legitimate’ route of enquiry for the
teachers concerned. There was a sense that the students’ observations needed to
comply with the ‘intended learning outcomes’ that the teachers had devised. The
established social utilisation schemes for the use of technology within explorations
of linear function are well-documented and the practice exhibited by the teachers in
this particular context resonates strongly with the archetypal practices reported by
Ruthven and Hennessey (2009).
A second insight that I made in relation to the analysis of the instrument utilisation
schemes concerned the small number of teachers who were devising new
conditions for the instrumentation of the technology. These offered what appeared
to be innovative environments in which students were expected to explore variance
and invariance.
A good instance of such a new approach was the lesson devised by Sophie,
‘Perpendicular lines’ [PSH3] previously included as an exemplification of IUS6 on
page 110. In this activity she wanted her students to establish their own definitions
of the gradient property of perpendicular lines so that they could achieve her
desired lesson outcome, which was ‘To recognize and generate the equations of
lines parallel and perpendicular to given straight line graphs’ [PSH3(Plan)]. In her
description of this activity Sophie reported that she had instructed her students to
use the Graphs and Geometry application and generate the function y=x. She
asked them to investigate finding a perpendicular line to y=x and reported that her
students were quick to respond with y=-x. She challenged with the question ‘how
can you prove to me it’s perpendicular?’ and, on their response that they wanted to
measure the angle between the lines, showed the pupils how to do this. Traditional
graph plotting technologies would not have facilitated the ability to switch from an
algebraic approach to a geometric one. In this example, Sophie was using the
knowledge she had gained about the available functionality of the technology to
permit her students’ request to make an angle measurement to be pursued. Having

How does a multi-representational mathematical tool mediate teachers‟ mathematical and pedagogical
knowledge about variance and invariance?
Chapter 5 Outcomes of Phase One and the design and methodology of Phase Two
118
established the 90° angle measurement (and justified this according to the
symmetry of the situation), Sophie then used a second aspect of the functionality
to ‘encourage pupils to then change f1(x) and f2(x) to avoid having to re-measure.’
Finally, having asked the students to vary f1(x), Sophie showed them how they
could vary f2(x) by dragging to get close to 90° and observe the displayed value of
function f2(x). A static image of this is shown in Figure 5-25.
Figure 5-25 Sophie’s activity design that required students to drag f1(x) and f2(x) such that they appeared perpendicular as a means to generalising about the
gradient property of perpendicular lines.
This brought an empirical aspect to the activity, which in Sophie’s evaluation,
supported more of her students to be able to conjecture the relationship and
express it in their own words. Sophie supported this claim by submitting an
example of one of her student’s written comments, ‘You have to divide 1 by the
amount of x's.’ [PSH3(tns-S)]. This description of Sophie’s activity design alongside
her report of its outcomes provides an insight into the complexities of how she used
her new knowledge about the technology and its functionality. She combined her
desire for her students to construct their own meanings with her sound
understanding of the underlying mathematics to create a new pedagogical
approach, which had been afforded by the technology.
The analysis of the Phase One data had provided a substantial insight into the
teachers’ emergent instrument utilisation schemes concerning explorations of
variance and invariance and it had also highlighted differences in individual
teachers’ responses to their involvement in the project. This influenced my selection
of the teachers that would be involved in the second phase of the study, which is
elaborated upon later in this chapter in Section 5.4.1.
5.3.2 Evidence of teacher learning – developing the research lens
As I became increasingly immersed in the data, I found myself becoming more
aware of the teachers’ responses in which they had expressed surprise or described

How does a multi-representational mathematical tool mediate teachers‟ mathematical and pedagogical
knowledge about variance and invariance?
Chapter 5 Outcomes of Phase One and the design and methodology of Phase Two
119
unexpected outcomes relating to the activities. There was clear evidence that the
evolution in their classroom practices with technology had spanned a wide range of
mathematical content and pedagogical approaches.
In all, there were 268 thickly coded examples of ‘teacher learning’ from 100 data
sources and, using a constant comparison data analysis approach, the individual
examples were grouped into the 34 categories shown in Table 5-3 .
Category of teacher learning as evidenced in Phase One TL - Amendment to students' IUS
TL - Amendment to teacher's introductory IUS
TL - Appreciation of 'fundamental' aspect of mathematics
TL - Appreciation of the need for a tighter focus on generalisation
TL - Balance of construction to exploration within IUS
TL - Better initial examples
TL - 'blend' of ICT and paper-pencil approach
TL - Classroom management issues
TL - Fundamental change to teacher pedagogy
TL - Good 'first' activity
TL - Importance of teacher demonstration re IUS
TL - Need for supporting resources for teachers and pupils
TL - Need for teacher to practise own skills - IUS
TL - Need to discuss machine v real mathematics
TL - New ways of organising classes for mathematical purpose
TL - Pupils enjoyed the activity
TL - Pupils working faster
TL - Software supporting classroom discourse
TL - Speed of student uptake
TL - Student reluctance to use technology
TL - Students' instrumentation issues
TL - Students' instrumentation successes
TL - Students' need for a big picture view of learning
TL - Students' need for teacher to renegotiate the didactic contract
TL - Students use of technical language beyond teachers' expectation
TL - Students working at own pace
TL - Surprise at students; ability to use technology
TL - Teacher observation of genuine student surprise and intrigue
TL - Teacher realisation of another way of learning
TL - Teachers' appreciation of improved student accuracy
TL - Trying a new approach
TL - Visual imagery provided scaffolding
TL - When not to use technology
TL - Whole class mediation – IUS
Table 5-3 The broad categories of teacher learning as evidenced by the analysis of

How does a multi-representational mathematical tool mediate teachers‟ mathematical and pedagogical
knowledge about variance and invariance?
Chapter 5 Outcomes of Phase One and the design and methodology of Phase Two
120
the Phase One data.
These broad categories were then grouped into four domains: Activity design;
Expectations of students; Instrument utilisation schemes and Meta-level ideas.
These four themes are described in Table 5-4. (The categories from Table 5-3 that
were associated with each domain are listed in Appendix 5).
Domain of
teacher
learning
Description
Activity design the teacher’s initial choice of examples, its appropriateness and
potential for non-trivial mathematical exploration and extension;
the features of a good ‘first activity’ when introducing the technology or new instrumental techniques to the students;
the need to balance the construction and exploration elements
within the design of activities;
teachers’ reflections on their personal instrument utilisation scheme when introducing the activity to the students and during
whole class discussions;
the relationship between the students’ learning of relevant mathematical concepts with technology and the traditional ‘by
hand’ or ‘paper and pencil’ approaches - and reflections
surrounding the teacher’s role in supporting students to connect these experiences;
an appreciation of the need for a tighter focus on or attention to
specific mathematical generalisations within activities.
Expectations of
students
the pace at which the students worked with the technology,
which was sometimes faster and sometimes slower than the teacher expected;
teachers’ estimations of the students’ existing knowledge and
abilities and perceptions of how the technology had provided them with a deeper insight of this;
the fact that the students could be highly engaged, show
enjoyment, genuine surprise and be intrigued when engaging with the mathematics using the technology;
the ease with which most students were able to use the
technology when the teachers had carefully planned all aspects of the activity;
the instrumentation difficulties encountered by some students,
which often accompanied students’ reluctance to use the
technology;
the intuitiveness of the mathematical language that some
students used when describing unfamiliar mathematical contexts.

How does a multi-representational mathematical tool mediate teachers‟ mathematical and pedagogical
knowledge about variance and invariance?
Chapter 5 Outcomes of Phase One and the design and methodology of Phase Two
121
Domain of
teacher
learning
Description
Instrument
utilisation
schemes
the importance of the role of teacher demonstration when
introducing new instrumental techniques and the need to plan this carefully;
the students’ experience, familiarity and confidence to use
relevant features of the technology, and in particular, selecting and dragging mathematical objects, becoming familiar with
syntax and moving between different representations;
the way in which the students evolved their own instrument utilisation schemes, which were not always what the teacher had
expected or had demonstrated;
aspects of the mathematics, which promoted a need for the teachers to discuss ‘machine’ versus ‘real’ mathematics with the
students;
general classroom management issues concerning the use of the
technology.
Meta-level ideas the appropriateness of the use of technology within specific topics and activities, that is to say when to, and when not to use
the technology;
the need for the teachers to have sufficient personal skills with the technology to enable them to accomplish the actual
instrumental techniques as envisaged within their activity
designs. (Sometimes they conceived approaches that were not
actually possible);
an appreciation of the role that the technology may have had in
enabling students to work more accurately;
their students’ need for a ‘bigger picture’ of their mathematical learning beyond the single activity they were working on and
which may have involved a renegotiation of the didactic contract;
the way in which the technology supported their learners to work at their own pace and to have more autonomy in their own
routes of mathematical enquiry;
an appreciation of the role of generalisation as being a ‘fundamental aspect’ of learning and doing mathematics;
the way in which the different representations, in particular
visual imagery supported students to scaffold both the
mathematical ideas and the associated classroom discourse.
Table 5-4 The domains of teacher learning as evidenced by the analysis of the Phase One data.
The broad term ‘Meta-level ideas’ referred to the evidence of teacher learning that
seemed to suggest a more fundamental shift in the teachers’ thinking concerning
the use of the technology within the domain of the study. For example, Jeff
concluded at the end of the project that his experience had prompted him to
fundamentally rethink his pedagogy concerning his teaching of geometrical
constructions. He said, ‘Even if I wasn’t using the software, this would change the
way I approached teaching this topic’ and that he and his students had a greater
appreciation of ‘why we use our compasses in constructions - understanding the
importance of circles in constructions.’ [Journ] I was intrigued by his conclusion as

How does a multi-representational mathematical tool mediate teachers‟ mathematical and pedagogical
knowledge about variance and invariance?
Chapter 5 Outcomes of Phase One and the design and methodology of Phase Two
122
he was referring to a self-identified ‘successful lesson’ that I had rejected from my
Phase One data analysis as I did not feel there was sufficient data to conclude that
the students had had opportunities to explore variance and invariance. However,
this highlighted to me again the need for systematic classroom observations during
the second phase. Without being present in the classroom, I was relying on the
teacher’s individual abilities to describe their lessons with a level of detail that
articulated the students’ mathematical processes. The evidence submitted by Jeff
for this lesson did not indicate how the classroom discourse had enabled him and
his students to appreciate the role of the circle within geometric constructions.
The breadth and depth of the emergent categories of teacher learning led me to
carefully consider the design of the second phase of the study, to enable me to
probe further the triggers for such teacher learning through the systematic
classroom observation of a subset of the teachers. In particular, I was interested to
observe the instances in which it appeared that the teachers were perturbed (in an
epistemological sense) as a result of their uses of the MRT with their students.
5.3.3 Establishing the validity of the pedagogical map
The first phase of the study sought to explore the validity of Stacey and Pierce’s
pedagogical map within my setting. As previously discussed in Section 3.2.2 this
map was an outcome of work with upper secondary students using CAS technology.
Since my study was in the domain ‘variance and invariance within a multi-
representational technological setting’, I had chosen not to focus on activities that
privileged the scaffolding of by-hand skills, the use of real data or the simulation of
real situations. Consequently I chose only to focus upon the aspects of the map
that I have indicated by the pink shading in Figure 5-26.

How does a multi-representational mathematical tool mediate teachers‟ mathematical and pedagogical
knowledge about variance and invariance?
Chapter 5 Outcomes of Phase One and the design and methodology of Phase Two
123
Figure 5-26 The pedagogical map showing the pedagogical opportunities provided
by mathematical software with the specific aspects on which my the study focussed
indicated by the pink shading (Stacey, 2008).
The first phase of the project revealed rich data concerning teachers’ perceptions of
explorations of regularity and variation, which seemed to substantiate Stacey’s
claim that, from the Australian research, this was the most common form of
mathematical activity with technology (Stacey, 2008). There was less evidence of
activities that made use of opportunities to link representations. However, as the
developing instrument utilisation schemes showed, this could be a function of both
teachers’ time and familiarity with the technology. On the other hand, for reasons
for that are described later in this chapter, it would not be possible for me to
pursue this hypothesis during the second phase of the study as I would no longer
be working with the whole cohort of Phase One teachers.
Considering the ‘Classroom layer’, there were many examples where the teachers
had articulated their perceptions of how both the social dynamics and didactic
contract in their classrooms were being affected as a result of the use of the
technology. For example,
The way the sums were given (a+b=180), encouraged much more
generalised working. This helped to be able to generate conversations
related to proof. [BAK4(Quest2)]
They had not been shown how to construct a perpendicular line before,

How does a multi-representational mathematical tool mediate teachers‟ mathematical and pedagogical
knowledge about variance and invariance?
Chapter 5 Outcomes of Phase One and the design and methodology of Phase Two
124
so were slightly hesitant when we begun using this. They also wanted to
know why I didn‟t just use the rectangle tool – they didn‟t really
appreciate that I was working on the definition, not just drawing a
rectangle. [BAK9(Quest2)]
As an analytical tool to support the descriptive analysis of future classroom
observations I could envisage the two elements of the classroom layer (social
dynamics and didactic contract) within the pedagogical map as providing a useful
construct within the second phase of the study and I had sufficient data to convince
me of its validity in my own setting.
Finally, reflecting on the resonance between my own analysis of the first phase data
and the ‘subject layer’ of the pedagogical map, again there was substantial
evidence from the teachers to indicate that they were taking advantage of the
pedagogical opportunities that related to this layer. Teachers had begun to
appreciate the anomalies and limitations of the machine mathematics, alongside
their established views of the ‘real mathematics’.
Some students needed help with regard to finding the range – getting
the min and max values. Would a range function be useful? Possibly –
though the conversation this generated was good. [BAK5(Quest2)]
They had also reflected on their approach to learning certain topics in mathematics,
and the order and emphases of skills concepts and applications within this. Fewer of
the teachers had made comments relating to a sense of building metacognition and
overview. However, I could see elements of this within the design of some activities
and their associated instrumentation utilisation schemes. For example, the
emergence of IUS33 did in some cases enable a broader mathematical landscape to
be offered to the students than within IUS14.
5.4 Designing the methodology for Phase Two
My interest in the teachers’ situated learning as they began to use the MRT in their
classrooms with learners had been ignited by the detailed analysis of the data from
the first phase. I had undoubtedly gained a greater insight into the nature of their
learning and associated trajectories of development. The second phase of the
research was designed to enable a much more focussed and systematic case study
of the selected teachers through classroom observations and individual interviews
3 IUS3 Vary the position of an object (by dragging) that has been constructed in accordance
with a conventional mathematical constraint and observe the resulting changes. 4 IUS1 Vary a numeric or syntactic input and use the instrument‟s functionality to observe
the resulting output in numeric, syntactic, tabular or graphical form.

How does a multi-representational mathematical tool mediate teachers‟ mathematical and pedagogical
knowledge about variance and invariance?
Chapter 5 Outcomes of Phase One and the design and methodology of Phase Two
125
with a view to understanding more about the process of teacher learning. This
enquiry remained centred on the teachers’ development, implementation and
evaluation of their lesson activities and approaches in their classroom. However
some elements of the methodology evolved and new methodological tools
developed to respond to the case study approach and my underlying justifications
are provided in this section.
A multiple case study approach was used, as broadly defined by Denscombe (2003)
Case studies focus on one instance (or a few instances) of a particular
phenomenon with a view to providing an in-depth account of events,
relationships, experiences or processes occurring in that particular
instance. (p.32)
A limitation of the case study method is perceived to be the lack of reliability,
meaning that an alternative researcher might reach different conclusions. To
minimise the likelihood of this I chose to adopt a reflective reporting style as
defined by Anderson and Arsenault (2002) in which ‘the researcher’s voice is heard
throughout the report and data are woven into the story’ (p. 159). I sought to
triangulate my interpretations through the use of multiple data sources and the
internal validity of the research was supported by incorporating a ‘tight and
interconnected path of recording evidence so that the reader who was not present
to observe the case can follow the analysis and come to the stated conclusion’. (ibid
p.159)
Case study methodologies, by their nature provide an in-depth insight into the
same processes, namely teachers developing their use of the selected technology
with the explicit aim to enable their students to explore mathematical variance and
invariance. This militates against the ability to generalise the outcomes outside the
particular instance. However, there were many elements in both the situation and
outcomes of the research that resonated with existing research findings and it
would be important for me to make the necessary connections in drawing together
my research findings and communicating the outcomes of the research. Although
this would not enable any form of statistical generalisability to be inferred, a
resonance with existing research findings would contribute to the validity of my
findings.
I envisaged that, by adopting a selection of the teachers as individual case studies,
I would be entering into a partnership with them as described by Sutherland, who
advocates a position where ‘both teachers and researchers bring distinctiveness and
complementarity to the knowledge building process’ (2007, p.82).

How does a multi-representational mathematical tool mediate teachers‟ mathematical and pedagogical
knowledge about variance and invariance?
Chapter 5 Outcomes of Phase One and the design and methodology of Phase Two
126
5.4.1 Selection of the teachers for Phase Two of the study
In making the selection of the teachers to be involved in the second phase of the
study two considerations were made. The first was that the teachers needed to
have demonstrated a level of technical competency that showed they had grasped
the skills needed to create activities using a range of applications within the MRT.
For example, evidenced through the lessons they had designed during Phase One,
they had planned activities that involved more than one representation and had
provided opportunities for learners to make mathematical connections between
these representations as an outcome of the activity. The systematic interpretation
of this was that their activities did not remain within any single representation, but
they sought to explore different ways of using the technology based on their
personal knowledge growth of both the technology and pedagogical opportunities it
afforded. The teachers’ technical competency was considered important as the
study provided an opportunity to research how teachers’ learned to use the wide
range of functionalities afforded by the MRT.
The second consideration was that the teachers adopted pedagogical approaches
that placed the students’ mathematical experiences at the centre of the classroom
environment. By allowing the students more mathematical choices within the
activities they developed, they adopted a more socio-constructivist philosophy in
which their students could form their own mathematical meanings with a
collaborative, supportive classroom ethos. My rationale for this choice was related
to my desire for the study to generate new knowledge about the way that teachers
conceive and learn from their own innovations with complex new technologies.
There were four teachers who most demonstrated these attributes (Tim, Eleanor,
Carla and Sophie) and all were approached to participate in the second phase.
However, as Sophie was moving to a new school in September 2008, and would no
longer have access to the chosen technology, she was unable to participate. During
the period of the first phase Carla was both the Head of Mathematics and an
Advanced Skills Teacher, with the significant responsibility to work outside of her on
school on behalf of her local school authority. Although she was willing to be
involved, I judged that she would be unlikely to be able to commit fully to the
second phase. Consequently, I selected Eleanor and Tim as my two cases for
further study.
My decision to continue the research with two case studies alone was justified by
my belief that the research tools I would develop for the second phase would help
me to draw out the teachers’, and my own insightful observations that would be

How does a multi-representational mathematical tool mediate teachers‟ mathematical and pedagogical
knowledge about variance and invariance?
Chapter 5 Outcomes of Phase One and the design and methodology of Phase Two
127
generalisable. In this respect, a single case study would have provided sufficient
opportunity to theorise about processes involved in situated teacher learning within
the domain of the study. However, the inclusion of the second case would provide
an opportunity to contrast the emerging practices of the two teachers and deepen
the validity of my resulting theories.
5.4.2 Methods of data collection in Phase Two
The change of methodological approach in Phase Two required a review of the data
collection instruments and strategies in order to fully respond to the research aims.
The most obvious new strategy was the inclusion of classroom observations as part
of the methodology, supported by pre-lesson and post-lesson correspondences and
discussions with the teachers. The context for the classroom observations also
allowed the teachers to develop activities and approaches that spanned more than
a single one-hour lesson.
5.4.2.1 Classroom observations
As already indicated, classroom observations were an important addition to the
methodology during the second phase of the research as this was judged to be the
only way that it would be possible to evidence the teachers’ situated learning in the
classroom. The observations replaced the need for the teachers to submit detailed
evaluation questionnaires, although I adopted the same questioning format for the
post lesson semi-structured interviews.
When observing in the classroom, I chose to position myself at the front of the
room and to one side, so that I could closely observe the whole class from the
teacher’s perspective during episodes of whole class discourse. If the teacher
moved to work amongst the students, I moved around the classroom to enable me
to have a visual memory of the teacher’s actions during the whole lesson. I avoided
intervening with students, although there were some inevitable moments when I
responded to requests for immediate help.
On arrival in each classroom I made a sketch of the table layout and recorded
where the students were sitting as the teacher registered the class (with the help of
the students). This enabled me to connect individual students’ responses to any
discussions that the teacher’s had with them during the lesson. Most of the lessons
were audio recorded with the teacher wearing a digital recording device during the
lesson and some key episodes were video recorded using a small handheld digital
camera.

How does a multi-representational mathematical tool mediate teachers‟ mathematical and pedagogical
knowledge about variance and invariance?
Chapter 5 Outcomes of Phase One and the design and methodology of Phase Two
128
Finally, I took the opportunity to digitally photograph particular examples of the
teacher’s writings and annotations on the class whiteboard where it had provided
the focus for individual or whole class discourse. I judged these to be of importance
to the narrative of the lesson, in addition to the relevant screen capture view of the
MRT from both the teacher’s and the students’ handheld devices or the teacher’s
class computer.
5.4.2.2 Teachers’ lesson plans, pupil resources and software files
As in Phase One, an important element of the data collection concerned the suite of
materials that constituted the lesson. These were similar to those submitted during
the first phase and may have included:
an activity plan in the form of a school lesson planning proforma, a hand-
written set of personal notes;
a lesson structure for use in the classroom (for example a Smart NoteBook
or PowerPoint file);
a software file developed by the teacher for use by the teacher (to introduce
the activity or demonstrate an aspect of the activity);
a software file developed by the teacher for use by the students that would
normally need to be transferred to the students handhelds on advance of the
lesson;
a task or instruction sheet developed by the teacher for students’ use;
students’ written work resulting from the activity;
students’ software files captured during and/or at the end of the activity.
However, my presence in the classroom meant that I was in a position to prompt or
instigate the collection of some of this data in addition to that which the teacher
had provided. For example, if I was aware of a particular student’s work that had
become the topic for classroom discourse, I was able to ensure that it was saved at
that point of the lesson and included in the data set.
Developments in the technological setup also meant that the Phase Two teachers
had access to a more efficient form of file distribution and collection than during the
first phase. The introduction of the TI-Nspire Navigator (Texas Instruments, 2009)
platform in May 2009 enabled the handhelds to be wirelessly networked and
resulted in a more efficient means of managing the students’ files, in addition to the
ease of displaying their individual and group screens in the classroom.
Consequently, the lesson data might be supplemented by the following data in

How does a multi-representational mathematical tool mediate teachers‟ mathematical and pedagogical
knowledge about variance and invariance?
Chapter 5 Outcomes of Phase One and the design and methodology of Phase Two
129
relation to particular classroom episodes:
periodic file collection from all students’ handhelds;
screenshots from all students’ (or an individual student’s) handhelds;
short video sequences from the teacher’s (or an individual student’s)
handheld;
still digital photographs of the teacher’s annotations on the traditional
whiteboard;
This additional data provided an unexpected rich resource to support the process of
reviewing and discussing the classroom observations with the teachers, as it
provided a tangible focal point concerning particular classroom episodes. By
synchronising the lesson audio with the screenshots and video sequences, it was
possible to reconstruct these important episodes as part of the data analysis
process. The inclusion of the classroom network also added another layer of
instrumentation for both teachers, the implications for which are considered later in
the study.
5.4.2.3 Interviews with teachers
The interviews with the teachers preceded and followed the classroom observations
and were of great significance in this phase of the study, as they formed the major
opportunity to hold in-depth discussions with the teachers about their intentions,
actions and reflections. As previously mentioned, a framework for the pre and post-
lesson interviews was provided by Questionnaire 2 (Table 4-2). The pre-lesson
interviews focussed on eliciting the teacher’s intentions for the lesson by adapting
Questions 2-3, 2-4 and 2-6 to the future tense. This inevitably led to more detailed
discussion regarding all aspects of the activity design during which I would probe
each teacher concerning the pedagogical and mathematical implications,
particularly concerning the exploration of variance and invariance. The post-lesson
interview would enable the teacher’s perspective of the lesson outcomes to be
explored in more depth. The naturalistic setting for the second phase of the study
resulted in all of the lessons being taught as part of the teacher’s normal teaching
timetable and the inevitable timetable constraints resulted in some of the pre-
lesson and post-lesson communications being held through telephone conversations
or email exchanges. The face-to face discussions were audio recorded, transcribed
and imported into Nvivo8 software for subsequent coding. This data analysis
process is described in greater detail later in this chapter in Section 5.4.4.
How does a multi-representational mathematical tool mediate teachers‟ mathematical and pedagogical
knowledge about variance and invariance?
Chapter 5 Outcomes of Phase One and the design and methodology of Phase Two
130
5.4.2.4 Personal research journal
As in the first phase of the research, I used my (electronic) research notes to
record my own insightful observations and potential lines of enquiry, as well as
using them as a holding space for my emerging theories and research action plan.
These comments related to my observations of activities in the classroom, my
reflections on discussions with the teachers and associated email correspondences.
I also recorded my own thoughts that connected my experiences during the
research and my wider reading within the domain of study. For example, following
a discussion with Tim in which he had suggested a possible approach with the
technology to support students to develop some meaning for the notion of the
solution of a linear and a quadratic equation, I made the following note in my
journal (Figure 5-27).
Figure 5-27 An extract from my research journal showing an incidental comment
relating to a teacher’s instrumentation scheme for a task [Journ]
I envisaged that my personal notes would enable me to make explicit my role in the
research during the second phase and also provide rich data in itself. For example,
the extract in Figure 5-27 is revisited later in the study when I discuss Tim’s
trajectory of development in Chapter 7.
5.4.3 Summary of the Phase Two data
During the second phase I observed eight of Tim’s lessons and six of Eleanor’s
lessons in the period from May 2009 until December 2009. In some cases these
were planned teaching sequences of lessons with a particular class, whereas other
observations were of single lessons. In common with the first phase, the onus was
on Eleanor and Tim to decide upon the mathematical content and progression for
each activity and the role for the MRT within this, although in several cases this
prompted a dialogue between us that impacted upon the resulting lessons. For each
of the observed lessons, all of the raw data was collated, coded and, when it was in
a compatible format, imported to Nvivo85. An example of this is shown in Table 5-5
for Tim’s lesson ‘Pythagoras theorem’ [STP6].
5 TI-Nspire and Smart Notebook files were an unsupported format. Files in these formats
were imported into Nvivo8 as image or printed document format (pdf) files.
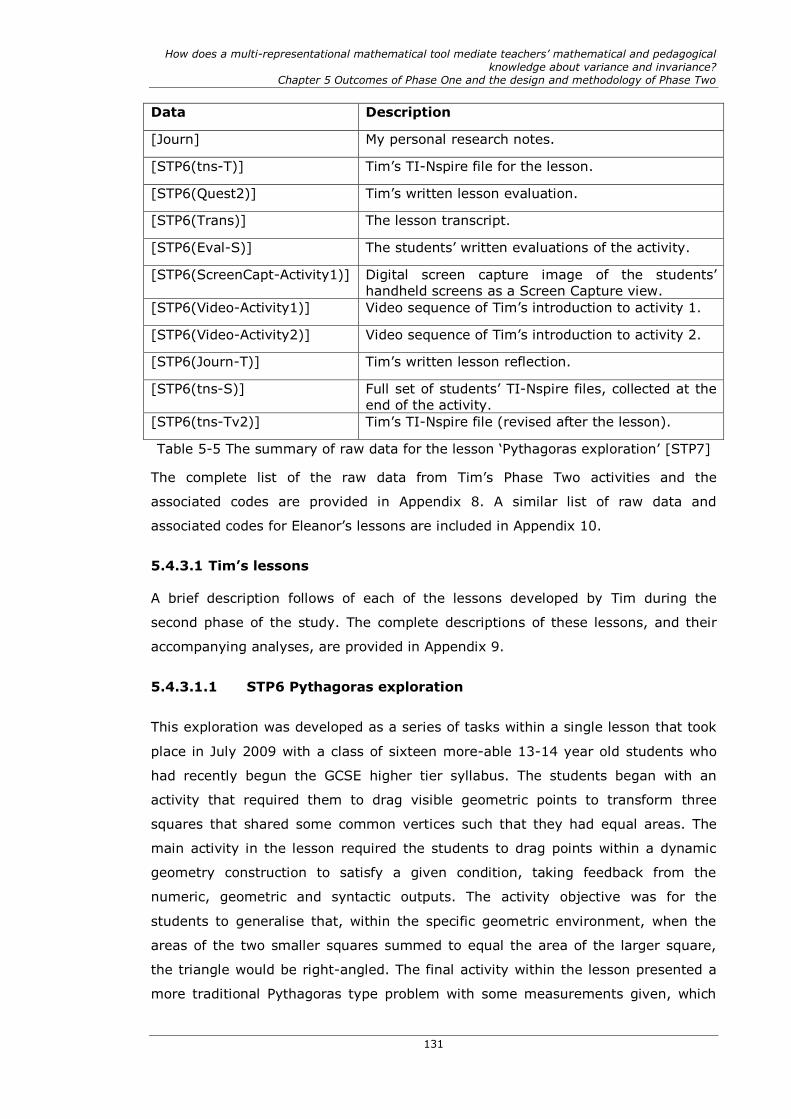
How does a multi-representational mathematical tool mediate teachers‟ mathematical and pedagogical
knowledge about variance and invariance?
Chapter 5 Outcomes of Phase One and the design and methodology of Phase Two
131
Data Description
[Journ] My personal research notes.
[STP6(tns-T)] Tim’s TI-Nspire file for the lesson.
[STP6(Quest2)] Tim’s written lesson evaluation.
[STP6(Trans)] The lesson transcript.
[STP6(Eval-S)] The students’ written evaluations of the activity.
[STP6(ScreenCapt-Activity1)] Digital screen capture image of the students’
handheld screens as a Screen Capture view.
[STP6(Video-Activity1)] Video sequence of Tim’s introduction to activity 1.
[STP6(Video-Activity2)] Video sequence of Tim’s introduction to activity 2.
[STP6(Journ-T)] Tim’s written lesson reflection.
[STP6(tns-S)] Full set of students’ TI-Nspire files, collected at the
end of the activity.
[STP6(tns-Tv2)] Tim’s TI-Nspire file (revised after the lesson).
Table 5-5 The summary of raw data for the lesson ‘Pythagoras exploration’ [STP7]
The complete list of the raw data from Tim’s Phase Two activities and the
associated codes are provided in Appendix 8. A similar list of raw data and
associated codes for Eleanor’s lessons are included in Appendix 10.
5.4.3.1 Tim’s lessons
A brief description follows of each of the lessons developed by Tim during the
second phase of the study. The complete descriptions of these lessons, and their
accompanying analyses, are provided in Appendix 9.
5.4.3.1.1 STP6 Pythagoras exploration
This exploration was developed as a series of tasks within a single lesson that took
place in July 2009 with a class of sixteen more-able 13-14 year old students who
had recently begun the GCSE higher tier syllabus. The students began with an
activity that required them to drag visible geometric points to transform three
squares that shared some common vertices such that they had equal areas. The
main activity in the lesson required the students to drag points within a dynamic
geometry construction to satisfy a given condition, taking feedback from the
numeric, geometric and syntactic outputs. The activity objective was for the
students to generalise that, within the specific geometric environment, when the
areas of the two smaller squares summed to equal the area of the larger square,
the triangle would be right-angled. The final activity within the lesson presented a
more traditional Pythagoras type problem with some measurements given, which

How does a multi-representational mathematical tool mediate teachers‟ mathematical and pedagogical
knowledge about variance and invariance?
Chapter 5 Outcomes of Phase One and the design and methodology of Phase Two
132
the students were asked to try to solve. The students’ handheld screens were on
display to the class periodically during the lesson.
5.4.3.1.2 STP7 Circles and lines
The activity comprised a series of tasks offered over a sequence of two lessons that
took place in December 2009 with a ‘more able’ group of twenty nine 15-16 year
old students working towards the GCSE higher tier examination. The two lessons
were conducted on the same day. The introductory activity focussed on a discussion
about √25 and √(-25) which did not use the technology. The students were then
sent a file with a circle defined geometrically on a Cartesian plane and were asked
to construct a line on the page, leading to a discussion about the possible number
of points of intersection between the circle and any line. The students’ handheld
screens were on display to the class throughout this discussion. In the final phase
of this activity, students made conjectures about the points of intersection between
different horizontal lines of the form y=c and attempted to prove their conjectures
both syntactically using paper and pencil, and using the MRT.
5.4.3.1.3 STP8 Quadratic curves
The activity comprised a series of tasks offered during a single lesson that took
place in December 2009 with twenty-six middle ability 14-15 year old students
working towards the GCSE higher tier examination. The students were sent a file in
which it was intended that they would enter two values into a spreadsheet that
represented ‘a’ and ‘b’ in a quadratic of the form y = (x-a)(x-b) and then drag a
related point on a Cartesian plane. The point traced the path of the defined
quadratic function, which had been hidden from view. The roots of the quadratic
were visible as crosses on the axes. The students were asked to make conjectures
about the nature of the point’s locus and to predict the factorised form of quadratic
function. They entered their predictions with the aim to ‘reveal’ the locus of the
moving point. However, a technological problem occurred when the file was
transferred, which resulted in the movable point losing its connection with the
underlying quadratic curve onto which it had been constructed. Consequently, Tim
had to amend the activity during the early part of the lesson and the focus of the
activity became one of matching the factorised form of the quadratic with its
expanded form, both syntactically and graphically.
5.4.3.1.4 STP9 Equivalent quadratic equations
The activity comprised a series of tasks offered during a sequence of three lessons

How does a multi-representational mathematical tool mediate teachers‟ mathematical and pedagogical
knowledge about variance and invariance?
Chapter 5 Outcomes of Phase One and the design and methodology of Phase Two
133
that took place in December 2009 with a group of sixteen lower ability 14-15 year
old students working towards the GCSE foundation tier examination. In the
preceding two lessons Tim reported that the students had learned to plot quadratic
graphs using paper and pencil methods. The lesson sequence initially focussed on
supporting the students to compare graphs of coincident quadratic functions that
had been plotted syntactically in both the factorised and expanded form, with a
view to making generalisations about the algebraic forms of each matching pair.
The second lesson extended this approach and Tim introduced a paper and pencil
grid multiplication method to support his explanation of the students’ conjectures.
In the final lesson, the students worked from a more conventional worksheet in
which they practised the grid multiplication method for expanding quadratic
functions and used the MRT as a ‘class authority’ to check their answers to each
question.
5.4.3.1.5 STP10 Linear graphs
This activity was designed for a single lesson that took place in December 2009
with a small group of twelve 16-17 year old students who were being prepared to
resit their GCSE examination and its mathematical focus concerned the gradient
and intercept properties of linear functions. A TI-Nspire file was created during the
initial whole-class discourse within the graphing application onto which two
coordinate points had been constructed. The ‘display grid’ functionality had been
enabled, resulting in the points being fixed onto integer values. These points were
then joined with a line. A second line was added in a similar way that shared a
common point with the first line. This file was then sent to the students’ handhelds
and they were shown how to reveal the equation of the one the lines and asked to
discuss the resulting gradient and intercept properties. Tim used a class poll to
gain their responses to a question about the gradient of the second line. In the final
part of the lesson, he constructed a third line segment and asked the students to
predict its gradient.
5.4.3.2 Eleanor’s lessons
A brief description follows of each of the lessons developed by Eleanor during the
second phase of the study. The complete descriptions of these lessons, and their
accompanying analyses, are provided in Appendix 11.
5.4.3.2.1 CEL6 Transforming graphs
A single lesson taught in May 2009 with a group of twenty-nine 15-16 year old girls

How does a multi-representational mathematical tool mediate teachers‟ mathematical and pedagogical
knowledge about variance and invariance?
Chapter 5 Outcomes of Phase One and the design and methodology of Phase Two
134
working towards the GCSE higher tier examination syllabus. The students were sent
a file in which they were expected to enter given sets of functions with a view to
generalising about the effect of different syntactic forms on the resulting graphs.
The students’ handheld screens were on public display in the classroom throughout
the lesson. Eleanor led a session of whole class discourse towards the end of the
lesson that concerned transformations of the type y=f(x±a).
5.4.3.2.2 CEL7 Generating circles
A single lesson taught in May 2009 with a group of twenty-nine 15-16 year old girls
working towards the GCSE higher tier examination syllabus. The initial activity
required the students to offer two numbers using the class poll which, when
individually squared and summed, equalled twenty five. The initial answers were
shared and the poll repeated, building a set of correct responses. These numbers
were then collated into a spreadsheet and the values plotted as coordinate pairs on
a Graphing page that had been linked using the MRT. The students’ handheld
screens were on display to the class periodically during the lesson. Students made
conjectures in relation to the shape of the resulting graph and in the final phase
they were supported to fit a function to the data points that plotted the circle
function syntactically.
5.4.3.2.3 CEL8 Triangles and squares
A single lesson taught in July 2009 with a year 8 group of 30 students working at
National Curriculum levels 6-7 who were soon to commence the higher tier GCSE
course. This is Eleanor’s adaptation of the lesson developed and taught by Tim
[STP6]. The students began with an activity that required them to drag visible
geometric points to transform three squares constructed on a common horizontal
base, such that they had equal areas. The students were then supported to
remember how to calculate the side length of any square, given its area. The
second activity required the students to drag points within a dynamic geometry
construction to satisfy a given condition, taking feedback from the numeric,
geometric and syntactic outputs. Towards the end of the lesson, a poll of the
students’ conclusions was conducted and the results discussed with the group. In
the final minutes of the lesson, they dragged points within a traditional Pythagoras
construction to create their own numerical problem, for which they were then asked
to try to find as many of the missing measurements on their diagram as they could.
The students’ handheld screens were on display to the class periodically during the
lesson.

How does a multi-representational mathematical tool mediate teachers‟ mathematical and pedagogical
knowledge about variance and invariance?
Chapter 5 Outcomes of Phase One and the design and methodology of Phase Two
135
5.4.3.2.4 CEL9 Crossing linear graphs
A series of three lessons taught in October 2009, with a year 9 class (set 1) of 29
students working at National Curriculum levels 7-8 who were undertaking the
higher tier GCSE course. Students began by conjecturing algebraic rules that could
describe the relationship between the x and y values for a given coordinate pair. A
class poll was conducted to gather their responses and, following an initial
discussion, the poll was repeated to allow the students to amend their answers. The
students were sent a file which included a graphing page, on which the given
coordinate point had been plotted, and they were asked to generate linear functions
that coincided with the point. The students’ handheld screens were on display to
the class during this time, resulting in episodes of discussion. In the final phase the
students were shown how to reveal the function table and they used this to support
them to reason that the MRT was indeed correct. In the final lesson, one of the
student’s responses in the previous lesson was used to reiterate the successful
strategies that had been devised to generate linear equations through a given
point. This process was then reversed by inviting the students to find their own
strategies to calculate the point of intersection for any two given linear functions.
They were expected to record their approaches using paper and pencil and they
also had access to the TI-Nspire handhelds during the lesson.
5.4.4 Process of data analysis during Phase Two
For each of the classroom observations, I began by transcribing the lessons in full
and importing the audio and text into Nvivo8 as a synchronised set of data. This
enabled me to move smoothly between the audio and transcript and to efficiently
locate, replay and code key episodes of the lessons. I was also able to link other
related supporting data that had also been imported into Nvivo8, for example the
digital image of a student’s handheld screen or the teacher’s written work on the
class whiteboard.
I used this set of interlinked data to support me to write a detailed, accurate and
complete lesson narrative, which typically included:
descriptions of my classroom observations (triangulated by the audio
recording and associated data);
direct quotes from the teacher and/or students for key episodes within the
lesson;
screen shots of the teacher’s and/or students’ technological display for key

How does a multi-representational mathematical tool mediate teachers‟ mathematical and pedagogical
knowledge about variance and invariance?
Chapter 5 Outcomes of Phase One and the design and methodology of Phase Two
136
episodes within the lesson;
photographs of the teacher’s written board work;
photographs of students’ written work.
Examples of the detailed lesson narratives for one of Tim’s activities and one of
Eleanor’s activities are provided later in the study within sections 6.2.2 and 6.3.2
respectively.
Following this, I used Stacey and Pierce’s pedagogical map as a tool to support the
writing of a broad analysis of the lesson (Stacey, 2008). This was done within
Nvivo8 by initially coding the lesson for the three ‘layers of pedagogical
opportunities’, namely the task layer, the classroom layer and the subject layer. For
example, Figure 5-28 shows the format that I adopted when developing the
descriptive analysis for Tim’s lesson ‘Pythagoras exploration’ [STP6].
Figure 5-28 An example of how I produced a written analysis of an activity using
the themes provided by the pedagogical map for Tim’s ‘Pythagoras exploration’ [STP6].
For example, in relation to the pedagogical opportunity within this activity to
‘explore regularity and variation’, the following features were surmised:
the activity focussed students' attentions onto the chosen generality;
there was an expectation that students would appreciate the condition for
the generality;

How does a multi-representational mathematical tool mediate teachers‟ mathematical and pedagogical
knowledge about variance and invariance?
Chapter 5 Outcomes of Phase One and the design and methodology of Phase Two
137
there was an implied interpretation of the generality as being a situation
where a particularly geometric condition ‘worked';
there was an expectation that students would notice variation through
differences in the representations.
5.4.5 My role during Phase Two
During the second phase of the study my role changed from being predominantly
concerned with in-service teacher education to that of an educational researcher. I
had invited Eleanor and Tim to be part of the second phase of my study and they
were aware that it formed part of my doctoral research. Consequently, I discussed
with them my need to observe them in the classroom using the technology with
their learners and that I was interested in the sorts of activities they designed that
provided opportunities for their learners to explore mathematical variance and
invariance.
I offered myself as a critical friend to the two teachers and, although I was still
keen that the activities and approaches designed by the teachers were of their own
origination, I was aware that technically, mathematically and pedagogically they
would want to know my opinion and views on different instrument utilisation
schemes. As such, although I was involved in professional conversations with
Eleanor and Tim concerning the design and evaluation of lessons, my motive for
holding these discussions was more concerned with eliciting rich data for the study.
This data was needed to support the triangulation process and, as the study
proceeded, provide opportunities for discussions concerning lessons.
From my research perspective, I did not interpret this as a threat to the objectivity
of the study as I was including these exchanges as part of the research data
through my audio recordings and personal research journal. I would be able to
‘declare’ my level of involvement at all stages of the activity design and use the
associated data to provide further insight into the teachers’ trajectories of
development. However, as previously stated, my role within the actual lesson
observations was that of a non-participant observer as it was crucial that the
lessons were as naturalistic as they could be when a researcher was present in the
classroom.
5.5 The emergence of the hiccup as an organising principle
As Phase Two commenced and I began to observe the teachers in their classrooms,
my attention was increasingly shifting towards the existence and opportunity to

How does a multi-representational mathematical tool mediate teachers‟ mathematical and pedagogical
knowledge about variance and invariance?
Chapter 5 Outcomes of Phase One and the design and methodology of Phase Two
138
analyse what I refer to throughout the thesis as lesson ‘hiccups’. These were the
perturbations experienced by the teachers during the lesson, triggered by the use
of the technology that seemed to illuminate discontinuities in their knowledge and
offer opportunities for the teachers’ epistemological development within the domain
of the study. They were highly observable events as they often caused the teacher
to hesitate or pause, before responding in some way. Occasionally the teachers
looked across to me in the classroom in surprise and, particularly in the case of
hiccups relating to what they considered to be unhelpful technological outputs, they
sometimes expressed their dissatisfaction verbally. Consequently, I also started to
code each activity for hiccups. An example of such coding for Tim’s lesson
‘Equivalent quadratic equations’ [STP9] is shown in Figure 5-29.
Figure 5-29 An example of the hiccups within Tim’s lesson ‘Equivalent quadratic
equations’ as coded within the Nvivo8 software [STP9].
The lesson transcripts formed the main data source, supported by my observational
notes and, in some cases, triangulated by evidence from the post-lesson interview
or the teacher’s written lesson reflections. If a particular hiccup was referred to
more than once within a single data source this would generally be considered to be
a major hiccup. For example, within the Nvivo8 summary shown in Figure 5-29 the
hiccup coded as TP9Hiccup07 occurred five times within this particular activity.
As I began to organise the research data to bring the examples of the lesson
hiccups to the fore, I became increasingly convinced that they were having a
significant role within Tim’s and Eleanor’s situated learning. Interestingly, although
the teachers’ immediate reaction to the hiccups was often a negative one, I did not
conceive the occurrence in the same way. This might have been because I could
see it as an opportunity to focus upon the unanticipated elements of the lessons as
a trigger for a substantial professional discussion with each teacher.
The notion of the lesson hiccup is expanded more substantially within Chapter 6
when I identify a single hiccup from each of Eleanor and Tim’s lessons and
articulate its significance within the thesis.

How does a multi-representational mathematical tool mediate teachers‟ mathematical and pedagogical
knowledge about variance and invariance?
Chapter 5 Outcomes of Phase One and the design and methodology of Phase Two
139
Finally, whilst coding and re-coding the data I also began to appreciate the
subtleties of each teacher’s actions both during and after the lessons, which
seemed to provide some possible evidence to suggest that the teacher had noticed
the hiccup and acted in response to it. Consequently I identified and coded this
data as ‘Actions’. The coded actions from the lesson [STP9] are shown in Figure
5-30.
Figure 5-30 [STP9] An example of the Tim’s actions in response to the hiccups within his lesson ‘Equivalent quadratic equations’ as coded within the Nvivo8
software [STP9].
This process of coding both the lesson hiccups and list of teacher actions was
repeated for each of Tim’s and Cindy’s observed lessons. The detail of this coding
for all of their Phase Two lessons is contained within Appendix 9 and Appendix 11
respectively. The overarching analysis that resulted from this data would ultimately
lead to the development of the ‘hiccup theory’ of situated teacher learning.
5.6 Summary
In this chapter I have detailed the outcomes of the first phase of the research and
how these informed an analysis of the teachers’ conceptions of variance and
invariance within the technological setting. This resulted in nine distinct instrument
utilisation schemes. In addition I was able to summarise the elements of the
associated teacher learning and to propose the notion of the lesson hiccup as an
observable instance of the teacher’s situated learning in the classroom. The chapter
outlined the methodology for the second phase to include: a justification of the use
of the adapted pedagogical map as an analytical tool for the forthcoming lesson
observations; the selection of the teachers to be involved; a description of my
revised role within the research.

How does a multi-representational mathematical ICT tool mediate teachers‟ mathematical and
pedagogical knowledge concerning variance and invariance?
Chapter 6 Introducing the teachers and analysing their mathematics lessons
140
6 INTRODUCING THE TEACHERS AND ANALYSING THEIR MATHEMATICS
LESSONS
If we could understand more precisely the roles that teachers are called
upon to play in computationally based environments, then it would
surely throw light on the nature of the mathematical knowledge
involved, its relationship with the priorities of the official mathematics
curriculum, and help to clarify how the process of integrating
technologies productively into classroom practice might be facilitated.
(Hoyles et al., 2004, p. 316)
6.1 Introduction
This chapter begins by introducing the two teachers selected as cases for the
second phase of the study namely, Eleanor and Tim. It provides a concise
description of their individual backgrounds and school contexts as relevant to the
research. In addition, the chapter includes an overview of their responses to the
first phase that served as a point of reference against which to contrast their later
practices. This overview refers to the nine Instrument Utilisation Schemes (IUS)
concerning activities and approaches that privileged the exploration of variance and
invariance that were defined as an outcome of the first phase of the research
(Section 5.3.1).
The chapter continues by making explicit to the reader the process through which
the data from each of Eleanor and Tim’s Phase Two lessons was collected and
analysed. By providing the detailed account of a selected lesson from each teacher,
followed by its analysis, I aimed to collect a more detailed and measured set of
data through which the story of each teacher’s trajectory could be elicited. The
notion of the lesson ‘hiccup’ is introduced as an instance of situated teacher
learning triggered by the technology, within the domain of study. For each selected
lesson, the occurrence and analysis of a chosen hiccup is described with a view to
developing a class of theories to describe this new construct that are expanded
upon more fully in Chapter 7.
6.2 Introducing Tim
Tim was in his mid-thirties and he held an honours degree in mathematics. When
asked about the first time that he had used technology in connection with
mathematics he responded,
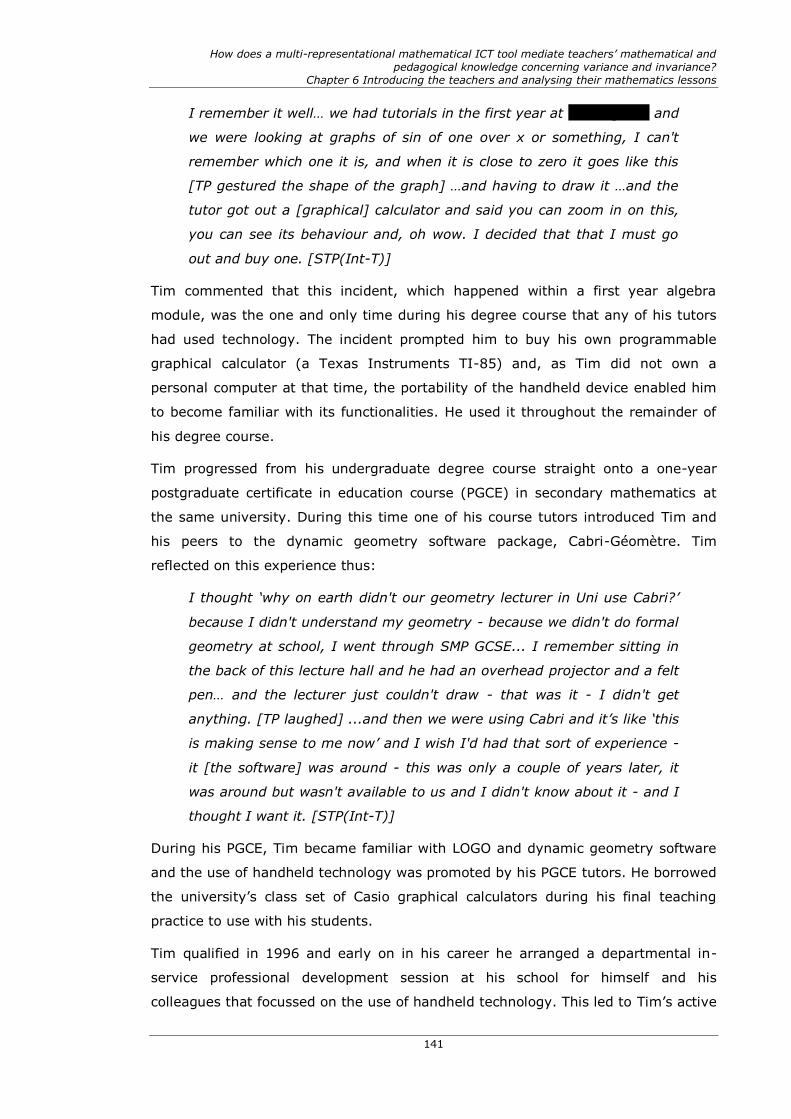
How does a multi-representational mathematical ICT tool mediate teachers‟ mathematical and
pedagogical knowledge concerning variance and invariance?
Chapter 6 Introducing the teachers and analysing their mathematics lessons
141
I remember it well… we had tutorials in the first year at Birmingham and
we were looking at graphs of sin of one over x or something, I can't
remember which one it is, and when it is close to zero it goes like this
[TP gestured the shape of the graph] …and having to draw it …and the
tutor got out a [graphical] calculator and said you can zoom in on this,
you can see its behaviour and, oh wow. I decided that that I must go
out and buy one. [STP(Int-T)]
Tim commented that this incident, which happened within a first year algebra
module, was the one and only time during his degree course that any of his tutors
had used technology. The incident prompted him to buy his own programmable
graphical calculator (a Texas Instruments TI-85) and, as Tim did not own a
personal computer at that time, the portability of the handheld device enabled him
to become familiar with its functionalities. He used it throughout the remainder of
his degree course.
Tim progressed from his undergraduate degree course straight onto a one-year
postgraduate certificate in education course (PGCE) in secondary mathematics at
the same university. During this time one of his course tutors introduced Tim and
his peers to the dynamic geometry software package, Cabri-Géomètre. Tim
reflected on this experience thus:
I thought „why on earth didn't our geometry lecturer in Uni use Cabri?‟
because I didn't understand my geometry - because we didn't do formal
geometry at school, I went through SMP GCSE... I remember sitting in
the back of this lecture hall and he had an overhead projector and a felt
pen… and the lecturer just couldn't draw - that was it - I didn't get
anything. [TP laughed] ...and then we were using Cabri and it‟s like „this
is making sense to me now‟ and I wish I'd had that sort of experience -
it [the software] was around - this was only a couple of years later, it
was around but wasn't available to us and I didn't know about it - and I
thought I want it. [STP(Int-T)]
During his PGCE, Tim became familiar with LOGO and dynamic geometry software
and the use of handheld technology was promoted by his PGCE tutors. He borrowed
the university’s class set of Casio graphical calculators during his final teaching
practice to use with his students.
Tim qualified in 1996 and early on in his career he arranged a departmental in-
service professional development session at his school for himself and his
colleagues that focussed on the use of handheld technology. This led to Tim’s active

How does a multi-representational mathematical ICT tool mediate teachers‟ mathematical and
pedagogical knowledge concerning variance and invariance?
Chapter 6 Introducing the teachers and analysing their mathematics lessons
142
involvement in the Teachers Teaching with Technology (T3) network, a practitioner
network part-funded by Texas Instruments to support the professional development
of teachers who had adopted their handheld products. Tim commented upon how
this happened thus,
I got involved with T^3 because I invited Barrie Galpin in to do a
presentation at my first school. He looked at a booklet that I had done
for my department and he said you should be writing stuff. So that was
what started me off with it. [STP(Int-T)]
Tim was a member of the Association of Teachers of Mathematics (ATM) and he had
contributed a number of articles to their journals, all of which have concerned the
use of technology. Tim had also contributed to published teaching resources and he
regularly led professional development sessions for other teachers concerning the
use of technology in secondary mathematics.
Tim would certainly be described as an innovator with respect to his curiosity for
the design of new teaching resources and pedagogies for mathematics. At the
outset of the study Tim commented that he had ‘given some training and shared
ideas with the department… but so far this has had little effect’ [Journ]. This
suggested that he was experiencing some of the difficulties involved with
supporting his colleagues to develop and use technology with their learners. Tim
also reported that he had registered for a Masters of Philosophy (MPhil) course and
that his personal research interests lay in the ‘focus of attention in the teaching and
learning of linear equations’ [STPQuest1)].
In 2007 Tim was appointed to his first post as a head of a mathematics department
at Stadium School in the centre of a West Midlands suburb. During the period of the
study, Stadium School was a mixed school of around one thousand students aged
between eleven and eighteen. The most recent Office for Standards in Education
(Ofsted) description of the school described it as serving a diverse area with above
average social and economic deprivation. At that time the ethnicity of the students
was approximately: one third white British; one quarter Pakistani backgrounds; one
eighth Caribbean backgrounds; and smaller numbers from Bangladeshi and African
backgrounds. One in ten students were judged to be at an early stage of acquiring
English language and one in seven students had designated learning difficulties.
The students’ mathematical achievement was consistently below the national
expectation, although there had been a slowly improving trend in the GCSE results
in the period since Tim assumed responsibility for the mathematics department at
the school in January 2007.

How does a multi-representational mathematical ICT tool mediate teachers‟ mathematical and
pedagogical knowledge concerning variance and invariance?
Chapter 6 Introducing the teachers and analysing their mathematics lessons
143
6.2.1 Tim’s participation during Phase One
Within a few weeks of participating in the project Tim had articulated that he saw
his students’ uses of the MRT as providing them with opportunities to ‘try out
mathematical conjectures’ and ‘access the mathematics in a situation more
directly’. He provided the following example of this:
In an activity exploring gradient of straight line graphs, students were
able to generate many graphs in a short space of time and keep their
focus on gradient rather than on the physical process of drawing the
graphs themselves. [Journ]
Tim’s experience and confidence with handheld technology was demonstrated from
the outset of the project as he sought to adapt and reversion familiar activities in
addition to designing new activities, which took advantage of the MRT environment
and associated functionalities. The detailed description and analysis of Tim’s
activities using the MRT during the first phase is provided in Appendix 6.
With the exception of activity STP4, all of Tim’s activities began with an input in one
representational form and led to a single output in another representational form.
His activities were classified as using IUS1, IUS3 and IUS4. Figure 6-1 shows
diagrammatically an indication of the types of input and output representations that
Tim privileged in his early activity designs.
Figure 6-1 The summary of Tim’s Instrument Utilisation Schemes produced from
the analysis of his Phase One lesson data.
For example, in activity STP2, the students’ initial input was numerical and the

How does a multi-representational mathematical ICT tool mediate teachers‟ mathematical and
pedagogical knowledge concerning variance and invariance?
Chapter 6 Introducing the teachers and analysing their mathematics lessons
144
resulting output gave a geometric image in a particular position on the display
screen. This diagram evidences Tim’s willingness to explore different
representational starting points in his early activity design.
Reflecting on Tim’s trajectory of development during the first phase of the study it
was possible to draw several conclusions concerning Tim’s practices.
In all of Tim’s activities and approaches his actions were consistent with his
original aims for the project in that they had all been designed to encourage
his students to explore and conjecture with respect to the mathematics
under investigation.
Despite Tim’s advanced technical knowledge he was mindful to his students’
needs with respect to the process of instrumentation. Although some of his
activities were complex in their design, the students only needed to be
familiar with basic techniques such as moving between pages, entering
numerical data and selecting and dragging objects.
It was noticeable that Tim chose to display the mathematical
representations in the form of the different applications on separate pages
within the TI-Nspire files, rather than taking advantage of the functionality
to combine applications on a single page. This decision seemed to help his
mediation of the activities whereby he was able to support his students to
maintain their attentions in a similar direction.
Tim seemed to have carefully considered what, when and how he wanted his
students to make paper and pencil recordings alongside their use of the
technology. It was also an established aspect of his practice that his
students evaluated on their own learning through an open written comment
made towards the end of the activities. This provided Tim with additional
insight into their experiences and seemed to be influencing his own learning.
6.2.2 Observing Tim in the classroom - The lesson introducing
Pythagoras’ theorem
What follows is a description and analysis of the lesson taught by Tim during Phase
Two involving his class of fifteen year 10 students aged 14-15 years. The group
were all pursuing a compulsory General Certificate of School Education (GCSE)
mathematics course with the majority being prepared for the higher tier of entry.
Tim asserted that they were currently working at around National Curriculum levels
5-6 (Department for Children Schools and Families, 2007). During the lesson Tim
and the students used the TI-Nspire handheld machines. As mentioned in Section

How does a multi-representational mathematical ICT tool mediate teachers‟ mathematical and
pedagogical knowledge concerning variance and invariance?
Chapter 6 Introducing the teachers and analysing their mathematics lessons
145
5.4.4 developments in the technological setup had resulted in the further
functionality that connected all of the handhelds to the Tim’s class computer
through a wireless classroom network. It was therefore now possible to display the
students’ handheld screens publicly through a ceiling mounted data projector onto
the classroom interactive whiteboard1.
The lesson was observed, audio recorded and the computer action for key
sequences where Tim led whole-class activities using the live presentation tool were
video recorded. The students’ files were collected from their handhelds the end of
the lesson using the file collection facility. In addition, the students’ written work,
which included their self-assessment statements about the lesson, was also
collected. Where it did not interrupt the classroom discourse, I also made a number
of screen captures of the students’ handheld displays during the lesson to
correspond with key episodes within the lesson when the class view had stimulated
whole-class mathematical discourse2. The description of the lesson is supported by
the relevant software screen shots and extracts from the lesson transcript to
provide a context for the subsequent detailed analysis using Pierce and Stacey’s
framework (2008).
6.2.2.1 A description of the lesson activity
Tim introduced the lesson by informing the students that they were going to be
‘doing something different today’ [STP6(Trans)], although in his written lesson
evaluation, completed after the lesson, he wrote that he had two objectives for the
lesson,
Mathematical objectives were for students to appreciate Pythagoras‟
Theorem, in particular recognising that the sum of the areas of the
squares on the two smaller sides will equal the area on the longer side if
and only if3 the triangle is right angled
...and then, in right angled triangles, find missing sides using the fact
that the two smaller areas sum to the larger area [STP6(Quest2]
In his written evaluation he also added a specific intention for the use of the
wireless network, ‘Each individual student will explore the triangles on their own
handheld – we will use the shared space of screen capture to come to a shared
1 The class interactive whiteboard can be considered a ‘red herring’ in this lesson as, at no
time did Tim (or his students) use its functionality to drive the computer software. 2 The only strategy for capturing the screen on class display was accomplished by using the
key sequence ‘Alt Print Screen’ on the class computer and ‘pasting’ the image into another
application which then had to be saved separately. 3 Tim’s emphasis.

How does a multi-representational mathematical ICT tool mediate teachers‟ mathematical and
pedagogical knowledge concerning variance and invariance?
Chapter 6 Introducing the teachers and analysing their mathematics lessons
146
agreement about the necessity for the triangle to be right angled’ [STP6(Quest2].
The activity was divided into three distinct episodes, hereafter described as tasks,
and each task focused around a particular dynamic interactive. Table 6-1 shows a
screenshot and description of the construction of each of the activity interactive
that had all been designed by Tim without my involvement.
Opening screen Description of the construction
of the environment
Figure 6-2 The opening view of Task 1 in which the students were asked to drag
different vertices to produce three squares of
equal areas [STP6(tns-T)page1].
Task 1: The environment had been
constructed in the graphs and
geometry application such that
three defined, connected squares
could be altered in size and
orientation by dragging any vertex.
The areas of the squares had been
measured and assigned to the
variables a, b and c. The definition
of the screen scale (1 cm) enabled
the areas of the squares be given a
standard unit. Finally the value of a
+ b was calculated and displayed.
Figure 6-3 The opening view of Task 2 in
which the students were asked to drag
different vertices to make a+b=c [STP6(tns-T)page2]
Task 2: In this environment, also in
the graphs and geometry
application, a triangle had been
constructed onto the sides of which
three squares had been defined. The
areas of the squares had been
measured and assigned to the
variables a and b. The value of a +
b was calculated and displayed.

How does a multi-representational mathematical ICT tool mediate teachers‟ mathematical and
pedagogical knowledge concerning variance and invariance?
Chapter 6 Introducing the teachers and analysing their mathematics lessons
147
Opening screen Description of the construction
of the environment
Figure 6-4 The opening view of Task 3 in
which the students were asked to find the lengths of as many of the lines in the
diagram as they were able. [STP6(tns-
T)page3]
Task 3: The final environment
included a split screen with the left
hand side displaying the graphs and
geometry application and the right
hand side the calculator application.
A right angled triangle was
constructed onto which only two
squares had been constructed. Two
area measurements were also
displayed on the page.
Table 6-1 The design of Tim’s activity ‘Pythagoras exploration’ [STP6]
Tim began Task 1 by using his handheld and the live presentation facility (through
the data projector) to demonstrate to the students how to use the handheld’s
navigation pad to select one of the vertices of the squares and drag it to a different
position. During this phase he drew the students’ attention to the changing
numbers on the screen and told them that the numbers related to the areas of the
three squares and which number related to which square, gesturing to their initial
positions on the screen. He set the students an initial task within this environment,
the purpose for which he told the students was ‘to get yourself organised and get
your head around this’ and gave the following instructions to the class.
Try and move the point around so that – it doesn‟t matter what number
you pick – so that that number... [Tim gestured to value of area defined
as „a‟] ...and that number... [d.o. „b‟] ...and that number... [d.o. „c‟] are
the same - or as close as you can get them to be the same - as each
other. Okay so try and make those three areas equal to each other.
[STP6(Trans)]
Tim gave the students three to four minutes to respond to the task and then chose
to display to the class a static screen capture of all of their handheld screens (see
Figure 6-5).

How does a multi-representational mathematical ICT tool mediate teachers‟ mathematical and
pedagogical knowledge concerning variance and invariance?
Chapter 6 Introducing the teachers and analysing their mathematics lessons
148
Figure 6-5 An image of the students’ handheld screens in response to Task 14
captured during the activity [STP6(ScreenCapt)].
Tim then spent a few minutes identifying what he described as ‘interesting screens’
and, as the students’ screens were anonymised5, identifying which screen belonged
to each student. It was noticeable that the students were keen to find their screen
within the public view. He picked out two of the displayed screens (S10 and S13)
and invited other students to suggest the strategy that was being adopted. At this
point Tim also noticed that a number of the students had not managed to make any
progress with this first task as their screens appeared unchanged, saying ‘We’ve
got some [students] that haven’t really started – who’s S17?’ to which a student
responded ‘I can’t do the points thing.’ Tim gave the students a second strategy to
select and move the vertices of the squares and established that all of the students
were then able to accomplish this. The final stage of each student’s response to this
first task was captured when the files were collected at the end of the lesson. These
files provided further evidence of how the students had responded to the various
discussions and interventions during the lesson.
Tim then used the live presentation facility to show the students how to move to
4 Tim had opted for a display setting that highlighted the designated teachers’ handheld in
yellow (S14). 5 This was because Tim had not imported his students’ names into the software to enable
their actual names to be displayed - consequently they appeared as S11, S12 etc.

How does a multi-representational mathematical ICT tool mediate teachers‟ mathematical and
pedagogical knowledge concerning variance and invariance?
Chapter 6 Introducing the teachers and analysing their mathematics lessons
149
the second page in the file and gave a very clear rationale for his introduction to
the second task:
The main focus of this lesson is something that is crucial for the next
part of your GCSE course. This is not - I am just doing for the fun of it -
this is actually what you are going to be assessed on. Okay? And you
need to be focused here. I am not actually going to tell you what it is
yet – I‟ll tell you what it is later. [STP6(Trans)]
He displayed Task 2 (see page 147) and spent a few minutes showing students how
the three squares from the first task had been ‘joined together’ to ‘look more like a
triangle in the middle’ [STP6(Trans)]. He then moved the triangles around by
dragging different vertices, highlighting which area measurement related to which
square and setting the aim for Task 2, which was to move the squares around until
the area measurements that had been labelled a and b, when summed, equalled
the area measurement that had been labelled c saying,
So you need to think about which square is which and move them
around a bit and I want a and b to add up to make c. Do you kind of get
what we have to do? You‟re trying to change the sides so that a and b
adds to make c. [STP6(Trans)]
At this stage Tim gave the students five minutes to respond to this challenge,
during which time he moved around the room supporting students and monitoring
their work. In this period the students’ handheld screens were on public display to
the class, refreshing automatically every thirty seconds. During this period Tim
chose to send one student’s work [STP6(tns-S22)] to the teacher’s computer, which
captured the student’s response to the task at that point in the lesson. Tim
concluded this period of the lesson by alerting the students that they were going to
be stopping and reviewing the class display of the individual handheld screens in a
few minutes and that they would, ‘scroll down and have a little chat about them
and see how we’re getting on’ [STP6(Trans)]. With the students’ attention back on
the screen capture view of their work, Tim began to pick out screens and check that
the numbers displayed satisfied the desired condition by talking out loud. For
example, he focused on screen S13, saying,

How does a multi-representational mathematical ICT tool mediate teachers‟ mathematical and
pedagogical knowledge concerning variance and invariance?
Chapter 6 Introducing the teachers and analysing their mathematics lessons
150
Figure 6-6 Student’s handheld screen
showing a response to Task 2 [STP6(tns-
S13)].
Okay I‟ll go through these and we‟ll
have a look at them so... a add b is
twenty-eight point six-ish, and there‟s
a and b is two point five, add them
together that‟s kind of alright – that‟s
really good. [STP6(Trans)]
He then moved on to screen S16, saying,
Figure 6-7 Student’s handheld screen
showing a response to Task 2 [STP6(tns-S16)].
We‟ve got this one here and we‟ve got
three and twelve, that‟s fifteen and
that‟s nineteen so that‟s close but a
little bit off but it‟s close.
[STP6(Trans)]
At this point he reminded the students that ‘...we’re kind of looking at the ones that
do work and the ones that don’t...’ and he invited the students to volunteer their
screen number if they thought that their screen ‘worked’ [STP6(Trans)]. At this
point there was a noticeable increase in students’ participation and involvement as
a number of students were heard to call out ‘mine works’, ’22 works’ and ‘mine’s
12’ and Tim tried to locate these screens and move them so that they were visible
to the class.
Tim then directed the students by saying,
Okay I‟d like you to look at the ones that work that we‟ve identified and
compare them with the ones that don‟t work and I want you to look at
the shape of the triangle... ...in the middle. This is what I am asking you
to look at now. Look at the shape of the triangle. Look at the ones that
work, look at the ones that don‟t work and my question to you and
you‟ve thirty seconds to discuss this now, my question to you is, is there
anything different about the shape of that triangle in the ones that work

How does a multi-representational mathematical ICT tool mediate teachers‟ mathematical and
pedagogical knowledge concerning variance and invariance?
Chapter 6 Introducing the teachers and analysing their mathematics lessons
151
compared to the ones that don‟t quite work? You‟ve got 30 seconds to
talk about it. [STP6(Trans)]
After a short period of pupil discussion Tim asked if anyone had noticed anything
and a student volunteered the response, ‘Is it right angled?’ [STP6(Trans)].
Tim responded by displaying the following student’s handheld screen (Figure 6-8)
and making the following comment, directed towards the owner of the screen:
Figure 6-8 Student’s handheld screen showing a response to Task 2 [STP6(tns-
S22)].
Yours is quite easy to see isn‟t it? - that this is a right angled triangle
because you‟ve actually got a square and you can see it‟s a corner of a
square in there – yes it is a right angled triangle. [STP6(Trans)]
Tim selected another student’s screen (Figure 6-9) and talked through why it did
not ‘work’.
Figure 6-9 Student’s handheld screen showing a response to Task 2 [STP6(tns-S16)].
Now this one here looks a little bit off, let‟s have a look at the numbers
a add b is fifteen point seven and c is nineteen so this one is a little bit
off – it is not a right angled triangle, it doesn‟t quite work.
[STP6(Trans)]
Tim then selected a screen this did not appear to satisfy the initial task instruction,

How does a multi-representational mathematical ICT tool mediate teachers‟ mathematical and
pedagogical knowledge concerning variance and invariance?
Chapter 6 Introducing the teachers and analysing their mathematics lessons
152
i.e. that the value of a and the value of b should sum to give the area
measurement of c, but did appear to work visually in that it appeared that the
central triangle was right angled (Figure 6-10).
Figure 6-10 Student’s handheld screen showing a response to Task 2 [STP6(tns-
S20)].
This one, we‟ve got a add b... doesn‟t quite make c either, but yours
kind of works the other way round, if we look at this square here, that‟s
five, and this square here is about nineteen and five and nineteen is
about twenty four-ish and that‟s twenty four – So yours works a
different way around – whoever this one is. [STP6(Trans)]
Tim selected two more examples and spoke his thoughts out loud to reason through
the calculation of the sum of the measured areas to verify whether they did or did
not meet the initial task constraint He then asked the students to make a
conjecture by saying, ‘So what do you think we are learning from this then? What
do you think we are noticing about the ones that work and about the ones that
don’t work?’ [STP6(Trans)].
The following dialogue ensued:
Student: The more the equaller they get then... you know...
Tim: The more the equaller they get then you know – okay
would you like to say that mathematically?
Student (M): They‟ve all got a right angle in them
Tim: They‟ve got a right angle in them – So if the two small
areas make the bigger area...
Student (M): [interrupted] it makes a right angle
Tim: You get a right angled triangle. Okay, so that‟s what
we‟re learning here if the two smaller areas of our

How does a multi-representational mathematical ICT tool mediate teachers‟ mathematical and
pedagogical knowledge concerning variance and invariance?
Chapter 6 Introducing the teachers and analysing their mathematics lessons
153
squares make the bigger area then we it‟s a right angled
triangle. If it‟s a right angled triangle then the two
smaller areas - of the squares - make…
Student (F): [interrupted] the biggest area.
Tim: the biggest area.
Tim then set Task 3 to the students (see page 147), asking them to move to the
next page in the file and he spent a few minutes encouraging them to notice what
was different about this page. These differences were concerned with the layout of
the screen, for example a calculator page had been included on the right hand side;
and the nature of the geometric figure itself. The construction of Task 3 differed in
that the triangle had been constructed to remain right-angled when transformed by
dragging and there was no square constructed on the hypotenuse of the triangle.
Tim then said,
Now, move that [TP gestured to the triangle] if you want to, when
you‟ve settled somewhere we‟re trying to find how long all of the lengths
are here. So we‟ve got the length of the sides, okay? I want you to try
to figure out, write it down if it helps you, how long each side is on
everything. [STP6(Trans)]
He gave out paper on which the students were asked to record their work and ‘Any
working out that you do, write that down as well. Okay? That will be really helpful –
put the detail of your working out and thinking and how you know what it is’
[STP6(Trans)] and allowed them five minutes to work on Task 3, which was the
only time remaining in the lesson. In this time he also showed the students how to
move to the Calculator part of the page in case they needed to use it and
encouraged them to record their thinking on paper. At no time did he suggest to
any students how to solve the problem, by intimating any strategy or mentioning
any linked mathematical ideas such as using the square root function on the
handheld to find the lengths of the sides of any of the squares from its given area.
Most students began Task 3 by transferring their own selected diagram from the
handheld screen onto paper, and one student added the two given areas to give the
area of the square of the hypotenuse. However, Tim concluded the lesson abruptly
when the end of lesson bell sounded. Before the students left the classroom, he
asked the students to respond in writing to two requests, ‘to write down they key
facts that you learned today in mathematics – something mathematical that you
learned today’ and ‘I want to know anything about how seeing everyone’s work on
the screen affected your learning in any way’ [STP6(Trans)].

How does a multi-representational mathematical ICT tool mediate teachers‟ mathematical and
pedagogical knowledge concerning variance and invariance?
Chapter 6 Introducing the teachers and analysing their mathematics lessons
154
6.2.2.2 An analysis of the lesson activity
What follows is an analysis of the lesson using the three strata suggested by Pierce
and Stacey’s framework, namely the task layer, the classroom layer and the
subject layer, as a means to describing the pedagogical opportunities afforded by
the technology.
6.2.2.2.1 The task layer
Tim’s lesson strongly evidenced an activity for which the use of the technology
brought about improved speed, access and accuracy, as described by Pierce and
Stacey’s definition of the pedagogical opportunities that mathematics technology
brings to the design of activities. Central to Tim’s design of the main activity of this
lesson (Task 2) was the intention to explore the regularity and generality of the
mathematical context provided by a dynamic construction of squares on each of the
sides of a triangle. In this task he had interpreted the notion of the variables a, b
and c as the registers of memory of the measured values of the areas of the
squares. Tim was explicit in directing the students to change the various
parameters within each of the environments, by the dragging of free vertices, with
a view to students arriving at their own example that satisfied the constraint that
the sum of the two areas labelled a and b should equal the measured value of the
area labelled c.
In preparation for the main task, Tim had included an initial task, which presented
a lower level of mathematical challenge for the students but offered them the
opportunity to familiarise themselves with some of the pre-requisite
instrumentation skills. These included locating and opening the relevant pre-
constructed file on the handhelds, moving between the pages of the file and
selecting and dragging vertices of shapes. However, Tim’s choice of the initial task
was intentional in that there were a number of interesting strategies possible that
could lead to its successful completion.
There is a sense in which this task could be interpreted as requiring students to
work with real data in that the area measurements (and subsequent calculations)
that they were observing were unique to each student and could appear to be
‘messy’. For example, the number of decimal places displayed was floating and,
depending on the vertex the students chose to drag, up to two area measurements
could vary simultaneously.
Tim set a very strong expectation that the students would arrive at their own
interpretations of the generality under exploration. The analysis of the lesson

How does a multi-representational mathematical ICT tool mediate teachers‟ mathematical and
pedagogical knowledge concerning variance and invariance?
Chapter 6 Introducing the teachers and analysing their mathematics lessons
155
transcript evidenced that, on five separate occasions during the whole class
discourse, he was encouraging the students to focus on aspects of the similarity
and difference between the properties of the central triangle when the areas of the
two smaller squares did or did not sum to equal the area of the third square. Early
on in this discourse, Tim introduced the notion of ‘it not quite working yet’ to
describe a student’s screen where the condition was not met and later on in the
discourse, Tim explicitly asks the students to focus on ‘the ones that work’
[STP6(Trans)].
There was evidence that the students needed to engage with and link multiple
representations, particularly within Task 2 as indicated by the instrument utilisation
scheme (Figure 6-11).
Figure 6-11 The Instrument Utilisation Scheme map for Tim’s ‘Pythagoras
exploration [STP6].
The activity was completely mediated by the technology and, as the IUS shows, the
students’ interactions relied on them being to observe and make connections
between the different representational outputs. This was in part due to the design
of the activity whereby it was not totally clear which of the measured values (and
subsequent calculations) displayed on the screen referred to which of the squares.
Consequently the students needed to connect the increasing and decreasing sizes
of the geometric squares with the relevant increasing and decreasing measured
values.
Task 3 could be interpreted as a genuine attempt to assess the transferability of the

How does a multi-representational mathematical ICT tool mediate teachers‟ mathematical and
pedagogical knowledge concerning variance and invariance?
Chapter 6 Introducing the teachers and analysing their mathematics lessons
156
students’ newly-acquired knowledge to an associated problem, whereby they were
asked to solve a more traditional Pythagoras style question in an attempt to
scaffold by-hand skills.
6.2.2.2.2 The classroom layer
The analysis of Tim’s lesson for the aspects that described opportunities for the use
of the technology to change the social dynamics of the classroom and its didactic
contract revealed some very strong evidence.
Throughout the lesson, Tim was highly explicit in suggesting expectations of how
his students should be engaging with the use of the technology. Some of these
expectations referred to suggested changes in the social dynamics of the
classroom, such as: the public sharing of the individual students’ handheld screens;
student exploration of each of the environments by dragging; that the students
would be working together, with the teacher’s support, to arrive at a shared
understanding of the mathematics under scrutiny. In addition, the acceptance by
Tim of a number of spontaneous comments by students during the lesson, which
had been prompted by their interactions with the technology, also suggested that in
Tim’s classroom each student’s experience was highly valued. For example, one
student spoke out freely to share his difficulty in selecting and dragging a vertex.
The way in which Tim selected and promoted what he described as ‘interesting
screens’ as a means to reviewing particular solution strategies, also implied an
emerging change to the social dynamics of the classroom. For example, the
following dialogue occurred during the whole-class discourse concerning the initial
task, in which the students were trying to make the areas of three given dynamic
squares equal to each other. Tim had asked the class to focus on one student’s
response as shown in Figure 6-12.
Figure 6-12 Student’s handheld screen showing a response to Task 1 [STP6(tns-
s13)].

How does a multi-representational mathematical ICT tool mediate teachers‟ mathematical and
pedagogical knowledge concerning variance and invariance?
Chapter 6 Introducing the teachers and analysing their mathematics lessons
157
Tim: I quite like this one [Tim gestured to screen S13] - this is
interesting – whose is this one?
Sophie: Megan‟s
Tim: What‟s Megan done to make all three the same? Sophie,
what‟s Megan done to make all three the same?
Sophie: Put them on top of each other.
Tim: Put them on top of each other – How clever is that? Put
them on top of each so that it‟s quite clear that they are
the same – it‟s slightly off - but to put them on top of
each other a very, very good idea – to make them the
same size as each other.
The students’ responses to Tim’s request for them to produce a written comment
about the way in which their experience of the classroom network and how the
shared display had affected their learning prompted an intuitive set of responses,
which also evidenced the sense of a changed classroom dynamic. All of the
students responded positively, with the emerging ideas relating to their increased
awareness of: how to begin the activity; alternative strategies to solve the activity;
their own progress relative to their peers; an awareness of correct and incorrect
solutions. One student commented that she ‘could compare my work with others -
it showed how my work was better’ [STP6(Eval-s21)]. This could be interpreted as
suggesting that this students’ view of success in mathematics incorporated a sense
of competition with her peers or alternatively, evidence of her increased self-
esteem as she was able to validate her responses alongside those of her peers. The
lesson transcript revealed that this student had volunteered her handheld screen
response to Task 2 to the teacher and it became the subject of the whole class
discourse, with the teacher validating it as a successful response. Only one student
mentioned that ‘The screen helped my[sic] by copying other people's work’
[STP6(Eval-S21)], which came from the student who had experienced difficulties
selecting and dragging vertices during Task 1, and was therefore slow in getting
started. On reviewing this particular student’s final outcomes, it was apparent that
he had managed to find successful solutions to both Task 1 and Task 2.
With respect to the renegotiation of the didactic contract between teacher and
students in this lesson, as a result of the use of the technology, there were a
number of notable instances. This lesson was the first occasion for all of the
students in which they had experienced a shared learning space, the constituent

How does a multi-representational mathematical ICT tool mediate teachers‟ mathematical and
pedagogical knowledge concerning variance and invariance?
Chapter 6 Introducing the teachers and analysing their mathematics lessons
158
parts of which were their own responses to a common activity, displayed through
their handheld screens. The process through which Tim set his expectations of how
they would engage with this new environment as a class was made clear to the
students in a number of ways. As previously mentioned, Tim had told the students
that they were going to be ‘doing something very different today’, which could
actually have referred equally to the use of the classroom network and public
display as it could to the use of the handheld devices, or the particular use of the
MRT. Tim chose to display the whole class screen capture view publicly from the
outset of the lesson. He did not comment on this decision to the students, nor did
the students make any unprompted remarks about it – it just happened! The
consequence of this was that Tim had begun to set the precedent for how this sort
of lesson would be conducted through the subtle use of language when he
addressed the students, such as always referring to the class as ‘we’, and by
focussing on particular students’ handheld screens during the whole class discourse.
In return, the students were beginning to learn the rules of this new game, and
were very quick to appreciate and keen to volunteer their own contributions to the
classroom discourse.
6.2.2.2.3 The subject layer
Within Pierce and Stacey’s framework, the ‘subject layer’ describes the pedagogical
opportunities that concern: the exploitation of the contrast between ideal and
machine mathematics; a rebalancing of the emphasis on skills, concepts and
applications; building metacognition and overview in mathematics. The analysis of
Tim’s lesson offers a rich example of the way in which this particular MRT and the
classroom system, which facilitated the shared learning space, provided evidence in
all three of these areas.
Within Tim’s mathematical example, the notion of ‘ideal’ mathematics concerned
the important generalisation that, ‘if and only if’ a triangle contains a right angle,
the sum of the areas of squares constructed on the two smaller sides will equal the
area of a square constructed on its hypotenuse. This expression of Pythagoras’
theorem suggests a broader interpretation than the traditional one, which makes an
initial assumption that the triangle is right angled. Consequently, what is becoming
a ‘traditional’ approach for the use of technology tends to constrain students to only
exploring cases concerning right angled triangles. In this respect, it could be argued
that Tim’s ‘ideal’ mathematics involved providing his students with an opportunity
to construct a broader knowledge within an appropriate mathematical environment.
However, in doing so, a number of tensions came into play with respect to the

How does a multi-representational mathematical ICT tool mediate teachers‟ mathematical and
pedagogical knowledge concerning variance and invariance?
Chapter 6 Introducing the teachers and analysing their mathematics lessons
159
‘machine mathematics’. The issue of numerical equality presented an underlying
tension throughout the lesson for both the teacher and the learners. Although Tim
did not explicitly say to the students that they might experience difficulty in finding
situations within tasks 1 and 2 when the required values were exactly equal, he
implied in his choice of language that this might be unachievable. For example, in
posing Task 1, he instructed the students to try to get all three area measurements
‘the same, or as close as you can get them to be the same as each other’
[STP6(Trans)] and during Task 2 Tim gave validity to students responses that were
almost equal by describing them as ‘kind of alright’ and ‘close’ [STP6(Trans)]. By
doing this, Tim was suggesting to his students what would be an acceptable
interpretation of equality within the context of the activity they had been set.
A second underlying tension, which Tim did not seem to have noticed, related to
the potential conflict over his choice of algebraic labelling for this problem. He used
the letters a, b and c as registers of memory for the measured values of the areas
in each task and, although it was obvious to the students that these values were
varying as vertices were dragged, the presence of the letters, and the obvious
connections with students emergent understanding of algebraic representation, was
not commented upon by Tim or his students. There was little likelihood of the
students experiencing any cognitive conflict with respect to the traditional
representation of Pythagoras’ theorem as a2 + b2 = c2 as this was an introductory
lesson for them, however it did not appear that Tim had considered that this might
present a problem to them in the future.
The design of this activity offered a mathematical experience to students that would
be very hard to conceive without the technology. As an exploratory activity, it was
attempting to focus upon the students’ conceptual understanding of the properties
of triangles and the particular case of the area properties of squares constructed on
the three sides. Without the constraints of the English mathematics curriculum this
could lead into further exploration of the relationships between the areas of the
squares for particular non right angled triangles, or allow for the construction of
alternative polygons, other than squares. Tim’s privileging of the use of a dynamic
technological tool in this way could be seen as an attempt to promote students’
exploratory work within the mathematics curriculum. However, in order to
comment upon if (and how) Tim built on the students’ experiences in this lesson,
such that they could connect it with the related skills for the application of this
knowledge to new, related problems, it would be necessary to observe how this
lesson was situated within subsequent lessons on this mathematical topic.

How does a multi-representational mathematical ICT tool mediate teachers‟ mathematical and
pedagogical knowledge concerning variance and invariance?
Chapter 6 Introducing the teachers and analysing their mathematics lessons
160
Pierce and Stacey’s definition of the use of technology in order to ‘build
metacognition and overview’ is exemplified by providing students with a ‘birds-eye
view’ of the topic or by ‘encapsulating a multi-step process by a single command’
(Stacey, 2008). Within the context of Tim’s lesson, the sense of a ‘birds-eye view’
related to Tim’s decision to allow students to initially explore the more global
situation of ‘any’ triangle, prior to focussing in on the particular situation for right-
angled triangles.
6.2.3 Evidence of a hiccup
The analysis of this lesson led to the identification of five hiccups, which were
broadly classified as shown in Figure 6-13.
Figure 6-13 Extract from Nvivo8 software showing the coded hiccups during Tim’s
‘Pythagoras exploration’ [STP6].
What follows is the detailed analysis of one of these hiccups [TP6 Hiccup2], and an
articulation of how this event may have contributed towards Tim’s situated learning
during and soon after the lesson.
This hiccup was observed during a point in the lesson when Tim was clearly
reflecting deeply on the students’ contributions to the shared learning space and
‘thinking on his feet’ with respect to responding to these. It coincided with his
observation of an unanticipated student response. The chosen hiccup, which was
previously mentioned on page 152 (see Figure 6-10), came about when a student
had found a correct situation for Task 2, that is the two smaller squares’ areas
summed to give the area of the larger square, but the situation did not meet Tim’s
activity constraint of a + b = c.
Tim commented about this in his personal written reflection after the lesson,
One student had created a triangle for which a+b did not equal c, but (I
think) a+c=b. This was also right angled. This was an interesting case
because it demonstrated that the „order‟ did not matter... when the sum
of the smaller squares equalled that of the larger square, then the
triangle became right angled. [STP6(Journ)]

How does a multi-representational mathematical ICT tool mediate teachers‟ mathematical and
pedagogical knowledge concerning variance and invariance?
Chapter 6 Introducing the teachers and analysing their mathematics lessons
161
Tim revised the TI-Nspire file after the lesson, providing some convincing evidence
of his learning as a result of the use of the MRT. Tim gives an insight into his
learning through his suggestions as to how he thought that some of these
perceived difficulties might be overcome by some amendments to the original file.
Opening screen Revisions to the construction of
the environment
Figure 6-14 Tim’s revised TI-Nspire file
for Task 1 [STP6(tns-T)v.2]
Task 1 (revised): The squares whose
areas were previously represented by
‘a’ and ‘b’ have been lightly shaded and
the square represented by the area
measurement ‘c’ has been darkly
shaded.
Figure 6-15 Tim’s revised TI-Nspire file
for Task 2 [STP6(tns-T)v.2]
Task 2 (revised): The shading from
Task 1 has been replicated and Tim
also added an angle measurement for
the angle that is opposite the side that
was intended to represent the
hypotenuse.
Table 6-2 Tim’s revisions to the .tns file for the activity ‘Pythagoras exploration’
[STP6].
Both of these amendments to the original file suggest that Tim wanted to direct the
students’ attentions more explicitly to the important representational features. He
wanted to enable the students to connect the relevant squares to their area
measurements and ‘notice’ more explicitly the condition that when the condition for
the areas was met, the angle opposite the hypotenuse would be (close to) a right
angle. This seemed to suggest that Tim was still trying to overcome the inherent
difficulty when using mathematical software concerning the display of measured
and calculated values in the hope that students would achieve an example where
the areas were equal and the measured angle showed ninety degrees. This seemed
to suggest a conflict with his earlier willingness to try to encourage his students to

How does a multi-representational mathematical ICT tool mediate teachers‟ mathematical and
pedagogical knowledge concerning variance and invariance?
Chapter 6 Introducing the teachers and analysing their mathematics lessons
162
accept an element of mathematical tolerance when working with technology with
respect to the concept of equality.
Finally, Tim did raise the concern that, in his design of Task 2, ‘Some students
struggled to get the areas of the two smaller squares to equal the area of the larger
square, and this was probably because there was ‘too much’ possible variation here
for them to be comfortable with’ [STP6(Quest2)]. This provided further evidence for
Tim’s reflections in relation to the aims of this study, and focuses on one of the key
areas of both pedagogic and mathematical knowledge construction for teachers
learning to use MRT for the classroom.
6.2.4 How is the description of the lesson activity informed by the
theoretical underpinning?
This study aimed to articulate more deeply the nature of, and processes involved
in, teachers’ learning as they introduced the MRT into their classroom practices. The
identification and analysis of the classroom hiccup, and the identification of Tim’s
subsequent associated actions, provided evidence of his possible situated learning
in relation to the use of the MRT in privileging students’ explorations of variance
and invariance. This learning was related to the following.
The decision to use the MRT for this activity and display the students’ results
publicly resulted in an unanticipated student’s responses becoming the focus
within the classroom discourse. Consequently, Tim was prompted to develop
a new repertoire of dialogue in response to this classroom experience that
acknowledged the student’s correct response within a wider mathematical
sense.
The construction of the MRT environment and the way in which its
appearance would support students to notice the variant and invariant
features. This included design decisions such as adopting a more subliminal
approach to the labelling of objects by using shading. Tim’s decision to
‘rename’ the squares as lighter or darker gave him an alternative means to
refer to them, which avoided the need to know which square was ‘a’ and
which square was ‘b’. The important focus was the sum of the area
measurements of the two lighter squares.
The inclusion of the angle measurement seemed to be in response to Tim’s
perception that he needed to focus the students’ attentions more explicitly
on the significance of the angle measurement itself, rather than relying on
their awareness that the angle appeared to be a right angle.

How does a multi-representational mathematical ICT tool mediate teachers‟ mathematical and
pedagogical knowledge concerning variance and invariance?
Chapter 6 Introducing the teachers and analysing their mathematics lessons
163
In developing his original instrument utilisation scheme for this activity Tim had not
envisaged the scenario of the student response that led to this lesson hiccup. Tim
was confident in his subject knowledge and he knew that, if the central triangle
appeared to contain right-angle, the resulting student’s screenshot must be an
instance of Pythagoras’ theorem, irrespective of the on-screen measurements and
calculations. Consequently, he did not dismiss the screen as an incorrect response
but sought to validate it from a wider mathematical perspective.
The analysis of this one lesson hiccup has provided an insight into the relationship
between Tim’s situated learning in the classroom and the potentially more
epistemic learning as evidenced by his direct actions in redesigning the activity. It
was anticipated that the close analysis of all of the lesson hiccups experienced by
Tim during the second phase of the study would offer a valuable source of data
from which to hypothesise the trajectory of his situated learning over the period of
the study. The identification and analysis of all of Tim’s potential lesson hiccups for
each activity is detailed within Appendix 9 and the summary of Tim’s learning
trajectory is provided in Chapter 7.
6.3 Introducing Eleanor
Eleanor had qualified in 1987 with an ordinary Bachelor of Education degree in
mathematics (11-16) from West Sussex Institute of Education and was in her early
forties. She did not explicitly mention any particularly memorable experiences of
using technology during this period. Eleanor recollected being involved in a project
in her first few years of teaching that had involved handheld technology but
commented that ‘it all seemed a bit of a blur’. She said that she had ‘dipped in with
the use of Texas graphics calculators for many years’ and that she was ‘confident
with most aspects but not so with the statistical side’. Eleanor thought that she
tended to use technology ‘as prescribed by someone else’ and that she was ‘not so
confident in designing handheld based activities’ [CELQuest1)].
For the duration of the study, Eleanor was the head of mathematics at Coastway
School, a voluntary aided school for girls aged 12-16 years in a coastal town in
southern England. The vast majority of the girls in the school were of white British
heritage and had English as their first language. The girls had consistently achieved
significantly above the national expectation in the GCSE examinations at age
sixteen and the school was judged to be outstanding at its last external school
inspection in 2007. The school was designated as a Technology College in 1999.
As a technology college the school was well-resourced and, in addition to several

How does a multi-representational mathematical ICT tool mediate teachers‟ mathematical and
pedagogical knowledge concerning variance and invariance?
Chapter 6 Introducing the teachers and analysing their mathematics lessons
164
class sets of graphical calculators, the department also had its own half-suite of
computers with access to a full range of mathematical software. Access to the
computer suite was organised via a departmental timetable, which ensured
equitable weekly access to all classes. Eleanor had an interactive whiteboard and
data projector in her classroom and her own laptop, which she plugged into the
school network when she was teaching. When asked about her own personal
confidence with ICT for mathematics and whether she had any particular favourite
resources, she commented that she ‘enjoyed the geometry of GSP6, although (I)
feel weak in using this’ and that she ‘enjoyed the graphing elements of handheld
technology’ [Journ].
6.3.1 Eleanor’s participation during Phase One
At the beginning of the project, Eleanor worked with her school colleague to design
and plan activities and, as they both taught classes in year 8, they decided to focus
on the teaching of a particular unit of work that focused on geometry. However, her
colleague taught the most able students and Eleanor taught the least able students
within the year group. Eleanor’s first two activities closely replicated established
paper and pencil approaches7. Towards the end of the first phase of the project
Eleanor devised a lesson (CEL5) using the MRT for her more able group of 14-15
year olds. Eleanor privileged numeric and geometric representations in her early
activity designs although she did involve syntactic inputs in the activity [CEL5].
The detailed description and analysis of Eleanor’s activities using the MRT during
the first phase is provided in Appendix 7. Each activity was analysed using the IUS
map (Figure 5-2) such that the flow of representational forms was made explicit.
The individual IUS maps were overlaid and Figure 6-16 shows diagrammatically the
different input and output representations that Eleanor used during the first phase
and her associated instrument utilisation schemes.
6 The Geometer’s Sketchpad software
7 The second of these activities [DCH2] was described in detail in Section 4.3.4 (see Figure
4-1 and Figure 4-2).

How does a multi-representational mathematical ICT tool mediate teachers‟ mathematical and
pedagogical knowledge concerning variance and invariance?
Chapter 6 Introducing the teachers and analysing their mathematics lessons
165
Figure 6-16 The summary of Eleanor’s Instrument Utilisation Schemes produced
from the analysis of her Phase One lesson data.
The first phase of the study revealed the following aspects of Eleanor’s trajectory of
development:
Her activity designs had moved from being totally static to involving
dynamic actions as an integral part of the conjecturing process.
There was a shift in her pedagogic approach to include more of an explicit
focus on the invariant and variant properties within activities.
Her confidence to adapt activities devised by others to align more closely to
her personal pedagogical philosophy had grown.
She had begun to design TI-Nspire files for herself from a blank new file.
Her activities were beginning to involve several different mathematical
representations in a considered way.
6.3.2 Observing Eleanor in the classroom – The lesson introducing
simultaneous equations
Following my decision to select Eleanor as one of my two case studies for further
research, I arranged to observe a series of one hour lessons that she was planning
for her higher achieving Year 9 students (girls aged 14-15 years), which would
introduce them to the concept of simultaneous linear equations. These students
were following the key stage 3 programme of study and Eleanor had assessed that

How does a multi-representational mathematical ICT tool mediate teachers‟ mathematical and
pedagogical knowledge concerning variance and invariance?
Chapter 6 Introducing the teachers and analysing their mathematics lessons
166
they were currently working at National Curriculum level 7.
Prior to us meeting to discuss the planning of the lessons in more detail we
exchanged emails and Eleanor commented,
„I‟ve not used handhelds to introduce s.e. before, so a graphical
approach is new to me. I usually talk about something like 2x + 4 = 6,
what‟s x? then x + y = 6, what‟s x and y, eliminating one variable, then
show process of solving s.e.. Obviously using nspires means solving only
types that are y =, whereas I usually go to x+y types.‟ [Journ]
From this brief reply I was not entirely sure whether she had used other technology
to introduce simultaneous equations and that it was an approach with the
handhelds that was new. However a later conversation confirmed that it was not a
topic with which she had previously used technology. Eleanor and I met a few
weeks before the planned lessons and we talked about her usual introductory
approach alongside a wider discussion of the topic, which included a consideration
of its inherent mathematical ideas and the role that different representational forms
might play in supporting her students to gain a more holistic understanding.
Eleanor settled on a pedagogic approach that she had learned about from another
teacher in the T3 network. This took the point of intersection as the initial premise,
and ask the students to create linear functions that passed through the given point
and would lead to the students generating ‘families’ of linear functions that
contained the point as a common solution. Following our discussions Eleanor
prepared the associated lesson plan, Smart Notebook file and the TI-Nspire file for
the lesson (See Appendix 12). The detailed lesson analysis was completed for the
second of the sequence of three lessons and, to support the contextualisation of the
selected lesson, a brief summary of the first lesson is provided.
During the first lesson, Eleanor had begun by posing a mathematical problem
concerning a scenario from her own real-life, which took place in a coffee shop in
which the price of the purchased items was unknown (see Figure 6-17).

How does a multi-representational mathematical ICT tool mediate teachers‟ mathematical and
pedagogical knowledge concerning variance and invariance?
Chapter 6 Introducing the teachers and analysing their mathematics lessons
167
Figure 6-17 The opening page of Eleanor’s Smart Notebook file displayed to the
students to introduce the activity. [CEL9(LessStruct)]
Eleanor gave the students a few minutes to try to solve the problem both orally and
using paper and pencil before informing them that, by the end of the forthcoming
sequence of lessons, they would learn a number of different strategies for solving
similar problems. She took some suggested answers from the students (all
incorrect) but did not resolve the observable student discomfort by offering a
correct solution to this problem.
Eleanor then wrote the coordinate pair (3,6) on her ordinary whiteboard. She gave
the students a few minutes to discuss amongst themselves how many lines might
pass through that point and then, gesturing to the three and the six, asked them to
make up their own ‘rule that connects those two numbers’ [CEL9(Trans)].
Noticeably, she gave no indication to the students with respect to how they should
express their rules. The students typed their rules into the handhelds and sent
them to Eleanor’s computer using the quick poll functionality. These results were
displayed, revealing a range of different numeric, syntactic and text responses
which Eleanor discussed with the group before resending the poll so that the
students could revise their first response. The second poll occurred less than two
minutes before the end of the lesson and by the time Eleanor had displayed the
students’ responses for public view, she had only had a limited opportunity to
absorb the multiple responses. The lesson ended abruptly when the school bell
sounded.
After the lesson, Eleanor and I had a brief discussion in which she said that she
planned to begin the next lesson by redisplaying the results of the poll and holding
a whole class discussion about the students’ responses. Consequently, we saved
the image of this poll onto her laptop. What follows is the detailed description and
How does a multi-representational mathematical ICT tool mediate teachers‟ mathematical and
pedagogical knowledge concerning variance and invariance?
Chapter 6 Introducing the teachers and analysing their mathematics lessons
168
analysis of the next lesson.
The lesson was observed, audio recorded and the students’ TI-Nspire files were
collected at three points during the lesson to coincide with occurrences of whole
class discussion. Where possible, I also saved an image of the class computer
screen when it was the topic of the classroom discourse providing it did not cause
an unnecessary interruption.
6.3.2.1 A description of the lesson activity
Eleanor had planned the lesson conscientiously and had prepared a formal written
lesson plan [CEL9(Plan)], a set of Smart Notebook pages [CEL9(Struct)] and a TI-
Nspire file [CEL9(tns-T)]. In her lesson plan she had identified her lesson
objectives to be,
To find linear equations that have one common solution and to explore
the mathematics behind these common factors. [CEL9(Plan)]
She further expanded on this by explicitly stating that the students would,
…explore the intersection of linear equations graphically as a means of
an introduction to simultaneous equations and to explore how the Nspire
technology can enable us to do this. [CEL9(Plan)]
The lesson contained three distinct episodes which centred on the use of the MRT
technology and the descriptions of each of the associated environments are
provided in Table 6-3.

How does a multi-representational mathematical ICT tool mediate teachers‟ mathematical and
pedagogical knowledge concerning variance and invariance?
Chapter 6 Introducing the teachers and analysing their mathematics lessons
169
Opening screen Description of the construction of
the environment
Figure 6-18 The image of the students’
responses to Eleanor’s initial poll [CEL9(Image1)]
Episode 1: The screen capture of the
students’ responses to Eleanor’s
request for a ‘rule that connects those
two numbers’ when referring to the
coordinate pair (3,6) [CEL9(Trans)].
This poll had been conducted at the
end of the first lesson.
Figure 6-19 The opening screen of the .tns file for the activity ‘Crossing linear graphs’
[CEL9(tns-T)page2]
Episode 2: Eleanor’s TI-Nspire file
constructed prior to the lesson on
which a single coordinate point (3,6)
had been constructed on a Cartesian
graphing plane.
Figure 6-20 A close-up of four students’ handheld screens showing their responses
to the activity [CEL9(ScreenCapt)].
Episode 3: The third teaching
episode focused on the whole class
discourse concerning the screen
capture of the students’ responses to
the previous activity. A sample of the
students’ handheld screen captures
are shown in Figure 6-20.
Table 6-3 [CEL9] The lesson episodes
Eleanor began the lesson by displaying the results of the quick poll, which she had
conducted at the very end of the previous lesson but had found herself with

How does a multi-representational mathematical ICT tool mediate teachers‟ mathematical and
pedagogical knowledge concerning variance and invariance?
Chapter 6 Introducing the teachers and analysing their mathematics lessons
170
insufficient time with which to discuss the outcomes with her students in the way
that she had envisaged (see Figure 6-21).
Figure 6-21 The image of the students’ responses to Eleanor’s initial poll which
asked for a ‘rule that connect the two numbers’ within the coordinate pair (3,6)
[CEL9(Image1)].
Eleanor reopened the discourse by saying,
Eleanor: Alright yesterday, towards the end, I did a „quick poll‟
and got you thinking about what rule you could come up
with connecting, three and six. Okay? And the most
common one that was spoken about was double that one
[Eleanor gestured to the three, written on the
whiteboard]. Okay? And what we started to do… which is
why I've brought this screen up here… is to look at… oh
most of you were using x and y… Why did we start using
xs and ys? What was it about these numbers?
Student: Because of the axes?
Eleanor: Because of the axes, okay? Because of the axes, what
else? What about this and this [Eleanor gestured to the
brackets] what does that help with that... to do with the
three and six? It is to do with the axes? Which is x?
Which is y?

How does a multi-representational mathematical ICT tool mediate teachers‟ mathematical and
pedagogical knowledge concerning variance and invariance?
Chapter 6 Introducing the teachers and analysing their mathematics lessons
171
Student: Three is x, six is y
Eleanor: Okay? How come we ended up using x and y? Some of
these [Eleanor gestured to the poll answers on screen],
do they all work? At the end of last lesson... the first one,
I think we all realised. Does this work? three y… does it
equal to two xs?
Eleanor spent the next five minutes focusing on selected students’ responses and
asking the class to reason whether they ‘worked’ within the context of the activity
they were set. During this sequence, the dialogue did not include words such as,
expression, equation, function, substitute or graph. Eleanor’s emphasis was reliant
on the students noticing the invariant property that when the values x=3 and y=6
were substituted into a selected poll response, it resulted in an equality.
The second main teaching episode of the lesson commenced when Eleanor sent the
students the TI-Nspire file ‘Crossing linear graphs’ [CEL9(tns-T)]. She
simultaneously displayed the page shown in Figure 6-22 from her own handheld
device to the class using the ‘live presenter’ mode.
Figure 6-22 The opening screen of the .tns file for the activity ‘Crossing linear
graphs’ [CEL9(tns-T)page2]
She instructed the class,
Eleanor: I want you now to draw a linear graph that will go
through that point… which is at what? What's that point
at Stacey? What's that point at?
Stacey: three six
Eleanor: I now want you to draw a graph that goes through three
six.
Eleanor proceeded to talk the students through the instrumentation process to draw
a function within the graphing application and, having chosen the function f1(x) =

How does a multi-representational mathematical ICT tool mediate teachers‟ mathematical and
pedagogical knowledge concerning variance and invariance?
Chapter 6 Introducing the teachers and analysing their mathematics lessons
172
2x as her example, produced the following graph.
Figure 6-23 Eleanor’s handheld screen after she had demonstrated how to enter the
function f1(x)=2x within her introduction of the activity ‘Crossing linear graphs’
[CEL9(tns-T)page2]
Eleanor then set the following activity for the students,
Right, I want you to come up with… I've got on my notes that I want
you to come up with ten different ones... I think for the moment we‟ll go
for four? Do you reckon? But I don't want you to put two x in yours...
See if you can come up with at least four... You've got paper in front of
you if you need to put anything down okay? Control G will get you on
and off that bottom bar. [CEL9(Trans)]
As the students began to work on this task, Eleanor changed the class display to
publicly show the screen capture view of the students’ handheld screens, which was
set to automatically refresh every thirty seconds. The students then worked on this
challenge for just under ten minutes and, during this time, Eleanor moved around
the room to support and respond to the students’ questions. These included
questions such as ‘Can we try... Can we do two x plus one minus one?’ and ‘I want
to get a line straight up?’ [CEL9(Trans)].
This period of working was interrupted when Eleanor, on noticing Eloise’s handheld
screen display, made the comment, ‘Eloise has got quite a few there’
[CEL9(Trans)]. Making reference to Eloise’s screen (see Figure 6-24), when one of
the students posed the question ‘How did she do it’ Eleanor reposed the question to
Eloise and invited Eloise to give her explanation to the class.

How does a multi-representational mathematical ICT tool mediate teachers‟ mathematical and
pedagogical knowledge concerning variance and invariance?
Chapter 6 Introducing the teachers and analysing their mathematics lessons
173
Figure 6-24 Eloise’s response to the activity ‘Crossing linear graphs’ [CEL9(tns-S)].
Eloise responded by reading out her list of entered functions (shown in Figure
6-25), which Eleanor recorded on the ordinary whiteboard. There was no discussion
of these functions and Eleanor did not ask Eloise to explain her reasoning with
respect to how she had generated them.
Figure 6-25 Eloise’s functions, entered in response to the activity ‘Crossing linear
graphs’ [CEL9(tns-S)].
Eleanor invited the class to contribute ‘any other graphs that are different to those
ones’ resulting in several students’ names being mentioned by the class. These
included Rosie and Emily and their handheld screens are shown in Figure 6-26 and
Figure 6-27.
Figure 6-26 Rosie’s response to the
activity ‘Crossing linear graphs’
[CEL9(tns-S)].
Figure 6-27 Emily’s response to the
activity ‘Crossing linear graphs’
[CEL9(tns-S)].
Eleanor took an additional contribution from Rosie, ‘nine x minus twenty-one’ and

How does a multi-representational mathematical ICT tool mediate teachers‟ mathematical and
pedagogical knowledge concerning variance and invariance?
Chapter 6 Introducing the teachers and analysing their mathematics lessons
174
dismissed Emily’s curved graph by saying, ‘I don't want to use that for this instance
yet… [pauses] it is… [pauses] I don't want to use it… [pauses] so….’, Eleanor
moved on to show the students how to include an additional mathematical
representation, the function table alongside their graph screen [CEL9(Trans)].
At this point Eleanor appeared flustered, saying ‘Girls I need you to concentrate
because we're looking backwards, this is a different way of looking at this’ before
leading a class discourse in which, using Eloise’s handheld, Eleanor talked the
students through the instrumentation process to display the function table
alongside their graphs. She then located the value x=3 in the first column of the
table moved the cursor horizontally to enable the students to observe the
corresponding values for each of their functions (see Figure 6-28 and Figure 6-29).
Figure 6-28 Eleanor’s handheld screen displayed during her demonstration that
f1(3) = 6 [CEL(tns-T)]
Figure 6-29 Eleanor’s handheld screen displayed during her demonstration that
f2(3) = 6 [CEL(tns-T)]
There was some confusion at this point as Eleanor had omitted to give the students
the steps needed to make the function table the active application to enable them
to move between its cells.
In the final teaching episode of the lesson, Eleanor returned to the list of Eloise’s
functions that had been recorded on the ordinary whiteboard, as shown in Figure
6-30.

How does a multi-representational mathematical ICT tool mediate teachers‟ mathematical and
pedagogical knowledge concerning variance and invariance?
Chapter 6 Introducing the teachers and analysing their mathematics lessons
175
Figure 6-30 Eleanor’s whiteboard annotations during the activity ‘Crossing linear graphs’. [CEL9(Image2)]
Eleanor posed the question to the class, ‘How can I use that fact with any of these
here [Eleanor gestured to Eloise‟s functions on the board] to prove that it goes
through (3,6)?’ and the following dialogue ensued,
Student: Because… [hesitates] you… [hesitates]
Eleanor: What can I do?
Student: Errm.. because it's two x so it's.. [hesitates]
Eleanor: Go on…
Student: Because isn't like, one of them's y and one of them's x so
you know that the one that's y you just work out that if
it's going to be the same...
Eleanor: Okay you're on the right.. you're getting there... Ella?
Ella: But if you like, if you took ages and like worked them all
out like one plus three equals and then did it up to three
and you work out that all of them equal three and the
answer is six

How does a multi-representational mathematical ICT tool mediate teachers‟ mathematical and
pedagogical knowledge concerning variance and invariance?
Chapter 6 Introducing the teachers and analysing their mathematics lessons
176
Student: Yeah, that's what I mean, so if x equals three, you'll have
y equals six and then you know that for the first one
then x equals three plus three [Eleanor annotated
whiteboard] is six.
Eleanor: [to the class] Is that right? Is that right?
Students: [positively] yes, yes
Eleanor selected a second function from Eloise’s list, y = 4x – 6, saying ‘What about
this one’ and encouraged the students to reason why they could say that it
‘worked’. She completed this final phase of the lesson by saying,
So we know by looking at the algebra, we know by looking at the
algebra that it's got to be right, they've got to be right. Okay? Would y
equals two point five x work? [CEL9(Trans)]
There was a confident response of ‘No’ from the class and, when Eleanor
questioned why a student responded ‘because it wouldn’t equal six, it would
equal…[Student hesitated]… …something else’ to which Eleanor responded
‘something else?... that’ll do at this time of day [Eleanor laughed].’ Eleanor
concluded the lesson by saying,
So we know for a fact that all those graphs all go through one unique
solution which is three six. Now I want to hold that thought for
tomorrow's lesson when we're gonna work backwards. Okay? And I'll
leave that with you. [CEL9(Trans)]
The end of lesson bell sounded shortly after and the class left the room.
6.3.2.2 An analysis of the lesson activity
Adopting a similar strategy to the analysis of Tim’s lesson, I used the same three
strata from Pierce and Stacey’s framework to support the analysis of Eleanor’s
lesson with the aim to articulate the pedagogical opportunities afforded by the
technology.
6.3.2.2.1 The task layer
Eleanor’s interpretation of variance and invariance during this activity was
underpinned by the assumption that, for any of the infinite number of linear
functions that ‘passed through’ the coordinate pair (3,6), the invariant property was
the equality statement produced when the values of x and y were substituted into a
‘correct’ function. However, from the pupils perspective there was an additional

How does a multi-representational mathematical ICT tool mediate teachers‟ mathematical and
pedagogical knowledge concerning variance and invariance?
Chapter 6 Introducing the teachers and analysing their mathematics lessons
177
complexity that was inherent in their possible interpretation of invariance, which
concerned the infinite number of possible functions than could exist in the graphical
domain. This is illustrated by the student’s response to the initial activity shown in
Figure 6-31 where the student had entered fifteen functions and achieved only two
successful outcomes8.
Figure 6-31 A students’ handheld screen showing a search for linear functions
which satisfy x=3 and y=6 [CEL9(tns-S)].
The extent of this particular student’s response provides sound evidence for the
way in which the technology gave the student quick access to many accurately
drawn graphs. However, without Eleanor’s intervention it was not obvious what this
particular student was learning. At no time during the lesson did Eleanor or any
other students notice this particular screen on the classroom display.
The most striking pedagogical opportunity within this lesson related to the multiple
representations selected by Eleanor to support the mathematics under discussion.
This was stimulated from the outset by the students’ own responses to Eleanor’s
request for a rule that would connect the ‘three and the six’ within the coordinate
pair (3,6). This sequence of events that followed is illustrated in Figure 6-32.
8 This student’s response was not noticed by Eleanor during or after the lesson.

How does a multi-representational mathematical ICT tool mediate teachers‟ mathematical and
pedagogical knowledge concerning variance and invariance?
Chapter 6 Introducing the teachers and analysing their mathematics lessons
178
Figure 6-32 A diagram showing the representational route through Eleanor’s activity ‘Crossing linear graphs’ [CEL9].
The students’ replies to this question included a range of numeric, textual and
syntactic formats (see Figure 6-18 on page 169). Eleanor supported the students to
translate the most common response (y = 2x) into the syntax required by the MRT
in order to generate a linear function. Eleanor mediated this transition by saying,
‘How do I write in, to remind you, if I wanted to draw a graph of y equals two x, for
instance? So y equals is already there’ [CEL9(Trans)]. In doing so she assumed that
the device’s syntax ‘f1(x)’ was equivalent to ‘y=’ and implied that the class were
familiar with this from a previous lesson. This led to the generation of the graphical
representation, which in turn led Eleanor to make the explicit connection to the ‘by-
hand’ syntax by acting as a scribe for the students on the ordinary whiteboard.
Eleanor then introduced the tabular representation of the function values before
completing the lesson by verifying the validity of selected rules by substitution for
the coordinate pair (3,6).
6.3.2.2.2 The classroom layer
There was a clear sense that Eleanor was renegotiating elements of the didactic

How does a multi-representational mathematical ICT tool mediate teachers‟ mathematical and
pedagogical knowledge concerning variance and invariance?
Chapter 6 Introducing the teachers and analysing their mathematics lessons
179
contract within the lesson as on several occasions she shared her apprehension
with the class, which resulted from her decision to introduce simultaneous
equations by starting with the point of graphical intersection. This was exemplified
by her statement ‘Girls I need you to concentrate because we’re looking
backwards… this is a different way of looking at this’ [CEL9(Trans)]. This had the
potential to bemuse the students as they had not met this mathematics before so
would have no idea what approaching the topic forwards might look like!
In addition, the explosion of methods and increased student agency was made
public through the shared display, which prompted the students to ask their own
mathematical questions of Eleanor and each other. Indeed the path of the lesson
was triggered by Eloise’s response to the activity, something which Eleanor could
not have planned to happen in advance. Eleanor was open to the students’
suggestions where they seemed to fit with her intended lesson path. However there
was evidence from her reaction to Emily’s handheld screen (see Figure 6-27 on
page 173) of a reluctance to deviate from this path, which I probe in more detail
later in this chapter.
6.3.2.2.3 The subject layer
In our discussions prior to the first lesson, Eleanor had showed me the resource
that she had most recently been using to introduce simultaneous equations with
another class (see Figure 6-33), which was an activity from the subscription based
mathematical content provider MyMaths (Jackson and Jackson, 2010).
Figure 6-33 An extract from the ‘MyMaths’ resource which Eleanor normally used to
introduce simultaneous equations (Jackson and Jackson, 2010).

How does a multi-representational mathematical ICT tool mediate teachers‟ mathematical and
pedagogical knowledge concerning variance and invariance?
Chapter 6 Introducing the teachers and analysing their mathematics lessons
180
Having reviewed this traditional approach, which would also be found in many text
book schemes, it was apparent that by adopting a graphical starting point, Eleanor
was reordering her teaching of the topic as a direct result of the functional
opportunity that the technology had afforded. However, this decision brought some
tensions into existence for Eleanor concerning the transition to the sorts of
problems the students would be subsequently asked to solve within the formal
examination setting. Eleanor articulated this by saying ‘Obviously using nspires
means solving only types that are y equals whereas I usually go to x plus y equals
types’ [Journ]. This discussion led to Eleanor’s decision to plan a series of lessons,
the aim for which was to provide the students with a meta-level view of the concept
of simultaneous equations before they moved towards the more pragmatic ‘drill and
practice’ questions.
Within the lesson, there were times when TI-Nspire was used as a checking device
to verify a mathematical condition. For example, the device was viewed as the
authority on the mathematics when Eleanor asked the students to bring the table of
function values into view and check the calculated values of y when the x values
was three. Eleanor did not conclude the dialogue at this point and she pushed the
students to explain why, for the ‘correct’ functions, this would always be the case.
This question brought the mathematics back to its starting point in the lesson, the
significance of the coordinate point (3,6), and the subsequent discussion appeared
to bring an element of closure to the activity for the majority of the students and
the teacher, who was visibly elated at the outcomes of the lesson. She remarked
immediately, ‘That was lovely, that end bit was lovely… …and I love what Kayleigh
said, ‘well ‘cos that is what we started with?’... how obvious is that?’ [(CEL9)Trans].
6.3.3 Evidence of a hiccup
There were eight identified broad classifications of hiccups during the lesson as
shown in Figure 6-34.
Figure 6-34 Extract from Nvivo8 software showing the coded hiccups during Eleanor’s activity ‘Crossing linear graphs’ [CEL9].
The particular hiccup selected from Eleanor’s lesson, prompted by the student

How does a multi-representational mathematical ICT tool mediate teachers‟ mathematical and
pedagogical knowledge concerning variance and invariance?
Chapter 6 Introducing the teachers and analysing their mathematics lessons
181
questions ‘Emily, how did you do it?’ [CEL9Hiccup04], takes the notion of a lesson
hiccup occurring as a result of an unanticipated student response within the
parameters of the previously described activity that Eleanor had constructed in
collaboration with me.
Less than two minutes after Eleanor had asked the students to input functions into
the MRT to pass through the given co-ordinate point (3,6), Emily’s screen (shown in
Figure 6-35), was one of the twenty-two screens on display to the class through the
whole-class digital projector.
Figure 6-35 Emily’s response to the activity ‘Crossing linear graphs’ [CEL9(tns-S)].
The following classroom conversation ensued.
Students: [background conversations] Is it two x equals y? No you
miss out the y. What does it actually mean? Emily, how
did you do it?
Eleanor: [to the class] Remember you don't need to write in the y
equals.
Student: [background conversation] so if we've got x plus three.
Student A: Emily, Emily has got a curved graph.
Eleanor:
Emily, Emily's got a curve there [EL pauses and turns to
look at the screen].
Student B: Nice
Eleanor: [to Emily] Try and avoid it at the moment… [EL pauses]
for what we are doing… [EL pauses] I like that… [EL
pauses] Okay?
Eleanor: [to the class] Emilie i-e-, where's Emilie i-e-? 9
9 There were two students with similar names Emily and Emilie in the class.

How does a multi-representational mathematical ICT tool mediate teachers‟ mathematical and
pedagogical knowledge concerning variance and invariance?
Chapter 6 Introducing the teachers and analysing their mathematics lessons
182
Eleanor: [to Emilie] Did you manage to get rid of that one?
Emilie: Yes
Eleanor: [to Emilie] Brilliant, well done so you've got one more -
maybe adjust it - think of what we did - may be get it to
move up okay?
Eleanor: [to Emily] Errm try not using curves - no not try don't
[EL is firm] I do want just straight lines at the moment.
Eleanor: [to the class] Billie, where's Billie?
No more examples of curved graphs appeared during the lesson and, at no point
did Eleanor hold a dialogue with Emily, or any of the other students with respect to
her rationale for the response she gave to Emily. Later in the same lesson, the
following dialogue occurred when Eleanor was leading a whole-class discussion
concerning the students’ functions that intersected at the coordinate (3, 6).
Eleanor: Has anybody got any other graphs different to that one?
...those ones sorry. [EL gestures to the equations on the
whiteboard] Has anybody got any different ones?
Student C: Emily has got one.
Eleanor: [to Rosie] Rosie?
Student C: Emily's got one, Emily's
Rosie: nine x minus twenty-one.
Eleanor: Say it again nine x minus twenty-one. Emily? Was it
Emily?
Student C: Emily's got quite a lot.
Eleanor: [to class] Any of yours different to any of that?
Students: Not really, no.
Maria: Do Emily, she's got a curved graph.
Eleanor: Yeah, I don't want to use that for this instance yet… [EL
pauses] it is… [EL pauses] I don't want to use it… [EL
pauses] so…. [EL pauses] Okay I'm going to stop now.
Eleanor then moved on to the next phase of the lesson in which the students looked
at the tables of values associated with each function and worked to justify why their
functions had one unique solution leading to the associated algebraic proofs.

How does a multi-representational mathematical ICT tool mediate teachers‟ mathematical and
pedagogical knowledge concerning variance and invariance?
Chapter 6 Introducing the teachers and analysing their mathematics lessons
183
Following the lesson, I asked Eleanor for her thoughts in reaction to Emily’s
response to the activity to which she replied:
I liked it because it made me realise that my instructions had not been
totally clear in only producing linear graphs and she had been quite
clever in producing a rule that was quite different to what we had
discussed or what I was expecting. I realised at that moment that I
hadn‟t clarified that I wanted only linear graphs. For the direction of the
work, solving simultaneous equations, in my mind it was only linear
equations. I did not want to create confusion by having to deal with
other equations, such as quadratic ones. I would have preferred to have
made sure I had said linear in the first place which is why I was quite
insistent. [CEL9(Int)]
Eleanor’s comment provides strong evidence of a possible inner conflict. Whilst she
respected Emily’s broader interpretation of the activity, which clearly indicated
Emily’s willingness to embrace a wider view of the concept of ‘simultaneousness’,
Eleanor maintained her more ‘teacherly’ need to constrain the activity to, in her
view, avoid confusing the wider group of students. This evidences the sort of
pragmatic decisions teachers make on a daily basis in their classroom practices,
whilst not knowing what the outcomes may have been had an alternative path
been chosen.
6.3.4 How is the description of the lesson activity informed by the
theoretical underpinning?
The development of Eleanor’s knowledge concerns that of her own mathematical
understandings, the MRT and her teaching approaches and classroom practices. In
making sense of Eleanor’s reaction to Emily’s response, the driving factor seemed
to be Eleanor’s reluctance to deviate from her original intentions for the lesson. In
her mind the lesson objectives concerned linear functions and, although she
expressed both surprise and delight in seeing Emily’s response, her post-lesson
comment suggests that she saw this as a failure on her part in not being specific
enough about the activity constraint to only generate linear functions. The evidence
from the lesson transcript indicated that she was actually very clear in her
introduction to the activity, having stated explicitly to the students that they were
to generate linear graphs. Eleanor clearly appreciated Emily’s divergent thinking but
chose neither to hold a direct discussion with Emily nor to divert the current class
activity with a discussion about Emily’s solution. Eleanor’s post-lesson comment
implied that she saw the introduction of a quadratic solution to the problem as
How does a multi-representational mathematical ICT tool mediate teachers‟ mathematical and
pedagogical knowledge concerning variance and invariance?
Chapter 6 Introducing the teachers and analysing their mathematics lessons
184
offering the potential for the class to be confused. So while Eleanor fully
appreciated that there were many functions for which (3,6) was a coordinate pair,
she had made the ‘teacherly’ decision to constrain the mathematical content of the
lesson such that the degree of variance permitted was within the domain of linear
functions. Eleanor’s perception of the meaning of ‘different’ within this activity
resulted in her not taking up opportunities to explore a number of the students’
perceptions of ‘different’.
To summarise, the analysis of Eleanor’s lesson hiccup suggests that she may have
learned that:
The use of the MRT in this activity made Emily's unanticipated response both
possible and also highly visible in the lesson.
Emily had made a 'clever' response to the initial activity, and had provided
evidence of her divergent thinking. However, as Eleanor did not challenge
Emily’s knowledge by asking her to explain or articulate her reasoning, she
was reliant on the fact that the curve appeared to pass through (3,6)10.
Emily's response might have resulted from Eleanor not having strongly
emphasised the requirement for linear functions. It is likely that in a future
lesson of this type Eleanor would seek to clarify the activity instructions
more explicitly than she did on this occasion or even highlight to the class
that, although curved graphs are possible, they would not be working on
them in that particular lesson.
The analysis of Eleanor’s hiccup exemplifies how Verillon and Rabardel’s notion of
the constraints for the instrumented activity resonate with the extra information
(afforded by the technology) that Eleanor was required to identify, understand and
manage in reaction to Emily’s response. Eleanor’s pre-structuring of the activity led
her to conceive her own version of the students’ instrument utilisation scheme with
which Emily did not comply, resulting in the occurrence of the hiccup. The
fundamental assumption of Verillon and Rabardel’s theory is that cognition evolves
through interaction with the environment and that the genesis of cognition must
take account of ‘particular specific functional and structural features which
characterise artefacts’ (Verillon and Rabardel, 1995, p. 77). In this example, it
appeared that Eleanor’s knowledge was mainly pragmatic knowledge in relation to
her role as a teacher, that is to say the way that she recognised and dealt with the
hiccup. The more epistemic knowledge, which is difficult to infer from an isolated
10
A scrutiny of Emily’s TI-Nspire file revealed she had entered the function f3(x)=x2-3 to
generate the graph.

How does a multi-representational mathematical ICT tool mediate teachers‟ mathematical and
pedagogical knowledge concerning variance and invariance?
Chapter 6 Introducing the teachers and analysing their mathematics lessons
185
example such as this, might concern how this experience contributes to (or not) the
process through which she pre-structures future activities, or how her previous
experience in similar situations led her to act as she did in this example.
6.4 Methodological considerations for the coding of lesson hiccups
As I was analysing and coding the Phase Two lesson data, I became aware that,
having identified the hiccups from the lesson data, some of the teachers’ immediate
responses to these hiccups indicated that they had a previously rehearsed
repertoire of responses. Subsequently I also began to code each hiccup in relation
to the evidence of the teacher’s responses. For example, Tim’s experience with the
technology meant that he had a number of contingencies in response to students’
basic instrumentation difficulties. He regularly promoted the key presses ‘escape’
and ‘control z to undo’ and had a number of explanation structures to support
students to learn to ‘grab and drag’. I devised three categories or teacher’s
response which were:
No immediate response repertoire: the teacher did not appear to have any
immediate contingencies, as evidenced by offering a ‘holding’ response such
as ‘we’ll look at that another time’.
A developing response repertoire: the teacher, whilst obviously acting in the
moment began to offer a response that involved dialogue, use of the
technology or both.
A well-rehearsed response repertoire: the teacher responded confidently and
involved dialogue, use of the technology or both.
For example, Tim’s hiccup [STP6H2], that has been previously described in Section
6.2.3 would be categorised as one for which he had a developing response
repertoire as he reconsidered his approach and designed a revised tns file. In
contrast, Eleanor’s hiccup [CEL9H4], previously described in Section 6.3.3 appears
to have remained unresolved in the short term. However, an unresolved hiccup
does not mean that the teacher did not learn anything from the experience in the
longer term. The remainder of the thesis will focus on the outcomes of the analysis
of both resolved and unresolved hiccups.
The full list of hiccups identified from the Tim and Eleanor’s lesson data, and their
classification according to the above set of categories is provided within Appendix
13 and Appendix 14.
How does a multi-representational mathematical ICT tool mediate teachers‟ mathematical and
pedagogical knowledge concerning variance and invariance?
Chapter 6 Introducing the teachers and analysing their mathematics lessons
186
6.5 Summary
In this chapter I have introduced the two case study teachers, summarised their
respective outcomes for the first phase of the study and described in detail an
observed lesson taught by each of them during the second phase. These lessons
have been analysed with respect to the activity, classroom and subject layers. This
analysis had resulted in the expansion of the notion of the lesson hiccup as the
perturbation experienced by teachers during lesson, stimulated by their use of the
technology. In addition I have begun to articulate the relationship between the
individual hiccups and teachers’ epistemological learning concerning mathematical
variance and invariance within the MRT environment.

How does a multi-representational mathematical ICT tool mediate teachers‟ mathematical and
pedagogical knowledge concerning variance and invariance?
Chapter 7 Charting teachers‟ trajectories: The case studies
187
7 CHARTING TEACHERS’ TRAJECTORIES: THE CASE STUDIES
‘Failing to learn what is expected usually results in learning something else
instead.’
(Wenger, 1998, p.8)
7.1 Introduction
This chapter analyses Eleanor and Tim’s professional learning during the second
phase of the study as evidenced by the analysis of their respective research data
which revealed:
The nature and evolution of their instrument utilisation schemes involving
the MRT.
The trajectories in their learning about the nature of mathematical variance
and invariance within the MRT environment.
The occurrence of their lesson hiccups leading to an articulation of how
these contributed to their personal knowledge development.
The diversity of the mathematical content around which the teachers had designed
their activities, coupled with the age and ability range of the students involved, did
not lead to any meaningful generalisations by mathematical content in relation to
any particular instrument utilisation scheme. There were insufficient lesson
observations to be able to draw such conclusions. Both teachers focussed mainly on
algebraic content because this was prescribed by their schemes of work at the time
that the lesson observations were taking place.
In defining the hiccup, it is important to state that these perturbations were
considered to be unpredicted events during the lesson. Their identification and
subsequent classification constituted an objective research activity that was
intended to stimulate and provoke professional conversation with the teachers
involved in the research both during and beyond its timescale. They are not
interpreted as a negative event and, although sometimes the teachers interpreted
them as weaknesses in aspects of their activity design or pedagogical approach, I
promoted their occurrence as opportunities for professional learning.
7.2 Tim’s trajectory
At the end of the first phase of the study, the analysis of Tim’s project data
revealed the following aspects of his practice. It was evident that he was:
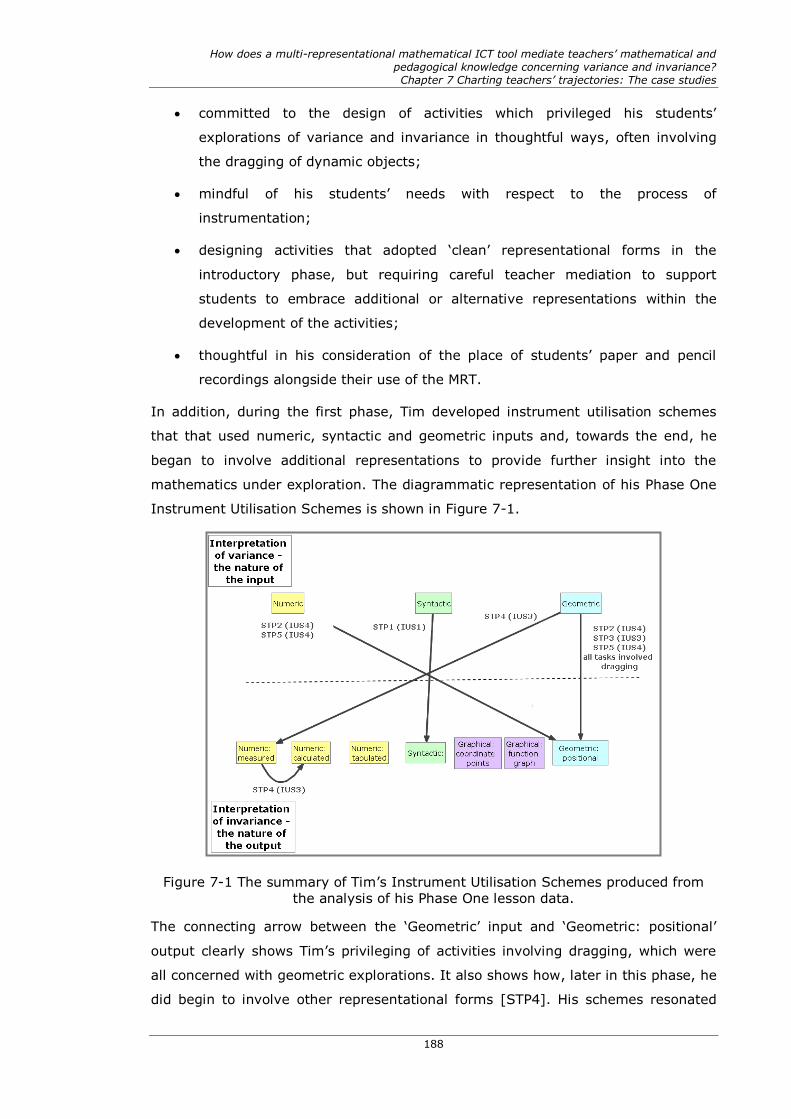
How does a multi-representational mathematical ICT tool mediate teachers‟ mathematical and
pedagogical knowledge concerning variance and invariance?
Chapter 7 Charting teachers‟ trajectories: The case studies
188
committed to the design of activities which privileged his students’
explorations of variance and invariance in thoughtful ways, often involving
the dragging of dynamic objects;
mindful of his students’ needs with respect to the process of
instrumentation;
designing activities that adopted ‘clean’ representational forms in the
introductory phase, but requiring careful teacher mediation to support
students to embrace additional or alternative representations within the
development of the activities;
thoughtful in his consideration of the place of students’ paper and pencil
recordings alongside their use of the MRT.
In addition, during the first phase, Tim developed instrument utilisation schemes
that that used numeric, syntactic and geometric inputs and, towards the end, he
began to involve additional representations to provide further insight into the
mathematics under exploration. The diagrammatic representation of his Phase One
Instrument Utilisation Schemes is shown in Figure 7-1.
Figure 7-1 The summary of Tim’s Instrument Utilisation Schemes produced from
the analysis of his Phase One lesson data.
The connecting arrow between the ‘Geometric’ input and ‘Geometric: positional’
output clearly shows Tim’s privileging of activities involving dragging, which were
all concerned with geometric explorations. It also shows how, later in this phase, he
did begin to involve other representational forms [STP4]. His schemes resonated

How does a multi-representational mathematical ICT tool mediate teachers‟ mathematical and
pedagogical knowledge concerning variance and invariance?
Chapter 7 Charting teachers‟ trajectories: The case studies
189
with the classifications IUS1, IUS3 and IUS4 as described in Section 5.3.1.
7.2.1 Tim’s developing conceptions of variance and invariance
One source of evidence for the evolution of Tim’s conceptions of variance and
invariance was the equivalent diagrammatic representation of the instrument
utilisation schemes he developed during Phase Two, as shown in Figure 7-2. This
overview was developed from the detailed descriptions of his Phase Two activities
(Appendix 9). These schemes focus solely on Tim’s intended use of the MRT by his
students and, although there was an additional instrumentation ‘layer’ concerning
his use of the classroom network, which often mediated the classroom discourse,
this has been ignored at this stage of the analysis1. Due to the increasing
complexity of these schemes, colour has been introduced to allow the path of each
activity to be seen more clearly. For example, activity [STP6], which was described
in full within Chapter 6, is shown in pink. In the main task within this activity, the
nature of the input was the geometric representation of a triangle with squares
constructed on its sides. The output representations focussed initially on the
geometric positioning of the construction as free vertices were moved and then
involved numeric (measured) values of areas and associated numeric (calculated)
values. The related syntactical representations also formed part of the activity.
Figure 7-2 The summary of Tim’s Instrument Utilisation Schemes produced from
the analysis of his Phase Two lesson data.
1 A more substantial commentary on the implications of the introduction of the classroom
network is provided in Chapter 8.

How does a multi-representational mathematical ICT tool mediate teachers‟ mathematical and
pedagogical knowledge concerning variance and invariance?
Chapter 7 Charting teachers‟ trajectories: The case studies
190
Comparing this diagram with the corresponding map from the first phase (see
Figure 7-1), the most obvious development was that all activities involved the
output representation being examined in another representational form as an
explicit component of the activity. This was clearly evidenced by the additional
loops on the lower part of the diagram. This could be explained by the fact that
Tim’s Phase One activities were all developed for single one-hour lessons, which
may have placed a time constraint on the opportunity to introduce further
representations. However, as the Phase Two activities STP6, STP8 and STP10 were
also developed for single lessons, this would seem to counter such a conclusion.
A deeper analysis of Tim’s Phase Two schemes revealed:
In common with the first phase Tim did not use the Numeric (tabulated)
representation in any of his activities. This was surprising since four of the
five activities developed during Phase Two were related to functions and
graphs.
Tim still privileged dragging as a means of interacting for two of his
activities, although in one case a technical issue prevented the file from
being used during the lesson by the students. In both cases the dragging
was linked to other variable outputs within the activity and the students
were required to actively seek mathematical connections between the
different representational forms.
Tim continued to develop innovative approaches to the creation of activities
in which he looked to make use of his growing knowledge of the
functionalities of the MRT. He identified subtle functionalities within the MRT
that opened up new opportunities for activity design. An example of this was
within [STP7] and [STP8], whereby functions of the form y=f(x) could be
entered as a text object and dragged to the axes to create a ‘hidden’
function which was not obvious within the function stack. This enabled
function matching activities to be developed.
A second source of evidence came from the analysis of his interpretation of
variance and invariance within each mathematical activity. Each activity had its own
‘flow’ between interactions with the technology, classroom discourse and
accompanying paper and pencil methods, highlighting the complexities of Tim’s
activity designs. There did not seem to be any one pedagogic approach. However
this did illuminate the ways in which Tim was choosing to use the technology within
the mediation of each of the activities. As an example, the analysis of one activity,
‘Circles and lines’ [STP7], is shown in Table 7-1.

How does a multi-representational mathematical ICT tool mediate teachers‟ mathematical and
pedagogical knowledge concerning variance and invariance?
Chapter 7 Charting teachers‟ trajectories: The case studies
191
Mathematical objectives
for the activity
How the concept of ‘variance and invariance’ was
interpreted within the activity design.
‘finding points of intersection
between a straight line and a
circle’ [Journ]
Initially, the invariant property was a ‘given’ circle
(x2+y2=52) constructed and displayed on the handheld
screen. The addition of a constructed geometric line was the
variant property by nature of its infinite2 number of positions
within the view.
The position of the line was then fixed (at y=4) and the
students were asked to identify the resulting invariant properties (i.e. points of intersection) using pencil and paper
methods3.
The position of the line, although still fixed as horizontal,
was then allowed to vary within the paper and pencil activity and a generalisation for this situation was sought. Tim did
not privilege dragging of the defined line y=4, although
there is evidence that some students drew additional horizontal lines using the MRT.
The students used the calculator functionality to evaluate
square roots of numbers, which provided the ‘class authority’ with respect to the meaning of the outputs as relevant to the
original activity. i.e.
Figure 7-3 A student’s handheld screen[STP7(tns-S)]
The overall intention for the activity was for the students to
determine the following invariant properties:
When c>5, x = √(52–c2) was ‘unsolvable’,
which implied ‘no points of intersection’.
When c=5, x = √(52–c2) produced only one solution, which implied ‘one point of intersection’.
When c<5, x = √(52–c2) produced two
solutions, which implied ‘two points of intersection’.
Tim reported that in the third lesson (which I did not
observe) the students ‘were able to check their algebraic
solutions by plotting the lines on the handheld and finding points of intersection’ [STP6(Journ-T)].
Table 7-1 The detailed analysis of Tim’s interpretation of variance and invariance within the activity ‘Circles and lines’ [STP7]
2 The finite number of screen pixels would, in reality, mean that there would be a finite
number of possible geometric lines. 3 There was one pair of students who chose to input each horizontal line and construct
perpendicular lines to enable them to read off the x-value from the resulting point of
intersection with the x-axis. They then used paper and pencil substitution strategies to prove
that they were correct.

How does a multi-representational mathematical ICT tool mediate teachers‟ mathematical and
pedagogical knowledge concerning variance and invariance?
Chapter 7 Charting teachers‟ trajectories: The case studies
192
Similar detailed descriptions were written for each of Tim’s activities, the remainder
of which are included within Appendix 9. A condensed version was also produced
for each activity which is shown below in Table 7-2.
Activity Interpretation of variance Interpretation of invariance
i.e. the generalisation being
sought
STP6
(main
activity)
The sums of the areas of two
squares constructed on the sides
of a triangle that were varied by
dragging.
The condition that, when the two
areas sum to give the area of the
third side, the triangle contains a
right angle.
STP7 The variation in the number and
position of points of intersection
between a straight line and a
circle of given centre and centre.
A series of invariant properties
which related the number of
points of intersection between the
circle and lines parallel to the x-
axis to the value of the x-co-
ordinate of the point of
intersection.
STP8 The geometric path of the locus of
a point positioned on a quadratic
curve of the form y=(x-a)(x-b)
where a and b were input values.
When matching functions of the
type y=(x-a)(x-b) were
constructed, the roots were
positioned at (a,0) and (b,0).
STP9 The geometric representation of
functions of the type
f(x)=(x+a)(x+b) and
f(x)=x2+cx+d.
When a+b=c and ab=d the two
functions coincide.
STP10 The geometric positioning of two
pairs of coordinate points that
defined two line segments.
The measured values of the
gradient of each line segment.
The condition that the measured
value of the gradient would equal
the vertical translation for every
unit of horizontal translation for
points along each line.
Table 7-2 A summary of Tim’s interpretations of variance and invariance for his
Phase Two activities.

How does a multi-representational mathematical ICT tool mediate teachers‟ mathematical and
pedagogical knowledge concerning variance and invariance?
Chapter 7 Charting teachers‟ trajectories: The case studies
193
The following findings concerning Tim’s conceptions of variance and invariance have
been revealed by this analysis:
Tim stored measured values from geometric contexts as variables (registers
of memory) to support generalisations from explorations that involved
dragging [STP6] (Previously used in STP5)
Tim used a geometric ‘meta-level’ representation to give students a broad
view of the topic prior to using specific examples as a means to encourage
the students to generalise [STP7].
Tim used the MRT as the ‘class authority’ to provide feedback in activities
concerning: calculating square roots [STP7]; ‘measuring’ linear equations
[STP10] and matching syntactic forms for quadratic expressions [STP9].
It was important to note that in some cases the schemes were carefully pre-
meditated by Tim. This was evident from his planning of the ‘story’ of the lesson
and the requirement for the TI-Nspire file to be constructed in advance and sent to
the students’ handhelds at some point during the lesson ([STP6], and [STP8]). For
other activities the file was constructed as part of the lesson introduction. This
meant that either Tim led the construction from the front of the class, with the
students simultaneously constructing their own version [STP10], or Tim and the
students co-constructed the file, which Tim subsequently sent to the students’
handhelds ([STP7] and [STP9]). Consequently, the diversity in these schemes led
to a wide range of potential hiccups within the lessons. What follows is an overview
of these lesson hiccups.
7.2.2 Tim’s hiccups
Tim’s lesson observation data revealed seven classifications of lesson hiccups.
Several of these occurred across the different activities and, in some cases more
than once within individual activities. Table 7-3 gives a summary of the hiccups
alongside exemplification from the data to describe each classification. The
frequency of each hiccup is made evident by the activity code accompanying the
exemplification and, where a particular hiccup occurred more than once within an
activity, its frequency of occurrence is shown in brackets.

How does a multi-representational mathematical ICT tool mediate teachers‟ mathematical and
pedagogical knowledge concerning variance and invariance?
Chapter 7 Charting teachers‟ trajectories: The case studies
194
Nature of the hiccup Exemplification
Resulting from the initial activity design Issues relating to identifying and
discussing objects displayed on the
MRT [STP6H1] [STP9H9].
Choice of initial examples
[STP10H12].
Sequencing of examples [STP6H5], [STP9H4], [STP9H5], [STP9H7](5).
Interpreting the mathematical generality under scrutiny.
Students’ unease over how a specific case related to the wider generality
[STP7H3], [STP7H4], [STP7H6],
[STP10H11](2).
Students’ instrumentation issues when
making inputs to the MRT.
i.e. translating ‘paper and pencil’
mathematics into machine mathematics;
Entering numeric and syntactic data
[STP8H2], [STP8H3], [STP9H1](3), [STP9H2](6), [STP9H3](6),
[STP10H3], [STP10H4].
Plotting free coordinate points [STP10H3](3).
Students’ instrumentation issues when actively engaging with the MRT.
i.e. learning to use new actions…
Grabbing and dragging dynamic objects [STP6H4(3)].
Organising objects on the screen
[STP6H3].
Students’ perturbations stimulated by the
representational outputs of the MRT.
Resulting from a syntactic output
[STP10H8](3).
Resulting from a geometric output
[STP7H1].
Doubts expressed about the ‘authority’ of the syntactic output
[STP7H2], [STP9H8].
Unanticipated student responses Students’ prior understanding is
below teacher’s expectation
[STP10H10](3), [STP10H13](2).
Students’ interpretations of activity
objectives [STP6H2], [STP7H5].
Students develop their own instrument utilisation schemes for
the activity [STP7H7](2).
General technical issues4 Transfer of files [STP8H1],
[STP10H1](4), [STP10H2].
Classroom display of teacher’s software/handheld [STP9H6],
[STP10H5], [STP10H6], [STP10H7].
Table 7-3 Summary of Tim’s lesson hiccups
It was observed that, for a quarter of these hiccups, Tim responded in a way that
strongly intimated that he had met that sort of hiccup before. This was evidenced
by a previously rehearsed repertoire of actions and such hiccups have been
4 All of these issues related to the use of the prototype classroom network hardware and
software which were outside of the teacher’s control.

How does a multi-representational mathematical ICT tool mediate teachers‟ mathematical and
pedagogical knowledge concerning variance and invariance?
Chapter 7 Charting teachers‟ trajectories: The case studies
195
indicated in Table 7-3 by underlined text. The remainder of the hiccups were
classified as either, ‘not appearing to have an immediate response repertoire’, or
‘the response repertoire was in development’.
7.2.3 Tim’s situated learning
Following the identification and classification of Tim’s hiccups, a scrutiny of the
research data led to the identification of a series of actions by Tim that indicated
that he may have become sensitised to the various hiccups. These actions were
sometimes observed in the classroom, but alternatively they materialised after the
lessons through his written lesson reflections, revised activity structures, post-
lesson interviews and email exchanges. For example, the scrutiny of Tim’s actions
during the activity ‘Equivalent quadratics’ generated the list shown in Figure 7-4
Figure 7-4 The summary of Tim’s actions within the activity ‘Equivalent quadratics’
[STP9].
The complete list of actions associated with each activity, as elicited from the
research data, is fully detailed in Appendix 9. The subsequent analysis of the list of
Tim’s actions throughout Phase Two seemed to suggest that his situated learning
related to:
A much deeper understanding of the nature of mathematical generalisation
and the way in which the related variant and invariant properties would be
both conceived and mediated by the MRT within the activity design. This
included an appreciation of the objects upon which the student attentions
would be focused and the timings for the related whole class discourse5.
An appreciation of the particular difficulties that his students experienced
within dynamic explorations involving multiple representations whereby their
5 Later in the thesis I define the events where this happens as the lesson ‘pinch-points’.

How does a multi-representational mathematical ICT tool mediate teachers‟ mathematical and
pedagogical knowledge concerning variance and invariance?
Chapter 7 Charting teachers‟ trajectories: The case studies
196
attentions may be drawn the simultaneous variation of several objects.
An increased understanding of the level of detailed planning needed when
designing activities involving the MRT. For each mathematical topic this
included the careful consideration of: the bigger mathematical picture; the
choice of the initial example(s); the mathematical progression within
subsequent examples and the degree of alignment between the MRT
mediated activity and traditional paper and pencil methods.
A broader appreciation of his students’ prior knowledge, understanding,
attitudes and motivation towards mathematics, which had been illuminated
by their engagement with the MRT, and made publicly visible by the screen
capture view and quick poll responses.
The development of a number of successful strategies in response to
students’ instrumentation issues concerning both the input of data to the
MRT and the related mediating interactions such as dragging.
Recognition of the emerging evidence of his students’ own
instrumentalisation processes whereby they had began to develop their own
IUS in response to the activities and problems posed.
These outcomes cannot be interpreted as a simple cause-effect model whereby the
singular occurrence of any one hiccup led to any one particular aspect of Tim’s
professional learning. It is hypothesised that, over time, Tim’s sensitivity to some
hiccups had led him to develop aspects of his pedagogy. This was certainly true of
most of the hiccups that arose from the students’ instrumentation issues when
inputting and interacting with the MRT. Tim had a well-rehearsed set of practices to
respond to these hiccups, which could be interpreted as evidence of his pragmatic
knowledge development. However, the many hiccups that Tim experienced that
concerned the sequencing of the examples that he selected within his activity
designs ([STP6H5], [STP9H4], [STP9H5], and [STP9H7]) would indicate that a
more epistemic knowledge development was required. For example, one of the
more significant hiccups related to Tim’s decision to choose a worksheet from a
commercial scheme that used different notation within its examples to the notation
with which the students had become familiar using the MRT [STP9H7]. Tim’s post-
lesson reflections strongly indicated that he had acknowledged that the worksheet
had not allowed the students to progress from their experiences when using the
technology to a more traditional paper and pencil approach. He also suggested
ways in which the MRT activity might be redesigned to accommodate a wider range
of mathematical notation.
How does a multi-representational mathematical ICT tool mediate teachers‟ mathematical and
pedagogical knowledge concerning variance and invariance?
Chapter 7 Charting teachers‟ trajectories: The case studies
197
An overarching outcome for Tim’s involvement in this study was his much greater
awareness of the importance of his choice of initial example, and the way in which
this example would be expanded or developed to enable his students to arrive at
common expressions of the generality in question. This often related to a smoother
transition between to MRT-mediated activity and the paper and pencil approaches
demanded by the current assessment regime.
7.3 Eleanor’s trajectory
The analysis of Eleanor’s activities, submitted during the first phase had revealed
the following aspects of her practice using the MRT:
She was designing activities which involved the students in making dynamic
actions as an integral part of the conjecturing process.
Her pedagogic approach within activities was moving towards a more explicit
focus of the students’ attentions on the variant and invariant properties.
She had grown in her confidence to adapt activities to be more in line with
her personal pedagogical approaches and to design her own activities from a
blank page.
She had started to include more than one mathematical representation
within her activity designs.
In common with Tim, Eleanor developed activities which took numeric, syntactic
and geometric inputs as their starting points. Towards the end of the first phase,
Eleanor had developed a repertoire of instrument utilisation schemes that are
illustrated diagrammatically in Figure 7-5.

How does a multi-representational mathematical ICT tool mediate teachers‟ mathematical and
pedagogical knowledge concerning variance and invariance?
Chapter 7 Charting teachers‟ trajectories: The case studies
198
Figure 7-5 The summary of Eleanor’s Instrument Utilisation Schemes produced
from the analysis of her Phase One lesson data.
By the end of Phase One, Eleanor’s activities were involving the dragging of
dynamic objects and integrating multiple representations and her schemes
resonated with IUS1 and IUS3. She accidentally developed an instrument utilisation
scheme (IUS7) which took an innovative approach to superimposing freely drawn
geometric lines with those defined syntactically using function notation in an
activity focussing on gradients of perpendicular lines [CEL5].
7.3.1 Eleanor’s conceptions of variance and invariance
What follows is a description of Eleanor’s intended instrument utilisation schemes
for her students’ uses of the MRT during the second phase of the study. Again, it is
acknowledged that there was an additional instrument utilisation scheme
concerning her use of the classroom network, the impact of which will be discussed
more fully in Chapter 8.
Firstly, the overview of Eleanor’s instrument utilisation schemes during the second
phase is shown diagrammatically in Figure 7-6. The more detailed versions of these
schemes for each activity are included within Appendix 10. The colour is used to
distinguish between the flows of different representations for each activity.

How does a multi-representational mathematical ICT tool mediate teachers‟ mathematical and
pedagogical knowledge concerning variance and invariance?
Chapter 7 Charting teachers‟ trajectories: The case studies
199
Figure 7-6 The summary of Eleanor’s Instrument Utilisation Schemes produced from the analysis of her Phase Two lesson data.
It was immediately apparent that Eleanor’s activities incorporated a greater
diversity of representations and each activity had its own sequential flow. For
example, ‘Generating circles’ [CEL7] began with a numeric starting point in the
form of tabulated data in the spreadsheet, which included a calculated checking
facility, and led to a data plot. The geometric form of the data plot informed both
the numeric inputs to the spreadsheet and the algebraic interpretation that was
subsequently ‘tested’ through a syntactic input. This ‘flow’ is shown in Figure 7-7.

How does a multi-representational mathematical ICT tool mediate teachers‟ mathematical and
pedagogical knowledge concerning variance and invariance?
Chapter 7 Charting teachers‟ trajectories: The case studies
200
Figure 7-7 Eleanor’s Instrument Utilisation Scheme map developed for the activity ‘Generating circles’ [CEL7].
My observation of Eleanor’s pedagogic approach in this example led to my
conception of the notion of ‘pinch-points’. These were the points in time during the
activity where Eleanor instigated a period of classroom discourse that mediated the
introduction of a new representational form. These pinch-points appeared to be
both thoughtfully planned and also insightful, in that they often required her to
have considered in advance the necessary instrumentation skills that the students
would need to master, in addition to the mathematical questions she would ask.
To arrive at a deeper understanding of Eleanor’s conceptions of variance and
invariance within her activities, each activity was scrutinised and a description
formed. For example, Table 7-4 shows such as description for the activity
‘Generating circles’ [CEL7]. Similar descriptions for the remainder of Eleanor’s
activities are included within Appendix 10.

How does a multi-representational mathematical ICT tool mediate teachers‟ mathematical and
pedagogical knowledge concerning variance and invariance?
Chapter 7 Charting teachers‟ trajectories: The case studies
201
Mathematical objectives
for the activity
How the concept of ‘variance and invariance’ was
interpreted within the activity design.
‘To establish the equation x2
+ y2 = r2
Making connections between the values placed into
spreadsheet and the graph of
these values.
Making conjectures about the circle and primarily the radius
to connect it to the statement
of squaring 2 numbers and adding them [CEL(Plan)]
The starting point for this activity was finding values of x and y that satisfied x2 + y2=25, which Eleanor was
interpreting as being in the real number domain only.
However, as Eleanor left the definition of the domain open as a point of discussion throughout the lesson, most
students began by considering positive integers and then
expanded this domain to include zero and negative integers.
Some students extended this domain further to include positive and negative square roots of non-square numbers.
The variant property was the range of permissible values for
x and y, whereas the invariant property was the given initial condition.
Although Eleanor had designed the activity to include
explorations of x2 + y2=16 and x2 + y2=36, and included a page in the TI-Nspire file which encouraged the students to
begin to generalise, (Figure 7-8), this part of the activity
was not observed during the lesson.
Figure 7-8 [CEL7(tns-T)page3]
Table 7-4 The detailed analysis of Eleanor’s interpretation of variance and
invariance within the activity ‘Generating circles’ [CEL7].
Similar detailed descriptions of each of Eleanor’s Phase Two activities are included
within Appendix 10. These descriptions were then condensed to produce the
summary shown in Table 7-5.

How does a multi-representational mathematical ICT tool mediate teachers‟ mathematical and
pedagogical knowledge concerning variance and invariance?
Chapter 7 Charting teachers‟ trajectories: The case studies
202
Activity Interpretation of variance Interpretation of invariance
i.e. the generalisation being
sought
CEL6 The syntactic inputs of six
different sets of given functions
subsequently plotted graphically
on a Cartesian plane.
Comparing certain sets of
functions revealed commonalties
in their geometric
transformations.
CEL7 The numeric input of pairs of
numbers satisfying a given rule
(i.e. ‘square and add to give
twenty-five) subsequently plotted
as coordinates on a Cartesian
plane.
The resulting geometric
representation satisfied a defined
geometric shape (i.e. a circle of
centre (0,0) with radius 5).
The resulting syntactic
representation satisfied a defined
function (a circle, x2 + y2 = r2).
CEL8
(Main
activity)
The sums of the areas of two
squares constructed on the sides
of a triangle that are varied by
dragging.
The condition that, when the two
areas sum to give the area of the
square constructed on the third
side, the triangle contains a right
angle.
CEL9 The syntactic form of the different
(linear) functions that pass
through a given coordinate point,
subsequently displayed on a
Cartesian plane.
The condition that when the lines
coincide, substituting their point of
intersection into the associated
linear function results in an
equality statement.
Table 7-5 A summary of Eleanor’s interpretations of variance and invariance for all
of her Phase Two activities.
The review of Eleanor’s Phase Two activities led to a number of conclusions. Eleanor
described some of her activities as having adopted a ‘backward’ approach
[CEL9(Trans)]. That is, the mathematics was being approached from the premise
that when a particular condition is satisfied, then this mathematical generalisation
must be true. This challenged her subject knowledge with respect to her awareness
of the generalisations that were possible within the different contexts. Her
pedagogical knowledge was also challenged as she began to devise new
explanatory structures and representational forms to support the progress of
explorations. It appeared that the process of foregrounding mathematical variance

How does a multi-representational mathematical ICT tool mediate teachers‟ mathematical and
pedagogical knowledge concerning variance and invariance?
Chapter 7 Charting teachers‟ trajectories: The case studies
203
and invariance when designing activities challenged her mathematical subject and
pedagogical knowledge. Eleanor also began to appreciate that, if the students were
going to be able to make the mathematical generalisations that she anticipated,
these generalisations needed to be manageable within the teaching timescale.
The analysis of Eleanor’s lesson hiccups that follows, offers an insight into the
nature of the contingent moments in the lessons that may have influenced
Eleanor’s professional learning over the research timescale.
7.3.2 Eleanor’s hiccups
Each of Eleanor’s lesson activities were analysed to reveal the hiccups. These were
the notable moments during the activity when she paused or hesitated and which
were triggered by her own or her students’ uses of the MRT. The individual sets of
hiccups are included in Eleanor’s detailed activity descriptions (Appendix 11). These
were then sorted, and a constant comparison method employed to reveal the
following categories and associated exemplifications. For each exemplification, the
relevant hiccup code is given and a number in brackets indicates the frequency of
occurrence of that particular hiccup during the activity.

How does a multi-representational mathematical ICT tool mediate teachers‟ mathematical and
pedagogical knowledge concerning variance and invariance?
Chapter 7 Charting teachers‟ trajectories: The case studies
204
Nature of the hiccup Exemplification
Resulting from the initial activity design Sequencing of examples [CEL6H2].
Resulting from an unfamiliar
pedagogical approach [CEL8H8].
Interpreting the mathematical generality
under scrutiny.
Students’ unease over the
permissible range of responses that satisfy the generality [CEL7H1],
[CEL8H3].
Students’ reluctance to notice the generality [CEL6H1].
Students’ instrumentation issues when making inputs to the MRT.
i.e. translating ‘paper and pencil’
mathematics into machine mathematics;
Entering numeric and syntactic data [CEL6H3], [CEL6H4](2), [CEL7H4],
[CEL9H2].
Students’ instrumentation issues when actively engaging with the MRT.
i.e. learning to use new actions…
Grabbing and dragging dynamic objects [CEL8H2](2), [CEL8H4].
Navigating between application
windows [CEL8H6], [CEL9H3],
[CEL9H6], [CEL9H8].
Student asks how to develop new
instrumentation [CEL9H5].
Accidental deletions of objects [CEL6H5], [CEL7H2].
Students’ perturbations stimulated by the representational outputs of the MRT.
Resulting from a syntactic output [CEL8H1].
Resulting from a geometric output
[CEL8H9].
Teacher’s instrumentation issues when using new representation.
Displaying the function table [CEL9H7].
Unexpected student responses Prompts classroom discourse triggered by the students
[CEL9H4](5).
Responses are more diverse than teacher anticipated [CEL6H6],
[CEL7H3], [CEL8H7], [CEL9H1](2).
Students’ activity approach reveals incorrect interpretation of the
mathematics [CEL8H5].
Table 7-6 Summary of Eleanor’s lesson hiccups
The hiccup codes that have been underlined represent those hiccups for which I
surmised that Eleanor’s immediate response indicated that she had a previously
rehearsed response repertoire.
7.3.3 Eleanor’s situated learning
It was very clear from the analysis of Eleanor’s activity hiccups, and her responses
to them, that she had developed a confident set of classroom practices in response
to the sort of hiccups that arose concerning students’ instrumentation issues. This

How does a multi-representational mathematical ICT tool mediate teachers‟ mathematical and
pedagogical knowledge concerning variance and invariance?
Chapter 7 Charting teachers‟ trajectories: The case studies
205
is indicated by the underlining of the hiccups in Table 7-6 related to the students’
inputs to the MRT and in engaging actively with the functionality of the MRT. These
practices included:
careful oral phrasing of the instrumentation instructions for activities, which
were often repeated several times;
‘acting out’ a physical metaphor to support students to make sense of the
instrumentation process;
instrumentation instructions displayed to the class in the Smart Notebook
file for the lesson;
interventions with individual students whereby she diagnosed their
difficulties by watching them re-enact it, before talking them through the
correct sequence of actions;
encouraging and expecting the students to get together to sort out each
others’ difficulties during the instrumentation phase.
When Eleanor was faced with the sort of hiccups that arose as a result of an
unexpected diversity in the students’ responses, in some situations she seemed to
have developed new pedagogic approaches. For example, in one activity she used
the diversity of students publicly displayed responses to an open question to force
the students to argue and agree the mathematical conventions that were
acceptable as answers [CEL9]. This served both to inform Eleanor of the range of
her students’ existing knowledge and to widen the students’ frames of
understanding. Eleanor commented that this was an adaptation of an existing
pedagogic approach whereby students would have previously displayed their
responses to her on ‘mini whiteboards6’. However, it appeared that the classroom
argument was more strongly provoked using the technological approach because
the students had wide visibility of each others’ responses.
In other activities the diversity of the students’ responses seemed to lead to
pedagogic dilemmas for Eleanor as she looked for either commonality or diversity,
as anticipated in her activity design, to support the next phase of the activity. For
example, in ‘Transforming graphs’ [CEL6], faced with the publicly displayed set of
handheld screens shown in Figure 7-9, Eleanor commented how she was unsure
how to take the next phase of the classroom discourse forward as she had expected
that the students would have all offered the same set of transformed functions.
6 a ‘write-on, wipe-off’ board that students use to record responses and hold up for the
teacher to see.

How does a multi-representational mathematical ICT tool mediate teachers‟ mathematical and
pedagogical knowledge concerning variance and invariance?
Chapter 7 Charting teachers‟ trajectories: The case studies
206
Figure 7-9 The students’ handheld screens displayed as a Screen capture view during the activity ‘Transforming graphs’ [CEL6].
Eleanor rationalised this particular hiccup by blaming it on her original activity
design saying,
As there were over twenty pairs of functions that the students were
comparing, I realised that it was difficult to direct the students to a
particular screen to compare – I needed to think carefully about how I
grouped and labelled the functions when devising the worksheet next
time!. Hence some of the students‟ screens showed vertical translations
and others showed horizontal translations! [CEL6(Journ-T)]
Her experiences in this lesson did seem to impact upon Eleanor’s thinking when it
came to her subsequent activity designs. She became much more focussed upon
identifying the generalisable elements of each activity and how she would direct the
students’ attentions towards these elements as the activity progressed. In her
informal planning notes she would write herself a script, which would include basics
such as:
her own instrumentation sequence to introduce the activity;
the initial instrumentation sequence for the students;
How does a multi-representational mathematical ICT tool mediate teachers‟ mathematical and
pedagogical knowledge concerning variance and invariance?
Chapter 7 Charting teachers‟ trajectories: The case studies
207
the key mathematical questions related to the activity;
when she would send files to the students’ handhelds;
when she would display the screen capture view, and which page of the
students’ files would be displayed;
if appropriate, the instrumentation steps for students when introducing new
representations;
if appropriate, when she would collect files from the students.
It was interesting to observe that, as Eleanor’s experience with the MRT in the
classroom was increasing, she did not become blasé about the process of planning
activities for her students. On the contrary, her awareness of the subtle elements of
activity designs that contributed to a successful experience for her students seemed
to be sharpening. My observations of Eleanor’s classroom practice led me to
conceive the notion of ‘pinch points’ within activities. These were the planned
moments during the activity when Eleanor directed the students to stop what they
were doing, move to a particular page of the MRT activity and focus their attention
towards a specific outcome. In some cases this was accompanied by the public
display of the handheld screens, for example Figure 7-9. Eleanor used the screen
capture view of the students’ handhelds to monitor their work and would often
announce an impending pinch-point to the class. It also seemed important to
Eleanor that the students could place their own handheld screen within the wider
class view and she was specific in her instructions to students in this respect. For
example, she would say, ‘Okay, I want you to concentrate on your screen first...
[pauses] on your Nspire... [pauses] ...and I want you also to come to these ones
[gestures to Screen capture view on public display]’ [CEL8(Trans)].
Over the period of the study, Eleanor’s overall approach to the design of activities
had developed a greater awareness of the ‘bigger mathematical picture’ in relation
to each topic. She had also begun to appreciate the way in which the MRT-mediated
aspect of the activity would need to link with the paper and pencil approaches that
the current assessment regimes demanded, and had begun to include this element
within her activity designs. Her conviction that her students were developing a
deeper mathematical understanding as a result of their engagement with the MRT
seemed to provide an incentive for her to want to ensure smoother transitions
between the two media.

How does a multi-representational mathematical ICT tool mediate teachers‟ mathematical and
pedagogical knowledge concerning variance and invariance?
Chapter 7 Charting teachers‟ trajectories: The case studies
208
7.4 The emergence of new theoretical ideas
The theoretical framework developed for this study was an adaptation of Verillon
and Rabardel’s triad characteristic of instrumented activity situations (Verillon and
Rabardel, 1995) resulting in a dual layered interpretation, which considered the
teacher’s perspective as both a learner (with respect to mathematics, pedagogy
and technology) and as a teacher (responsible for constructing situations that
would lead to students’ learning). This highlighted the need to develop the notion of
the object in Verillon and Rabardel’s triad and to explore the way in which the
teacher’s reflections on and through classroom practice contributed to the
development of their knowledge within the domain of the study.
The research aimed to develop a language to support the description of teachers’
situated learning in the classroom within the context of developing mathematics
teaching and learning (concerning variance and invariance) when integrating a
complex technology. The definition and further articulation of the lesson hiccup and
its role within this process of teachers’ knowledge development, offers a
contribution to such a language as an example of an ontological theory.
The hiccups, that is to say the instances within the lesson, often indicated by clear
‘pauses’ or ‘hesitations’ on the part of the teacher, offered an opportunity for
teachers’ knowledge development in both a pragmatic and an epistemic sense. The
evidence presented in this chapter sought to substantiate the emergence of the
hiccup and indicate its relationship to Eleanor and Tim’s situated learning. Chapter
8 will articulate the theory in more depth with a view to offering a more expansive
definition of the hiccup and its relationship to teachers’ situated epistemological
development.
7.5 Summary
This chapter has described the outcomes of the second phase of the study with
respect to Eleanor and Tim’s experiences resulting from the analysis of their
research data. This led to an overview of their professional learning concerning
their expanding instrument utilisation schemes and the ways in which they
conceptualised mathematical variance and invariance within the activities they
developed. The analysis and discussion of their lesson hiccups was related to the
evidence of their actions, substantiating the lesson hiccup as a notable contributory
event to their learning during the period of the study.

How does a multi-representational mathematical ICT tool mediate teachers‟ mathematical and
pedagogical knowledge concerning variance and invariance?
Chapter 8 Discussion
209
8 DISCUSSION
The presence of someone whose attention is differently structured,
whose awareness is broader and multiply-levelled, who can direct or
attract pupil attention appropriately to important features, is essential.
(Mason, 1996, p.71)
8.1 Introduction
In this chapter, the findings in relation to Eleanor and Tim’s situated learning are
examined as a cross case analysis relevant to the aims of the study. The discussion
focuses on the nature of their situated learning by considering the evolution of their
mathematical, pedagogical and technical knowledge resulting from the lesson
hiccups. The chapter continues with a commentary on the nature of the observed
classroom hiccups and an articulation of the hiccup theory of teachers’ situated
learning concerning mathematical variance and invariance in a MRT environment. It
concludes by considering the contribution that the classroom network technology
made to the teachers’ epistemological development.
8.2 What did the teachers learn?
In this study, the technology was conceived as having dual roles in mediating both
teachers’ learning in the classroom and the transformation of this knowledge
through the way that they reflected upon their students’ learning and developed
their own theoretical and practical pedagogic ideas. The data analysis revealed that
the three broad areas of Eleanor and Tim’s learning concerned their conceptions of
variance and invariance, their pedagogical approaches and their use of the
technology. These three themes, although inextricably interconnected, are now
examined one by one. The key consideration is that the occurrence of lesson
hiccups was a necessary contributory factor in the teachers’ epistemological
development.
8.2.1 Mathematical knowledge development concerning variance
and invariance
A central tenet of this thesis was that activities and approaches that privileged an
exploration of mathematical variance and invariance constituted a legitimate
pedagogical opportunity for the use of technology in secondary mathematics
classrooms. The decision to base the research on a group of teachers’ developing
uses of a multi-representational technology (MRT) also provided the context to

How does a multi-representational mathematical ICT tool mediate teachers‟ mathematical and
pedagogical knowledge concerning variance and invariance?
Chapter 8 Discussion
210
explore how the teachers learned to develop activities that linked mathematical
representations within the mathematical explorations. These themes were
consistent with the task layer within Pierce and Stacey’s pedagogical map (2008).
The teachers’ evolving conceptions of variance and invariance were revealed in
several ways during the study. This included how they conceptualised the initial
representation of the variant property under exploration and the related
representations that added insight to, or progressed, the exploration and the way in
which any invariant properties would become explicit as a result of the exploration.
It is problematic to try to interpret the evolution of the teachers’ conceptions of
variance and invariance solely as aspects of their mathematical knowledge because
the context for this development was rooted within their pedagogical decisions and
actions concerning the design and evaluation of mathematical tasks. However, the
teachers’ choices of initial representation, as evidenced by the ‘input’ to the
exploration, offered an insight into the mathematical content area in which the
teacher perceived that the broader generality under scrutiny would reside. For
example, in Tim’s lesson that would eventually focus on the algebraic solution of
simultaneous equations involving circles and lines, his starting point was to
consider the geometric possibilities of lines crossing circles prior to introducing any
algebra [STP7]. For each of the teachers’ activities, this initial representation
evidenced the first ‘example’ from which they anticipated that they would be able to
guide their learners towards a specific mathematical generalisation.
Eleanor and Tim learned that there were several important aspects when making
the choice of initial example within their activity design and its subsequent
representation within the MRT. Firstly, it needed to be an example of the
generalisation being sought. A hiccup that Tim experienced during the activity
‘Linear equations’ [STP10] led him to conclude that his choice of functions for the
initial example, which was a spontaneous decision, was unhelpful. His selection of
y=1x+1 and y=2x did not support the students to begin to generalise about the
gradients of the linear functions, partly because there were two digit ones inherent
in y=1x+1, but also due to the way that the MRT displayed the measured
equations1 (see Figure 8-1).
1 This hiccup was compounded by the output from the MRT which displayed an unhelpful
‘measured’ equation. (A measured equation is one which for which the MRT numerically
analyses a set of points that define a geometrically constructed line, often revealing
unexpected numerical errors i.e. Figure A9-41 on Page 360)

How does a multi-representational mathematical ICT tool mediate teachers‟ mathematical and
pedagogical knowledge concerning variance and invariance?
Chapter 8 Discussion
211
Figure 8-1 Tim’s handheld screen showing the ‘measured’ linear functions which
resulted in a lesson hiccup during the activity ‘Linear graphs’ [STP10(tns-T)].
However, this ‘double’ hiccup contributed to a development in Tim’s pedagogical
knowledge with respect to the importance of example choice, evidenced by his own
reflective writings [STP(Journ-T)].
A second aspect of the initial task choice that may also be relevant, although there
was only one instance of it resulting in a hiccup, concerned the students’
articulations of their mathematical generalisations that were outside of the
teacher’s expectation. For example, in Task 2 of Tim’s ‘Pythagoras exploration’
activity [STP6], one student concluded that ‘a small square and a big square make
a right angle triangle’ and another pair of students wrote, ‘to get 3 squares equal
size you have to have an equilateral triangle in the middle’ [STP6(Eval-S)]. Tim
commented that he felt it was his role to ‘find out what students think, in order to
help them move forward’, and that gaining an insight into the generalisations they
made was an important part of this process.
Eleanor and Tim both seemed to grapple with the notion of the ‘example space’ in
ways that were resonant with Goldenberg and Mason’s elaboration of the difficulties
encountered when trying to identify appropriate examples for different
mathematical generalisations,
Sometimes there is a general „sense‟ of examples without specific
details, while at other times a few clear examples come to mind
immediately, setting off a trail of metonymic triggers and metaphoric
resonances associated with concepts, techniques, or other features, or
with ways to vary or tinker with those examples. (Goldenberg and
Mason, 2008 p.188)
Tim’s choice of functions in the ‘Linear equations’ activity could be interpreted as
him having a ‘general sense’ of the representation of any two straight lines on a
dotty grid alongside the functionality of a ‘gradient measure’ tool as a sufficient
How does a multi-representational mathematical ICT tool mediate teachers‟ mathematical and
pedagogical knowledge concerning variance and invariance?
Chapter 8 Discussion
212
space in which to be able to generalise about slope. However, a more informed
choice of functions, alongside the utilisation of the MRT’s functionality to measure
the slope of the line, rather than its equation, might be aspects of the activity that
Tim would redesign if he were to use this activity again.
Having decided upon the initial input representation, another important
consideration for the teachers related to their decisions about the syntactic labelling
or notation of variable objects. They learned that this was a necessary element of
activities when classroom discourse would be initiated to support students to notice
and verbalise their generalisations. As both teachers privileged whole-class
discourse focussed on key mathematical generalisations in their classroom
practices, they both experienced a number of hiccups that indicated that there was
insufficient notation or labelling to enable this discussion to be suitably focussed.
This is an aspect that Pierce and Stacey have noted in their recent research into the
way that Australian secondary mathematics teachers are developing the use of the
TI-Nspire handhelds to privilege linked mathematical representations when
teaching about quadratic functions (Pierce and Stacey, 2009). They have
highlighted the conflict between the labelling of variables within the ‘ideal’ or pencil
and paper mathematics alongside the conventions built into the MRT, as an
important element for teachers to consider in the design of tasks.
A final consideration was the development of the teachers’ knowledge concerning
the grouping or sequencing of examples, that is, determining the scale and
structure of the example space. This aspect of their learning not only related
strongly to their personal mathematical knowledge and interpretation of the
mathematical progression of ideas within the topic matter, but was also intrinsically
linked to the pedagogic skill of considering the most suitable activity structure for
their students. Prior to her lesson ‘Transforming graphs’, Eleanor was honest about
her lack of confidence in the topic, saying that she needed to follow the text book
quite closely when teaching standard function transformations and she would
normally encourage her students to ‘just learn them’ [CEL6(Int-T)]. However, her
experience in designing and evaluating the lesson led her to appreciate how the
MRT activity could be designed to allow the students to explore why the functions
were being transformed in a particular way by involving the Numeric (tabular)
representation. This was an expansion of Eleanor’s previous mathematical
knowledge, which also offered her the opportunity of a new pedagogic approach. A
significant aspect of her learning concerned an appreciation that if her students had
a deeper understanding of why and how a particular transformation set ‘worked’,
they would have a structure through which they could make sense of others.

How does a multi-representational mathematical ICT tool mediate teachers‟ mathematical and
pedagogical knowledge concerning variance and invariance?
Chapter 8 Discussion
213
In general, having selected an initial example for each activity, Eleanor and Tim
expanded the example spaces to add insight to, or support the analysis of the
variant and invariant properties under exploration in one, or a combination of the
following approaches:
Further examples were explored within the same mathematical
representation by making new inputs in the same numeric, syntactic or
geometric form [STP7], [STP8], [STP9], [STP10], [CEL6], and [CEL9].
Further examples were explored within the same mathematical
representation by dragging objects dynamically [STP6] [CEL8].
Further examples were explored within a different mathematical
representation by making new numeric, syntactic or geometric inputs
[STP7], [STP8], [STP9], [STP10], and [CEL9].
The same example was explored within a new mathematical representation
[CEL7] [CEL9].
8.2.2 Pedagogic knowledge development
This study sought to build upon Rowland et al’s notion of contingency, which they
defined as a teacher’s ‘knowledge-in-interaction’ that ‘on occasion can be seen in
the teacher’s willingness to deviate from her own agenda to develop a student’s
unanticipated contribution’ (Rowland et al., 2005, p.266). Examples from each of
Eleanor and Tim’s lessons of a hiccup that arose from the students’ unanticipated
contributions have been described in detail in Chapters 6 and categorised within
Chapter 7 (see Table 7-3 and Table 7-6). The overarching categories were:
Students’ interpretations of the objectives or instructions for the MRT
activity were broader than the teacher anticipated, leading to a more diverse
set of students’ responses.
Students developed their own instrument utilisation schemes for the activity.
The MRT outputs prompted classroom discourse that was initiated by the
students.
Students’ approaches using the MRT reveal incorrect interpretations of the
mathematics or prior understanding that were below the teacher’s
expectation.
The categories above were neither mutually inclusive nor single occurrences in that
hiccups of this type often instigated a sequence of events in the classroom. In

How does a multi-representational mathematical ICT tool mediate teachers‟ mathematical and
pedagogical knowledge concerning variance and invariance?
Chapter 8 Discussion
214
Eleanor’s lesson hiccup, which was described in depth in Section 6.3.3, Emily’s
unanticipated response as a result of her broader interpretation of the task led to
the other students initiating the discourse about it. An important point to make
here is that these unanticipated responses were all revealed by the interactions
afforded by the MRT. This does not mean that in a non-technology mediated lesson
the teacher would not experience unanticipated students’ responses that would also
result in situated learning. It merely highlights the nature of the opportunities that
the hiccups provided for the teachers within the context of this study. The evidence
from these hiccups clearly indicated that the MRT had a role to play in creating
contingent moments and, as Eleanor and Tim experienced as a result of these
moments, opportunities for their situated learning arose.
One element of their pedagogical development, which was illuminated by the
actions Eleanor and Tim took in the classroom, concerned the process of
consciously mediating whole-class discourse with a view to arriving at a consensus
to new mathematical knowledge. It was obvious from the way that the majority of
students responded to the teachers that both mathematics classrooms were places
of enquiry and discussion, and each teacher listened carefully to the students’
reactions and responses to tasks through ‘mini-plenaries2’. Mathematical language
and notation was sensitively introduced to the students as a support for both the
class discourse and for developing written methods.
However, it appeared that in both teachers’ activity designs these plenaries became
mathematical ‘pinch-points’ as the teachers stopped tasks and focussed the
students towards particular variant and invariant properties within the MRT
explorations. Tim’s approach to these pinch-points appeared to be more ‘ad hoc’.
He tended to move about the classroom and use the information he gained about
the students’ progress to decide when to stop the class. Eleanor’s approach seemed
more explicit as she monitored the publicly displayed screen capture view of the
students’ handhelds and announced to the class when a pinch-point was
forthcoming.
The positioning of the initial example space within the ‘wider mathematical
landscape’ of the topic was a second aspect to which both teachers responded
following discussions and email exchanges concerning the design of activities. There
was evidence that they were beginning to consider more carefully the role of the
MRT within sequences of lessons and how the individual activities would support
2 The ‘mini-plenary’ was a teaching approach advocated by the National Secondary Strategy
in England and Wales whereby teachers would focus students on particular aspects of tasks
throughout individual lessons.

How does a multi-representational mathematical ICT tool mediate teachers‟ mathematical and
pedagogical knowledge concerning variance and invariance?
Chapter 8 Discussion
215
their students to piece together the smaller generalisations in order to arrive at the
deeper mathematical generalisation. However, this process was neither
straightforward nor without its hiccups and it is most certainly an area needing
further research using different methodological approaches.
The review of literature highlighted an opportunity to reflect upon whether the
teachers’ uses of the MRT within their designed activities in this study revealed
more ‘transformational’ and ‘meta-level’ approaches to algebra, as opposed to the
more common ‘generational’ tasks as described by Kieran (1996, 2004). Kieran’s
premise of ‘algebra as activity’ resonated with the interactions afforded by the MRT
in the activities designed by Eleanor and Tim during the second phase. On
reviewing Table 7-2 and Table 7-5 within Chapter 7, none of the Eleanor and Tim’s
activities fitted with Kieran’s definition of generational tasks. Their activities fell into
Kieran’s remaining two categories:
Transformational activities, mainly concerning the changing form of
expressions or equations to maintain equivalence [STP8] [STP9].
Global/meta level activities, for which algebra is a tool but are not exclusive
to algebra. These would involve both generational and transformational
activities [STP6] [STP7] [STP10] [CEL7] [CEL8] [CEL9].
In common with the early research into the use of technology in building students’
conceptions of variables, evidence from this study revealed that the teachers had
begun to create activities in which the MRT afforded ‘meaningful experience to the
creation of algebraic expressions’ for the students (Sutherland and Rojano, 1993).
In addition, Kieran expressed a note of caution regarding the possibility that the
use of technology might ‘make it quite easy to sidestep algebraic representation
and algebraic transformation’ (Kieran, 2004, p.31). However, the detailed
descriptions of Eleanor and Tim’s activities indicated that they both developed
pedagogies that met Kieran’s proposition that ‘the algebra teacher has a crucial role
to play in bringing algebraic representations to the fore and in making their
manipulation by students a venue for epistemic growth’ (ibid.).
Eleanor and Tim demonstrated approaches to their activity designs which resonated
with Kaput’s view that mathematics in the school curriculum was not all ‘about
symbols and syntax’ (Kaput, 1989, pp 167-8). They faced a dilemma in needing to
develop notational forms that made sense to their students alongside the
requirement to use the syntactic forms designed into the MRT. So Tim’s ‘clean
representational forms’ were his response to this dilemma, although he learned that
this could lead to the students’ confusion over the specific objects under discussion,

How does a multi-representational mathematical ICT tool mediate teachers‟ mathematical and
pedagogical knowledge concerning variance and invariance?
Chapter 8 Discussion
216
particularly within dynamic explorations.
This study has also provided a deep insight into Eleanor and Tim’s pedagogic
approaches in trying to bridge the transition from the exploratory MRT environment
to incorporate the generational and transformational skills demanded by the current
formal mathematics assessment regime. However, this was an element of the
technology integration which they found both challenging and, in both cases, was
an element of their pedagogy which they were seeking to develop further.
8.2.3 The process of instrumental genesis
As previously stated, there was a dual role for the technology within this study. On
the one hand, it was mediating the teachers’ learning within the mathematical
domain of the research. On the other, it was mediating the transformation of this
knowledge in the way that they reflected upon their students’ learning and
developed their own theoretical and practical pedagogic ideas. The development of
the teachers’ uses of the technology provided a strong indication of this process of
instrumental genesis as they initially learned about the different functionalities of
the MRT and subsequently developed classroom activities that incorporated chosen
features.
The data analysis of the first phase of the study revealed nine broad instrument
utilisation schemes that added insight to both the representational pathways of
each activity alongside an indication of the nature of the intended students’
interactions with each representation (see Section 5.3.1). However, the lack of
classroom observation data during this phase did not enable a closer scrutiny of the
way in which the representations were being used within the activity and each
teacher’s role in mediating the students’ pathways through the representations.
Phase one did reveal the trend for teachers to initially adopt IUS 1:Vary a numeric
and syntactic input and use the instrument‟s functionality to observe the resulting
output in numeric, geometric, tabular or graphical form. Whilst some teachers did
not progress beyond this scheme, others diversified to schemes that began with
geometric inputs and involved dragging (IUS3) or those which extended IUS1 by
using another representational form to re-examine the initial output. A few teachers
developed more diverse schemes which involved more advanced aspects of the
MRT’s functionality.
In common with the students in Guin and Trouche’s study, Eleanor and Tim
underwent an initial phase of discovery followed by an organisational phase
whereby mathematical consistency between different representational outputs were
How does a multi-representational mathematical ICT tool mediate teachers‟ mathematical and
pedagogical knowledge concerning variance and invariance?
Chapter 8 Discussion
217
sought (Guin and Trouche, 1999). Their experiences during the first phase, in which
they became familiar with the individual MRT applications and their
instrumentation, contributed to the development of their later activities. On the
other hand, there were often two levels of instrumentation for them to consider.
The first related to their own instrumentation schemes which were necessary for
the conception and design of the activities. The second concerned their awareness
of the students’ instrumentation process, to which both Eleanor and Tim were
noticeably sensitised.
Eleanor and Tim’s very different starting points with respect to their previous
knowledge and experience with handheld technology did not seem to impact greatly
upon their perceptions of the success of their classroom experiences. On the one
hand, Eleanor’s activities were less technically demanding in their design, requiring
basic instrumentation skills such as entering functions syntactically [CEL6, CEL9]
and linking spreadsheet data to a scatter plot to produce a coordinate graph
[CEL7]. Eleanor expressed that she did feel ‘frustrations at not always having the
technical know-how’ [CEL(Journ)]. However, she did appreciate that her technical
knowledge was developing as a result of her involvement with both the research
project and the wider community of TI-Nspire teacher-users3. Tim’s activities were
more technically ambitious and there were several examples of how he had moved
from his own instrumentation phase, whereby he learned about particular
functionalities and began to instrumentalise these functionalities within his activity
designs. Whilst Tim did experience one hiccup that was a direct consequence of a
more complex activity design, when it lost functionality during the wireless transfer
to the students’ handhelds, he concluded that the underlying principle was one that
he would use again.
In the second phase of the study, the evidence from the diagrammatic versions of
the utilisation schemes seemed to suggest strongly that Eleanor and Tim were
moving more confidently between different representations of the mathematics
within each activity. This did not mean that all activities involved vastly different
representational outputs of the MRT that would be evidenced by movement
between the different TI-Nspire applications. It was due to the teachers’ more
subtle interpretation of the different representations. For example, in Tim’s activity
‘Circles and lines’ [STP7], in which the students explored the possible points of
intersections of lines with the circle x2 + y2 = 52, the activity involved a geometric
3 Eleanor had become an active member of the Texas Instruments’ sponsored Teachers
Teaching with Technology (T3) community, regularly contributing to meetings and
conferences.

How does a multi-representational mathematical ICT tool mediate teachers‟ mathematical and
pedagogical knowledge concerning variance and invariance?
Chapter 8 Discussion
218
representation as its starting point, to which an algebraic interpretation was
introduced.
There were some representational outputs that the teachers rarely used. For
example, displaying the ‘function table’ (showing coordinate values) alongside the
graph of a defined function was a representational output that was only used once
by Eleanor in her final activity [CEL9]. This lack of use could result from the design
of the MRT as the function table can only be revealed alongside a ‘Graphing’ page
after it has been defined and graphed. This is unlike other representational forms
within the MRT that can exist as their own ‘page’ and could be pre-designed into
the activity file. On the other hand, there is some evidence in the research that
little is known about how teachers integrate tables of functions within the teaching
of function and graphs with technology, suggesting that this might be a widely
underused aspect (Goulding and Kyriacou, 2008).
Finally, although the methodological design of this study does not allow for any
conclusive remarks to be made concerning the emergence of social utilisation
schemes for the MRT within the individual schools where Eleanor and Tim taught,
there was emerging evidence of these within the wider community of TI-Nspire
users. Eleanor had joined Tim in becoming an active member of the T3 community
in the United Kingdom. Eleanor presented her lesson ‘Generating circles’ on a
couple of occasions and it stimulated wide discussion amongst other teachers about
the way that she constructed the activity in the classroom and how she had
involved the multiple representations in moving from the numeric, to the geometric
and syntactic forms. Similarly, Tim’s ‘Pythagoras exploration’ had also been taken
up by other teachers.
8.3 How did the teachers learn? - The emergence of the hiccup as
an ontological innovation
The evidence from the study strongly supports the thesis that teachers were
engaged in substantial situated learning, which was prompted by their experiences
of lesson hiccups, as they designed and evaluated activities using the MRT. These
activity designs privileged explorations of variance and invariance in some way and
most also involved multiple mathematical representations. In this sense the hiccup
is considered to be an epistemological phenomenon, that is, a rupture in the fabric
of the teacher’s knowledge.
The hiccup is defined as a perturbation experienced by the teachers during lessons
that is stimulated by their use of the technology and which illuminates

How does a multi-representational mathematical ICT tool mediate teachers‟ mathematical and
pedagogical knowledge concerning variance and invariance?
Chapter 8 Discussion
219
discontinuities in their knowledge. This definition requires the hiccup to have been
‘noticed’ by the teacher and the evidence for this noticing was interpreted as a clear
pause or hesitation on their part. In some cases, the teachers responded to the
hiccup in a way that suggested that they had a previously rehearsed response
repertoire. In others cases, the teachers offered a response, although it appeared
to be ‘in formation’ or a holding response. Some hiccups were ignored by the
teacher within the classroom setting in that no direct response was made.
All of these hiccups provided opportunities for the teachers to at least interrogate, if
not develop their knowledge. It is not suggested that all hiccups would lead to a
clear learning outcome for the teachers. However, the research evidence from my
study is rich with examples of how individual hiccups (and combinations of hiccups)
have prompted the teachers to rethink the subtle aspects of their activity designs.
There were of course many other types of hiccups that occurred during lessons
other than those prompted by the technology. These concerned general classroom
management issues, for example, resulting from students’ off-task behaviour.
However, these were outside of the domain of the study.
If the hiccup is being interpreted as a vital contributory element of the teachers’
situated learning, it is necessary to articulate how the existence of the hiccup
prompted the teachers’ learning (and the nature of this learning) as a means to
understand how the process worked. What follows is a detailed discussion of the
different types of hiccups that emerged from the study, followed by a more
substantial articulation of their role in the teachers’ epistemological development.
8.3.1 Hiccups – the emergent classifications
The cross-case analysis revealed that the hiccups were attributed to the following
eight considerations:
1. 1. Aspects of the initial activity design:
Choice of initial examples.
Sequencing of examples.
Identifying and discussing objects
displayed on the MRT.
Unfamiliar pedagogical approach.
2. 2. Interpreting the mathematical
generality under scrutiny:
Relating specific cases to the wider
generality.
Appreciating the permissible range of
responses that satisfy the generality.
Failing to notice the generality.

How does a multi-representational mathematical ICT tool mediate teachers‟ mathematical and
pedagogical knowledge concerning variance and invariance?
Chapter 8 Discussion
220
3. Unanticipated student responses as a
result of using the MRT:
Students’ prior understanding is
below teacher’s expectation.
Students’ interpretations of activity
objectives.
Students develop their own
instrument utilisation schemes for
the activity.
4. Perturbations experienced by
students as a result of the
representational outputs of the MRT:
Resulting from a syntactic output.
Resulting from a geometric output.
Doubting the ‘authority’ of the
syntactic output.
5. Instrumentation issues experienced
by students when making inputs to the
MRT and whilst actively engaging with
the MRT:
Entering numeric and syntactic data.
Plotting free coordinate points.
Grabbing and dragging dynamic
objects.
Organising on-screen objects.
Navigating between application
windows.
Enquiring about a new
instrumentation.
Deleting objects accidentally.
6. Instrumentation issue experienced by
one teacher whilst actively engaging
with the MRT:
Displaying the function table.
7. Unavoidable technical issues4: Transferring files to students’ handhelds.
Displaying teacher’s software or
handheld screen to the class.
Of these, hiccup types 6 and 7 were considered to be trivial or unavoidable and
these were discarded from the discussion that follows. Consequently, only the first
five types are discussed in detail.
4 As previously mentioned, the teachers were using prototype classroom network technology
which did result in some equipment failures during some lessons. Although these
occurrences were definitely classed as hiccups, they were considered to be outside of the
domain of the research study.

How does a multi-representational mathematical ICT tool mediate teachers‟ mathematical and
pedagogical knowledge concerning variance and invariance?
Chapter 8 Discussion
221
8.3.1.1 Hiccups arising from the initial activity design
The importance of the teachers’ choices of initial examples (and to some extent the
subsequent sequencing of examples), in relation to the contribution that the related
hiccups had to their epistemological development, has already been discussed at
length in Sections 8.2.1 and 8.2.2. This section focuses on a discussion of the
nature of the remaining hiccups that fell into this broad category.
The sequencing of examples within the MRT activities was a common hiccup that
both Eleanor and Tim experienced a number of times. These could be considered
to be the most tangible type of hiccup because they sometimes recurred during the
lesson as the students arrived at a particular point within an activity. Hence they
were often very obvious to the teacher. Tim experienced this hiccup in a highly
visible way when his choice of worksheet in the ‘Equivalent quadratics’ activity
caused students to question the conflict between the notation used by the MRT and
that of the accompanying paper and pencil activity [STP9]. Eleanor concluded that
her lesson ‘Transforming graphs’ was very unsuccessful because she had been
over-ambitious in her expectations of the way that the sequence of examples she
chose would enable the students to appreciate the generalisation as intended.
Within the initial design of tasks, the implicit or explicit notation that was attributed
to the variant objects, either within the actual syntactic notation within the MRT or
as part of the accompanying classroom discourse, was a source of hiccup. This type
of hiccup revealed itself when there were dynamic objects involved (i.e. in activity
[STP6]) as the teacher was challenged to direct the students’ attentions to the
particular variant properties.
Eleanor experienced a hiccup when she introduced a new pedagogical approach to
encourage her students to consider the generalisation they were beginning to make
within the activity ‘Triangles and squares’ [CEL8 Hiccup08]. She used an ‘always-
sometimes-never’ embedded question stem within the TI-Nspire file that gave the
following mathematical statement and asked the students to respond with a single
choice (Figure 8-2).

How does a multi-representational mathematical ICT tool mediate teachers‟ mathematical and
pedagogical knowledge concerning variance and invariance?
Chapter 8 Discussion
222
Figure 8-2 The ‘always-sometimes-never’ question included within Eleanor’s activity
‘Triangles and squares’ [CEL8(tns-T)page2.2]
Eleanor collected their responses, displayed them to the class and initiated the
following discourse:
Eleanor: So one person said „always‟, twenty two of you said
„sometimes‟ and one said „never‟. Why have we got those
answers? Can anyone who said „always‟ want to respond
to the person who said „never‟.
Student: I put „never‟ because every time I tried to it wouldn‟t go,
like it wouldn‟t go exactly.
Eleanor: Okay, right well that‟s maybe to do with the software
that we‟re using, okay? What about sometimes? Staci?
Staci: I managed to get it, but then it might not work with
every single way. If the squares were like, one was
smaller and one was slightly bigger, then it might not
work.
Eleanor: Okay. But you did manage to get it, when did you manage to get it?
Staci: Like two seconds before I moved them
Eleanor: What was special about the arrangement that you had?
[Staci is unsure how to respond]
Don‟t worry, alright... Bryony?
Bryony:
I put sometimes because erm it was sometimes out and
sometimes if you tried to get it to that number it wouldn‟t
work and it would just go to the decimal point after.
Eleanor So slightly with the accuracy. Anybody else sometimes?
[CEL(Trans)]
After the lesson, and in her written lesson reflection, Eleanor commented on how
her initial response on seeing the majority of students answer ‘sometimes’ was that
they had fully understood that ‘sometimes’ was conditional on the enclosed triangle
containing a right angle. However, her questioning of the students led her to
conclude,
The results of this were totally unexpected as most selected sometimes

How does a multi-representational mathematical ICT tool mediate teachers‟ mathematical and
pedagogical knowledge concerning variance and invariance?
Chapter 8 Discussion
223
(which is what was expected) but on further investigation the reasons
behind this were unusual. It was not because of being right angled or
not, it was to do with the accuracy of the technology and that it didn‟t
allow results to always be spot on. [CEL8(Journ-T)]
This hiccup prompted Eleanor to reflect upon how her students were interpreting
‘always-sometimes-never’ within the context of both the mathematics of the task
itself and the way in which the students’ experiences with the technology had
influenced their decisions. She concluded that her students needed more
experience of this type of question within non-technology mediated mathematical
activities before they would be able to see past the ‘machine mathematics’ to the
‘ideal mathematics’ that she was seeking.
8.3.1.2 Hiccups arising from the students’ different interpretations of the
mathematical generality under scrutiny
There were three sorts of hiccups which evidenced that the students had
interpreted the mathematical generality in a different way to that intended by the
teacher in their activity design. In some cases, these hiccups were related to the
students attempting to ‘see beyond’ the example space in which the teacher’s
activity design resided. In others, the students were challenged by the range of
permissible values within the defined example space and in a number of cases, the
students failed to notice the generality at all.
Tim experienced the first of these when a student expressed unease over how a
particular case that she was exploring related to the wider generality during the
activity ‘Circles and lines’ [STP7]. She was working on a task which required her to
justify the points of intersection between horizontal lines of the type y=c, where c
was a positive or negative number and the given circle x2+y2=52.
Student(f): What if the circle... Does the circle have to be from this
point [gestures to the origin] for it to work?
Tim: No it does not have to be from that point? [hesitation] but the equation for a circle I have given you there is
quite a nice equation, x squared plus y squared equals
five squared, yes?
Student(f): yes, it is
Tim: The equation for a circle that's not centred on the origin
is more of a complicated equation.
Student(f): Oh well
Tim: It does have an equation, but it's nastier.
Just to show you that, let‟s try and see if it does it... I've not tried this before... let's draw a circle anywhere, let's

How does a multi-representational mathematical ICT tool mediate teachers‟ mathematical and
pedagogical knowledge concerning variance and invariance?
Chapter 8 Discussion
224
just draw a circle there, okay, that‟s a circle somewhere
else, then if I ask the computer to give me the equation
for that one, there you go
Figure 8-3 Tim’s measured circle function used in
discussion with a student during the activity ‘Circles and
lines’ [STP7(tns-T)v2]
It's x plus two point five eight squared plus y minus one point five one squared equals three point four eight
squared [student laughs] It's a bit messier can you see?
Yes?
Student(f): Yes
Tim: Now actually it's not that complicated because it's gone... It's moved two point five eight one way and one point
five one away from there and the radius of that is three
point four eight...
But can you see that the maths involved would be a bit more complicated there.
Student(f): Yes
Tim: That's why I've kept it fairly straight forward today and
stuck with those, which for GCSE is about all you need to be able to do, okay? 5
[STP7(Trans)]
Tim responded to the student’s question by using the MRT to draw and measure the
equation of a circle that had its centre positioned away from the origin was his first
attempt at this, something that he acknowledged to the student. His willingness to
explore how the MRT would respond, and his satisfaction at being able to justify
how the MRT had displayed the resulting equation, had expanded his knowledge of
the technology in this instance. Knowing Tim as I now did, I would expect him to
see an opportunity to further develop this sequence of lessons to encompass this
functionality, albeit with his older students within the advanced level mathematics
courses.
The hiccups which evidenced that the students’ were uneasy about the permissible
5 Solving equations of this type was beyond the expectation of the mathematics course that
this group of students were following.
How does a multi-representational mathematical ICT tool mediate teachers‟ mathematical and
pedagogical knowledge concerning variance and invariance?
Chapter 8 Discussion
225
range of responses satisfying the generality under scrutiny, were particularly
interesting in that there was evidence that teachers might be able to capitalise on
this as a pedagogical approach, as Eleanor had done within the activity ‘Generating
circles’ [CEL7]. She began the lesson with a quick poll in which she asked the
students to give two numbers, which when individually squared and summed
equalled twenty five. She shared the students’ responses publicly, which initially
included only the values 3 and 4. Eleanor re-sent the poll, asking the students to
think of a different pair of numbers that satisfied the condition. The next set of
responses included a zero, which prompted the hiccup when a student questioned
Eleanor about whether zero was ‘allowed’. Eleanor used this hiccup very
productively to expand the range and type of permissible variables that the
students were allowed to include. Later in the activity, this range was expanded
again as students began to contribute square roots of non square numbers and
negative numbers.
There were many occasions throughout the lesson observations when it was
obvious to both me and the teacher that the students were failing to notice the
mathematical generality in the way that the teacher had anticipated in their activity
design. Indeed, as all of the activity designs had this as a fundamental aim, many
of our associated discussions focussed on this aspect. Therefore it was very
surprising when the analysis of the lesson hiccups revealed only one example where
a noticeable hiccup had occurred. This was in Eleanor’s lesson ‘Transforming
graphs’ [CEL6] as she displayed the screen capture view of the students’ handheld
screens. (This example had been previously discussed in section 7.3.3).
I would hypothesise that very few actual hiccups were observed of this type
because, as a unit of analysis, it was possibly too big to be useful. That is, the
opportunities for the teacher to learn about the ‘global view’ of the students’
appreciation of the generality were elements within other hiccup types. For
example, a previously described hiccup [CEL6 Hiccup09], in which Eleanor used the
‘Always-Sometimes-Never’ question stem to find out if the students had
appreciated the intended generality within the activity ‘Triangles and squares’
[CEL8]. The students’ responses, when probed, seemed to reveal that they had not
appreciated the generality under scrutiny, even though the vast majority responded
‘correctly’ to the question. On the other hand, the use of the screen capture view
and quick poll did offer pedagogic strategies for teachers to assess the whole class
perceptions of the generalities being sought. It would be likely that, as the teachers
developed more use of these functionalities, this type of hiccup might become more
frequent.

How does a multi-representational mathematical ICT tool mediate teachers‟ mathematical and
pedagogical knowledge concerning variance and invariance?
Chapter 8 Discussion
226
8.3.1.3 Hiccups arising from unanticipated student responses as a result of
using the MRT
Whilst it could be argued that any unanticipated student responses could be a direct
outcome of the task design, I am adopting the perspective that it was unrealistic for
teachers to have considered all possible lines of enquiry in an activity’s initial
design, particularly when it involved a new technological tool. From this
perspective, all of the activity designs were initially theoretical, although as the
teachers built their history of experiences, so they were better equipped to consider
possible students’ reactions and build their repertoires of responses. Within the
context of a constructivist mathematics classroom, the notion of ‘student-proof’
activities in which all possible deviations from the designed task were eliminated,
was considered undesirable. My perception of Eleanor and Tim’s activity designs
were that they wanted to design tasks in which alternative lines of enquiry were
encouraged as a means to promoting and extending their students’ thinking. In
classifying hiccups of this type, I considered the incident to be a hiccup if the
teacher’s immediate reaction was one that expressed surprise (or sometimes
dismay) at the outcome.
The hiccups of this type have been previously discussed in Section 8.2.2 within the
context of the teachers’ pedagogical development and, to summarise, they
concerned:
students’ interpretations of the objectives or instructions for the MRT activity
that were broader than the teacher anticipated, sometimes leading to a
more diverse set of students’ responses;
students developing their own instrument utilisation schemes for the
activity;
the MRT outputs prompting classroom discourse that was initiated by the
students;
students’ approaches when using the MRT revealing incorrect interpretations
of the mathematics or their prior understanding that was below the teacher’s
expectation.
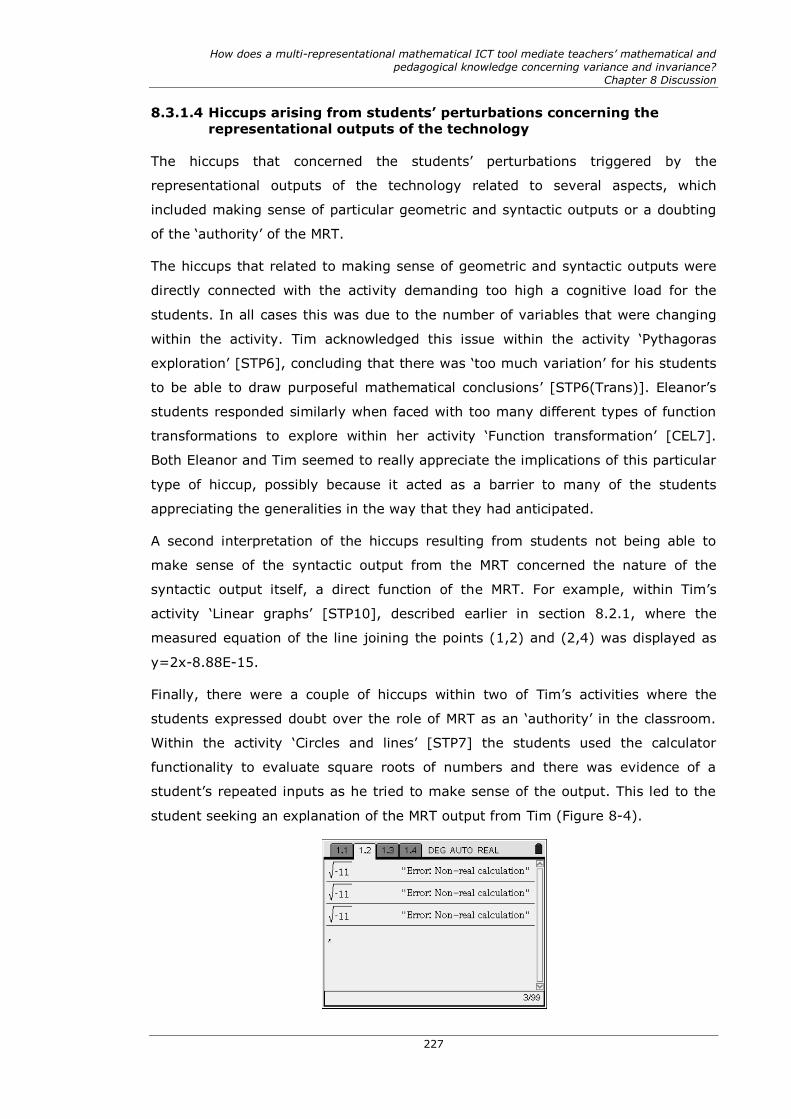
How does a multi-representational mathematical ICT tool mediate teachers‟ mathematical and
pedagogical knowledge concerning variance and invariance?
Chapter 8 Discussion
227
8.3.1.4 Hiccups arising from students’ perturbations concerning the
representational outputs of the technology
The hiccups that concerned the students’ perturbations triggered by the
representational outputs of the technology related to several aspects, which
included making sense of particular geometric and syntactic outputs or a doubting
of the ‘authority’ of the MRT.
The hiccups that related to making sense of geometric and syntactic outputs were
directly connected with the activity demanding too high a cognitive load for the
students. In all cases this was due to the number of variables that were changing
within the activity. Tim acknowledged this issue within the activity ‘Pythagoras
exploration’ [STP6], concluding that there was ‘too much variation’ for his students
to be able to draw purposeful mathematical conclusions’ [STP6(Trans)]. Eleanor’s
students responded similarly when faced with too many different types of function
transformations to explore within her activity ‘Function transformation’ [CEL7].
Both Eleanor and Tim seemed to really appreciate the implications of this particular
type of hiccup, possibly because it acted as a barrier to many of the students
appreciating the generalities in the way that they had anticipated.
A second interpretation of the hiccups resulting from students not being able to
make sense of the syntactic output from the MRT concerned the nature of the
syntactic output itself, a direct function of the MRT. For example, within Tim’s
activity ‘Linear graphs’ [STP10], described earlier in section 8.2.1, where the
measured equation of the line joining the points (1,2) and (2,4) was displayed as
y=2x-8.88E-15.
Finally, there were a couple of hiccups within two of Tim’s activities where the
students expressed doubt over the role of MRT as an ‘authority’ in the classroom.
Within the activity ‘Circles and lines’ [STP7] the students used the calculator
functionality to evaluate square roots of numbers and there was evidence of a
student’s repeated inputs as he tried to make sense of the output. This led to the
student seeking an explanation of the MRT output from Tim (Figure 8-4).

How does a multi-representational mathematical ICT tool mediate teachers‟ mathematical and
pedagogical knowledge concerning variance and invariance?
Chapter 8 Discussion
228
Figure 8-4 An example of a student’s handheld screen in which the MRT’s authority
appears to be doubted during the activity ‘Circles and lines’ [STP7(tns-S)].
The other hiccup occurred during the activity ‘Equivalent quadratics’ [STP9] when
one student questioned the response from the MRT after Tim had entered a
mathematical statement (Figure 8-5).
Figure 8-5 Tim’s handheld screen that led to a student asking ‘Why didn't it say
false?’ within the activity ‘Equivalent quadratics’ [STP9(tns-T)].
Student(m): Why didn't it say false?
Tim: Sorry?
Student(m): Why didn't it say false?
Tim: Because we got it right.
If I'd done... and I can copy this... [Tim copies line and
pastes it below]
Let's say I didn't put eighteen, let's say I put seventeen, instead of eighteen, that would have been wrong...
'cause we worked out it was eighteen yeah?
[Tim changes the eighteen to seventeen]
If I put seventeen in instead, it says false.
Alright? You get the idea?
[STP9(Trans)]
In the second hiccup example, Tim’s technical knowledge and confidence enabled
him to respond quickly to the student’s question. It was interesting in that Tim’s
immediate response was to provide another example, whereas the deeper
interpretation of the student’s question may not have related to the MRT’s
authoritative output at all. He may have been addressing a far more fundamental
issue concerning why (x+2)(x+9)= x2+11x+18 was true.

How does a multi-representational mathematical ICT tool mediate teachers‟ mathematical and
pedagogical knowledge concerning variance and invariance?
Chapter 8 Discussion
229
8.3.1.5 Hiccups arising from students’ inputs and active engagement with
the technology
An unsurprising (in my view) aspect of the research findings related to the
occurrence of hiccups resulting from the students’ instrumentation of the MRT. This
finding resonated with the extensive body of research concerning the difficulties
that students experience when learning to use a new technology for mathematics.
The nature of the hiccups was also unsurprising in that they concerned: entering
numeric and syntactic data; plotting free coordinate points; grabbing and dragging
dynamic objects; organising on-screen objects; navigating between application
windows; enquiring about new instrumentations and deleting objects accidentally.
It should be stressed that the range of classes that Eleanor and Tim selected to use
the MRT varied greatly in their mathematical abilities and experience with the MRT.
This study was not designed to draw any conclusions concerning the frequency and
nature of this particular type of hiccup as the primary research subjects were the
teachers.
However, a noticeable outcome of the analysis of this type of hiccup was related to
Eleanor and Tim’s skill in responding to them. They demonstrated that they
understood the hiccups immediately and exhibited a range of confident response
repertoires. Over the course of the whole study, there was significant evidence to
suggest that Eleanor, in particular, had evolved a very successful set of classroom
strategies to support the students’ instrumentation phase (see section 7.3.3).
8.3.2 Hiccups – their role in teacher learning
This section seeks to expand upon the way in which the hiccup can be described as
an ontological innovation to support an articulation of how Eleanor and Tim
appropriated the mathematical, pedagogical and technical knowledge through their
design and evaluation of activities using the MRT, which privileged variance and
invariance.
An important aspect of the hiccup is that it provided the opportunity for the teacher
to rethink and reflect upon the conditions for its occurrence. In trying to understand
how any particular hiccup may have contributed to the teachers’ epistemological
development, two things needed to have happened. Firstly, the hiccup needed to
have been noticed by the teacher, which by definition was indicated by a noticeable
pause or hesitation. Secondly, the teacher needed to have rationalised or reflected
upon the hiccup in some way, such that their subsequent actions indicated that an
aspect of situated learning may have resulted. It would be naïve to suggest that
there was a direct causal link between all hiccups all subsequent actions, but there

How does a multi-representational mathematical ICT tool mediate teachers‟ mathematical and
pedagogical knowledge concerning variance and invariance?
Chapter 8 Discussion
230
is enough evidence in this study to suggest that, over time, the teachers involved
developed their mathematical, pedagogical and technical knowledge in response to
their hiccups. It would also be naïve to suggest that my exchanges with the
teachers (and indeed their involvement in the study) had not also influenced
opportunities for the teachers’ situated learning during the second phase. Whilst I
cannot surmise what might have happened had I not been there, it is highly likely
that their learning was accelerated by having a ‘significant other’ with whom to
discuss activity designs, classroom experiences and, most importantly, reflect upon
the hiccups.
Mason and Spence argue that the importance of ‘knowing-to act’ is an essential
aspect of teachers’ pedagogic knowledge that is not just dependent upon the
situation, but the psychological stance of the person in that situation (Mason and
Spence, 1999, p.141). Taking the premise that the hiccup presents the teacher with
an unanticipated situation, Mason and Spence claim that each situation ‘triggers
and resonates access to acts’ and that ‘these triggers and resonances can be
enhanced and sensitised’. This study revealed that both Eleanor and Tim had
become sensitised to the hiccups that related to their students’ instrumentation
skills with the MRT. However, there were notable aspects of their subject and
pedagogical knowledge concerning the design and structuring of tasks exploring
variance and invariance, for which their sensitivities were less acute. The notion
that the teachers might not ‘know-to’ act in the moment is a realistic one that could
be explained by them just not thinking about it or, as in Eleanor’s case, when faced
with the Emily’s curved graph, her reaction suggested that she may have exhibited
‘cognitive dissonance’ (Festinger, 1957). The combination of her praise to Emily
followed by a direct instruction not to ‘do curved graphs’ suggest that Eleanor was
holding conflicting ideas regarding her admiration of Emily’s creative response to
the task alongside her mathematical boundaries for the topic.
There was a need for the teachers to have understood the hiccup, something that
was not always possible in ‘real-time’ during the lesson. This was when the post-
lesson discussions and emails were important, particularly if my own systematic
analysis of the research data had provided opportunities to revisit certain hiccups
with the teachers, some time after the lessons had taken place. For example,
Eleanor and I discussed a student’s screen which was captured halfway through the
second lesson when she was working on the activity ‘Crossing linear graphs’
[STP9]. Eleanor had introduced the task that required the students to use the MRT
to generate linear functions other than y=2x that would pass through the
coordinate (3,6). Immediately after the task introduction, Maria asked Eleanor a

How does a multi-representational mathematical ICT tool mediate teachers‟ mathematical and
pedagogical knowledge concerning variance and invariance?
Chapter 8 Discussion
231
question.
Maria: Miss, can we do two x plus one minus one?
Eleanor: [Hesitated and looked at the graph on the board]
No. [firmly]
Well you can... [questioningly]
Maria: Is that cheating?
Eleanor: Well you can - yeah, but it's not exactly very exciting is
it. [CEL7(Trans)]
Eleanor then moved away to talk with another pair of students and Maria had no
more direct discourse with her during the lesson, nor did Maria’s handheld screen
feature in any whole class discourse.
A few weeks later, after I had transcribed the lesson, Eleanor and I met to discuss
the lessons. I had selected the above extract from the transcript and we reviewed
Maria’s TI-Nspire file (Figure 8-6 and Figure 8-7).
Figure 8-6 Maria’s handheld screen
showing her response to the activity ‘Crossing linear functions’ [CEL9(tns-
S)1].
Figure 8-7 Maria’s corresponding
functions for the graphs displayed in the previous figure [CEL9(tns-S)1].
Eleanor’s immediate reaction was one of hesitation as she tried to make sense of
what Maria had done. She then expressed some surprise and immediately
appreciated the mathematical implication of her giving Maria permission to enter
equivalent functions. Eleanor admitted that she had never thought about this
before and, although she then realised it was obvious, she also saw an opportunity
to develop a task for her younger students that would specifically explore
equivalent expressions. Eleanor also suggested that she could use such an
approach in an activity to check algebraic expansions graphically.
Eleanor was intrigued about Maria’s subsequent progress during that activity and
we reviewed her TI-Nspire file, which was captured at the end of the lesson.

How does a multi-representational mathematical ICT tool mediate teachers‟ mathematical and
pedagogical knowledge concerning variance and invariance?
Chapter 8 Discussion
232
Figure 8-8 Maria’s handheld screen
showing her response to the activity
‘Crossing linear functions’ later in the
same lesson [CEL9(tns-S)2].
Figure 8-9 Maria’s corresponding
functions for the graphs displayed in the
previous figure [CEL9(tns-S)2].
Eleanor was relieved to see that Maria had broadened the type of function that she
was entering and moved away from equivalent functions to include some of the
functions that had featured during the intervening whole-class discourse. Eleanor
commented that adopting a more systematic approach to reviewing the students’
files, as a means of gaining an insight into their mathematical thinking was
something that she felt would be useful to add to her practice.
Both teachers experienced a certain level of anxiety concerning their personal
aspirations to be able to respond to everything that was now visible. In the short
term, that is during individual activities, this concerned identifying the focus for and
the timing of the activity ‘pinch-points’. In the medium term, this was more
focussed towards smoother progressions for subsequent activities. There were
times when it appeared that the more the teacher knew the harder it became to
know how best to guide the learners.
Within the study, there was little evidence of the teachers beginning to plan for
particular hiccups to happen as an integral part of an activity’s design, although I
would hypothesise that this would begin to happen as they revisited familiar
activities with new classes.
8.4 The impact of the classroom network technology on Eleanor
and Tim’s learning
This study was not specifically designed to examine the role of the classroom
network technology, which both Eleanor and Tim began to use during the second
phase. However, as it became part of the technical setup in their classrooms, it had
an obvious and observable impact on several aspects of their professional learning.
An immediate impact resulted from the functionality that enabled TI-Nspire files to

How does a multi-representational mathematical ICT tool mediate teachers‟ mathematical and
pedagogical knowledge concerning variance and invariance?
Chapter 8 Discussion
233
be sent from the teacher’s handheld device or computer to the students’ handhelds
at any time during the lesson. This meant that the files could be developed and
amended, moments before the beginning of a lesson, or developed collaboratively
with the students during the lesson. In both teachers’ cases, the teachers
developed pedagogical approaches which involved the students in co-constructing
the software files with which they would be interacting. It appeared that this
process of co-construction had a positive impact upon the students’ willingness to
participate in the activities, as they anticipated the files being sent and were
generally motivated to open the file to begin the exploration. It also meant that the
students did not necessarily need all of the instrumentation skills to construct each
MRT task, although they were aware of its underlying construction. Both Eleanor
and Tim commented that this was a distinct advantage of the classroom network
technology.
The screen capture functionality, whereby all of the students’ handheld screens
were simultaneously displayed on public view in the classroom, appeared to have
had a noticeable impact on a number of aspects of Eleanor and Tim’s learning. This
shared display prompted just over a quarter of the total number of lesson hiccups
(n=63) which were mostly concerning:
unanticipated students’ responses [CEL9H4], [CEL6H6], [CEL7H3],
[CEL8H7], [CEL9H1], [CEL8H5], [STPH10], [STPH13], [STP7H1].
interpreting the mathematical generality under scrutiny [CEL7H1],
[CEL8H3], [STP10H11] ;
issues concerning the initial activity design [STPH1], [STPH9],
[STP10H12];
students’ perturbations stimulated by the representational outputs of the
multi-representational technology [TP10H8], [TP7H1].
For both teachers the hiccups that resulted from unanticipated students’ responses
were the type of hiccup that was made most visible by the screen capture view.
Whilst it could have been possible that the teachers would have experienced the
same hiccups whilst moving around the classroom and supporting individual
students, it seems more likely that the simultaneous display of all of the students
screens vastly increased the probability of the hiccup occurring.
Finally, both teachers used the quick poll (or the embedded questioning facility6) at
6 The classroom network system enabled the teacher to embed questions within the TI-
Nspire file, which could then be collected, displayed and analysed.

How does a multi-representational mathematical ICT tool mediate teachers‟ mathematical and
pedagogical knowledge concerning variance and invariance?
Chapter 8 Discussion
234
least once during the second phase (Eleanor n=3, Tim n=2). In all of these uses
except one [CEL7], it resulted in a lesson hiccup. As the students’ answers were on
public display using screen capture view, these have been included in the analysis
above.
Eleanor and Tim both commented that having the screen capture functionality
improved their awareness of their students’ mathematical knowledge and
understanding. Tim commented that ‘the maths that my students struggle with is
not always what I expect’ (STPJourn-T).
I interpreted this in two ways. There was an immediate pragmatic knowledge that
would influence their decisions about the next episode in that lesson or a
subsequent lesson. However, there was the potential for more epistemic
knowledge, whereby their teaching practices would evolve to use the diversity of
the students’ responses as part of their pedagogy. Eleanor had begun to do this in
her lesson ‘Generating circles’ [CEL7] when she used the diversity of the students
responses to force them to decide upon the numerical domain for the problem.
Tim captured the dilemmas that teachers face in this new pedagogic setting when
he said ‘I will not always be able to respond to everything that I am bombarded
with... I have to make choices’ (Journ-T). Both Eleanor and Tim had learned about
the diversity of students responses within different activities and this learning was
informing their subsequent activity designs. In addition they were evolving
strategies for responding to this diversity in the classroom setting as it happened.
This new knowledge could be interpreted as Mason and Spence’s ‘knowing-to act in
the moment’ which requires ‘some degree of sensitivity to features of a situation’
and ‘a degree of readiness as a result of what is being attended to’ (Mason and
Spence, 1999, p. 151). The ways that Eleanor and Tim acted in response to the
various hiccups they experienced gave an insight into their different forms of this
knowledge. There was only one example when Eleanor and Tim both experienced
an identical hiccup in a lesson as a result of the shared public view. Tim’s response
to an unanticipated response by a student during the ‘Pythagoras exploration’ was
very different response to Eleanor’s when faced with the same situation (see Figure
8-10 and Figure 8-11). Tim was confident in the mathematics such that he was able
to justify the correctness of the situation to the students, whereas Eleanor was
more hesitant and offered no immediate explanation.

How does a multi-representational mathematical ICT tool mediate teachers‟ mathematical and
pedagogical knowledge concerning variance and invariance?
Chapter 8 Discussion
235
Figure 8-10 A student’s response to Task
2 within Tim’s lesson ‘Pythagoras
exploration’ [STP6(tns-S)]
Figure 8-11 A student’s response to Task
2 within Eleanor’s lesson ‘Triangles and
squares’ [CEL8(tns-S].
8.5 Summary
This chapter discussed the findings in relation to Eleanor and Tim’s situated
learning as a cross-case analysis as relevant to the aim for the research. This
learning was categorised with respect to the evolution of their mathematical,
pedagogical and technical knowledge that resulted from their lesson hiccups. This
was followed by a commentary of the nature of the lesson hiccups and an
articulation of the hiccup theory of teachers’ situated learning. The chapter
concluded with a discussion of the contribution that the networked classroom
technology made to the teachers epistemological development.
How does a multi-representational mathematical ICT tool mediate teachers‟ mathematical and
pedagogical knowledge concerning variance and invariance?
Chapter 9 Conclusions and implications
236
9 CONCLUSIONS AND IMPLICATIONS
The contingent moments or „hiccups‟ that teachers experience when
integrating a multi-representational technology into their classroom
practice provide both rich contexts for their situated learning and fruitful
foci for professional discourse.
9.1 Introduction
This chapter summarises what has been achieved by this research project and
articulates how the findings contribute to the research field within the domain of the
study. In doing so, it makes links between the research findings and those of the
key studies outlined within the review of literature. In addition, it suggests ways in
which the process of mathematics teacher development concerning multi-
representational technologies might be reconceived. The limitations of the study are
discussed and some directions for further research are identified.
9.2 Summary of the findings
The findings of the study are organised as follows:
The theoretical construct of the ‘triad of instrumented activity’ (within the
context of the study) is expanded upon as a direct outcome of the research.
The way in which the teachers’ ideas about mathematical variance and
invariance shaped and were shaped by their use of the technology is
described.
Some important considerations for activity designs that involve the
exploration of mathematical variance and invariance within MRT
environments are concluded.
9.2.1 Reconsidering the triad of instrumented activity
This study sought to develop a clearer articulation of the nature of the ‘object’
within Verillon and Rabardel’s triad of instrumented activity, which had been
adapted for the research as shown in Figure 9-1.

How does a multi-representational mathematical ICT tool mediate teachers‟ mathematical and
pedagogical knowledge concerning variance and invariance?
Chapter 9 Conclusions and implications
237
Figure 9-1 My adaptation of Verillon and Rabardel’s triad of instrumented activity in
which the instrument is the TI-Nspire handheld, the subject is ‘teachers as learners’
and the object is teachers’ learning about the teaching and learning of
mathematics through the exploration of mathematical variance and invariance.
The methodological approach developed for the study was designed to illuminate
the trajectory of the teachers’ epistemological development, as evidenced by the
evolution of their instrument utilisation schemes alongside their personal
mathematical and pedagogical knowledge development as they designed and
evaluated classroom activities. The longitudinal case study approach provided rich
data that illuminated the nature of the different interactions within the triad. Each
of the interaction types within the triad is now considered individually with respect
to how each type of interaction contributed to the teachers’ learning within the
domain of the study
9.2.1.1 Direct Subject-Object (dS-O) interactions
This element of the triad concerns the non-technology mediated ways that teachers
developed their ideas and approaches to incorporate an expanded perspective of
mathematics and its pedagogy. It is therefore very difficult to identify the learning
that took place as a result this type of interaction because the context for this study
concerned the use of technology. I did not have lesson observation data to be able
to compare the teachers’ approaches to the exploration of variance and invariance
in the non-technology settings. However, the teachers’ personal reflections on the
outcomes of their technology mediated learning (mS-O) provided an insight into

How does a multi-representational mathematical ICT tool mediate teachers‟ mathematical and
pedagogical knowledge concerning variance and invariance?
Chapter 9 Conclusions and implications
238
their broader thinking. They encountered the following aspects of their learning
within the technology setting that could be ‘transferable’ to the non-technology
setting:
A broader conception of mathematical variance and invariance.
An appreciation of different forms of expression of mathematical generality.
The importance of the initial choice and expandability of the example space.
An appreciation of the teachers’ role in supporting students transitions
between different mathematical representations within paper and pencil
approaches.
However, particularly in Eleanor’s case, there was strong evidence to suggest that
the use of the technology had enhanced her own mathematical understanding
which would impact upon her confidence to teach certain topics within the non-
technology setting if she so chose.
9.2.1.2 Direct Subject-Instrument (S-I) interactions
This type of interaction was predominantly concerned with development of the
individual teachers’ instrumentation of the MRT. For Eleanor and Tim, this
development spanned Phase One and Phase Two of the study, which was a period
of two years and five months. There was a visible trajectory of development in both
the range of representations that the teachers privileged and their competence and
confidence to move between the different representations. To some extent, the
teachers mirrored the students’ behaviour in Guin and Trouche’s research in that
they were initially in a phase of discovery as they realised the affordances of each
application in the MRT, and moved into a phase where they sought mathematical
consistency between representations (Guin and Trouche, 1999). However, their
underlying motives for these actions were very different to those of the students in
Guin and Trouche’s study. As they were learning to use the various applications,
the teachers engaged in meta-level thinking, which concerned the accessibility of
the related instrumentation steps for their own students. For the teachers, it was
difficult for them to separate these two trains of thought. In Eleanor’s case she
would note down her own instrumentation steps and later incorporate these into
her own lesson plans and structures for her students. Tim was more confident of his
own instrumentation skills with the MRT, appearing to internalise his new
technological knowledge more quickly and he tended to support his students
verbally in the classroom.

How does a multi-representational mathematical ICT tool mediate teachers‟ mathematical and
pedagogical knowledge concerning variance and invariance?
Chapter 9 Conclusions and implications
239
9.2.1.3 Direct Instrument-Object (I-O) interactions
This element of the triad concerns the ‘cold’ interactions between the teachers’
learning and the technology, which was triggered by the outputs from the MRT in
the classroom setting. For example, Tim learned about the ‘unhelpful’ format of the
measured linear equation in his activity ‘Linear graphs’ [STP10]. The research
revealed that, although the teachers may have conceptualised the instrumentation
utilisation scheme for an activity at the planning stage, they did not always
rehearse all of the instrumentation steps in advance of the lesson. Hence a number
of hiccups occurred in the classroom situation that would provide evidence for the
way that these forms of interaction contributed to the teachers’ overarching
epistemological development.
These interactions were highly significant in the teachers’ epistemological
development as in some ways the teachers were more willing to rethink the MRT
activity as a tangible response. The TI-Nspire file was an artefact that could be
‘blamed’ and redesigned, whereas remembering the human classroom interactions
that may have instigated a particular hiccup and reconsidering the pedagogical
approach was more difficult. The teachers needed both time and the systematic
evidence that the study produced to support this deeper reflective process to
happen. However, I would consider that it is essential that teachers have an
opportunity to make sense of the hiccups that were revealed as a result of the
unanticipated outputs from the technology itself. There is a danger that, without
such opportunities, teachers would reject the use of technology completely because
it ‘throws up’ occasional responses which place them in situations in the classroom
that they lack the confidence and knowledge to question or explain.
9.2.1.4 Mediated Subject-Object (mS-O) interactions
This particular interaction was of predominant interest to my study as I sought to
understand the processes through which the technology supported the trajectory of
the teachers’ epistemological development concerning variance and invariance.
Consequently, sections 9.2.2 and 9.2.4 articulate this in more detail by considering
how the teachers’ mathematical ideas shaped and were shaped by their interactions
with the technology and the role that the lesson hiccups had in stimulating this
development.

How does a multi-representational mathematical ICT tool mediate teachers‟ mathematical and
pedagogical knowledge concerning variance and invariance?
Chapter 9 Conclusions and implications
240
9.2.2 How teachers’ mathematical ideas about variance and
invariance shaped and were shaped by their uses of the
technology
There was a two-way consideration of the nature of the way in which the
mathematical terrain was being reconceptualised with respect to its content and
pedagogies. The teachers’ mathematical ideas of variance and invariance shaped
how they used the technology, which was evident from the activities they designed
and the representations that they privileged. The converse was also true as their
activity designs were shaped as a result of their increased knowledge about the
affordances of the MRT.
The study revealed a number of ways in which the teachers’ mathematical ideas
concerning explorations of variance and invariance shaped their use of the
technology. The data from the first phase revealed teachers’ initial tendencies to
develop instrument utilisation schemes that relied on single inputs which were
examined in a single output representation (IUS1). Their choice of representations
gave an indication of how they initially conceived the variant and invariant
properties and it was understandable that the teachers would take it slowly in
becoming familiar with different representational forms (and the associated
instrumentations) before they were in a position to begin to consider these
alongside each other. The significance of Eleanor and Tim’s positioning of this initial
example space became more apparent as the project progressed and, irrespective
of their increased knowledge of the affordances of the MRT, they began to use
familiar representations to develop more substantial activities. Tim’s activity ‘Circles
and lines’ [STP7] was a good example of this as it required little more than a
geometric figure displayed by the MRT as a stimulus for the activity that followed.
Over time, Eleanor and Tim’s increasing knowledge of the technology and its
functionalities provided substantial evidence for how the teachers’ mathematical
ideas concerning explorations of variance and invariance were being shaped by
their use of the technology. In his final reflection, Tim wrote,
During the original TI-Nspire project I had a very distinct moment when
all of a sudden I recognised the importance of variation (in its many
forms) to focus student attention. This led to the two-part article that I
wrote for ATM. In it I recognised the need to identify the mathematical
property (generalisation?) that I am trying to draw attention to... and
then identify the variables within the situation. Then by using ICT, vary
that which will draw attention to the mathematical property. I mention

How does a multi-representational mathematical ICT tool mediate teachers‟ mathematical and
pedagogical knowledge concerning variance and invariance?
Chapter 9 Conclusions and implications
241
this because after I had this 'moment'... my thinking processes in task
design began to change. There was greater clarity in my head for the
need to consider what I wanted to vary as I planned the Mathematics-
ICT task. Up until this point I designed tasks that did involve variation...
but I don't think that I was as aware of what I was doing in the task
design. [STPJourn-T]
In Tim’s case, the focus on lesson design that formed a large part of the
professional activity during the first phase of the project had stimulated him to
reflect upon the importance of a deep consideration of the variant and invariant
properties within his task design. His Phase Two activities clearly evidenced how he
was continuing to do this, and still learning about how complex a process this was.
Although Eleanor had not verbally articulated her personal reflections on her
epistemological development as deeply as Tim had, the research data was rich with
evidence of how her thinking and planning had been significantly influenced by the
affordances of the MRT. In her case, several seeds of ideas stayed dormant within
her until she saw an opportunity to use them in her own classroom and she was
openly influenced by the ideas of others involved in the project. On several
occasions Eleanor referred to her lesson activities as having ‘a backward approach’,
in that the students were being given the opportunity to experience a mathematical
situation first before being presented with the underlying theory.
A number of activities developed by Eleanor and Tim could be considered to be
offering new approaches to the mathematics that are not evident in existing
schemes and resources. For example, Tim’s ‘Pythagoras exploration’ [STP6] took as
its starting point an example space that was much broader than that evident within
the current legitimate curriculum and Eleanor’s ‘Generating circles’ [CEL7] offered
an insight into how the integration of multiple representations might be manifested
in accessible activities for secondary students.
There was very clear evidence that Eleanor and Tim had developed ‘warranted
practice’ in their use of the MRT, as described by Ruthven, in which they had
articulated explicit rationales for their ‘practice in action’, analysed the processes in
operation, assessed the impact on their students’ development and sought to refine
their practices accordingly (Ruthven, 1999). In developing this practice, they both
developed the language through which they could better articulate the tacit
knowledge that Polanyi and Schön describe as an integral part of human thinking
and practice (Polanyi, 1966, Schön, 1987).

How does a multi-representational mathematical ICT tool mediate teachers‟ mathematical and
pedagogical knowledge concerning variance and invariance?
Chapter 9 Conclusions and implications
242
9.2.3 Designing activities that privilege the exploration of variance
and invariance in a MRT environment
The scrutiny of over eighty classroom activities within this study, the majority of
which emphasised the exploration of variance and invariance, has provided a
substantial data set on which to base a response to Stacey’s call for further
research, ‘What are the major considerations when exploiting each of the
pedagogical opportunities’ within the pedagogical map (Stacey, 2008).
Mason et al’s premise that ‘a lesson without the opportunity for learners to express
a generality is not in fact a mathematics lesson’ could be considered to have been
an initial constraint for the teachers involved in this study when designing their
activities to explore variance and invariance (Mason et al., 2005, p.297). However,
an element of the teachers’ epistemological development was related to their
realisation that expressing generality was a very important aspect of the activities
that they went on to design. The teachers’ increasing attentions to the way that the
MRT environment supported or hindered this, and the design of the associated
supporting resources and their role in mediating the associated classroom
discourse, was another element of their professional development.
Evidence from the study suggests that the process of designing tasks that utilise
the MRT to privilege explorations of variance and invariance is a highly complex
process which requires teachers to carefully consider how variance and invariance
might manifest itself within any given mathematical topic. The relevance and
importance of the initial example space, and how this might be productively
expanded to support learners towards the desired generalisation is a crucial aspect
of activity design.
The starting point for any classroom activity is its initial design and the following set
of questions, generated as a result of this study offer a research-informed
approach:
What is the generalisable property within the mathematics topic under
investigation?
How might this property manifest itself within the multi-representational
technological environment – and which of these manifestations is at an
accessible level for the students concerned?
What forms of interaction with the MRT will reveal the desired
manifestation?
What labelling and referencing notations will support the articulation and

How does a multi-representational mathematical ICT tool mediate teachers‟ mathematical and
pedagogical knowledge concerning variance and invariance?
Chapter 9 Conclusions and implications
243
communication of the generalisation that is being sought?
What might the ‘flow’ of mathematical representations (with and without
technology) look like as a means to illuminate and make sense of the
generalisation?
What forms of interaction between the students and teacher will support the
generalisation to be more widely communicated?
How might the original example space be expanded to incorporate broader
related generalisations?
There is a degree of resonance between the questions posed as a result of this
study (concerning the design of activities privileging explorations of variance and
invariance) with the principles of lesson design that Pierce and Stacey concluded
following an analysis of the use of TI-Nspire handhelds to privilege the use of
multiple representations within the teaching of quadratic functions (Pierce and
Stacey, 2009). Their principles included:
focus on the main goal for that lesson (despite the possibilities offered
by having many representations available); identify different purposes
for using different representations to maintain engagement; establish
naming protocols for variables that are treated differently when working
with pen and paper and within a machine; and reduce any sources of
cognitive load that are not essential. [ibid, p.228]
Responses to the questions just posed uncover a very generic ‘top level’ of thinking
which makes little sense in the absence of a clear mathematical context. The next
level of thinking becomes closely related to the topic of the mathematics itself for
which a number of existing structures and approaches can support teachers to
develop further this aspect of their practice (Watson and Mason, 1998, Mason and
Johnston-Wilder, 2005, Mason et al., 2005).
9.2.4 The significance of the hiccup in understanding and
articulating pedagogy
The need for mathematics teachers to have contingent knowledge that enables
them to respond in-action is a firmly established aspect of the research literature
(Shulman, 1986, Rowland et al., 2005, Mason and Spence, 1999). However, the
research literature concerning how this contingent knowledge developed through
classroom practice is under developed. This thesis makes an original contribution to
understanding what and how teachers learn about the concept of mathematical

How does a multi-representational mathematical ICT tool mediate teachers‟ mathematical and
pedagogical knowledge concerning variance and invariance?
Chapter 9 Conclusions and implications
244
variance and invariance within a technological setting through the construct of the
lesson hiccup.
Hiccups, by their definition, only occurred if the teacher noticed them. This implies
that the teacher needed to have an existing knowledge of the mathematics and the
technology, which sensitised them to the hiccup. Their associated knowledge would
be an influence on the degree of this sensitivity. For example, when Eleanor noticed
that her structuring of the students’ worksheet within the lesson ‘Transforming
graphs’ [CEL6] made it difficult for her to develop the classroom discourse in the
way she had envisaged, her existing mathematical knowledge-in-action was such
that she could not fully appreciated the meaning behind the hiccup.
The teachers did appreciate that some hiccups, although possibly unwelcome when
they were first experienced, might actually be desirable and designed into future
activities. For example, in some situations a diversity of students responses might
make it difficult for the teacher to support the class towards particular
generalisations, whereas in others activities it might expand the example space.
This element of knowing when hiccups might be reconceived as a teaching
approach is an element of the new pedagogies that became possible for the
teachers working in the MRT environment with access to the shared public view.
Indeed Eleanor developed this pedagogical approach within her activity ‘Generating
circles’ [CEL7] when she used the students’ diversity of numerical responses to
expand their notion of the acceptable number range.
An important appreciation of the lesson hiccup is that, although they might
sometimes be unwelcome or unhelpful, they undoubtedly provided an opportunity
for the teachers to reflect on the experience and to develop their mathematical,
pedagogical and technological knowledge. In many cases the teachers’ gained a
deeper insight into their students’ prior knowledge and understanding.
A number of the hiccups instigated by the students’ own mathematical questions
developed into mathematical pinch-points during the activities in which the
teachers saw validity in the question that was worthy of a wider classroom
discourse. Again, the teachers’ sensitivity to these questions was crucial in taking
up the opportunities motivated by the students’ own ideas. However, in some cases
the teacher’s own subject knowledge and confidence could hinder productive lines
of enquiry. Alternatively the teacher feels pressured to rationalise the students’
question alongside the legitimate curriculum.
The process through which teachers mediate whole class discourse with a view to
arriving at a consensus with respect to new mathematical knowledge when the

How does a multi-representational mathematical ICT tool mediate teachers‟ mathematical and
pedagogical knowledge concerning variance and invariance?
Chapter 9 Conclusions and implications
245
‘substance’ is provided by a multi-representational technology is another important
element of their developing pedagogy, an element highlighted in other studies
(Guin and Trouche, 1999, Drijvers et al., 2010).
9.2.5 Peripheral findings from the research
A number of peripheral findings emerged from the study and, although in some
cases there was insufficient or incomplete data to support any bold claims from the
research, it did signify that future research in these areas would be desirable.
9.2.5.1 The impact of the classroom network technology
The discussion provided in section 8.4 highlighted a number of ways in which the
network classroom technology provided a significant window onto the teachers’
professional learning. This was evidenced by the proportion of lesson hiccups that
were made visible through its functionalities, in particular the screen capture view.
It follows therefore that, if the central tenet for this thesis is that lesson hiccups
form an important contributory element of teachers’ situated learning within the
domain of the study, increasing the visibility of these hiccups could increase the
rate of teaching learning within MRT settings.
However, both teachers expressed doubt over the demands that this widely
expanded view of their students’ thinking placed on their abilities to steer the
mathematical path within lessons. This led to a focussing of their activity designs as
they very quickly began to appreciate important aspects such as the example
space, levels of cognitive load and the labelling and notation of variant objects.
There was no doubt that the classroom network technology proved to be a
significant research tool as a wealth of data was made available to me that may
otherwise had remained hidden. The ability to capture students’ work (files and
screen capture views) during mathematical ‘pinch-points’ and analyse these
alongside the lesson transcripts was an important element of the professional
discussions I had with the teachers, in addition to the obvious advantage as a data
collection method.
There was one highly visible outcome of the use of the classroom network
technology, which concerned my own and the teachers’ observations of the
students’ level of engagement with the mathematical activities in both Eleanor and
Tim’s classrooms. We noticed that the students appreciated working on the same
file as a class and anticipated receiving it on their own handheld to be able to
continue their own explorations. The students found the screen capture view a

How does a multi-representational mathematical ICT tool mediate teachers‟ mathematical and
pedagogical knowledge concerning variance and invariance?
Chapter 9 Conclusions and implications
246
motivating environment and actively sought similarities and differences between
their own screens and those of their peers. In many cases, the students instigated
the mathematical pinch-points in lessons by announcing their own theories or
questioning other students’ responses. In this sense the classroom dynamic was
visibly placing students’ work at the heart of the classroom discourse in the way
that Pierce and Stacey described (Pierce and Stacey, 2008). However, there is a
need for longitudinal systematic studies which explore the students’ experiences in
such classrooms as a means to understanding how the nature of the mathematics
curriculum and its pedagogies might be reconceptualised in such environments.
9.2.5.2 The design of the TI-Nspire handheld
This study was not designed to evaluate the individual functionalities of the TI-
Nspire handheld and, as the operating software was revised several times during
the period of the study there were aspects of its instrumentation that continuously
evolved. However, my research did reveal that the subtleties of this evolution were
an aspect of the teacher’s technological knowledge development that resulted in
both successes and frustrations. For example, functionality that was previously
identified by the teachers as being pedagogically helpful disappeared. For example,
during Phase One all of the teachers responded positively to the appearance of the
actual names of the variables within the equation of the measured ‘movable line’
within the activity ‘Weighing sweets’ [GBA3/GAS1].
There were some aspects of the functionality that were underused in both Phase
One and Phase Two of the study, which might be a result of their location within the
menu structure. The function table was an example of this and I have suggested
possible reasons for this within section 8.2.3.
9.3 Rethinking mathematics teachers’ professional development
concerning multi-representational technology
The longitudinal nature of this study has enabled a number of recommendations to
be made concerning the nature, focus and timescale of teachers’ professional
development activities involving the MRT. In addition, prompted by my reflections
of my role during the second phase, the importance of a ‘significant other’ in
supporting teachers’ development is also considered.
How does a multi-representational mathematical ICT tool mediate teachers‟ mathematical and
pedagogical knowledge concerning variance and invariance?
Chapter 9 Conclusions and implications
247
9.3.1 The need for a clear mathematical focus
It is very common for teacher development projects and courses that are concerned
with technology to focus mainly on developing teacher’s instrumentation skills at
the expense the important discussions concerning the nature of the mathematics
under consideration and the associated pedagogical considerations. During the
second phase of the study, the mathematical focus for the research ‘variance and
invariance’ provided a challenging and relevant focus to support both Eleanor and
Tim to design, evaluate, (and redesign) their classroom activities. Whilst it could be
argued that any individual mathematical topic might suffice, indeed each teacher
needed to have a mathematical topic in mind as they began to design each activity,
it was the overarching principle of ‘what will change and what will stay the same’
that prompted the actual activity designs. Having adopted Pierce and Stacey’s
pedagogical map as an analytical tool when analysing the observed lessons, I would
conclude that any of the pedagogical opportunities contained within would offer a
substantial starting focus for teachers engaged in such projects (Pierce and Stacey,
2008).
9.3.2 The role of the ‘significant other’ in supporting teachers’
situated learning
Reflecting on my role as researcher in this study, in which I worked closely with
Eleanor and Tim, in both cases I can identify examples where conversations and
email exchanges led them to take risks in their activity designs by adopting new
technological and pedagogical approaches. Whilst I cannot possibly comment upon
what might have happened if my role had been totally non-interventionalist, my
presence as a ‘significant other’ stimulated mutually beneficial professional
conversations and supported both teachers to have the confidence to take risks in
their classroom when adopting new approaches. In some sense, knowing that I
would be observing their lessons triggered them to think afresh about their
teaching. An example of this was an email exchange I had with Tim the evening
before I was due to observe him with one of his classes. Tim had written a synopsis
of his previous lesson with this class, saying that they had been exploring equations
of circles using the MRT and, by the end of the lesson, they were ‘generally happy’
x2+y2 = r2, where r was the radius of a circle, with centre at the origin. He
continued,
They didn't have a lesson today (another exam)... but I was thinking
that I would like to look at finding points of intersection between a

How does a multi-representational mathematical ICT tool mediate teachers‟ mathematical and
pedagogical knowledge concerning variance and invariance?
Chapter 9 Conclusions and implications
248
straight line and a circle. Am struggling at the moment to find a way to
use the Nspire for this other than to 'check' answers using the co-
ordinate tool... any ideas? [Journ]
My response posed a series of questions to Tim, in which I was trying to help him
to think deeply about his underlying aims for the activity,
What is the 'big picture' here?
Ultimately I expect it is to solve GCSE exam style questions... but en route is it?
- appreciate when the line will cross the circle, 0, 1 2 times (I can see
everyone with a common circle and then each students adding a chosen
straight line to this...)
- getting a sense of where the line and circle might cross - i.e. Can they
get it (by dragging the line) to cross in a given quadrant too?
- exploring the algebra to arrive at how you would prove that the line
and circle crossed at a certain place... You could approach this
backwards by giving the students (an) incorrect point(s) of intersection and proving it doesn't by substitution...
- leading into finding algebraically where the line crosses - several
approaches here - do you lead the class through one or allow some to
come up with this for themselves (with some clues)
- offering an extension activity of 'finding formulae' for x and y in terms
of m and c where y = mx+c crosses y^2+x^2=r^2
- identifying the 'conditions' for the circle and line to intersect 0, 1 and 2
times (extension) [Journ]
It was evident from the activity that Tim subsequently designed that he had
thought about and responded to a number of the questions that I had posed.
However, reflecting on this exchange at the end of the study, I realised that in my
response I had merely ‘laid bare’ my own thinking about how I would design the
activity based on the information that Tim had provided about the topic. My own
approach was to stand back from the very specific mathematical objective of the
lesson and to attempt to identify the more fundamental conceptual knowledge that
underpins with a view to designing activities where students can have an
opportunity to appreciate where, how and why facts, concepts and skills fit
together. My own deep understanding of the functionality of the MRT, gained
though my personal research and experience in this area enabled me to bridge
gaps in the teachers’ knowledge in the sense that Shulman advocates (Shulman,
1986).
It is perfectly reasonable to suggest that a ‘significant other’, that is somebody to
co-design and co-evaluate with, would enhance all aspects of mathematics
teachers’ practices. However, the nature of the multiple representations of the

How does a multi-representational mathematical ICT tool mediate teachers‟ mathematical and
pedagogical knowledge concerning variance and invariance?
Chapter 9 Conclusions and implications
249
mathematics within the activities developed for this study triggered many hiccups.
My presence as a non-judgemental observer in the classroom with mathematical,
technical and pedagogical insight enabled the teachers to reflect on aspects of their
practice in a highly supported way and acted to accelerate their epistemological
development.
9.3.3 The professional development timeline
The evidence from the first phase of the study indicated that, for the activities that
focussed on explorations of mathematical variance and invariance, all but two of
the fifteen teachers began by developing instrument utilisation schemes that used
numeric and syntactic inputs and explored the associated outputs in numeric,
syntactic and graphical forms (IUS1). In all nine different instrument utilisation
schemes were defined of which five were used by individual teachers or pairs of
teachers working together (IUS2, IUS4, IUS6, IUS7 and IUS9). This left two
schemes that were used more widely (IUS3 and IUS5). Eight of the teachers
progressed to adopt schemes that resonated with IUS3, in which geometric input
representations were mediated by dragging, with the output representations
explored in numeric, syntactic and geometric forms. Eight teachers extended IUS1
to include the introduction of another representational output and this was defined
as IUS5. Within the timescale of the first phase (nine months), this gave an
indication of the breadth of schemes that were possible as the teachers learned to
use a complex MRT with associated professional development support.
Eleanor and Tim’s involvement spanned eighteen months and the analysis of their
Phase Two instrument utilisation schemes did not lead to a large number of new
schemes. However, the evidence of the way that their use of multi-representational
outputs developed within their activity designs suggested that the number of
schemes they had created was not actually important. It was the way in which their
familiarity within each representational form enabled them to develop tasks that
linked these in productive ways that took the time. An important aspect of this was
the consideration of the flow of representations within activities and the teacher’s
role in mediating their introduction and the transitions between representations.

How does a multi-representational mathematical ICT tool mediate teachers‟ mathematical and
pedagogical knowledge concerning variance and invariance?
Chapter 9 Conclusions and implications
250
9.4 Limitations of the research design and methodology
The nature of this ‘naturalistic’ research study involving teachers in the secondary
school resulted in no control over how the teachers involved in Phase One and
Phase Two would respond. Also, I was not in a position to specify that they used
the MRT to focus upon any particular class, topic or activity. Consequently the study
cannot offer any comparative conclusions in relation to any particular age range,
ability range or curricular area. The outcomes were skewed towards algebraic
contexts as a result of the mathematical focus on variance and invariance and the
opportunities that the Phase Two teachers saw in their schemes of work that
related to this.
The methodological decision to select the teachers for Phase Two of the study who
were technologically more confident and who demonstrated a more socio-
constructive approach to their activity design and pedagogical practices, whilst
enabling a rich set of research data to be gathered, does limit the validity of the
research findings for the broad range of secondary mathematics teachers.
9.5 Directions for further research
There are a number of potentially productive lines of enquiry for further research.
The first two would involve a secondary analysis of my existing research data and
the remainder are posed to the wider mathematics education community.
Hoyles et al (2004) set a challenge to the mathematics education research
community for studies that illuminated the roles that mathematics teachers play in
technology-mediated classrooms. The substantive data that this study has
collected, particularly concerning teachers actions in the classroom is worthy of re-
examination in response to this challenge. In particular a deeper examination of
their mediating actions during classroom activities would lead to a further
articulation of the role that they play within exploratory activities using multi-
representational technologies.
My experiences of this research project have led me to question how professional
development activities for teachers concerning the use of multi-representational
technologies (and the associated wireless network technology) might be best
structured to complement or enhance the situated learning that is natural to a
teacher’s personal knowledge development. I would be interested to research how
the identification and systematic analysis of lesson hiccups by teachers might form
an integral element of such professional development. This might provide an
opportunity to validate the hiccup theory of teacher learning within a wider

How does a multi-representational mathematical ICT tool mediate teachers‟ mathematical and
pedagogical knowledge concerning variance and invariance?
Chapter 9 Conclusions and implications
251
community of mathematics teachers and serve to expand both its definitions and
exemplifications.
As previously indicated, further studies of the students’ experiences within the
wirelessly connected handheld classroom are needed to widen our understanding of
how the nature of the mathematics curriculum and its pedagogies might be
reconceptualised in such environments.
Finally, I offer the hiccup theory of teacher learning to the mathematics education
research community as a construct to support research into situated teacher
learning more widely than the domain of the study.

References
252
10 REFERENCES
AHMED, A. 1987. Better mathematics. London: Her Majesty's Stationery Office.
AHMED, A. & WILLIAMS, H. 1997. Numeracy project: a catalyst for teacher
development and teachers researching. Teacher Development, 1, pp. 357-
84.
ANDERSON, G. & ARSENAULT, N. 2002. Fundamentals of educational research,
London, Routledge-Falmer.
ARTIGUE, M. 1998. Teacher training as a key issue for the integration of computer
technologies. In: TINSLEY, D. & JOHNSON, D. (eds.) Vol. 119, Proceedings of the IFIP TC3/WG3.1 Working Conference on Secondary School
Mathematics in the World of Communication Technology: Learning,
Teaching, and the Curriculum: Information and Communications
Technologies in School Mathematics. London Chapman and Hall.
ARTIGUE, M. 2001. Learning mathematics in a CAS environment: The genesis of a reflection about instrumentation and the dialectics between technical and
conceptual work. Computer Algebra in Mathematics Education Symposium.
Utrecht University, Netherlands.
ARZARELLO, F. & ROBUTTI, O. 2008. Multi-representations in TI-Nspire and TI-Navigator environments. Paper presented to Sharing Inspiration. Berlin, 16-
18 May 2008.
BARDINI, C., RADFORD, L. & SABENA, C. Year. Struggling with variables,
parameters and indeterminate objects or how to go insane in mathematics. In: CHICK, H. L. & VINCENT, J. L., eds. 29th Conference of the International
Group for the Psychology of Mathematics Education, 2005 Australia.
University of Melbourne, pp. 129-136.
BAULAC, Y., BELLEMAIN, F. & LABORDE, J. M. 1988. Cabri Géomètre. Paris: Cedic-
Nathan.
BEDNARZ, N., KIERAN, C. & LEE, L. (eds.) 1996. Approaches to algebra:
Perspectives for research and teaching, Dordrecht: Kluwer.
BRITISH EDUCATIONAL COMMUNICATION AND TECHNOLOGY AGENCY 2007.
Harnessing Technology Review 2007. Coventry: British Educational Communication and Technology Agency,.
BRITISH EDUCATIONAL RESEARCH ASSOCIATION 2004. Revised ethical guidelines
for educational research, Macclesfield, UK, British Educational Research
Association.
BRITT, M., IRWIN, K. & RITCHIE, G. 2001. Professional conversations and
professional growth. Journal of Mathematics Teacher Education, 4, pp. 29-
53.
BROWN, M., JONES, K. & TAYLOR, R. 2003. Developing geometrical reasoning in the secondary school: outcomes of trialling teaching activities in classrooms.
A report from the Southampton/Hampshire group to the Qualifications and
Curriculum Authority. Southampton: University of Southampton.
CLARK-WILSON, A. 2008. Evaluating TI-NspireTM in secondary mathematics
classrooms: Research Report. Chichester, UK: University of Chichester.
CLARK-WILSON, A. 2009. Connecting mathematics in the connected classroom: TI-
NspireTM NavigatorTM. Chichester, UK: University of Chichester.

References
253
COBB, P., CONFREY, J., DISESSA, A., LEHRER, R. & SCHAUBLE, L. 2003. Design
experiments in educational research. Educational Researcher, 32, pp. 9-13.
CONFREY, J. 1990. Student conceptions, representations, and the design of
software for mathematics education. In: BOWEN, B. (ed.) Design for
learning. Cupertino, CA: Apple Computer, External Research.
COONEY, T. & KRAINER, K. (eds.) 1996. Inservice mathematics teacher education: The importance of listening, Dordrecht: Kluwer Academic.
DENSCOMBE, M. 2003. The good research guide, Maidenhead, Oxford University
Press.
DEPARTMENT FOR CHILDREN SCHOOLS AND FAMILIES 2007. National Curriculum for mathematics. London, UK: Qualifications and Curriculum Agency.
DISESSA, A. A. & COBB, P. 2004. Ontological Innovation and the Role of Theory in
Design Experiments. Journal of the Learning Sciences, 13, pp. 77-103.
DRIJVERS, P., DOORMAN, M., BOON, P., REED, H. & GRAVEMEIJER, K. 2010. The teacher and the tool: instrumental orchestrations in the technology-rich
mathematics classroom. Educational Studies in Mathematics, pp. 1-22.
DRIJVERS, P. & TROUCHE, L. 2008. From Artifacts to Instruments: A Theoretical
Framework behind the Orchestra Metaphor. In: BLUME, G. & HEID, K. (eds.)
Research on technology in the learning and teaching of mathematics: Syntheses, cases and perspectives. Vol 2 Cases and perspectives. Charlotte:
National Council of Teachers of Mathematics/Information Age Publishing.
ERNEST, P. 1991. The impacts of beliefs on the teaching of mathematics. Available:
http://www.ex.ac.uk/~PErnest/impact.htm [Accessed 02-12-04].
ERNEST, P. 1996. The nature of mathematics and teaching. Available:
http://www.ex.ac.uk/~PErnest/pome/pompart7.htm [Accessed 02-12-04].
FESTINGER, L. 1957. A theory of cognitive dissonance, Evanston, IL, Row, Peterson
and Company.
FEY, J. 1989. Technology and mathematics education: a survey of recent
developments and important problems. Educational Studies in Mathematics,
20, pp. 237-272.
FINZER, W. 2007. Fathom. Emeryville, CA: Key Curriculum Press.
FISHER EDUCATIONAL LTD 2009. Ten Ticks Level 6 Pack 7, Bolton.
GODWIN, S. & SUTHERLAND, R. 2004. Whole-class technology for learning
mathematics: The case of functions and graphs. Education Communication
and Information, 4, pp. 131-152.
GOLDENBERG, P. & MASON, J. 2008. Shedding light on and with example spaces. Educational Studies in Mathematics, 69, pp. 183-194.
GOULDING, M. & KYRIACOU, C. 2008. A systematic review of the use of ICTs in
developing pupil's understanding of algebraic ideas. Report. London: EPPI-
Centre, Institute of Education.
GUIN, D. & TROUCHE, L. 1999. The complex process of converting tools into
mathematical instruments: The case of calculators. International Journal of
Computers for Mathematical Learning, 3, pp. 195-227.
HENNESSY, S. 2000. Graphing investigations using portable (palmtop) technology. Journal of Computer Assisted Learning, 16, pp. 243-258.
HER MAJESTY'S INSPECTORATE 1985. Curriculum matters 3: Mathematics from 5
to 16. London: HMSO.
References
254
HOYLES, C. & LAGRANGE, J. B. (eds.) 2009. Mathematics Education and
Technology - Rethinking the Terrain: The 17th ICMI Study, Berlin: Springer.
HOYLES, C., NOSS, R. & KENT, P. 2004. On the Integration of Digital Technologies
into Mathematics Classrooms. International Journal of Computers for
Mathematical Learning, 9, pp. 309-326.
HYDE, R. 2004. A snapshot of practice: Views of teachers on the use and impact of technology on secondary mathematics classrooms. Paper presented to Topic
Study Group 22 at the International Congress on Mathematics Education 10,
Copenhagen.
INSTITUTE OF EDUCATION 2006. Ethics Approval for Doctoral Student Research Projects v1.0 London: Institute of Education.
JACKSON, A. & JACKSON, C. 2010. My Maths [Online]. Staffordshire: My Maths Ltd.
Available: http://www.mymaths.co.uk/ [Accessed 13th May 2010].
JANVIER, C. (ed.) 1987. Problems of representation in the teaching and learning of mathematics, Hillsdale, NJ: Lawrence Erlbaum Associates.
JAWORSKI, B. 1994. Investigating mathematics teaching. London: Falmer.
KAPUT, J. 1986. Information technology and mathematics: Opening new
representational windows. Journal of Mathematical Behavior, 5, pp. 187 -
207.
KAPUT, J. 1989. Linking Representations in the Symbol Systems of Algebra. In:
KIERAN, C. & WAGNER, S. (eds.) Research Issues in the Learning and
Teaching of Algebra Reston, VA: Lawrence Erlbaum/NCTM.
KAPUT, J. 1992. Technology and mathematics education. In: GROUWS, D. (ed.) Handbook of research on mathematics teaching and learning. New York:
Macmillan.
KAPUT, J. 1998. Transforming algebra from an engine of inequity to an engine of
mathematical power by 'algebrafying' the K-12 curriculum. In: NATIONAL COUNCIL OF TEACHERS OF MATHEMATICS & MATHEMATICAL SCIENCES
EDUCATION BOARD (eds.) Proceedings of a national symposium.
Washington, DC: National Research Council, National Academy Press.
KEY CURRICULUM PRESS 2003. The Geometer's Sketchpad v.4. CA: Key Curriculum
Press.
KIERAN, C. Year. The changing face of school algebra. In: ALSINA, C., ALVAREZ, J.
M., HODGSON, B., LABORDE, C. & PEREZ, A., eds. Selected Lectures from
the 8th International Congress on Mathematics Education, 1996 Seville,
Spain. SAEM Thales, pp 271-290.
KIERAN, C. 2004. The core of algebra: Reflections on its main activities. In:
STACEY, K., CHICK, H. & KENDAL, M. (eds.) The future of the teaching and
learning of algebra: The 12th ICMI Study. Dordrecht: Kluwer Academic
Publishers.
KIERAN, C. & WAGNER, S. (eds.) 1989. Research Issues in the Learning and
Teaching of Algebra Reston, VA: Lawrence Erlbaum/NCTM.
KIERAN, C. & YERUSHALMY, M. 2004. Research on the Role of Technological
Environments in Algebra Learning and Teaching. In: STACEY, K., CHICK, H. & KENDAL, M. (eds.) The future of the teaching and learning of algebra: The
12th ICMI Study. Dordrecht: Kluwer Academic Publishers.
KNIGHTS, C. 2009. The perceived impact of ICT on mathematical learning by
mathematics teachers in the UK. Teaching Mathematics and its Applications,

References
255
28, pp. 212-215.
LABORDE, C. 2001. The use of new technologies as a vehicle for restructuring teachers' mathematics. In: LIN, F. & COONEY, T. (eds.) Making Sense of
Mathematics Teacher Education. Dordrecht: Kluwer Academic.
LAKATOS, I. 1976. Proof and refutations, Cambridge, Cambridge University Press.
LERMAN, S. 1983. Problem solving or knowledge centred: The influence of philosophy on mathematics teaching. International Journal of Mathematical
Education in Science and Technology, 14, 7.
MALISANI, E. & SPAGNOLO, F. 2009. From arithmetical thought to algebraic
thought: The role of the 'variable'. Educational Studies in Mathematics, 71, pp. 19-42.
MASON, J. 1996. Expressing generality and roots of algebra. In: BEDNARZ, N.,
KIERAN, C. & LEE, L. (eds.) Approaches to algebra: Perspectives for
research and teaching. Dordrecht: Kluwer.
MASON, J. 2002. Researching your own practice: The discipline of noticing, London,
Routledge-Falmer.
MASON, J., GRAHAM, A. & JOHNSON-WILDER, S. (eds.) 2005. Developing thinking
in algebra, London: Open University Press.
MASON, J. & JOHNSTON-WILDER, S. (eds.) 2005. Developing thinking in geometry, London: Open University Press.
MASON, J. & SPENCE, M. 1999. Beyond mere knowledge of mathematics: The
importance of knowing-to act in the moment. Educational Studies in
Mathematics, 38, pp. 135-161.
MONAGHAN, J. Year. Teachers’ classroom interactions in ICT-based mathematics
lessons. In: VAN DEN HEUVEL-PANHUIZEN, M., ed. Proceedings of the 25th
Conference of the International Groups for the Psychology of Mathematics
Education, 2001 2001a Utrecht. pp. 383-390.
MONAGHAN, J. 2001b. Teachers’ classroom interactions in ICT-based mathematics
lessons. In: VAN DEN HEUVEL, M. & PANHUIZEN, M. (eds.) Proceedings of
the 25th Conference of the International Groups for the Psychology of
Mathematics Education. Netherlands: Freudenthal Institute.
MONAGHAN, J. 2004. Teachers' activities in technology-based mathematics lessons. International Journal of Computers for Mathematical Learning, 9, pp. 327-
357.
MORENO-ARMELLA, L., HEGEDUS, S. J. & KAPUT, J. J. 2008. From static to dynamic
mathematics: historical and representational perspectives. Educational Studies in Mathematics, 68, p. 99-111.
MOUSLEY, J., LAMBDIN, D. & KOC, Y. (eds.) 2003. Mathematics teacher education
and technology, Dordrecht: Kluwer Academic.
NATIONAL COUNCIL FOR EDUCATIONAL TECHNOLOGY 1998. Data capture and modelling in mathematics and science. In: OLDKNOW, A. & TAYLOR, R.
(eds.). Coventry: National Council for Educational Technology.
NORTON, S., MCROBBIE, C. & COOPER, T. 2000. Exploring mathematics teachers’
reasons for not using computers in their teaching: Five case studies. Journal of Research in Computing Education, 33, pp. 87-105.
NOSS, R. & HOYLES, C. 1996. Windows on mathematical meanings: Learning
cultures and computers, Dordrecht, Kluwer Academic.

References
256
NOSS, R., SUTHERLAND, R. & HOYLES, C. 1991. Final Report of the Microworlds
Project Vol. II: Teacher attitudes and interactions. London: Institute of Education.
OFFICE FOR STANDARDS IN EDUCATION 2006. Evaluating mathematics provision
for 14–19-year-olds. London: Her Majesty's Inspectorate.
OFFICE FOR STANDARDS IN EDUCATION 2008. Mathematics: Understanding the Score. London: Department for Children, Schools and Families.
OLDKNOW, A. 2009. Plenary: Their world, Our world - Bridging the divide. In:
BARDINI, C. (ed.) Proceedings of the International Conference for
Technology in Mathematics Teaching 9. Metz, France: University of Metz.
OLDKNOW, A. & TAYLOR, R. 2003. Teaching mathematics using information and
communications technology, London, Continuum.
PAPERT, S. 1980. Mindstorms: Children, computers, and powerful Ideas, New York,
Basic Books.
PIERCE, R. & STACEY, K. 2008. Using pedagogical maps to show the opportunities
afforded by CAS for improving the teaching of mathematics. Australian
Senior Mathematics Journal, 22, pp. 6-12.
PIERCE, R. & STACEY, K. 2009. Researching principles of lesson design to realize
the pedagogical opportunities of mathematics analysis software. Teaching Mathematics and its Applications, 28, pp. 228-233.
POLANYI, M. 1962. Personal knowledge: Towards a post-critical philosophy,
Chicago, The University of Chicago Press.
POLANYI, M. 1966. The tacit dimension, Chicago, The Universty of Chicago Press.
QSR INTERNATIONAL 2008. Nvivo8. Melbourne: QSR International.
QUALIFICATIONS AND CURRICULUM AUTHORITY. Year. Reasoning, explanation and
proof in school mathematics and their place in the intended curriculum. In:
ABRAMSKY, J., ed. QCA International Seminar, 2001 London. Qualifications and Curriculum Authority.
QUALIFICATIONS AND CURRICULUM AUTHORITY 2004. Developing reasoning
through algebra and geometry, London, Department for Education and
Skills.
QUALIFICATIONS AND CURRICULUM AUTHORITY 2007. Draft National Curriculum for Mathematics. London: Qualifications and Curriculum Authority.
RADFORD, L. 1996. The roles of geometry and arithmetic in the development of
algebra: Historical remarks from a didactic perspective. In: BEDNARZ, N.,
KIERAN, C. & LEE, L. (eds.) Approaches to algebra: Perspectives for research and teaching. Dordrecht: Kluwer.
RIDGEWAY, J. 1997. Vygotsky, informatics capability and professional
development. In: PASSEY, D. & SAMWAYS, B. (eds.) Information technology
supporting change through teacher education. London: Chapman Hall.
ROBSON, C. 2001. Real world research, London, Blackwell.
RODD, M. & MONAGHAN, J. 2002. Graphic calculator use in Leeds schools:
Fragments of practice. Journal of Information Technology for Teacher
Education, 11, pp. 93-108.
ROWLAND, T., HUCKSTEP, P. & THWAITES, A. 2005. Elementary teachers'
mathematics subject knowledge: The knowledge quartet and the case of
Naomi. Journal of Mathematics Teacher Education, 8, pp. 255-281.

References
257
RUTHVEN, K. 1999. Reconstructing professional judgement in mathematics
education: From good practice to warranted practice. In: HOYLES, C. (ed.) Rethinking the mathematics curriculum. London: Falmer Press.
RUTHVEN, K. 2003. Linking algebraic and geometric reasoning with dynamic
geometry software: Final report to the Qualifications and Curriculum
Authority. Cambridge: University of Cambridge, Faculty of Education.
RUTHVEN, K. 2008. The Interpretative Flexibility, Instrumental Evolution, and
Institutional Adoption of Mathematical Software in Educational Practice: The
Examples of Computer Algebra and Dynamic Geometry. Journal of
Educational Computing Research, 39, pp. 379-394.
RUTHVEN, K., DEANEY, R. & HENNESSY, S. 2009. Using graphing software to teach
about algebraic forms: a study of technology-supported practice in
secondary-school mathematics. Educational Studies in Mathematics, 71, pp.
279-297.
RUTHVEN, K. & HENNESSY, S. 2002. A practitioner model for the use of computer-
based tools and resources to support mathematics teaching and learning.
Educational Studies in Mathematics, 49, pp. 47-88.
RUTHVEN, K., HENNESSY, S. & DEANEY, R. 2004. Incorporating dynamic geometry
systems into secondary mathematics education: Didactical perspectives and practices of teachers. British Educational Research Association Conference.
Manchester: BERA.
RUTHVEN, K., HENNESSY, S. & DEANEY, R. 2008. Constructions of dynamic
geometry: A study of the interpretative flexibility of educational software in classroom practice. Computers and Education, 51, pp. 297-317.
SCHIELACK, J. & CHANCELLOR, D. (eds.) 1994. Stop, look listen: Building reflection
into continuing professional development, Reston VA: National Council for
Teachers of Mathematics.
SCHÖN, D. 1984. The Reflective Practitioner: How professionals think in action,
New York, Basic Books.
SCHÖN, D. 1987. Educating the reflective practitioner, London, Jossey-Bass.
SCHWARTZ, J. & YERUSHALMY, M. 1985. The geometric supposers. New York:
Sunburst Communications.
SHAFFER, D. W. & KAPUT, J. 1998. Mathematics and virtual culture: An
evolutionary perspective on technology and mathematics education.
Educational Studies in Mathematics, 37, pp. 97-119.
SHULMAN, L. 1986. Those Who Understand: Knowledge Growth in Teaching. Educational Researcher, 15, pp. 4-14.
SOFT WAREHOUSE 1988. Derive. Honolulu HA.
STACEY, K. 2008. Pedagogical Maps for Describing Teaching with Technology. Paper
presented at Sharing Inspiration Conference. Berlin 16-18 May 2008.
STRADLING, B., SIMS, D. & JAMISON, J. 1994. Portable computers pilot evaluation
summary. Coventry,UK: National Council for Educational Technology.
SUTHERLAND, R. 2007. Teaching for learning mathematics, Maidenhead, Open
University Press.
SUTHERLAND, R. & MASON, J. 1995. Exploiting Mental Imagery with Computers in
Mathematics Education, Berlin, Springer-Verlag.
SUTHERLAND, R. & ROJANO, T. 1993. A Spreadsheet Approach to Solving Algebra

References
258
Problems. Journal of Mathematical Behavior, 12, p. 351-383.
TEXAS INSTRUMENTS 2007. TI-NspireTM. Dallas, TX: Texas Instruments Inc.
TEXAS INSTRUMENTS 2007a. TI-NspireTM Reference Guide, Dallas, TX, Texas
Instruments.
TEXAS INSTRUMENTS 2007b. TI-NspireTM Software Guide, Dallas, TX, Texas
Instruments.
TEXAS INSTRUMENTS 2009. TI-NspireTM NavigatorTM. Dallas, TX: Texas Instruments
Inc.
THOMPSON, A. 1984. The relationship of teachers’ conceptions of mathematics and
mathematics teaching to instructional practice. Educational Studies in Mathematics, 15, pp. 105-127.
THOMPSON, A. (ed.) 1992a. Teachers‟ beliefs and conceptions; a synthesis of the
research, New York: Macmillan.
THOMPSON, A. 1992b. Teachers’ beliefs and conceptions; a synthesis of the research. In: GROUWS, D. (ed.) Handbook of research on mathematics
teaching and learning. New York: Macmillan.
THOMPSON, D. A. 1917. On growth and form, Cambridge, Cambridge University
Press.
TROUCHE, L. 2004. Managing the complexity of human/machine interactions in computerized learning environments: Guiding students' command process
through instrumental orchestrations. International Journal of Computers for
Mathematical Learning, 9, pp. 281-307.
VANDENBERG, D. 1997. Phenomenology and educational discourse, Sandton, South Africa, Heinemann.
VERILLON, P. & RABARDEL, P. 1995. Cognition and Artefacts: A contribution to the
study of thought in relation to instrumented activity. European Journal of
Psychology of Education, 10, pp. 77-102.
VYGOTSKY, L. 1981. The instrumental method in psychology. In: WERTSCH, J. &
COLE, M. (eds.) The Concept of Activity in Soviet Psychology. New York: ME
Sharpe.
WATSON, A., DE GEEST, E. & PRESTAGE, S. 2003. Deep Progress in Mathematics:
The Improving Attainment in Mathematics Project. Oxford: University of Oxford, Department of Educational Studies.
WATSON, A. & MASON, J. 1998. Questions and Prompts for Mathematical Thinking,
Derby, Association of Teachers of Mathematics.
WENGER, E. 1998. Communities of practice. Learning, meaning and identity, Cambridge, Cambridge University Press.
WERTSCH, J. 1981. The concept of activity in Soviet psychology, New York, ME
Sharpe.
WILSON, K., AINLEY, J. & BILLS, L. 2005. Spreadsheets, pedagogic strategies and the evolution of meaning for variable. In: CHICK, H. & VINCENT, J. (eds.)
Proceedings of the 29th Conference of the International Group for the
Psychology of Mathematics Education,. Melbourne: University of Melbourne.
ZODIK, I. & ZASLAVSKY, O. 2008. Characteristics of teachers’ choice of examples in and for the mathematics classroom. Educational Studies in Mathematics,
69, pp. 165-182.

Appendix 1: Project Agreement
259
11 APPENDICES
APPENDIX 1: PROJECT AGREEMENT
Project schools will:
release teachers to attend project conferences and meetings;
have a satisfactory procedure for securing equipment;
support teachers to participate fully in the evaluation project by providing
time and resources, as appropriate;
return the loan kit at the end of the project. Schools continuing to Phase
Two of the pilot will keep the loan kit.
Project teachers will:
attend project conferences to familiarise themselves with the handheld and
associated software;
use, adapt (and develop) resources for use in KS3 and 4 mathematics
classrooms;
maintain a log of their project activity and associated reflections;
use the evaluation tools provided to deeply evaluate the impact of the
handheld and software in the classroom;
submit all project data by agreed deadlines.

Appendix 2: Ethical Agreement
260
APPENDIX 2: ETHICAL AGREEMENT
Main theme: The nature of teachers’ learning about mathematical variables within
a multi-representational technological environment.
Aim: To learn more about how secondary mathematics teachers develop their
understanding of the concept of a variable within mathematics through developing
their use of a multi-representational technological tool, in this case TI-Nspire.
Timescale: July 2007 – June 2009
This research project will be carried out in accordance with the British Educational
Research Association’s Revised ethical guidelines for educational research (BERA
2004) and I am therefore seeking your voluntary informed consent to be included
in the study. The nature of your involvement is:
Participation in discussions and interviews with the researcher, which may
be video or audio recorded;
Sharing written notes, lesson plans and evaluations with the researcher;
Allow the researcher to observe lessons and talk with students.
All permissions would be sought prior to any publication and you will be offered the
opportunity to verify statements/data and the researcher’s interpretation of the
data throughout the period of the project.
Please indicate if you give your consent to your name and affiliation being used in
the final Thesis.
I consent to my name and affiliation being included in the Thesis.
I do not consent to my name and affiliation being included in the Thesis.
Any audio or video recordings made as part of the research process will not be used
in any other context without your specific consent and any personal data will be
stored and used in accordance with the Data Protection Act (1989).
I agree to the terms of this ethical agreement.
Signature ___________________________
Name ___________________________
Affiliation ___________________________

Appendix 3: Summary of Phase One lesson data
261
APPENDIX 3: SUMMARY OF PHASE ONE LESSON DATA
A summary of the research data each of the sixty-one lessons on which the
conclusions and recommendations are based is provided below.
Lesson code Lesson title
Lesson P
lan
(Pla
n)
Lesson S
tructu
re
(Str
uct)
Teacher’s .
tns file
(tns-T
)
Stu
dents
’ .t
ns files
(tn
s-S
)
Stu
dents
’ Activity S
heet
(Activity)
TI-
Nspire H
elp
Sheet
(Help
)
Lesson E
valu
ation (
Teacher)
(Quest2
)
Lesson E
valu
ation (
Stu
dent)
(LEval-
S)
Teachers
ongoin
g r
eflection
(Journ
-T)
Teacher’s P
resenta
tion
(Pre
s-T
)
STP1 Prime factorisation
STP2 Visual fractions
STP3 Angle bisectors
STP4 Circle circumferences
STP5 Enlargements
SJK1 Prime factorisation
SJK2 Polygon angles
SJK3 nth terms of sequences
SJK4 Straight line graphs
SJK5 Scattergraphs
CEL1 Quadrilateral angles
CEL2 Triangle angles
CEL3 Intersecting lines
CEL4 All angles recap
CEL5 Perpendicular lines
CHS1 Four fours

Appendix 3: Summary of Phase One lesson data
262
Lesson code Lesson title
Lesson P
lan
(Pla
n)
Lesson S
tructu
re
(Str
uct)
Teacher’s .
tns file
(tns-T
)
Stu
dents
’ .t
ns files
(tn
s-S
)
Stu
dents
’ Activity S
heet
(Activity)
TI-
Nspire H
elp
Sheet
(Help
)
Lesson E
valu
ation (
Teacher)
(Quest2
)
Lesson E
valu
ation (
Stu
dent)
(LEval-
S)
Teachers
ongoin
g r
eflection
(Journ
-T)
Teacher’s P
resenta
tion
(Pre
s-T
)
CHS2 Triangle angles
CHS3 Dice
CHS4 Intersecting lines
LSM1 Sums of sequences
LSM3 Mystery Factors
LSM4 Trial and improvement
LMF1
LSM2 Digit sums
LMF2 Four fours
LMF3 Trial and improvement
LMF4 Mystery factors
LMF5 Circles and Pi
LMF6 Box plots
HAH1 Four fours
HAH2 Temperature conversion
HAH3 Further Conversion
HAH4 Adding fractions
HAH5 Data handling coursework
HRG1 Standard form
HRG2 Straight line graphs
HRG3 Data handling
coursework

Appendix 3: Summary of Phase One lesson data
263
Lesson code Lesson title
Lesson P
lan
(Pla
n)
Lesson S
tructu
re
(Str
uct)
Teacher’s .
tns file
(tns-T
)
Stu
dents
’ .t
ns files
(tn
s-S
)
Stu
dents
’ Activity S
heet
(Activity)
TI-
Nspire H
elp
Sheet
(Help
)
Lesson E
valu
ation (
Teacher)
(Quest2
)
Lesson E
valu
ation (
Stu
dent)
(LEval-
S)
Teachers
ongoin
g r
eflection
(Journ
-T)
Teacher’s P
resenta
tion
(Pre
s-T
)
PCT1 Four fours
PCT2 Reflections
PCT3 Angles lessons
PCT4 Solving simultaneous
equations 1
PCT5 Solving simultaneous equations 2
PSH1 Rich Aunt problem
PSH2 Circles and tangents
PSH3 Parallel and
perpendicular lines
PSH4 Exponential growth and decay
PSH5 Enlargements
BAK1
BJJ1 Four fours
BAK10
BJJ10 Constructing equilateral
triangles
BAK2 Percentage multipliers
BAK3 BJJ3
Investigating straight lines
BAK4
BJJ4 Exploring angles
BAK5
BJJ5 Comparing box plots
BAK6 BJJ6
Weighing sweets
BAK8 Pi Day
BAK9
BJJ9
Investigating
quadrilaterals
BJJ7 Angle bisectors

Appendix 3: Summary of Phase One lesson data
264
Lesson code Lesson title
Lesson P
lan
(Pla
n)
Lesson S
tructu
re
(Str
uct)
Teacher’s .
tns file
(tns-T
)
Stu
dents
’ .t
ns files
(tn
s-S
)
Stu
dents
’ Activity S
heet
(Activity)
TI-
Nspire H
elp
Sheet
(Help
)
Lesson E
valu
ation (
Teacher)
(Quest2
)
Lesson E
valu
ation (
Stu
dent)
(LEval-
S)
Teachers
ongoin
g r
eflection
(Journ
-T)
Teacher’s P
resenta
tion
(Pre
s-T
)
GBA1 Box plots comparisons
GBA2 Vitruvian man
GBA3 Weighing sweets
GBA4 Introducing
trigonometry
GBA5 Circles 1 and 2
GRE1 Four fours
GRE2 Vitruvian man

Appendix 4: Summary of activities submitted during Phase One
265
APPENDIX 4: SUMMARY OF ACTIVITIES SUBMITTED DURING PHASE ONE
Lesson code, title
and activity description
Relevant screenshots
and implied evidence of teacher learning
Interpretation of
variance and invariance
Implied Instrument
Utilisation
Scheme
STP1 Prime factorisation
Students created a new file and used
the factor() command within
the Calculator
application to explore different
inputs and outputs
to encourage generalisation.
Students recorded
their work in
exercise books. Student self-
evaluation supported the
teacher
assessment.
Teacher reflection after the
lesson implied a greater appreciation of how the
initial choice of input numbers might have
affected the students’
abilities to see generalities.
Variance = changing the input
number (manual
text/numeric input to Calculator
application)
Invariance = ‘the
prime factorisation of a number is
unique. Also that all
prime numbers have only two factors,
square numbers have an odd number
of factors.’
[STP1(Quest2)].
IUS1: Vary a numeric or
syntactic input and
use the instrument‟s
functionality to observe the
resulting output in
numeric, syntactic, tabular or graphical
form.
STP2
Visual fractions
Students opened a
pre-constructed file which had already
been loaded onto
the handhelds by the teacher. It used
a dynamic
environment to explore adding
fractions to encourage
generalisation.
Students recorded their work in
exercise books.
Variance = the individual values of
the numerators and
denominators of the two fractions to be
added and the value of the ‘divisor’ (d).
The position of the
point on the line segment as it is
dragged resulting in
the ‘emptying of the LH bar into the RH
bar.
Invariance = the
dimensions of the fraction bars.
IUS4: Vary a numeric input and
drag an object
within a related mathematical
environment and observe the
resulting visual
output.
STP3
Angle bisectors
Students created a
new file and used
the Graphs and Geometry
application to explore the
construction of
angle bisectors leading to the
construction of an
angle fan. Students saved their work.
As they did this, they were
getting immediate visual
feedback. When students constructed their own
bisectors they were able to
see if they were constructing correctly by
trying to move the lines dynamically.
Students made connections
by having to relate the properties of the circle to
Variance = the size
of the circles drawn to construct the
angle bisector - offering a more
‘global’ approach to
the construction of angle bisectors.
Invariance = the
condition when the
two circles constructed on the
rays are equal,
resulting in an angle bisector.
IUS3: Vary the
position of an object (by
dragging) that has been constructed in
accordance with a
conventional mathematical
constraint and observe the
resulting changes.

Appendix 4: Summary of activities submitted during Phase One
266
Lesson code, title and activity
description
Relevant screenshots and implied evidence of
teacher learning
Interpretation of variance and
invariance
Implied
Instrument Utilisation
Scheme
consideration of equal
lengths. Students were able to
articulate reasons for the
symmetry of the construction and saw that
the equal radii proved that the construction was
symmetrical. [STP3(Quest4-
T)]
STP4
Circle
circumferences
Students created a
new file and used the Graphs and
Geometry application to
construct a dynamic
circle, measure its properties and
tabulate the data in their exercise
books. They then
used the Calculator application to find
the ratio of the circumference to
the diameter and
discussed their findings as a class.
Students saved
their work.
Variance = change the diameter and
observe the change
in the circumference of the constructed
circle.
Invariance = the
numeric ratio between the
diameter and
circumference of the circle visible as a
linear relationship when plotted
graphically.
IUS3: Vary the position of an
object (by
dragging) that has been constructed in
accordance with a
conventional mathematical
constraint and observe the
resulting changes.
Use another representational
form to add insight to or justify/prove
any invariant
properties. New possibilities
for the action: The use of dragging
to offer quasi
empirical approach to gathering ‘real’
data for numerical
analysis.
Private utilisation scheme:
Geometric
construction of a circle by centre and
radius. Measurement of
diameter and
circumference. Data capture of
diameter and
circumference within Spreadsheet.
Observation of linear relationship.
Modelling linear
function to coincide with collected data
values. Testing of hypothesis in
Spreadsheet.
Social utilisation
scheme: This approach has
been documented
in other research studies (Arzarello
and Robutti, 2008).

Appendix 4: Summary of activities submitted during Phase One
267
Lesson code, title and activity
description
Relevant screenshots and implied evidence of
teacher learning
Interpretation of variance and
invariance
Implied
Instrument Utilisation
Scheme
STP5
Enlargements (Two lessons)
[The first lesson was not reported in
detail. In it the students begun by
creating a new file
and used the Graphs and
Geometry
application to construct shapes,
enlarge them and vary the centre of
enlargement and
position.]
In the second lesson the students
worked from a pre-
constructed file provided by the
teacher which
focused their attentions on the
variant properties within the
construction.
At the end of the first
lesson, students were able to describe quite accurately
where the centre of
enlargement would be. I found it helpful to have
both the approaches of (a) an enlargement that
students created
themselves and (b) a prepared file where a slider
controlled the enlargement
as this gave students the opportunity to see the
enlargement in small increments and help them
create a mental picture of
the process of enlargement and its relationship to the
centre of enlargement. I was pleasantly surprised
at how comfortable the
students were at creating a shape and enlarging it.
[STP4(Quest2)]
Variance= position
of shape, appearance of
shape, position of
centre of enlargement, scale
factor.
Invariance = the
similarity of the two shapes.
IUS4: Vary a
numeric input and drag an object
within a related
mathematical environment and
observe the resulting visual
output.
New possibilities
for the action:
The students had ‘constrained
freedom’ to explore a concept that is
difficult to mediate
without the use of technology.
Multiple representations
were incorporated
within the activity. The use of dragging
to observe the
effect of moving the position of the
centre of enlargement.
New conditions for organising the
action: Many choices
available to the
teacher with respect to how they
direct the students’
attentions during the activity.
Private utilisation
scheme:
Students chose whether to vary the
scale factor (by changing its
numeric input), the
centre of enlargement (by
dragging its position) or the
appearance of the
original shape (by changing its
coordinates).
Social utilisation
scheme: A similar lesson
was developed by
RD (PSH5) although it is not
evident from the available research
data whether this

Appendix 4: Summary of activities submitted during Phase One
268
Lesson code, title and activity
description
Relevant screenshots and implied evidence of
teacher learning
Interpretation of variance and
invariance
Implied
Instrument Utilisation
Scheme
was as a direct
result of any discussion between
the two teachers.
SJK1
Prime factorisation
Students created a new file and used
the factor() command within
the Calculator
application to explore different
inputs and outputs
to encourage generalisation.
Students recorded their work on a
worksheet prepared
by the teacher.
Q. What aspect(s) of the idea would you use again?
Definitely the worksheet
idea as this enables pupils to work at their own pace.
I needed the worksheet for
me as well as for them. I was able to refer to the
sheet and that helped my confidence. The sheet also
allowed pupils to continue
with the work whilst I went round to help students with
a problem. BUT - the sheet could have been more
structured i.e. not jump
around haphazardly but be more systematic. Factor (1),
Factor (2), Factor (3), etc...
I liked Exercise 1 but questions 1 and 2 were too
hard for this group. I was nervous to use the
device even though I am a
very experienced teacher of maths. I needed the
worksheet as support. Having done one lesson I
would now be confident to
try again. The worksheet could have been more
interesting. Pupils seemed
to enjoy the lesson. [SJK1(Quest2)]
Teacher had
constructed a worksheet (with
support from her
mentor) that did lead students
through a set of suggested input
numbers that
progressed in their level of complexity.
Variance = changing the input
number (manual text input to
calculator
application using factor () syntax)
Invariance = all
prime numbers had
only two factors.
IUS1: Vary a
numeric or syntactic input and
use the
instrument‟s functionality to
observe the resulting output in
numeric, syntactic,
tabular or graphical form.
Private utilisation scheme:
Students worked
with a numerical
input and output within one
application responding to the
same set of
numbers, as provided by the
teacher. No use of multiple
representations
using the technology.
Social utilisation scheme:
Whilst JK developed
this lesson in close
collaboration with TP, who taught a
similar lesson [STP1]. The lessons
had very different
utilisation schemes. JK provided a
structured
worksheet for the students that
contained a variety of questions that
did not appear to
follow any conceptual
progression.
SJK2
Polygon angles
Students opened a
pre-constructed file
that had been distributed to them
during the lesson using the link
cables. The
Variance = the
position of the vertices (and
therefore the values of the interior
angles) and also the
number of sides of each polygon.
Invariance = the
angles sum for all
IUS3: Vary the
position of an object (by
dragging) that has been constructed in
accordance with a
conventional mathematical
constraint and observe the
resulting changes.
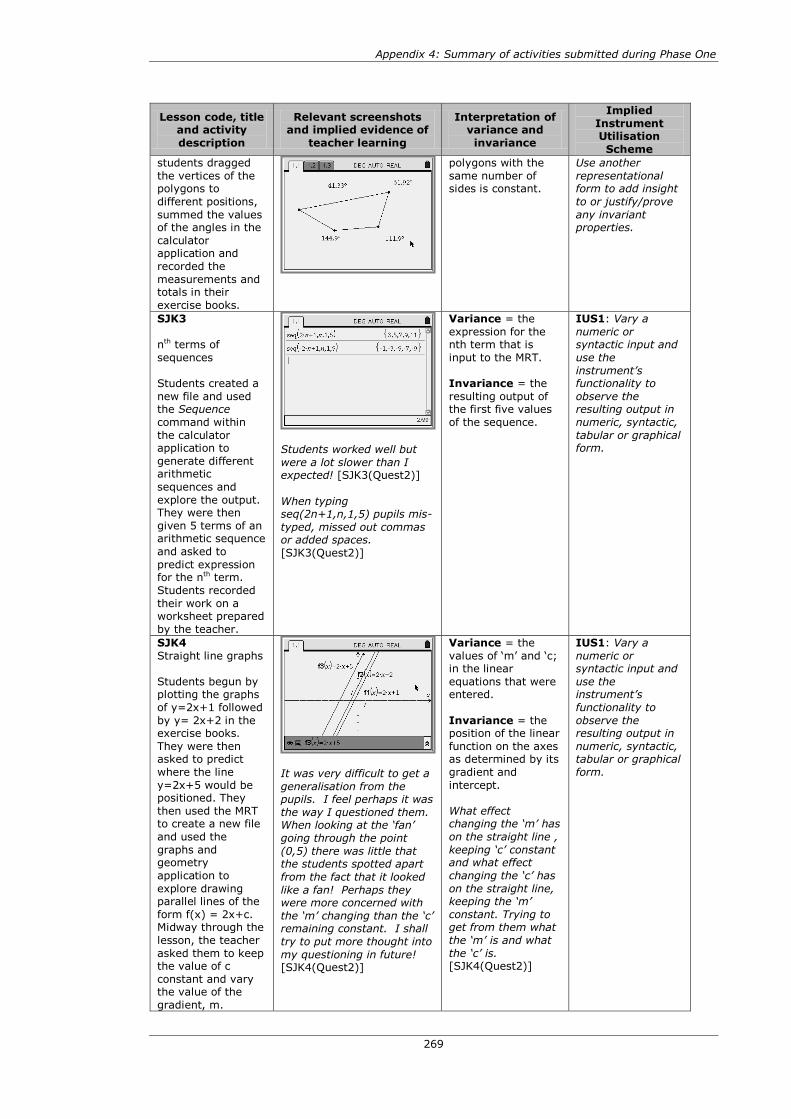
Appendix 4: Summary of activities submitted during Phase One
269
Lesson code, title and activity
description
Relevant screenshots and implied evidence of
teacher learning
Interpretation of variance and
invariance
Implied
Instrument Utilisation
Scheme
students dragged
the vertices of the polygons to
different positions,
summed the values of the angles in the
calculator application and
recorded the
measurements and totals in their
exercise books.
polygons with the
same number of sides is constant.
Use another
representational form to add insight
to or justify/prove
any invariant properties.
SJK3
nth terms of
sequences
Students created a
new file and used the Sequence
command within
the calculator application to
generate different arithmetic
sequences and
explore the output. They were then
given 5 terms of an arithmetic sequence
and asked to
predict expression for the nth term.
Students recorded
their work on a worksheet prepared
by the teacher.
Students worked well but
were a lot slower than I expected! [SJK3(Quest2)]
When typing seq(2n+1,n,1,5) pupils mis-
typed, missed out commas or added spaces.
[SJK3(Quest2)]
Variance = the
expression for the nth term that is
input to the MRT.
Invariance = the
resulting output of the first five values
of the sequence.
IUS1: Vary a
numeric or syntactic input and
use the
instrument‟s functionality to
observe the resulting output in
numeric, syntactic,
tabular or graphical form.
SJK4
Straight line graphs
Students begun by plotting the graphs
of y=2x+1 followed
by y= 2x+2 in the exercise books.
They were then asked to predict
where the line
y=2x+5 would be positioned. They
then used the MRT to create a new file
and used the
graphs and geometry
application to
explore drawing parallel lines of the
form f(x) = 2x+c. Midway through the
lesson, the teacher
asked them to keep the value of c
constant and vary the value of the
gradient, m.
It was very difficult to get a
generalisation from the pupils. I feel perhaps it was
the way I questioned them. When looking at the „fan‟
going through the point
(0,5) there was little that the students spotted apart
from the fact that it looked
like a fan! Perhaps they were more concerned with
the „m‟ changing than the „c‟ remaining constant. I shall
try to put more thought into
my questioning in future! [SJK4(Quest2)]
Variance = the
values of ‘m’ and ‘c; in the linear
equations that were entered.
Invariance = the position of the linear
function on the axes as determined by its
gradient and
intercept.
What effect changing the „m‟ has
on the straight line ,
keeping „c‟ constant and what effect
changing the „c‟ has
on the straight line, keeping the „m‟
constant. Trying to get from them what
the „m‟ is and what
the „c‟ is. [SJK4(Quest2)]
IUS1: Vary a
numeric or syntactic input and
use the instrument‟s
functionality to
observe the resulting output in
numeric, syntactic, tabular or graphical
form.

Appendix 4: Summary of activities submitted during Phase One
270
Lesson code, title and activity
description
Relevant screenshots and implied evidence of
teacher learning
Interpretation of variance and
invariance
Implied
Instrument Utilisation
Scheme
SJK5
Scatter graphs
Students created a
new .tns file and used the
spreadsheet application to enter
a given set of data
and produce scatter plots within the
data and statistics application in order
to respond to a set
of questions relating to
correlation. Students recorded
their findings on an
accompanying worksheet. The
teacher reminded
them how to identify different
types of correlation.
Variance = the
data set (provided
by the teacher) that was entered.
Invariance = the conclusion that, for
some sets of data there is an
approximate
proportional relationship between
the two sets.
IUS1: Vary a
numeric or
syntactic input and use the
instrument‟s
functionality to observe the
resulting output in numeric, syntactic,
tabular or graphical
form.
CEL1
Quadrilateral angles (2 lessons)
Students opened a
pre-constructed file
that had already been loaded onto
the handhelds by the teacher. They
recorded the types
of angles within some different
quadrilaterals and measured the
interior angles to
find the angle sum. This data was
entered manually
into the spreadsheet.
They did not drag any of the vertices.
Students were
asked to comment on their findings
using a Notes page.
Have bigger pictures drawn,
even as one per page would aid students‟ ability (sic) to
measure more accurately and not end up moving
shapes by mistake.
[CEL1(Quest2)]
Variance =
measured values of interior angles of
given polygons.
Invariance = the
angles sum for all polygons with the
same number of sides is constant.
IUS2: From a
given set of static geometric objects,
make measurements and
tabulate data to
explore variance and invariance
within the measured data in
numeric and
tabular forms. New possibilities
for the action: As the shapes were
constructed within
the dynamic geometry
application, it
would have been possible to drag
them to observe changes in angles.
Private utilisation scheme:
Measurement of pre-constructed
angles by selecting
three vertices in appropriate order
and placing
measurement on the page.
Moving to new page in document
Entering measured

Appendix 4: Summary of activities submitted during Phase One
271
Lesson code, title and activity
description
Relevant screenshots and implied evidence of
teacher learning
Interpretation of variance and
invariance
Implied
Instrument Utilisation
Scheme
values in
spreadsheet and observing angle
sum (pre-entered
formula in spreadsheet).
Social utilisation
scheme:
This activity was developed during
the first project
meeting and the idea was picked up
and redesigned by four other teachers.
CEL2
Triangle angles
Students opened a
pre-constructed file that had already
been loaded onto the handhelds by
the teacher. They
measured the interior angles of
several polygons using the graphs
and geometry
application. They did not drag any of
the vertices. They
entered angle measurements
manually into a Spreadsheet page
and commented on
their findings using a Notes page.
Variance = measured values of
individual angles and subsequent
calculated totals.
Invariance =
displayed total is in range 179 -181
IUS2: From a given set of static
geometric objects, make
measurements and
tabulate data to explore variance
and invariance within the
measured data in
numeric and tabular forms.
Private utilisation
scheme:
Measurement of pre-constructed
angles by selecting
three vertices in appropriate order.
Entering data into spreadsheet page
with automatically
calculated total. EL prescribed the
instrumentation for the students with
respect to
measuring each of the angles.
To measure angles:
menu 7: measurement
4: angle (Highlight the 3
corners in order)
enter move measurement
to correct point (hand opens and
closes (ctrl middle
doughnut)) [CEL2(Struct)]
Social utilisation
scheme:
This activity was a revised version of
the lesson that was
jointly developed
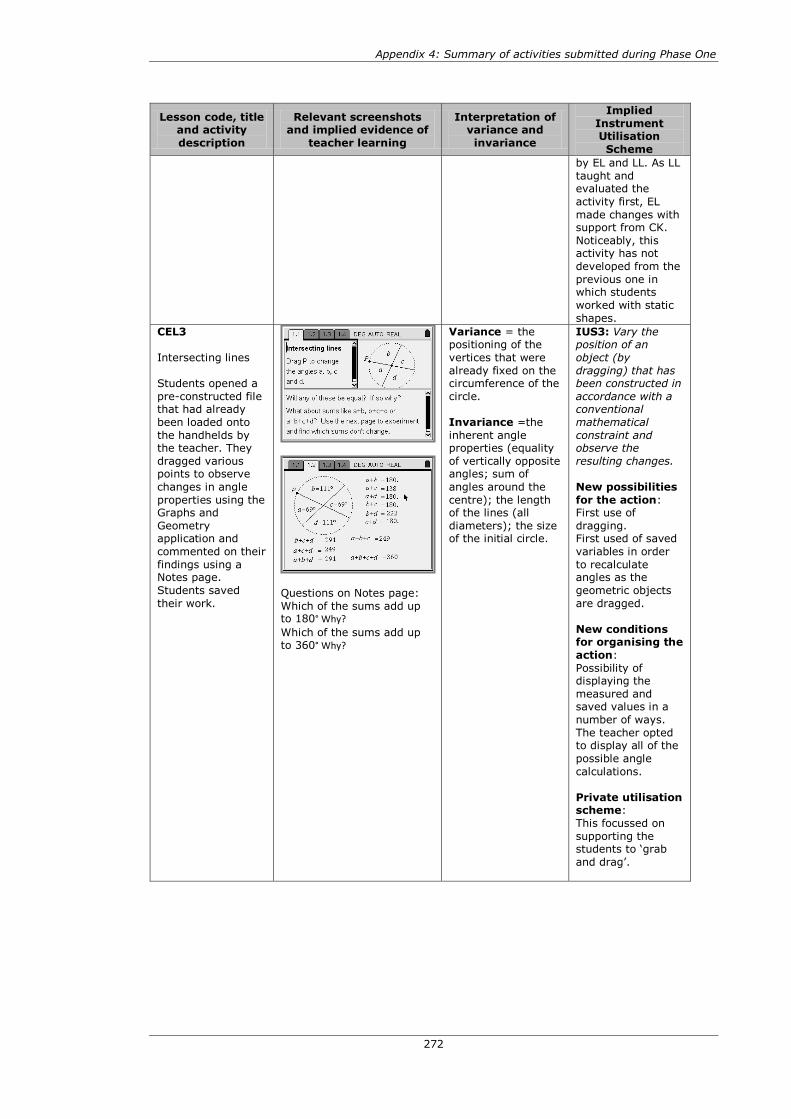
Appendix 4: Summary of activities submitted during Phase One
272
Lesson code, title and activity
description
Relevant screenshots and implied evidence of
teacher learning
Interpretation of variance and
invariance
Implied
Instrument Utilisation
Scheme
by EL and LL. As LL
taught and evaluated the
activity first, EL
made changes with support from CK.
Noticeably, this activity has not
developed from the
previous one in which students
worked with static
shapes.
CEL3
Intersecting lines
Students opened a
pre-constructed file that had already
been loaded onto
the handhelds by the teacher. They
dragged various points to observe
changes in angle
properties using the Graphs and
Geometry application and
commented on their
findings using a Notes page.
Students saved
their work.
Questions on Notes page:
Which of the sums add up to 180° Why?
Which of the sums add up to 360° Why?
Variance = the positioning of the
vertices that were
already fixed on the circumference of the
circle.
Invariance =the
inherent angle properties (equality
of vertically opposite angles; sum of
angles around the
centre); the length of the lines (all
diameters); the size of the initial circle.
IUS3: Vary the position of an
object (by
dragging) that has been constructed in
accordance with a conventional
mathematical
constraint and observe the
resulting changes.
New possibilities
for the action: First use of
dragging. First used of saved
variables in order
to recalculate angles as the
geometric objects
are dragged.
New conditions for organising the
action:
Possibility of displaying the
measured and saved values in a
number of ways.
The teacher opted to display all of the
possible angle
calculations.
Private utilisation scheme:
This focussed on
supporting the students to ‘grab
and drag’.

Appendix 4: Summary of activities submitted during Phase One
273
Lesson code, title and activity
description
Relevant screenshots and implied evidence of
teacher learning
Interpretation of variance and
invariance
Implied
Instrument Utilisation
Scheme
Social utilisation
scheme: Similarities with the
approach developed by KS
later in the project
(GBA5).
CEL4
All angles recap
Students opened a
pre-constructed file that had already
been loaded onto
the handhelds by the teacher. They
reviewed the mathematics from
the other reported
TI-Nspire lessons (CEL1 Quadrilateral
angles, CEL2
Triangle angles and CEL3 Intersecting
lines) using the Graphs and
Geometry
application but using the drag
facility to vary the angles and recorded
their own
comments using the Notes application.
Students saved
their work.
Variance = positions of
geometric objects
and resulting angle measurements.
Invariance =
Activity 1.1: angle
sum of a right angle (a problematic
concept as the students have no
given information to
suggest that it ‘should’ be a right
angle;
Activity 1.2: sum of the ‘angles on a
straight line’ Activity 1.3: Sum of
the interior angles of
a triangle Activity 1.4: Angle
properties of crossing lines.
IUS3: Vary the position of an
object (by
dragging) that has been constructed in
accordance with a conventional
mathematical
constraint and observe the
resulting changes.
New possibilities
for the action: Involving dragging
as the main
activity. Inviting students to add
comments to their work.
New conditions for organising the
action:
Private utilisation
scheme: ‘Grab and drag’
central to each of
the interactives.
Social utilisation scheme: Beginning
to emerge within
the classroom.
CEL5
Perpendicular
functions
Students created a
new file and used
the Graphs and Geometry
application to define a linear function
and draw a
If the perpendicular value
Variance = initial
definition (positioning?) of
linear function, ‘by
eye’ positioning of geometric line, value
of measured angle,
the gradients of the two lines (by
measurement or by definition).
IUS7: Construct a
graphical and geometric scenario
and then vary the
position of geometric objects
by dragging to
satisfy a specified mathematical
condition. Input functions
syntactically to

Appendix 4: Summary of activities submitted during Phase One
274
Lesson code, title and activity
description
Relevant screenshots and implied evidence of
teacher learning
Interpretation of variance and
invariance
Implied
Instrument Utilisation
Scheme
freehand
‘perpendicular line’. They used the angle
measure facility to
check their accuracy, dragged
the geometric line until it was
perpendicular and
then generated parallel functions to
this geometric line.
They used a Notes page to record their
findings. Students saved their work.
did not appear to fit the rule
we checked angles were 90o. [CEL5(Quest2)]
Q. What changes would you
make?
To reinforce looking for
connections between perpendicular gradients as
written for the value of m.
To encourage more formal methods of recording
results. To introduce a
spreadsheet page to establish that the product of
perpendicular gradients is -1. Slope can be measured.
Ensuring all hand-held are
in degree mode and all with a float of 3.
Students were very intuitive with using the new
technology. Would need to
reinforce girls to do more mathematical thinking and
reflection and to view the
technology as a means to do this. [CEL5(Quest2)]
Invariance = the
condition that, when the lines were
perpendicular, the
products of their gradients would
equal -1.
observe invariant
properties. New possibilities
for the action:
This was a very innovative use of
the technology – it combined defining
functions with
dragging and measuring angle.
EL also suggested
develops that would integrate the
Spreadsheet page as a means for
collating results
and checking conjectures.
New conditions
for organising the
action:
Private utilisation
scheme: To draw a simple
linear function on a graphs page. To
construct a line
that crosses this at 90o. To measure
this angle and draw a selection of
parallel lines to this
drawn line. To record findings.
[CEL5(Quest2)]
Results were recorded on a notes
page and we brought together
the many concepts
related to gradients,
parallelness, perpendicular and
y=mx+c.
[CEL5(Quest2)]
Social utilisation scheme:
This idea was ‘mis-
remembered’ by EL from a lesson
developed by RD
and reported at the third project
meeting [PSH3].
CHS1
Four fours
Students opened a
pre-constructed file
that had already
Activity introduction on page 1.1
Name:
Date: 1.1 Four fours
Using only four fours, how
can you calculate all of the
Variance = the inputs that the
students provide
that met the activity constraints with
respect to ‘four
fours’ and the
IUS1: Vary a numeric or
syntactic input and
use the instrument‟s
functionality to
observe the

Appendix 4: Summary of activities submitted during Phase One
275
Lesson code, title and activity
description
Relevant screenshots and implied evidence of
teacher learning
Interpretation of variance and
invariance
Implied
Instrument Utilisation
Scheme
been loaded onto
the handhelds by the teacher. They
used the Calculator
application to try to use four fours and
any combination of operations,
including brackets,
to generate the numbers from one
to a hundred. They
recorded their results in the
Spreadsheet application and
used a Notes page
to record their findings. Students
saved their work.
whole numbers from 1 to
100? 1.2 An example
(4+4)/4+4=6. Try others
here. 1.3 Fill in your calculations
here 1.4 Learning notes
[CHS1(tns-T)]
permitted
mathematical operations.
Invariance = the machine constraints
with respect to how the input was
interpreted.
resulting output in
numeric or syntactic form.
CHS2
Triangle angles
Students opened a
pre-constructed file that was distributed
to them during the
lesson using the link cables. They
measured the interior angles of
several polygons
using the Graphs and Geometry
application. They
did not drag any of the vertices. They
entered angle measurements
manually into a
Spreadsheet page and commented on
their findings using a Notes page.
Students saved
their work.
(I) Liked the idea of the
Variance = measured values of
individual angles.
Invariance =
displayed total is in range 179 -181.
IUS2: From a given set of static
geometric objects,
make measurements and
tabulate data to explore variance
and invariance
within the measured data in
numeric and tabular forms.
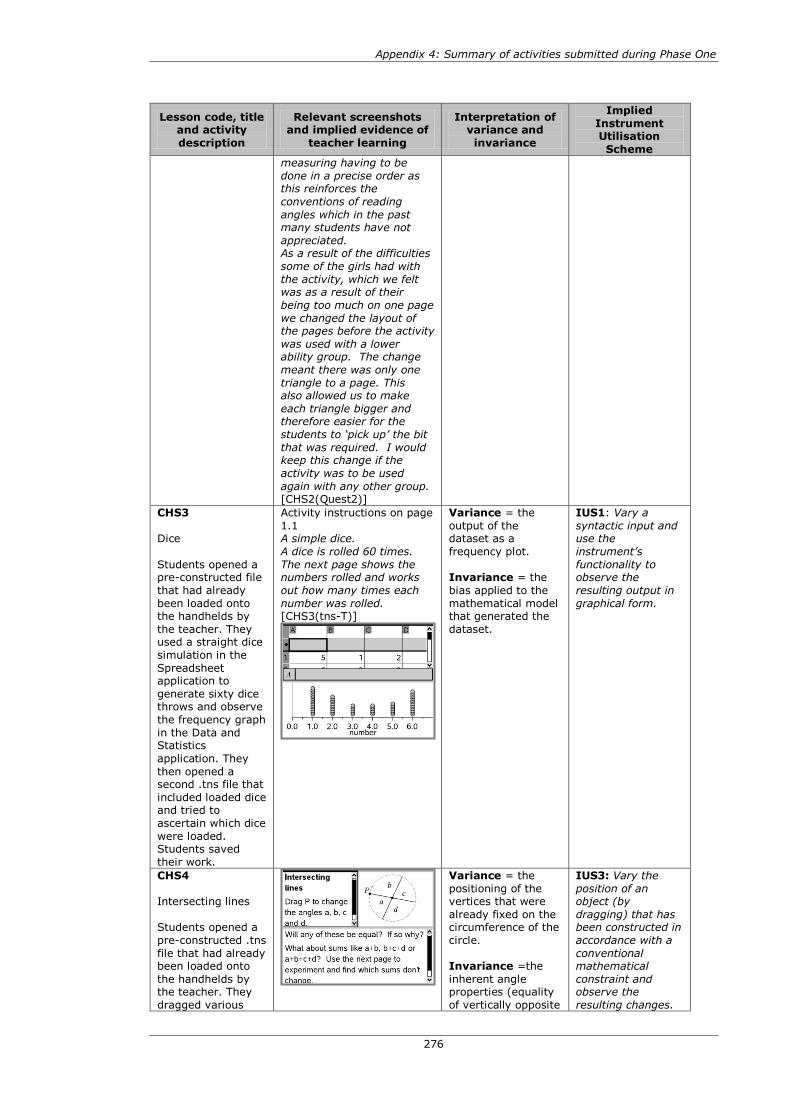
Appendix 4: Summary of activities submitted during Phase One
276
Lesson code, title and activity
description
Relevant screenshots and implied evidence of
teacher learning
Interpretation of variance and
invariance
Implied
Instrument Utilisation
Scheme
measuring having to be
done in a precise order as this reinforces the
conventions of reading
angles which in the past many students have not
appreciated. As a result of the difficulties
some of the girls had with
the activity, which we felt was as a result of their
being too much on one page
we changed the layout of the pages before the activity
was used with a lower ability group. The change
meant there was only one
triangle to a page. This also allowed us to make
each triangle bigger and therefore easier for the
students to „pick up‟ the bit
that was required. I would keep this change if the
activity was to be used
again with any other group. [CHS2(Quest2)]
CHS3
Dice
Students opened a pre-constructed file
that had already
been loaded onto the handhelds by
the teacher. They used a straight dice
simulation in the
Spreadsheet application to
generate sixty dice throws and observe
the frequency graph
in the Data and Statistics
application. They
then opened a second .tns file that
included loaded dice and tried to
ascertain which dice
were loaded. Students saved
their work.
Activity instructions on page
1.1 A simple dice.
A dice is rolled 60 times.
The next page shows the numbers rolled and works
out how many times each
number was rolled. [CHS3(tns-T)]
Variance = the
output of the dataset as a
frequency plot.
Invariance = the
bias applied to the
mathematical model that generated the
dataset.
IUS1: Vary a
syntactic input and use the
instrument‟s
functionality to observe the
resulting output in
graphical form.
CHS4
Intersecting lines
Students opened a
pre-constructed .tns
file that had already been loaded onto
the handhelds by the teacher. They
dragged various
Variance = the
positioning of the vertices that were
already fixed on the circumference of the
circle.
Invariance =the
inherent angle properties (equality
of vertically opposite
IUS3: Vary the
position of an object (by
dragging) that has been constructed in
accordance with a
conventional mathematical
constraint and observe the
resulting changes.

Appendix 4: Summary of activities submitted during Phase One
277
Lesson code, title and activity
description
Relevant screenshots and implied evidence of
teacher learning
Interpretation of variance and
invariance
Implied
Instrument Utilisation
Scheme
points to observe
changes in angle properties using the
Graphs and
Geometry application and
commented on their findings using a
Notes page.
Students saved their TI-Nspire
work.
What aspect(s) of the idea would you use again?
All of it
What changes would you make?
Make the shape bigger to try to help the girls pick up
the points more easily
[CHS4(Quest2)]
angles; sum of
angles around the centre); the length
of the lines (all
diameters); the size of the initial circle.
LSM1
Sums of series
Students were
shown how to enter fractions using the
library key. They
were also shown how to copy and
paste the previous sum.
Students recorded
their calculations in their exercise
books.
The teacher demonstrated to
the students how to graph the sequence
and plot its function
– it is not clear from the
questionnaire how this was done.
Instead of writing the
answers in fractions, I should have introduced the
decimal. This would have
help them to draw conclusion without can
prompt. [LSM1(Quest2)]
Variance = initially - numerical inputs,
the terms of the
sequence.
Invariance = the total for each
calculation, the limit
of the sequence.
IUS1: Vary a numeric input and
use the
instrument‟s functionality to
observe the resulting output in
numeric form.
LSM2 LMF1
Digit sums
Students began generating two digit
numbers that were a multiple of the
sum of the two
digits and used the Calculator
application to verify
results. They then identified the
sequences of solutions that were
multiples of 2, 3, 4
etc. and made conjectures about
their findings.
The teacher showed
One student typed the following into a calculator
page: 12=1+2x4
The Nspire reported „true‟ which the student was very
keen to share (because he wanted to know what was
going on). [LSM1(Quest2)].
Variance = the initial choice of
number, the chosen multiple, the
sequence definition
as input to the handheld, the term
number.
Invariance = for
any defined sequence, the value
of the defined
sequence for any a given term number.
IUS1: Vary a numeric or
syntactic input and use the
instrument‟s
functionality to observe the
resulting output in numeric, syntactic,
tabular or graphical
form.

Appendix 4: Summary of activities submitted during Phase One
278
Lesson code, title and activity
description
Relevant screenshots and implied evidence of
teacher learning
Interpretation of variance and
invariance
Implied
Instrument Utilisation
Scheme
the students how to
generate sequences and calculate terms
– it is not clear
from the questionnaire
exactly how this was done.
LSM3
Mystery factors
Students created a
new file and used the Calculator
application to
explore the outcomes of
inputting GCD(n,N) to explore highest
common factor and
LCM(n,N) to explore lowest common
multiple. Students recorded their
findings in their
exercise books.
Gaining more confidence in
supporting students to structure their work with
little guidelines.
[LSM3(Quest2)]
Variance = choice of input numbers.
Invariance =
output in accordance
with machine’s algorithm for
calculating GCD and
LCM.
IUS1: Vary a numeric input and
use the instrument‟s
functionality to
observe the resulting output in
numeric form.
LSM4
Trial and Improvement
Students created a
new file and used
the Calculator application to define
a given quadratic
function using function notation.
They then evaluate the function by
substituting
different values of x to try to find the
solutions of the equation. Students
then used a
Spreadsheet page to automate the
process and observed the
scatter plot of the
values of x and f(x). Students recorded
their observations
in their exercise books.
When students started to look for values to fill into
their tables, it would have
been better to tell them to use f(x) notation (which
these students are familiar
with from other Inspire (sic) work). In fact it was left
open to students to find a method, but the f(x) idea
was explained to a few and
Variance = the
change in the
evaluated y-values for different inputted
x-values for a defined function.
This was also shown
in a tabulated form and graphical form.
Invariance = that the x-value for the
particular case where the y-value
equalled zero – is
called the ‘solution’. This was observable
as the point of intersection between
the function and the
x-axis within the graphing
representation.
IUS5: Vary a
numeric or
syntactic input and use the
instrument‟s functionality to
observe the
resulting output in numeric, syntactic,
tabular or graphical
form. Use another representational
form to add insight to or justify/prove
any invariant
properties.

Appendix 4: Summary of activities submitted during Phase One
279
Lesson code, title and activity
description
Relevant screenshots and implied evidence of
teacher learning
Interpretation of variance and
invariance
Implied
Instrument Utilisation
Scheme
spread, which was
inefficient. It could be that not suggesting anything
would have led to
interesting discussion about the efficiency of different
methods, but in this case it would be important for the
teacher to avoid giving any
method. The starter problem by
inspection was too easy
(surprisingly for one student, who insisted on
sharing the answers very quickly). This spoilt the
search. This student and
one or two others needed to be given a much harder
example to start with. It was difficult to explain
how to set up the
spreadsheet in the middle of the lesson. The lack of
desktop software and/or a
viewscreen meant more teacher direction to ensure
absolute attention was needed at this stage.
Student data collection is
vital – the table in the book ensured students could
reflect on their values. Creating a new file and
saving it at the start of the
activity prevented change of focus later on (saving
caused a nuisance for some
if they hadn‟t done this). Very clear activity
instructions are vital for the smooth running of the
lesson.
A teacher projection to explain short practical
sequences is very important. Especially for the
spreadsheet.
[LSM4(Quest2)]
LMF2
Four fours
Students opened a
pre-constructed file that had already
been loaded onto
the handhelds by the teacher. They
used the Calculator application to try to
use four fours and
any combination of operations,
including brackets,
to generate the
Activity introduction and screenshots as shown in
CHS1
Initial introduction should
also be done on the handheld instead of doing
that in their books
The use of pupils presenting their feed back to the whole
class [LMF2(Quest2)]
Variance = the inputs that the
students provide
that met the activity constraints with
respect to ‘four fours’ and the
permitted
mathematical operations.
Invariance = the
machine constraints
with respect to how the input was
interpreted.
IUS1: Vary a numeric or
syntactic input and
use the instrument‟s
functionality to observe the
resulting output in
numeric, syntactic, tabular or graphical
form.
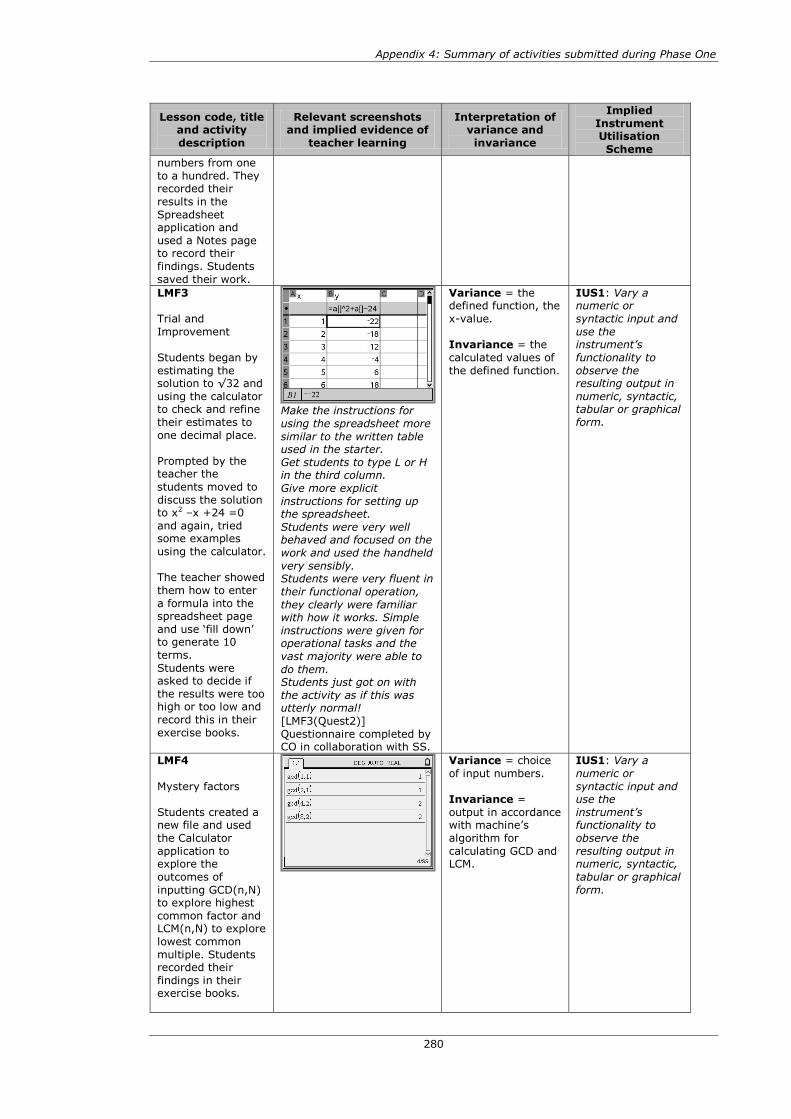
Appendix 4: Summary of activities submitted during Phase One
280
Lesson code, title and activity
description
Relevant screenshots and implied evidence of
teacher learning
Interpretation of variance and
invariance
Implied
Instrument Utilisation
Scheme
numbers from one
to a hundred. They recorded their
results in the
Spreadsheet application and
used a Notes page to record their
findings. Students
saved their work.
LMF3
Trial and
Improvement
Students began by
estimating the solution to √32 and
using the calculator to check and refine
their estimates to
one decimal place.
Prompted by the teacher the
students moved to
discuss the solution to x2 –x +24 =0
and again, tried some examples
using the calculator.
The teacher showed
them how to enter
a formula into the spreadsheet page
and use ‘fill down’ to generate 10
terms.
Students were asked to decide if
the results were too high or too low and
record this in their
exercise books.
Make the instructions for
using the spreadsheet more
similar to the written table used in the starter.
Get students to type L or H in the third column.
Give more explicit
instructions for setting up the spreadsheet.
Students were very well behaved and focused on the
work and used the handheld
very sensibly. Students were very fluent in
their functional operation,
they clearly were familiar with how it works. Simple
instructions were given for operational tasks and the
vast majority were able to
do them. Students just got on with
the activity as if this was utterly normal!
[LMF3(Quest2)]
Questionnaire completed by CO in collaboration with SS.
Variance = the defined function, the
x-value.
Invariance = the
calculated values of
the defined function.
IUS1: Vary a numeric or
syntactic input and
use the instrument‟s
functionality to
observe the resulting output in
numeric, syntactic, tabular or graphical
form.
LMF4
Mystery factors
Students created a new file and used
the Calculator
application to explore the
outcomes of
inputting GCD(n,N) to explore highest
common factor and LCM(n,N) to explore
lowest common
multiple. Students recorded their
findings in their exercise books.
Variance = choice
of input numbers.
Invariance =
output in accordance with machine’s
algorithm for
calculating GCD and LCM.
IUS1: Vary a
numeric or
syntactic input and use the
instrument‟s functionality to
observe the
resulting output in numeric, syntactic,
tabular or graphical
form.

Appendix 4: Summary of activities submitted during Phase One
281
Lesson code, title and activity
description
Relevant screenshots and implied evidence of
teacher learning
Interpretation of variance and
invariance
Implied
Instrument Utilisation
Scheme
LMF5
Circles and Pi
Students created a new file and the
Graphs and Geometry
application and
used a step by step set of instructions
prepared by the
mentor to construct a circle with a
diameter, measure its properties and
save them as
variables. Students then opened a
Spreadsheet page to perform a data
capture of the
radius, diameter, circumference and
area. They then
added a Data and Statistics page and
produced a scatter plot of the diameter
and circumference.
What aspect(s) of the idea
would you use again?
The transfer from the graphical to spreadsheet
side to see linkages. [LMF4(Quest2)]
Students very please and
surprised by the automatic data collection
[LMF4(Quest2)] Yes but it is too much for
one lesson, so may be
better to be delivered in two lessons. [LMF4(Quest3)]
Variance =
positioning of circle, radius of circle,
positioning of
movable line (and resulting gradient).
Invariance =
sampling rate of
data, appearance of graphs (subject to
initial scale on
axes), position of curve y=x2.
IUS8: (Construct a
geometric scenario and then) vary the
position of objects
(by dragging) and automatically
capture measured data. Use the
numeric, syntactic,
graphical and tabular forms to
explore, justify
(and prove) invariant
properties.
LMF6
Box plots
analysing the
salaries of
Insufficient data
submitted
Insufficient data
submitted
Rejected from
Phase One data
analysis.

Appendix 4: Summary of activities submitted during Phase One
282
Lesson code, title and activity
description
Relevant screenshots and implied evidence of
teacher learning
Interpretation of variance and
invariance
Implied
Instrument Utilisation
Scheme
graduates and non
graduates using box plots
[LMF6Quest5)]
HAH1
Four fours
Students opened a
pre-constructed file that had already
been loaded onto the handhelds by
the teacher. They
used the Calculator application to try to
use four fours and
any combination of operations,
including brackets, to generate the
numbers from one
to a hundred. They recorded their
results in the Spreadsheet
application and
used a Notes page to record their
findings. Students saved their work.
Activity introduction and
screenshots as shown in CHS1
Due to personal lack of knowledge I became very
prescriptive in terms of the step by step tasks that I set
out, for example – “Press
the „on‟ button and no more!”
Fantastic start to the project
as it enabled me to see how much I knew and what I
needed to work on before I went any further.
[HAH1(Quest2)]
by me doing the activity
first I was confident to show the pupils. [HAH1(Quest3)]
Variance = the
inputs that the students provide
that met the activity
constraints with respect to ‘four
fours’ and the permitted
mathematical
operations.
Invariance = the
machine constraints with respect to how
the input was interpreted and its
resulting display.
IUS1: Vary a
numeric or syntactic input and
use the
instrument‟s functionality to
observe the resulting output in
numeric, syntactic,
tabular or graphical form.
HAH2 Temperature
conversion
Students created a
new file and used a step by step set of
instructions created
by the teacher to open a Lists and
Spreadsheet page and input a set of
values to represent
temperatures in Celsius and type
the given formula (=a1/5X9-32) to
generate a set of
temperatures in Fahrenheit.
Students then were instructed to insert
a Graphs and
Geometry page and told how to produce
a scatter plot of
temperatures in °F against °C. They
were instructed to join the points by
using the Attribute
‘Points are connected’.
No evidence of students’
exploration of variance and
invariance within
the lesson.
Rejected from Phase One data
analysis.

Appendix 4: Summary of activities submitted during Phase One
283
Lesson code, title and activity
description
Relevant screenshots and implied evidence of
teacher learning
Interpretation of variance and
invariance
Implied
Instrument Utilisation
Scheme
HAH3
Further Conversions
Students opened a
pre-constructed file that was distributed
to them during the lesson using the
link cables. They
used activity instructions written
in the Notes pages
to draw scatter plots of various
conversion data using Graphs and
Geometry pages.
The students had to deduce the
conversion relationships in
order to generate
the spreadsheet data and respond to
questions within the
Notes pages.
Variance = The
student’s choice of initial data set. The
student’s choice of
function to replicate the conversion.
Invariance = the
resulting
scattergraph.
IUS1: Vary a
numeric or syntactic input and
use the
instrument‟s functionality to
observe the resulting output in
numeric, syntactic,
tabular or graphical form.
HAH4
Adding fractions
Students created a
new file and used the Calculator
application to add
fractions of three types (same
denominators, co-prime
denominators, any
denominator). The students recorded
their own generalisations in
the Notes
application. The students shared
these during a
whole class plenary mediated by the
teacher with the support of the
project mentor.
Students saved their work.
Much more discussion work
– really got the boys
involved in the mathematical theories and
how the operations work. The theories really „stuck‟
with the boys because they
discovered it! [HAH4(Quest3)]
Variance = The
fractions chosen by the students as
inputs. The fraction
operation.
Invariance = The
calculated output,
IUS1: Vary a
numeric or syntactic input and
use the
instrument‟s functionality to
observe the
resulting output in numeric, syntactic,
tabular or graphical form.
HAH5
Data Handling Coursework
Students chose
whether to use TI-
Nspire or Excel to carry out their
GCSE Statistics Data Handling
project.
Insufficient data
submitted – it is not clear how the technology was
used in this activity.
Insufficient data
submitted
Rejected from
Phase One data analysis.

Appendix 4: Summary of activities submitted during Phase One
284
Lesson code, title and activity
description
Relevant screenshots and implied evidence of
teacher learning
Interpretation of variance and
invariance
Implied
Instrument Utilisation
Scheme
HRG1
Standard Form
Students chose
whether to use their TI-Nspire handheld
to solve a series of problems that led to
Standard Form
notation.
Insufficient data
submitted – it is not clear how the technology was
used in this activity.
Insufficient data
submitted
Rejected from
Phase One data analysis.
HRG2 Equations of
Straight Line
Students created a
new file and used
the Graphs and Geometry
application to investigate
equations that
produce parallel lines or lines that
go through a particular point on
the y-axis. Students
then tested their predictions for the
position of some given linear
functions.
No teacher file or students’ work submitted.
I led the lesson with my handheld hooked up to the
OHP. We investigated
parallel lines (same gradient) – the number in
front of the x and how we could measure it directly
from the graph. Also we
thought about how we could now easily plot straight lines
by hand – something we would try next lesson! We
moved on to test the effect
of the intercept – what it meant and whether it was
just true for straight lines. (HRG2(Journ-T)].
Variance = The values of m and c
for input linear
equations. The appearance of the
linear functions on
the screen, their lengths and
orientation. Invariance = the
definition of gradient
and intercept.
IUS1: Vary a numeric or
syntactic input and
use the instrument‟s
functionality to
observe the resulting output in
numeric, syntactic, tabular or graphical
form.
HRG3
Data Handling Coursework
Students chose whether to use TI-
Nspire or Excel to
carry out their GCSE Statistics
Data Handling project.
Insufficient data
submitted – it is not clear how the technology was
used in this activity.
Insufficient data
submitted
Rejected from
Phase One data analysis.
PCT1
Four fours
Students opened a
pre-constructed file
that had already been loaded onto
the handhelds by the teacher. They
used the Calculator
application to try to use four fours and
any combination of operations,
including brackets,
to generate the numbers from one
to a hundred. They recorded their
results in the
Spreadsheet application and
used a Notes page
to record their
Activity introduction and
screenshots as shown in
CHS1
A syntax error was
produced by adding = to the end of the calculation which
promoted a discussion on the use of the handheld
enter button.
The use of higher level keys on the calculator e.g.
square root button promoted experiment and
challenged previous
knowledge. Squaring and square roots
were discovered Making zero and 1 helped
make other numbers
Allowed pupils to choose their own style of
calculations, not teacher
led.
Variance = the
inputs that the
students provide that met the activity
constraints with
respect to ‘four fours’ and the
permitted mathematical
operations.
Invariance = the
machine constraints with respect to how
the input was
interpreted.
IUS1: Vary a
numeric or
syntactic input and use the
instrument‟s
functionality to observe the
resulting output in numeric, syntactic,
tabular or graphical
form.

Appendix 4: Summary of activities submitted during Phase One
285
Lesson code, title and activity
description
Relevant screenshots and implied evidence of
teacher learning
Interpretation of variance and
invariance
Implied
Instrument Utilisation
Scheme
findings. Students
saved their work.
The handheld allowed the
pupils to use functions beyond their previous
knowledge and gave
confidence to experiment. The pupils were able to
learn from errors. The handheld provided a
clear record with correct
notation. The record was electronic
and teachers had a
permanent record of their work. The facility of being
able to save work allows for the pupils to build on
previous work and
knowledge. The file could be returned to and added to
at a later date. The use of the handheld
encouraged accuracy.
Working in pairs promoted mathematical discussion of
operations, for instance
squaring numbers. Also discussion from pair to pair.
[PCT1(Journ-T)]
PCT2 Reflection
Students created a new and used the
Graphs and
Geometry application to
construct a freehand 2-D shape
and reflect it in
both axes. They then deformed their
original shape by dragging vertices
and observed the
resulting transformations.
During the introduction the feedback from the software
supported students to learn
from their predictions, where the outcomes
differed.
Students were able to visualise where the image
was going to end up and the dynamic nature of the
software supported the boys
to learn quickly. They also discussed their
mathematical ideas with each other. [PCT2(Quest2)]
The boys were more
engaged than usual with all students engaged in the
activity and keen to share
their outcomes with others
Variance = The position and
appearances of the
initial objects on the coordinate plane.
The selection of the
lines of symmetry.
Invariance = Resulting line
symmetry (in the
axes) as defined by the machine
constraints.
IUS3: Vary the position of an
object (by
dragging) that has been constructed in
accordance with a
conventional mathematical
constraint and observe the
resulting changes.

Appendix 4: Summary of activities submitted during Phase One
286
Lesson code, title and activity
description
Relevant screenshots and implied evidence of
teacher learning
Interpretation of variance and
invariance
Implied
Instrument Utilisation
Scheme
– something that is not
normal for this group. They were particularly intrigued
when we begun to drag the
shapes and use the dynamic nature of the software.
[PCT2(Quest2)]
PCT3
Intersecting lines
Students opened a pre-constructed file
that had already
been loaded onto the handhelds by
the teacher. They
dragged various points to observe
changes in angle properties using the
Graphs and
Geometry application and
commented on their findings using a
Notes page.
Students saved their TI-Nspire
work.
Sequence of lessons written
already. We felt we would like to
adjust the activities to make them more simplistic. (One
page to one diagram).
[PCT3(Quest2)] Some pages were too full
and „froze‟ when moving
points. By 3rd lesson most pupils
could navigate and use „doughnut‟ much more
effectively. [PCT3(Quest2)]
The lesson files were too prescriptive – we had
requested a lesson to use geometry menu – to allow
pupils to measure angles
accurately and spot themselves which were
equal/add to 180 or 360 etc. [PCT3(Quest3)]
Variance = the
positioning of the vertices that were
already fixed on the circumference of the
circle.
Invariance =the
inherent angle
properties (equality of vertically opposite
angles; sum of angles around the
centre); the length
of the lines (all diameters); the size
of the initial circle.
IUS3: Vary the
position of an object (by
dragging) that has been constructed in
accordance with a
conventional mathematical
constraint and
observe the resulting changes.
(Use another representational
form to add insight
to or justify/prove any invariant
properties).
PCT4 Solving
simultaneous equations (Linear
and quadratic)
Students created a
new file and used
the Graphs and Geometry
application to define two functions and
use the
Construction menu to find the
intersection points.
It would be possible to then
move on to solving the pairs of equations algebraically
with a clear picture in the
pupils‟ minds of what the algebraic manipulation
achieves/means.
It would also be possible to use the calculator page to
store a value of x then define a function and check
that the equations have the
same values at the point of intersection(s).
[PCT4(Quest2)] (What changes would you
make?)
Variance = the given pairs of
functions.
Invariance = the
point of intersection as observed (or
calculated) using the
technology.
IUS5: Vary a numeric or
syntactic input and use the
instrument‟s
functionality to observe the
resulting output in
numeric, syntactic, tabular or graphical
form. Use another representational
form to add insight
to or justify/prove any invariant
properties.

Appendix 4: Summary of activities submitted during Phase One
287
Lesson code, title and activity
description
Relevant screenshots and implied evidence of
teacher learning
Interpretation of variance and
invariance
Implied
Instrument Utilisation
Scheme
See above re using store
value of x and define function to check
[PCT4(Quest2)]
Without the need to plot graphs by hand they were
able to work at mathematics beyond this.
They were able to work
through the file at their own speed and understanding.
[PCT4(Quest2)]
The split screens allowed them to be systematic in
their working and recording (Changes next time)
checking simultaneous
equations intersected! could allow for them to
create files - examples of their own. [PCT4(Quest3)]
PCT5 Sequences
No teacher file or students’ work submitted.
This lesson highlights the
progression that needs to
be made by the teacher in their own learning of the
use of a new ICT tool, in that, as their capabilities
increase they are able to
recognise how to integrate its‟ use into their teaching.
[PCT5(Journ-T)]
Insufficient data submitted
Insufficient data submitted
PSH1
Rich Aunt problem
Students created a
new file and used the Spreadsheet
application to model the results of four
different investment
options aver different lengths of
time. They input formulae to the
spreadsheet and
used the fill down functionality to
generate lists of data and answer a
set of related
questions.
After teaching this one I decided a pre-constructed
spreadsheet would avoid the time consuming in the
lesson e.g. column headings
[PSH1(Quest3)] Pupils may have progressed
further in the activity if a lesson on formulae in excel
had been taught previously.
[PSH1(Quest3)]
Variance = The
four different investment options.
The spreadsheet
formula input to ‘match’ each model.
Invariance = the
resulting data
generated by the Spreadsheet
formula.
IUS1: Vary a
numeric or syntactic input and
use the
instrument‟s functionality to
observe the resulting output in
numeric, syntactic,
tabular or graphical form.
PSH2
Angles in circles
and tangents
Students opened a pre-constructed file
that had already
been loaded onto the handhelds by
the teacher. They
used a geometric
Pupils got on with the
syntax needed really well –
Variance = Position
of construction on
the page. Dimensions of circle.
Position of point on circumference.
Invariance = Position of
symmetrical point
on circumference.
IUS3: Vary the
position of an
object (by dragging) that has
been constructed in accordance with a
conventional
mathematical constraint and
observe the
resulting changes.

Appendix 4: Summary of activities submitted during Phase One
288
Lesson code, title and activity
description
Relevant screenshots and implied evidence of
teacher learning
Interpretation of variance and
invariance
Implied
Instrument Utilisation
Scheme
figure in the Graphs
and Geometry application to make
generalisations
about angle and line properties of a
circle’s radius and tangent.
much better than younger
pupils did. [PSH2(Quest2)]
I know feel pupils could
construct some of their own diagrams to aid their
learning of the properties of shapes, lines and angles.
[PSH2(Quest2)]
I was surprised at how positive the students were
and how easily they could
use the handheld e.g. opening files, selecting,
using menus. [PSH2(Quest2)]
Avoided the need for the
pupils to be able to draw accurate diagrams.
Gave pupils more opportunity to „play‟ with
the maths.
Highlighted the importance of correct notation.
[PSH2(Quest2)]
Point of intersection
of tangents.
PSH3
Equations of parallel and perpendicular
lines
Students created a
blank file and used the Graphs and
Geometry
application to generate linear
functions of parallel lines. They then
explored how to
generate perpendicular lines,
by measuring the angle between
them and adjusting
it to 90 degrees by dragging. They
made and tested
conjectures about the gradients of
pairs of perpendicular lines.
During the plenary
they collated their findings resulting in
a generalisation.
‘YOU HAVE TO DIVIDE 1 BY THE AMOUNT X'S.’
[PSH3(tns-S)]
Pupils really appreciated the
ability to move the line on the screen and then be told
the equation of the new line. [PSH3(Quest2)]
It would have been useful to have accompanying
resources for pupils to
record their graphs and note findings. [PSH3(Quest2)]
it allowed pupils to explore
the problem for themselves
quickly and efficiently so the focus was on the intended
learning rather than issues with drawing graphs that
could have occurred
otherwise. [PSH3(Quest2)]
Measurements not always exact e.g. 90.34…°
between y=2x and y=-
0.49x [PSH3(Quest2)]
Variance = The
initial linear function (entered
syntactically). The second linear
function. The
positioning of the points used to define
the angle between
the two lines. The measured angle
between the two linear functions.
Invariance = The mathematical
condition - when the lines are
perpendicular, the
product of the gradients is negative
one.
IUS6: Vary the
position of an object that has
previously been defined
syntactically (by
dragging) to satisfy a specified
mathematical
condition.

Appendix 4: Summary of activities submitted during Phase One
289
Lesson code, title and activity
description
Relevant screenshots and implied evidence of
teacher learning
Interpretation of variance and
invariance
Implied
Instrument Utilisation
Scheme
PSH4
Exponential growth and decay
Students used 25 real dice each to
obtain data to simulate an
exponential decay.
The group’s results were collated by the
teacher using the
Spreadsheet application and a
Scatter plot of the results drawn in the
Data and Statistics
page. Students then worked on similar
problems from a text book scheme,
to model growth
and decay problems and fitted algebraic
functions to the
data.
Pupils could recognise the
shape of an exponential graph and most could
describe what is happening
in that graph – phrases such as “the more there is the
more it increases” led to connection with a multiplier.
[PSH4(Quest2)]
I would like to try more
experimental lessons –
especially with connections to other subjects. I would
also like to try and introduce the Nspire to
some of the science
department so they could utilise it within lessons.
[PSH4(Quest2)]
It was powerful for the
pupils to be able to connect the data they worked out
for themselves to a function
drawn on a graph. Collecting data on the
spreadsheet function to be able to represent it in
graphical form.
[PSH4(Quest2)]
It would have been nice to try and assign a function to
the dice/atom activity and
compare this using split screen view on the nspire.
I have since found out that
you can add an exponential regression line which gives
you the equation of the line as well – this could have
been used as a check to the
one they found themselves. [PSH4(Quest2)]
Variance = The
data input to the spreadsheet. The
function input to the
graphical application.
Invariance =The
resulting
scattergraph of the data in the Data and
Statistics
application. The resulting function
plot in the Graphs application.
IUS5: Vary a
numeric or syntactic input and
use the
instrument‟s functionality to
observe the resulting output in
numeric, syntactic,
tabular or graphical form. Use another
representational
form to add insight to or justify/prove
any invariant properties.

Appendix 4: Summary of activities submitted during Phase One
290
Lesson code, title and activity
description
Relevant screenshots and implied evidence of
teacher learning
Interpretation of variance and
invariance
Implied
Instrument Utilisation
Scheme
PSH5
Enlargements
Students opened a
pre-constructed file that was distributed
to them during the lesson using the
link cables. They
worked in the Graphs and
Geometry
application to enlarge a given
shape by changing the scale factor
using integer
values. Students observed the
resulting perimeter and area
measurements and
entered these into a Spreadsheet
application. The
teacher led a whole class plenary to
discuss findings. The teacher did not
review the students’
files.
No teacher file or students’
work submitted.
To an extent, I did as much
as I my technical abilities would allow in the time that
I had. If I had asked for technical
help earlier I could have
transferred the doc. prior to the lesson. [PSH5(Quest3)]
No – I wanted to capture data from the enlargements
to the spreadsheet but neither Adrian or I could do
this – pupils had to enter
data manually. [PSH5(Quest3)]
Pupils realised the need for
centre of enlargement as
the Nspire needed that info to complete the
enlargement.
& pupils found they ran out of space and needed to
change the centre of enlargement to fit it.
[PSH5(Quest3)]
Variance = The
appearance and the position of the given
shape. The original
perimeter and area of the given shape.
The scale factor.
Invariance = The
appearance and position of the
enlarged shape. The
resulting perimeter and area of the
enlarged shape.
IUS2: From a
given set of static geometric objects,
make
measurements and tabulate data to
explore variance and invariance
within the
measured data in numeric and
tabular forms.
BAK1 BJJ1
Four fours
Students
downloaded a pre-constructed file
from the school
virtual learning environment to
their laptop computers. They
used the Calculator
application to try to use four fours and
any combination of
operations, including brackets,
to generate the numbers from one
to a hundred. They
recorded their results in the
Spreadsheet application and
used a Notes page
to record their findings. Students
continued the activity for
homework and
uploaded their files to the school virtual
learning
environment at the
Activity introduction and screenshots as shown in
CHS1
Also, the division sums all
changed to fractions – again they found this confusing.
Some students were really
happy to try things out and enter calculations to
investigate what was going on. Others were more
reluctant and needed some
prompting just to have a go. Many wanted to key straight
into the spreadsheet, which
meant them having to know the answer before they had
tried the question, these pupils were pointed to the
calculator page and
encouraged to type in any sum and see what
happened. [BAK1(Quest2)]
Variance = the inputs that the
students provide
that met the activity constraints with
respect to ‘four fours’ and the
permitted
mathematical operations.
Invariance = the
machine constraints
with respect to how the input was
interpreted.
IUS1: Vary a numeric or
syntactic input and
use the instrument‟s
functionality to observe the
resulting output in
numeric, syntactic, tabular or graphical
form.

Appendix 4: Summary of activities submitted during Phase One
291
Lesson code, title and activity
description
Relevant screenshots and implied evidence of
teacher learning
Interpretation of variance and
invariance
Implied
Instrument Utilisation
Scheme
end of the lesson.
BAK2
Percentage
multipliers
Students
downloaded a pre-constructed file
from the school virtual learning
environment to
their laptop computers.
Students solved some problems
relating to
comparing decimals and percentages in
the Spreadsheet application and
used a Calculator
page to check for validity. In the
second part of the
lesson they used the Spreadsheet
application to solve numerical problems
relating to
percentage increases and
decreases of given amounts. The
students uploaded
their files to the school virtual
learning
environment at the end of the lesson.
On each line on the
following spreadsheet page
there is a question. For example:
35% < = > 1/3
Delete the two incorrect symbols from "<", "=" and
">" so that the line reads correctly e.g.
35% > 1/3
If you make a mistake use the "undo" button - the blue
arrow. You can check your results
using the calculator page 3.
[BAK2(tns-T)].
No evidence of
students’
exploration of variance and
invariance within
the lesson.
Activity rejected
from data
analysis process.
BAK3
BJJ3 Investigating
straight lines
Students created a
new file and used
the Graphs and Geometry
application to explore equations
of straight lines of
the form y = mx + c by varying m and
c. They were encouraged to split
their page and write
about their observations using
the Notes
application. Students uploaded
their .tns files to the school virtual
learning
Variance = The
values of m and c for input linear
equations. The
appearance of the linear functions on
the screen, their
lengths and orientation.
Invariance = the definition of gradient
and intercept.
IUS1: Vary a
numeric or syntactic input and
use the
instrument‟s functionality to
observe the
resulting output in numeric, syntactic,
tabular or graphical form.

Appendix 4: Summary of activities submitted during Phase One
292
Lesson code, title and activity
description
Relevant screenshots and implied evidence of
teacher learning
Interpretation of variance and
invariance
Implied
Instrument Utilisation
Scheme
environment at the
end of the lesson.
BAK4
BJJ4
Exploring angles
Students
downloaded a pre-constructed file
from the school virtual learning
environment to
their laptop computers.
Students opened a pre-constructed file
that had already
been loaded onto the handhelds by
the teacher. They dragged various
points to observe
changes in angle properties using the
Graphs and
Geometry application and
made comments in response to
questions on a
Notes page. Students uploaded
their files to the school virtual
learning
environment at the end of the lesson.
Questions on Notes page:
Which of the sums add up to 180° Why?
Which of the sums add up to 360° Why?
Able to move and use
dynamic diagrams and to
make conjectures about vertically opposite angles.
[BAK4(Quest2)]
Variance = the
positioning of the
vertices that were already fixed on the
circumference of the
circle.
Invariance =the inherent angle
properties (equality
of vertically opposite angles; sum of
angles around the centre); the length
of the lines (all
diameters); the size of the initial circle.
IUS3: Vary the
position of an
object (by dragging) that has
been constructed in
accordance with a conventional
mathematical constraint and
observe the
resulting changes.
BAK5
BJJ5
Comparing box plots
Students
downloaded a pre-
constructed .tns from the school
virtual learning
environment to their laptop
computers. They used a simple data
set in the
Spreadsheet application and
used the defined functions mean and
median to calculate
these values. Some students also used
formulae to
calculate the range. They then inserted
at Data and Statistics page and
drew Box plots of
On the following page you
will find the scores of 4
students from a series of maths test over the past 10
weeks. The tests are marked out of 10.
By working out the four
averages, decide on who is the best student.
Write on the third page who
is the best student. [BJJ5(tns-T)]
Variance = Four
different data sets
already input into the spreadsheet.
Invariance =
Calculated Mean,
Mode Median and Range for each set
of data. Displayed
Box Plots.
IUS1: Vary a
numeric or
syntactic input and use the
instrument‟s functionality to
observe the
resulting output in numeric, syntactic,
tabular or graphical
form.
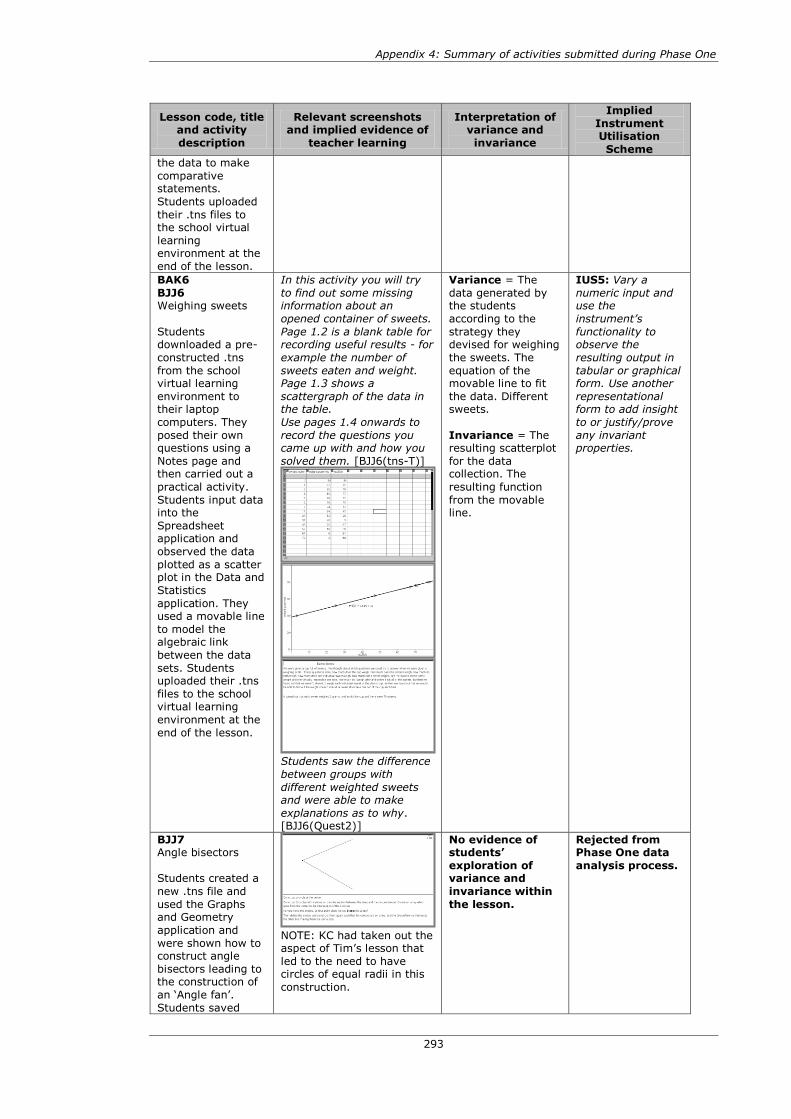
Appendix 4: Summary of activities submitted during Phase One
293
Lesson code, title and activity
description
Relevant screenshots and implied evidence of
teacher learning
Interpretation of variance and
invariance
Implied
Instrument Utilisation
Scheme
the data to make
comparative statements.
Students uploaded
their .tns files to the school virtual
learning environment at the
end of the lesson.
BAK6
BJJ6 Weighing sweets
Students downloaded a pre-
constructed .tns
from the school virtual learning
environment to their laptop
computers. They
posed their own questions using a
Notes page and then carried out a
practical activity.
Students input data into the
Spreadsheet application and
observed the data
plotted as a scatter plot in the Data and
Statistics
application. They used a movable line
to model the algebraic link
between the data
sets. Students uploaded their .tns
files to the school virtual learning
environment at the
end of the lesson.
In this activity you will try
to find out some missing information about an
opened container of sweets.
Page 1.2 is a blank table for recording useful results - for
example the number of
sweets eaten and weight. Page 1.3 shows a
scattergraph of the data in the table.
Use pages 1.4 onwards to
record the questions you came up with and how you
solved them. [BJJ6(tns-T)]
Students saw the difference
between groups with
different weighted sweets and were able to make
explanations as to why. [BJJ6(Quest2)]
Variance = The
data generated by the students
according to the
strategy they devised for weighing
the sweets. The
equation of the movable line to fit
the data. Different sweets.
Invariance = The resulting scatterplot
for the data collection. The
resulting function
from the movable line.
IUS5: Vary a
numeric input and use the
instrument‟s
functionality to observe the
resulting output in
tabular or graphical form. Use another
representational form to add insight
to or justify/prove
any invariant properties.
BJJ7 Angle bisectors
Students created a
new .tns file and
used the Graphs and Geometry
application and
were shown how to construct angle
bisectors leading to the construction of
an ‘Angle fan’.
Students saved
NOTE: KC had taken out the aspect of Tim’s lesson that
led to the need to have circles of equal radii in this
construction.
No evidence of students’
exploration of variance and
invariance within
the lesson.
Rejected from Phase One data
analysis process.

Appendix 4: Summary of activities submitted during Phase One
294
Lesson code, title and activity
description
Relevant screenshots and implied evidence of
teacher learning
Interpretation of variance and
invariance
Implied
Instrument Utilisation
Scheme
their TI-Nspire
work. Students uploaded their .tns
files to the school
virtual learning environment at the
end of the lesson.
BAK8
Pi Day
Students created a new .tns file and
used the Graphs
and Geometry application with a
set of instructions
to construct a circle with a diameter,
measure its diameter and
circumference and
save them as variables. Students
then opened a Spreadsheet page
to perform
automated data capture of the
diameter and circumference. They
then added a Data
and Statistics page and produced a
scatter plot of the
diameter and circumference. They
added a movable line to find the
algebraic
relationship between the
variables. Students uploaded their .tns
files to the school
virtual learning environment at the
end of the lesson.
They drew a segment
relatively easily and also a circle, but found it quite
difficult to attach the two together so that they were
linked. A lot of them did not
appreciate the importance of them being linked
together until we tried to
drag them bigger and smaller and collect the data.
It would be good to use alongside measuring real
objects. It is a nice idea to
plot diameter against circumference and use the
moveable line to find the value of pi. We need to
change the fix function to
get the value to more decimal places – I forgot to
do this before the start or tell the kids to do it.
[BAK8(Quest2)]
Variance =
Positioning of circle. Radius of circle.
Positioning of movable line.
Invariance = Sampling rate of
data. Appearance of
graphs (subject to initial scale on
axes). Resulting gradient of movable
line.
IUS8: (Construct a
geometric scenario and then) vary the
position of objects (by dragging) and
automatically
capture measured data. Use the
numeric, syntactic,
graphical and tabular forms to
explore, justify (and prove)
invariant
properties.
BAK9
Investigating quadrilaterals
Students
downloaded a pre-
constructed .tns from the school
virtual learning
environment to their laptop
computers. They opened a Graphs
and Geometry page
and followed a set of instructions in
the Notes page to construct a
rectangle. They
Activity instructions
On the following pages are different quadrilaterals.
Measure the length of each line.
Which lines are the same
length? Which lines are parallel?
Measure some angles.
Which angles are the same? Do any angles add up to
Variance = the
chosen quadrilateral, the construction
technique, the measurements
taken,
Invariance =
IUS3: Vary the
position of an object (by
dragging) that has been constructed in
accordance with a
conventional mathematical
constraint and
observe the resulting changes.
Use another representational
form to add insight
to or justify/prove any invariant
properties.

Appendix 4: Summary of activities submitted during Phase One
295
Lesson code, title and activity
description
Relevant screenshots and implied evidence of
teacher learning
Interpretation of variance and
invariance
Implied
Instrument Utilisation
Scheme
then moved on to
measure the interior angles and
side lengths for a
given set of quadrilaterals
(square rhombus, parallelogram,
trapezium, isosceles
trapezium, kite and arrowhead). They
were encouraged to
drag the vertices and record what
they noticed using the Notes
application.
Students uploaded their .tns files to
the school virtual learning
environment at the
end of the lesson.
180°?
Record your finding in the space provided
Being able to move the shapes around and see what
they could change them into and which observations
remained true was very
useful to the students. The accuracy of the
measurements helped them
as well – they could see that their lines were exactly the
same length, rather than just approximately as it
might have been if we‟d
drawn them by hand. [BAK9(Quest2)]
BAK10 BJJ10
Constructing
equilateral triangles
Students created a new file and used
the Graphs and
Geometry application to
explore how to
construct an equilateral triangle
using circles alongside making
the same
constructions using a straight edge
compasses. Students uploaded
their files to the
school virtual learning
environment at the
end of the lesson.
No evidence of students’
exploration of
variance and invariance within
the lesson.
Rejected from Phase One data
analysis process.
GBA1 Box plots
comparison
Students opened a
pre-constructed .tns file that had already
been loaded onto
the handhelds by the teacher. They
used given sets in the Spreadsheet
application to draw
parallel box plots in the Data and
Statistics application and
compare sets of
Box and whisker diagrams are use to compare sets of
data. Your job is to compare the sets of data given to
you on the spread sheet,
draw the box plots and use the notes page to comment
on the differences.
Question 1: Year 9 & year 8 weights
Question 2: Year 6 & year 7 test scores
Question 3: Hours of sun in
resort 1 & resort 2 Question 4: Birth weights
boys & girls Question 5: Goals scored by
a team in 2006 & 2007
Variance =The two data sets selected
by the students.
Invariance = The
resulting Box plots and statistical
summary data.
IUS1: Vary a numeric or
syntactic input and use the
instrument‟s
functionality to observe the
resulting output in
numeric, syntactic, tabular or graphical
form. New possibilities

Appendix 4: Summary of activities submitted during Phase One
296
Lesson code, title and activity
description
Relevant screenshots and implied evidence of
teacher learning
Interpretation of variance and
invariance
Implied
Instrument Utilisation
Scheme
data. They recorded
their comments using the Notes
page. Students
saved their work.
For Questions 1 & 2 set
scale from 0 - 100 For Question 3 set scale
from 0 - 15
For Question 4 set scale from 0 - 5
For Question 5 set scale from 0 – 12 [GBA1(tns-T]
GBA2 Vitruvian man
Students opened a
pre-constructed .tns
file that had already been loaded onto
the handhelds by
the teacher. They had previously
collected a set of heights and arm
spans sixty people
that had been entered into the
Spreadsheet application. The
students made and
tested hypothesis by using the Data
and Statistics application to draw
scatter plots of
specific data. They recorded their
findings using the
Notes application. Students saved
their work, which was reviewed by
the teacher.
The Ancient Roman architect Vitruvius
considered proportion when designing buildings and this
led to him defining his
Vitruvian Man. He wrote that for a human man:
the length of a man's
outspread arms is equal to his height
the distance from the top of the head to the
bottom of the chin is
one-eighth of a man's height
the maximum width of the shoulders is a
quarter of a man's
height the distance from the
elbow to the tip of the hand is one-fifth of a
man's height
the length of the hand is one-tenth of a
man's height
the distance from the bottom of the chin to
the nose is one-third of the length of the
head
the length of the ear is one-third of the length
of the face
Your activity is to
investigate the connection between a man's arm span
and height together with
one other statement from
Variance =The data sets selected by the
students for comparison.
Invariance = The resulting statistical
plots summary data.
IUS1: Vary a numeric or
syntactic input and use the
instrument‟s
functionality to observe the
resulting output in
numeric, syntactic, tabular or graphical
form.
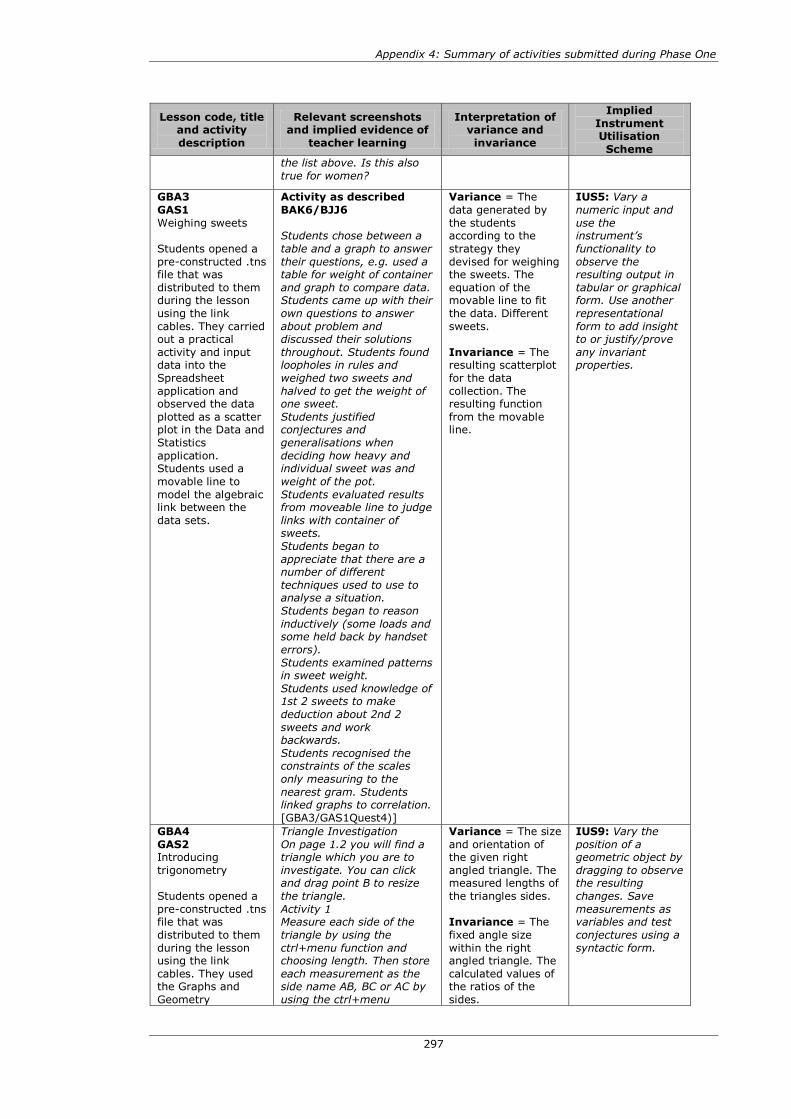
Appendix 4: Summary of activities submitted during Phase One
297
Lesson code, title and activity
description
Relevant screenshots and implied evidence of
teacher learning
Interpretation of variance and
invariance
Implied
Instrument Utilisation
Scheme
the list above. Is this also
true for women?
GBA3
GAS1
Weighing sweets
Students opened a
pre-constructed .tns file that was
distributed to them during the lesson
using the link
cables. They carried out a practical
activity and input data into the
Spreadsheet
application and observed the data
plotted as a scatter plot in the Data and
Statistics
application. Students used a
movable line to
model the algebraic link between the
data sets.
Activity as described
BAK6/BJJ6
Students chose between a
table and a graph to answer
their questions, e.g. used a table for weight of container
and graph to compare data. Students came up with their
own questions to answer
about problem and discussed their solutions
throughout. Students found loopholes in rules and
weighed two sweets and
halved to get the weight of one sweet.
Students justified conjectures and
generalisations when
deciding how heavy and individual sweet was and
weight of the pot.
Students evaluated results from moveable line to judge
links with container of sweets.
Students began to
appreciate that there are a number of different
techniques used to use to analyse a situation.
Students began to reason
inductively (some loads and some held back by handset
errors).
Students examined patterns in sweet weight.
Students used knowledge of 1st 2 sweets to make
deduction about 2nd 2
sweets and work backwards.
Students recognised the constraints of the scales
only measuring to the
nearest gram. Students linked graphs to correlation.
[GBA3/GAS1Quest4)]
Variance = The
data generated by
the students according to the
strategy they
devised for weighing the sweets. The
equation of the movable line to fit
the data. Different
sweets.
Invariance = The resulting scatterplot
for the data
collection. The resulting function
from the movable line.
IUS5: Vary a
numeric input and
use the instrument‟s
functionality to
observe the resulting output in
tabular or graphical form. Use another
representational
form to add insight to or justify/prove
any invariant properties.
GBA4
GAS2 Introducing
trigonometry
Students opened a
pre-constructed .tns file that was
distributed to them
during the lesson using the link
cables. They used the Graphs and
Geometry
Triangle Investigation
On page 1.2 you will find a triangle which you are to
investigate. You can click and drag point B to resize
the triangle.
Activity 1 Measure each side of the
triangle by using the
ctrl+menu function and choosing length. Then store
each measurement as the side name AB, BC or AC by
using the ctrl+menu
Variance = The size
and orientation of the given right
angled triangle. The measured lengths of
the triangles sides.
Invariance = The
fixed angle size
within the right angled triangle. The
calculated values of the ratios of the
sides.
IUS9: Vary the
position of a geometric object by
dragging to observe the resulting
changes. Save
measurements as variables and test
conjectures using a
syntactic form.

Appendix 4: Summary of activities submitted during Phase One
298
Lesson code, title and activity
description
Relevant screenshots and implied evidence of
teacher learning
Interpretation of variance and
invariance
Implied
Instrument Utilisation
Scheme
application to
measure the sides of given right-
angled triangles
and saved each measurement as a
variable. They used a Calculator page to
calculate various
ratios. Groups of students focused on
a different set of
triangles and these groups were mixed
up to support the class to generalise
about trigonometric
rations during the whole-class
plenary.
function and choosing store.
Activity 2 Investigate the result of
*((BC)/(AB)), ((AC)/(AB)),
or ((BC)/(AC)) using the calculator page.
Answer the questions on page 1.3.
Activity 3
Record your results of activity 3 in page 1.4,
please note which sides you
are investigating. [GAS2(tns-T)]
Surprise that the ratio
remained constant for a
given angle – even though they had just worked on
identifying similar triangles, this fact had clearly not hit
home. [GAS2(Quest2)]
GBA5
Circles theorems
Students created a
new .tns file and inserted a split page
with a Graphs and Geometry (analytic
window) alongside
a Calculator page. They constructed a
circle and an inscribed
quadrilateral,
measuring the four interior angles and
saving the
measurements explicitly as
variables. They used the calculator
page to check angle
sums using the variable notation
and made generalisations
relating to their
explorations.
(In the subsequent lesson they
explored the angle
properties of a quadrilateral with
three vertices on
the circle’s
[GBA5 (tns-S2)]
[GBA5 (tns-S3)]
Getting the pupils to construct the situation and
play about with it themselves is definitely a
valuable activity that I
would use again. [GBA5(Quest2)]
I feel that my teaching of
this topic has been
enhanced by this activity. Although it could have been
done on a geometry
program in a computer
Variance = the size
of the circle, the position of the
vertices of the
quadrilateral or ‘bow’ shape.
Invariance =
opposite angles of a
cyclic quadrilateral sum to 180°; angles
subtended on the same arc are equal.
IUS9: Construct a
graphical or geometric scenario
and then vary the
position of a geometric object by
dragging to observe the resulting
changes. Save
measurements as variables and test
conjectures using a syntactic form.

Appendix 4: Summary of activities submitted during Phase One
299
Lesson code, title and activity
description
Relevant screenshots and implied evidence of
teacher learning
Interpretation of variance and
invariance
Implied
Instrument Utilisation
Scheme
circumference and
the fourth vertex positioned at the
centre of the circle.)
room, the use of the TI-
nspire was less disruptive and as this class have used
them before it was easier
for them to access. I feel that the pupils will
remember these circle theorems as they have had
a practical lesson to
discover them rather than being shown or told them
and then simply applying
them. [GBA5(Quest2)]
Having discovered one circle theorem in the previous
lesson they now seemed
more confident in making generalisations about the
angles that they had measured and any
connections they were
noticing. They were again able to move things around
and see what happened to
the angles. [GBA5(Quest2)]
GRE1 Four fours
Students opened a
pre-constructed .tns
file that had already been loaded onto
the handhelds by
the teacher. They used the Calculator
application to try to use four fours and
any combination of
operations, including brackets,
to generate the numbers from one
to a hundred. They
recorded their results in the
Spreadsheet
application and used a Notes page
to record their findings.
Activity introduction and screenshots as shown in
CHS1
The visual representation of
the problem on screen helped to differentiate
between different „sums‟.
[GRE1(Quest2)]
Variance = the inputs that the
students provide that met the activity
constraints with
respect to ‘four fours’ and the
permitted
mathematical operations.
Invariance = the
machine constraints
with respect to how the input was
interpreted.
IUS1: Vary a numeric or
syntactic input and use the
instrument‟s
functionality to observe the
resulting output in
numeric, syntactic, tabular or graphical
form.
GRE2
Vitruvian man
The students had
previously collected
a set of heights and arm spans sixty
year 9 students. They opened a pre-
constructed .tns file
that included the data within the
Spreadsheet application.
Activity as described in
GBA2
Variance =The data
sets selected by the
students for comparison.
Invariance = The resulting statistical
plots and summary data.
IUS1: Vary a
numeric or
syntactic input and use the
instrument‟s
functionality to observe the
resulting output in numeric, syntactic,
tabular or graphical
form. The students made
and tested hypotheses by
using the Data and

Appendix 4: Summary of activities submitted during Phase One
300
Lesson code, title and activity
description
Relevant screenshots and implied evidence of
teacher learning
Interpretation of variance and
invariance
Implied
Instrument Utilisation
Scheme
What I am really trying to do is to
get pupils to focus
on the analysis of results and to try
and get them to see that drawing
relevant conclusions
from statistical data is as important as
calculating from the
data. [GRE3 (Journ-T)]
Statistics
application to draw scatter plots of
specific data. They
recorded their findings using the
Notes application. Students saved
their work, which
was reviewed by the teacher
GRE3
Scatter plots
Students opened a pre-constructed .tns
file that had already
been loaded onto the handhelds by
the teacher. They used given data
sets in the
Spreadsheet application to draw
scattergraphs in the Data and Statistics
application. They
commented on the resulting
correlation, added a
movable line and responded to
questions inferred from the data. They
recorded their
comments using the Notes page.
Students saved their TI-Nspire
work.
Variance =
inherent in the data sets within the
activity.
Invariance =
The text ‘variable’
appears when the students move the
cursor towards the
axes in order to select the data for
the scatter plot.
IUS5: Vary a
numeric input and use the
instrument‟s functionality to
observe the
resulting output in numeric and
graphical form. Use another
representational
form to add insight to or justify/prove
any invariant properties.

Appendix 5: Coding categories and sub-categories for teacher learning in Phase One
301
APPENDIX 5: CODING CATEGORIES AND SUB-CATEGORIES FOR TEACHER
LEARNING IN PHASE ONE
Category of teacher
learning Name
Activity design TL - Amendment to teacher's intro IUS
TL - Balance of construction to exploration within IUS
TL - Better initial examples
TL - 'blend' of ICT and paper-pencil approach
TL - Good 'first' activity
TL - Need for supporting resources for teachers and pupils
TL - New ways of organising classes for mathematical purpose
TL - Trying a new approach
TL - Whole class mediation – IUS
TL - Appreciation of the need for a tighter focus on generalisation
Expectations of students TL - Pupils enjoyed the activity
TL - Pupils working faster
TL - Student reluctance to use technology
TL - Students' instrumentation issues
TL - Students' instrumentation successes
TL - Students use of technical language beyond teachers'
expectation
TL - Surprise at students; ability to use technology
TL - Teacher observation of genuine student surprise and intrigue
TL - Speed of student uptake
Instrument utilisation
schemes
TL - Amendment to students' IUS
TL - Classroom management issues
TL - Importance of teacher demonstration re IUS
TL - Need to discuss machine v real mathematics
Meta level ideas TL - Appreciation of 'fundamental' aspect of mathematics
TL - Fundamental change to teacher pedagogy
TL - Need for teacher to practise own skills - IUS
TL - Software supporting classroom discourse
TL - Students' need for a big picture view of learning
TL - Students' need for teacher to renegotiate the didactic contract
TL - Students working at own pace
TL - Teacher realisation of another way of learning
TL - Teachers' appreciation of improved student accuracy
TL - When not to use technology
TL - Visual imagery provided scaffolding

Appendix 6: Analysis of Tim‟s Phase One lesson data
302
APPENDIX 6: ANALYSIS OF TIM’S PHASE ONE LESSON DATA
What follows is an account of Tim’s learning trajectory as evidenced by the analysis
of his lesson data from the first phase. This provides an insight into his emergent
instrument utilisation schemes and some evidence for his learning during this
period of time.
I have already commented that Tim’s starting point with respect to his technical
and pedagogic knowledge relating to mathematics education technology was
noticeably more advanced that the other participants in the project. He had been
personally acquainted with handheld technology for over seventeen years and in
that period he had been active in the authoring of teaching materials and the
professional development of other teachers. However, his school context, and in
particular, his concerns over supporting his learners through the initial
instrumentation period led him to begin quite tentatively, using an activity of the
type IUS1.
STP1 Prime factorisation
Tim’s first lesson using the MRT was with his Year 8 class, a set 1 (of 6)1 working at
National Curriculum levels 5-6. Tim showed his students how to manually entered a
text and numeric input to the calculator’s ‘factor()’ function with the aim of
observing the invariant properties: ‘the prime factorisation of a number is unique;
prime numbers have only two factors; square numbers have an odd number of
factors’ [STP1(Quest2)]. In his activity design Tim intended that, by changing the
input number, the students would gain an appreciation of the aforementioned
invariant properties through their interpretations of the numerical outputs (Figure
A6-1).
Figure A6-1 [STP1(tns-T)]
1 Each year group at Blue Coat School was divided into two bands. These were then sub-
divided into mathematics sets according to their mathematical attainment. Set 1 would have
included the most able students in that half of the year group.

Appendix 6: Analysis of Tim‟s Phase One lesson data
303
In addition to his mathematics objectives for the activity, he had also identified two
objectives that concerned the students’ instrumentation phase, ‘to learn how to use
the factor() command and also how to copy and paste items from the history on
the calculator page’ [STP1(Quest2)]. This reflected Tim’s existing knowledge in that
he knew that his lesson introduction would need to mediate these instrumental
techniques as an explicit act. The students recorded their work in their exercise
books. Tim’s post-lesson evaluation suggested that his classroom experience had
led him to think more carefully about his introduction to the activity, implying his
increased appreciation of how his initial choice of input numbers might have
affected the students’ abilities to see the intended generalities. Tim went as far as
to suggest an alternative sequencing for the activity thus:
I would probably start by deliberately choosing numbers that are a
product of exactly two primes (each to the power 1) in order to
encourage students to begin to generalise.
factor(6)=2x3
factor(35)=5x7
factor(14)=2x7
I would then ask students what they thought the output of, say
factor(21) and factor(55) might be.
Just when the students thought they were getting the hang of this I
would throw in a question where the prime factorisation contained an
index, such as factor(16). I would look surprised at the outcome and
ask them to investigate further. [STP1(Quest2)]
Tim’s evaluation of the activity was in part triangulated by a sample of his students’
written work that he had photocopied and submitted to the study. This showed the
sequences of numbers that the students had explored, which appeared to be
initially random choices, although later into the activity, some students began to
work more systematically. Already there was evidence to suggest that Tim was
reflecting on the requirement for him to think carefully about structuring the
activity to enable him to support his students to ‘see’ the invariant properties in the
way that he envisaged.
STP2 Visual fractions
The second activity that Tim submitted to the project reflected the fact that he had
now had ownership of his handheld for over five months. He had clearly been
exploring the opportunities to define variables and link these to the geometric

Appendix 6: Analysis of Tim‟s Phase One lesson data
304
representations on the screen, which resulted in his creation of a set of two activity
resources that he called ‘visual fractions’. In these he allowed the user to change
five integer values that represented the ‘divisor’ (d) and the numerators and
denominators of two fractions. Both fractions had to be less than one. Having input
the five values, the user was expected to drag a point on a line segment from left
to right, the outcome of which was to perform a fraction addition by appearing to
pour the contents of the first fraction bar into the second one (Figure A6-2).
Figure A6-2 [STP2(tns-T)]
The instrument utilisation scheme that Tim developed was an enhanced version of
IUS1, which I labelled IUS5 (Vary a numeric input and drag an object within a
related mathematical environment and observe the resulting visual output). It
differed in that Tim had introduced an additional requirement to select and drag a
point fixed on a line segment from left to right, which served to enact the fraction
calculation as a visual representation. Tim commented that he felt that this
dragging added the dimension of time to the process.
Tim used this activity with the same year 8 class that had worked on the Factor
activity. There was a particular subtlety relating to the invariant property that Tim
was keen for the students to observe through this activity, which concerned the
value the students assigned to d the divisor. He was hoping that they would notice
that, when d bore a particular relationship to the denominators of the fractions, the
positions of the horizontal lines of division made it possible for his students to
predict and ‘read off’ the outcome of their fraction additions.
In designing this activity Tim was offering a dynamic visual representation of
fraction addition that he hoped would provide a bridge to later pencil-and-paper
methods. However, Tim also observed that not all of his students were receptive to
this dynamic approach and noted,
Some students already had a strong mental image of fractions and/or
were already capable of working with the addition and subtraction of

Appendix 6: Analysis of Tim‟s Phase One lesson data
305
fractions quite confidently. These students were reluctant to use the TI-
nspire to explore fractions, seemingly because they did not want to have
their understanding of fractions challenged. They made comments such
as, „It‟s easier without the TI-nspire,‟ or, „I can do fractions already‟.
[STP2(Quest2)]
On the other hand Tim reported that there were some students for whom the
activity using the technology had influenced their subsequent paper and pencil work
when they were practising fraction addition calculations without access to the
technology. Tim included the extract from one of his students’ exercise books as
evidence for this (Figure A6-3).
Figure A6-3 STP2(StudWork)
An interesting observation of this student’s work is that, in addition to drawing the
fraction bars, the student has omitted to write a conventional horizontal line
between the numerator and denominator of all of the fractions. This may well be a
result of the student’s attention being focused on the importance of the values of
the numerators and denominators within the technological setting and failing to
notice the conventional syntax for fractions.
STP3 Angle bisectors
The third lesson that Tim submitted during Phase One was a geometric activity
concerning the conventional Euclidian construction of an angle bisector and he
created an approach that used only a geometric representation. He took a wide
perspective on the mathematics concerning this construction and, rather than
teaching his students a practical algorithm that would lead to a successful
construction he maintained his desire to allow his students to explore the possible
constructions with a view to them arriving at their own interpretation of the
conditions needed for a successful angle bisector. Tim again chose to work with the
same year 8 class as previously and he began the lesson by working with them to
create a dynamic construction on the board using the TI-Nspire software displayed
on the class interactive whiteboard (see Figure A6-4).
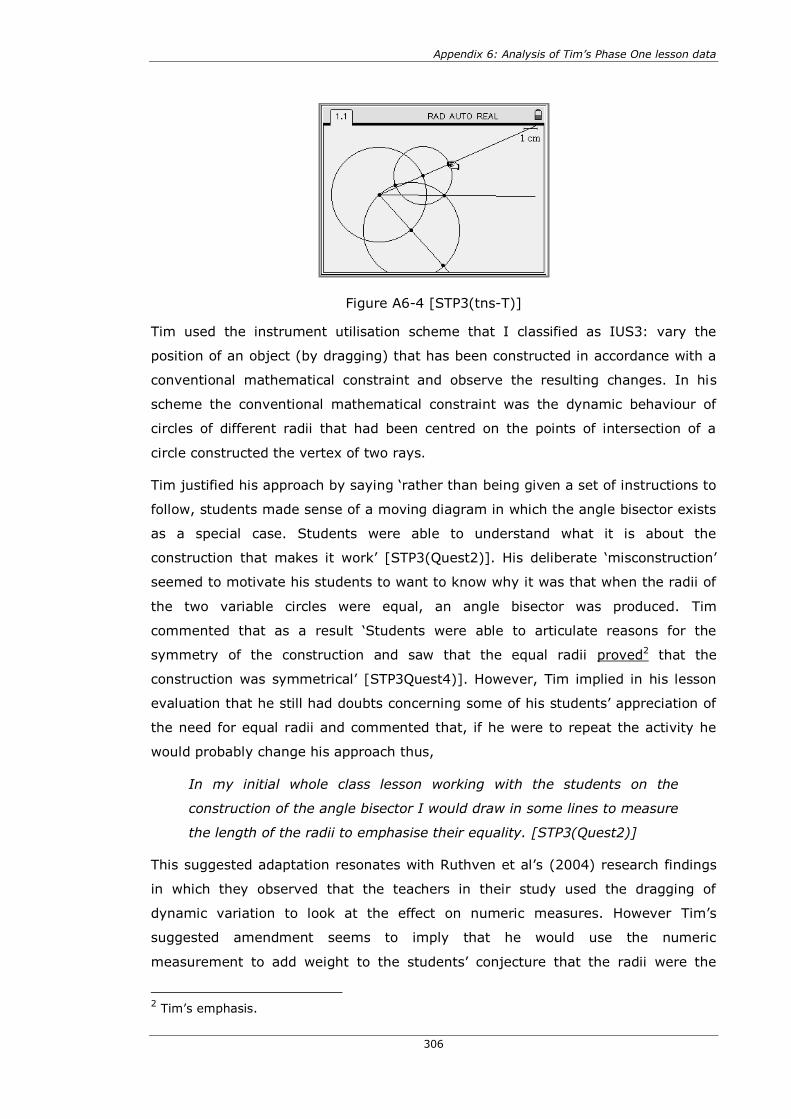
Appendix 6: Analysis of Tim‟s Phase One lesson data
306
Figure A6-4 [STP3(tns-T)]
Tim used the instrument utilisation scheme that I classified as IUS3: vary the
position of an object (by dragging) that has been constructed in accordance with a
conventional mathematical constraint and observe the resulting changes. In his
scheme the conventional mathematical constraint was the dynamic behaviour of
circles of different radii that had been centred on the points of intersection of a
circle constructed the vertex of two rays.
Tim justified his approach by saying ‘rather than being given a set of instructions to
follow, students made sense of a moving diagram in which the angle bisector exists
as a special case. Students were able to understand what it is about the
construction that makes it work’ [STP3(Quest2)]. His deliberate ‘misconstruction’
seemed to motivate his students to want to know why it was that when the radii of
the two variable circles were equal, an angle bisector was produced. Tim
commented that as a result ‘Students were able to articulate reasons for the
symmetry of the construction and saw that the equal radii proved2 that the
construction was symmetrical’ [STP3Quest4)]. However, Tim implied in his lesson
evaluation that he still had doubts concerning some of his students’ appreciation of
the need for equal radii and commented that, if he were to repeat the activity he
would probably change his approach thus,
In my initial whole class lesson working with the students on the
construction of the angle bisector I would draw in some lines to measure
the length of the radii to emphasise their equality. [STP3(Quest2)]
This suggested adaptation resonates with Ruthven et al’s (2004) research findings
in which they observed that the teachers in their study used the dragging of
dynamic variation to look at the effect on numeric measures. However Tim’s
suggested amendment seems to imply that he would use the numeric
measurement to add weight to the students’ conjecture that the radii were the
2 Tim’s emphasis.

Appendix 6: Analysis of Tim‟s Phase One lesson data
307
same, rather than as the initial purpose for the process of dragging.
Tim reported that, for some students, their experiences with the technology in the
angle bisectors activity bore a similarity to the fraction addition activity in that the
representational form within the technological environment impacted upon their
paper and pencil methods. He made the comment that ‘Students created accurate
angle bisectors, interestingly, they drew circles not arcs in their books’
[STP3(Quest2)], which resonates with the example of student’s work shown
previously in Figure A6-3. In the two lessons that followed this activity, Tim
reported that he gave his students the opportunity to practice constructing angle
bisectors for themselves using the technology by creating their own angle fan. This
required them to construct nested angle bisectors and hide the construction circles
such that ‘they were able to see if they were constructing correctly by trying to
move the lines dynamically’ [STP3Quest4)]. A successful example of such a
construction is shown in Figure A6-5 and Figure A6-6.
Figure A6-5 [STP3(tns-S)1]
Figure A6-6 [STP3(tns-S)2]
Reflecting on Verillon and Rabardel’s theory of instrumented activity, Tim’s
approach had clearly offered a ‘new condition for organising the action’ concerning
the construction of an angle bisector that resonated with his preferred teaching
approach and that offered his students an opportunity to arrive at their own
justification for the validity of the method. The lessons did highlight somewhat
predictable issues concerning students’ instrumentations and Tim reported that
they experienced difficulties in successfully placing new points onto objects and
successfully locating points of intersection. However, the desire to produce a
successful dynamic fan seemed to offer a genuine motivation to the students to
overcome these issues.
STP4 Circle circumferences
Tim submitted his fourth activity seven months into the project and, yet again it
used a different utilisation scheme, which I have already defined in Section 5.3.1 as

Appendix 6: Analysis of Tim‟s Phase One lesson data
308
IUS3: Vary the position of an object (by dragging) that has been constructed in
accordance with a conventional mathematical constraint and observe the resulting
changes. Use another representational form to add insight to or justify/prove any
invariant properties. This activity was developed for use with a year 9 (set 2) group
working at around National Curriculum level 6.
Tim designed the activity ‘Circle circumferences’ in which his mathematical
objective for the students was ‘to introduce students to the relationship between
the circumference and the diameter of a circle’ [STP4(Quest2)]. In his lesson
evaluation, Tim wrote,
I started with a lesson starter in which I gave students several questions
of the form a÷8=20 (where 8 and 20 were replaced with different
numbers) and asked them to find out the value of a. This led into some
work with the class on inverse operations… and they were able to say
that if a÷b=c then a=c x b. I did this because I was going to use the
Nspires to establish that Circumference ÷ Diameter= π, and wanted
them to be able to make the connection that Circumference=Diameter x
π. [STP4(Quest2)].
In the subsequent activity, which was mediated by the technology, Tim led the
students through the construction of a circle and its diameter and how to measure
the resulting circumference and diameter. He instructed his students to draw a
table in their exercise books with three columns labelled ‘circumference’, ‘diameter’
and ‘circumference ‚ diameter’. They were then shown how to drag the circle to
vary the dimensions and each set of instantaneous results was recorded in the table
in their exercise books. The students were then asked to move to the calculator
application on the next page to divide the circumference by the diameter and also
to record this result in the table (see Figure A6-7 and Figure A6-8).
Figure A6-7 [STP4(tns-T)page1]
Figure A6-8 [STP4(tns-T)page2]
Tim concluded that,

Appendix 6: Analysis of Tim‟s Phase One lesson data
309
In many ways this activity was quite „controlled‟ by me to lead to the
conclusion that I wanted them to achieve… however, the students felt in
control because they could vary the size of the circle as they wanted –
rather than me giving them a specific size of circle to use.
[STP4(Quest2)]
This indicated Tim’s awareness of the need to focus his students’ attentions towards
the specific invariant property c ÷ d = π. At the final project conference, Tim
selected this lesson as his most successful of the first phase, citing the reason,
‘there was a definite ‘aha’ moment for the students when they realised that c/d
always equalled 3.14159...’ [STPQuest5)]. He also commented that ‘constructing
the circle itself gave students a ‘sense of’ how the construction was likely to behave
when dragged’ [STPQuest6)].
In Tim’s evaluation he also suggested an alternative instrument utilisation scheme
for this activity, ‘If time allowed (and it is time consuming working with students to
construct circle diameters) I would have linked the c and d variables to a
spreadsheet and used an automatic data capture.’ [STP(Quest2)]. That Tim was
open to consider alternate utilisation schemes to approach the same mathematical
content was an indication of his ability to consider the merits of different
instrumentation approaches.
STP6 Enlargements
Nine months into the first phase Tim submitted his final activity, which he had
developed for use with his year 8 group (set 2 of 7) who were working at National
Curriculum level 6. The activity ‘Enlargements’ was designed in two parts and it
spanned two fifty-five minute lessons. Tim only reported briefly on the outcomes of
the first lesson, saying,
Use handhelds to enlarge shapes – students „play around‟ with moving
the centre of enlargement to see what happens to the image.
Discussion about how the centre affects the position of the image.
[STP5(Quest2)]
During the second lesson, the students worked from a file that Tim had created and
transferred to the handhelds before the lesson (see Figure A6-9 to Figure A6-11).

Appendix 6: Analysis of Tim‟s Phase One lesson data
310
Figure A6-9 [STP5(tns-T)page1]
Figure A6-10 [STP5(tns-T)page2]
Figure A6-11 [STP5(tns-T)page3]
In this activity, there were many opportunities for variation. These included the
position and appearance of the original shape, as determined by its coordinates in
the second (spreadsheet) page of the file (Figure A6-10). Similarly the position of
the image shape was determined by the values input for the ‘Centre of
enlargement’ on the third page (Figure A6-11). The relative sizes of the image and
enlargement were determined by numerically editing the scale factor on page 1
(Figure A6-11). Finally the three line segments on the first page acted as switches,
enabling the user to switch on and off the appearance of the object, the image and
the centre of enlargement. These switches had the effect of slowing down the
activity in a similar way to Tim’s previous use of a slider in the Fractions activity
[STP2]. In addition these switches provided an opportunity for Tim to focus the
students’ minds towards particular aspects of variance and invariance by literally
switching on and off their attentions. So it would be possible to pose questions such
as ‘how does changing the centre of enlargement affect the relative sizes of the
shapes?’. Despite the complexities involved with this activity, it fitted the
instrument utilisation classification IUS4: Vary a numeric input and drag an object
within a related mathematical environment and observe the resulting visual output.
In his lesson evaluation, Tim concluded,
At the end of the first lesson, students were able to describe quite

Appendix 6: Analysis of Tim‟s Phase One lesson data
311
accurately where the centre of enlargement would be. I found it helpful
to have both the approaches of (a) an enlargement that students
created themselves and (b) a prepared file where a slider controlled the
enlargement as this gave students the opportunity to see the
enlargement in small increments and help them create a mental picture
of the process of enlargement and its relationship to the centre of
enlargement. I was pleasantly surprised at how comfortable the
students were at creating a shape and enlarging it. [STP4(Quest2)]
This activity presented Tim with many choices with respect to how he mediated the
students’ activities. There was a sense of ‘constrained freedom’ in that there were
many opportunities for exploration within an area of mathematics that is difficult to
teach without the use of technology. The inclusion of the multiple representations
of the object and centre of enlargement as coordinate values also added another
dimension to the exploration.

Appendix 7: Analysis of Eleanor‟s Phase One lesson data
312
APPENDIX 7: ANALYSIS OF ELEANOR’S PHASE ONE LESSON DATA
CEL1 Quadrilateral angles
Eleanor planned her first activity carefully ‘Quadrilateral angles’ [CEL1] and she
used her school’s standard lesson planning template in addition to the production of
a set of Smart Notebook pages, which she used with the students to introduce the
activity.
Lesson plan [CEL1(LessPlan)]:
LESSON PLAN
CLASS 8JHu TOPIC Shape and space: angles
DATE 25.07.09 LESSON 2 DAY Tuesday
Learning Objectives
To name types of angles and explore angles in quadrilaterals
Vocabulary
Angles, acute, obtuse, right angles, quadrilaterals
Starter First slide: In pairs write as many words related to angles and shapes on mini-
whiteboards. Use diagrams if need be.
Resources
Slide 1
Introduction
Pull out ideas from class relating to acute, obtuse, and right angles. Use of
conventions to label and measure angles.
Slide 2/3
Main Activity
Use handheld to carry out a small activity of measuring angles on prepared
quadrilaterals.
Need to pass around the file from 1 handheld to another.
Need to demo the use of the handheld to measure angles. Leave slide 7 up for
instructions.
NEW SKILL: LOADS OF RUNNING AROUND EXPECTED!
Slide 4-9
Differentiation
SEN Pupils
Plenary
Review learning objectives have been achieved and share pupil successes.
What have I learnt today? What skills have I learnt today? GAR
Homework
Assessment
Individual and whole class questions and answers and work produced.

Appendix 7: Analysis of Eleanor‟s Phase One lesson data
313
CLASS 8JHu TOPIC Shape and space: angles
DATE 27.07.09 LESSON 2 DAY Thursday
Learning Objectives
To name types of angles and explore angles in quadrilaterals
Vocabulary
Angles, acute, obtuse, right angles, quadrilaterals
Starter
Journal logs from last lesson
Resources
Slide 2
Introduction
Recap over any ideas of using the handheld from last lesson.
Slides
Main Activity
Use handheld to carry out a small activity of measuring angles on prepared
quadrilaterals.
Need to demo the use of the handheld to measure angles. Leave slide 7 up for
instructions.
NEW SKILL: LOADS OF RUNNING AROUND EXPECTED!
Last 15 mins need to get feedback from lessons for our report back.
Slides
Form to fill
in and
journals to
complete.
Differentiation
SEN Pupils
Plenary
Review learning objectives have been achieved and share pupil successes.
What have I learnt today? What skills have I learnt today? GAR
Homework
Assessment
Individual and whole class questions and answers and work produced.

Appendix 7: Analysis of Eleanor‟s Phase One lesson data
314
Smart Notebook Lesson Structure [CEL1 (LessStruct)]:
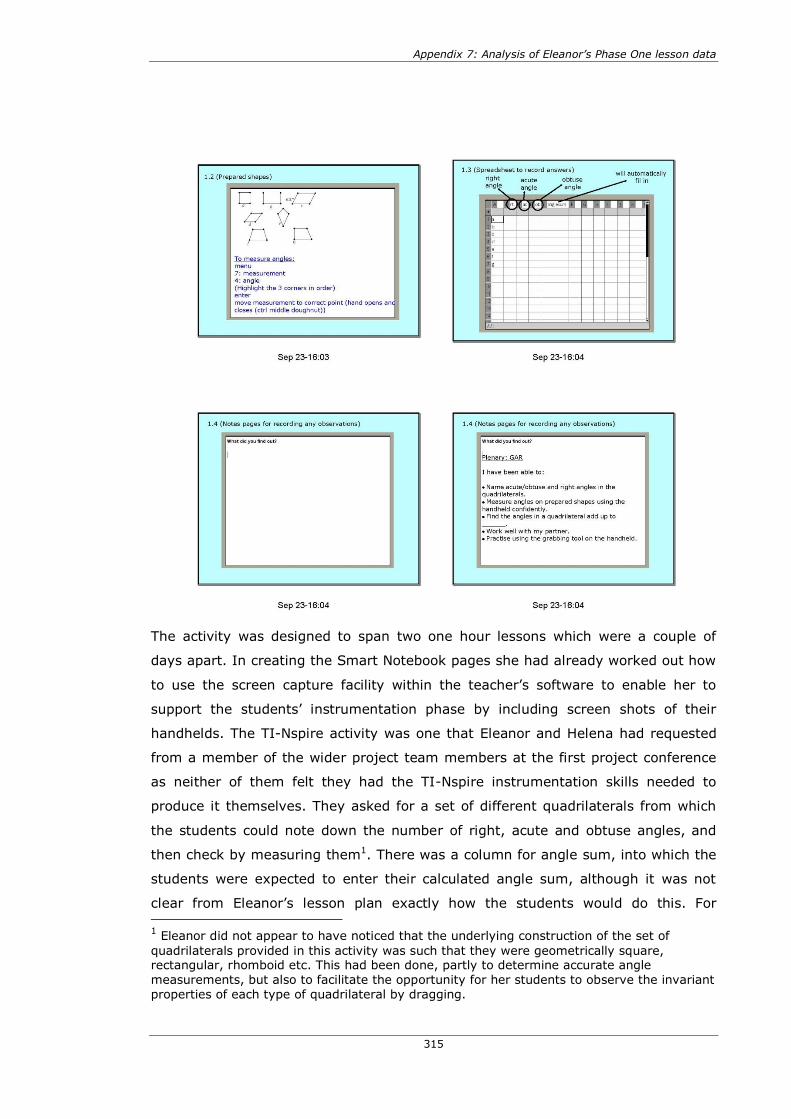
Appendix 7: Analysis of Eleanor‟s Phase One lesson data
315
The activity was designed to span two one hour lessons which were a couple of
days apart. In creating the Smart Notebook pages she had already worked out how
to use the screen capture facility within the teacher’s software to enable her to
support the students’ instrumentation phase by including screen shots of their
handhelds. The TI-Nspire activity was one that Eleanor and Helena had requested
from a member of the wider project team members at the first project conference
as neither of them felt they had the TI-Nspire instrumentation skills needed to
produce it themselves. They asked for a set of different quadrilaterals from which
the students could note down the number of right, acute and obtuse angles, and
then check by measuring them1. There was a column for angle sum, into which the
students were expected to enter their calculated angle sum, although it was not
clear from Eleanor’s lesson plan exactly how the students would do this. For 1 Eleanor did not appear to have noticed that the underlying construction of the set of
quadrilaterals provided in this activity was such that they were geometrically square, rectangular, rhomboid etc. This had been done, partly to determine accurate angle
measurements, but also to facilitate the opportunity for her students to observe the invariant
properties of each type of quadrilateral by dragging.

Appendix 7: Analysis of Eleanor‟s Phase One lesson data
316
example, whether they would be expected to: enter the calculation into the
relevant spreadsheet cell using the = key; insert a calculator page and sum the
four angles; add their four measurements using a paper and pencil method.
However, as Eleanor submitted all of the students’ .tns files as part of her project
data, I was able to ascertain that none of the students progressed beyond
measuring some of the interior for some of the shapes, so any activity or discussion
relating to the resulting angles sums seems unlikely to have occurred during the
lessons.
Eleanor’s lesson plan indicated that her objectives for the first of the two lessons
was to ‘Pull out ideas from class relating to acute, obtuse, and right angles’ and to
focus on the ‘Use of conventions to label and measure angles’ [CEL1(Plan)]. Her
lesson structure indicated that the students should first measure the angles in each
quadrilateral (Figure A7-1) before recording the ‘count’ for each type of angle
(right, acute and obtuse) into the spreadsheet (Figure A7-2).
Figure A7-1 [CEL1(tns-T)page1]
Figure A7-2 [CEL1(tns-T)page2]
Within Eleanor’s lesson structure, she appears to have a misunderstanding about
the inclusion of the spreadsheet column labelled ‘anglesum’ as she indicates to the
students that it would ‘automatically fill in’. As the students were actually entering
the ‘counts’ for each type of angle in each quadrilateral in the three columns
headed ‘rt’, ‘ac’ and ‘ob’ it is not clear how she envisaged that this would work (see
Figure A7-3).
Figure A7-3 [CEL1(Struct)] Eleanor’s supporting instructions for students
In Eleanor’s lesson evaluation, she commented mainly on the students’

Appendix 7: Analysis of Eleanor‟s Phase One lesson data
317
instrumentation issues concerning the selection of points when measuring each of
the angles and the subsequent placing of measured values of the page. She
suggested how she would amend the activity for future use, saying she would ‘Have
bigger pictures drawn - even as one per page would aid students ability to measure
more accurately and not end up moving shapes by mistake’ [CEL1(Quest2)].
CEL2 Triangle angles
Eleanor’s second activity was prepared for the same class of year 8 students three
weeks after the first lesson. It followed a similar instrumentation scheme to the first
lesson except this time the focus was on the angle properties of triangles and the
emphasis was on measuring the interior angles of a given set of shapes (Figure
A7-4) and summing these measurements within a spreadsheet (Figure A7-5).
Figure A7-4 [CEL1(tns-T)page1]
Figure A7-5 [CEL1(tns-T)page2]
Immediately it was obvious that Eleanor had learned from her experiences during
the first lesson as she had adapted the approach and separated the individual
shapes onto different pages. As with her first lesson she produced a detailed lesson
plan [CEL2(Plan)] and accompanying Smart Notebook structure [CEL2(Struct)],
which included the instrumentation steps needed for her students to remind them
how to measure an angle (Figure A7-6).
Figure A7-6 [CEL2(Struct)] Eleanor’s activity instructions for students
An interesting observation of these instructions is the emergence of a classroom
vocabulary concerning the instrumentation of the technology with ‘control middle
doughnut’ being offered by Eleanor as a legitimate phrase concerning the selection
of an object on the screen!

Appendix 7: Analysis of Eleanor‟s Phase One lesson data
318
Both of Eleanor’s first activities were classified as IUS2: From a given set of static
geometric objects, make measurements and tabulate data to explore variance and
invariance within the measured data in numeric and tabular forms. Whilst there was
a progression in both the presentation of the activity and the level of mathematics
with which the students had engaged, there did not appear to be an explicit
emphasis on variance and invariance, although there were opportunities for this
within both activities.
CEL3 Intersecting lines
Eleanor’s third activity was a departure from her previous approaches when, still
working with the same year 8 group of students, she used an activity that required
them to drag objects within a geometric environment for the first time. It was now
five months into the project and Helena and Eleanor had again requested a
‘bespoke’ design that would enable the students to explore the angle properties of
intersecting lines [CEL3]. The resulting activity ‘intersecting lines’ maximised the
functionalities afforded by the MRT in that it would use the measured values of the
angles, rounded to the nearest degree to test a set of conjectures.
Figure A7-7 [CEL3(tns-T)page1]
Figure A7-8 [CEL3(tns-T)page2]
This activity offered the students a single movable point, P that was constrained on
the circumference of the circle (Figure A7-8). The four angles a, b, c and d had
been pre-measured and stored as variables. All of the possible angle sums had
been evaluated and were displayed on the handheld screen. Consequently, as the
point P was dragged, each sum was recalculated.
Eleanor’s written lesson reflection reported that the students had encountered
many difficulties overcoming the instrumentation needed to be able to select and
drag the point P. The technique required by the handheld was to use the doughnut
key to move the cursor near to the point P. When the cursor arrow changed to a
‘grab hand’ the students had one of two instrumentation schemes to select the
point: press the control key followed by the ‘middle doughnut’ to close the hand or

Appendix 7: Analysis of Eleanor‟s Phase One lesson data
319
simply to hold down the ‘middle doughnut’ key for a few seconds. Having grabbed
the point the dragging was effected by holding down the up, down right or left
doughnut keys to move the point in the desired direction.
Eleanor also commented that, ‘the file was running very slow because their (sic)
were too many inter-connecting calculations. We wanted to make it more open-
ended.’ [CEL3Quest3)]. Eleanor worked with another project team member to
redesign the activity, which offered a much more open format (see Figure A7-9 to
Figure A7.13). The angles were no longer saved as variables and the point was no
longer constrained onto the circumference of a circle. Also, the numerous angle
calculations on the screen had been removed, making the screen much less busy.
When justifying these amendments, Eleanor reported, ‘There needed to be a
balance between having enough data evident for pupils to feel a sense of ownership
of the activity through having a choice about what to look at and making it too
overwhelming.’ [CEL3(Quest2)]. These amendments gave an indication of her
preferred approach to the topic for this particular group. It also indicated that
Eleanor was shifting her instrumentation scheme towards IUS3: Vary the position of
an object (by dragging) that has been constructed in accordance with a
conventional mathematical constraint and observe the resulting changes.
Figure A7-9 [CEL3(tns-T)v2page1]
Figure A7-10 [CEL3(tns-T)v2page2]
Figure A7-11 [CEL3(tns-T)v2page3]
Figure A7-12 [CEL3(tns-T)v2page4]

Appendix 7: Analysis of Eleanor‟s Phase One lesson data
320
Figure A7.13 [CEL3(tns-T)v2page5]
CEL4 All angles recap
About a week after this lesson, Eleanor planned an activity for which she prepared
the TI-Nspire file on her own for the first time. This was significant in Eleanor’s
development as she indicated that she now felt that she had sufficient
understanding of the functionality of the Geometry application to confidently create
her own activity from a new blank file. The resulting activity, which she called ‘All
angles recap’ was designed to give this same year 8 class an opportunity to bring
together their understanding of a number of the angle properties that they had
been learning over the previous few weeks [CEL4]. There were four pages to the
file and each page had been split with a dynamic geometric construction on the left
hand side and a Notes page on the right hand side (see Figure A7-14 to Figure
A7-17).
Figure A7-14 [CEL4(tns-T)page1]
Figure A7-15 [CEL4(tns-T)page2]

Appendix 7: Analysis of Eleanor‟s Phase One lesson data
321
Figure A7-16 [CEL4(tns-T)page3]
Figure A7-17[CEL4(tns-T)page4]
What was evident from this activity was that Eleanor now saw dragging as the main
student activity and, by inviting the students to write their own comments on the
notes pages, she was encouraging the students to share their responses. Each page
offered a different geometric environment and required the students to explore
each situation moving points and reporting their observations and conjectures.
Eleanor had also pre-measured the angles, which she had initially dragged such
that there were ‘nice numbers’ on display. Eleanor reported all of the students’ .tns
files to the project, and the students’ screens shown in Figure A7-18 and Figure
A7-19 were selected by Eleanor as evidence of her perception of a successful
outcome for these students in the activities. In these files, there was evidence that
the student had engaged in dragging and had been prepared to note her
observations. In response to the activity on the first page (Figure A7-18) the
student uses the expression ‘…even when you do something like…’ [CEL4(tns-
S4)page1], which offers an insight into the student’s thinking in that she was
beginning to generalise her findings.
Figure A7-18 [CEL4(tns-S4)page1]
Figure A7-19 [CEL4(tns-S4)page2]
However, a contrasting response from another student evidenced the fact that not
all of the students did drag any of the points or lines, however still recorded their
observations which could be interpreted as correct. In Figure A7-21, it may well be
that the ‘nice numbers’ that Eleanor presented within the activity acted to distract

Appendix 7: Analysis of Eleanor‟s Phase One lesson data
322
the students if they had ‘spotted’ the connection with 180° and therefore saw no
need to drag anything on the diagram.
Figure A7-20 [CEL4(tns-S2)page4]
Figure A7-21[CEL4(tns-S2)page4]
contd.
During the first phase Eleanor was invited by the SSAT to contribute an article to
their monthly ‘Maths and Computing Update’ that was sent to all specialist schools.
In her article she wrote about this lesson, and noted that ‘my bottom set [of
students] were beginning to use generalisations!’ [CEL4(Journ-T)].
CEL5 Perpendicular functions
The final activity that Eleanor reported to the first phase of the project was an
obvious development from her previous approaches. She had already commented
informally that she had felt mathematically constrained by her decision to focus her
project activity on her lower ability year eight group. The project meetings had led
to a number of activities within other areas of the curriculum being shared and
discussed by the teachers and Eleanor took up an idea for an activity that Sophie
had shared at the third project meeting in January 2008. (Sophie’s activity,
‘Perpendicular lines’ [PSH4] was described in detail in Section 5.3.1 on page 118).
However, Eleanor ‘misremembered’ Sophie’s instrumentation of the activity and as
a result, devised a very similar activity, which also contained some subtle
differences. In Sophie’s activity, all of the lines were generated by defining linear
functions. When Eleanor came to recreate the activity, although she generated the
initial line by means of a linear function, Eleanor then asked her students to add a
geometric line to the figure that they judged to be perpendicular to the function
according to their ‘eye’. Eleanor described how the activity progressed by, as
Sophie had done, measuring the angle between the two lines and dragging the
geometric line such that the measured angle was approximately 90°. An example of
this is shown in Figure A7-22.

Appendix 7: Analysis of Eleanor‟s Phase One lesson data
323
Figure A7-22 [CEL5(tns-T)]
Eleanor was using this activity with an older, more mathematically able class, a
Year 10 set who were working towards the higher tier GCSE examination and she
judged their current attainment to be at about National Curriculum level 7. She had
identified the lesson goals saying, ‘I wanted to enable them to find their own
relationships between gradients of linear graphs, parallel lines and ultimately
perpendicular lines’ [CEL5(Quest2)].
Eleanor then developed the activity by asking the students to generate further
linear functions that were parallel to the original function, using the measured
geometric line as a guide. Eleanor was using the technology to try many examples
quickly so as to provide immediate feedback to the students. Eleanor supported this
by saying,
The time saved in not having to draw out any graphs is the main factor
when using this technology. Trial and improving different functions
enables girls to experiment and by establishing their own rules/findings
they have a better understanding of what the conventions are.
[CEL5(Quest2)]
The students’ work that Eleanor submitted in support of her evaluation of this
lesson showed a diversity of responses. The most apparent observation of their
responses was that the ‘foci’ of their individual explorations were more diverse than
in Eleanor’s previous lessons (see Figure A7-23 to Figure A7-27). This may be
because she felt that this more able group would be more capable of independent
exploration. However her evaluation did suggest that the majority of the students’
difficulties still related to aspects of the instrumentation.

Appendix 7: Analysis of Eleanor‟s Phase One lesson data
324
Figure A7-23 [CEL5(tns-S1)]
Figure A7-24 [CEL5(tns-S2)]
Figure A7-25 [CEL5(tns-S5)]
Figure A7-26 [CEL5(tns-S6)]
Figure A7-27 [CEL5(tns-S7)]
Eleanor made some overall comments in response in which included:
the students seemed ‘au fais (sic) with many graphs on one page’;
there were lots of ‘comments and mistakes and not quite rights’;
the students had been ‘looking at parallel as well as perpendicular’
[CEL5(Quest2)].
The instrument utilisation scheme that Eleanor developed for this activity was
unique within the first phase of the project. I classified it as IUS7: Construct a
graphical and geometric scenario and then vary the position of geometric objects by

Appendix 7: Analysis of Eleanor‟s Phase One lesson data
325
dragging to satisfy a specified mathematical condition. Input functions syntactically
to observe invariant properties.
When Eleanor spoke of this lesson, she expressed surprise by the number of
parallel linear functions the students seemed to need to input in order to be
convinced that the gradient properties they had focussed upon held up to their
scrutiny (see Figure A7-28 and Figure A7-29).
Figure A7-28 [CEL5(tns-S3)]
Figure A7-29 [CEL5(tns-S4)]
By generating many perpendicular functions, Eleanor said that she felt that some
students had reached a deeper understanding of the generalisation in that by
seeing that all lines parallel to y = mx+c would have a gradient of -1/m. In this
respect Eleanor’s accidental amendments to Sophie’s original instrumentation
scheme had led Eleanor to an unanticipated and surprising lesson outcome.
In her overall evaluations Eleanor made several comments relating to how she
would amend her instrument utilisation scheme if she were to develop this activity
further, which were:
To introduce a spreadsheet page to establish that the product of
perpendicular gradients is -1;
Use of slope measurement;
Ensuring all hand-held are in degree mode and all with a float of 3.
[CEL5(Quest2)]
This indicates that she felt it important to bring in another representation in which
the students could collate results and check their conjectures. Her appreciation that
the slopes of the functions could be measured, saved as variables and hence
‘captured’ would offer an additional environment for the students’ explorations.
Eleanor also considered how she would refine aspects of the her original teaching
and learning approach by stating that her revised intentions would be: ‘to reinforce
looking for connections between perpendicular gradients as written for the value of

Appendix 7: Analysis of Eleanor‟s Phase One lesson data
326
m; to encourage more formal methods of recording results’ [CEL5(Quest2)]. This
lesson indicated an acceleration point in Eleanor’s development and it appeared
that she had now taken personal ownership of the technology. She had overcome
her initial instrumentation difficulties and was now embarking on activity designs
that fitted with her personal view of what constituted valid mathematical activity for
her students in accordance with their ages and abilities.

Appendix 8: Summary of Tim‟s Phase Two data
327
APPENDIX 8: SUMMARY OF TIM’S PHASE TWO DATA
STP6 Pythagoras theorem
Data Description
[Journ] Lesson observation notes.
[STP6(tns-T)] Tim’s tns file.
[STP6(Quest2)] Tim’s written lesson evaluation.
[STP6(Trans)] Lesson transcript.
[STP6(Eval-S)] Students’ written evaluations.
[STP6(ScreenCapt-Activity1)] Digital screen capture of displayed handheld
screens.
[STP6(Video-Activity1)] Video sequence of Tim’s introduction to activity
1.
[STP6(Video-Activity2)] Video sequence of Tim’s introduction to activity
2.
[STP6(Journ-T)] Tim’s written lesson reflection.
[STP6(tns-S)] Full set of students’ tns files
[STP6(tns-Tv2)] Tim’s tns file (revised after the lesson).
STP7 Circles and lines
Data Description
[Journ] Email exchange with Tim prior to lesson.
Lesson observation notes (lessons 1 and 2).
[STP7(Trans)L1] Transcript of lesson 1.
[STP7(Image1)L1] Image of Tim’s computer screen capture of the
quick poll responses (lesson 1).
[STP7(Video)L1] Video of Tim’s introduction to the main activity
(lesson 1).
[STP7(tns-S)L1] Folder of students’ .tns files captured at the
end of lesson 1.
[STP7(Image1a)L1] Image of Tim’s handwritten whiteboard work –
√25 and √-25.
[STP7(Image1b)L1] Image of Tim’s handwritten whiteboard work –
substituting into x2 + y2 = 25.

Appendix 8: Summary of Tim‟s Phase Two data
328
Data Description
[STP7(Int-T)L1] Transcript of post-lesson interview with Tim,
which included the planning discussion for
Lesson 2.
[STP7(Trans)L2] Complete transcript of lesson 2.
[STP7(tns-S)L2a] Folder of students’ .tns files captured 25
minutes into the 55 minute lesson.
[STP7(tns-S)L2b] Folder of students’ .tns files captured at the
end of the lesson.
[STP7(Image1)L2] Image of Tim’s handwritten whiteboard work –
„proving the points of intersection‟
[STP7(Journ-T)] Tim’s written lesson reflection.
STP8 Quadratic curves
Data Description
[Journ] Email exchange with Tim prior to lesson.
Lesson observation notes.
[STP8(Int-T)] Pre-lesson discussion with Tim.
[STP8(Trans)] Transcript of lesson.
[STP8(tns-S)1] Folder of students’ .tns files captured 55
minutes into the 55 minute lesson.
[STP8(tns-S)2] Folder of students’ .tns files captured at the
end of the lesson.
STP9 Equivalent quadratics
Data Description
[Journ] Email exchange with Tim prior to lesson.
Lesson observation notes (all lessons).
[STP9(Int)L1] Pre-lesson discussion
Post lesson discussion
[STP9(tns-T)L1] Tim’s tns file.
[STP9(Activity)L1] Students’ activity sheet
[STP9(Trans)L1] Transcript of lesson 1.
[STP9(Video)L1] Video of Tim’s whole class plenary discussions.
[STP9(StudWork)L1] Paper copies of students’ written work
[STP9(Trans)L2] Transcript of lesson 2.

Appendix 8: Summary of Tim‟s Phase Two data
329
Data Description
[STP9(Activity)L2] Students’ activity sheet
[STP9(StudWork)L2] Paper copies of students’ written work
[STP9(Int)L3] Pre-lesson discussion
Post lesson discussion
[STP9(tns-T)L3] Tim’s tns file.
[STP9(Activity)L3] Students’ activity sheet
[STP9(Trans)L3] Transcript of lesson 3.
[STP9(Video)L3] Video of Tim’s whole class plenary discussions.
[STP9(tns-S)L3] Set of class files brackets1.tns – collected
midway during lesson 3
[STP9(tns-S)L3a] Set of class files brackets2.tns – collected at
end of lesson 3
[STP9(StudWork)L3] Paper copies of students’ written work
STP10 Linear graphs
Data Description
[STP10(Int-T)] Pre-and post-lesson discussions with Tim
[STP10(Trans)] Transcript of lesson
[Journ] Lesson observation notes.
[STP10(Video)] Video of Tim’s final whole class teaching
episode.
[STP10(tns-T)1] Tim’s .tns file to introduce activity 1.
[STP10(tns-T)1a]
Tim’s .tns file displayed to students at the end
activity 1.
[STP10(tns-T)2] Tim’s .tns file to introduce activity 2.

Appendix 9: Detailed descriptions and analyses of Tim‟s Phase Two activities
330
APPENDIX 9: DETAILED DESCRIPTIONS AND ANALYSES OF TIM’S PHASE
TWO ACTIVITIES
STP6 Pythagoras exploration
The detailed description of this lesson is provided within the main thesis (Section
6.2.2.1).
Instrument utilisation scheme: The IUS developed by Tim is shown in Figure A9-1.
The three tasks which comprised the activity were each mediated by a geometric
representation and the students were required to drag points and observe the
resulting syntactic and numeric (measured and calculated) representations. This
IUS seems consistent with IUS3, as previously defined in Section 5.3.1.
Figure A9-1 IUS [STP6] Pythagoras exploration
The students’ main interaction with the MRT was by dragging and following this,
they were required to closely observe the resulting changes in the geometric
orientation of the diagram, its geometric properties and the changes in the
measured and calculated values. All of these are considered to be dynamic objects.
Consequently, whilst engaging with the second (and main) task, the students’
attentions were being drawn to four different dynamic objects within the
representation.
Hiccups identified from the lesson data: There were five broad classifications of
hiccups identified from the lesson data as shown in Figure A9-2.

Appendix 9: Detailed descriptions and analyses of Tim‟s Phase Two activities
331
Figure A9-2 [STP6] Activity hiccups
These categories were more fully described as:
Instrumentation issues experienced by the students, which concerned grabbing and
dragging on-screen objects and dealing with displayed measured values that
‘disappeared’ from the screen as other objects were dragged.
Difficulties concerning the whole class discourse as a result of a lack of clarity in the
naming and referencing of the multiple dynamic objects under discussion.
Unexpected student responses as a result of their different interpretations of the
instructions that Tim provided for the second activity. These included: vertices
being dragged so that the squares were displayed on the ‘interior’ of the triangle’s
sides; reproducing the first activity (all areas equal) and producing the ‘correct’
right angled triangle but ignoring the calculated values.
Possible evidence of situated learning: Evidence from the various data sources led
to a list of eight actions by Tim that might provide evidence of his situated learning
during this activity. These are shown in Figure A9-3.
Figure A9-3 [STP6] Evidence of teacher’s actions
Tim commented on the nature of the dynamic variation within the activity and in
particular what constituted ‘too much variation’ for the students to be able to draw
purposeful mathematical conclusions [STP6(Trans)]. Tim spoke of the lack of an
‘aha’ moment when the students realised that a right angled triangle was formed as
an outcome of the second activity. He reflected on this point thus:
I think this was to do with the difficulty in getting the areas to „exactly‟
match. I think that this was a problem with the activity – and one
possible improvement would be to construct the activity so that the
vertices of the triangle „snapped‟ to a grid. Another possibility would be

Appendix 9: Detailed descriptions and analyses of Tim‟s Phase Two activities
332
to create a message that appeared when a+b was quite close to c, if not
„equal‟ to c. [Journ]
The occurrence of Hiccup2 provided evidence for Tim’s heightened awareness of his
students’ thinking. In this example, a pair of students had continued to work on the
first activity (to produce three squares with equal areas), but within the
environment for Activity 2, producing the following screen. Tim selected this screen
during a period of whole class discourse when discussing Activity 2 (Figure A9-4).
Figure A9-4 [STP6(tns-s19)] Student’s response
TP: Let‟s look at the ones that don‟t work - let‟s go back to the bottom
ones that don‟t work, like that one for example, now that one is clearly
not a right angled triangle is it?
Student: It‟s equilateral
TP: It‟s just about an equilateral triangle and we‟ve got a add b is about
twenty one, a is ten, b is ten, so that‟s about twenty one isn‟t it? Ah! But
the c is eleven point five, so they‟re all about the same area aren‟t they
- a is about ten, b is about ten and c is about eleven, twelve.
In Tim’s personal notes that he made after the lesson, he commented about his
students’ responses to Activity 1 (to form squares of equal areas) saying,
One student overlaid all three squares to accomplish this. This was an
„interesting‟ way of solving the problem and I was able to comment on
this. A couple of other students formed an equilateral triangle.
[STP6(Journ-T)]
This seemed to indicate that Tim had appreciated that these students had not
actually progressed to the second activity, and found an opportunity to value effort,
even though it was not seen as a successful outcome for the lesson. One of the
other students in the class commented in his evaluation of the lesson about this
particular screen, saying that ‘I learned that to get 3 squares equal size you have to

Appendix 9: Detailed descriptions and analyses of Tim‟s Phase Two activities
333
have an equilateral triangle in the middle’ STP6(Eval-s22).
Alongside this, Tim seemed to have recognised the diversity of the students’
abilities to articulate the generalisation on which the second (and main) activity had
focussed.
An understanding of the issues within the original activity design that had
led students to misunderstand the activity objectives.
A greater understanding of the possible student progression from the
dynamic exploration to more traditional paper and pencil strategies when
solving Pythagoras problems.
The difficulties experienced by himself and the students when trying to
clearly identify the mathematical objects under discussion. Tim’s redesign of
the activity showed an awareness of the need to label and colour code
particular objects more obviously.
His developing thinking about the role that the shared class view of the
handheld screens might have within the design of mathematical activities.
For example, Tim commented:
Students are naturally interested in their own screen when all screens
are displayed. In working with all screens in a „shared space‟, I am
more interested in the „whole‟... the „big picture‟. I think this can affect
the motivation and interest of individual students. If I happen to be
commending certain screens, those students feel pleased. If I am
moving screens to the bottom because they have not managed to make
(in this instance) a+b=c, then those children can become less engaged.
These issues are worth considering in future activity design, i.e. How
can students be kept interested in the „whole picture‟ when their
individual screen is only a small part of that „whole picture‟?
[STP6(Quest2)]
In addition, Tim suggested developments to the classroom display technology that
would support the grouping and sorting of the students’ handheld screens. In
overall conclusion, Tim said that he liked the 'empirical sense of generality' that this
activity approach had afforded.

Appendix 9: Detailed descriptions and analyses of Tim‟s Phase Two activities
334
STP7 Circles and lines
A series of tasks offered over a sequence of two lessons to a year 11 (set 1) group
of twenty nine students working towards the GCSE higher tier examination. The two
lessons were conducted on the same day.
Tim reported that, in the preceding lesson he and the class had,
explored the equation of a circle by drawing circles centred on the origin
and then getting the Nspire to find the equation of the circle.... Students
were generally happy by the end of the lesson that x^2+y^2 = r^2,
where r is the radius of the circle. They didn't have a lesson today
(another exam)... but I was thinking that I would like to look at finding
points of intersection between a straight line and a circle. Am struggling
at the moment to find a way to use the Nspire for this other than to
'check' answers using the co-ordinate tool... any ideas? [Journ].
I responded with the following ‘ideas’.
What is the 'big picture' here? Ultimately I expect it is to solve GCSE
exam style questions.. but en route is it to?
- appreciate when the line will cross the circle, 0, 1 2 times (I can see
everyone with a common circle and then each student adding a chosen
straight line to this... )
- getting a sense of where the line and circle might cross - i.e. Can they
get it (by dragging the line) to cross in a given quadrant too?
- exploring the algebra to arrive at how you would prove that the line
and circle crossed at a certain place... You could approach this
backwards by giving the students (an) incorrect point(s) of intersection
and proving it doesn't by substitution...
- leading into finding algebraically where the line crosses - several
approaches here - do you lead the class through one or allow some to
come up with this for themselves (with some clues)
- offering an extension activity of 'finding formulae' for x and y in terms
of m and c where y = mx+c crosses y^2+x^2=r^2
- identifying the 'conditions' for the circle and line to intersect 0, 1 and 2
times (extension) [Journ]

Appendix 9: Detailed descriptions and analyses of Tim‟s Phase Two activities
335
Lesson one: In the first of the observed lessons Tim began by posing two questions
‘what’s the square root of twenty-five?’ and ‘what’s the square root of minus
twenty-five?’. The questions promoted much discussion between students and Tim
conducted a poll to ascertain the students’ responses, the results of which are
shown in Figure A9-5. Tim did not resolve the students’ conflicting ideas, but told
them that they would come back to this problem later in the lesson.
Figure A9-5 [STP7] Students’ responses to ‘What is √(-25)?’
Following this initial activity, Tim opened a blank page within the Graph and
Geometry application and constructed a geometric circle with its centre positioned
at the origin and its circumference at the coordinate (0, 5). He then ‘measured’ its
equation (displayed by the MRT as x2+y2=52) and sent the resulting file to the
students’ handhelds (Figure A9-6).
Figure A9-6 [STP7(tns-T)]
Tim asked the students to draw a geometric line anywhere on the page. He then
displayed their handheld screens publicly in the classroom, revealing a diversity of
responses which included the screens shown in Figure A9-7 to Figure A9-10.

Appendix 9: Detailed descriptions and analyses of Tim‟s Phase Two activities
336
Figure A9-7 [STP7(tns-S1)]
Figure A9-8 [STP7(tns-S2)]
Figure A9-9 [STP7(tns-S3)]
Figure A9-10 [STP7(tns-S4)]
This led to a period of classroom discourse concerning the number of possible
points of intersection between a circle and a straight line. The limitations of the
technology led to some unanticipated screens (for example, Figure A9-8). Tim
included the phrase ‘if the line was to continue’ to encourage the students to
imagine that their lines were continuous when considering the number of points of
intersection in each case.
In the final phase of his whole-class introduction, Tim added a second line (y=4) to
the diagram by typing y=4 as a text object and dragging it to the x-axis. He sent
this file to the students’ handhelds (see Figure A9-11).
Figure A9-11 [STP7(tns-T)]
Tim asked the students to try to work out ‘where it crosses’ and also said ‘I’m

Appendix 9: Detailed descriptions and analyses of Tim‟s Phase Two activities
337
hoping that some algebra takes place at some point’ [STP7(Trans)]. He distributed
the activity sheet (Figure A9-12), which outlined ‘Challenge one’.
Figure A9-12 [STP7(Activity1)]
The students worked in groups of two to four and recorded their work on large A1
paper. They were encouraged to annotate the worksheet and record their written
strategies. Tim concluded the first lesson by working through the substitution of
y=4 into x2+y2=52 on the class whiteboard, which resulted in the class appreciating
that the coordinates of the points of intersection would be (3,4) and (-3,4).
Lesson two: The second lesson was a direct continuation of the first and it took
place later the same day. Tim redistributed the handhelds, the students’ written
work and the first activity sheet containing ‘Challenge one’ [STP7(Activity)1]. The
students were asked to continue working independently in the same groups.
Throughout this phase the students had access to the MRT, although they were not
instructed to use it in any particular way.

Appendix 9: Detailed descriptions and analyses of Tim‟s Phase Two activities
338
Towards the end of the second lesson a group of four students had completed the
first challenge. Tim encouraged them to look at the second activity sheet (Figure
A9-13). As before, the students had access to the technology.
Figure A9-13 [STP7(Activity2)]
Tim continued to move around the classroom, supporting small groups and
individual students, often in response to their questions, but otherwise to ask them
how they were progressing and what they were finding out.
Fifteen minutes before the end of the lesson, Tim stopped the class and led a period
of whole-class discourse at the ordinary whiteboard without using the technology.
He revisited the algebraic solution to x2 + y2 =25 and y=4 and contrasted this with
the algebraic solution to x2 + y2 =25 and y=6, highlighted to the students that they
were ‘not getting an answer, we’re getting a negative square root and that’s
impossible’ [STP6(Trans)]. Tim then asked the students to consider what the value
of y would need to be such that horizontal line would touch the circle at only one
point and supported the students to test their conjecture that the y-value would
equal five.
Interpretation of variance and invariance: Initially, the invariant property was a
‘given’ circle (x2+y2=52) constructed and displayed on the handheld screen. The
addition of a constructed geometric line was the variant property by nature of its
infinite number of positions within the view. The position of the line was then fixed

Appendix 9: Detailed descriptions and analyses of Tim‟s Phase Two activities
339
(at y=4) and the students were asked to identify the resulting invariant properties
that concerned points of intersection using pencil and paper methods .
The position of the line, although still fixed as horizontal, was then allowed to vary
within the paper and pencil activity and a generalisation for this situation was
sought. Tim did not privilege dragging of the defined line y=4, although there is
evidence that some students drew additional horizontal lines using the MRT.
The students used the calculator functionality to calculate square roots of numbers,
which provided the ‘class authority’ with respect to the meaning of the outputs in
relation to the original activity. (See example in Figure A9-14)
Figure A9-14 [STP7(tns-S)]
The overall intention for the activity was for the students to determine the following
invariant properties:
When c>5, x = √(52–c2) was ‘unsolvable’, which meant no points of
intersection within the context of the original activity.
When c=5, x = √(52–c2) produced only one solution, which meant one point
of intersection within the context of the original activity.
When c<5, x = √(52–c2) produced two solutions, which meant two points of
intersection within the context of the original activity.
Tim reported that in the third lesson (which I did not observe) the students ‘were
able to check their algebraic solutions by plotting the lines on the handheld and
finding points of intersection’ [STP6(Journ-T)].
Implied instrument utilisation scheme: The IUS developed for this lesson was
unusual in that, although the starting point was geometric, this was mainly to
support the students’ initial engagement with the activity. There was no dragging
involved. The use of the whole class display had a significant part to play in
mediating the phase of the lesson where the students’ individual responses were
quickly and efficiently compared and discussed. Tim’s addition of the line y=3 to

Appendix 9: Detailed descriptions and analyses of Tim‟s Phase Two activities
340
the original diagram was sent to the students handhelds. However, as they were
not instructed to interact with this file in any way, most students used paper and
pencil methods to work on the activities. There was one pair of students who were
the exception to this and they did choose to use the MRT as part of their response.
The IUS suggested by Tim’s activity design is shown diagrammatically in Figure
A9-15.
Figure A9-15 IUS [STP7] Circles and lines
Hiccups identified from the lesson data: There were seven hiccups identified from
the lesson data, which were individually coded into the categories shown in Figure
A9-16.
Figure A9-16 [STP7] Activity hiccups
These categories can be more fully described as:
Instrumentation issues experienced by the teacher, which concerned
unanticipated responses from some students’ constructions of a line that
would be expected to intersect the circle twice, but only appeared to
intersect once (see Figure A9-8).
Highlighting students’ disbeliefs concerning: the robustness of the generality
that they were beginning to articulate; the technology’s response to √(-11);

Appendix 9: Detailed descriptions and analyses of Tim‟s Phase Two activities
341
and whether it was possible for the line to touch the circle only once.
Unexpected students’ responses arising from the students own
instrumentalisation within the activity, suggesting that they had not
appreciated the need to use the algebra to prove the points of intersection.
Possible evidence of situated learning: Evidence from the various data sources led
to a list of five actions by Tim that might provide evidence of his situated learning
during this activity. These are shown in Figure A9-17.
Figure A9-17 [STP7] Evidence of teacher’s actions
Tim’s choice of questions within [STP7(Activity)2] indicated his sense of progression
with respect to developing the students’ knowledge and confidence to solve more
complex activities relating to the intersection of circles and lines.
The analysis of the lesson transcript evidenced a number of conversations that Tim
had held with students, which indicated a wide range of possible learning sites for
him in relation to:
The students own instrumentalisation of the activity. (Cameron
geometrically constructed a perpendicular line through the point of
intersection and read off where it crossed the x-axis). Tim mentioned ‘…and
with Cameron, and it will be on its work, he did something I think to do with
intersections and coordinates, so that's quite interesting’ [STP7(Int)] (see
Figure A7-17).
Figure A9-18 [STP7(tns-S)] Cameron’s response to the activity
The students’ abilities to appreciate the position of the specific topic of the
lesson within a larger mathematical landscape. This was in relation to a

Appendix 9: Detailed descriptions and analyses of Tim‟s Phase Two activities
342
recognition of the more general topic (‘Is this simultaneous equations, sir?’
[STP7(trans)]) and with respect to the limitations of the generality being
pursued within the lesson (i.e. non-horizontal lines and tangents).
My post-lesson discussion with Tim revealed that he was pleasantly
surprised by the students’ responses to the initial activity.
and I though with a circle of radius five, it's not.. it' so big that no-one
would come up with one that didn't intersect the circle I thought, it's not
going to happen. And there they were... there were these three that
didn't intersect the circle... and that was quite lovely.. and even the
tangent... just about...and I wasn't expecting that.. I though they'll all
go through twice and I'll have to tweak this now because my circle is too
big... but no, it was quite nice that. But there‟s no way of knowing how
that would have gone. Yes that was lovely actually, that was really nice.
[STP7(Int)]
Reviewing Tim’s overall approach for this activity it seemed that he had developed
the following mathematical progression:
Explore the ‘big picture’ first, how many times might it be possible for any
line to cross a circle. (Although, by defining the initial circle as x2 + y2 =52,
rather than leaving the circle’s equation ‘undefined’, this imposed a scale on
the ‘big picture’).
Consider where horizontal lines of the form y = c (integer values of c)
integer values) might cross, using the symmetry of the problem to support
the students to identify two (integer) solutions.
Consider where horizontal lines of the form y = c (decimal values of c)
integer values) might cross, using the symmetry of the problem to support
the students to identify two (decimal) solutions.
Extend the problem to consider intersection of lines of the form y = mx.
Extend the problem to consider intersection of lines of the form y = mx+c.
In my post lesson interview with Tim I commented on this progression and the
following conversation ensued,
ACW: that's a really nice way into that [topic] because taking the
horizontal line is so... Had you seen that anywhere?
TP: No… …and what I'm doing now with going through the y equals line
and then going to a diagonal line, I've not seen that anywhere either - it

Appendix 9: Detailed descriptions and analyses of Tim‟s Phase Two activities
343
goes straight into the hardest case. But actually that is quite nice, and
for some reason I hadn't tweaked that the answer was an integer - it
was a three four five triangle, I should have recognised that but.. erm,
and erm
ACW: Well that's nice too, because you can now take it on to think
about well what if it was a little bit lower?
TP: and I had planned that anyway... well I don't think that will as nice a
number... I need to check that before the lesson [TP laughs].
STP8 Quadratic curves
A series of tasks offered during a single lesson with twenty six middle ability 14-15
year old students working towards the GCSE higher tier examination. In his
communication to me prior to the lesson Tim reported,
They have had a couple of TI-Nav lessons this week. They started with a
graph of y=(x+4)(x-4) and then changed the +4 and -4 to other
numbers in order to get a pattern of evenly spaced overlapping
quadratic curves. They did this quite successfully. Interesting at the
end of the first lesson, I asked the students (using quick poll) where the
graph y=(x+2)(x-6) would cut the x-axis and more students thought
that 7 students thought it would cut at +2 and -6 while only 5 thought it
would cut at -2 and +6 (a number didn't vote or chose another
option). I want to explore the links between the factored and un-
factored quadratic expressions and also explore the solutions of the
equations and consider why they are the 'opposite' signs to that
expected. [Journ]
The students were sent a file in which it was intended that they would enter two
values into a spreadsheet that represented ‘a’ and ‘b’ within a quadratic of the form
y = (x-a)(x-b) (see Figure A9-19). They would then be asked to drag a related
point on a Cartesian plane (see Figure A9-20) and make conjectures about the
nature of the point’s locus (which traced the path of the related quadratic function).
The students were then expected to predict the factorised form of the quadratic
function and, by entering this as a function ‘match’ the locus of the moving point
(Figure A9-21).

Appendix 9: Detailed descriptions and analyses of Tim‟s Phase Two activities
344
Figure A9-19 [STP8(tns-T)] Spreadsheet
page
Figure A9-20 [STP8(tns-T)] Graphing
page
Figure A9-21 [STP8(tns-T)] Graphing
page with an incorrect ‘function match’
displayed
Figure A9-22 [STP8(tns-T)] Graphing
page with the correct ‘function match’
displayed
However a technological issue occurred when the file was transferred, which
resulted in the movable point losing its connection with the underlying quadratic
curve on which it had been constructed. Consequently, having introduced the initial
activity from the front of the class, Tim had to quickly amend the activity.
The students used the same TI-Nspire file but Tim then showed them how to
unhide the quadratic graph. Therefore, the focus of the amended activity became
one of conjecturing the quadratic function (in its factorised form) that would match
the quadratic graph that had been generated by the spreadsheet values. The
students then checked this by observing whether the graphs coincided. The earlier
disruption to the lesson meant that the students had only a few minutes to work on
the amended activity.
Interpretation of variance and invariance: The activity required the students to
‘notice’ the effects on the appearance of both the position of two points on the x-
axis (marked with crosses) and the locus of a draggable point as they varied the
two numeric values within the spreadsheet. Tim was hoping that the students

Appendix 9: Detailed descriptions and analyses of Tim‟s Phase Two activities
345
would notice the invariant property that, when the two functions coincided, the
numeric values within the spreadsheet carried the opposite signs to the values of a
and b within the entered functions.
Implied instrument utilisation scheme: In Tim’s intended activity, he was conceiving
an IUS which did not resonate with any seen previously in the study. Indeed, when
Tim first suggested the activity approach, I had noted in my research journal, ‘Neat
idea – plot the function, put a point on it, hide the function... Drag it so that it
moves – Can you work out what the function is by observing the crossing points?’
[Journ].
This was the first time that I had seen a teacher develop a pedagogic approach that
required the students to interact by dragging to try to relate the path of the moving
point to their existing knowledge about the shape of quadratic functions. By
requiring the students to try to conjecture the function and enter it syntactically,
they were being encouraged to notice the geometric form of the graph and connect
them to the syntactic form. In addition, the notion of relative speed would also
become a consideration for students interacting in this way.
Figure A9-23 Intended IUS [STP8] Quadratic graphs
Due to the technical issues experienced, Tim’s adapted activity reverted to the
more familiar IUS1 (Section 5.3.1.), whereby direct numeric and syntactic inputs
were made, and the outcomes compared (Figure A9-24).

Appendix 9: Detailed descriptions and analyses of Tim‟s Phase Two activities
346
Figure A9-24 Revised IUS [STP8] Quadratic graphs
Hiccups identified from the lesson data: Three hiccups were observed in this lesson,
and they fell into three distinct categories as shown in Figure A9-25.
Figure A9-25 [STP8] Activity hiccups
The most obvious (and time consuming) hiccup in this lesson resulted from the
unexpected technical failure when there was a loss of functionality within the
transferred file. Consequently, the students received a new set of activity
instructions and this could partly explain the remaining hiccups, which may be
attributable to their confusions about what they were supposed to be doing.
For example, one pair of students has not realised that the highlighted cells in the
spreadsheet dictated the function that they were attempting to match. Having
successfully matched the function f1(x)=(x-2)(x+4), they entered a second set of
values into the spreadsheet with the expectation that this would produce a second
quadratic graph (Figure A9-26 and Figure A9-27). They successfully entered a
second function to match their new choice of values, however received no feedback
from the MRT in this respect (Figure A9-28).

Appendix 9: Detailed descriptions and analyses of Tim‟s Phase Two activities
347
Figure A9-26 [STP8(tns-S)page2] Spreadsheet values
Figure A9-27 [STP8(tns-S)page1] A
correctly matched function
Figure A9-28 [STP8(tns-S)page2] An
unresolved attempt
Possible evidence of situated learning: Evidence from the various data sources led
to a list of two actions by Tim that might provided evidence of his situated learning
during this activity. These are shown in Figure A9-29.
Figure A9-29 [STP8] Evidence of teacher’s actions
In our pre-lesson discussion, Tim spoke in an animated way about his design of the
intended activity,
TP: Okay, if we set one of these files up so that you've got two points
and you can move them around by changing the values on the
spreadsheet... …If we can put two in there and negative four there and
we can store that as b perhaps and store that one as a... and over here
I could have x minus a and x minus b, is that logical? [TP draws
function]… …So there's our roots, minus two and four and if we hide that
[referring to the curve] and if I hide that and if I've intersection points
between my axes and the equation Da Da!... …So I now want to hide
this don't I? [TP is refers the quadratic graph] Do I want to leave those

Appendix 9: Detailed descriptions and analyses of Tim‟s Phase Two activities
348
points on?
ACW: No leave the points there, that's nice, if you leave the points there
it puts a focus on them.
TP [TP puts a point on the function] We're not interested in its
coordinates, hide those, okay so now hide that [referring to the
quadratic graph itself]
ACW: I think leave the points there - it's a nice focus...
TP: Okay have we got this now? Now we can pick that up, [referring to
the point on the now hidden function] and we can drag it and it goes
'ding' and that's quite nice. [STP8(Int)]
Early on in the lesson, soon after Tim had introduced the amended activity, one
student asked the question ‘why is the sign the opposite?’ causing Tim to hesitate
and then respond with the statement, ‘That’s what we’re trying to find out’
[STP8(Trans)]. It was noticeable that partly due to the earlier disruptions, which
limited the lesson time, Tim did not return to this question, which referring back to
our pre-lesson correspondence, seemed to have been a main objective for his
activity design.
STP9 Equivalent quadratic equations
A series of tasks offered during a sequence of three lessons with a year 10 group
working towards the GCSE foundation tier examination. Between 13 and 16
students were present in each of the lessons and Tim had assessed that they were
currently working at between GCSE Grades D and E. In the preceding lessons the
students had plotted quadratic graphs using paper and pencil methods. Tim had
said that in the observed lessons he wanted to ‘spend the lessons with this group
looking at multiplying out quadratics.... and comparing graphs of non-multiplied out
and multiplied out quadratic expressions. Possibly extend to factorising...’ [Journ].
In our pre-lesson discussion, Tim expressed his concern about the more algorithmic
approaches to teaching the expansion and factorisation of quadratic expressions to
(particularly) less able students
TP: so with this group I've got today, I'm wondering whether I move on
this afternoon to just multiplying out brackets, so they'll be quicker at
doing it properly and to get the process in their heads, [leading to]
„however if I had two x plus three it wouldn't work. So there's an issue
there‟. [STP9(Int)]

Appendix 9: Detailed descriptions and analyses of Tim‟s Phase Two activities
349
Tim had also revealed his normal approach when teaching students to expand and
factorise quadratic expressions thus:
What I do or have done is I'll do up to fifteen 15 minutes on multiplying
out brackets and then I'll say, „okay let's cover this up and work
backwards‟. And after a couple more examples I use a highlighter pen
and say like [writes (x+3)(x+5)=x2+8x+15] five three eight five three.
And then six two twelve, what's going on here? And I do it that way with
several examples and try and force them to recognise the pattern and
then we go backwards from there... [STP9(Int)]
We discussed an alternative teaching approach, which used a grid method of
multiplication and results in an alternative visual representation of the products.
Tim mentioned that he had not used this strategy when teaching expanding
brackets as he felt that his students needed to appreciate the link between
multiplication and calculating areas before they could fully understand the strategy.
Tim felt that, as expanding brackets was a topic within algebra, this could confuse
many of his students.
Lesson 1: In the first lesson, Tim gave the students a set of quadratic expressions1
that he had prepared (see Figure A9-30) and asked the students to try find pairs
that matched by entering selected pairs into the TI-Nspire as functions and
identifying when the graphs coincided.
1 These were described throughout the lesson as ‘expressions with brackets’ and ‘expressions
with squareds’.

Appendix 9: Detailed descriptions and analyses of Tim‟s Phase Two activities
350
Figure A9-30 [STP9(Activity)] Matching quadratic expressions2
Using his own handheld in ‘live presenter’ mode, Tim showed the students how to
enter the first factorised expression, (x+2)(x+5), as a function to produce a
quadratic graph. Tim then sent this version of the TI-Nspire file to the students’
handhelds (see Figure A9-31).
Figure A9-31 [STP9(tns-T)] Graphing f1(x)=(x+2)(x+5)
He then asked a student to choose one of the expanded expressions from the
activity sheet (x2+9x+18 was selected) and entered this as a second function on
2 Tim noticed his accidental omission of a bracket in the fifth expression and asked the
students to write it onto their worksheets.

Appendix 9: Detailed descriptions and analyses of Tim‟s Phase Two activities
351
the handheld, which resulted in a second quadratic graph that differed from the
first. He explained to the students that their activity objective was to enter one of
the expanded expressions such that the two graphs coincided and record this on
the activity sheet. Tim then selected a second expanded expression (x2+7x+10),
showed the students how to clear the previously entered function and replace it
with the new function, which coincided with (x+2)(x+5). He encouraged the
students to notice that the new function briefly appeared as a bold line as it was
drawn.
The students proceeded to work at the activity and Tim moved around the
classroom responding to students’ difficulties and encouraging the students to come
up with their own theory about what was happening. Several students began to
notice a connection between the integer term within the expanded expression and
the two integer terms within the factorised expression. Tim did not enter into
discussions with the students about their theories, but asked the students to record
them on their work. The lesson ended abruptly with Tim informing the students that
they would ‘look at how you did this morning this afternoon and compare what you
though the answers were… …There were a few good theories floating around this
morning which I want to explore this afternoon’ [STP9 (Trans)].
Lesson 2: The second lesson took place later the same day, immediately after the
midday break. The beginning of the lesson was disrupted as a result of a lunchtime
incident outside the school to which Tim had been required to respond. During the
break Tim had prepared an activity sheet to follow on from the previous lesson’s
work (Figure A9-32).

Appendix 9: Detailed descriptions and analyses of Tim‟s Phase Two activities
352
Figure A9-32 [STP9(Activity)L2] More matching quadratic graphs
His choice of initial functions clearly evidenced that he had appreciated that the
majority of the students had concluded a limited theory concerning the connection
between the quadratics in their factorised and expanded forms. By selecting
quadratic functions with a common integer term, he was aiming to force the
students to expand their theories and look at the coefficient of x within the
expanded expressions. The use of the technology in the lesson was identical to that
of the previous lesson. The students entered expressions to check their equivalence
by plotting the graphs. Towards the end of the lesson, Tim held a plenary
discussion in which he asked a student to offer is theory and, having established
the ‘sum- product’ connection between the factorised and expanded expressions for
the example (x+3)(x+6)=x2+9x+18, Tim proceeded to show the students what this
would look like using the ‘grid multiplication’ representation, which the students
were subsequently asked to record (Figure A9-33).

Appendix 9: Detailed descriptions and analyses of Tim‟s Phase Two activities
353
Figure A9-33 [STP9(StudWork)L2] Grid multiplication strategy
There were far fewer observable hiccups during the second lesson, which I would
surmise to be as a result of the similarity in the approach with that of the preceding
lesson.
Lesson 3: The final lesson in this sequence of three lessons took place the following
morning. In our very brief discussion before the lesson, Tim had said,
I was planning quite late last night and I couldn't come up with
something interesting until this morning when I got to work. I'm going
to do quite a, in a sense, quite a tedious lesson. If I was to store some
random decimal number into the value for x, you can then type in x plus
three, x plus four equals whatever seven x plus twelve and it would say
if it was true and if it was wrong it would say false. So we can use it as a
checking tool which is not a Navigator lesson but it's a good use of the
Nspires to make a dull exercise a bit more interesting. So it's going to
be quite a dull lesson in a sense but… …they need that and they'll get
some success out of that. So I'm going to print off a worksheet for them
and see if that will work. [STP9(Int)]
The worksheet Tim selected was one of the National Curriculum Level 6 resources
from ‘TenTicks’ (Fisher Educational Ltd, 2009), a web-based resource bank to which
the school subscribed (see Figure A9-34).

Appendix 9: Detailed descriptions and analyses of Tim‟s Phase Two activities
354
Figure A9-34 [STP9(Activity)L3] TenTicks worksheet
Tim began the lesson by sending a pre-prepared TI-Nspire file to the students’
handhelds, although he did not direct the students to the file at this point (see
Figure A9-35).
Figure A9-35 [STP9(tns-T)L3] Equivalent quadratic expressions
Tim then reminded the students how to expand a factorised quadratic expression

Appendix 9: Detailed descriptions and analyses of Tim‟s Phase Two activities
355
using the grid multiplication method that he had introduced at the end of the
previous lesson using an example from the previous lesson’s activity (x+2)(x+9).
The students were asked to record this on the blank side of the worksheet he had
just distributed.
Tim opened the TI-Nspire file and demonstrated to the students how to enter the
statement (x+2)(x+9)=x2+11x+18 into a Calculator page to check its validity.
Some students also followed this using their own handhelds.
The students were then asked to work independently, using the grid method to
answer the questions on the worksheet beginning with Section D, halfway down the
page. They were asked to enter the correct terms in each grid and then sum the
terms to produce the correct quadratic expansion. Following this, they were
encouraged to check their statements using the MRT. The students found this
highly motivating and there were shouts of delight from several students when they
gained positive feedback from the MRT.
Interpretation of variance and invariance: The generality that Tim wanted the
students to explore within the first and second lesson concerned the identity
(x+a)(x+b)=x2+(a+b)x+ab. By giving them a range of different factorised and
expanded expressions to match he intended for them to make the connection
between the sum and product in each case. During the first lesson, Tim’s examples
included positive integers only. All of the expanded expressions had different
integer terms and three of them contained the term 9x [STP9(Activity)1].
Consequently the product relationship was the most obvious invariant property for
the students to notice.
The first part of the second activity sheet was obviously designed to expose this
assumption, by including three examples with an integer term of eighteen, forcing
the students to consider the relationship between the numbers in the brackets and
the coefficient of x [STP6(Activity)2].
In the third lesson, the expectations with respect to variance and invariance were
at a much higher mathematical level in that the questions posed required students
to appreciate that (ax+b)(cx+d)= acx2+(bc+ad)x+bd for positive and negative
integer values of b and d.
Instrument utilisation scheme: The IUS that Tim developed for this series of lessons
resonated with IUS1, as the use of the MRT required students to input their
conjectures as syntactic expressions or statements and use the feedback to decide
upon the validity of these conjectures. This is shown diagrammatically in Figure

Appendix 9: Detailed descriptions and analyses of Tim‟s Phase Two activities
356
A9-36.
Figure A9-36 IUS [STP9] Equivalent quadratic expressions
Hiccups identified from the lesson data: Nineteen hiccups were observed in this
series of three lessons and they were grouped into eight categories as shown in
Figure A9-37.
Figure A9-37 [STP9] Activity hiccups
Several students made explicit their instrumentation difficulties when entering the
expanded form of the quadratic expression. Common issues included: using the
multiplication key r (which looked like the letter ‘x’), instead of the alphanumeric
key X; and pressing the x2 key (q) without first pressing the alphanumeric ‘x’ key
when entering x2.
During Tim’s introduction to the first activity, by reading out loud the expression
(x+2)(x+5) as ‘x plus two, x pus five’ as he typed it into the function entry line he
assumed the presence of the brackets [STP(Trans)]. This led to at least one student
entering the function f1(x)=x+2x+5, which produced an unexpected linear function
and, as he moved around the classroom several other students sought reassurance
with respect to whether or not they should type the brackets. In the second lesson,
the students continued to question Tim concerning his omission to mention the

Appendix 9: Detailed descriptions and analyses of Tim‟s Phase Two activities
357
brackets when ‘speaking out loud’ as he entered the factorised expression
(x+2)(x+9) into the MRT.
A similar hiccup occurred in the first lesson, which concerned Tim’s hesitation with
regard to whether the MRT would ‘require’ a multiplication sign between the two
brackets. This again caused confusion as, a few minutes earlier, he had led a
whole-class discourse concerning the ‘invisible’ multiplication sign.
A very subtle difficulty occurred for one pair of students resulting from the order in
which they tried to match the functions. As Tim’s introduction to the whole class
had begun by ‘wrongly’, matching f1(x)=(x+2)(x+5) with f2(x)= x2+7x+18, many
students had these two functions entered on their handhelds. However, as they
began to work independently, many chose to work on the next expression on the
activity sheet, which was (x+3)(x+9). However, when they changed f1(x) to
(x+3)(x+9), they were not prepared for this to result in a correct ‘match’ and were
confused by the feedback from the MRT.
Tim initially thought that, by including many expanded quadratic expressions
containing the term 9x, the students would be forced into cognitive conflict when
they began to match the functions. However, as each pair of expressions matched
uniquely by virtue of their integer terms, this situation did not arise.
A significant hiccup occurred when Tim looked closely at the format of the questions
on the worksheet and noticed that the variable used in the questions, although
initially represented by the letter ‘x’, changed to other letters.
There was an interesting moment when one student questioned the response from
the MRT after Tim had entered a mathematical statement during the third lesson
(Figure A9-38).
Figure A9-38 [STP9(tns-T)] Why didn't it say false?
Student (m): Why didn't it say false?
TP: Sorry?

Appendix 9: Detailed descriptions and analyses of Tim‟s Phase Two activities
358
Student (m): Why didn't it say false?
TP: Because we got it right. If I'd done, and I can copy this, Let's say I
didn't put eighteen, let's say I put seventeen, instead of eighteen, that
would have been wrong... 'cause we worked out it was eighteen yeah? If
I put seventeen in instead, it says false. Alright? You get the idea?
Possible evidence of situated learning: Evidence from the various data sources led
to a list of twelve actions by Tim that might provide evidence of his situated
learning during this activity. These are shown in Figure A9-39.
Figure A9-39 [STP9] Evidence of teacher’s actions
Tim had clearly noticed the issue concerning the inadequacies of the generalisation
that many of the students had made as a result of the first activity and the
worksheet that he devised for the second lesson seemed to respond to these
[STP9Hiccup5]. He also included a series of questions that would encourage the
students to begin to consider the inverse relationship for the generality that they
were beginning to conclude.
The number of students who questioned how they should enter the factorised
expressions during the first lesson seemed to lead Tim to modify his language later
in the lesson sequence [STP9Hiccup2]. For example, when speaking to one pair of
students he said, ‘The first one says x plus two close bracket open bracket, x plus
nine. That's the first one...’ [STP9(Trans)].
Following the third lesson, Tim and I had a brief conversation in which Tim
commented that he felt that he had missed an opportunity for the students to
appreciate that the choice of letters was not mathematically significant and that it
would have been possible to set up the initial file such that all of the questions
could have been checked in the form they had been written [STP9Hiccup7].
ACW: It was very motivating to have that true-false response… … There
are always issues between translating the specificities of the questions

Appendix 9: Detailed descriptions and analyses of Tim‟s Phase Two activities
359
when you take something off the shelf to [use alongside] the context of
the technology.
TP: yes, and that was an issue for me and I hadn't realised it. Yeah, it
wouldn't have even taken very long to store a variable in every single
letter of the alphabet, wouldn't take very long, but I didn't think of it…
…The better thing to do would have been to store a variable for all the
letters of the alphabet and then it would work for anything. But there
you go, you don't think of these things do you? [STP9(Int)]
STP10 Linear graphs
An activity offered during a single lesson with a year 12 group who were preparing
to resit their GCSE examination. Only 10 students were present of which two were
from another teacher’s group due to a disrupted timetable on that day. In the
previous lesson Tim had allowed the students to explore gradient properties of
linear functions by ‘making stars’. In this lesson he began by supporting the
students to construct pairs of coordinate points and then join them with a
geometric line (see Figure A9-40).
Figure A9-40 [STP10(tns-T)1] Comparing gradient properties of lines
Tim encouraged a whole class discussion about the steepness of each of the lines
and used the dots on the grid to support the students to understand that the
gradient of the (steeper) line was equal to two. He then showed them how to use
MRT functionality to ‘measure’ the equation of the steeper line, which revealed an
unanticipated outcome, causing Tim to express a sigh of despair (see Figure
A9-41).

Appendix 9: Detailed descriptions and analyses of Tim‟s Phase Two activities
360
Figure A9-41 [STP10(tns-T)2] The revealed equation
Tim led a period of whole class discourse during which he discussed the
unanticipated notation. He then instigated a quick poll, asking the students to send
their response to the question ‘what is the gradient of the other line?’, a question
which caused some confusion to those students who had not followed the whole
class discussion closely enough to know what was meant by ‘the other line’
[STP10(Trans)]. The students’ responses were discussed and, as most students had
actually responded with an equation, rather than a numerical value for the
gradient, Tim focused this discussion on the different syntactical formats that the
students’ responses had taken.
Tim then adapted the previous file to display a new line (Figure A9-42) and
instructed the students, ‘I want to know what the gradient of that line is… …or even
the equation - if you know what that is from yesterday’ [STP10(Trans)].
Figure A9-42 [STP10(tns-T)3] Describing the linear function
The students entered their responses onto a Notes page within the handhelds and
Tim displayed these to the class using the screen capture view. Most of the
students’ responses were in the form of equations.
Interpretation of variance and invariance: By choosing to construct two line
segments and compare their gradients using the dotty grid as a reference, Tim was
expecting that the students would conclude that, the calculated value of the
gradient would equal the vertical translation for every unit horizontal translation.

Appendix 9: Detailed descriptions and analyses of Tim‟s Phase Two activities
361
The variance was provided by the different positioning of the two coordinate points
which defined the lines and the invariant property was the measured value of its
gradient. In this respect, the MRT was acting the classroom authority. It appeared
that Tim hoped that by contrasting the two initial lines and, later in the lesson
introducing a third line, his students would begin to generalise about the
relationship between the positioning of the dots and the value of the gradient.
Implied instrument utilisation scheme: In this lesson Tim began by co-constructing
the TI-Nspire file with the students, however, as there were several students in the
lesson that day who struggled to follow his instructions he also sent the resulting
file directly to their handhelds3.
The initial representation was one of geometric points that were positioned on a
Cartesian plane with the dotty grid displayed. These points were used to construct
geometric line segments. The equation of the line segments were measured and
the respective equations were displayed in y=mx+c format. Figure A9-43 shows
this IUS diagrammatically.
Figure A9-43 IUS [STP10] Linear functions
Hiccups identified from the lesson data: Twenty-four hiccups were observed in this
activity and they were grouped into the thirteen categories as shown in Figure
A9-44.
3 Due to a staff absence and a subsequent regrouping of the students, three of the students
in the class that day were normally taught by another teacher and had no previous
experience with the MRT.
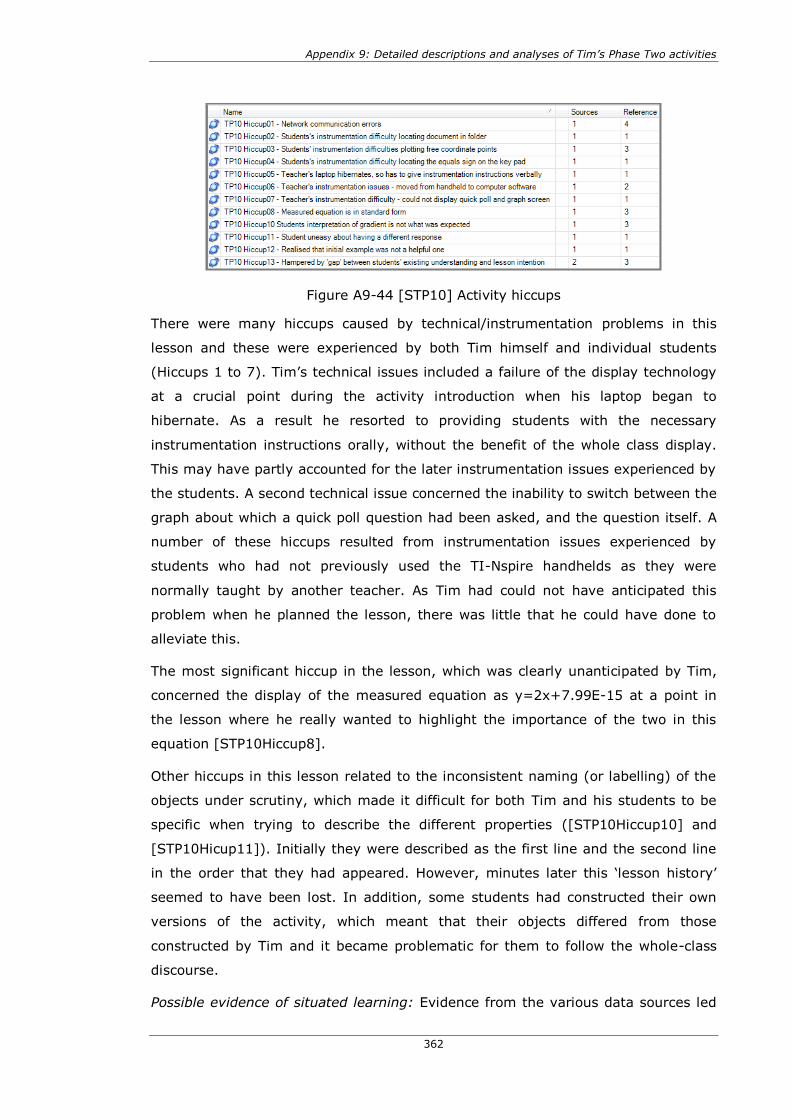
Appendix 9: Detailed descriptions and analyses of Tim‟s Phase Two activities
362
Figure A9-44 [STP10] Activity hiccups
There were many hiccups caused by technical/instrumentation problems in this
lesson and these were experienced by both Tim himself and individual students
(Hiccups 1 to 7). Tim’s technical issues included a failure of the display technology
at a crucial point during the activity introduction when his laptop began to
hibernate. As a result he resorted to providing students with the necessary
instrumentation instructions orally, without the benefit of the whole class display.
This may have partly accounted for the later instrumentation issues experienced by
the students. A second technical issue concerned the inability to switch between the
graph about which a quick poll question had been asked, and the question itself. A
number of these hiccups resulted from instrumentation issues experienced by
students who had not previously used the TI-Nspire handhelds as they were
normally taught by another teacher. As Tim had could not have anticipated this
problem when he planned the lesson, there was little that he could have done to
alleviate this.
The most significant hiccup in the lesson, which was clearly unanticipated by Tim,
concerned the display of the measured equation as y=2x+7.99E-15 at a point in
the lesson where he really wanted to highlight the importance of the two in this
equation [STP10Hiccup8].
Other hiccups in this lesson related to the inconsistent naming (or labelling) of the
objects under scrutiny, which made it difficult for both Tim and his students to be
specific when trying to describe the different properties ([STP10Hiccup10] and
[STP10Hicup11]). Initially they were described as the first line and the second line
in the order that they had appeared. However, minutes later this ‘lesson history’
seemed to have been lost. In addition, some students had constructed their own
versions of the activity, which meant that their objects differed from those
constructed by Tim and it became problematic for them to follow the whole-class
discourse.
Possible evidence of situated learning: Evidence from the various data sources led

Appendix 9: Detailed descriptions and analyses of Tim‟s Phase Two activities
363
to a list of twelve actions by Tim that might provide evidence of his situated
learning during this activity. These are shown in Figure A9-45.
Figure A9-45 [STP10] Evidence of teacher’s actions
Tim demonstrated a number of pedagogic strategies to respond to the
instrumentation issues experienced by the students during the activity. He began
the lesson by talking through the steps needed to create the initial TI-Nspire file,
with the students being expected to follow these on their own handhelds. However,
partly as a result of his laptop hibernating and the screen display being temporarily
blank, he told the students that he would send them his file, rather than expect
them to follow the steps to create it for themselves. This had the advantage of
enabling the students to focus on his screen (when it returned to view) and make
sense of the construction that he was building.
The hiccup that resulted in the display of standard form notation that undoubtedly
contributed to the students’ confusion over the definition of gradient [STP10Hiccup]
required Tim to respond by looking to identify commonalities in the students’
responses to the quick poll.
The students’ oral responses and their interactions with the technology provided
Tim with substantial information about their prior understanding of the topic, as
well as their recollections of previous lesson activities that they related to it.
The diversity of the students’ responses to the activity presented Tim with
dilemmas concerning how he responded to those students’ who questioned the
correctness of their answers. For example, one student wanted reassurance that his
response (y=x+1) was more mathematically correct than that of another student
(y=1x+1).
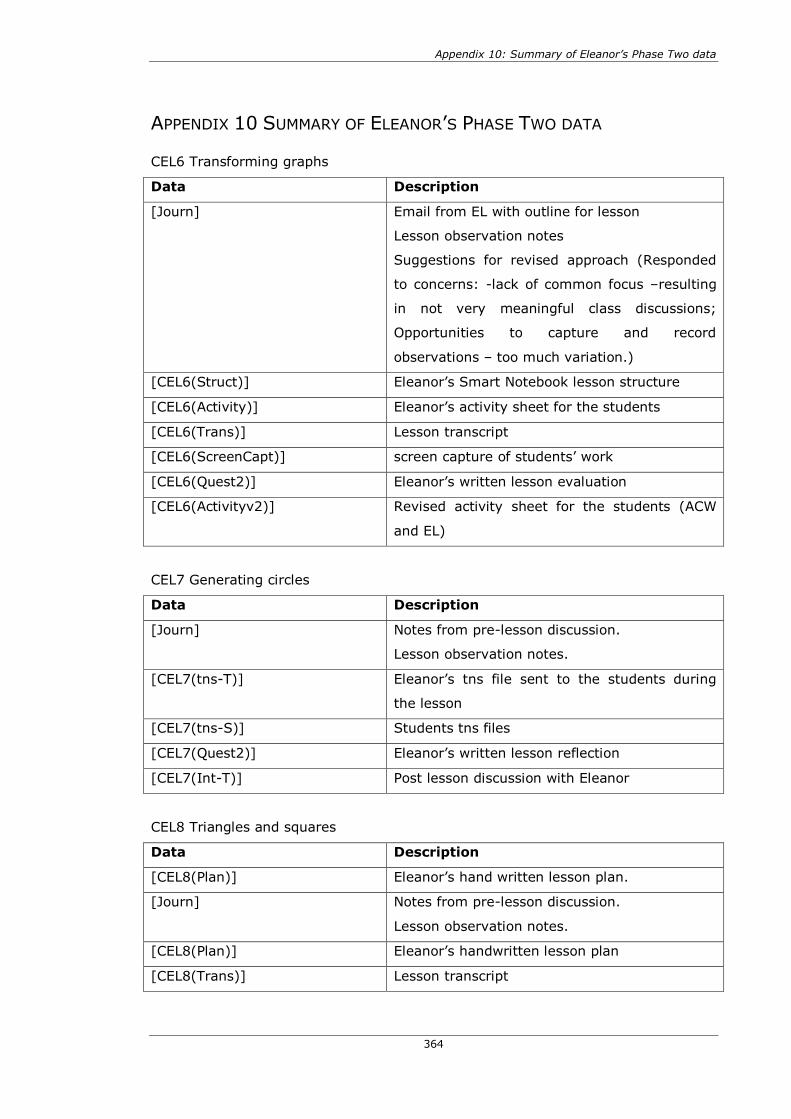
Appendix 10: Summary of Eleanor‟s Phase Two data
364
APPENDIX 10 SUMMARY OF ELEANOR’S PHASE TWO DATA
CEL6 Transforming graphs
Data Description
[Journ] Email from EL with outline for lesson
Lesson observation notes
Suggestions for revised approach (Responded
to concerns: -lack of common focus –resulting
in not very meaningful class discussions;
Opportunities to capture and record
observations – too much variation.)
[CEL6(Struct)] Eleanor’s Smart Notebook lesson structure
[CEL6(Activity)] Eleanor’s activity sheet for the students
[CEL6(Trans)] Lesson transcript
[CEL6(ScreenCapt)] screen capture of students’ work
[CEL6(Quest2)] Eleanor’s written lesson evaluation
[CEL6(Activityv2)] Revised activity sheet for the students (ACW
and EL)
CEL7 Generating circles
Data Description
[Journ] Notes from pre-lesson discussion.
Lesson observation notes.
[CEL7(tns-T)] Eleanor’s tns file sent to the students during
the lesson
[CEL7(tns-S)] Students tns files
[CEL7(Quest2)] Eleanor’s written lesson reflection
[CEL7(Int-T)] Post lesson discussion with Eleanor
CEL8 Triangles and squares
Data Description
[CEL8(Plan)] Eleanor’s hand written lesson plan.
[Journ] Notes from pre-lesson discussion.
Lesson observation notes.
[CEL8(Plan)] Eleanor’s handwritten lesson plan
[CEL8(Trans)] Lesson transcript

Appendix 10: Summary of Eleanor‟s Phase Two data
365
Data Description
[CEL8(tns-T)] Eleanor’s tns file distributed to the students at
the beginning of the lesson.
[CEL8(ScreenCapt)] Images of students’ handhelds as a screen
capture
[CEL8(tns-S)] Students’ tns files
[CEL8(StudWork)] Class set of students’ handwritten response to
Activity 3-1.
[CEL8(Quest2)] Eleanor’s detailed lesson reflection.
CEL9 Crossing linear functions
Data Description
[Journ] Notes from pre-lesson discussion.
Lesson observation notes.
[CEL9(Int-T)] Planning discussions
[CEL9(Plan)] Eleanor’s lesson plan
[CEL9(Struct)] Eleanor’s Smart Notebook lesson structure
[CEL9(tns-T)] Eleanor’s tns file distributed to the students at
the beginning of the lesson.
[CEL9(Image)] Image of the quick poll responses
[CEL9(Trans)] Lesson transcripts
[CEL9(tns-S)] Students’ tns files
[CEL9(ScreenCapt)] Images of students’ handhelds as a screen
capture
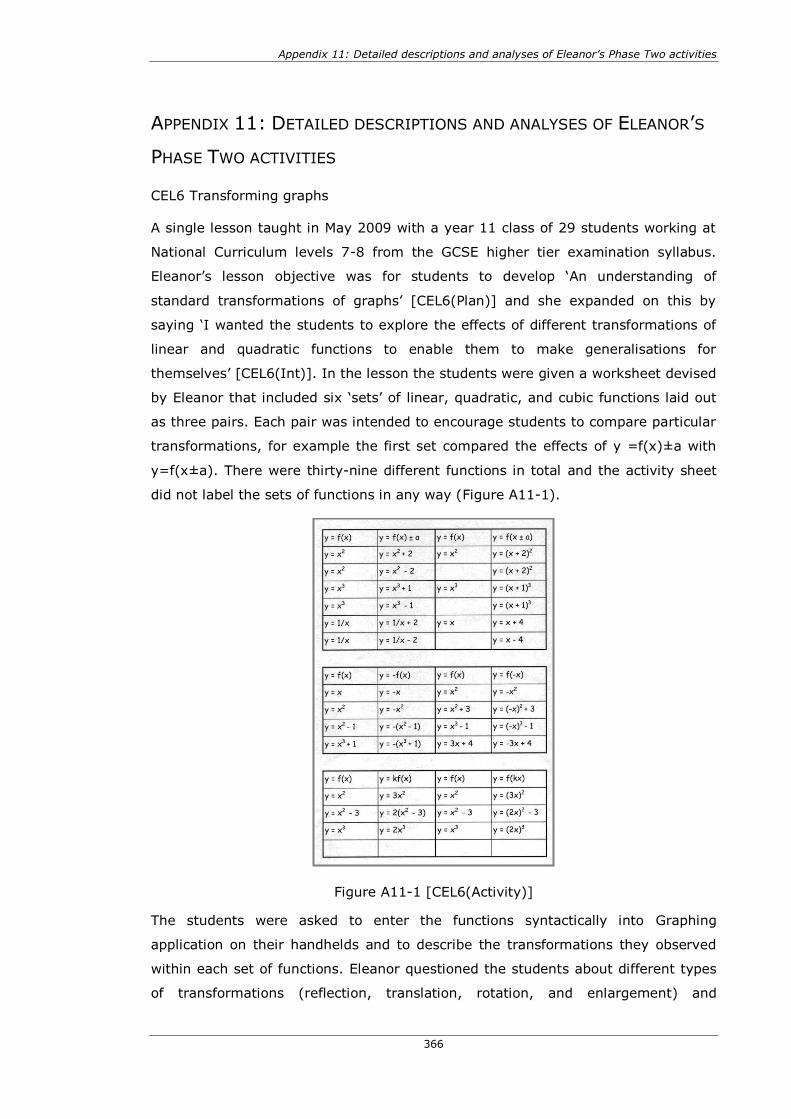
Appendix 11: Detailed descriptions and analyses of Eleanor‟s Phase Two activities
366
APPENDIX 11: DETAILED DESCRIPTIONS AND ANALYSES OF ELEANOR’S
PHASE TWO ACTIVITIES
CEL6 Transforming graphs
A single lesson taught in May 2009 with a year 11 class of 29 students working at
National Curriculum levels 7-8 from the GCSE higher tier examination syllabus.
Eleanor’s lesson objective was for students to develop ‘An understanding of
standard transformations of graphs’ [CEL6(Plan)] and she expanded on this by
saying ‘I wanted the students to explore the effects of different transformations of
linear and quadratic functions to enable them to make generalisations for
themselves’ [CEL6(Int)]. In the lesson the students were given a worksheet devised
by Eleanor that included six ‘sets’ of linear, quadratic, and cubic functions laid out
as three pairs. Each pair was intended to encourage students to compare particular
transformations, for example the first set compared the effects of y =f(x)±a with
y=f(x±a). There were thirty-nine different functions in total and the activity sheet
did not label the sets of functions in any way (Figure A11-1).
Figure A11-1 [CEL6(Activity)]
The students were asked to enter the functions syntactically into Graphing
application on their handhelds and to describe the transformations they observed
within each set of functions. Eleanor questioned the students about different types
of transformations (reflection, translation, rotation, and enlargement) and

Appendix 11: Detailed descriptions and analyses of Eleanor‟s Phase Two activities
367
encouraged them to use these words when describing their observations. They
were not instructed as to how they should communicate their observations,
however it seemed to be an expected part of the classroom ethos that they would
discuss their outcomes with their neighbours. The Smart Notebook file that Eleanor
developed to present the activity to the students included the suggestion that the
students should ‘use 2 graphs per page’ [CEL6(Struct)]. A typical student’s
response to the first stage of the activity is shown in Figure A11-2.
Figure A11-2 [CEL6(tns-S)]
During the lesson Eleanor moved around the classroom and responded to questions
initiated by the students. These were mainly related to instrumentation issues
concerning entering the functions, ‘where is the squared key?’ and ‘how do I insert
a new page’ [CEL6(Trans)]. Ten minutes prior to the end of the lesson, Eleanor
instigated one episode of whole class discourse in which she asked the students to
open ‘your page where you’ve explored this set’ whilst gesturing to the set of
functions shown in Figure A11-3.
Figure A11-3 [CEL6] Function set selected for whole class display
The resulting screen capture view was on public display in classroom in Figure
A11-4.

Appendix 11: Detailed descriptions and analyses of Eleanor‟s Phase Two activities
368
Figure A11-4 [CEL6(ScreenCapt)]
Eleanor attempted to elicit from the students the key generalisation for this
transformation, i.e. that it resulted in a ‘sideways shift’ of ±a. No other
mathematical representations were used during this discussion to justify or explore
why this was true.
Interpretation of variance and invariance: Eleanor’s interpretation of variance and
invariance concerned the four different generalisations that can be concluded as a
function f(x) is transformed according to the following conventions.
Function transformation Geometric transformation
f(x)+a vertical translation by a units
f(x+a) horizontal translation by –a units
-f(x) reflection in the x-axis
f(-x) reflection in the y-axis
af(x) stretch, parallel to the y-axis, scale
factor a
f(ax) stretch, parallel to the x-axis, scale
factor 1/a
The invariant properties were the generalisations that could be made by varying
different input functions according to the above conventions. As a consequence

Appendix 11: Detailed descriptions and analyses of Eleanor‟s Phase Two activities
369
there were two variant properties being explored in this activity which were the
variance resulting from the chosen function transformation and the variance in the
syntactic inputs and geometric and outputs of the individual functions.
Implied instrument utilisation scheme: The activity used a scheme which was
resonant with IUS5 in that Eleanor used a syntactic input to generate a graphical
output, the geometric features of which were the focus for the classroom discourse
(Figure A11-5).
Figure A11-5 [CEL6] Instrument utilisation scheme
Hiccups identified from the lesson data: Nine hiccups were observed in this activity
and they were grouped into the six categories as shown in Figure A11-6.
Figure A11-6 [CEL6] Activity hiccups
Several students’ instrumentation issues were observed at the beginning of the
activity to which Eleanor responded.
The omission of any labelling of the ‘sets’ of functions as they were laid out on the
worksheet (or related teacher explanation) seemed to trigger the following hiccups
during the lesson:
Difficulties experienced by the students in making ‘global’ sense of the
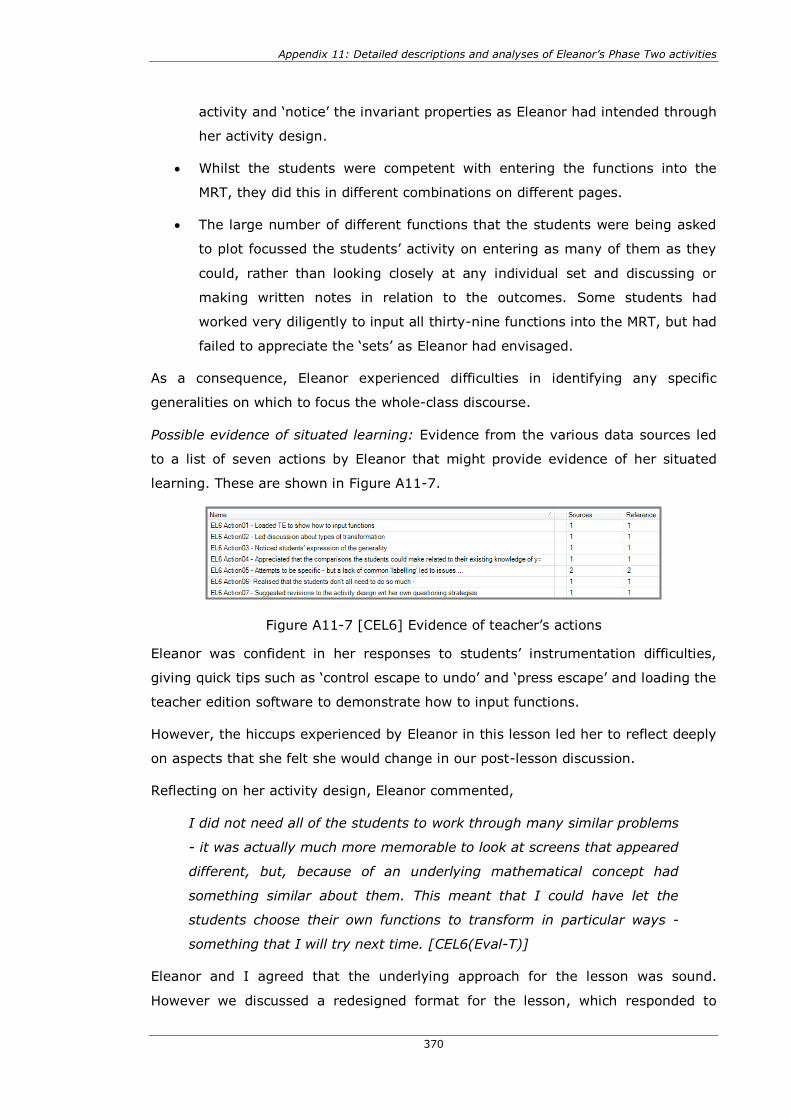
Appendix 11: Detailed descriptions and analyses of Eleanor‟s Phase Two activities
370
activity and ‘notice’ the invariant properties as Eleanor had intended through
her activity design.
Whilst the students were competent with entering the functions into the
MRT, they did this in different combinations on different pages.
The large number of different functions that the students were being asked
to plot focussed the students’ activity on entering as many of them as they
could, rather than looking closely at any individual set and discussing or
making written notes in relation to the outcomes. Some students had
worked very diligently to input all thirty-nine functions into the MRT, but had
failed to appreciate the ‘sets’ as Eleanor had envisaged.
As a consequence, Eleanor experienced difficulties in identifying any specific
generalities on which to focus the whole-class discourse.
Possible evidence of situated learning: Evidence from the various data sources led
to a list of seven actions by Eleanor that might provide evidence of her situated
learning. These are shown in Figure A11-7.
Figure A11-7 [CEL6] Evidence of teacher’s actions
Eleanor was confident in her responses to students’ instrumentation difficulties,
giving quick tips such as ‘control escape to undo’ and ‘press escape’ and loading the
teacher edition software to demonstrate how to input functions.
However, the hiccups experienced by Eleanor in this lesson led her to reflect deeply
on aspects that she felt she would change in our post-lesson discussion.
Reflecting on her activity design, Eleanor commented,
I did not need all of the students to work through many similar problems
- it was actually much more memorable to look at screens that appeared
different, but, because of an underlying mathematical concept had
something similar about them. This meant that I could have let the
students choose their own functions to transform in particular ways -
something that I will try next time. [CEL6(Eval-T)]
Eleanor and I agreed that the underlying approach for the lesson was sound.
However we discussed a redesigned format for the lesson, which responded to

Appendix 11: Detailed descriptions and analyses of Eleanor‟s Phase Two activities
371
Eleanor’s comment that she could allow the students to explore their own functions.
We also incorporated an element of the lesson which I had felt was a constituent
part in developing the students’ understanding of the outcomes of each of the
transformations. To exemplify this, when the function y=f(x) is compared with
y=f(x±a), the visible horizontal ‘shift’ in the graph is linked with the apparent ‘shift’
in corresponding values of x within the table of values for the functions when
viewed side-by-side. This is shown for the function y=x2 and y=(x+2)2 in Figure
A11-8.
Figure A11-8 Using the MRT to explore the function table
In our discussion, when I showed this to Eleanor, she commented that she had
never thought about this connection before, partly because she had learned the
various transformations herself by rote. We jointly developed a recording sheet for
the students to use in the subsequent lesson (see Figure A11-9). This required
them to choose their own functions, record selected values from the function table
and make their own written notes with respect to what they had noticed.
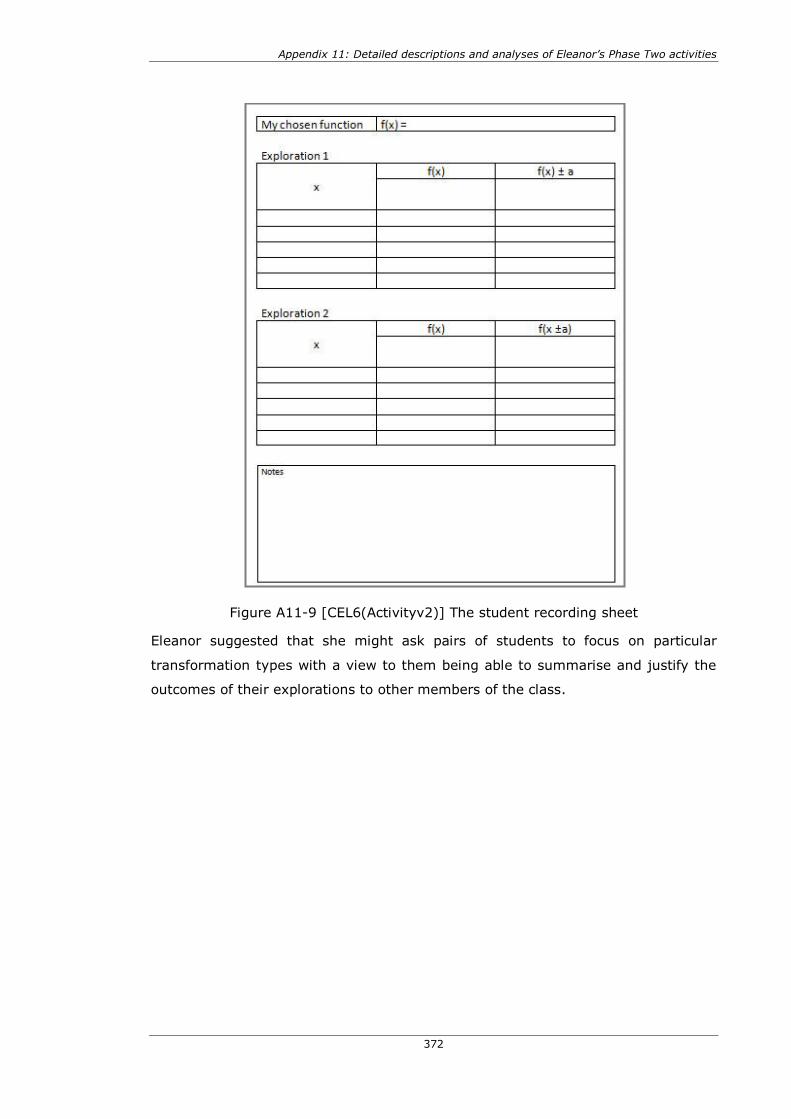
Appendix 11: Detailed descriptions and analyses of Eleanor‟s Phase Two activities
372
Figure A11-9 [CEL6(Activityv2)] The student recording sheet
Eleanor suggested that she might ask pairs of students to focus on particular
transformation types with a view to them being able to summarise and justify the
outcomes of their explorations to other members of the class.

Appendix 11: Detailed descriptions and analyses of Eleanor‟s Phase Two activities
373
CEL7 Generating circles
A single lesson taught in May 2009 with a year 11 class of twenty-nine students
working at National Curriculum levels 7-8 from the GCSE higher tier examination
syllabus. Eleanor wrote that her lesson objective was ‘To establish the equation x2
+ y2 = r2’ [CEL7(Quest2)].
Eleanor began the lesson with a quick poll in which she asked the students to give
two numbers such that, when they were individually squared and summed they
equalled twenty five. Eleanor shared the responses publicly, which initially included
mainly the values 3 and 4. Eleanor resent the poll, asking the students to think
again and provide a different pair of numbers and this time the responses included
zeros. Some students’ perturbation at the inclusion of zero led to a period of
classroom discourse concerning the range and type of permissible variables that
they were ‘allowed’ to include. Eleanor opened a TI-Nspire file that she had
prepared before the lesson and moved to the first page, which included a
spreadsheet into which she typed a pair of ‘correct’ numbers. The third column
automatically summed these numbers as a ‘check’. She then sent the file to the
students’ handhelds, and asked the students to continue to complete the
spreadsheet with as many pairs of numbers as they could.
Examples of two students’ responses during this activity are shown in Figure
A11-10 and Figure A11-11.
Figure A11-10 [CEL7(tns-S1)page1]
Figure A11-11 [CEL7(tns-S2)page1]
Having given the students about ten minutes to enter as many values into the
spreadsheet as they were able, Eleanor asked them to move to the next page of
the file, which was a graphing page onto which the data was (unknowingly to the
students) being plotted automatically (Figure A11-12 and Figure A11-13).

Appendix 11: Detailed descriptions and analyses of Eleanor‟s Phase Two activities
374
Figure A11-12 [CEL7(tns-S1)page2]
Figure A11-13 [CEL7(tns-S2)page2]
At this point Eleanor displayed the screen capture view of all of the students’
handhelds to the class, prompting a period of purposeful classroom discourse
concerning: the range of permissible values (some students had used the square
root function), the symmetrical pictures that some students had produced; the
nature of the shape that was emerging and how to form a ‘more perfect circle’
[CEL7(Trans)].
During the final lesson plenary Eleanor supported the students to make connections
between the original problem and the algebraic function that would ‘join’ the points,
leading to the establishment of the equation x2 + y2 = 25.
Eleanor reported that, in the next lesson (which I did not observe), she had
supported the students to rearrange this equation to give y = √(25-x2), which they
plotted on the graphing page and established that it fitted the plotted points.
Eleanor concluded that this lesson had been a very successful one for the following
reasons:
The numerical starting point for the lesson was highly accessible to all of the
students, with everyone able to contribute a response.
Having populated the spreadsheet with some initial values that satisfied the
given condition, the ‘reveal’ of the graph promoted a high level of intrigue
amongst the students, and provided a visible challenge for them to try find
many more points.
The sharing of responses prompted a high level of discussion, initially
concerning the use of negative values and later on, the use of the square
root symbol within the spreadsheet to generate many more numerical
solutions.
The students were quick to notice the ‘symmetry’ within the numbers for the
possible solutions, i.e. if they knew (3, 4) was a solution then (4, 3), (-3, 4),

Appendix 11: Detailed descriptions and analyses of Eleanor‟s Phase Two activities
375
(3, -4), (-3, -4), (-4, -3), (-4, 3) and (4, -3) would also be solutions. They
made strong links between the symmetry of the numbers within the
coordinates with the geometric symmetry of their position on the graph.
Interpretation of variance and invariance: The starting point for this activity was
finding values of x and y that satisfied x2 + y2=25, which Eleanor was interpreting
as being in the real number domain only. However, as Eleanor left the definition of
the domain open as a point of discussion throughout the lesson, most students
began by considering positive integers and then expanded this domain to include
zero and negative integers. Some students extended this domain to include positive
and negative square roots of non-square numbers. The variant property was the
range of permissible values for x and y, whereas the invariant property was the
given initial condition.
Although Eleanor had designed the activity to include similar explorations of x2 +
y2=16 and x2 + y2=36, and had included a page in the TI-Nspire file which
encouraged the students to begin to generalise (Figure A11-14), this part of the
activity was not observed during the lesson.
Figure A11-14 [CEL7(tns-S2)page3]
Implied instrument utilisation scheme: The instrument utilisation scheme developed
by Eleanor for this lesson, whilst resonating with the type IUS5, clearly illustrates
the range of representational forms that she utilised and the associated flow of the
students’ attentions and actions (Figure A11-15).

Appendix 11: Detailed descriptions and analyses of Eleanor‟s Phase Two activities
376
Figure A11-15 [CEL7] Instrument utilisation scheme
Hiccups identified from the lesson data: Four hiccups were observed in this activity
and they were grouped into the categories as shown in Figure A11-16.
Figure A11-16 [CEL7] Activity hiccups
Apart from a few early instrumentation issues experienced by the students, which
were quickly responded to by Eleanor, most of the hiccups in the lesson related to
the perturbations that the students were experience with respect to the domain of
possible variation of the problem.
Possible evidence of situated learning: Evidence from the various data sources led
to a list of eleven actions by Eleanor that might provide evidence of her situated
learning. These are shown in Figure A11-17.

Appendix 11: Detailed descriptions and analyses of Eleanor‟s Phase Two activities
377
Figure A11-17 [CEL7] Evidence of teacher’s actions
This seemed to relate to Eleanor’s:
Adoption of an open-minded attitude to eliciting students’ existing
knowledge – and allowing the students’ own responses to become the focus
for the resulting responses from the quick poll and public screen capture
display.
Acknowledgement of and responses to the students’ perturbations regarding
the domain for the invariant properties.
Development of a new strategy to overcome students’ instrumentation
difficulties (i.e. send a pre-written TI-Nspire file).
Willingness to involve multiple representations to provide multiple
perspectives for the variant and invariant properties.
Interestingly, Eleanor’s perception of her own use of the MRT in the lesson was ‘It's
not very high tech’ [CEL7(Int)].

Appendix 11: Detailed descriptions and analyses of Eleanor‟s Phase Two activities
378
CEL8 Triangles and squares
A single lesson taught in July 2009 with a group of thirty 13-14 year old girls
working at National Curriculum levels 6-7 who were soon to commence the higher
tier GCSE course. This is Eleanor’s adaptation of the lesson developed and taught
by Tim [STP6], which I had observed a week previously and described to Eleanor.
As it was an appropriate topic on her scheme of work for this class we met and
adapted the activity into a form with which she felt comfortable. Eleanor reported
that she planned the lesson as ‘a very initial look into Pythagoras’ theorem in a
completely different way that could only be thought about using the handheld
technology’ [CEL(Journ-T)].
As this was the first time this class would have used dynamic geometry, in common
with Tim, she began the lesson with a activity which introduced the students to the
instrumentation process required to ‘grab and drag’ a geometric point. Whereas
Tim’s original activity included three squares that were constructed with common
vertices free to move in the 2-D plane (Figure A11-18), Eleanor adapted this so
that the three squares were constructed on a common horizontal base (Figure
A11-19). Eleanor also included a Calculator page on the right hand side of the
handheld screen and hid selected vertices of the squares to focus the students’
attention on just four dynamic aspects.
Figure A11-18 [STP6(tns-T)page1]
Figure A11-19 [CEL8(tns-T)page1]
In a similar initial activity to that devised by Tim, Eleanor asked the students to
drag the vertices to try to make the squares have equal areas. She then supported
the students to remember how to work out the side length of a square, if its area
was known, using the adjacent Calculator page for this purpose.
The student then moved to the second activity which required the students to
explore a dynamic geometric construction that related the areas of squares
constructed on the edges of a triangle. They were asked to try to find a condition
whereby the areas of the two smaller squares summed to give an area that was

Appendix 11: Detailed descriptions and analyses of Eleanor‟s Phase Two activities
379
close to that of the largest triangle (Figure A11-20).
Figure A11-20 [CEL8(tns-T)page2]
Following this, Eleanor displayed the class view of the students’ handhelds publicly
and invited the students to offer their own conjectures in response to the many
different cases that were visible (Figure A11-21).
Figure A11-21 [CEL8(ScreenCapt)]
Eleanor then invited the students to respond to a quick poll question concerning
their observations (Figure A11-22).

Appendix 11: Detailed descriptions and analyses of Eleanor‟s Phase Two activities
380
Figure A11-22 [CEL8(tns-T)page2.2]
During last few minutes of the lesson Eleanor asked the students to drag points
within a traditional Pythagoras construction to create their own numerical problem
(Figure A11-23). They were then asked to try to find as many of the missing
measurements on their diagram as they could.
Figure A11-23 [CEL8(tns-T)page3.1]
Interpretation of variance and invariance: In the main activity, the invariant
property concerned the condition for the sum of the two smaller squares equalling
the area of the larger square when the contained triangle appeared to be right-
angled. The invariant property was the positioning of the vertices of the triangle,
which dictated the values of the resulting areas and area calculation.
Implied instrument utilisation scheme: In common with Tim’s original lesson, the
instrument utilisation scheme developed by Eleanor for this lesson was resonant
with the type IUS3 as shown in Figure A11-24.

Appendix 11: Detailed descriptions and analyses of Eleanor‟s Phase Two activities
381
Figure A11-24 [CEL8] Instrument utilisation scheme
Hiccups identified from the lesson data: Nine hiccups were observed in this activity
and they were grouped into the nine categories as shown in Figure A11-25.
Figure A11-25 [CEL8] Activity hiccups
It was noticeable that only one student experienced problems grabbing and
dragging, which was unusual as this was the first time the students had used the
dynamic geometry features of the handheld.
There were three incidents whereby the students questioned what was meant by
‘equal’, prompted by their concerns over what was an acceptable degree of
accuracy whereby they had met the required condition.
The most significant hiccup in the lesson concerned the students’ responses to the
second activity in which they had satisfied the required condition, however, the
orientation of their triangles what not what Eleanor had expected to see. She
hesitated and asked me, ‘Does Isla’s still work?’ (Figure A11-26) and later, to the
class, ‘Does Lana’s work’ (Figure A11-27) [CEL8(trans)].

Appendix 11: Detailed descriptions and analyses of Eleanor‟s Phase Two activities
382
Figure A11-26 [CEL8(tns-S)] ‘Does Isla’s
still work?
Figure A11-27 [CEL8(tns-S)] ‘Does
Lana’s work?’
Possible evidence of situated learning: Evidence from the various data sources led
to a list of twenty actions by Eleanor that might provide evidence of her situated
learning. These are shown in Figure A11-28.
Figure A11-28 [CEL8] Evidence of teacher’s actions
The number of actions taken by Eleanor in the lesson was extensive and those
which imply that she was actively developing strategies that may have developed
as a result of her growing classroom experiences were:
The very explicit directions that she was giving to the students to focus on
the specific aspects of each representation and, in particular the features
that concerned the generality that she was supporting them to notice.
The ‘scripts’ that she had developed to support students to learn the basic
instrumentation skills to enable them to interact with the technology.
The recognition that some bridging activities were sometimes needed to
support the students to make connections between the various aspects of
the MRT activity.

Appendix 11: Detailed descriptions and analyses of Eleanor‟s Phase Two activities
383
CEL9 Crossing linear graphs
A detailed description of this lesson is provided in the main thesis (Section 6.3.2.1)
Interpretation of variance and invariance: In the initial activity, the invariant
property was the co-ordinate point and the variant property was the infinite number
of linear functions that might pass through it. This led to the generalisation that, if
two lines were to cross, they would share a common coordinate.
Implied instrument utilisation scheme: The implied instrument utilisation scheme
developed for this lesson was resonant with the type IUS3 as shown in Figure
A11-29.
Figure A11-29 [CEL9] Instrument utilisation scheme
Hiccups identified from the lesson data: Nine hiccups were observed in this activity
and they were grouped into the nine categories as shown in Figure A11-30.
Figure A11-30 [CEL9] Activity hiccups
A hiccup within the lesson ‘Crossing linear functions’ [CEL9] challenged Eleanor’s understanding of the meaning of ‘different’ further when we discussed the screens
produced by Maria in Figure A11-31 and

Appendix 11: Detailed descriptions and analyses of Eleanor‟s Phase Two activities
384
Figure A11-32 in response to the same activity.
Figure A11-31 [CEL9(tns-S)] Maria’s
graphs
Figure A11-32 [CEL9(tns-S)] Maria’s
functions
Eleanor did not have a chance to make sense of Maria’s problem in order to
respond to it during the lesson. However, it did become the topic of one of our
post-lesson discussions.
Possible evidence of situated learning: Evidence from the various data sources led
to a list of nineteen actions by Eleanor that might provide evidence of her situated
learning. These are shown in Figure A11-33.
Figure A11-33 [CEL9] Evidence of teacher’s actions

Appendix 12: Eleanor‟s lesson plan and lesson structure for „Crossing linear graphs‟ [CEL9]
385
APPENDIX 12: ELEANOR’S LESSON PLAN AND LESSON STRUCTURE FOR
‘CROSSING LINEAR GRAPHS’ [CEL9]
Lesson plan [CEL9(LessPlan)]
Davison C.E. High School for Girls Lesson Plan Class: 9Ja
Number of
students: 28
Date: 25-09-09 Period:
Subject: Mathematics
Teacher: Mrs. Hunt
Names of SEN
students
Differentiation
required
Purpose and
context of lesson
Lesson 1/3
To explore the intersection of linear equations graphically as a means of an introduction to
simultaneous equations and to explore how the Nspire technology can enable us to do this.
To revise the linear equation y=mx + c and connections between linear graphs drawn.
Learning
Objective(s)
PLTS
To find linear equations that have one common solution and to explore the mathematics
behind these common factors.
reflective learners, creative thinkers
Literacy/numeracy
Cross Curricular
Opportunities
Approx time Activity Resources AFL
opportunities
Introduction
Development
(Focus/step)
(Focus/step)
Plenary
Choose own working pair. Nspires and Nspire paper.
Starbucks, Seattle – cappuccino & latte prices. Could we work
this out, discuss. Our intention is to be able to eventually be
able to solve this and problems like this.
Send tns file, on first page point (3,6) has been plotted. How
many straight lines go through this point?
Quick poll ‘Write a rule that is true for (3,6). 30 secs only to
come up with an idea, save to portfolio, re-submit.
Discussion to lead to x,y notation and axis and linear equation.
Add a function that goes through the point. NB y=f(x). Now
add a 2nd. How do we know that they cross?
Now add a results table and look carefully at values.
Come up with 10 different linear equations that all go through
(3,6).
Record thoughts, findings. Pull together ideas.
Nspires,
A3 paper
Open
Smart, TE,
navigator
Personal Study
Task
N/A
PLTS* - independent enquirers, creative thinkers, reflective learners, team workers, self managers, effective
participators

Appendix 12: Eleanor‟s lesson plan and lesson structure for „Crossing linear graphs‟ [CEL9]
386
Lesson structure [CEL9(LessStruct)]
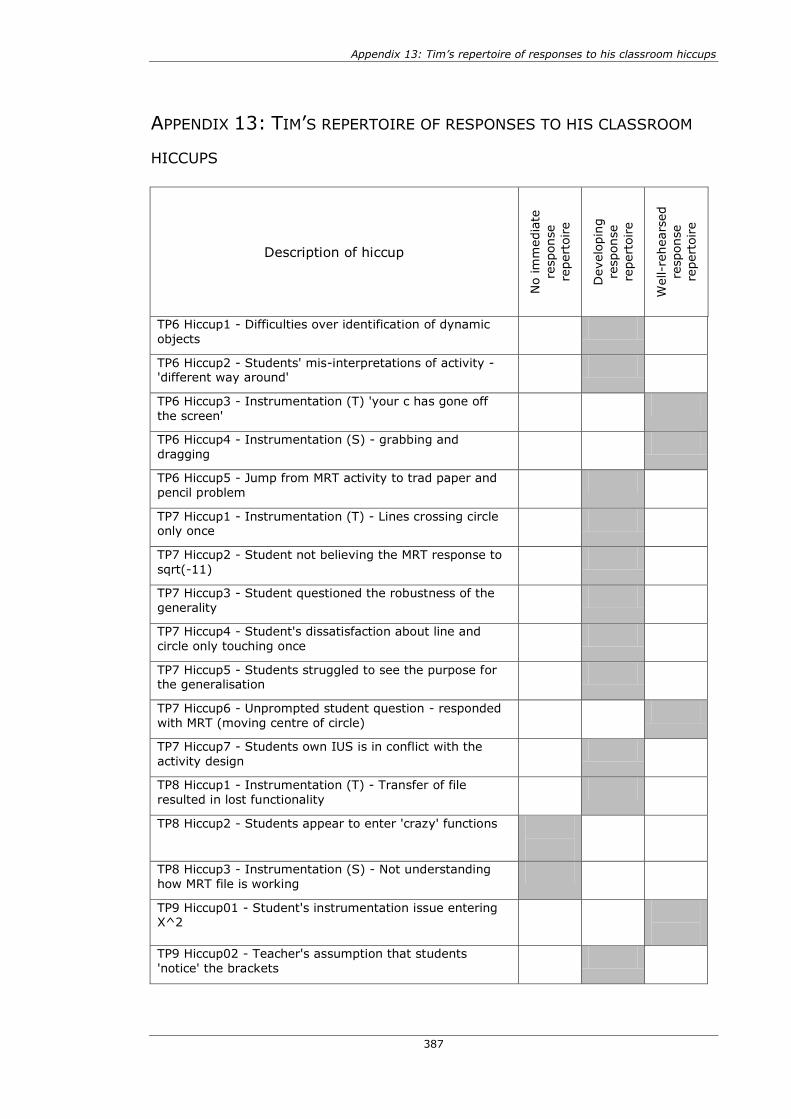
Appendix 13: Tim‟s repertoire of responses to his classroom hiccups
387
APPENDIX 13: TIM’S REPERTOIRE OF RESPONSES TO HIS CLASSROOM
HICCUPS
Description of hiccup
No im
media
te
response
repert
oire
Develo
pin
g
response
repert
oire
Well-r
ehears
ed
response
repert
oire
TP6 Hiccup1 - Difficulties over identification of dynamic
objects 1
TP6 Hiccup2 - Students' mis-interpretations of activity - 'different way around'
1
TP6 Hiccup3 - Instrumentation (T) 'your c has gone off
the screen' ##
TP6 Hiccup4 - Instrumentation (S) - grabbing and
dragging ##
TP6 Hiccup5 - Jump from MRT activity to trad paper and
pencil problem 1
TP7 Hiccup1 - Instrumentation (T) - Lines crossing circle only once
1
TP7 Hiccup2 - Student not believing the MRT response to
sqrt(-11) 1
TP7 Hiccup3 - Student questioned the robustness of the
generality 1
TP7 Hiccup4 - Student's dissatisfaction about line and
circle only touching once 1
TP7 Hiccup5 - Students struggled to see the purpose for the generalisation
1
TP7 Hiccup6 - Unprompted student question - responded
with MRT (moving centre of circle) ###
TP7 Hiccup7 - Students own IUS is in conflict with the
activity design 1
TP8 Hiccup1 - Instrumentation (T) - Transfer of file
resulted in lost functionality
TP8 Hiccup2 - Students appear to enter 'crazy' functions ####
TP8 Hiccup3 - Instrumentation (S) - Not understanding
how MRT file is working ###
TP9 Hiccup01 - Student's instrumentation issue entering X^2
####
TP9 Hiccup02 - Teacher's assumption that students
'notice' the brackets 1

Appendix 13: Tim‟s repertoire of responses to his classroom hiccups
388
Description of hiccup
No im
media
te
response
repert
oire
Develo
pin
g
response
repert
oire
Well-r
ehears
ed
response
repert
oire
TP9 Hiccup03 - Teacher's assumption that students 'see'
the invisible multiplication sign 1
TP9 Hiccup04 - Students' activity sequencing issue.
TP9 Hiccup05 - Teacher's assumption activity sequencing will lead to counter-examples in students' theories
1
TP9 Hiccup06 - Technology fails as teacher goes to use
live presenter in final plenary
TP9 Hiccup07 - Noticing that the worksheet uses letters
other than x 1
TP9 Hiccup08 - Student doubts authority of MRT 'Why didn't it say false'
#
TP9 Hiccup09 - Insufficient specificity about labelling objects under discussion
1
TP10 Hiccup01 - Network communication errors
TP10 Hiccup02 – Student’s instrumentation difficulty
locating document in folder #
TP10 Hiccup03 - Students' instrumentation difficulties plotting free coordinate points
#
TP10 Hiccup04 - Student's instrumentation difficulty locating the equals sign on the key pad
##
TP10 Hiccup05 - Teacher's laptop hibernates, so has to
give instrumentation instructions verbally
TP10 Hiccup06 - Teacher's instrumentation issues -
moved from handheld to computer software #
TP10 Hiccup07 - Teacher's instrumentation difficulty - could not display quick poll/graph screen simultaneously
TP10 Hiccup08 - Measured equation is in standard form #
TP10 Hiccup10 - Students interpretation of gradient is not
what was expected 1
TP10 Hiccup11 - Students uneasy about having a different
response 1
TP10 Hiccup12 - Realised that initial example was not a helpful one
1
TP10 Hiccup13 - Students' confusion over gradient 1

Appendix 14: Eleanor‟s repertoire of responses to her classroom hiccups
389
APPENDIX 14: ELEANOR’S REPERTOIRE OF RESPONSES TO HER
CLASSROOM HICCUPS
Description of hiccup
No im
media
te
response
repert
oire
Develo
pin
g
response
repert
oire
Well-r
ehears
ed
response
repert
oire
EL6 Hiccup01 - Students' reluctance to focus on the outcomes
related to their inputs
1
EL6 Hiccup02 - Students' struggling to see 'sets' of transformations
########
###
EL6 Hiccup03 - Instrumentation (S) - 'How do you draw them' ####
####
###
EL6 Hiccup04 - Instrumentation (S) - Entering x^3 ####
#######
EL6 Hiccup05 - Instrumentation(S) - all pages change the
same
####
####
###
EL6 Hiccup06 - Diverse student responses make
generalisations difficult
####
##
EL7 Hiccup01 - Students question the range of possible
variation
1
EL7 Hiccup02 - Instrumentation(S) - over writing formula in spreadsheet
########
###
EL7 Hiccup03 - Students are perturbed by the range of
different pictures
1
EL7 Hiccup04 - Instrumentation (S) - 'Forgot' how to use the
spreadsheet
####
####
###
EL8 Hiccup01 - MRT responses prompts students' question
'why is that a polygon'
1
EL8 Hiccup02 - Student's instrumentation issues - dragging ####
####
###
EL8 Hiccup03 - Need to define 'exactly' the same 1
EL8 Hiccup04 - Instrumentation (S) – Dragging ####
#######
EL8 Hiccup05 - Students add areas to find length of line 1
EL8 Hiccup06 - Instrumentation issues - Ctrl G to function remove entry line
1

Appendix 14: Eleanor‟s repertoire of responses to her classroom hiccups
390
Description of hiccup
No im
media
te
response
repert
oire
Develo
pin
g
response
repert
oire
Well-r
ehears
ed
response
repert
oire
EL8 Hiccup07 - Students responses show squares in
unexpected orientation
####
####
###
EL8 Hiccup08 - Students understanding of always, sometimes
never
####
#######
EL8 Hiccup09 - Student questions the missing square ####
####
###
EL9 Hiccup01 - Students give diverse responses to quick poll ####
#######
EL9 Hiccup02 - Instrumentation (S) - 'where's equals?' ########
###
EL9 Hiccup03 - Instrumentation (S) 'how do you get down?' -
to send quick poll response
####
#######
EL9 Hiccup04- 'Emily how did you do it?' ########
###
EL9 Hiccup05 - 'How do you get a graph that goes straight
up?'
####
####
###
EL9 Hiccup06 - Instrumentation (S) 'How do you get onto it?' - referring to full function entry line
########
###
EL9 Hiccup07 – Instrumentation (T) struggles to display table
of values
1
EL9 Hiccup08 - Instrumentation (S) - 'How do you get that?' - referring to the table
1