How Do Underwriters Value Initial Public Offerings?: An Empirical Analysis … ANNUAL ME… · ·...
41
How Do Underwriters Value Initial Public Offerings?: An Empirical Analysis of the French IPO Market Peter Roosenboom * RSM Erasmus University JEL classification: G24, G32 Keywords: Initial public offerings, valuation * Corresponding author. The usual disclaimer applies. Correspondence address: Department of Financial Management, Rotterdam School of Management, Erasmus University Rotterdam, PO Box 1738, 3000 DR Rotterdam, The Netherlands. Phone: +31 10 408 1255, Fax: +31 10 408 9017, Email: [email protected]. I thank Martine Cools, Tjalling van der Goot, Frank Hartmann, Abe de Jong, Gerard Mertens, Peter Pope, Willem Schramade, Jeroen Suijs and Frank Verbeeten and several anonymous underwriters for their helpful suggestions.
Transcript of How Do Underwriters Value Initial Public Offerings?: An Empirical Analysis … ANNUAL ME… · ·...

How Do Underwriters Value Initial Public Offerings?:
An Empirical Analysis of the French IPO Market
Peter Roosenboom*
RSM Erasmus University
JEL classification: G24, G32Keywords: Initial public offerings, valuation
* Corresponding author. The usual disclaimer applies. Correspondence address:Department of Financial Management, Rotterdam School of Management, ErasmusUniversity Rotterdam, PO Box 1738, 3000 DR Rotterdam, The Netherlands. Phone: +3110 408 1255, Fax: +31 10 408 9017, Email: [email protected]. I thank Martine Cools,Tjalling van der Goot, Frank Hartmann, Abe de Jong, Gerard Mertens, Peter Pope, WillemSchramade, Jeroen Suijs and Frank Verbeeten and several anonymous underwriters fortheir helpful suggestions.
How Do Underwriters Value Initial Public Offerings?:
An Empirical Analysis of the French IPO Market
Abstract
This paper investigates how French underwriters value the stocks of companies they bring
public. Underwriters often use several valuation methods to determine their fair value
estimate of the IPO firm’s equity. We investigate five of these valuation methods: peer
group multiples valuation, the dividend discount model, the discounted cash flow model,
the economic value added method, and underwriter-specific methods. We document that
underwriters base their choice for a particular valuation method on firm characteristics,
aggregate stock market returns and aggregate stock market volatility in the period before
the IPO. In addition, we examine how underwriters combine the value estimates of the
valuation methods they use into a fair value estimate by assigning weights to these value
estimates. We document that these weights also depend on firm-specific factors, aggregate
stock market returns and aggregate stock market volatility. Finally, we document that
underwriters discount their fair value estimate to set the preliminary offer price of the
shares. This discount is higher for IPO firms with greater valuation uncertainty and lower
for companies that are brought to the market by more reputable underwriters and that are
forecasted to be more profitable.
JEL classification: G24, G32
Keywords: Initial public offerings, valuation

1
1. Introduction
It is well known that an Initial Public Offering (IPO) involves problems regarding price
discovery. The market is not certain about the quality of the IPO firm, while the issuing
firm does not know the market demand for its shares. Issuers therefore delegate the offer
price decision to an investment bank that underwrites the IPO (Baron, 1982). Since
underwriters repeatedly bring firms public, they have strong incentives to build a reputation
as a valuation expert and certify that the offer price reflects fundamental value (Ibbotson
and Ritter, 1995).
In practice, underwriters determine an ex-ante estimate of the fair or market value
of the IPO firm’s equity, which serves as a basis for setting the preliminary offer price. For
this purpose, underwriters normally use several valuation methods and then combine the
value estimates of the different methods in estimating the fair value of the IPO shares. We
know very little about the actual IPO valuation process used by underwriters because it is
unobservable. However, we obtain a large sample of 228 reports from French underwriters
that detail how they value IPO stocks before the shares start to trade on Euronext Paris.
This data is unique because earnings and cash flow forecasts of US IPO firms are generally
unavailable in SEC documents and US underwriters are prohibited from publishing
opinions concerning valuation before the IPO (Kaplan and Ruback, 1995; Bradley et al.,
2003)1. In our empirical analyses, we distinguish between five valuation methods: peer
group multiples, the dividend discount model, the discounted cash flow model, the
economic value added method and underwriter-specific valuation methods. We aim to
answer three novel research questions: (i) How do underwriters select the methods to value
IPO stocks? (ii) How do underwriters combine the outcomes of the different valuation
2
methods to arrive at a fair value estimate of the IPO firms’ equity? (iii) How do
underwriters set the preliminary offer price on the basis of the fair value estimate?
This paper makes three contributions to the existing literature. First, we explain
valuation practice in an IPO context. The limited track record at the time of valuation may
impact the choice of valuation method. It can thus be expected that the usefulness of a
given valuation model varies with firm-specific factors. It may also be the case that,
depending on aggregate stock market circumstances, the different characteristics of
alternative valuation models gives them differing appeal to underwriters. We therefore
examine whether firm-specific factors, aggregate stock market returns and aggregate stock
market volatility affect the choice of valuation method. We are aware of only one other
study that has investigated the choice of valuation method by financial analysts. Demirakos
et al. (2004) show that UK analysts tailor their valuation methods to industry
circumstances. However, they do not investigate how firm-specific factors and aggregate
stock market conditions impact the choice of valuation method. Moreover, they anticipate
but do not test that analysts may employ different models for dividend payers versus non-
payers. In this paper, we examine whether the choice of valuation model depends on the
extent to which the IPO firm plans to pay out future dividends.
Our second contribution is that we investigate how underwriters combine the value
estimates of the different valuation methods into their fair value estimate. Underwriters in
our sample frequently use two or more valuation methods. This implies that they need to
assign weights to each of the two or more value estimates in order to set the fair value
estimate. Bayesian theory states that underwriters should use a linear weighted average of
all available bona fide value estimates giving a higher weight to the value estimates that
they believe to be more accurate (Yee, 2004). Accordingly, Ely and Mande (1996) find that
US analysts substitute away from earnings towards dividends when earnings are noisy

3
indications of future earnings. Penman (1998) investigates how to combine the equity
valuations of price-earnings and price-to-book multiples into one composite valuation. He
shows that more weight should be given to book value and less to earnings multiples when
earnings are particularly high or low relative to book value. We are not aware of papers
that examine how underwriters weigh the value estimates of the five valuation methods
that we examine in this paper.
The third contribution is that we have access to pre-IPO reports that detail how
underwriters value IPOs in practice. This differs from Kim and Ritter (1999), Purnanandam
and Swaminathan (2004) and Houston et al. (2006), who only consider the use of multiples
valuation and that have to estimate the value of IPO firms using their own techniques
assuming that the results approximate the valuation process used by the underwriter. The
pre-IPO reports enable us to focus on the early stage of IPO valuation during which the
underwriter uses one or more valuation methods to arrive at its fair value estimate of the
IPO firm’s equity. We also examine how the underwriter sets the preliminary offer price on
the basis of its fair value estimate. We report that the typical underwriter applies a
deliberate discount to the fair value estimate when setting the preliminary offer price. The
deliberate price discount is distinct from the well-known IPO underpricing that occurs later
in the IPO pricing process2. To our knowledge, we are the first to investigate the cross-
sectional determinants of the deliberate price discount.
We document that underwriters widely use peer group multiples to value IPO
shares. However, in contrast to previous US studies (e.g., Asquith et al., 2005; Houston et
al., 2006) we also find many cases where the dividend discount model and/or the
discounted cash flow model is used. Our results show that underwriters do not randomly
select a valuation method but base their decision on firm characteristics, aggregate stock
market returns and aggregate stock market volatility in the period before the IPO. For

4
example, they prefer to use the dividend discount model to value firms that go public when
past aggregate stock market returns have been poor and when companies plan to pay a
large proportion of their future earnings as dividends. The weight that underwriters assign
to the value estimates of the different valuation methods in setting their fair value estimate
also depends on firm-specific factors and aggregate stock market conditions. For instance,
underwriters assign a lower weight to the value estimates of peer group multiples and
discounted cash flow methods when valuing firms that plan to pay high proportion of their
future earnings as dividends. Instead they attach a higher weight to the value estimate of
the dividend discount model for high dividend paying firms. This suggests that
underwriters take into account the firm’s dividend policy when valuing the IPO firm’s
equity. We also report that the average underwriter discounts the fair value estimate by
18.2% to determine the preliminary offer price. We document that more reputable
underwriters offer lower discounts to investors. Companies forecasted to be relatively
profitable in the year of going public are associated with lower IPO price discounts. In
addition, we report that the IPO price discount is higher for riskier IPO deals with greater
valuation uncertainty.
The outline of our paper is as follows. Section two positions our paper relative to
the prior literature. Section three develops our empirical model. Section four describes the
data. Section five presents the results. Section six concludes.
2. Prior literature
Most valuation studies concentrate on the accuracy of valuation methods. Cheng and
McNamura (2000) and Liu et al. (2002) focus on multiples valuation and report that
multiples derived from forecasted earnings are more accurate than multiples based on other

5
value drivers. Other papers investigate how the selection of comparable firms impacts the
accuracy of multiples (e.g., Boatsman and Baskin, 1981; Alford, 1992; Baker and Ruback,
1999; Bhojrai and Lee, 2002). In general, these authors find that expected profitability,
growth and risk are effective criteria for selecting comparable firms.
Valuation theorists have studied the theoretical properties of several valuation
frameworks. Penman and Sougiannis (1998) and Francis et al. (2000) compare the
accuracy of dividend, free cash flows and accrual earnings equity value estimates. They
find that the value estimate based on accrual earnings is more accurate than the value
estimates based on free cash flows or dividends. However, Lundholm and O’Keefe (2001)
show that discounted cash flow and accrual valuation models yield identical valuations
when consistently applying the same input assumptions to the different models.
The multiples valuation and discounted cash flow model also appear to have similar
valuation accuracy. Kaplan and Ruback (1995) show that the discounted cash flow method
performs at least as well as the multiples method in valuing leveraged buyouts. Gilson et
al. (2000) report that discounted cash flow and comparable firm valuation methods have
similar accuracy in the context of bankruptcy court cases.
Kim and Ritter (1999) investigate how the offer prices of US IPO firms are set by
selecting multiples from industry peers that went public no more than twelve months
before the IPO firm’s offer date. They report that forward price-earnings multiples
dominate all other multiples in valuation accuracy. Houston et al. (2006) also focus on
multiples valuation and study the accuracy of target prices established by analysts one
month after the IPO and argue that this is informative of how US underwriters value IPOs.
They find that the average offer price is set at a 10% discount compared to the value
estimate using the mean comparable firm multiple listed in the analyst report. However,
they do not investigate what determines the size of the discount as we do in this paper.
6
We conclude that most valuation studies focus on a comparison between the
valuation accuracy of the different methods or on the best way to select comparable
companies for multiples valuation. Little is known about what determines the choice of
valuation method. In a recent paper, Demirakos et al. (2004) find that financial analysts in
the UK are more likely to use multiples valuation as their dominant valuation method in
the beverages industry than in the pharmaceuticals and electronics industry. They argue
that the multiples method is more applicable to the beverages industry because it is
characterized by stable and uniform growth prospects compared to the pharmaceutical and
electronics industry. In this paper, we examine whether the underwriter selects a specific
valuation method based on firm-specific factors, aggregate stock market returns, and
aggregate stock market volatility when valuing IPO shares in France. This richer set of
determinants distinguishes our study from Demirakos et al. (2004). Another difference is
that we examine the determinants of the weights that underwriters assign to the value
estimates of the different methods in order to arrive at a fair value estimate of the firm’s
equity. In the next section, we develop our empirical model.
3. Empirical model
3.1. Explaining the choice of valuation method
In this section, we develop an empirical model to explain the choice for a particular
valuation method in the context of IPOs. We examine the cross-sectional determinants of
the choice for a particular valuation method using the binary logit analysis. We estimate the
following models:
ii11i10 εUREPβNMβ +++

7
i3i2i10iiiii AIPβ)AGE1(LnβLnSIZEββ ] OTH ,EVA ,DCF ,[DDM MULT ++++=
i9i8i7i6i5i4 SDβMRETβTECHβDIVβGROWβPROFβ ++++++
Model 1 [2,3,4,5]:
In the five logit regressions the dependent variable equals one if the underwriter uses the
peer group multiples method (MULT), dividend discount model (DDM), discounted cash
flow model (DCF), economic value added method (EVA) or underwriter-specific
techniques (OTH), respectively. The multiples valuation is a relative valuation approach
whereas the other four valuation methods are direct valuation techniques3. We include the
same set of independent variables for every model. Table 1 shows variable definitions.
[Please insert Table 1 about here]
We measure firm size (LnSIZE) by the natural logarithm of total assets reported on
the balance sheet of the most recent financial year before going public. Larger IPO firms
are considered to be easier to value than smaller IPO firms because they have more stable
and easier to forecast cash flows and dividends (Ritter, 1984; Beatty and Ritter, 1986). This
makes the use of direct valuation methods such as the dividend discount model and the
discounted cash flow model more likely.
The natural logarithm of one plus firm age (Ln(1+AGE)) is used as an ex-ante
proxy for risk. It is argued that the greater the age of the firm, the lower the degree of risk
(Ritter, 1984). Kim and Ritter (1999) argue that it is more difficult to forecast future cash
flows and dividends for younger firms without established track records since more of their
value is represented by expectations about future growth rates, which can substantially vary

8
from firm to firm. We therefore predict that older firms are more likely to be valued using
direct valuation methods.
We measure assets in place (AIP) as the ratio of plant, property and equipment and
total assets at the end of the financial year preceding the IPO. In general, accounting
numbers are believed to be better in capturing the value derived from tangible assets than
intangible assets (Lev, 2001). This predicts an increased use of accounting-based valuation
methods such as the economic value added method when valuing firms with high asset
tangibility.
We hypothesize that underwriters are more likely to value the IPO firm using peer
group multiples when they forecast that the company is comparatively profitable in the
current year (PROF). When firms are forecasted to be only marginally profitable or loss
reporting it is less appropriate to use multiples valuation because applying price-earnings
multiples in these circumstances would result in a low or negative multiples valuation.
We employ forecasted sales growth during the current year (GROW) as our proxy
for growth opportunities. For rapidly growing firms short-term free cash flows tend to be
negative because the cash inflows are lower than capital investments. As argued by
Penman (2001, page 117) investment is treated as a loss of value in the discounted cash
flow method and free cash flow fails to recognize value that does not involve cash flows. In
addition, growing firms tend to retain their earnings rather than pay them out as dividends.
Multiples valuation is better suited to value rapidly growing firms since it values
investments and growth opportunities. We thus hypothesize that rapidly growing firms are
less likely to be valued using the direct valuation methods but more likely to be valued
using the multiples approach.
A unique feature of our data is that French IPO firms typically disclose their future
dividend pay-out ratio (DIV) in their prospectus. Firms that make a commitment to pay out

9
a high dividend can be regarded as entering into an ex ante implicit contract that is
verifiable in the period following the IPO. Bhattacharya (1979) shows that only high-
quality firms can credibly use dividend pay-out to signal their quality to investors. In his
theoretical model, dividends are an immediately costly and easily observable signal that
low-quality firms are unable to imitate without turning to expensive outside financing. A
commitment to a high and stable dividend pay-out ratio (DIV) can therefore be expected to
make the value estimate of the dividend discount model more reliable. In particular, it
enables the underwriter to more reliably forecast dividends over a longer planning horizon
making the value estimate less dependent on the terminal value calculation. Damodaran
(1994, page 121) writes that many financial analysts view the dividend discount as useful
for valuing stable, high-dividend-paying stocks. We therefore predict that underwriters are
more likely to use the dividend discount model when setting the fair value estimate for
firms that plan to pay out a large proportion of their future earnings as dividends.
High-tech firms are more difficult to value because a large part of their value is
derived from growth options (Kim and Ritter, 1999; Bartov et al., 2002). Because direct
valuation methods such as the discounted cash flow method and the dividend discount
model cannot easily incorporate the value of these growth opportunities we expect that
technology companies are more likely to be valued using the multiples approach. We
therefore include a dummy variable (TECH) that equals one if the IPO firm is a high-tech
company and zero otherwise4.
Value estimates generated by the discounted cash flow model are sensitive to the
cash flow and discount rate assumptions of underwriters. Although discounted cash flow
valuation may be useful in assessing equity values to a given issuer, DeAngelo (1990)
argues that it is not a very credible means of convincing outside stockholders because of
the sensitivity of the value estimate to the assumptions made unless there is a window of
10
opportunity in which investors are more eager to buy stocks. A rising aggregate stock
market may indicate such a window of opportunity. We thus include market index returns
(MRET) during a 90 trading interval from 95 trading days before and 5 trading days before
the IPO firm’s first day of trading into our model. We predict that a period with high
aggregate stock market returns before the IPO increases the likelihood of using the
discounted cash flow model. In contrast, we expect that the dividend discount model is
more often used when aggregate stock market returns are poor. Baker and Wurgler (2004)
develop a theory in which firms pay dividends to cater to investor demand. When the
aggregate stock market is declining, investors may be more likely to look for safe dividend
paying stocks that give them interim payments on their investment (rather than having to
sell their stock in a declining market). This may give the dividend discount model more
appeal when aggregate stock market returns are low because it emphasizes the firm’s
dividend paying ability of the stock.
We also include the standard deviation of the daily market index returns (SD)
during a 90 trading interval from 95 trading days before and 5 trading days before the IPO
firm’s first day of trading into our model. We argue that investors are likely to be more
uncertain about fundamental value when the aggregate stock market is volatile.
Underwriters may then cater to investor’s demand for more information about fundamental
value by valuing the IPO stock using direct valuation methods. We therefore expect that
direct valuation methods such as the dividend discount model, the discounted cash flow
model and the economic value added method to be used more often when the aggregate
stock market is more volatile in the period before the IPO.
We include two control variables in our empirical model. In order to increase the
power of our tests, we decide to pool the observations for the Nouveau Marché and Second
Marché of Euronext Paris in our analyses. We include a Nouveau Marché dummy variable

11
(NM) to control for any potential differences in the choice of valuation method between the
two markets. In France, IPO activity is concentrated on these two stock market segments.
The Nouveau Marché has been established in 1996 to attract young and high-tech issuers.
Companies that want to list on this stock market are required to have a book value of
equity equal to €1.5 million and raise a minimum of €5 million in the IPO. At least half of
the shares the shares sold in the IPO must be newly issued by the company. In addition,
Nouveau Marché IPO firms are required to have a free float equal to at least 20% of the
shares outstanding after the IPO. The Second Marché has been founded in 1983 to attract
small family-run businesses in more mature industries. Firms that go public on this stock
market have to exist for at least two years and have a free float of at least 10% of the shares
outstanding after the IPO.
We also include underwriter reputation as a control variable. We use underwriter
market share as our proxy for underwriter reputation (UREP). We calculate the underwriter
market share as the percentage market share of the lead underwriter. Following Ljungqvist
and Wilhelm (2002), market share is the sum of gross proceeds (excluding over-allotment
option) in all IPOs lead managed by the underwriter divided by the total proceeds raised
during the sample period. Higher reputation underwriters are believed to be experts in
valuing companies (Carter and Manaster, 1990). This may have an impact on valuation
method choice although we do not have any specific a priori predictions about which
valuation method would be preferred by higher reputation underwriters.
3.2. Explaining the weights attached to valuation estimates
We estimate OLS regressions to explain the weight that underwriters assign to the value
estimate of a particular valuation method conditional on the underwriter using that method.
12
)AGE1(LnβLnSIZEββ ] OTHW ,EVAW ,DCFW,[DDMW MULTW i2i10iiiii +++=
i9i8i7i6i5i4i3 SDβMRETβTECHβDIVβGROWβPROFβAIPβ +++++++
The dependent variable is defined as the weight attached to the value estimates of the
multiples valuation method (MULTW) dividend discount model (DDMW), discounted cash
flow model (DCFW), economic value added method (EVAW) and underwriter-specific
techniques (OTHW) in setting the fair value estimate, respectively. The weights are
obtained from the valuation reports published by the underwriter before the IPO starts
trading on the stock market. For example, one underwriter in our sample arrives at a fair
value estimate of €151.7 million by assigning a weight of 2/3 to the multiples value
estimate of €154.1 million and a weight of 1/3 to the discounted cash flow value estimate
of €147 million. In this example, MULTW thus equals 2/3 and DCFW equals 1/3. We
include the same set of independent variables as in the logit regressions. The models are as
follows:
Model 6 [7,8,9,10]:
Bayesian theory suggests that analysts should use a weighted linear combination of
all available bona fide value estimates with higher weights assigned to those value
estimates that are believed to be more reliable (Yee, 2004). We therefore expect that
underwriters assign a higher weight to the value estimates of direct valuation methods
when they believe that these methods are more likely to generate reliable value estimates.
As argued before, direct valuation methods are believed to be more appropriate when
valuing larger and older firms with low growth opportunities from mature industries. We
ii11i10 εUREPβNMβ +++

13
predict that underwriters will attach a higher weight to the valuation estimate of the
multiples approach when valuing relatively profitable, rapidly growing and/or technology
firms for which this method is likely to be more suitable. Assuming that accounting
numbers are better able to capture value generated from tangible assets than intangible
assets, we predict that the economic value added method receives a higher weight in the
fair value estimate when valuing firms with more assets in place (AIP).
As argued in the previous subsection, we argue that a commitment to a high future
dividend pay-out ratio (DIV) is expected to make the value estimate of the dividend
discount model more reliable. The underwriter is able to more reliably forecast dividends
over a longer planning period. This reduces the sensitivity of the value estimate to the
terminal value calculation. We thus predict that underwriters assign a higher weight to the
value estimate of the dividend discount model when setting the fair value estimate for
firms that plan to pay out a high proportion of their future earnings as dividends.
We anticipate that aggregate stock market returns have a positive impact on the
weight assigned to the value estimate of the discounted cash flow model. When market
index returns (MRET) are high, there exists a window of opportunity during which
investors are more likely to believe the cash flow and discount rate assumptions underlying
the discounted cash flow model (DeAngelo, 1990). In a period with low aggregate stock
market returns investors may be more interested in buying safe dividend paying stocks. In
this event, investors prefer interim payments rather than relying on future capital gains to
generate a return on their investment. Underwriters are expected to assign a higher weight
to the dividend discount model in the fair value estimate in this event so as to emphasize
the dividend paying capacity of the IPO firm and to possibly cater to investor demand for
dividends.

14
i5i4i3i2i10i GROWβPROFβAIPβ)AGE1(LnβLnSIZEββ ISCOUNTD ++++++=
i11i10i9i8i7i6 UREPβNMβSDβMRETβTECHβDIVβ ++++++
We expect that underwriters are more likely to rely on value estimates from direct
valuation methods, such as the discounted dividend model and discounted cash flow
model, during periods when investors are uncertain about the fundamental value of stocks.
A period with high aggregate market volatility may indicate such a period. We therefore
expect underwriters to assign higher weights to the value estimates of the direct valuation
methods when the standard deviation of the market index returns (SD) is high in the period
before the IPO. As before, the Nouveau Marché dummy (NM) and the underwriter
reputation (UREP) act as control variables.
3.3. Explaining the price discount
As a final part of our analysis, we estimate an OLS regression to explain the IPO price
discount. After determining the fair value estimate the typical underwriter applies a price
discount to set the preliminary offer price. The discount (DISCOUNT) is computed as (fair
value estimate – preliminary offer value)/fair value estimate. In this expression, the
preliminary offer value is computed as the preliminary offer price times the number of
shares outstanding after the IPO. The model is as follows:
Model 11:
McCarthy (1999) argues that the applying a price discount early on in the IPO valuation
process may serve two purposes. First, it permits underwriters to expend less market effort
and to ingratiate themselves with buy-side clients such as institutional investors (Baron,
15
1982)5. Second, it serves a defensive purpose. If disgruntled investors argue that the issue
was overpriced, the underwriter can point to this discount as evidence of a conservative
pricing (Tiniç, 1988).
The information asymmetry theories of Beatty and Ritter (1986) and Baron (1982)
argue that IPOs characterized by greater valuation uncertainty will need larger price
discounts In their theoretical models, the price discounts serve to compensate investors for
the valuation uncertainty associated with risky IPO deals. We therefore expect higher
discounts when underwriters bring smaller, younger, less profitable, rapidly growing and/or
technology firms with low asset tangibility to the market. We also add a more direct
measure of valuation uncertainty (UNCERT) to the regression model. This variable is
measured as the ratio of standard deviation of the different valuation estimates and the
arithmetic average of the valuation estimates. In 30 cases, the underwriter only uses one
valuation method and we set this variable equal to zero. We predict higher price discounts
when valuation uncertainty is greater.
As mentioned earlier, Bhattacharya (1979) theoretically shows that high-quality
companies signal their quality by committing themselves to a high dividend pay-out. Low
quality companies cannot credibly mimic this signal without turning to expensive outside
financing again. If investors consider the future dividend pay-out policy announced in the
prospectus as credible this commitment to a high future dividend pay-out ratio (DIV) can
be expected to reduce the need for high price discounts.
Market conditions may be another important determinant of the deliberate price
discounts. If market returns (MRET) are low and/or market volatility (SD) is high
underwriters may need to attract investors through larger discounts and/or avoid
accusations of overpricing from investors. We also expect that more reputable underwriters
offer lower discounts to investors. Their reputation capital certifies IPO firm quality and
ii12 εUNCERTβ ++

16
reduces the need to compensate investors via price discounts (Carter and Manaster, 1990).
The Nouveau Marché dummy variable (NM) is included to control for any differences in
price discounts between the two markets.

17
4. Data and sample description
4.1. Sample construction
We start with the complete universe of French newly listed firms from January 1990 to
December 1999. New listings are identified by L’Année Boursière, an annual publication
of the Société des Bourses Françaises (SBF), the SDC New Issues Database and Dealogic.
We exclude 24 firms that listed on the Premier Marché (the most prestigious listing venue
in France) because these listings generally involve privatization, equity carve-outs or spin-
offs. Twenty-nine firms that transfer from the Marché hors-cote (an over-the-counter
market that existed until 1998), or that previously traded on a foreign stock market, are
excluded because their price discovery is straightforward. We exclude 26 financial services
firms (SIC codes 6000-6999) because their reporting environments are different from those
of other IPO firms. For the same reason, 18 firms that listed either on one of the six
regional stock exchanges (Bordeaux, Lille, Lyons, Marseilles, Nantes, and Nancy) or on
the Marché Libre (an unregulated trading platform in France) are removed.
These selection criteria result in a sample of 309 non-financial French firms that
had an IPO on either the Nouveau Marché (98 firms) or the Second Marché (211 firms) of
Euronext Paris. We obtain valuation reports from the company, from the lead underwriter,
from the Commission des Opération de Bourse (COB), i.e. the French equivalent of the
Securities and Exchange Commission (SEC), or from Disclosure Global Access for 228
out of 309 companies. We obtain 66 valuation reports for the Nouveau Marché and 162
reports for the Second Marché. The valuation reports are from 34 different underwriters.
[Please insert Table 2 about here]

18
4.2. Descriptive statistics
We first examine the industry distribution for our sample of 228 IPO firms (not tabulated).
We group our firms into industries using the industry classifications from Fama and French
(1997), which are constructed by grouping various four-digit SIC codes. Many different
Fama-French industries are represented in our sample of which business services (22.8%),
wholesale trade (9.2%) and retail (5.7%) dominate. We observe that 22.8% of our sample
firms are active in the technology sector.
[Please insert Table 3 about here]
Table 3 shows descriptive statistics. Offer prices and financial statement numbers
are taken from IPO prospectuses. We collect information about total assets from the
balance sheet ending one financial year before the IPO (SIZE). Table 3 shows the average
[median] SIZE equals €54.2 million [€20.9 million]. We measure company age (AGE) as
the number of years the firm has been in existence prior to its IPO. We find that the
average [median] AGE equals 27.4 years [16 years].
Table 3 also reports on assets in place (AIP). The average [median] company in our
sample has 17.9% [13.4%] of its asset base in plant, property and equipment in the
financial year before the IPO. Profitability (PROF) is defined as the current year’s
forecasted earnings before interest and taxes divided by current year’s forecasted sales. The
average [median] PROF equals 11% [10.5%]. Next, we examine forecasted sales growth
(GROW) during the current year. The average [median] company in our sample is

19
forecasted to experience a sales growth of 31% [21.4%]. We find that the average [median]
future dividend pay-out ratio (DIV) equals 20% [20%] of net income.
The market index return (MRET) is measured during a 90 trading interval from 95
trading days before and 5 trading days before the IPO firm’s first day of trading. We use
the Datastream index for France prior to 1992 and the MSCI France index thereafter. The
average [median] MRET is 9.23% [9.46%]. The market index volatility (SD) is measured
as the standard deviation of the daily market index returns during the same 90 trading day
interval. The average [median] SD equals 1.13% [1.03%]. We calculate the underwriter
market share as the percentage market share of the lead underwriter as our proxy for
underwriter reputation (UREP)6. The average [median] UREP is 2.6% [0.3%].
The average [median] number of different valuation methods (NMETHODS) used
by the underwriter equals 2.4 [2]. Multiples valuation is the most popular with 199
underwriters using this method. The dividend discount model and discounted cash flow
model are each used by 135 underwriters. The use of the economic value added is not as
widespread with 44 underwriters employing this method. Underwriters rarely base fair
value estimates on underwriter-specific valuation techniques such as discounting sales,
discounting earnings, sum-of-the-parts valuation etc. These underwriter-specific techniques
are used by 26 underwriters.
A unique aspect of our data is that we are also able to determine the weights that
underwriters assign to the value estimates of the different models when arriving at their fair
value estimate. Table 3 shows the weights assigned to the value estimate of each method in
the fair value estimate conditional on the underwriter using that method. For this reason,
the average weights do not add up to 100%7. The average [median] weight assigned to the
multiples value estimate (MULTW) in the fair value estimate equals 50.3% [50%]8. When
underwriters use the dividend discount model they assign an average [median] weight

20
(DDMW) of 40.4% [33.3%]. The discounted cash flow value estimate receives an average
[median] weight (DCFW) of 36.8% [33.3%]. The average [median] weight (EVAW)
attached to the economic value added value estimate amounts to 30.2% [25%]. The value
estimate of the underwriter-specific techniques is weighted at 40.1% on average and 33.3%
at the median (OTHW). The different valuation methods may yield diverging value
estimates indicating valuation uncertainty. The average [median] valuation uncertainty
(UNCERT) equals 10.5% [7.9%].
To complete the picture, Table 3 also shows the statistical properties of the fair value
of the IPO firm’s equity (FAIRV). The average [median] FAIRV in our sample equals €69.5
million [€41 million]. After the underwriter has determined the fair value estimate he
applies the deliberate price discount to come to the preliminary offer value (POFFERV).
The average [median] POFFERV, computed as the preliminary offer price times the
number of shares outstanding after completion of the IPO, equals €57.5 million [€33.3
million]. Finally, the average [median] deliberate price discount (DISCOUNT) is 18.2%
[18.2%].
5. Empirical results
5.1. The choice of valuation method
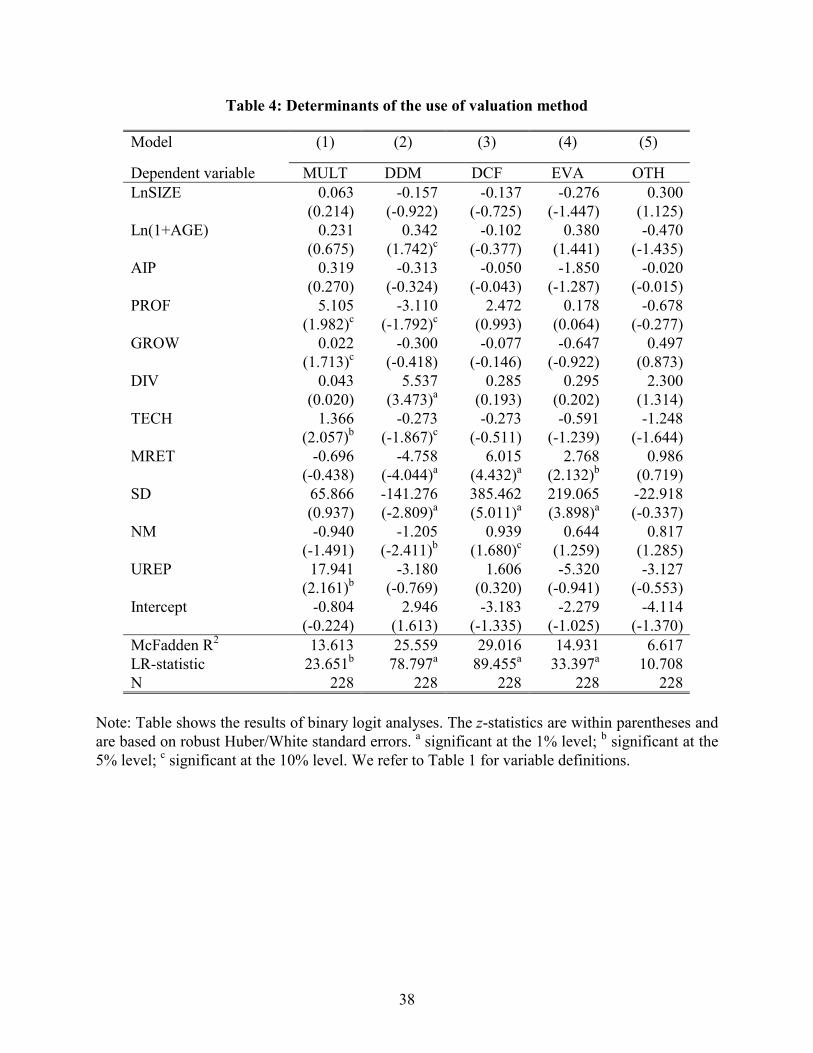
Table 4 shows the results of the binary logit analyses. Consistent with expectations, we
find that underwriters are more likely to use the multiples method when the firm is
forecasted to be relatively profitable in the current year (PROF). We also find that
technology firms (TECH) and rapidly growing firms (GROW) are more likely to be valued
using multiples valuation. We infer that the value of technology and high-growth

21
companies is derived from growth opportunities that are more easily valued using multiples
valuation. More reputable underwriters (UREP) are more likely to opt for multiples
valuation.
[Please insert Table 4 about here]
Table 4 shows that underwriters have a preference for the dividend discount model
when the firm is older (Ln(1+AGE)) and intends to pay out large fraction of its future
earnings as dividends (DIV). Other things equal, underwriters valuing Nouveau Marché
IPO firms (NM) and technology companies (TECH) are less likely to employ the dividend
discount model. Underwriters are also less likely to use the dividend discount model when
valuing companies that are relatively profitable (PROF). When market returns (MRET) are
low it becomes more likely that the underwriter will use the dividend discount model to
value the IPO firm’s equity. A possible explanation is that investors are more interested in
safe dividend paying stocks when aggregate stock market returns are low. The negative
coefficient on aggregate stock market volatility (SD) is inconsistent with our expectations
and suggests that underwriters are less rather than more likely to use the dividend discount
model in the face of a volatile stock market. We also do not find support for our conjecture
that underwriters are more likely to use the dividend discount model to value large firms
(LnSIZE) and firms with relatively low forecasted sales growth (GROW).
Underwriters prefer to use the discounted cash flow method when valuing Nouveau
Marché companies (NM). One possible explanation is that the discounted cash flow
analysis is used to value Nouveau Marché firms because the other valuation methods are
difficult to employ. Typically, these companies cannot be valued using the dividend
discount model because they do not pay dividends in the immediate future and it is more

22
difficult to find comparable companies to use for multiples valuation9. We also find that
underwriters use discounted cash flow analysis when the market index returns (MRET) are
high. We conjecture that these market conditions offer a window of opportunity during
which investors are more eager to buy stocks and more willing to believe the cash flow and
discount rate assumptions underlying the discounted cash flow model. We report that the
market index volatility (SD) is positively related to the use of the discounted cash flow
model. In these market circumstances, investors may be more uncertain about fundamental
value. The discounted cash flow model may give investors the information they need to
evaluate the fundamental value of the IPO stock. In contrast to our predictions, we do not
find that underwriters use the discounted cash flow model more frequently when valuing
larger (LnSIZE), older companies (Ln(1+AGE)) with lower growth rates (GROW).
We report that aggregate market conditions are an important determinant of the
choice for the economic value added method. The use of the economic value added method
is more frequent when aggregate market returns (MRET) are high. Similar to the
discounted cash flow model we argue that investors are more receptive to this valuation
method in a buoyant stock market. The economic value added method is also more often
used when the overall market is relatively volatile (SD). We infer that the additional
information disclosed to investors as part of the economic value added method may give
investors the information about the fundamental value of the IPO firms that they are
looking for. Apart from aggregate market conditions, we do not find any determinants of
the choice for this valuation method. Contrary to our expectations, we do not find a higher
use of economic value added method when valuing firms with more assets in place (AIP).
Finally, we examine the use of underwriter-specific methods. We do not find any
statistically significant determinants that explain the choice for this particular valuation
method. Possibly, there is too much heterogeneity among the underwriter-specific methods.

23
5.2. Weights attached to value estimates
Table 5 shows the results of the valuation weights regressions. These regressions are
estimated conditional on the underwriter using that particular method to value the IPO
firm’s equity. The first column shows that the weight attached to the multiples valuation
outcome is 3.4 percentage points higher for technology companies (TECH). Underwriters
also rely on this method to a larger extent when valuing relatively profitable (PROF) and/or
fast growing (GROW) firms. Underwriters are less likely to rely on the multiples valuation
outcome when the company plans to pay out a relatively high fraction of its future earnings
as dividends (DIV) and when the stock market is more volatile (SD).
[Please insert Table 5 about here]
Consistent with expectations, underwriters base their fair value estimate on the
dividend discount model to a higher degree when the company is planning to pay out a
higher proportion of its future earnings as dividends (DIV). The dividend discount model
carries more weight when market index returns (MRET) are poor. A possible explanation is
that underwriters cater to investor demand and underline the dividend paying ability of the
IPO stock at a time when investors are generally more interested in dividends. We report
that the weight assigned to the dividend discount model is higher when the aggregate
market volatility (SD) is low. This contrasts with our hypothesis that direct valuation
methods are more relied upon during periods of aggregate market volatility. We also do not
find support for our conjecture that underwriters rely on the dividend discount model to
value large firms (LnSIZE) and firms with relatively low forecasted sales growth (GROW).

24
Table 5 reports that underwriters put less weight on the discounted cash flow
method when the company plans to pay out a substantial proportion of its future earnings
as dividends (DIV). We do not find any other significant determinants of the weight that
underwriters attach to the value estimate of the discounted cash flow model when setting
their fair value estimate. In contrast to our earlier predictions, there is no support for the
conjecture that underwriters rely more on the discounted cash flow method when valuing
older companies (Ln(1+AGE)) with lower growth rates (GROW). Market conditions do not
seem to influence the weight that underwriters assign to the discounted cash flow value
estimate in setting the fair value estimate.
We do not find any statistically significant determinants of the weight assigned to
the value estimate of the economic value added method. As a final point, the weight given
to the value estimate of the underwriter-specific techniques is largely driven by profitability
(PROF), underwriter reputation (UREP), and aggregate stock market volatility (SD). Other
things equal, underwriters do not heavily rely on these ad-hoc techniques when valuing
firms with higher forecasted profitability in the current year or when facing a volatile stock
market. More reputable underwriters appear to rely less on these techniques when
determining their fair value estimate. However, we need to be careful in interpreting these
results given the small number of observations.
5.3. The price discount
Table 5 shows the results of the deliberate price discount regression (Model (11)). We find
that higher underwriter reputation (UREP) is associated with a lower price discount. This
suggests that the underwriter’s reputation capital certifies IPO firm quality and reduces the
need for a high price discount. Other things equal, companies that are forecasted to be
25
comparatively profitable in the current year (PROF) are associated with lower IPO price
discounts. Consistent with information asymmetry theories, we report that valuation
uncertainty (UNCERT) is positively associated with the IPO price discount. This is
consistent with the hypothesis that the discount serves as compensation to investors to
invest in riskier IPO deals. Higher aggregate stock market index volatility (SD) has the
same effect on the IPO price discount. In contrast to our expectations, there is no evidence
that underwriters need to attract investors via larger discounts when they bring smaller
(LnSIZE), younger (Ln(1+AGE)), technology (TECH) and/or rapidly growing firms
(GROW) to the market. There is also no support for the conjecture that a high future
dividend pay-out (DIV) is associated with a lower discount or that lower market returns
(MRET) are associated with a higher discount.
5.4. Sensitivity analyses
We conduct several unreported sensitivity analyses to check the robustness of our results10.
First, we check whether underwriter familiarity with valuation methods affects our results.
It might be that a particular underwriter always uses the same methods to value the shares
of the companies it brings public. We therefore re-estimate Models (1) to (5) using a set of
16 dummies for the most active underwriters. There are at most seven dummies that are
significant suggesting that familiarity plays some role in explaining the choice for a
particular valuation method. However, our previous results remain largely intact. We also
exclude the two underwriters that make most frequent use and the two underwriters that
make least frequent use of a particular valuation method. When re-estimating the
regressions the results prove qualitatively similar.

26
We also included profitability and sales growth for the year prior to the IPO rather
than the profitability and sales growth forecasted for the current year in the regressions.
Similar results obtain. Our results are also not sensitive to the inclusion of a set of year
dummies.
We also tested for possible multicollinearity which would prevent estimating
discrete effects. We therefore calculate variance inflation factors of the independent
variables (VIFs). VIFs in excess of 10 suggest severe multicollinearity problems. However,
none of the VIFs is higher than five. This implies that multicollinearity is not a significant
problem in our analyses. In our analyses we pool the observations for the Nouveau Marché
and Second Marché of Euronext Paris to increase the power of our tests. To some extent,
we control for differences between the stock markets by the inclusion of the Nouveau
Marché intercept dummy in our regression models. As a robustness check, however, we
also re-estimate all regressions (with the exception of models (9) and (10) given the limited
number of observations) using interaction terms between the Nouveau Marché dummy
variable and all other independent variables. We find that in an individual regression model
there are never more than two of these interaction terms that are significant. Other things
equal, Nouveau Marché firms are less likely to be valued using multiples when their
tangible asset intensity (AIP) is high and more likely to be valued using the discounted
dividend model and discounted cash flow model when they are more profitable(PROF).
More reputable underwriters (UREP) are more likely to value Nouveau Marché firms using
the discounted cash flow model. In addition, underwriters place a lower weight on the
multiples valuation when valuing older Nouveau Marché firms and a higher weight on the
value estimate of the dividend discount model when valuing more profitable Nouveau
Marché companies. Our other results are the same as before. Overall, there do not seem to

27
be many differences in the regression coefficients between the Nouveau Marché and
Second Marché subsamples.
Other possible concerns are with the estimation of Models (6) to (10). There are 30
out of 228 valuation reports where the underwriter uses only one particular method to value
the IPO stock. This may influence our results because we give a weight equal to 100% to
this one valuation method. We therefore re-estimate Models (6) to (10) excluding the 30
observations where the underwriter only uses one method. We find similar results. Another
concern is that the potential weight that underwriters can assign to the outcome of the value
estimate of each method is inversely related to the number of methods used to value the
IPO. To check this, we also re-estimated Models (6) to (10) adjusting the weight that the
underwriter assigns to the value estimate of the particular valuation method by subtracting
the inverse of the number of valuation methods that the underwriter uses. Hence, if the
underwriters assigns a weight of 2/3 to the multiples method and he uses two valuation
methods, the adjusted weight becomes (2/3-1/2)=1/6. We find similar results as before
when we re-estimate the models using the adjusted weights as dependent variables.
6. Summary and conclusions
The valuation literature is particularly thin about how underwriters value the shares of the
companies they bring public. Our study aims at filling this gap. We obtain valuation reports
from underwriters that give us unique access to detailed valuation analyses for a sample of
228 IPOs on Euronext Paris during the period 1990-1999. We aim to answer three new
research questions: (i) How do underwriters select the methods to value IPO stocks? (ii)
How do underwriters combine the outcomes of the different valuation methods to arrive at
28
a fair value estimate of the IPO firms’ equity? (iii) How do underwriters set the preliminary
offer price on the basis of the fair value estimate?
We document that underwriters frequently use multiples valuation, the dividend
discount model and the discounted cash flow model to value IPO firm’s equity. Other
methods such as the economic value added method and underwriter-specific techniques are
less widespread. We find that underwriters prefer to use multiples valuation when valuing
technology firms and rapidly growing and/or profitable firms. The dividend discount model
is often used when valuing older firms from mature industries that plan to pay out a large
fraction of their future earnings as dividends. The dividend discount model is also more
popular when aggregate stock market returns are relatively low. In these market
circumstances, the use of the dividend discount model may cater to the demand of
investors for safe dividend paying stocks. Other things equal, the use of the discounted
cash flow model and the economic value added method is more frequent when aggregate
stock market returns are high. A possible explanation is that these stock market conditions
offer a window of opportunity during which investors are eager to buy stocks and more
willing to believe assumptions underlying the discounted cash flow model and the
economic value added method. We also report a higher use of these two methods when the
aggregate stock market is relatively volatile. Investors that face a more volatile stock
market are in need of information about fundamental value. The discounted cash flow
model and economic value added method may perhaps provide investors with this
information at the time they need it most.
We also investigate the weights that underwriters assign to the value estimates of
the different methods when setting the fair value estimate. The fair value estimate can be
viewed as the underwriter’s ex-ante estimate of first-day market capitalization.
Underwriters assign a higher weight to the value estimate of the multiples method when

29
valuing relatively profitable and/or fast growing firms in the technology sector. The
multiples value estimate and the discounted cash flow value estimate receive lower weights
when the company plans to pay out relatively high dividends in the future. Underwriters
assign a higher weight to the value estimate of the dividend discount model when the IPO
firm plans to pay out a larger fraction of its future earnings as dividends. Possibly,
underwriters believe the dividend discount model to be more reliable in case the firm plans
to pay out more dividends in the future. Other things equal, underwriters do not heavily
rely on ad-hoc underwriter-specific techniques when valuing more profitable firms or when
facing a more volatile aggregate stock market. More reputable underwriters seem to rely
less on their underwriter-specific value estimates when determining their fair value
estimate.
As a final point, we investigate the determinants of the price discount that
underwriters apply to their fair value estimate to arrive at the preliminary offer value. This
discount is thus applied early on in the IPO valuation process and distinct from the well-
documented IPO underpricing. We document that more reputable underwriters are
associated with lower discounts. Other things equal, companies that are forecasted to be
comparatively profitable in the current year are also linked with lower price discounts. In
addition, we report that the price discount is larger for riskier IPO deals with higher
valuation uncertainty.
To conclude, this study extends the findings Demirakos et al. (2004) by looking at
the use of valuation method in the context of IPOs and including a richer set of
determinants in our empirical model. This enables us to go beyond looking at the cross-
industry variation in the use of particular valuation models. We report that firm
characteristics, aggregate stock returns, and aggregate stock market volatility are important
determinants of the choice of valuation method. Underwriters therefore do not seem to
30
select the valuation methods at random but to at least partially base their decisions on
industry circumstances, firm-specific factors and aggregate stock market conditions.
The extant valuation literature focuses on a comparison between the valuation
accuracy of different valuation methods or on the best way to select comparable companies
for multiples valuation. There is a paucity of research about the determinants of valuation
method choice. Future studies could conduct a large survey among financial analysts to
shed more light on why and when they use a particular valuation method. Another
suggestion for future research is to investigate whether the use of several valuation
methods is associated with higher valuation accuracy. Finally, the use of valuation methods
in other contexts such as mergers and acquisitions deserves further attention.

31
Endnotes
1 In the United States, safe harbor provisions for forward-looking statements in the Private SecuritiesLitigation Reform Act of 1995 do not apply to IPOs. As a result, earnings forecasts in US IPO prospectusesare very rare (Berger, 2002).2 The IPO pricing process begins after setting the preliminary offer price. The underwriter starts withcollecting information about investor demand for the shares during a road show or an auction. Any positiveinformation about investor demand is used to adjust the preliminary offer price upward to arrive at the finaloffer price. On average, the market price on the first day of trading exceeds the final offer price such thatinvestors that were allotted shares in the IPO earn a positive first-day return. This positive first-day return isknown as IPO underpricing and is computed as (first-day market price – final offer price)/final offer price.This paper focuses on the early stage of pre-IPO valuation and not the later IPO pricing stage. We refer toDerrien and Womack (2003) for a more detailed description of the IPO pricing process in France.3 A detailed description of the valuation techniques can be found in text books such as Damodaran (1994),Palepu et al. (2000) and Penman (2001).4 We identify technology firms following the approach of Loughran and Ritter (2004), High-tech companiesare active in SIC codes 3571, 3572, 3575, 3577, 3578 (computer hardware), 3661, 3663, 3669(communications equipment), 3674 (semiconductors), 3812 (navigation equipment), 3823, 3825, 3826, 3827,3829 (measuring and controlling devices), 3841, 3845 (medical instruments), 4812, 4813 (telephoneequipment), 4899 (communications services) and 7370, 7371, 7372, 7373, 7374, 7375, 7378 and 7379(software). We collect SIC codes from COMPUSTAT Global Vantage and Worldscope Disclosure.5 Reading through the analyst reports we found that the price discount is indeed often advertised to enticeinvestors to buy the stock. For example one analyst writes: “The preliminary offer price offers a substantialdiscount from our fair value estimate. We therefore issue a strong buy recommendation for this stock”.6 When constructing the underwriter market share measure we combine local offices and take into accountname changes of underwriters because of mergers and acquisitions in the underwriting industry. Ourunderwriter market share measure identifies the following top three underwriters: BNP Paribas, CréditLyonnais and Société Générale. We base market shares on the original sample of 309 companies that wentpublic during 1990-1999.7 The average unconditional weights of each of the different value estimates are as follows: multiplesvaluation 43.9%, dividend discount model 23.9%, discounted cash flow model 21.8%, economic value addedmethod 5.8% and underwriter-specific techniques 4.6%, respectively.8 The most popular trailing and forward multiples in our sample are price-earnings ratios (used by 191underwriters), followed by price-to-cash flow ratios (94 underwriters), enterprise value-to-earnings ratios (56underwriters), enterprise value-to-sales ratios (56 underwriters), price-to-sales ratios (55 underwriters) andprice-to-book ratios (37 underwriters). We find that the average underwriter selects 6.3 peer group on thebasis of industry and/or size. In a typical valuation report, the underwriter aggregates the value estimates ofthe different multiples together into one value estimate. We therefore use the weight attached to this aggregatemultiple valuation estimate in our analysis rather than the weights assigned to the individual estimates of eachmultiple.9 The Nouveau Marché has been established in 1996 to attract young and high-tech issuers. We report thatonly 4.6% of French listed firms with coverage on Worldscope in 1996 can be classified as technology firms(using the Loughran and Ritter (2004) definition). This made it difficult for underwriters to find a sufficientnumber of appropriate comparable firms. The multiples method may therefore have been more difficult to usewhen valuing Nouveau Marché companies during the initial years.10 Results are available upon request from the corresponding author.

32
References
Alford, A.W., 1992, “The Effect of the Set of Comparable Firms on the Accuracy of thePrice-Earnings Valuation Method”, Journal of Accounting Research 30, 94-108.
Asquith, P., M.B. Mikhail and A. Au, 2005, “Information Content of Equity AnalystReports”, Journal of Financial Economics 75, 245-282.
Baron, D., 1982, “A Model of the Demand of Investment Banking Advising andDistribution Services for New Issues”, Journal of Finance 37, 955-976.
Baker, M. and R. Ruback, 1999, Estimating Industry Multiples, Working paper, HarvardUniversity.
Baker, M. and J. Wurgler, 2004, “A Catering Theory of Dividends”, Journal of Finance59, 1125-1165.
Bartov, E., P. Mohanram and C. Seethamraju, 2002, “Valuation of Internet Stocks – AnIPO Perspective”, Journal of Accounting Research 40, 321-346.
Beatty, R.P. and J.R. Ritter, 1986, “Investment Banking, Reputation and the Underpricingof Initial Public Offerings”, Journal of Financial Economics 15, 213-232.
Berger, P., 2002, “Discussion of Valuation of Internet Stocks – An IPO Perspective”,Journal of Accounting Research 40, 347-358.
Bhattacharya, 1979, “Imperfect Information, Dividend Policy, and the ‘Bird in the Hand’Fallacy”, The Bell Journal of Economics 10, 259-270.
Bhojrai, S. and C.M.C. Lee, 2002, “Who is My Peer? A Valuation-Based Approach to theSelection of Comparable Firms”, Journal of Accounting Research 40, 407-439.
Boatsman, J.R. and E.F. Baskin, 1981, “Asset valuation with Incomplete Markets”,Accounting Review 56, 38-53.
Bradley, D.J., B.D. Jordan and J.R. Ritter, 2003, “The Quiet Period Goes out with a Bang”,Journal of Finance 58, 1-36.
Carter, R. and S. Manaster, 1990, “Initial Public Offerings and Underwriter Reputation”,Journal of Finance 45, 1045-1067.
Cheng, C.S. and R. McNamura, 2000, “The Valuation Accuracy of the Price-Earnings andPrice-Book Benchmark Valuation Models”, Review of Quantitative Finance andAccounting 15, 349-370.
Damodaran, A., 1994, Damodaran on Valuation: Security Analysis for Investment andCorporate Finance, Wiley, New York.
DeAngelo, L.E., 1990, “Equity Valuation and Corporate Control”, Accounting Review 65,93-112.
Demirakos, E.G., N.C. Strong and M. Walker, 2004, “What Valuation Models Do AnalystsUse?”, Accounting Horizons 18, 221-240.
Derrien, F. and K.L. Womack, 2003, “Auctions versus Book-Building and the Control ofUnderpricing in Hot IPO Markets”, Review of Financial Studies 16, 31-61.
Ely, K.M. and V. Mande, 1996, “The Interdependent Use of Earnings and Dividends inFinancial Analysts’ Earnings Forecasts”, Contemporary Accounting Research 13,435-456.

33
Fama, E.F. and K.R. French, 1997, “Industry Costs of Equity”, Journal of FinancialEconomics 43, 153-194.
Francis, J., P. Olsson and D. Oswald, 2000, “Comparing the Accuracy and Explainabilityof Dividend, Free Cash Flow, and Abnormal Earnings Equity Value Estimates”,Journal of Accounting Research 38, 45-70.
Gilson, S.C., E.S. Hotchkiss and R.S. Ruback, 2000, “Valuation of Bankrupt Firms”,Review of Financial Studies 13, 43-74.
Houston, J., C. James and J. Karceski, 2006, “What a Difference a Month Makes: StockAnalyst Valuations Following Initial Public Offerings”, Journal of Financial andQuantitative Analysis 41, 111-137.
Ibbotson, R.G. and J.R. Ritter, 1995, “Initial Public Offerings”, in: R.A. Jarrow, V.Maksimovic and W.T. Ziemba (eds.), Handbook of Finance, North-Holland,Amsterdam.
Kaplan, S.N. and R.S. Ruback, 1995, “The Valuation of Cash Flow Forecasts: AnEmpirical Analysis”, Journal of Finance 50, 1059-1093.
Kim, M. and J.R. Ritter, 1999, “Valuing IPOs”, Journal of Financial Economics 53, 409-437.
Lev, B., 2001, Intangibles: Management, Measurement, and Reporting, BrookingsInstitution Press: Washington D.C.
Liu, J., D. Nissim, J. Thomas, 2002, “Equity Valuation Using Multiples”, Journal ofAccounting Research 40, 135-172.
Ljungqvist, A.P. and W.J. Wilhelm, 2002, “IPO Allocations: Discriminatory orDiscretionary?”, Journal of Financial Economics 65, 167-201.
Loughran, T. and J.R. Ritter, 2004, “Why Has IPO Underpricing Changed Over Time?”,Financial Management 33, 5-37.
Lundholm, R. and T. O’Keefe, 2001, “Reconciling Value Estimates from the DiscountedCash Flow Model and the Residual Income Model”, Contemporary AccountingResearch 18, 311-335.
McCarthy, 1999, “Pricing IPOs: Science or Science Fiction?”, Journal of Accountancy188, 51-58.
Palepu, K.G., P.M. Healy and V.L. Bernard, 2000, Business Analysis and Valuation (2ded.), South-Western College Publishing, Cincinnati.
Penman, S.H., 1998, “Combining Earnings and Book Value in Equity Valuation”,Contemporary Accounting Research 15, 291-324.
Penman, S.H. and T. Sougiannis, 1998, “A Comparison of Dividend, Cash Flow, andEarnings Approaches to Equity Valuation”, Contemporary Accounting Research15, 343-383.
Penman, S.H., 2001, Financial Statement Analysis and Security Valuation (2d ed.),McGraw-Hill, New York.
Purnanandam, A.K. and B. Swaminathan, 2004, “Are IPOs Really Underpriced?”, Reviewof Financial Studies 17, 811-848.
Ritter, J.R., 1984, “The ‘Hot’ Issue Market of 1980”, Journal of Business 57, 215-240.

34
Tiniç, S.M., 1988, “Anatomy of Initial Public Offerings of Common Stock”, Journal ofFinance 43, 789-822.
Yee, K.K., 2004, “Combining Value Estimates to Increase Accuracy”, Financial AnalystsJournal 60, 23-28.
White, H.L., 1980, “A Heteroscedastic-Consistent Covariance Matrix Estimator and aDirect Test of Heteroscedasticity”, Econometrica 48, 817-838.

35
Table 1: Variable definitions
Variable name DescriptionDependent variablesMULT dummy variable equal to one if the underwriter uses the multiples valuationDDM dummy variable equal to one if the underwriter uses the dividend discount modelDCF dummy variable equal to one if the underwriter uses the discounted cash flow modelEVA dummy variable equal to one if the underwriter uses the economic value added methodOTH dummy variable equal to one if the underwriter uses underwriter-specific valuation methodsMULTW weight the underwriter assigns to the value estimate of multiples valuation when setting the
fair value estimateDDMW weight the underwriter assigns to the value estimate of the dividend discount model when
setting the fair value estimateDCFW weight the underwriter assigns to the value estimate of the discounted cash flow model
when setting the fair value estimateEVAW weight the underwriter assigns to the value estimate of the economic value added method
when setting the fair value estimateOTHW weight the underwriter assigns to the value estimate of underwriter-specific valuation
methods when setting the fair value estimateDISCOUNT (fair value estimate-preliminary offer value)/preliminary offer valueIndependent variablesLnSIZE natural logarithm of assets (in millions €) for the most recent 12 month financial period
reported in the prospectusLn(1+AGE) natural logarithm of (one plus firm age). Firm age is the difference between the IPO year
and the founding year in the prospectusAIP plant, property and equipment from the most recent 12 month balance sheet disclosed in the
prospectus divided by total assetsPROF ratio of current year’s forecasted earnings before interest and taxes (EBIT) to current year’s
forecasted salesGROW forecasted sales growth during the current yearDIV future dividend pay-out ratio (dividends/net income) as disclosed in the prospectusTECH dummy variable equal to one if a company belongs to the technology sector (using
Loughran and Ritter (2004) definition), zero otherwiseMRET market index return during a 90 trading day interval from 95 trading days before to 5
trading days before the IPO firm’s first day of trading. We use the Datastream index forFrance prior to 1992 and the MSCI France index thereafter
SD standard deviation of the daily market index returns during a 90 trading day interval from95 trading days before to 5 trading days before the IPO firm’s first day of trading. We usethe Datastream index for France prior to 1992 and the MSCI France index thereafter
NM dummy variable equal to one if a company goes public on the Nouveau Marché , zerootherwise
UREP percentage market share of the IPO lead underwriter in the French IPO market (measuredby gross proceeds raised during 1990-1999)
UNCERT coefficient of variation (standard deviation/average) of the valuation estimates of thedifferent valuation methods used by the underwriter. If the underwriter only uses onevaluation method valuation this variable is set equal to zero (in 30 cases)

36
Table 2: Sample selection criteria
Year Newadmissions
Exclusions because of In sample
PremierMarché
Transfers Financialservices
Regionalexchange
Novaluation
report1990 16 0 0 7 4 0 51991 14 2 0 6 3 0 31992 6 1 0 1 2 2 01993 9 0 0 2 0 0 71994 36 3 1 3 3 4 221995 21 3 4 1 0 1 121996 52 4 3 2 1 17 251997 66 2 7 2 2 16 371998 119 5 9 1 1 24 791999 67 4 5 1 2 17 38Total 406 24 29 26 18 81 228

37
Table 3: Descriptive statistics
Variable Mean Min Percentiles Max Std.dev.
N
25th 50th 75th
SIZE (millions €) 54.18 1.75 10.54 20.85 51.72 898.84 96.15 228AGE (years) 27.44 2.00 9.75 16.00 30.00 250.00 32.75 228AIP (%) 17.91 0.21 5.41 13.38 25.33 84.55 16.37 228PROF (%) 10.99 -32.51 7.30 10.50 15.51 48.92 8.86 228GROW (%) 31.04 -9.48 11.79 21.44 37.99 303.62 35.17 228DIV (%) 20.03 0.00 12.88 20.00 28.13 80.00 13.94 228MRET (%) 9.23 -27.60 -2.14 9.46 18.72 42.10 15.90 228SD (%) 1.13 0.58 0.91 1.03 1.33 2.01 2.02 228UREP (%) 2.61 0.00 0.15 0.32 1.77 12.99 4.40 228NMETHOD 2.36 1.00 2.00 2.00 3.00 5.00 0.83 228MULTW (%) 50.26 14.29 33.33 50.00 60.00 100.00 19.64 199DDMW (%) 40.41 11.11 26.79 33.33 50.00 100.00 19.05 135DCFW (%) 36.82 12.50 25.00 33.33 33.33 100.00 19.96 135EVAW (%) 30.23 11.11 25.00 25.00 33.33 100.00 15.35 44OTHW (%) 40.09 10.00 27.08 33.33 50.00 100.00 19.86 26UNCERT (%) 10.54 0.00 2.56 7.88 15.45 80.61 10.95 228FAIRV (millions €) 69.53 12.20 27.12 40.98 78.21 591.50 82.33 228POFFERV (millions €) 57.54 10.79 21.76 33.33 64.58 553.86 69.62 228DISCOUNT (%) 18.21 -9.09 12.92 18.21 24.57 50.94 9.86 228
Note: The sample consists of 228 IPO firms from January 1990 to December 1999. The numberof different valuation methods (NMETHOD) that the underwriter uses to value the IPO firm’sequity is taken from the valuation report. The fair value estimate (FAIRV) can be viewed as anex-ante estimate of the ‘true’ or market value of the IPO and is taken from the valuation reportthat is published about two weeks before the shares start trading on the stock market. Preliminaryoffer value (POFFERV) is computed as the number of shares outstanding after the IPO times thepreliminary offer price. The preliminary offer price equals the midpoint of the price range for 128IPOs that use the bookbuilding procedure. The preliminary offer price is set equal to theminimum tender price for 81 IPO auctions. The preliminary price equals the fixed-offer price for19 fixed-price offerings. The first market price is retrieved from Datastream. See Table 1 forother variable definitions.
38
Table 4: Determinants of the use of valuation method
Model (1) (2) (3) (4) (5)
Dependent variable MULT DDM DCF EVA OTHLnSIZE 0.063
(0.214)-0.157
(-0.922)-0.137
(-0.725)-0.276
(-1.447)0.300
(1.125)Ln(1+AGE) 0.231
(0.675)0.342
(1.742)c-0.102
(-0.377)0.380
(1.441)-0.470
(-1.435)AIP 0.319
(0.270)-0.313
(-0.324)-0.050
(-0.043)-1.850
(-1.287)-0.020
(-0.015)PROF 5.105
(1.982)c-3.110
(-1.792)c2.472
(0.993)0.178
(0.064)-0.678
(-0.277)GROW 0.022
(1.713)c-0.300
(-0.418)-0.077
(-0.146)-0.647
(-0.922)0.497
(0.873)DIV 0.043
(0.020)5.537
(3.473)a0.285
(0.193)0.295
(0.202)2.300
(1.314)TECH 1.366
(2.057)b-0.273
(-1.867)c-0.273
(-0.511)-0.591
(-1.239)-1.248
(-1.644)MRET -0.696
(-0.438)-4.758
(-4.044)a6.015
(4.432)a2.768
(2.132)b0.986
(0.719)SD 65.866
(0.937)-141.276(-2.809)a
385.462(5.011)a
219.065(3.898)a
-22.918(-0.337)
NM -0.940(-1.491)
-1.205(-2.411)b
0.939(1.680)c
0.644(1.259)
0.817(1.285)
UREP 17.941(2.161)b
-3.180(-0.769)
1.606(0.320)
-5.320(-0.941)
-3.127(-0.553)
Intercept -0.804(-0.224)
2.946(1.613)
-3.183(-1.335)
-2.279(-1.025)
-4.114(-1.370)
McFadden R2 13.613 25.559 29.016 14.931 6.617LR-statistic 23.651b 78.797a 89.455a 33.397a 10.708N 228 228 228 228 228
Note: Table shows the results of binary logit analyses. The z-statistics are within parentheses andare based on robust Huber/White standard errors. a significant at the 1% level; b significant at the5% level; c significant at the 10% level. We refer to Table 1 for variable definitions.

39
Table 5: Determinants of the weights assigned to the value estimatesand of the deliberate price discount
Model (6) (7) (8) (9) (10) (11)
Dependentvariable
MULTW DDMW DCFW EVAW OTHW DISCOUNT
LnSIZE 0.018(1.171)
-0.005(-0.258)
0.005(0.278)
-0.024(-0.840)
-0.059(-1.491)
-0.004(-0.617)
Ln(1+AGE) -0.025(-1.311)
0.012(0.604)
-0.028(-1.100)
0.006(0.369)
0.082(1.710)
-0.007(-0.783)
AIP -0.004(-0.044)
-0.025(-0.297)
0.094(1.033)
0.053(0.529)
0.238(1.375)
0.001(0.037)
PROF 0.029(2.144)b
0.165(0.514)
0.036(0.144)
-0.570(-1.230)
-1.533(-3.603)a
-0.115(-1.795)c
GROW 0.020(1.976)c
-0.036(-0.593)
0.065(0.835)
0.012(0.107)
-0.056(-0.468)
-0.003(-0.180)
DIV -0.396(-3.121)a
0.390(2.215)b
-0.463(-3.211)a
-0.212(-0.849)
0.431(1.227)
-0.022(-0.481)
TECH 0.034(1.865)c
0.024(0.498)
-0.043(-0.853)
0.056(0.802)
0.005(0.036)
0.029(1.590)
MRET 0.005(0.056)
-0.436(-3.966)a
0.191(1.377)
0.118(0.729)
-0.307(-1.160)
0.008(0.170)
SD -8.457(-2.281)b
-20.454(-4.575)a
1.470(0.280)
-6.598(-0.841)
-24.049(-2.562)b
4.100(2.055)b
NM -0.042(-0.978)
0.009(0.181)
0.036(0.912)
-0.022(-0.464)
0.080(0.681)
0.007(0.353)
UREP 0.129(0.342)
-0.222(-0.608)
-0.332(-0.719)
0.197(0.211)
-2.208(-1.871)c
-0.261(1.655)c
UNCERT 0.179(2.569)b
Intercept 0.578(3.118)a
0.653(2.761)a
0.410(1.746)c
0.679(1.751)c
1.125(2.144)b
0.189(2.107)b
Adjusted R2 7.083 12.821 12.638 18.998 50.146 13.679F-statistic 2.372a 2.792a 2.762a 1.917c 3.286a 4.000a
N 199 135 135 44 26 228
Note: Table shows the results of OLS regression analyses. In parentheses are the t-statistics usingWhite (1980) heteroskedastic-consistent standard errors. a significant at the 1% level; b
significant at the 5% level; c significant at the 10% level. We refer to Table 1 for variabledefinitions.