How do pupils progress during Key Stages 2 and 3? · Research Report DFE-RR096. How do pupils...
62
Research Report DFE-RR096 How do pupils progress during Key Stages 2 and 3? Education Standards Analysis and Research Division Department for Education
-
Upload
nguyendung -
Category
Documents
-
view
216 -
download
2
Transcript of How do pupils progress during Key Stages 2 and 3? · Research Report DFE-RR096. How do pupils...

Research Report DFE-RR096
How do pupils progress during Key Stages 2 and 3?
Education Standards Analysis and Research Division
Department for Education
Executive Summary
What’s in this Report?
How do Pupils Progress During Key Stages 2 and 3? presents statistical analysis of pupils’ progress in reading, writing and maths during years 3-9, based on a sample of termly teacher assessments for over 70,000 pupils in 10 Local Authorities. The main issues addressed are when most progress is made, who makes most progress, how termly progress adds up to expected threshold levels of achievement, and what progress through National Curriculum Key Stages 2 and 3 looks like empirically – the patterns and pathways actually followed by pupils.
What are the Key Findings from the Analysis?
Learning Pathways (details in Chapter 5)
• For many pupils, progress during Key Stages 2 and 3 is not linear and continuous; episodes of regression to an earlier level of attainment, or remaining at the same level for a period, are part of the norm.
• Patterns of progress are highly individual; there is low concentration of pupils into one pathway or another, especially in reading and writing.
• The more progress a pupil made in the previous term, the less likely they are to make progress the following term, and vice versa.
Timing of Progress (details in Chapter 1)
• More progress is made per year in Key Stage 2 than Key Stage 3 in all three subjects, but especially in reading and writing.
• Pupils make most progress during the summer term and least progress during the autumn term.
Prior Attainment (details in Chapter 2)
• Pupils who were behind at the previous Key Stage are less likely to make progress than those who had achieved the expected level or above.
• Differences in progress by prior attainment were largest for maths.
Expected Levels of Attainment (details in Chapter 3)
• The percentages of pupils achieving the expected level, and above the expected level, increase steadily through KS2 and KS3, with average attainment rising from level 2 in year 3 to level 5 in year 9.
• By the end of year 5, significant proportions of pupils have already reached the expected level for the end of Key Stage 2: 62% in reading, 44% in writing, and 52% in maths. By the end of year 8, 66% have achieved the end of Key Stage 3 expected level in reading, as have 65% in writing, and 70% in maths.
• However, the rate of progress by high attainers in reading and writing is slower than expected during Key Stage 3: in reading, almost 30% of pupils
1

begin the Key Stage at the expected level (L5), but only around 20% have reached the next level (L6) after two more years of schooling.
Pupil Characteristics (details in Chapter 4)
• Boys are less likely to make progress than girls in all three subjects; the differences are larger during Key Stage 3, when the probability of progressing each year decreases more for boys than for girls. Maths has the smallest gender progress differences, and reading has the largest.
• The gaps in attainment widen between pupils known to be eligible for Free School Meals (FSM) and their peers as there are greater differences in progress in years 4 and 5 during Key Stage 2, although pupils with FSM also make less progress during Key Stage 3. Reading has the smallest FSM progress differences, and maths has the largest.
• The widening of the attainment gaps between pupils with Special Educational Needs (SEN) and their peers is spread across both Key Stages, with similar differences in progress in years 4-5 as in years 8-9; interestingly, in year 7, when the gap is actually narrowing in reading and writing, it continues to grow in maths at a faster rate than any other year.
• Chinese pupils progress the most, especially in maths; unlike other ethnic groups who may be “catching up” during KS2 and 3, Chinese pupils are already ahead of White pupils in attainment of the expected levels at Key Stage 1.
• Asian pupils also make more progress than White pupils, but this is concentrated in Key Stage 2, with their progress slowing to be more in line with other pupils in the latter part of Key Stage 3. Black pupils show a tendency for polarized progress performance in Key Stage 3, with more failing to progress, as well as more making three or more sub-levels of progress per year (compared with White pupils).
• Pupils with English as an Additional Language (EAL) make more sub-levels of progress than other pupils in all years in all three subjects. This represents “catching up” with other pupils, who tend to have higher prior attainment levels at Key Stage 1. The biggest difference is in reading, with smaller differences in writing and maths.
Questions Arising from the Findings
The findings of the paper, culminating in the pathways analysis in chapter 5, raise further questions that cannot be answered using the available data. If pupil progress is currently non-linear and/or non-continuous for a significant proportion of Key Stage 2 and 3 learners, to what extent is this due to inherent tendencies of pupils, and to what extent are these progress patterns influenced by the systems, focus and intervention that a school places at different points in the academic year or the Key Stages? There is no available counterfactual system within schools in England to determine this. In either case, there may be implications for how schools would wish to organise their teaching and learning.
2
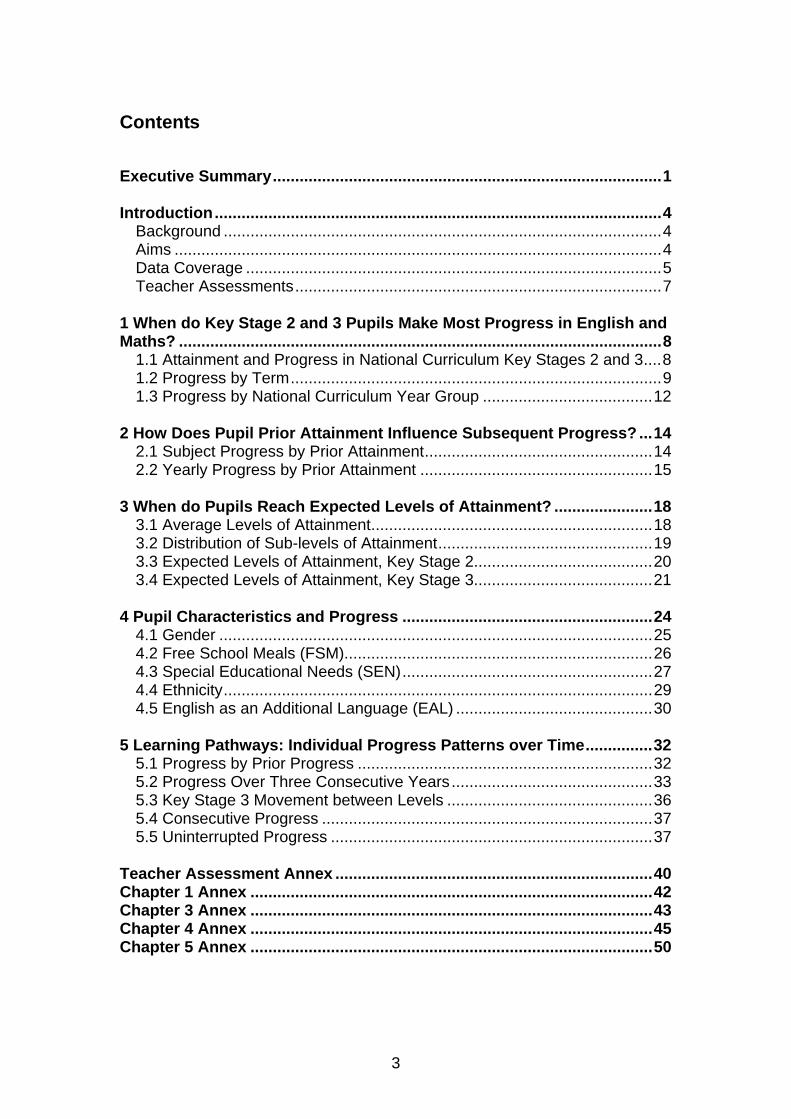
Contents
Executive Summary.......................................................................................1 Introduction....................................................................................................4
Background ..................................................................................................4 Aims .............................................................................................................4 Data Coverage .............................................................................................5 Teacher Assessments..................................................................................7
1 When do Key Stage 2 and 3 Pupils Make Most Progress in English and Maths? ............................................................................................................8
1.1 Attainment and Progress in National Curriculum Key Stages 2 and 3....8 1.2 Progress by Term...................................................................................9 1.3 Progress by National Curriculum Year Group ......................................12
2 How Does Pupil Prior Attainment Influence Subsequent Progress? ...14
2.1 Subject Progress by Prior Attainment...................................................14 2.2 Yearly Progress by Prior Attainment ....................................................15
3 When do Pupils Reach Expected Levels of Attainment? ......................18
3.1 Average Levels of Attainment...............................................................18 3.2 Distribution of Sub-levels of Attainment................................................19 3.3 Expected Levels of Attainment, Key Stage 2........................................20 3.4 Expected Levels of Attainment, Key Stage 3........................................21
4 Pupil Characteristics and Progress ........................................................24
4.1 Gender .................................................................................................25 4.2 Free School Meals (FSM).....................................................................26 4.3 Special Educational Needs (SEN)........................................................27 4.4 Ethnicity................................................................................................29 4.5 English as an Additional Language (EAL) ............................................30
5 Learning Pathways: Individual Progress Patterns over Time...............32
5.1 Progress by Prior Progress ..................................................................32 5.2 Progress Over Three Consecutive Years.............................................33 5.3 Key Stage 3 Movement between Levels ..............................................36 5.4 Consecutive Progress ..........................................................................37 5.5 Uninterrupted Progress ........................................................................37
Teacher Assessment Annex .......................................................................40 Chapter 1 Annex ..........................................................................................42 Chapter 3 Annex ..........................................................................................43 Chapter 4 Annex ..........................................................................................45 Chapter 5 Annex ..........................................................................................50
3
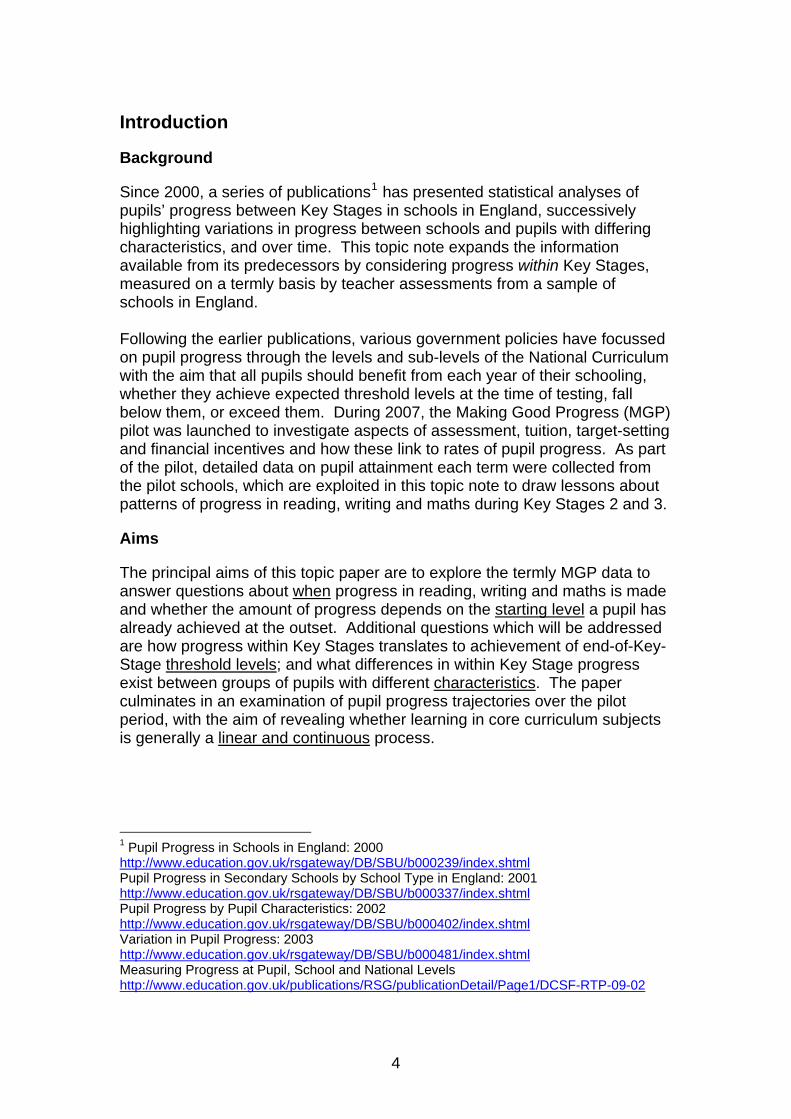
Introduction
Background
Since 2000, a series of publications1 has presented statistical analyses of pupils’ progress between Key Stages in schools in England, successively highlighting variations in progress between schools and pupils with differing characteristics, and over time. This topic note expands the information available from its predecessors by considering progress within Key Stages, measured on a termly basis by teacher assessments from a sample of schools in England. Following the earlier publications, various government policies have focussed on pupil progress through the levels and sub-levels of the National Curriculum with the aim that all pupils should benefit from each year of their schooling, whether they achieve expected threshold levels at the time of testing, fall below them, or exceed them. During 2007, the Making Good Progress (MGP) pilot was launched to investigate aspects of assessment, tuition, target-setting and financial incentives and how these link to rates of pupil progress. As part of the pilot, detailed data on pupil attainment each term were collected from the pilot schools, which are exploited in this topic note to draw lessons about patterns of progress in reading, writing and maths during Key Stages 2 and 3.
Aims
The principal aims of this topic paper are to explore the termly MGP data to answer questions about when progress in reading, writing and maths is made and whether the amount of progress depends on the starting level a pupil has already achieved at the outset. Additional questions which will be addressed are how progress within Key Stages translates to achievement of end-of-Key-Stage threshold levels; and what differences in within Key Stage progress exist between groups of pupils with different characteristics. The paper culminates in an examination of pupil progress trajectories over the pilot period, with the aim of revealing whether learning in core curriculum subjects is generally a linear and continuous process.
1 Pupil Progress in Schools in England: 2000 http://www.education.gov.uk/rsgateway/DB/SBU/b000239/index.shtml Pupil Progress in Secondary Schools by School Type in England: 2001 http://www.education.gov.uk/rsgateway/DB/SBU/b000337/index.shtml Pupil Progress by Pupil Characteristics: 2002 http://www.education.gov.uk/rsgateway/DB/SBU/b000402/index.shtml Variation in Pupil Progress: 2003 http://www.education.gov.uk/rsgateway/DB/SBU/b000481/index.shtml Measuring Progress at Pupil, School and National Levels http://www.education.gov.uk/publications/RSG/publicationDetail/Page1/DCSF-RTP-09-02
4
Data Coverage
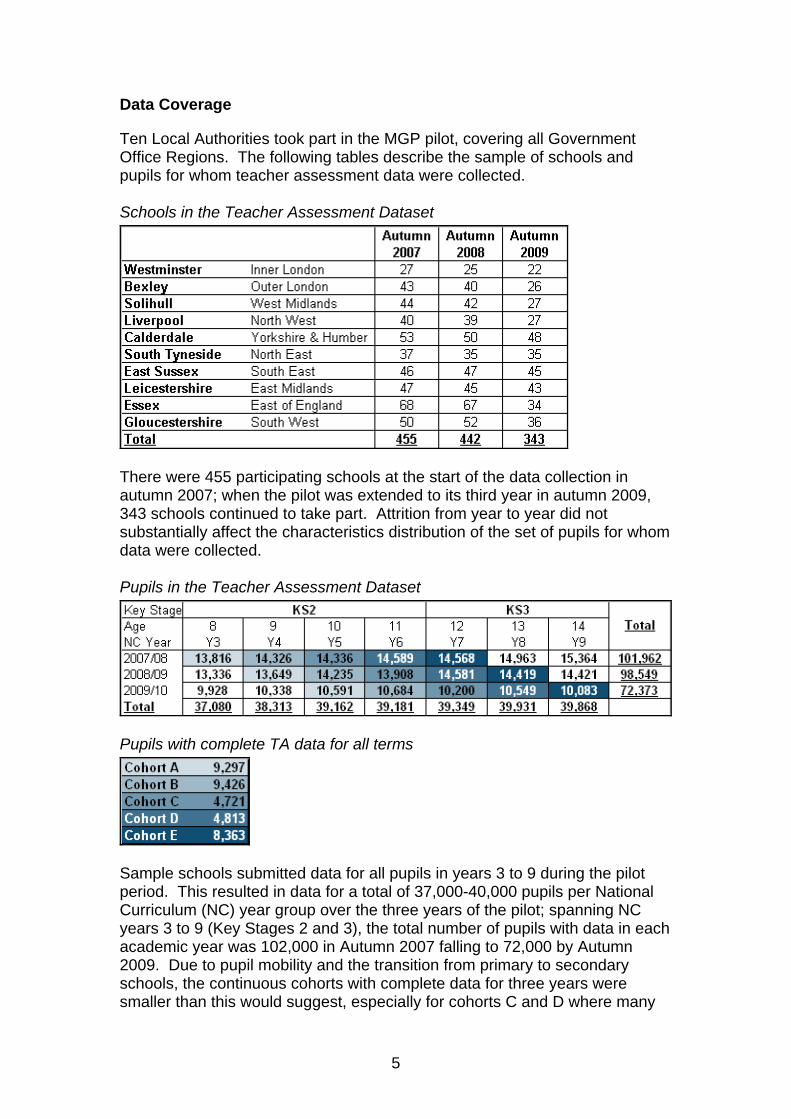
Ten Local Authorities took part in the MGP pilot, covering all Government Office Regions. The following tables describe the sample of schools and pupils for whom teacher assessment data were collected. Schools in the Teacher Assessment Dataset
There were 455 participating schools at the start of the data collection in autumn 2007; when the pilot was extended to its third year in autumn 2009, 343 schools continued to take part. Attrition from year to year did not substantially affect the characteristics distribution of the set of pupils for whom data were collected. Pupils in the Teacher Assessment Dataset
Pupils with complete TA data for all terms
Sample schools submitted data for all pupils in years 3 to 9 during the pilot period. This resulted in data for a total of 37,000-40,000 pupils per National Curriculum (NC) year group over the three years of the pilot; spanning NC years 3 to 9 (Key Stages 2 and 3), the total number of pupils with data in each academic year was 102,000 in Autumn 2007 falling to 72,000 by Autumn 2009. Due to pupil mobility and the transition from primary to secondary schools, the continuous cohorts with complete data for three years were smaller than this would suggest, especially for cohorts C and D where many
5

pupils had moved in/out of schools participating in the pilot when they progressed to secondary school. A total of 37,000 pupils had a complete three year Teacher Assessment data set. Representativeness of the Sample
The sample were broadly representative of pupils in years 3-9 nationally, in terms of deprivation, gender, special educational needs, and the proportion with first languages other than English. At the beginning of the data collection, the sample pupils lived in slightly more affluent areas and contained a slightly higher proportion of boys than the national picture; by Autumn 2009, following attrition, the remaining sample pupils lived in slightly more deprived areas, still contained a slightly higher proportion of boys, and had slightly more non-statemented special educational needs than was the case nationally. Primary schools in the sample had average Key Stage 1-2 progression rates (the percentage of pupils making 2 levels of progress over the Key Stage) for 2007 that were the same as those for maintained mainstream schools nationally. Secondary schools in the sample had average Key Stage 2-3 progression rates that were a little lower than the national rates for maintained mainstream schools. The difference was larger for maths progression than English progression, but the English progression difference grew slightly as the sample shrank in the final year, whereas the maths progression difference
6
did not. Whilst the differences in pupil characteristics and progression rates between the sample and maintained mainstream schools in England should be born in mind when considering the analyses which follow, they are not so large as to bring into question the validity of the patterns of progress which are presented in chapters 1-5. The main point worth keeping in mind is the slightly higher progression rates in secondary schools nationally, for maths in particular. If it were possible to analyse complete national data on a termly basis, we might expect to see slightly more progress between Key Stages 2 and 3 than is manifested in the sample.
Teacher Assessments
Schools in the sample were encouraged to use assessment criteria grids providing descriptors at each National Curriculum level for each assessment strand within the three subjects (reading, writing and maths). The criteria used form part of nationally available materials for Assessing Pupil Progress (APP). Some cross-school moderation activities are known to have taken place organised within each pilot LA, however, concerns were expressed about the quality of the earlier sets of teacher assessments, and the quality was felt to have improved as the process bedded in over the pilot period.2 Comparing teacher assessment levels reported in the summer terms with their corresponding Key Stage 2 or 3 test levels (for those subsets of the sample with National Curriculum tests that year) confirms that the two forms of measurement do not result in allocation to the same level for all pupils (see TA annex). Discrepancies between the teacher assessments and the test levels may be partly accounted for by differences in timing between the two measures. In this paper, National Curriculum test levels (KS2) and end of Key Stage teacher assessments (KS1) are used to establish the prior attainment of pupils for some analyses, and these are used to categorise pupils and the (teacher assessment derived) progress they have made by starting level.
2 PWC (2010) DCSF-RR184 Evaluation of the Making Good Progress Pilot http://www.education.gov.uk/publications/RSG/publicationDetail/Page1/DCSF-RR184
7

1 When do Key Stage 2 and 3 Pupils Make Most Progress in English and Maths?
Key Findings • Pupils make most progress during the summer term and least progress
during the autumn term. • More progress is made per year in Key Stage 2 than Key Stage 3 in all
three subjects, but especially in reading and writing.
1.1 Attainment and Progress in National Curriculum Key Stages 2 and 3
Pupils' attainment is assessed in relation to the National Curriculum programmes of study3, and pupils are awarded levels on the National Curriculum scale to reflect their attainment. An attainment target sets out the “knowledge, skills and understanding that pupils of different abilities and maturities are expected to have by the end of each Key Stage” as defined by the Education Act 1996. Attainment targets consist of eight level descriptions of increasing difficulty, plus a description for exceptional performance above level 8. Each level description describes the types and range of performance that pupils working at that level should demonstrate. The level descriptions provide the basis for making judgements about pupils’ performance at the end of Key Stages 1, 2 and 3. The National Curriculum standards have been designed so that most pupils will progress approximately one level every two years. Range of levels within which the great Expected attainment for the majority majority of pupils are expected to work of pupils at the end of the Key Stage Key Stage 1 1–3 at age 7 2 Key Stage 2 2–5 at age 11 4 Key Stage 3 3–7 at age 14 5/6 Source: The National Curriculum: Handbook for primary teachers in England. The progress made by a pupil between terms or years is calculated from the difference between the National Curriculum levels at either end of the period in question. Teacher assessments submitted by schools in the pilot were provided at sub-level. Progress is then calculated in sub-levels per term, for autumn to spring, spring to summer and summer to autumn. Teacher Assessments were conducted towards the end of each term, meaning that summer-autumn progress would tend to reflect learning in the autumn term; autumn-spring progress, learning in the spring term; and spring-
3 The National Curriculum in England is currently under review, with new programmes of study expected to be announced during 2012: http://www.education.gov.uk/schools/teachingandlearning/curriculum/nationalcurriculum/
8

summer progress, learning in the summer term. Summer-autumn progress may be affected by the intervening summer break, requiring pupils to retain their learning from the previous academic year over several weeks away from school. The spring term is typically a few days shorter than the autumn or summer terms, giving a little less time for teaching and learning to take place.
1.2 Progress by Term
Figure 1.1 gives distributions of progress made by pupils in each subject between school terms. For reading, writing and maths, more pupils progress to a higher attainment sub-level between the spring and summer terms, and fewer do so between the summer and autumn terms. This is likely to be linked to the summer break, and to the transition to the next year group which usually corresponds to a new teacher in primary schools; a teacher who is just getting to know their class may have less information about what each pupil can achieve on which to base their assessment. Pupils are also more likely to fall backwards, or regress, to a lower sub-level between the summer and autumn terms, while the greatest number make more than one sub-level of progress between spring and summer. The proportion of pupils making progress is slightly higher in maths and slightly lower in reading; however the variation in progress between terms is greatest for reading, with almost double the number of pupils falling backwards between the summer and autumn terms as between the other terms.
9

The largest differences between summer to autumn progress and the other termly comparisons are for the proportions of pupils making one sub-level of progress, which are around 10% lower for summer to autumn; the differences between autumn to spring and spring to summer progress are more about the proportions of pupils moving forward by two or more sub-levels.
Figure 1.1: Distribution of pupils making progress in summer, autumn and spring terms for reading, writing and maths.
0%
10%
20%
30%
40%
50%
60%
70%
80%
90%
100%
Summer toAutumn
Autumn toSpring
Spring toSummer
Summer toAutumn
Autumn toSpring
Spring toSummer
Summer toAutumn
Autumn toSpring
Spring toSummer
Reading Writing Maths
Subject and term
Perc
enta
ge o
f pup
ils
2+ sub levels progress1 sub level progressNo progressWent backwards
Progress per term:
Figure 1.2 illustrates the distribution of pupil progress in reading for years 3-9; equivalent charts for writing and maths appear in annex 1. The probability of dropping backwards to a lower sub-level is greatest between summer of year 6 and autumn of year 7. In reading, nearly 40% of children go backwards between the end of year 6 and the beginning of year 7, which is around twice the proportion for writing or maths, or in any other term for reading. For most pupils, this is the transition between primary and secondary school, the exception being those in middle school systems. It may be that teachers in secondary schools tend towards a “stricter” application of the criteria for each attainment sub-level, and/or that it takes time for pupils to demonstrate the necessary skills and knowledge to new teachers who have limited knowledge of their previous schoolwork. In years 7, 8 and 9 (KS3), a larger proportion (10% to 20%) of pupils fall backwards each term compared with years 3-6 (KS2), however the proportion making more than one sub-level of progress is also higher (15% to 25%). This reflects the fact that, historically, there has been greater variation in pupil progress at KS3.4 Turning to what may be driving this, over both KS1-2 and KS2-3, the majority of the variation in pupil progress occurs within schools,
4 DfES (2004) Variation in Pupil Progress (see Table 7.7): http://www.education.gov.uk/rsgateway/DB/SBU/b000481/index.shtml
10

rather than between schools, indicating individual factors are at play. However, the total variance in value-added progress measures increases by 84% between the two Key Stages, which is large enough to result in a 23% increase in variation linked to school factors, as well as a greater increase in variation linked to individual pupil factors. Hence, the larger number of pupils with high or low progress during terms in KS3 (compared with KS2) seen in figure 1.2 may be linked to larger differences in what individual secondary schools achieve with their pupils, as well as larger differences in the prior attainment levels of KS3 pupils. The differences in progress between terms are larger during KS2, with the percentage making progress ranging from around 30% for summer to autumn to around 60% for spring to summer, while the percentage ranges from around 45% to around 50% in KS3. In writing and maths, the transition from one school year to the next sees more pupils fail to progress during KS2 than is the case over the transition from primary to secondary school. The proportions failing to progress in reading over the transition from one school year to the next are similar within KS2 to those of the year 6/7 Key Stage transition. More progress is made per term during KS2 than during KS3. During KS3 less than half of pupils progress to a higher sub-level in any particular term in reading and writing, and there are only two terms (out of nine) when more than half make progress in maths. The National Curriculum expectation translates to 1 sub-level per 2 terms, so an individual pupil is not necessarily expected to make measured progress every term. See chapter 5 for further analysis of expected progress. Figure 1.2: Distribution of pupils making progress in reading for each term of
each year.
0%
10%
20%
30%
40%
50%
60%
70%
80%
90%
100%
Autu
mn
to S
prin
g
Sprin
g to
Sum
mer
Sum
mer
to A
utum
n
Autu
mn
to S
prin
g
Sprin
g to
Sum
mer
Sum
mer
to A
utum
n
Autu
mn
to S
prin
g
Sprin
g to
Sum
mer
Sum
mer
to A
utum
n
Autu
mn
to S
prin
g
Sprin
g to
Sum
mer
Sum
mer
to A
utum
n
Autu
mn
to S
prin
g
Sprin
g to
Sum
mer
Sum
mer
to A
utum
n
Autu
mn
to S
prin
g
Sprin
g to
Sum
mer
Sum
mer
to A
utum
n
Autu
mn
to S
prin
g
Sprin
g to
Sum
mer
3 4 5 6 7 8 9
Year and term
Perc
enta
ge o
f pup
ils
2+ sub levels progress1 sub level progressNo progressWent backwards
Progress per term:
11
1.3 Progress by National Curriculum Year Group
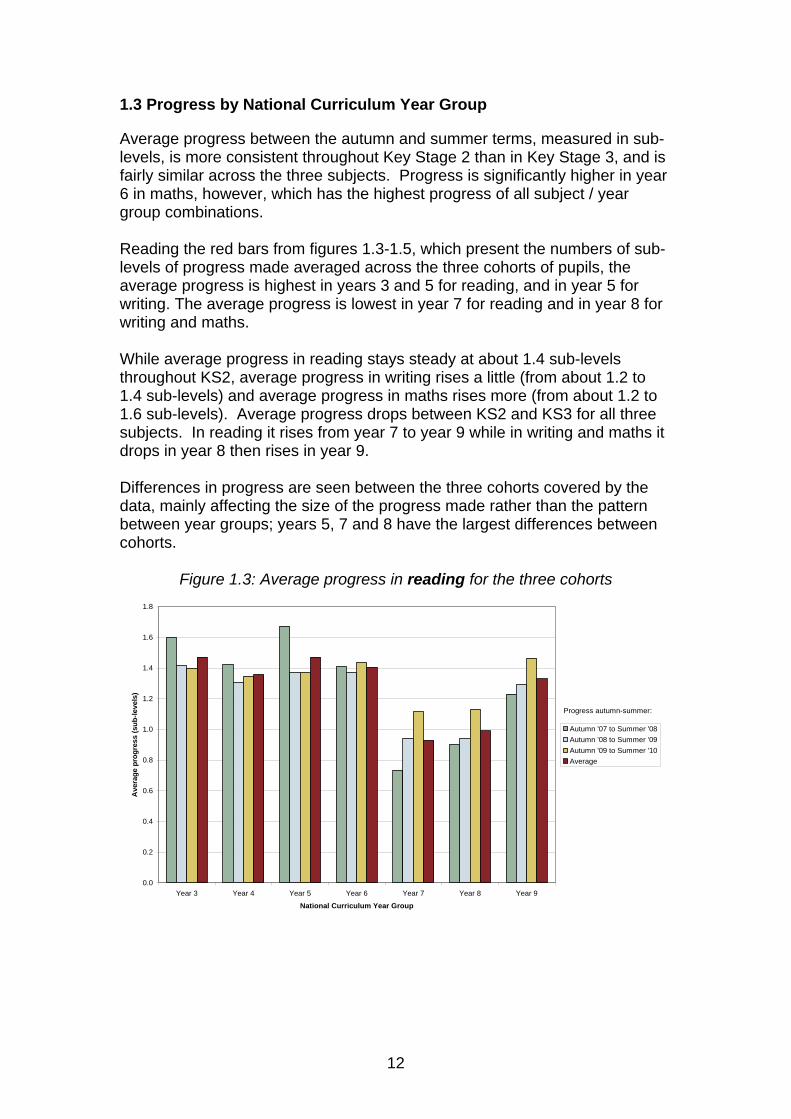
Average progress between the autumn and summer terms, measured in sub-levels, is more consistent throughout Key Stage 2 than in Key Stage 3, and is fairly similar across the three subjects. Progress is significantly higher in year 6 in maths, however, which has the highest progress of all subject / year group combinations. Reading the red bars from figures 1.3-1.5, which present the numbers of sub-levels of progress made averaged across the three cohorts of pupils, the average progress is highest in years 3 and 5 for reading, and in year 5 for writing. The average progress is lowest in year 7 for reading and in year 8 for writing and maths. While average progress in reading stays steady at about 1.4 sub-levels throughout KS2, average progress in writing rises a little (from about 1.2 to 1.4 sub-levels) and average progress in maths rises more (from about 1.2 to 1.6 sub-levels). Average progress drops between KS2 and KS3 for all three subjects. In reading it rises from year 7 to year 9 while in writing and maths it drops in year 8 then rises in year 9. Differences in progress are seen between the three cohorts covered by the data, mainly affecting the size of the progress made rather than the pattern between year groups; years 5, 7 and 8 have the largest differences between cohorts.
Figure 1.3: Average progress in reading for the three cohorts
0.0
0.2
0.4
0.6
0.8
1.0
1.2
1.4
1.6
1.8
Year 3 Year 4 Year 5 Year 6 Year 7 Year 8 Year 9
National Curriculum Year Group
Ave
rage
pro
gres
s (s
ub-le
vels
)
Autumn '07 to Summer '08Autumn '08 to Summer '09Autumn '09 to Summer '10Average
Progress autumn-summer:
12

Figure 1.4: Average progress in writing for the three cohorts
0.0
0.2
0.4
0.6
0.8
1.0
1.2
1.4
1.6
1.8
Year 3 Year 4 Year 5 Year 6 Year 7 Year 8 Year 9
National Curriculum Year Group
Ave
rage
pro
gres
s (s
ub-le
vels
)
Autumn '07 to Summer '08Autumn '08 to Summer '09Autumn '09 to Summer '10Average
Progress autumn-summer:
Figure 1.5: Average progress in maths for the three cohorts
0.0
0.2
0.4
0.6
0.8
1.0
1.2
1.4
1.6
1.8
Year 3 Year 4 Year 5 Year 6 Year 7 Year 8 Year 9
National Curriculum Year Group
Ave
rage
pro
gres
s (s
ub-le
vels
)
Autumn '07 to Summer '08Autumn '08 to Summer '09Autumn '09 to Summer '10Average
Progress autumn-summer:
13
2 How Does Pupil Prior Attainment Influence Subsequent Progress?
Key Findings • Pupils who were behind at the previous Key Stage are less likely to make
progress than those who had achieved the expected level or above. • Differences in progress by prior attainment were largest for maths.
2.1 Subject Progress by Prior Attainment
Pupils within a given year group have varied starting points for the progress they make, depending on their levels of prior attainment. The data show that the amount of progress pupils make each term varies depending on whether they were above, at or below the expected level at the previous Key Stage; the differences were larger for maths progress than for reading or writing. Figure 2.1 shows that over all terms in KS2 and KS3 as a whole, in writing and maths, those pupils who were ahead are most likely to progress, while those who were behind are least likely to progress. In reading, while those who were behind are still least likely to progress, those who were at the expected level are slightly more likely to progress than those who were ahead.
14

Those who were behind are the most likely prior attainment group to drop backwards, but in reading, are also the most likely to make more than one sub-level of progress; however in writing and maths those who were ahead are the most likely group to make more than one sub-level of progress.
Figure 2.1: Distribution of pupils who are ahead, at the expected level and behind making progress in reading, writing and maths
0%
10%
20%
30%
40%
50%
60%
70%
80%
90%
100%
Ahead Expected Behind Ahead Expected Behind Ahead Expected Behind
Reading Writing Maths
Attainment at previous Key Stage
Perc
enta
ge o
f pup
ils
2+ sub levels progress1 sub level progressNo progressWent backwards
Progress per term:
2.2 Yearly Progress by Prior Attainment
Figures 2.2, 2.3 and 2.4 present a more detailed analysis of progress by prior attainment and year group. The dominant pattern in reading, with pupils who started the Key Stage below the expected level of attainment being less likely to progress than other pupils, and more likely to fall further behind, but also a little more likely to make three or more levels of progress, holds true for years 4-6 and 8. In year 9, these pupils were less likely to make 3+ levels of progress, as well as less likely to make any progress. The only year which diverged from these patterns of lesser progress for low prior attainers was year 7, where there was a significant degree of “catching up”, and pupils with higher prior attainment made less progress than those with lower prior attainment; this was the strongest prior attainment effect, although confined to a single year. The divergence from the norm in year 7 may be influenced by the proximity to the validated national results from Key Stage 2 testing, and/or by differences in expectations of what constitutes level 4 or 5 performance between primary and secondary school teachers. The dominant pattern in writing and maths, with lower progress the lower a pupil’s prior attainment, held true in years 5, and 8-9 in writing, and in all years except year 6 in maths. There were also some years where pupils who started the Key Stage behind the expected level were a little more likely to
15

make 3 or more sub levels of progress, but still less likely to make progress overall: years 4 and 6 in writing and year 6 in maths. Year 7 shows a degree of catching up by low prior attainers, and lower progress by high prior attainers in writing, but the effect is not as large as in reading; there is no catching up in year 7 in maths, and overall maths has the strongest progress advantage for pupils who began the Key Stage at or ahead of the expected level of attainment.
Figure 2.2: Distribution of pupils who are ahead, at the expected level and behind making progress in reading for each year.
0%
10%
20%
30%
40%
50%
60%
70%
80%
90%
100%
Abo
ve K
S1
L2
At K
S1
L2
Bel
ow K
S1
L2
Abo
ve K
S1
L2
At K
S1
L2
Bel
ow K
S1
L2
Abo
ve K
S1
L2
At K
S1
L2
Bel
ow K
S1
L2
Abo
ve K
S2
L4
At K
S2
L4
Bel
ow K
S2 L
4 (N
,2,3
)
Bel
ow K
S2 L
4 (B
,T)
Abo
ve K
S2
L4
At K
S2
L4
Bel
ow K
S2 L
4 (N
,2,3
)
Bel
ow K
S2 L
4 (B
,T)
Abo
ve K
S2
L4
At K
S2
L4
Bel
ow K
S2 L
4 (N
,2,3
)
Bel
ow K
S2 L
4 (B
,T)
Y4 Y5 Y6 Y7 Y8 Y9
4+ sub levels3 sub levels2 sub levels1 sub levelNo ProgressWent Backwards
Progress per year:
Figure 2.3: Distribution of pupils who are ahead, at the expected level and behind making progress in writing for each year.
0%
10%
20%
30%
40%
50%
60%
70%
80%
90%
100%
Abo
ve K
S1
L2
At K
S1
L2
Bel
ow K
S1
L2
Abo
ve K
S1
L2
At K
S1
L2
Bel
ow K
S1
L2
Abo
ve K
S1
L2
At K
S1
L2
Bel
ow K
S1
L2
Abo
ve K
S2
L4
At K
S2
L4
Bel
ow K
S2 L
4 (N
,2,3
)
Bel
ow K
S2 L
4 (B
,T)
Abo
ve K
S2
L4
At K
S2
L4
Bel
ow K
S2 L
4 (N
,2,3
)
Bel
ow K
S2 L
4 (B
,T)
Abo
ve K
S2
L4
At K
S2
L4
Bel
ow K
S2 L
4 (N
,2,3
)
Bel
ow K
S2 L
4 (B
,T)
Y4 Y5 Y6 Y7 Y8 Y9
4+ sub levels3 sub levels2 sub levels1 sub levelNo ProgressWent Backwards
Progress per year:
16

Figure 2.4: Distribution of pupils who are ahead, at the expected level and behind making progress in maths for each year.
0%
10%
20%
30%
40%
50%
60%
70%
80%
90%
100%
Abo
ve K
S1
L2
At K
S1
L2
Bel
ow K
S1
L2
Abo
ve K
S1
L2
At K
S1
L2
Bel
ow K
S1
L2
Abo
ve K
S1
L2
At K
S1
L2
Bel
ow K
S1
L2
Abo
ve K
S2
L4
At K
S2
L4
Bel
ow K
S2 L
4 (N
,2,3
)
Bel
ow K
S2 L
4 (B
,T)
Abo
ve K
S2
L4
At K
S2
L4
Bel
ow K
S2 L
4 (N
,2,3
)
Bel
ow K
S2 L
4 (B
,T)
Abo
ve K
S2
L4
At K
S2
L4
Bel
ow K
S2 L
4 (N
,2,3
)
Bel
ow K
S2 L
4 (B
,T)
Y4 Y5 Y6 Y7 Y8 Y9
4+ sub levels3 sub levels2 sub levels1 sub levelNo ProgressWent Backwards
Progress per year:
17

3 When do Pupils Reach Expected Levels of Attainment?
Key Findings • The percentages of pupils achieving the expected level, and above the
expected level, increase steadily through KS2 and KS3, with average attainment rising from level 2 in year 3 to level 5 in year 9.
• By the end of year 5, significant proportions of pupils have already reached the expected level for the end of Key Stage 2: 62% in reading, 44% in writing, and 52% in maths. By the end of year 8, 66% have achieved the end of Key Stage 3 expected level in reading, as have 65% in writing, and 70% in maths.
• However, the rate of progress by high attainers in reading and writing is slower than expected during Key Stage 3: in reading, almost 30% of pupils begin the Key Stage at the expected level (L5), but only around 20% have reached the next level (L6) after two more years of schooling.
Pupils are expected to reach level 4 by the end of KS2 and level 5 or 6 by the end of KS3. In this note, following the precedent of historical Statistical First Releases, level 5 is used for the expected level for KS3. Many pupils reach this level before the end of the Key Stage; others do not reach the level at all. The expected levels are based on the standards that the majority of pupils of that age should attain.
3.1 Average Levels of Attainment
Figure 3.1 shows that the average level achieved by pupils increased continuously from the beginning of year 3 to the end of year 9, with the exception of reading where there is a noticeable drop between summer of year 6 and autumn of year 7. This might suggest a possible discontinuity in teachers’ expectations of reading standards between primary and secondary schools, or some short-term gains in the run-up to the KS2 tests, which are not sustained through the transition from primary to secondary school.
18

Interestingly, examining average reading levels only for pupils in Leicestershire, where there is a middle school system, shows only a very slight dip in average reading levels in the autumn of year 7, and a reduction between summer of year 5 and autumn of year 6 where the transition from junior to middle school takes place; this is smaller than the autumn year 7 dip across all 10 LAs, but larger than the autumn year 7 dip for Leicestershire.
Figure 3.1: Average levels at each term for reading, writing and maths.
0
1
2
3
4
5
6
Aut
umn
Sprin
g
Sum
mer
Aut
umn
Sprin
g
Sum
mer
Aut
umn
Sprin
g
Sum
mer
Aut
umn
Sprin
g
Sum
mer
Aut
umn
Sprin
g
Sum
mer
Aut
umn
Sprin
g
Sum
mer
Aut
umn
Sprin
g
Sum
mer
Year 3 Year 4 Year 5 Year 6 Year 7 Year 8 Year 9
Year and term
Ave
rage
leve
l
ReadingWritingMaths
3.2 Distribution of Sub-levels of Attainment
Figure 3.2 illustrates the distribution of pupils across individual sub-levels of attainment in reading for each year group; equivalent charts for writing and maths appear in annex 3. There is a fairly even distribution of sub-levels in the middle of the range across the terms, each accounting for about 15% of pupils, with the percentage at both ends of the range trailing off to zero. The percentage at each sub-level is larger at the beginning of year 3 and gradually decreases until the end of year 9, where there is more variation between the pupils. This is especially the case in maths, where there is less variation than in reading and writing in year 3 and more in year 9. These figures show the same steady and continuous increase in the levels achieved throughout years 3 to 9, with the exception of the drop between summer of year 6 and autumn of year 7 in reading. In reading, more than half of pupils have reached level 4 by summer of year 5; in writing this is spring of year 6, and in maths, autumn of year 6. Half of pupils reach level 5 by spring of year 8 in reading and writing and by summer of year 7 in maths. Half of pupils reach level 6 by summer of year 9 in maths; however fewer than half of pupils have reached this level in reading and writing by the end of year 9.
19

Figure 3.2: Distribution of pupils at each sub-level in reading for each term.
0%
10%
20%
30%
40%
50%
60%
70%
80%
90%
100%
Aut
umn
Sprin
g
Sum
mer
Aut
umn
Sprin
g
Sum
mer
Aut
umn
Sprin
g
Sum
mer
Aut
umn
Sprin
g
Sum
mer
Aut
umn
Sprin
g
Sum
mer
Aut
umn
Sprin
g
Sum
mer
Aut
umn
Sprin
g
Sum
mer
Year 3 Year 4 Year 5 Year 6 Year 7 Year 8 Year 9
Year and term
Perc
enta
ge o
f pup
ils
E8A8B8C7A7B7C6A6B6C5A5B5C4A4B4C3A3B3C2A2B2C1A1B1CW
3.3 Expected Levels of Attainment, Key Stage 2
Figure 3.3 shows that a small minority of pupils are already at the expected level in writing for the end of KS2 at the beginning of the Key Stage, and that the percentage achieving this level increases steadily and continuously throughout KS2. A minority of pupils achieving above the expected level begins to be seen from half way through the Key Stage.
20

The percentage of pupils achieving the expected level follows a similar pattern, but is consistently higher, in reading and maths than in writing (the depicted subject), as does the percentage achieving above the expected level. Equivalent charts for reading and maths appear in annex 3.
Figure 3.3: Percentage of pupils achieving expected level and above expected level in writing for each term in KS2.
0%
10%
20%
30%
40%
50%
60%
70%
80%
90%
100%
Aut Spr Sum Aut Spr Sum Aut Spr Sum Aut Spr Sum
Year 3 Year 4 Year 5 Year 6
Year and term
Perc
enta
ge o
f pup
ils
Expected level or above Above expected level
3.4 Expected Levels of Attainment, Key Stage 3
Figures 3.4, 3.5 and 3.6 present the cumulative increase in the proportion of pupils who have achieved levels 5 and 6 for each subject, over the course of Key Stage 3. The percentage achieving at and above the expected level does not increase as steadily in KS3. Between summer of year 8 and autumn of year 9 the percentage of pupils achieving the expected level drops in reading and writing. A significant proportion of pupils begin the Key Stage at the expected level for the end of year 9 – about 30% in reading, 25% in writing and 35% in maths. This rises to about 80% in each subject at the end of KS3. There is a small minority achieving above the expected level at the beginning of KS3, and this rises to nearly 40% in reading and writing and over 50% in maths by the end of KS3. However, apart from in maths, which has the highest percentages of pupils achieving levels 5 and 6, the progress made by those who began the Key Stage with the highest levels of attainment is slower than might be expected. For example, in reading, almost 30% of pupils begin the Key Stage at the expected level (L5), but only around 20% have reached the next level up (L6) after two more years of schooling; so about one third of the pupils who started
21

out as high attainers have failed to keep pace with an expectation of one sub-level of progress every two terms.
Figure 3.4: Percentage of pupils achieving expected level and above expected level in reading for each term in KS3.
0%
10%
20%
30%
40%
50%
60%
70%
80%
90%
100%
Aut Spr Sum Aut Spr Sum Aut Spr Sum
Year 7 Year 8 Year 9
Year and term
Perc
enta
ge o
f pup
ils
Expected level or above Above expected level
Figure 3.5: Percentage of pupils achieving expected level and above expected level in writing for each term in KS3.
0%
10%
20%
30%
40%
50%
60%
70%
80%
90%
100%
Aut Spr Sum Aut Spr Sum Aut Spr Sum
Year 7 Year 8 Year 9
Year and term
Perc
enta
ge o
f pup
ils
Expected level or above Above expected level
22

Figure 3.6: Percentage of pupils achieving expected level and above expected level in maths for each term in KS3.
0%
10%
20%
30%
40%
50%
60%
70%
80%
90%
100%
Aut Spr Sum Aut Spr Sum Aut Spr Sum
Year 7 Year 8 Year 9
Year and term
Perc
enta
ge o
f pup
ils
Expected level or above Above expected level
23

4 Pupil Characteristics and Progress
Key Findings • Boys are less likely to make progress than girls in all three subjects; the
differences are larger during Key Stage 3, when the probability of progressing each year decreases more for boys than for girls. Maths has the smallest gender progress differences, and reading has the largest.
• The gaps in attainment widen between pupils known to be eligible for Free School Meals (FSM) and their peers as there are greater differences in progress in years 4 and 5 during Key Stage 2, although pupils with FSM also make less progress during Key Stage 3. Reading has the smallest FSM progress differences, and maths has the largest.
• The widening of the attainment gaps between pupils with Special Educational Needs (SEN) and their peers is spread across both Key Stages, with similar differences in progress in years 4-5 as in years 8-9; interestingly, in year 7, when the gap is actually narrowing in reading and writing, it continues to grow in maths at a faster rate than any other year.
• Chinese pupils progress the most, especially in maths; unlike other ethnic groups who may be “catching up” during KS2 and 3, Chinese pupils are already ahead of White pupils in attainment of the expected levels at Key Stage 1.
• Asian pupils also make more progress than White pupils, but this is concentrated in Key Stage 2, with their progress slowing to be more in line with other pupils in the latter part of Key Stage 3. Black pupils show a tendency for polarized progress performance in Key Stage 3, with more failing to progress, as well as more making three or more sub-levels of progress per year (compared with White pupils).
• Pupils with English as an Additional Language (EAL) make more sub-levels of progress than other pupils in all years in all three subjects. This represents “catching up” with other pupils, who tend to have higher prior attainment levels at Key Stage 1. The biggest difference is in reading, with smaller differences in writing and maths.
24

4.1 Gender
Figures 4.1, 4.2 and 4.3 present the yearly progress made by boys compared with girls in reading, writing and maths. Boys are less likely to make progress than girls in all three subjects. The differences are larger during Key Stage 3, when the probability of progressing each year decreases more for boys than for girls. The gender gap also widens in year 4 for writing and maths. The difference between the proportion of girls and boys making progress each year is generally largest in reading and smallest in maths. Figure 4.1: Distribution of pupils making progress in reading for girls and boys
in each year
0%
10%
20%
30%
40%
50%
60%
70%
80%
90%
100%
Girls Boys Girls Boys Girls Boys Girls Boys Girls Boys Girls Boys
4 5 6 7 8 9
Year
4+ sub levels3 sub levels2 sub levels1 sub levelNo progressWent Backwards
Progress per year:
...Gender Gap Widening
25

Figure 4.2: Distribution of pupils making progress in writing for girls and boys
in each year
0%
10%
20%
30%
40%
50%
60%
70%
80%
90%
100%
Girls Boys Girls Boys Girls Boys Girls Boys Girls Boys Girls Boys
4 5 6 7 8 9
Year
4+ sub levels3 sub levels2 sub levels1 sub levelNo progressWent Backwards
Progress per year:
...Gender Gap Widening
Figure 4.3: Distribution of pupils making progress in maths for girls and boys
in each year
0%
10%
20%
30%
40%
50%
60%
70%
80%
90%
100%
Girls Boys Girls Boys Girls Boys Girls Boys Girls Boys Girls Boys
4 5 6 7 8 9
Year
4+ sub levels3 sub levels2 sub levels1 sub levelNo progressWent Backwards
Progress per year:
...Gender Gap Widening
4.2 Free School Meals (FSM)
On average, pupils who are known to be eligible for Free School Meals (FSM) have lower prior attainment at Key Stage 1 than their peers. Figure 4.4 shows that pupils with FSM tend to make less progress than their peers in maths, and a similar pattern - but with smaller differences - is seen for reading and
26

writing (charts appear in annex 4). The exceptions to this are year 6 in all three subjects and year 7 in reading, when pupils with FSM are more likely than their peers to make two or more sub-levels of progress although similarly likely to make any progress overall. Unlike gender, noticeable differences in the distribution of progress made by pupils known to be eligible for FSM compared with their peers are observed across Key Stage 2 as well as Key Stage 3. The larger differences in progress between pupils with FSM and their peers are in years 4 and 5 during Key Stage 2. Reading has the smallest differences in progress between pupils with FSM and their peers; those for writing are larger, and those for maths are the largest. Figure 4.4: Distribution of pupils making progress in maths for pupils eligible and not eligible for FSM.
0%
10%
20%
30%
40%
50%
60%
70%
80%
90%
100%
FSMEligible
Not FSMEligible
FSMEligible
Not FSMEligible
FSMEligible
Not FSMEligible
FSMEligible
Not FSMEligible
FSMEligible
Not FSMEligible
FSMEligible
Not FSMEligible
4 5 6 7 8 9
Year
4+ sub levels3 sub levels2 sub levels1 sub levelNo progressWent Backwards
Progress per year:
…FSM Gap Widening
…FSM Gap Narrowing
4.3 Special Educational Needs (SEN)
On average, pupils with Special Educational Needs (SEN) will have entered KS2 with lower prior attainment than those without any SEN; although this leaves greater scope to progress, the findings in chapter 2 suggest that this is likely to be associated with lower probabilities of making progress during KS2 and KS3. Figure 4.5 presents the distribution of pupil progress in maths for pupils with and without SEN (see annex 4 for equivalent charts for reading and writing). Pupils recorded as having SEN do make less progress in all years in maths, all except year 7 in writing, and all except years 6 and 7 in reading. They are also more likely to drop backwards, and less likely to make more two or more sub-levels of progress (in the same years). The widening of the attainment gaps between pupils with SEN and their peers is seen across both Key
27
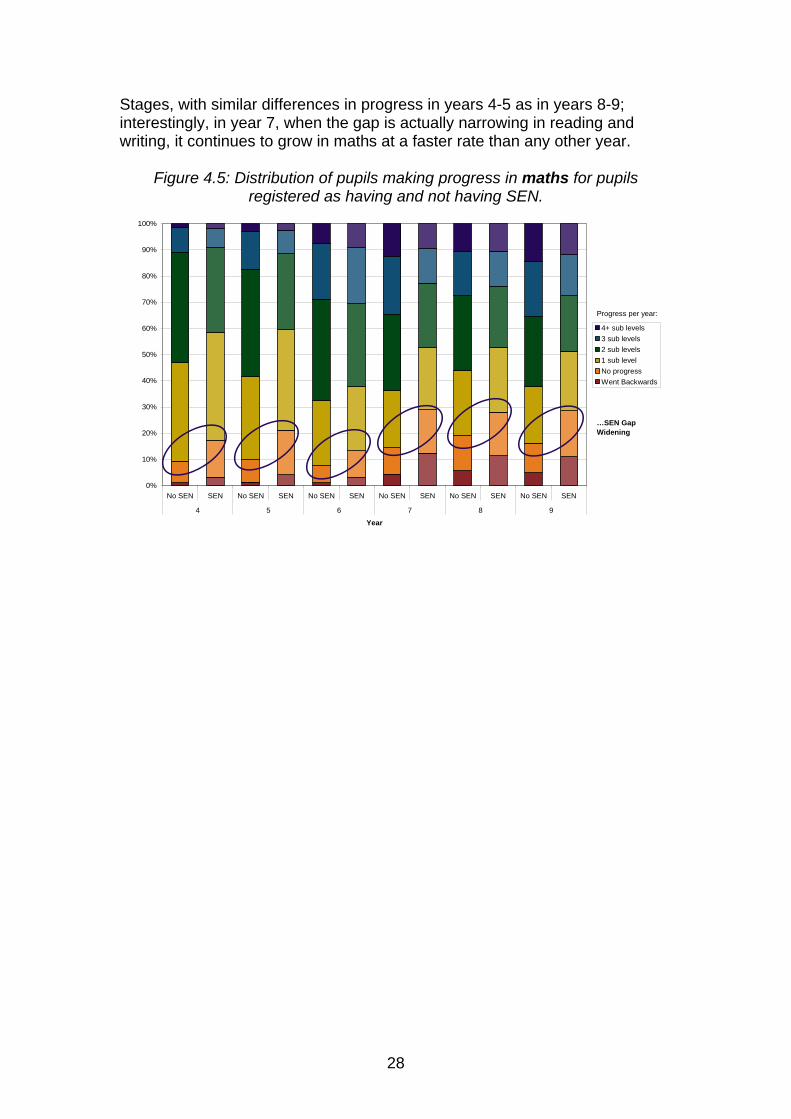
Stages, with similar differences in progress in years 4-5 as in years 8-9; interestingly, in year 7, when the gap is actually narrowing in reading and writing, it continues to grow in maths at a faster rate than any other year.
Figure 4.5: Distribution of pupils making progress in maths for pupils registered as having and not having SEN.
0%
10%
20%
30%
40%
50%
60%
70%
80%
90%
100%
No SEN SEN No SEN SEN No SEN SEN No SEN SEN No SEN SEN No SEN SEN
4 5 6 7 8 9
Year
4+ sub levels3 sub levels2 sub levels1 sub levelNo progressWent Backwards
Progress per year:
…SEN Gap Widening
28

Figure 4.6 examines variation within the group of pupils with SEN, displaying the reading progress made according to level of SEN. In most years, pupils with a statement of SEN (those with the greatest need) make less progress than those designated School Action or School Action Plus. The differences are sharpest during Key Stage 2, but persist into years 8 and 9. Year 7 sees a reversal of the pattern in reading, and a mixed pattern in writing with pupils with statements being more likely to drop backwards, or to make 4 or more levels of progress; this mixed pattern occurs in year 8 for maths.
Figure 4.6: Distribution of pupils making progress in reading for pupils registered with different levels of SEN.
0%
10%
20%
30%
40%
50%
60%
70%
80%
90%
100%
Sch
ool A
ctio
n
Sch
ool A
ctio
nPl
us
Sta
tem
ent
Sch
ool A
ctio
n
Sch
ool A
ctio
nPl
us
Sta
tem
ent
Sch
ool A
ctio
n
Sch
ool A
ctio
nPl
us
Sta
tem
ent
Sch
ool A
ctio
n
Sch
ool A
ctio
nPl
us
Sta
tem
ent
Sch
ool A
ctio
n
Sch
ool A
ctio
nPl
us
Sta
tem
ent
Sch
ool A
ctio
n
Sch
ool A
ctio
nPl
us
Sta
tem
ent
4 5 6 7 8 9
Year
4+ sub levels3 sub levels2 sub levels1 sub levelNo progressWent Backwards
Progress per year:
…Within-SEN Gaps Widening
…Witthin-SEN Gaps Narrowing
4.4 Ethnicity
Figure 4.7 illustrates the distribution of progress in writing among pupils of different ethnic backgrounds (see annex 4 for reading and maths charts). Overall, Chinese pupils progress the most, especially in maths; unlike other ethnic groups who may be “catching up” during KS2 and 3, Chinese pupils are already ahead of White pupils in attainment of the expected levels at Key Stage 1, as are pupils with Mixed ethnic backgrounds. In writing, Chinese and Asian pupils make more progress than White pupils in years 4, 5 and 7-9, with Chinese pupils in particular being more likely to make three or more levels of progress in years 8 and 9. Black pupils make comparable progress with White pupils during Key Stage 2, but their progress performance becomes polarized during Key Stage 3, with higher proportions of Black pupils failing to progress, but also higher proportions making 3 or more levels of progress each year. Similar patterns occur in reading, except with some polarization of Asian pupils’ progress performance during Key Stage 3, and a more nuanced
29

progress trajectory for Black pupils. Less progress in writing is made by Black pupils compared with White pupils during years 4 and 5, but greater progress in years 6 and 7; their progress then becomes polarized with more Black pupils failing to progress, but also more making 3 or more levels of progress in years 8 and 9. In maths, Chinese pupils make markedly more progress than other pupils in years 4 and 5; there are smaller differences in the progress made by Asian pupils compared with White pupils at this stage. Moving into Key Stage 3, this continues for Chinese pupils in years 7 and 8, but is moderated by a higher proportion of Chinese pupils not making progress in year 9 (as well as more making two or more levels of progress). The stronger progress made by Asian pupils (than White pupils) begins to fade out towards the end of Key Stage 3. As with writing, Black pupils make comparable progress with White pupils during Key Stage 2, but their progress performance becomes polarized during Key Stage 3. In interpreting these findings, it should be borne in mind that ethnicity effects on attainment are known to be confounded by higher levels of deprivation amongst non-White pupils.
Figure 4.7: Distribution of pupils making progress in writing for pupils of different ethnicities.
0%
10%
20%
30%
40%
50%
60%
70%
80%
90%
100%
Whi
teM
ixed
Asi
anB
lack
Chi
nese
Oth
erW
hite
Mix
edA
sian
Bla
ckC
hine
seO
ther
Whi
teM
ixed
Asi
anB
lack
Chi
nese
Oth
erW
hite
Mix
edA
sian
Bla
ckC
hine
seO
ther
Whi
teM
ixed
Asi
anB
lack
Chi
nese
Oth
erW
hite
Mix
edA
sian
Bla
ckC
hine
seO
ther
4 5 6 7 8 9
Year
4+ sub levels3 sub levels2 sub levels1 sub levelNo progressWent Backwards
Progress per year:
4.5 English as an Additional Language (EAL)
Figure 4.8 presents the distribution of pupil progress in reading for pupils whose first language is not English, compared with those whose first language is English; equivalent charts for writing and maths appear in annex 4. Pupils with English as an Additional Language (EAL) make more progress in all three subjects. This represents “catching up” with other pupils, who tend
30

to have higher prior attainment levels at Key Stage 1. The biggest difference is in reading, with smaller differences in writing and maths. Most of the differences between pupils with and without EAL occur in the proportions making 2 or more sub-levels of progress, rather than at the margin between any progress and no progress. Pupils with EAL tend to be more likely to make more than one sub-level of progress per term, but in years 8 and 9, this becomes mixed with higher proportions dropping backwards over the year.
Figure 4.8: Distribution of pupils making progress in reading for pupils with English as a first or additional language.
0%
10%
20%
30%
40%
50%
60%
70%
80%
90%
100%
Not EAL EAL Not EAL EAL Not EAL EAL Not EAL EAL Not EAL EAL Not EAL EAL
4 5 6 7 8 9
Year
4+ sub levels3 sub levels2 sub levels1 sub levelNo progressWent Backwards
Progress per year:
…EAL Gap Widening
…EAL Gap Narrowing
31

5 Learning Pathways: Individual Progress Patterns over Time
Key Findings • For many pupils, progress during Key Stages 2 and 3 is not linear and
continuous; episodes of regression to an earlier level of attainment, or remaining at the same level for a period, are part of the norm.
• Patterns of progress are highly individual; there is low concentration of pupils into one pathway or another, especially in reading and writing.
• The more progress a pupil made in the previous term, the less likely they are to make progress the following term, and vice versa.
A recurrent theme through chapters 1-4 has been that progress during Key Stages 2 and 3, for many pupils is not linear and continuous, and that episodes of regression to an earlier level of attainment, or remaining at the same level for a period, are not uncommon; the latter are in fact part of the norm. This final chapter proceeds to examine how these individual units of progress (or non-progress), as individual school years or terms, fit together over time into pathways of pupil progress.
5.1 Progress by Prior Progress
Figures 5.1 and 5.2 show that the more progress a pupil made in the previous term, the less likely they are to make any progress in the next term, and the more likely they are to drop backwards. The reverse is also true; over 80% of pupils who dropped backwards the previous term made progress the next term, and over 70% of them made more than one sub-level of progress. The pattern is consistent across subjects and years, with similar distributions occurring for the alternate subject/year group combinations, and also for comparisons of progress in years 4-5 and 7-8 (for additional charts, please see annex 5).
32

These analyses demonstrate that periods of non-progress do not necessarily mean that a pupil will remain stuck at a level indefinitely; they are part of a pattern where mixed pathways including periods of progress and of non-progress are common. Figure 5.1: Distribution of pupils making progress in reading in year 6 based
on their previous progress in year 5.
0%
10%
20%
30%
40%
50%
60%
70%
80%
90%
100%
Went backwards No progress 1 sub level progress 2 sub levels progress 3+ sub levels progress
Previous progress
Perc
enta
ge o
f pup
ils
3+ sub levels progress2 sub levels progress1 sub level progressNo progressWent backwards
Progress per year:
Figure 5.2: Distribution of pupils making progress in writing in year 9 based on their previous progress in year 8.
0%
10%
20%
30%
40%
50%
60%
70%
80%
90%
100%
Went backwards No progress 1 sub level progress 2+ sub levels progress
Previous progress
Perc
enta
ge o
f pup
ils
2+ sub levels progress1 sub level progressNo progressWent backwards
Progress per year:
5.2 Progress Over Three Consecutive Years
The next pair of charts extends the analysis to cover three consecutive years
33

of progress, incorporating years 4-6 in figure 5.3 and the whole of KS3 in figure 5.4. There is a high degree of fragmentation of the cohorts of pupils into many individual progress pathways, or equivalently, a low level of concentration into any one pathway or another. At Key Stage 3, of the 64 possible pathways for reading, only 3 represent 5% or more of the total cohort of pupils in the analysis; two of these three more common pathways include years in which no reading progress was made. For writing, only two of the 64 possible progress pathways during KS3 represent 5% or more of the cohort. These two most common pathways both include years in which progress was not made, as well as years where more than one sub-level of progress was made. Pupils were slightly more concentrated into some pathways rather than others for KS3 maths than was the case for reading or writing, and these were characterised by continuous progress to a greater extent than the most common pathways in the other two subjects. Four of the 64 possible pathways represented 5% or more of the cohort, and 3 of these were made up of three consecutive years where progress in maths was made. At Key Stage 2, the fragmentation of pupils into many different progress trajectories was as strong, with only 3 of the 64 pathways containing at least 5% of the cohort in both reading and maths, and only 2 of 64 pathways representing 5% or more of pupils in writing. All of these more common KS2 pathways were made up of three consecutive years of progress, in all subjects.
34

Nevertheless, episodes of regression to an earlier level of attainment, or remaining at the same level for a period, were by no means uncommon; in fact they were even more prevalent at KS2 than at KS3. Reading pathways with at least one such year were followed by 44% of pupils (37% for writing, 35% for maths). For comparison, at Key Stage 3, 35% of pupils followed a reading pathway including at least one year without progress, as did 30% in writing and 24% in maths. Figure 5.3: Numbers of pupils making each amount of progress in reading in
years 4, 5 and 6 based on their progress in the previous year.
2081 3070 2565 1612
183 481 694 723 335 933 1240 562 365 971 933 296 389 583 485 155
13
19
45
106
15
84
192
190
60
201
258
175
139
250
230
104
14
33
91
197
49
238
364
282
138
455
455
192
139
232
134
57
15
56
122
172
72
302
408
189
174
399
278
82
93
119
61
23
20
93
127
149
64
197
202
120
107
194
139
45
57
68
22
8
1 sub-level progress
Year 4
Year 5
Year 6
Went backwards or no progress 2 sub-levels progress 3+ sub-levels progress
Figure 5.4: Numbers of pupils making each amount of progress in writing in
years 7, 8 and 9 based on their progress in the previous year.
1187 2561 2143 2393
54 99 190 844 205 451 615 1290 186 433 636 888 508 612 621 652
1
1
2
50
1
9
17
72
7
15
31
137
73
144
197
430
1
9
22
173
11
52
88
300
17
54
162
382
102
237
349
602
3
8
22
153
13
56
106
258
12
121
197
306
80
228
264
316
13
68
80
347
25
125
125
337
54
131
178
258
81
182
192
197
Year 7
Year 8
Year 9
Went backwards No progress 1 sub-level progress 2+ sub-levels progress
35

5.3 Key Stage 3 Movement between Levels
Figure 5.5 maps the progress of pupils from the start of year 7 to the end of year 9 in maths. A minority of pupils drop backwards whole levels between years, with a few pupils dropping backwards more than one level. There are also some pupils who progress by more than one level, especially between year 8 and year 9. In maths, 11% of pupils ended the Key Stage with a summer year 9 teacher assessment at the same level that they had started at in autumn of year 7 (or remaining either below level 3 or above level 6); this was more common in reading (15%) and writing (13%). Focusing on achievement of level 6 in maths at the end of the Key Stage, a significant proportion of pupils who achieved this were already at level 5 at the beginning of year 7; however, the greatest proportion of level 6 achievers began the Key Stage at level 4, had reached level 5 by the end of year 7, and made the transition to level 6 during year 9. In reading and writing, most eventual level 6 achievers were already at level 5 at the start of year 7. Switching the focus to pupils who achieved above level 6 in maths, the greatest proportion started the Key Stage at level 5, reached level 6 in year 7 or 8, then reached level 7 in year 9. There were smaller numbers of eventual level 7 achievers in reading and writing, and these had mostly started at level 5 and reached level 6 during year 7 rather than year 8, then reached level 7 in year 9. Equivalent mappings for reading and writing can be found in annex 5; there are fewer pupils at the extremes – with very high or very low levels – in reading and writing than in maths.
Figure 5.5: Mapping of number of pupils achieving each level in maths in years 7, 8 and 9 and numbers of pupils moving between each level.
36

5.4 Consecutive Progress
Figure 5.6 considers continuous progress in reading on a termly basis. Continuous progress on a termly basis would be a stronger expectation than the National Curriculum sets out, but is presented here for completeness. Figures 5.7 and 5.8 then develop the analysis to examine expected progress using one sub-level every two terms as a rule of thumb to define the expectation, which sums to approximately two full levels per Key Stage. Figure 5.6 shows that only a very small minority of pupils make reading progress every term over the three years. Approximately 40% of pupils make progress two consecutive terms, fewer than 20% make progress three consecutive terms and fewer than 5% make progress in four consecutive terms. Equivalent charts for writing and maths appear in annex 5.
Figure 5. 6: Consecutive progress in reading each term.
Continuous Reading Progress Each Term
0
6,000
12,000
18,000
24,000
30,000
36,000
Autumn 07(T1)
Spring 08(T2)
Summer 08(T3)
Autumn 08(T4)
Spring 09(T5)
Summer 09(T6)
Autumn 10(T7)
Spring 10(T8)
Term
MG
P C
ohor
t Pup
ils
progressed continuously from T8progressed continuously from T7progressed continuously from T6progressed continuously from T5progressed continuously from T4progressed continuously from T3progressed continuously from T2progressed continuously from T1
5.5 Uninterrupted Progress
The following pair of charts compares expected progress (one sub-level per two terms) according to two alternative definitions. The unbroken green lines show how many pupils continue to make expected progress continuously each two terms, and without any interruptions to their progress. The dashed lines contrast this with the much greater number who have made enough progress, net of any extra progress, stalls or regressions, to remain on track to meet the 2 levels of progress over the whole Key Stage, but not necessarily in the continuous linear pattern of the first group. Generally, across reading, writing, and maths over Key Stages 2 and 3, the number of pupils making progress continuously is much smaller than the number making the same progress by stalling or dropping behind in some
37

term but making extra progress in others. This illustrates the stark difference between an assumption of continuous linear progress and the more complex reality for the majority of pupils, of achieving the expected amount of progress, but by a multitude of different progress pathways. Figure 5.7 shows that fewer than 800 pupils make progress continuously in writing through years 4 to 6 compared with over 7,500 pupils making the same or more progress on average through this period.
Figure 5.7: Cumulative and Snapshot of progress in writing in years 4 to 6.
Year 4-6 Writing Progress (Cumulative and Snapshot)
0
1,000
2,000
3,000
4,000
5,000
6,000
7,000
8,000
9,000
T1 - T3 T3 - T5 T5 - T7 T7 - T9
Progress Every Two Terms
MG
P C
ohor
t Pup
ils
RegressedNo ProgressExpected ProgressExtra Progress
Bars Show Snapshot Progress For Two Terms
Lines Show Cumulative Progress Each Two
(end
Continuous Linear Progress
Net Cumulative Progress
38

Figure 5.8 shows that fewer than 300 pupils make progress continuously through years 7 to 9 compared with over 5,500 pupils making the same or more progress on average over this period.
Figure 5.8: Cumulative and Snapshot of progress in maths in years 7 to 9.
Year 7-9 Maths Progress (Cumulative and Snapshot)
0
1,000
2,000
3,000
4,000
5,000
6,000
7,000
8,000
T1 - T3 T3 - T5 T5 - T7 T7 - T9
Progress Every Two Terms
MG
P C
ohor
t Pup
ils
RegressedNo ProgressExpected ProgressExtra Progress
Bars Show Snapshot Progress For Two Terms
Lines Show Cumulative Progress Each Two
(end
Continuous Linear Progress
Net Cumulative Progress
39

Teacher Assessment Annex
Correspondence between Teacher Assessments and Test Levels
40

41

Chapter 1 Annex
Figure 1.2b: Distribution of pupils making progress in writing for each term of each year.
0%
10%
20%
30%
40%
50%
60%
70%
80%
90%
100%
Autu
mn
to S
prin
g
Sprin
g to
Sum
mer
Sum
mer
to A
utum
n
Autu
mn
to S
prin
g
Sprin
g to
Sum
mer
Sum
mer
to A
utum
n
Autu
mn
to S
prin
g
Sprin
g to
Sum
mer
Sum
mer
to A
utum
n
Autu
mn
to S
prin
g
Sprin
g to
Sum
mer
Sum
mer
to A
utum
n
Autu
mn
to S
prin
g
Sprin
g to
Sum
mer
Sum
mer
to A
utum
n
Autu
mn
to S
prin
g
Sprin
g to
Sum
mer
Sum
mer
to A
utum
n
Autu
mn
to S
prin
g
Sprin
g to
Sum
mer
3 4 5 6 7 8 9
Year and term
Perc
enta
ge o
f pup
ils
2+ sub levels progress1 sub level progressNo progressWent backwards
Progress per term:
Figure 1.2c: Distribution of pupils making progress in maths for each term of
each year.
0%
10%
20%
30%
40%
50%
60%
70%
80%
90%
100%
Autu
mn
to S
prin
g
Sprin
g to
Sum
mer
Sum
mer
to A
utum
n
Autu
mn
to S
prin
g
Sprin
g to
Sum
mer
Sum
mer
to A
utum
n
Autu
mn
to S
prin
g
Sprin
g to
Sum
mer
Sum
mer
to A
utum
n
Autu
mn
to S
prin
g
Sprin
g to
Sum
mer
Sum
mer
to A
utum
n
Autu
mn
to S
prin
g
Sprin
g to
Sum
mer
Sum
mer
to A
utum
n
Autu
mn
to S
prin
g
Sprin
g to
Sum
mer
Sum
mer
to A
utum
n
Autu
mn
to S
prin
g
Sprin
g to
Sum
mer
3 4 5 6 7 8 9
Year and term
Perc
enta
ge o
f pup
ils
2+ sub levels progress1 sub level progressNo progressWent backwards
Progress per term:
42

Chapter 3 Annex
Figure 3.2b: Distribution of pupils at each sub-level in writing for each term.
0%
10%
20%
30%
40%
50%
60%
70%
80%
90%
100%
Aut
umn
Sprin
g
Sum
mer
Aut
umn
Sprin
g
Sum
mer
Aut
umn
Sprin
g
Sum
mer
Aut
umn
Sprin
g
Sum
mer
Aut
umn
Sprin
g
Sum
mer
Aut
umn
Sprin
g
Sum
mer
Aut
umn
Sprin
g
Sum
mer
Year 3 Year 4 Year 5 Year 6 Year 7 Year 8 Year 9
Year and term
Perc
enta
ge o
f pup
ils
E8A8B8C7A7B7C6A6B6C5A5B5C4A4B4C3A3B3C2A2B2C1A1B1CW
Figure 3.2c: Distribution of pupils at each sub-level in maths for each term.
0%
10%
20%
30%
40%
50%
60%
70%
80%
90%
100%
Aut
umn
Sprin
g
Sum
mer
Aut
umn
Sprin
g
Sum
mer
Aut
umn
Sprin
g
Sum
mer
Aut
umn
Sprin
g
Sum
mer
Aut
umn
Sprin
g
Sum
mer
Aut
umn
Sprin
g
Sum
mer
Aut
umn
Sprin
g
Sum
mer
Year 3 Year 4 Year 5 Year 6 Year 7 Year 8 Year 9
Year and term
Perc
enta
ge o
f pup
ils
E8A8B8C7A7B7C6A6B6C5A5B5C4A4B4C3A3B3C2A2B2C1A1B1CW
43

Figure 3.3b: Percentage of pupils achieving expected level and above expected level in reading for each term in KS2.
0%
10%
20%
30%
40%
50%
60%
70%
80%
90%
100%
Aut Spr Sum Aut Spr Sum Aut Spr Sum Aut Spr Sum
Year 3 Year 4 Year 5 Year 6
Year and term
Perc
enta
ge o
f pup
ils
Expected level or above Above expected level
Figure 3.3c: Percentage of pupils achieving expected level and above expected level in maths for each term in KS2.
0%
10%
20%
30%
40%
50%
60%
70%
80%
90%
100%
Aut Spr Sum Aut Spr Sum Aut Spr Sum Aut Spr Sum
Year 3 Year 4 Year 5 Year 6
Year and term
Perc
enta
ge o
f pup
ils
Expected level or above Above expected level
44

Chapter 4 Annex
Figure 4.4b: Distribution of pupils making progress in reading for pupils eligible and not eligible for FSM.
0%
10%
20%
30%
40%
50%
60%
70%
80%
90%
100%
FSMEligible
Not FSMEligible
FSMEligible
Not FSMEligible
FSMEligible
Not FSMEligible
FSMEligible
Not FSMEligible
FSMEligible
Not FSMEligible
FSMEligible
Not FSMEligible
4 5 6 7 8 9
Year
4+ sub levels3 sub levels2 sub levels1 sub levelNo progressWent Backwards
Progress per year:
…FSM Gap Widening
…FSM Gap Narrowing
Figure 4.4c: Distribution of pupils making progress in writing for pupils eligible
and not eligible for FSM.
0%
10%
20%
30%
40%
50%
60%
70%
80%
90%
100%
FSMEligible
Not FSMEligible
FSMEligible
Not FSMEligible
FSMEligible
Not FSMEligible
FSMEligible
Not FSMEligible
FSMEligible
Not FSMEligible
FSMEligible
Not FSMEligible
4 5 6 7 8 9
Year
4+ sub levels3 sub levels2 sub levels1 sub levelNo progressWent Backwards
Progress per year:
…FSM Gap Widening
…FSM Gap Narrowing
45

Figure 4.5b: Distribution of pupils making progress in reading for pupils registered as having and not having SEN.
0%
10%
20%
30%
40%
50%
60%
70%
80%
90%
100%
No SEN SEN No SEN SEN No SEN SEN No SEN SEN No SEN SEN No SEN SEN
4 5 6 7 8 9
Year
4+ sub levels3 sub levels2 sub levels1 sub levelNo progressWent Backwards
Progress per year:
…SEN Gap Widening
…SEN Gap Narrowing
Figure 4.5c: Distribution of pupils making progress in writing for pupils registered as having and not having SEN.
0%
10%
20%
30%
40%
50%
60%
70%
80%
90%
100%
No SEN SEN No SEN SEN No SEN SEN No SEN SEN No SEN SEN No SEN SEN
4 5 6 7 8 9
Year
4+ sub levels3 sub levels2 sub levels1 sub levelNo progressWent Backwards
Progress per year:
…SEN Gap Widening
…SEN Gap Narrowing
46

Figure 4.6b: Distribution of pupils making progress in writing for pupils registered with different levels of SEN.
0%
10%
20%
30%
40%
50%
60%
70%
80%
90%
100%
Sch
ool A
ctio
n
Sch
ool A
ctio
nPl
us
Sta
tem
ent
Sch
ool A
ctio
n
Sch
ool A
ctio
nPl
us
Sta
tem
ent
Sch
ool A
ctio
n
Sch
ool A
ctio
nPl
us
Sta
tem
ent
Sch
ool A
ctio
n
Sch
ool A
ctio
nPl
us
Sta
tem
ent
Sch
ool A
ctio
n
Sch
ool A
ctio
nPl
us
Sta
tem
ent
Sch
ool A
ctio
n
Sch
ool A
ctio
nPl
us
Sta
tem
ent
4 5 6 7 8 9
Year
4+ sub levels3 sub levels2 sub levels1 sub levelNo progressWent Backwards
Progress per year:
…Within-SEN Gaps Widening
…Witthin-SEN Gaps Narrowing
Figure 4.6c: Distribution of pupils making progress in maths for pupils registered with different levels of SEN.
0%
10%
20%
30%
40%
50%
60%
70%
80%
90%
100%
Sch
ool A
ctio
n
Sch
ool A
ctio
nPl
us
Sta
tem
ent
Sch
ool A
ctio
n
Sch
ool A
ctio
nPl
us
Sta
tem
ent
Sch
ool A
ctio
n
Sch
ool A
ctio
nPl
us
Sta
tem
ent
Sch
ool A
ctio
n
Sch
ool A
ctio
nPl
us
Sta
tem
ent
Sch
ool A
ctio
n
Sch
ool A
ctio
nPl
us
Sta
tem
ent
Sch
ool A
ctio
n
Sch
ool A
ctio
nPl
us
Sta
tem
ent
4 5 6 7 8 9
Year
4+ sub levels3 sub levels2 sub levels1 sub levelNo progressWent Backwards
Progress per year:
…Within-SEN Gaps Widening
…Witthin-SEN Gaps Narrowing
47

Figure 4.7b: Distribution of pupils making progress in reading for pupils of different ethnicities.
0%
10%
20%
30%
40%
50%
60%
70%
80%
90%
100%
Whi
teM
ixed
Asi
anB
lack
Chi
nese
Oth
erW
hite
Mix
edA
sian
Bla
ckC
hine
seO
ther
Whi
teM
ixed
Asi
anB
lack
Chi
nese
Oth
erW
hite
Mix
edA
sian
Bla
ckC
hine
seO
ther
Whi
teM
ixed
Asi
anB
lack
Chi
nese
Oth
erW
hite
Mix
edA
sian
Bla
ckC
hine
seO
ther
4 5 6 7 8 9
Year
4+ sub levels3 sub levels2 sub levels1 sub levelNo progressWent Backwards
Progress per year:
Figure 4.7c: Distribution of pupils making progress in maths for pupils of different ethnicities.
0%
10%
20%
30%
40%
50%
60%
70%
80%
90%
100%
Whi
teM
ixed
Asi
anB
lack
Chi
nese
Oth
erW
hite
Mix
edA
sian
Bla
ckC
hine
seO
ther
Whi
teM
ixed
Asi
anB
lack
Chi
nese
Oth
erW
hite
Mix
edA
sian
Bla
ckC
hine
seO
ther
Whi
teM
ixed
Asi
anB
lack
Chi
nese
Oth
erW
hite
Mix
edA
sian
Bla
ckC
hine
seO
ther
4 5 6 7 8 9
Year
4+ sub levels3 sub levels2 sub levels1 sub levelNo progressWent Backwards
Progress per year:
48

Figure 4.8b: Distribution of pupils making progress in writing for pupils with English as a first or additional language.
0%
10%
20%
30%
40%
50%
60%
70%
80%
90%
100%
Not EAL EAL Not EAL EAL Not EAL EAL Not EAL EAL Not EAL EAL Not EAL EAL
4 5 6 7 8 9
Year
4+ sub levels3 sub levels2 sub levels1 sub levelNo progressWent Backwards
Progress per year:
…EAL Gap Widening
…EAL Gap Narrowing
Figure 4.8c: Distribution of pupils making progress in maths for pupils with English as a first or additional language.
0%
10%
20%
30%
40%
50%
60%
70%
80%
90%
100%
Not EAL EAL Not EAL EAL Not EAL EAL Not EAL EAL Not EAL EAL Not EAL EAL
4 5 6 7 8 9
Year
4+ sub levels3 sub levels2 sub levels1 sub levelNo progressWent Backwards
Progress per year:
…EAL Gap Widening
…EAL Gap Narrowing
49

Chapter 5 Annex
Figure 5.1b: Distribution of pupils making progress in writing in year 6 based on their progress in year 5.
0%
20%
40%
60%
80%
100%
Went backwards No progress 1 sub level progress 2 sub levels progress 3+ sub levels progress
Previous progress
Perc
enta
ge o
f pup
ils
3+ sub levels progress2 sub levels progress1 sub level progressNo progressWent backwards
Progress per year:
Figure 5.1c: Distribution of pupils making progress in maths in year 6 based on their progress in year 5.
0%
20%
40%
60%
80%
100%
Went backwards No progress 1 sub level progress 2 sub levels progress 3+ sub levels progress
Previous progress
Perc
enta
ge o
f pup
ils
3+ sub levels progress2 sub levels progress1 sub level progressNo progressWent backwards
Progress per year:
50

Figure 5.1d: Distribution of pupils making progress in reading in year 5 based on their progress in year 4.
0%
10%
20%
30%
40%
50%
60%
70%
80%
90%
100%
Went backwards No progress 1 sub level progress 2 sub levels progress 3+ sub levels progress
Previous progress
Perc
enta
ge o
f pup
ils
3+ sub levels progress2 sub levels progress1 sub level progressNo progressWent backwards
Progress per year:
Figure 5.1e: Distribution of pupils making progress in writing in year 5 based on their progress in year 4.
0%
10%
20%
30%
40%
50%
60%
70%
80%
90%
100%
Went backwards No progress 1 sub level progress 2 sub levels progress 3+ sub levels progress
Previous progress
Perc
enta
ge o
f pup
ils
3+ sub levels progress2 sub levels progress1 sub level progressNo progressWent backwards
Progress per year:
51

Figure 5.1f: Distribution of pupils making progress in maths in year 5 based on their progress in year 4.
0%
20%
40%
60%
80%
100%
Went backwards No progress 1 sub level progress 2 sub levels progress 3+ sub levels progress
Previous progress
Perc
enta
ge o
f pup
ils
3+ sub levels progress2 sub levels progress1 sub level progressNo progressWent backwards
Progress per year:
Figure 5.2b: Distribution of pupils making progress in reading in year 9 based on their progress in year 8.
0%
10%
20%
30%
40%
50%
60%
70%
80%
90%
100%
Went backwards No progress 1 sub level progress 2+ sub levels progress
Previous progress
Perc
enta
ge o
f pup
ils
2+ sub levels progress1 sub level progressNo progressWent backwards
Progress per year:
52

Figure 5.2c: Distribution of pupils making progress in maths in year 9 based on their progress in year 8.
0%
10%
20%
30%
40%
50%
60%
70%
80%
90%
100%
Went backwards No progress 1 sub level progress 2+ sub levels progress
Previous progress
Perc
enta
ge o
f pup
ils
2+ sub levels progress1 sub level progressNo progressWent backwards
Progress per year:
Figure 5.2d: Distribution of pupils making progress in reading in year 8 based
on their progress in year 7.
0%
10%
20%
30%
40%
50%
60%
70%
80%
90%
100%
Went backwards No progress 1 sub level progress 2+ sub levels progress
Previous progress
Perc
enta
ge o
f pup
ils
2+ sub levels progress1 sub level progressNo progressWent backwards
Progress per year:
53

Figure 5.2e: Distribution of pupils making progress in writing in year 8 based on their progress in year 7.
0%
10%
20%
30%
40%
50%
60%
70%
80%
90%
100%
Went backwards No progress 1 sub level progress 2+ sub levels progress
Previous progress
Perc
enta
ge o
f pup
ils
2+ sub levels progress1 sub level progressNo progressWent backwards
Progress per year:
Figure 5.2f: Distribution of pupils making progress in maths in year 8 based on their progress in year 7.
0%
20%
40%
60%
80%
100%
Went backwards No progress 1 sub level progress 2+ sub levels progress
Previous progress
Perc
enta
ge o
f pup
ils
2+ sub levels progress1 sub level progressNo progressWent backwards
Progress per year:
54

Figure 5.3b: Numbers of pupils making each amount of progress in writing in years 4, 5 and 6 based on their progress in the previous year.
1467 2753 2538 1292
101 330 537 499 235 827 1150 541 314 947 937 340 300 483 354 155
4
14
31
52
13
63
123
131
38
134
199
166
66
185
168
80
6
32
62
135
45
192
316
274
107
362
476
205
109
206
166
60
11
48
115
140
49
240
404
254
139
327
348
123
92
140
88
20
14
63
119
104
43
133
218
89
50
151
110
43
52
66
32
5
1 sub-level progress
Year 4
Year 5
Year 6
Went backwards or no progress 2 sub-levels progress 3+ sub-levels progress
Figure 5.3c: Numbers of pupils making each amount of progress in maths in
years 4, 5 and 6 based on their progress in the previous year.
1532 3077 2505 936
145 395 573 419 344 1050 1138 545 336 873 991 305 212 402 266 56
14
17
35
79
15
40
119
221
33
117
243
180
48
141
167
63
12
36
99
197
51
172
402
425
61
289
513
275
72
221
185
67
15
48
112
161
49
182
365
277
84
306
389
212
44
132
94
35
8
36
71
97
27
103
167
105
24
92
97
53
9
21
16
10
1 sub-level progress
Year 4
Year 5
Year 6
Went backwards or no progress 2 sub-levels progress 3+ sub-levels progress
55

Figure 5.4b: Numbers of pupils making each amount of progress in reading in years 7, 8 and 9 based on their progress in the previous year.
1346 2636 1929 2368
66 147 238 895 247 567 677 1145 221 390 579 739 703 580 516 569
3
1
1
61
1
7
14
125
8
17
36
177
104
133
238
420
6
8
29
204
13
58
98
398
25
84
174
394
98
236
323
488
7
12
22
180
8
63
98
221
23
86
176
294
62
174
226
277
20
52
104
527
29
82
133
336
39
107
135
235
84
131
156
198
Year 7
Year 8
Year 9
Went backwards No progress 1 sub-level progress 2+ sub-levels progress
Figure 5.4c: Numbers of pupils making each amount of progress in maths in
years 7, 8 and 9 based on their progress in the previous year.
1038 2030 2009 3171
38 83 157 760 102 242 428 1258 102 260 554 1093 319 583 991 1278
5
33
14
18
51
6
20
36
95
104
147
227
282
2
8
12
80
13
28
51
150
24
78
94
232
117
287
324
530
2
5
14
81
8
20
53
179
15
65
117
357
77
164
314
538
14
27
52
226
17
58
112
396
28
84
226
653
98
158
348
674
Year 7
Year 8
Year 9
Went backwards No progress 1 sub-level progress 2+ sub-levels progress
56

Figure 5.5b: Mapping of number of pupils achieving each level in reading in years 7, 8 and 9 and numbers of pupils moving between each level.
Figure 5.5c: Mapping of number of pupils achieving each level in writing in years 7, 8 and 9 and numbers of pupils moving between each level.
57

Figure 5.6b: Consecutive progress in writing each term.
Continuous Writing Progress Each Term
0
6,000
12,000
18,000
24,000
30,000
36,000
Autumn 07(T1)
Spring 08(T2)
Summer 08(T3)
Autumn 08(T4)
Spring 09(T5)
Summer 09(T6)
Autumn 10(T7)
Spring 10(T8)
Term
MG
P C
ohor
t Pup
ils
progressed continuously from T8progressed continuously from T7progressed continuously from T6progressed continuously from T5progressed continuously from T4progressed continuously from T3progressed continuously from T2progressed continuously from T1
Figure 5.6c: Consecutive progress in maths each term.
Continuous Maths Progress Each Term
0
6,000
12,000
18,000
24,000
30,000
36,000
Autumn 07(T1)
Spring 08(T2)
Summer 08(T3)
Autumn 08(T4)
Spring 09(T5)
Summer 09(T6)
Autumn 10(T7)
Spring 10(T8)
Term
MG
P C
ohor
t Pup
ils
progressed continuously from T8progressed continuously from T7progressed continuously from T6progressed continuously from T5progressed continuously from T4progressed continuously from T3progressed continuously from T2progressed continuously from T1
58
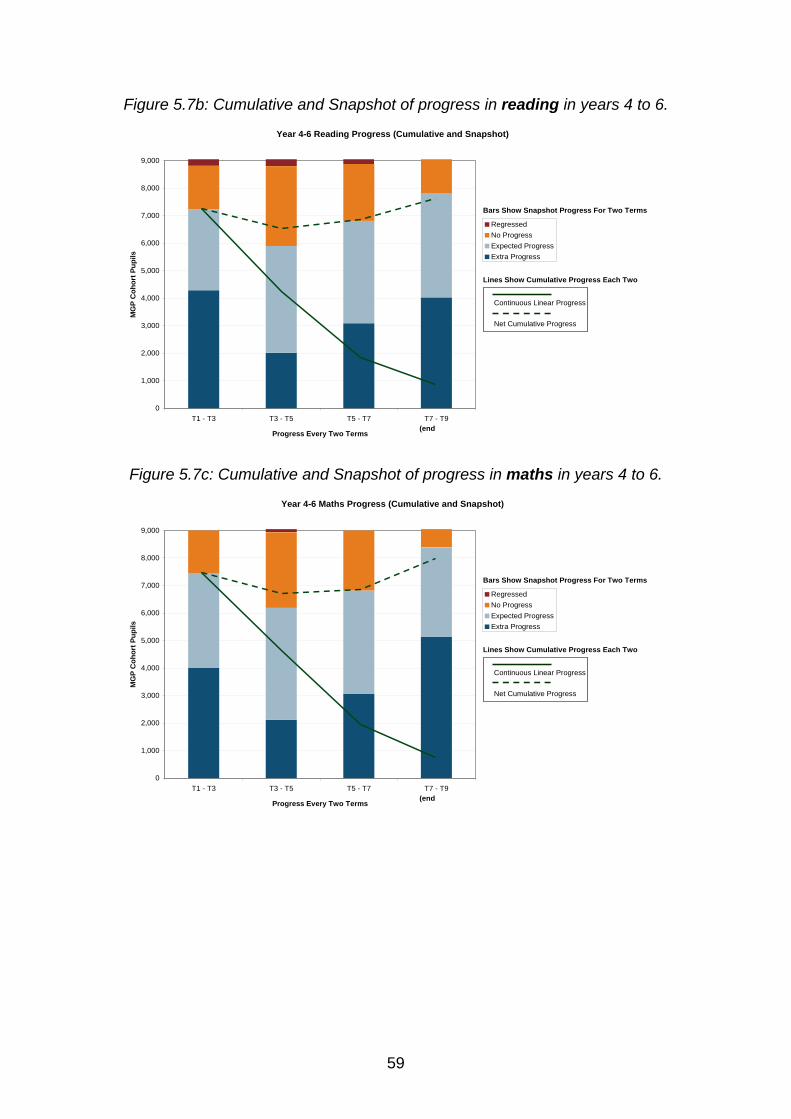
Figure 5.7b: Cumulative and Snapshot of progress in reading in years 4 to 6.
Year 4-6 Reading Progress (Cumulative and Snapshot)
0
1,000
2,000
3,000
4,000
5,000
6,000
7,000
8,000
9,000
T1 - T3 T3 - T5 T5 - T7 T7 - T9
Progress Every Two Terms
MG
P C
ohor
t Pup
ils
RegressedNo ProgressExpected ProgressExtra Progress
Bars Show Snapshot Progress For Two Terms
Lines Show Cumulative Progress Each Two
(end
Continuous Linear Progress
Net Cumulative Progress
Figure 5.7c: Cumulative and Snapshot of progress in maths in years 4 to 6.
Year 4-6 Maths Progress (Cumulative and Snapshot)
0
1,000
2,000
3,000
4,000
5,000
6,000
7,000
8,000
9,000
T1 - T3 T3 - T5 T5 - T7 T7 - T9
Progress Every Two Terms
MG
P C
ohor
t Pup
ils
RegressedNo ProgressExpected ProgressExtra Progress
Bars Show Snapshot Progress For Two Terms
Lines Show Cumulative Progress Each Two
(end
Continuous Linear Progress
Net Cumulative Progress
59
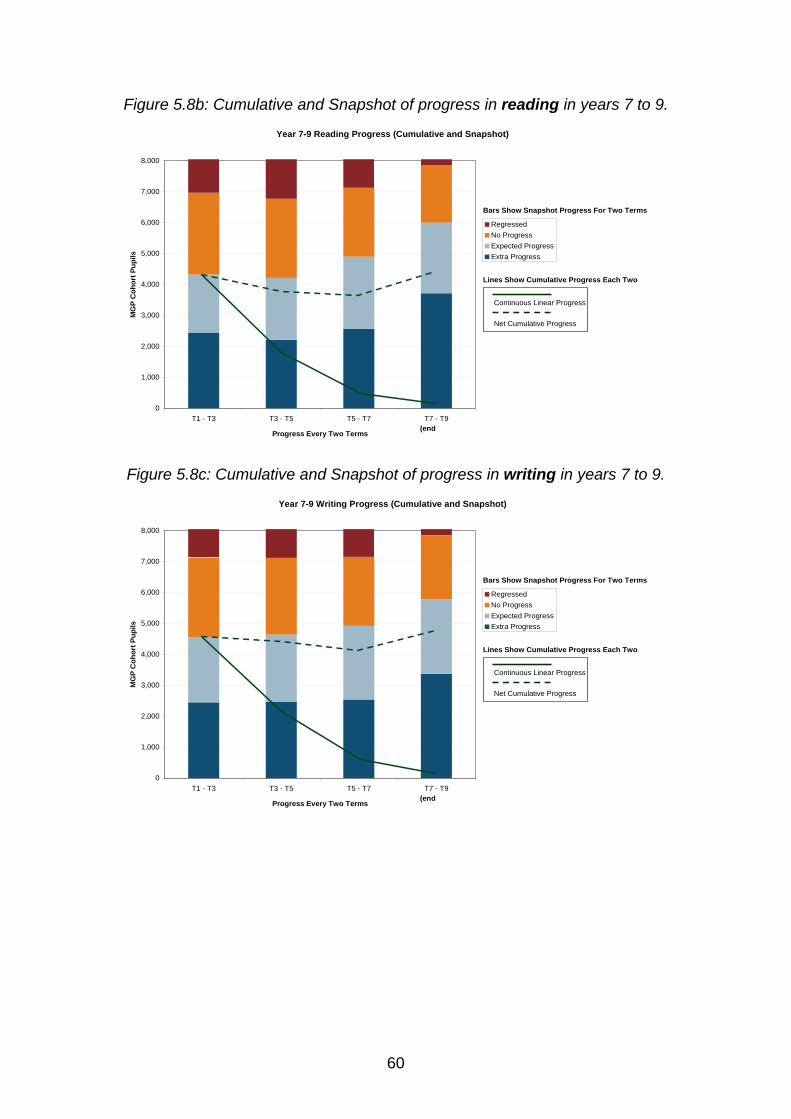
Figure 5.8b: Cumulative and Snapshot of progress in reading in years 7 to 9.
Year 7-9 Reading Progress (Cumulative and Snapshot)
0
1,000
2,000
3,000
4,000
5,000
6,000
7,000
8,000
T1 - T3 T3 - T5 T5 - T7 T7 - T9
Progress Every Two Terms
MG
P C
ohor
t Pup
ils
RegressedNo ProgressExpected ProgressExtra Progress
Bars Show Snapshot Progress For Two Terms
Lines Show Cumulative Progress Each Two
(end
Continuous Linear Progress
Net Cumulative Progress
Figure 5.8c: Cumulative and Snapshot of progress in writing in years 7 to 9.
Year 7-9 Writing Progress (Cumulative and Snapshot)
0
1,000
2,000
3,000
4,000
5,000
6,000
7,000
8,000
T1 - T3 T3 - T5 T5 - T7 T7 - T9
Progress Every Two Terms
MG
P C
ohor
t Pup
ils
RegressedNo ProgressExpected ProgressExtra Progress
Bars Show Snapshot Progress For Two Terms
Lines Show Cumulative Progress Each Two
(end
Continuous Linear Progress
Net Cumulative Progress
60
Ref: DFE-RR096
ISBN: 978-1-84775-880-4
© Department for Education
March 2011


![Qcda-11-4841 Using the p Scales to Assess Pupils Progress[1]](https://static.fdocuments.in/doc/165x107/553cb96b4a7959da598b4612/qcda-11-4841-using-the-p-scales-to-assess-pupils-progress1.jpg)