
HOW DO FIRMS COMBINE DIFFERENT INTERNATIONALISATION MODES ... · HOW DO FIRMS COMBINE DIFFERENT...
31
1 HOW DO FIRMS COMBINE DIFFERENT INTERNATIONALISATION MODES? A MULTIVARIATE PROBIT APPROACH P. Calia 1 , M. R. Ferrante 1, * 1 Department of Statistics, University of Bologna Bologna, Italy Abstract In recent years, internationalisation processes have broadened and intensified in various and complex forms. In this paper, we analyze the patterns of modes of engagement in international markets adopted by firms in order to identify the link between these patterns and firm heterogeneity and to verify the hypothesis of complementarity vs. substitution among internationalisation modes. We consider various non-equity forms in addition to forms of internationalisation traditionally dealt with in the literature. We describe the internationalisation patterns using a multivariate probit model where firm choices about each internationalisation form are described by a yes/no variable and these choices are jointly modelled. This approach allows us to assess the associations among the choices driving the firm’s internationalisation strategy as a whole and, at the same time, to avoid a priori assumptions about the internationalisation pattern. Some main results emerge from the empirical evidence. First, we show that to disregard some forms of internationalisation would lead to unreliable conclusions about the internationalisation process. Second, a remarkable portion of firms adopt non-equity internationalisation forms and the set of firm characteristics significantly connected to internationalisation choices varies depending on the pattern under consideration. Third, the complementary internationalisation process seems to be preferred over the substitutive process. Key words: non-equity forms, firm heterogeneity, substitutive-complementary process, maximum simulated likelihood. JEL classification: F20, F23, C25 * Corresponding author: M.R. Ferrante (University of Bologna, Departments of Statistics - Via Belle Arti, 41 – 40133, Bologna BO, Italy; tel. +39 051 2098279, fax +39 051 232153) E-mail addresses: [email protected] , [email protected]
Transcript of HOW DO FIRMS COMBINE DIFFERENT INTERNATIONALISATION MODES ... · HOW DO FIRMS COMBINE DIFFERENT...
1
HOW DO FIRMS COMBINE DIFFERENT INTERNATIONALISATION
MODES? A MULTIVARIATE PROBIT APPROACH
P. Calia1, M. R. Ferrante1,*
1Department of Statistics, University of Bologna
Bologna, Italy
Abstract
In recent years, internationalisation processes have broadened and intensified in various and complex forms. In this paper, we analyze the patterns of modes of engagement in international markets adopted by firms in order to identify the link between these patterns and firm heterogeneity and to verify the hypothesis of complementarity vs. substitution among internationalisation modes. We consider various non-equity forms in addition to forms of internationalisation traditionally dealt with in the literature. We describe the internationalisation patterns using a multivariate probit model where firm choices about each internationalisation form are described by a yes/no variable and these choices are jointly modelled. This approach allows us to assess the associations among the choices driving the firm’s internationalisation strategy as a whole and, at the same time, to avoid a priori assumptions about the internationalisation pattern. Some main results emerge from the empirical evidence. First, we show that to disregard some forms of internationalisation would lead to unreliable conclusions about the internationalisation process. Second, a remarkable portion of firms adopt non-equity internationalisation forms and the set of firm characteristics significantly connected to internationalisation choices varies depending on the pattern under consideration. Third, the complementary internationalisation process seems to be preferred over the substitutive process.
Key words: non-equity forms, firm heterogeneity, substitutive-complementary process, maximum simulated likelihood. JEL classification: F20, F23, C25 * Corresponding author: M.R. Ferrante (University of Bologna, Departments of Statistics - Via Belle Arti, 41 – 40133, Bologna BO, Italy; tel. +39 051 2098279, fax +39 051 232153) E-mail addresses: [email protected], [email protected]
2
1. INTRODUCTION
In the last decade, international trade has become one of the fastest growing economic activities
worldwide. This remarkable expansion of firms across national borders has stimulated new theoretical
developments and a wide stream of empirical literature emphasising the role of firm heterogeneity
(mainly represented by productivity) in decisions related to the internationalisation process (for a
comprehensive and current review, see Greenaway and Kneller, 2007, and Wagner, 2007).
The majority of the literature focuses on a limited number of internationalisation forms, mainly
exports and foreign direct investments (FDI). It has only recently become evident that firm
participation in foreign markets is reflected in a wider set of forms of internationalisation, such as
commercial penetration, technical agreements, and outsourcing. In the theoretical framework, the
relevance of considering more complex internationalisation strategies and the whole set of different
options available to the firms has been stressed by Antras and Helpman (2004), Grossman et al. (2006),
Helpman (2006), Ottaviano and Turrini (2007) and Bougheas and Görg (2008). To the best of our
knowledge, a limited number of empirical studies (Basile et al., 2003; Castellani and Zanfei, 2007;
Tomiura, 2007) have attempted to consider a broader set of internationalisation forms beyond export
and FDI. In addition, the relevance and rapid growth that non-equity forms have experienced in the
last decade has been highlighted by Narula and Zanfei (2003) and Palmberg and Pajarinen (2005).
In terms of the econometric tools used in this context, firms’ internationalisation choices have
been modelled by multiple-choice models (ordered or unordered). Benfratello and Razzolini (2008)
adopt a multinomial logit model for the categories of “no internationalisation”, “only export” and
“export plus horizontal FDI”. Further, Bougheas and Görg (2008) estimate a multinomial logit model
to demonstrate empirically the relevance of considering a wide set of internationalisation forms. Basile
et al. (2003) propose an internationalisation index that considers various internationalisation categories
and model it with a univariate ordered probit, thereby assuming that the categories are ordered and that
the internationalisation process is cumulative. Note that in the real world, the choices available to a
firm consist of “no internationalisation” and of all possible combinations of a set of
internationalisation modes (where combinations can be defined by considering two modes, three
modes, and so on). In such models, choices are exhaustive and mutually exclusive and the firm chooses
only one: the choice that maximises the profit function. Unfortunately, multiple-choice models suffer a
drawback when used in this framework. They become cumbersome for a large number of
internationalisation forms because the different forms can be combined and each combination defines
a choice. The number of possible combinations to be modelled quickly increases with the number of
internationalisation modes considered (i.e., 6 modes results in 64 choices). Alternatives in the empirical
literature that limit the number of choices to be modelled consists in disregarding the information on
3
some internationalisation forms or in formulating some a priori assumptions on the combination of
forms (i.e., ordering or collapsing).
As briefly outlined above, the literature on the relationship between firms’ internationalisation
and heterogeneity has largely focused on productivity. Recently, the role of other characteristics of
firms besides productivity have been stressed, including innovative behaviour, proprietary assets, skills
composition, organisational choices, accumulation of technology (Helpman, 2006). To the best of our
knowledge, very few studies have verified the interaction between the internationalisation process
described by a wide range of alternative choices and firm heterogeneity, measured by a large number of
characteristics.
This paper contributes to explanations of the nature of the firm internationalisation processes
and of their connection to firm heterogeneity in a number of ways.
First, to better represent the behaviour of firms, we consider a wide range of internationalisation
forms, including offshoring of production and outsourcing of services abroad, as well as non-equity
forms, such as commercial penetration operations and agreements, in addition to the exports and FDI
more commonly discussed in the literature. In this framework, we illustrate the relevance of including
all possible choices in the study of internationalisation patterns. We demonstrate that neglecting some
choices can lead to biased conclusions.
Second, in order to take into account the entire set of the available combinations of the different
internationalisation forms and the relationships among them, we analyse the complexity of
internationalisation processes in a multivariate framework. To this end, we use a multivariate probit
model (MVP) that provides us with a number of advantages compared to other discrete choice models
already used in the literature. In the MVP model, every internationalisation mode corresponds to a
binary choice (yes/no) equation and the choices are modelled jointly through correlations among
disturbances. This specification improves model estimates when correlations are significantly different
from zero. At the same time, the MVP model prevents us from formulating an a priori assumption on
the patterns of internationalisation or from excluding some internationalisation forms from the
analysis. We draw directly from the estimated joint and conditional probabilities information on how
the different internationalisation options are associated and from estimated marginal effects (MEs) how
these patterns combine with the various dimensions of firm heterogeneity. In addition, we highlight
how predictions are sensitive to the set of internationalisation forms included in the estimated model.
By exploiting the very rich output produced by the estimation of the MVP model, which includes the
estimated joint and conditional probabilities and their connection with the covariates, we can explicitly
address the question of complementary versus the substitutive assumptions about the
internationalisation process. We can also highlight which types of firms are more prone to choose one
type of process over another.
4
Third, we use a large range of covariates besides productivity to describe the heterogeneity of
firms. This range reduces the problem of confounding effects for the relationship between productivity
and internationalisation choices.
For our analysis, we rely on the data provided by the Capitalia1 survey, a very rich micro-level
dataset on Italian manufacturing firms that includes information on the various forms of international
involvement.
The results must be interpreted with some caution: our analysis is descriptive, aiming at detecting
the relevant associations between different internationalisation patterns and variables describing firm
heterogeneity, but cannot be used to infer causal relationships.
The paper is organised as follows: in Section 2 we provide a review of the literature on the
international involvement of firms; Section 3 presents the MVP model; Section 4 contains a description
of the data and some descriptive statistics; Section 5 describes the model specification; in Section 6, we
present the model estimates; in Section 7, we comment on the results on the relationship between
heterogeneity and internationalisation patterns; and Section 8 concludes the paper.
2. A REVIEW OF THE THEORETICAL AND EMPIRICAL LITERATURE
Traditional theories of international trade explain the international involvement of firms in terms
of the so-called proximity-concentration trade-off (Brainard, 1997). This concept expresses the notion
that firms concentrate production at home while serving foreign markets via exports if there are
advantages to concentration. They are more likely to establish foreign production facilities when the
transport costs are higher and trade barriers exist, the fixed costs of entry are lower, and the economies
of scale can be realised at the plant level. In this form of FDI, called horizontal FDI, firms produce the
same products abroad that they produce at home. Subsequently, general equilibrium models have been
extended to include vertical FDI, an internationalisation form that arises when the firm locates each
stage of production in the country where it can reduce overall production costs (Markusen, 2002). In
this case, the firm produces products abroad that are different from those that it produces at home.
One consequence of traditional theories is that firms in the same industry adopt the same behaviour in
terms of participation in foreign markets. However, in reality, internationally involved forms are not a
random sample of the firm population in an industry. Exporting and non-exporting firms coexist in the
same industry, and in a single industry only a small fraction of firms realise FDI.
The heterogeneous firm model faces these drawbacks because it relates firm decisions to
productivity levels. In his pioneering paper, Melitz (2003) builds a dynamic theoretical industry model
that considers the interaction between productivity differentials across firms in the same industry and
1 Capitalia was one of the largest Italian banks. It was recently acquired by the Unicredit group.
5
the fixed costs of export. Helpman et al. (2004) extend the Melitz model, combining the analysis of
exports with that of (horizontal) FDI. Their paper focuses on the role of intra-industry firm
productivity differentials in explaining the structure of international trade and investment. The model
highlights that only the most productive firms engage in foreign activity and that among firms that
serve the foreign market, only the most productive engage in FDI. In short, these results suggest that
heterogeneity in productivity is a potential source of comparative advantage. The model also confirms
the proximity-concentration trade-off: firms tend to substitute FDI for exports when transport costs
are high and economies of scale are small.
An extensive stream of empirical literature has grown from these theoretical developments
testing the relationship between internationalisation modes (export and FDI) and firm heterogeneity,
with the latter typically represented by productivity. A number of studies show that the most
productive firms undergo a self-selection process to enter foreign markets and substantiate a ranking of
firms’ performance indicators and productivity across multinationals, exporters, and firms serving only
domestic markets (among others see Head and Ries, 2003; Helpman et al., 2004; Girma et al., 2004;
Girma et al., 2005). Few contributions test the learning-by-exporting hypothesis (productivity advantages
increase only after exporting) but in general, the direction of the causation between productivity and
internationalisation has been controversial (for a review of this literature see Greenaway and Kneller,
2007). Recently, a limited number of studies emphasize the relevance of considering other variables
representing firm heterogeneity besides productivity. In this framework, Criscuolo et al. (2005), Frenz
and Ietto-Gillies (2007), Castellani and Zanfei (2007) deal with the role of innovation in explaining the
propensity for internationalisation.
The literature mentioned above mainly focuses on export and FDI, comparing productivity levels
of multinationals against non-multinationals and exporters against non-exporters, and of exporters
against multinationals. The model of Helpman et al. (2004) suggests the hypothesis that more
productive companies substitute their exports through FDI. This hypothesis states that firms enter the
international market with “light” and indirect forms of internationalisation, denoted by low sunk costs
and by a low international commitment. When they are able to assume higher risks associated with
international activities, they abandon these indirect forms by substituting forms requiring higher
experience, investments and commitment. The alternative hypothesis of a complementary
internationalisation process suggests that firms gradually cumulate different and more demanding
forms to enlarge their international involvement. Empirical results have not led to an unequivocal
preference for one of these two hypotheses. Research in this field mainly focuses on evidence for
productivity differences between foreign direct investors and exporting firms by indirectly supporting
the substitution between exports and FDI related to productivity differences. Other arguments support
the hypothesis of a complementary relationship between exports and foreign production. FDI and
6
exports can coexist in the same firm if FDI capital outflows create or expand the opportunity to export
products (the so-called export platform FDI hypothesis). Another line of literature models this alternative
depending on the number of product lines the firm is assumed to produce: in a single-product setting,
exports and FDI are substituted, whereas complementarity refers to multi-product firms, and exports
and FDI become positively correlated if there are horizontal and vertical complementarities across
product lines (for a review see Head and Ries, 2004 and Helpman, 2006). Yeaple (2005) shows that
firms adopt complex international integration strategies that have complementary horizontal and
vertical FDIs.
The relevance of considering a wide set of internationalisation forms has recently been stressed.
Helpman (2006) highlights the need to model alternative forms of firm involvement in foreign
activities. Grossman et al. (2005, 2006) analyze the complementarity between outsourcing and foreign
sourcing as well as the adoption of FDI for intermediate and/or final goods production. Antras and
Helpman (2004) focus on outsourcing and FDI, whereas Ottaviano and Turrini (2007) focus on
export, FDI and outsourcing. Finally, Bougheas and Görg (2008) propose a theoretical model that
allows for a wide set of alternative forms of internationalisation and prove the disadvantages of
neglecting some of the alternatives.
3. A STATISTICAL MODEL FOR INTERNATIONALISATION CHOICES
To model the whole set of internationalisation forms we adopt a multivariate probit model
(MVP), where a binary choice (yes/no) corresponds to each internationalisation category depending on a
function of covariates specified through different equations and allowing the simultaneity of
internationalisation choices. Because a firm could simultaneously pursue more than one mode of
internationalisation, that is, it could adopt combination of modes, the main advantage of this model is
in avoiding the need to formulate an a priori assumption on the internationalisation pattern. No
restrictions on the structure of relationships among alternatives (i.e., on correlations between
disturbances) are required in the MVP, whereas this kind of restriction is imposed in multiple-choice
models. Relationships among forms of internationalisation are data-driven and modelled through
correlation parameters that have to be estimated. These correlations tell us if there are unobserved
factors, besides those explicitly considered, that simultaneously affect different choices around foreign
expansion. Further, the MVP model allows the use a different set of covariates for each alternative,
whereas, in the ordered probit model the covariate set is the same for each alternative.
Formally, considering M internationalisation categories for each observation, there are M
equations each describing a latent dependent variable that corresponds to the observed binary outcome
(the observation subscript has been suppressed for notational convenience):
7
otherwiseandyify
Mmy
mm
mmmm
001
,,1
*
*
>=
=+′= Kεxβ (1)
where m
x is a vector of p covariates for the m-th equation (m =1, …, M), mβ′ is the corresponding
vector of parameters, and Mmmε ,..,][ 1==ε is the error term vector distributed as multivariate normal, with a
zero mean and variance-covariance matrix V. The leading diagonal elements of V are normalised to one
and the off-diagonal elements are the correlations jmmj ρρ = for m, j=1,...,M and m≠j. If we assume that
εm are distributed independently and identically with a univariate normal distribution, equation (1)
defines M univariate probit models. The assumption of the independence of the error terms means that
information about the firm’s choice on an internationalisation mode does not affect the prediction of
the probability of choosing another internationalisation mode for the same firm. If the unobserved
correlations among outcomes are ignored, the whole set of M equations in (1) could be estimated
separately as univariate probit models. However, neglecting correlations leads to inefficient estimated
coefficients and could produce biased results in significance tests.
The probability of the observed outcomes for any observation is the joint cumulative distribution
);( ΩΦ µM
, where )(⋅ΦM
is the M-variate standard normal cumulative distribution function with
arguments µ and Ω that vary with observations; for each observation, ),,,(222111 MMM
xβxβxβ ′′′= κκκµ K
are upper integration points, m
κ are sign variables defined as 12 −=mm
yκ , being equal to 1 or –1
depending on whether the observed binary outcomes equal 1 or 0, and m = 1,…, M. Matrix Ω has
constituent elements mjΩ , where 1=Ωmm
and jmmjjmmj ρκκ=Ω=Ω . Note that the MVP has a structure
similar to that of a Seemingly Unrelated Regression model, except that in a MVP model, the dependent
variables are binary indicators.
The estimates of the equation parameters and correlation terms are obtained through the
Simulated Maximum Likelihood (SML) that consists of maximising the simulated log-likelihood function:
);(~
log~
1ii
n
iM ΩΦ=∑
=
µl (2)
where the individual terms are multivariate normal probabilities (i.e., an M-dimensional integral without
a closed analytical form), which are calculated at each iteration of the maximisation process for a given
value of the parameters using the Geweke-Hajivassiliou-Keane (GHK) simulator (Hajivassiliou and
Ruud, 1994, Cappellari and Jankins, 2003).
One important hypothesis to verify is that all cross-equation correlation coefficients are
simultaneously equal to zero. This verification is carried out by means of a Wald test, and if the null
hypothesis is not rejected, we can conclude that the choices of different internationalisation modes are
independent of each other. In this case, we could equivalently fit M independent univariate probits for
8
each internationalisation form. On the contrary, if the null hypothesis is rejected, fitting M independent
probits leads to unbiased but not efficient estimates. A correlation coefficient different from zero
between a pair of choices, after controlling for firm characteristics, indicates that there are unobserved
factors affecting both choices.
4. THE DATA
The data come from the 9th wave (covering the years 2001–2003) of the survey on medium and
small firms conducted every three years by Capitalia Observatory.
The target population consists of Italian manufacturing firms with more than ten employees;
firms with more than 500 employees are sampled in entirety whereas firms with less than 500
employees are selected on the basis of a stratified sample by size, activity sector (Pavitt classification),
and geographical area (North, Centre, South). The final sample consists of 4289 firms.
The survey collects detailed quantitative and qualitative information on property and businesses
relationships, the labour force, investments, innovation and R&D, internationalisation, markets, and
finance. This information is also linked to balance sheet data for the three years 2001–2003 covered by
the survey, provided by the database AIDA (Bureau Van Dijk), available for 3450 firms.
One section of the questionnaire is devoted to internationalisation choices, the basis for our
analysis. The main forms of internationalisation identified are as follows:
(a) export, EXP (y1),
(b) commercial penetration2, CP (y2),
(c) trade or technical agreements with foreign firms, AGR (y3),
(d) foreign direct investments, FDI (y4),
(e) total or partial production offshoring, OFF (y5),
(f) outsourcing of services from abroad, OUTS (y6).
These variables, considered as binary choices (yes/no), are the dependent variables of the six
equations defining the MVP model.
Here, FDI refers to firms that engaged in foreign direct investments in the period 2001-2003, so
FDI flows are considered instead of stocks, which is conventional in the literature. We decide not to
discard this information to fully exploit the richness of the dataset. At the same time, we rely on the
data concerning offshoring to capture the information about the stock of FDI.
The original sample size of 4289 is reduced due to various reasons. First, there is a problem of
missing data for the dependent variables. Missing data for dependent variables are were concentrated in
large firms - having more than 500 employees - with a partial non-response rate in this class of
2 Commercial penetration concerns operations like sales outlets, sales through local traders, sales arrangements with firms belonging to the group, and other promotional initiatives.
9
approximately 75%. To limit the analysis to the remaining 25% could have led to biased estimates, as
this class would be underrepresented in the whole sample. In order to reduce bias, we decide to deal
with partial non-responses by imputing the whole vector of dependent variables using a hot-deck
imputation in the classes defined by 2-digit Nace-based industry classification.
Second, there are missing values in covariates as well. In particular, we introduce the Total Factor
Productivity (TFP) measure as a covariate, which impliy conditioning only on observations with
accounting data (3450 out of 4289). Moreover, data missing in the TFP calculated in 2003 are due to
missing data in accounting flows. Because imputation is more effective in reducing bias the more the
covariate that drives the imputation is correlated with the outcome variables, we decide to impute
missing data in the TFP of 2003 with the corresponding average of 2002 and 2001 estimates. At the
end of this procedure, a few missing data still remain in some other covariates, so the final sample has
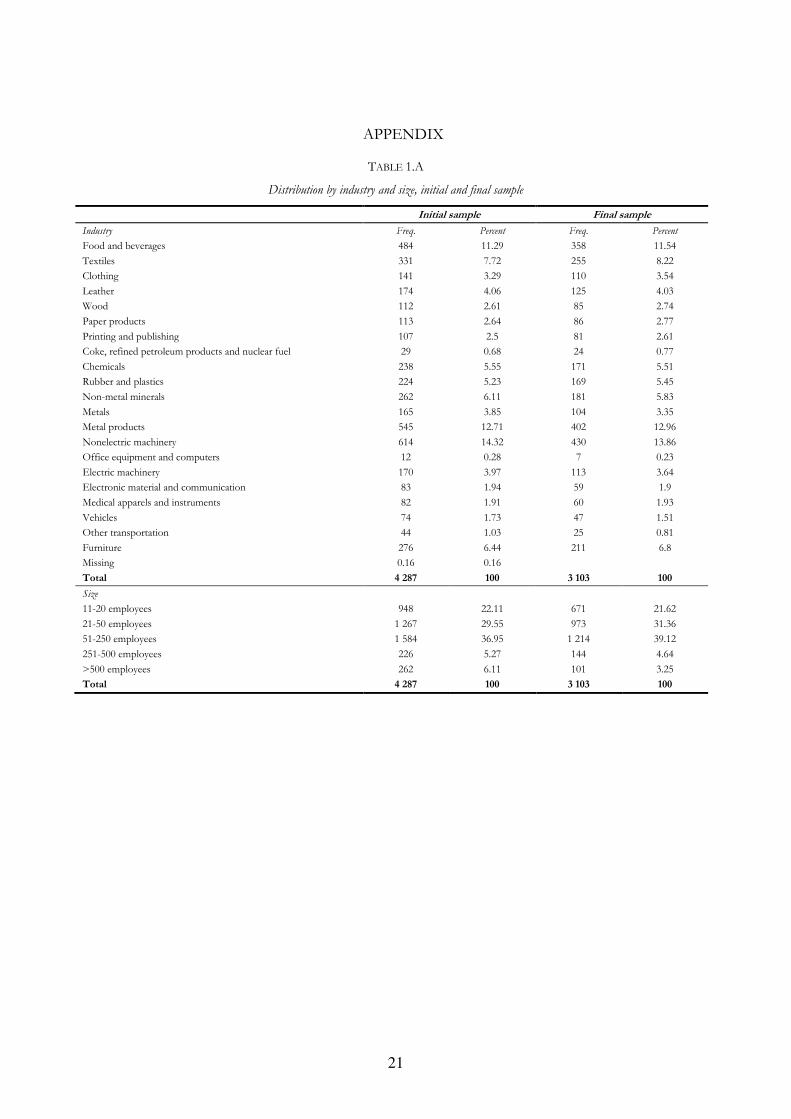
3103 firms. To evaluate the effect of missing data, we compare the distributions of the initial and the
final sample by industry and size. Results (Table 1.A in the Appendix) show that distributions are
sufficiently similar.
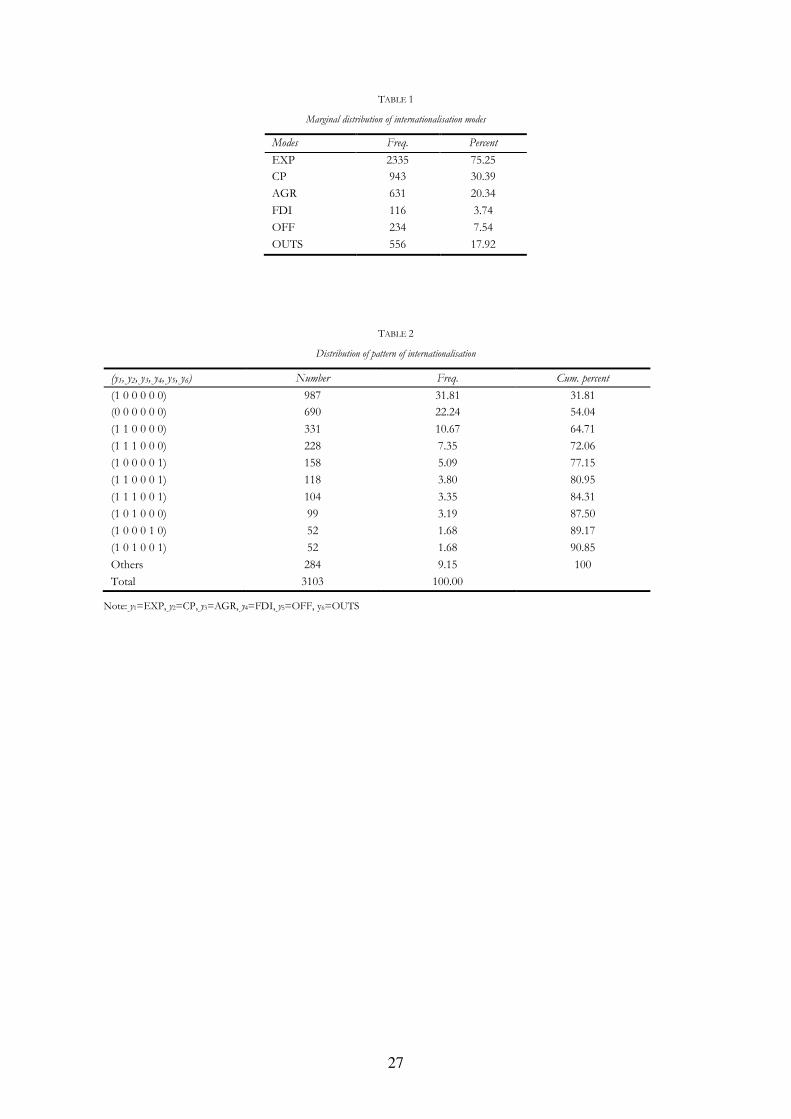
Table 1 describes the marginal distribution of each internationalisation category. The majority of
the firms export and more than 30% of them conduct commercial penetration operations. The
frequency of firms that take on offshoring is quite small, representing 7.5% of the total. The least-
chosen mode is FDI. The sampling distribution of the patterns of internationalisation is reported in
Table 2.
Table 1
Table 2
We notice that the first ten combinations (ordered by frequency) account for 91% of all the
firms. Of these firms, 22% do not engage in any form of internationalisation while 32% are only
exporters. Firms exporting and conducting commercial penetration constitute 11% of the firms and
another 7% have also entered into trade and technical agreements with foreign firms. Other
combinations of internationalisation modes are less frequent, but we notice that all involve exporting.
Under the category “Others” are combinations with a frequency smaller than 1%; together these
account for about the 9% of the firms.
5. THE MODEL SPECIFICATION
The MVP is fitted to the six internationalisation modes defined in the previous section. Binary
dependent variables and equations are defined for each of them as in (1).
10
In the literature, different covariates are proposed for different internationalisation forms.
However, non-equity internationalisation forms are not considered, nor are the correlations between
those and the more traditional modes. Therefore, to avoid any a priori selection of the relevant
covariates, we adopt the same set of covariates for each equation of the MVP and we leave to the
hypothesis tests the task of detecting significant effects. Obviously, the analysis could lead to the
identification of different sets of significant covariates for each mode. In the following paragraphs, we
briefly discuss the choice of the covariates (for their exact definition see Table 2.A in the Appendix).
Basic structural characteristics are size, economic activity, and geographical location. Although it
is generally believed that a firm should be large to compete in the global market, the empirical evidence
is mixed. In particular, Sterlacchini (2001) finds a positive relation between export and size extending
only until an upper limit above which the size of a firm does not increase its export propensity, while
Basile et al. (2003) find that the effect of size is very small for firms engaging in export, commercial
penetration, and FDI and even negative for firms engaging only in export. The Pavitt classification,3
rather than the Nace-based industry classification, is used in order to control for the sample design.
However, the Pavitt classification is meaningful because it identifies sectoral patterns of technological
change that are strongly industry-specific (Sterlacchini, 2001). We used four classes of geographical
location and a dummy for location in industrial districts. Evidence of a positive effect of the firm’s
location in an industrial district on its export performance has been found in Becchetti and Rossi (2000)
and Intesa San Paolo (2007).
Internationalisation is expected to be positively associated with an higher share of skilled workers
because it usually requires more white collar activities or because of skill upgrading due to the
offshoring of low-skill production activities (Lipsey, 2002). However, a negative sign may arise when
the choice of offshoring or outsourcing originates from the lack of in-house specialised skills or
equipment, (Abraham and Taylor, 2006). We also consider an indicator of capital intensity (the ratio
capital/employment). As far as offshoring and outsourcing are concerned, a negative association with
capital intensity implies that firms are more willing to outsource labour-intensive activities (Antonietti
and Cainelli, 2008).
Foreign-owned/controlled firms are likely to be part of international networks and linked to
other affiliates overseas; this may facilitate the commercial penetration of international markets as well
as the outsourcing of services or production activities (Girma et al., 2004, Cusmano et al., 2006). Group
membership might provide firms with the necessary marketing and financial resources to
internationalise (Sterlacchini, 2001, Benfratello and Razzolini, 2008). By joining a consortium, partners
are able to exploit economies of scale and scope that cannot be pursued by individual firms (Basile et
al., 2003).
3 The Pavitt taxonomy is a classification of economic sectors based on technological opportunities, innovations, R&R intensity, and knowledge. For details on categories, see Table A.2 in the appendix.
11
The relationship with productivity has been widely discussed in Section 2. Different measures of
the total factor productivity have been used in literature depending on the amount of information
available. We adopt the approach pioneered by Olley and Pakes (1996) and developed by Levinson and
Petrin (2003) that, in a semi-parametric framework, deals with the simultaneity problem between input
decisions and productivity shock by assuming deflated intermediate costs as proxy of capital. The TFP
is measured at the firm level by estimating a two factor Cobb-Douglas production function separately
for groups of industries, with value added as output, total costs of labour as labour input and the book
value of fixed and intangible assets as capital input. All variables are provided by balance sheets and
deflated by proper index numbers. Estimated firm-specific TFPs are scaled with respect to industry
means so that the estimated TFP provides a relative measures of how specific firm TFP diverges from
the average.
The literature has recently revealed the role of technological innovation in improving exports and
FDI (Castellani and Zanfei, 2006, 2007). Basile et al. (2003) find that innovative activities have positive
effects on other internationalisation modes as well (commercial penetration and trade and technical
agreement). We measure innovative activity with different variables: a dummy for formal R&D
expenditures in the period 2001–2003, two dummies for innovation in products or processes, a dummy
for organisational innovation due to product or process innovation, a dummy for investment in
Information and Communication Technologies (ICT)4.
6. MODEL ESTIMATES
6.1. Marginal probabilities
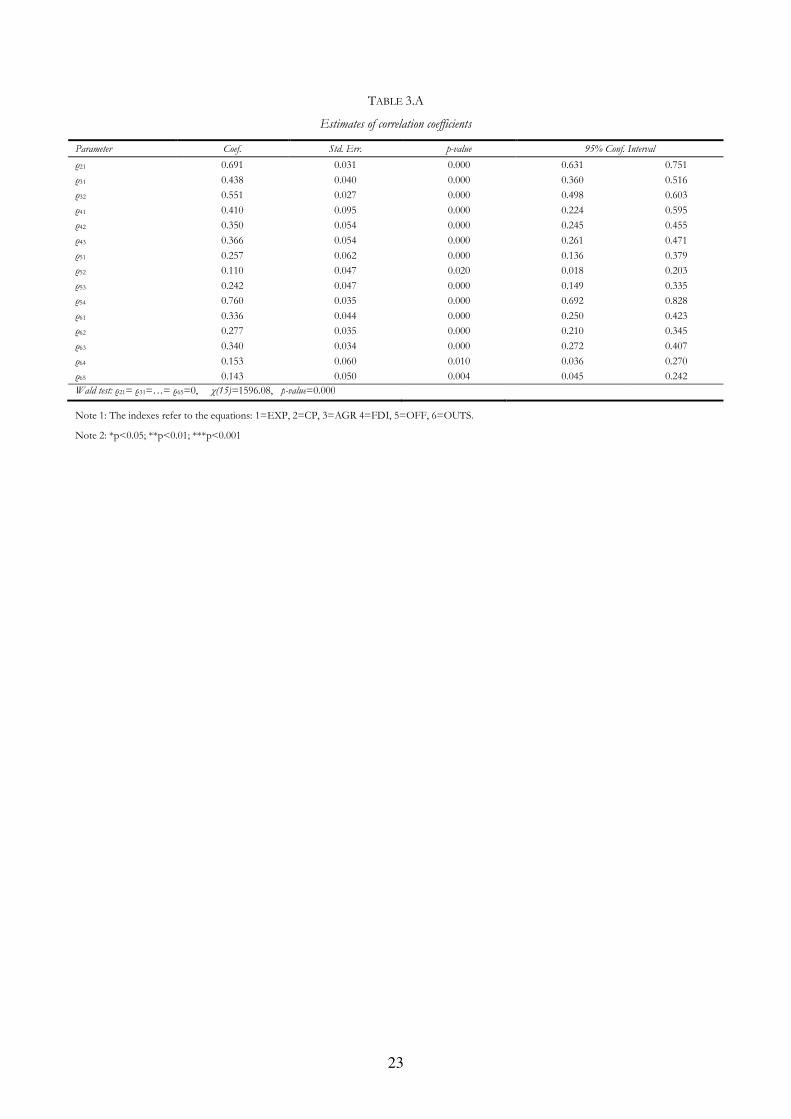
Correlation coefficient estimates (Table 3.A in the Appendix) are all positive and significant and
the hypothesis that all correlation coefficients are jointly equal to zero is rejected5. This confirms that
the MVP model is a better specification than the six distinct univariate probit models for the observed
data. A correlation coefficient different from zero between a pair of choices means that there are
unobservable factors affecting both choices and reveals an association after controlling for firm
characteristics. After accounting for observable firm’s heterogeneity, there still remains a relevant
positive correlation among some of the pairs of choices.
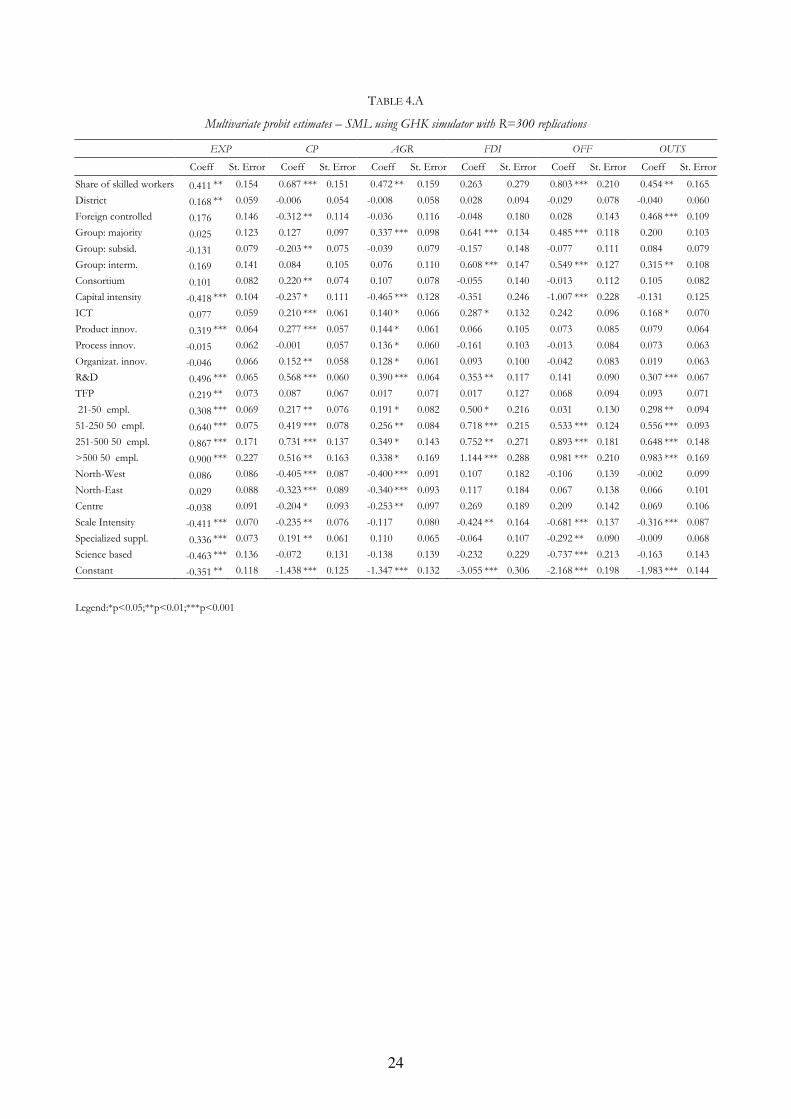
Results on estimated MVP coefficients are reported in Table 4.A of the Appendix. Distinct Wald
tests for the hypothesis that all the coefficients in each equation are jointly equal to zero reject the null
hypothesis as well as the hypothesis that the vectors of coefficients are equal across the six equations.
The results generated by these last two sets of tests are not reported but available upon request.
4 The survey collects data on the amount of R&D expenditures and investment in ICT, but we did not use them due to the large amount of missing data. 5 The model has been estimated using STATA (StataCorp, 2005) ml command, with a self-supplied code for the log-likelihood calculation, and the modules
mdraws and mvnp developed by Cappellari and Jenkins (2006).
12
We summarise the results by focusing on the marginal effects (MEs) on marginal probabilities for
each dependent variable (Table 3). In other words, we consider the probability of choosing each
internationalisation mode, irrespective of the choice of the remaining modes. Each ME represents the
change in probability of success given a one-unit change in the associated regressor (a change from
zero to one for binary variables). For the m-th equation and the k-th continuous covariate, the marginal
effect is calculated using mkmmmkmkm
xxxyE ββφ ˆ)ˆ()|( ′=∂∂ at mean values for the covariates (Greene,
2003). For the k-th binary variable, the difference )0|1(ˆ)1|1(ˆ ==−==mkmmkm
xyPxyP is calculated
holding all other covariates constant at mean values6. Here, mk
β is the coefficient estimate of the
covariate mk
x from the mode-type m equation, and )(⋅φ is the probability density function of a standard
normal distribution with zero mean and unit variance.
Table 3
The first row of Table 3 reports the estimated predicted probability (from now on: PPR) at mean
values of the covariates. The probability for each internationalisation mode generally increases with
size. The Pavitt sector has significant associations only with exports, commercial penetration, and
offshoring. Specialised suppliers are those that mostly export and carry out commercial penetration,
while firms in the supplier-dominated sector (which comprises “traditional” industries) choose to
offshore more frequently. It may be argued that firms in the traditional sectors resort to offshoring in
their attempts to reduce production costs. Scale-intensive firms are the ones that are less likely engaged
in any form of internationalisation. Firms located in the South of Italy, more than others, venture
commercial penetration and conclude agreements with foreign firms. No significant associations are
found with other internationalisation forms.7
The share of skilled workers is significantly and positively associated with all internationalisation
modes except FDI. Results confirm previous findings that firms located in industrial districts export
more than others, but we do not find significant associations with other internationalisation modes.
Group membership is associated with the internationalisation process, but this relationship depends on
the firm’s position in the group. Firms that have a majority position have a greater probability of
concluding agreements and engaging in FDI and offshoring. Firms in the intermediate position also
have a greater probability not only to execute FDI and offshoring ventures but also to outsource
services abroad. This evidence can be explained by the fact that the controlling firms, as well as
intermediate firms, may invest in or let other firms of the group produce for them. In contrast,
6 Because marginal effects are a non-linear combination of model parameters, standard errors (not reported) were estimated by the Delta method and significance was tested by a Wald test. Detailed results are available from the authors upon request. 7 In a previous estimation exercise not reported here, with no industrial district indicator and a dummy for investments in fixed capital instead of capital intensity, we found a strong positive association between locations in the North of Italy and exports.

13
subsidiary firms are less likely to adopt commercial penetration than others. Belonging to a consortium
also facilitates the commercial penetration of foreign markets. Foreign-owned firms have a lower
probability of engaging in commercial penetration but a higher probability of outsourcing services from
abroad. Here, the reverse of the explanation used for group membership may be applied if foreign-
owned firms are members of economic groups in intermediate or subsidiary positions. Capital intensity
has a strong negative association with offshoring, implying that firms are especially willing to relocate
labour-intensive activities. However, a significant negative association is also found with exports,
commercial penetration, and agreements, implying that firms involved in more capital-intensive
activities are less interested in international commitment. As expected, innovative activity has a strong
and positive association with internationalisation. The probability of exporting is greater for firms
investing in research and development and producing innovative products. Effects on the probability
of engaging in commercial penetration are even more valuable: plus 19 points for firms investing in
R&D, plus 5 points for firms producing innovative products and introducing innovations in
organisation, plus 7 points for firms investing in ICT. The probability of concluding agreements with
foreign firms is higher for firms investing in R&D, innovating products, processes, and organisation,
and investing in ICT. Firms investing in R&D and in ICT also have a greater probability of engaging in
FDI and outsourcing of services. On the contrary, the only significant association with offshoring is
found to be investments in ICT. This may suggest that offshoring is also carried out by firms whose
core activity is not producing innovative products to improve their competitiveness by reducing
production costs in low-wage countries. TFP is found to be significantly and positively associated only
with export. This last result seems surprising in view of the recent empirical evidence of significant
productivity differentials between domestic firms, exporters and multinational firms. We have to stress,
however, that each marginal probability evaluates the probability for a firm to engage in one specific
internationalisation form without considering the choice to internationalise in other ways.
6.2. Comparing marginal and joint probabilities: the “value added” of the MVP
In order to highlight the relevance of adopting an MVP model and to consider the whole set of
choices, we analyze the estimated MEs on some selected marginal and joint probabilities. We discuss
this point considering probabilities referred to patterns, where the choice of exporting is always
included8:
i) the probability to EXP irrespective of the other choices (A: ( )P EXP 1, , , , ,= ),
ii) the two tri-variate probabilities involving EXP, FDI and OFF, the forms traditionally considered in
the literature on firm internationalisation, (B: ( )P EXP FDI OFF1, , , 0, 0,= = = and D:
( )P EXP FDI OFF1, , , 1, 1,= = = );
8 The estimates of MEs referred to the remaining probabilities are available from the author upon request.
14
iii) the six-variate probability of exporting in absence of the remaining modes (C:
( )P EXP CP AGR FDI OFF OUTS1, 0, 0, 0, 0, 0= = = = = = );
iv) the six-variate probability of adopting EXP, FDI and OFF, but not CP, AGR and OUTS (E:
( )P EXP CP AGR FDI OFF OUTS1, 0, 0, 1, 1, 0= = = = = = );
v) the six-variate probability of performing all of the internationalisation modes considered (F:
( )P EXP CP AGR FDI OFF OUTS1, 1, 1, 1, 1, 1= = = = = = ).
The estimates of the five probabilities mentioned above and their MEs are reported in Table 4.
Conditional and joint probabilities are highly nonlinear in both parameters and X variables, which
prevent a tractable analytical solution of MEs and standard errors (SEs). SEs for the predicted
probabilities and MEs are then calculated using simulation and numerical gradients. In particular, we
simulate 500 sets of parameters from an asymptotic multivariate normal distribution, each time
calculating the predicted probability and its numerical derivatives with respect to the relevant covariates
evaluated at the means of all covariates. We thereby obtain 500 sets of PPR and MEs. Sample SEs are
then calculated as estimates of the SEs for the PPR and MEs.
As can be seen in the first row of the table, the magnitude of the PPRs is very different among
probabilities (ranging from 0.1% to 80%) for the patterns considered and, more importantly, the
estimated MEs are quite different as well. Comparing A, B, and C, representing probabilities of
exporting conditioned on different sets of alternatives, we see that the effects of many covariates
change significance and even sign. The proportion of skilled workers, product innovation, investment
in R&D, size and also productivity have a significant positive effect on the marginal probability of
exporting (A), but they are no more significant or even have a significant negative effect on the
probability of only exporting when we consider some or all of the other internationalisation choices (B
and C). The opposite happens for capital intensity. When exporting is the only choice considered, the
probability of exporting (A) neglects that most exporting firms are also pursuing other strategies while
most of the non-exporting firms do not pursue any other form of internationalisation. Therefore, the
positive relationship between these covariates and exporting is inflated by the fact that exporting firms
are also utilising other strategies to participate in international markets. Such strategies are more likely
to be pursued by firms that are larger, have more skilled workers, and are more innovative and
productive compared to firms that are not internationally involved. When a wider set of alternatives is
considered, these effects can be disentangled. The estimated MEs on the probabilities of performing
other strategies besides export (D, E or F) support this conclusion. In particular, productivity has a
positive effect on the marginal probability of exporting (A) and on the probability of only exporting
when FDI and OFF are also considered (B), but this does not affect either of the other probabilities.
This means that productivity principally discriminates between exporting and non-exporting firms but
its effect on exporting firms depends on the set of internationalisation modes considered. Similarly, if
15
we compare the MEs related to the tri-variate probability to export, to perform FDI and OFF (D) with
the six-variate probability to export, and to perform FDI and OFF but in the absence of the remaining
three internationalisation modes (E), it arises that, though the signs of the significant MEs are the same,
the effects are more intense for the tri-variate probability. These effects (positive or negative) are driven
by the choice to perform at least some other internationalisation form besides EXP, FDI and OFF.
Table 4
Furthermore, comparing A with B and D, we see that the location in a district, product
innovation, and productivity significantly affect the marginal probability to export (A) and the
probability to only export when FDI and OFF are also considered (B). However, these relationships
are not significant when the firm chooses to jointly perform all three internationalisation forms (D).
This indicates that each of these covariates increases the probability to export only if exporting is the
only mode adopted.
In summary, these results indicate unequivocally that any conclusion concerning patterns of
internationalisation and their link with firm characteristics depends heavily on the set of the
internationalisation modes considered as the outcome variable. There are a number of comparisons
that could be realised, but these examples suffice to confirm that a full understanding of the firms’
propensity to engage in international markets and its relationship with firms’ heterogeneity requires
considering the whole set of internationalisation modes in a multivariate framework.
7. THE INTERNATIONALISATION PATTERNS
The estimate of a MVP produces a very rich and informative output in terms of joint and
conditional probabilities and of the corresponding MEs. In this section, we analyse these results with
the aim of demonstrating how heterogeneity affects the internationalisation pattern (sect. 7.1) and of
checking some hypotheses present in the literature on firms’ internationalisation processes (sect. 7.2).
7.1 Firm heterogeneity and internationalisation strategies
In Table 5, we report the estimated six-variate joint probabilities that are referred to the entire set
of the internationalisation modes considered, but selected among those that are above 5%. The last
column reports the probability of adopting the entire set of internationalisation modes. We also present
the corresponding MEs.
As expected, the PPRs confirm the descriptive analysis reported in Section 4. A relevant
percentage of firms (17.5%) do not participate in the international markets (domestic firms) and more
than one third only export. Other common patterns always involve exporting, sometimes accompanied
16
by CP (PPR equal to 12.5%), by CP and AGR (PPR equal to 6.3%), and by OUTS (PPR equal to
5.5%). The PPR to adopt the whole set of internationalisation modes is very low and equal to 0.15%.
The estimated MEs show that the effects of covariates differ in sign and magnitude depending on
the internationalisation pattern. The probability to not be involved in an international market:
- ( )P EXP CP AGR FDI OFF OUTS0, 0, 0, 0, 0, 0= = = = = = , denoted as A,
is greater for firms that have a smaller share of skilled workers, are smaller in size, and do not belong to
a district. Furthermore, innovating products and investing in ICT and R&D reduce the probability to
be domestic, whereas this probability increases with capital intensity. Firms in scale-intensive and in
science-based sectors are more likely to be domestic than specialised and traditional firms. Finally, as
expected, less productive firms have a higher probability to be domestic: this means that the most
productive firms have a higher probability to be internationally involved in some way. A number of
covariates affecting the probability to be domestic are also related to the probability of only exporting
(B: ( )P EXP CP AGR FDI OFF OUTS1, 0, 0, 0, 0, 0= = = = = = ). MEs of share of skilled workers, firm size,
ICT and R&D show the same sign in A and B; therefore, we can conclude that these firms do not
differ from domestics in these characteristics, whereas belonging to a district increases the probability
to export but not to engage in other internationalisation strategies. The probability of only exporting is
smaller for firms in a group with a majority position and greater for firms in the North.
Table 5
From results referring to patterns that include EXP, CP and/or AGR, given by:
- ( )P EXP CP AGR FDI OFF OUTS1, 1, 0, 0, 0, 0= = = = = = denoted as C,
- ( )P EXP CP AGR FDI OFF OUTS1, 1, 1, 0, 0, 0= = = = = = ) denoted as D,
new findings arise. Both probabilities are greater for firms with a higher share of skilled workers, with
product and organisational innovation, that invest in R&D, and that belong to specialised supplier
industries. The probability to engage in EXP, CP and/or AGR is smaller for firms that are foreign-
controlled, belong to a group in a subsidiary position, have higher capital intensity, and are located in
northern regions.
The probability to perform both EXP and OUTS:
- ( )P EXP CP AGR FDI OFF OUTS1, 0, 0, 0, 0, 1= = = = = = , denoted as E,
is higher for firms that are foreign-owned, are larger in size, and are located in the North; however, the
probability is lower for firms operating in scale-intensive industries.
Finally, the probability to adopt all of the internationalisation modes:
17
- ( )P EXP CP AGR FDI OFF OUTS1, 1, 1, 1, 1, 1= = = = = = , denoted as F, is greater for firms with a higher
share of skilled workers, for firms investing in ICT and R&D, for larger firms, and for firms that are
members of a group in a majority or intermediate position. Firms with higher capital intensity and that
belong to scale-intensive or science-based industries are less likely to pursue all the strategies of
internationalisation.
In summary, some main points arise from the analyses: i) a remarkable portion of firms adopt
only non-equity forms of internationalisation, ii) a significant portion of firms adopt, in addition to the
most traditional internationalisation form (i.e., EXP), non-equity forms characterised by greater sunk
costs and greater organisational commitment to international activities than EXP (CP, AGR and
OUTS), iii) the most complex internationalisation pattern, that based on the adoption of the entire set
of modes considered, is implemented by a very small percentage of firms, iv) there is noticeable
heterogeneity between these groups. Referring to this last point, domestic firms or firms adopting only
EXP have, as expected, a lower share of skilled workers and a smaller size, they do not perform
innovative activities, they have higher capital intensity, and they operate in the scale-intensive and
science-based sectors. Domestic firms are also less productive. Firms that engage in CP, AGR and
EXP differ from the groups described above. They have a higher share of skilled workers, they have
innovation and R&D potentialities, and they belong to a group that is not in a subsidiary position.
Firms that engage in OUTS and EXP are most likely foreign-controlled, larger in size, and located in
the northern region of the country. Finally, firms with the most complex internationalisation pattern
are large firms that belong to a group in a majority or intermediate position and operate in traditional
or specialised-supplier sectors, investing in R&D and in ICT but with a lower capital intensity.
Productivity lowers the probability to be domestic but has no particular effects on the choice of any
specific pattern of internationalisation. It appears that productivity affects the choice to stay domestic
or to be internationally involved in some way, but that it does not affect the choice among the different
internationalisation modes. In fact, this conclusion agrees with the results in section 6.2: non-exporting
firms are generally domestic, i.e., do not pursue any internationalisation strategy, whereas firms
operating in an international market are almost all exporting.
7.2. The complementary/substitutive hypothesis
In order to contribute to the debate on the nature of firms’ internationalisation processes we test
the hypothesis of the substitutive process versus the complementary process. To do so, we analyse
some selected conditional probabilities and their MEs, reported in Table 6.
Because the literature traditionally focuses on EXP, FDI, and OFF, we limit the analysis to these
three forms of internationalisation. In order to test the above hypothesis, we consider the difference
between the probability to perform OFF/FDI among exporters (complementary) and the
18
corresponding probability among non-exporters (substitution), i.e., the differences between the
conditional probabilities:
- ( ) ( )P OFF EXP P OFF EXP1 1 1 0= = − = = , denoted as A,
- ( ) ( )P FDI EXP P FDI EXP1 1 1 0= = − = = , denoted as B.
The positive values of PPR (first row of Tab. 6) show that the probabilities to perform FDI or
OFF are larger among exporters as compared to non-exporters. A and B are equal to 3.5% and to 2%,
respectively, and they are both significantly different from zero. This result indicates that firms are
more likely to perform OFF or FDI jointly with EXP, supporting the complementary hypothesis over
and against the substitutive one.
Table 6
Second, we test the substitutive/complementary hypothesis with reference to the two categories
of equity (OFF, FDI) and non-equity (EXP, CP, AGR) forms. We consider the difference between the
probability to perform equity forms among firms that also carry out non-equity forms (complementary)
and the corresponding probability among firms that do not realise non-equity forms (substitution):
- ( ) ( )P OFF FDI EXP CP AGR P OFF FDI EXP CP AGR1, 1 1, 1, 1 1, 1 0, 0, 0= = = = = − = = = = = , denoted as
C. The estimated difference between these probabilities (first row of the Tab. 6), is positive and equal
to 3.6%, indicating that for equity and non-equity internationalisation forms as well, the complementary
hypothesis prevails over the substitutive one.
Obviously, a number of other combinations of the six internationalisation modes could have
been considered, but here we limit the analyses to those described above because we deem them to be
the most interesting.
We now consider the estimated MEs on the differences between the conditional probabilities
above: significant estimated MEs indicate which covariates significantly affect the propensity to adopt
complementary strategies or to substitute one for another. To simplify, we refer to a dummy covariate
describing a certain characteristic. When the estimated ME is positive, firms with that characteristic are
more likely to adopt the complementary process instead of the substitutive one. In contrast, a negative
ME reduces the probability to prefer a complementary scheme over a substitutive one; in particular
when the value of ME is greater in absolute value than the value of PPR, firms with that characteristic
are more likely to adopt a substitutive process.
Considering the difference in probability to perform OFF/FDI between exporters and non
exporters (columns A and B), the propensity to adopt complementarities between FDI/OFF and EXP
increases for firms that are members of a group in a majority or intermediate position, that have a larger
size (and the effect grows with the size), and that invest in ICT. In contrast, firms belonging to sectors
19
other than supplier-dominated are less likely complement EXP and OFF or FDI than traditional ones.
The results illustrated here are almost identically valid for both OFF and FDI.
Turning to the equity and non-equity forms (column C), the difference in probabilities is
positively affected by almost the same set of covariates with MEs that are similar in magnitude or in
some cases larger: large firms operating in a group are more likely to choose complementarities
between equity and non-equity strategies when other non-equity forms besides EXP are considered.
The substitution of equity forms for non-equity forms is preferred, instead, by firms with higher
capital intensity, for which the estimated MEs are negative and in absolute value greater than the
respective PPRs (at least for A and C): increasing the capital intensity reverses the sign of the difference
between probabilities, i.e., the difference becomes negative, thus supporting the substitutive hypothesis.
In summary, the complementary process is preferred to the substitutive one: firms jointly adopt
different forms of internationalisation instead of replacing forms that require low sunk costs with more
demanding forms. This conclusion is referred to the relationship between the traditional
internationalisation modes (FDI/OFF and EXP), but also applies to strategies that have rarely been
considered in the literature, such as CP and AGR. In fact, firms prefer to jointly perform equity and
non-equity modes instead of substituting them. The preference for a complementary process is more
pronounced for larger firms that are members in a group in a majority or intermediate position and
investing in ICT. Exceptions are more capital-intensive firms that seem to prefer a substitutive process.
8. CONCLUSIONS
Results obtained in this study can be summarised along four main themes.
First, the consideration of non-equity internationalisation forms, in addition to the more
traditional exports and FDI, allows a detailed description of firm behaviour in expanding abroad. A
remarkable portion of firms adopt only non-equity internationalisation forms, a kind of alternative
generally neglected in the literature.
Second, the adoption of the MVP allows us to generate multivariate outcomes that correspond
to all possible combinations of internationalisation choices. We show that disregarding some
alternatives faced by the firms can lead to unreliable results because any conclusion concerning the
patterns of internationalisation and their link with firm characteristics depends heavily on the set of
internationalisation modes considered as outcome variables.
Third, the empirical evidence presented in this study confirms the idea present in the most recent
literature that firm heterogeneity needs to be described by means of a multiplicity of firm characteristics
in addition to productivity. The groups of domestic firms or of firms adopting only export have a
lower share of skilled workers and are smaller in size, they do not perform innovative activities, they
have high capital intensity, and they operate in the scale-intensive and science-based sectors. Domestic
20
firms are also less productive than firms engaging in international activities. The group of firms that
engage in non-equity forms besides export assumes very different characteristics compared to the
groups described above. This group mainly consists of firms with a higher share of skilled workers,
with innovation and R&D potentialities, that belongs to a group that is not in a subsidiary position.
Firms that jointly engage in service outsourcing and export are most likely foreign-controlled, with a
larger size, located in the North of Italy. Firms adopting the entire set of forms are very rare; they are
large firms that belong to a group in a majority or intermediate position and in traditional or specialised
supplied sectors, investing in R&D and in ICT but with a lower capital intensity. Regarding
productivity, our results suggest that it affects the choice to stay domestic or to be internationally
involved in some way but not the choice among different internationalisation modes.
Fourth, the complementary process is preferred to the substitutive one. This is true for the
traditional internationalisation modes (foreign direct investment/off-shoring that cumulates with
export), but also for non-equity forms. Firms prefer to jointly perform equity and non-equity modes
instead of substituting the latter for the former, characterised by greater sunk costs, independent from
the level of productivity. The probability to adopt a complementary process is greater for larger firms
that are members of a group in a majority or intermediate position, and that realise ICT investment.
We hope that this multifaceted picture of firms’ internationalisation patterns could be a stimulus
to extend the model of heterogeneous firms (Melitz, 2003; Helpman et al., 2004) to more than two
forms of firms’ international involvement.
21
APPENDIX
TABLE 1.A
Distribution by industry and size, initial and final sample
Initial sample Final sample
Industry Freq. Percent Freq. Percent
Food and beverages 484 11.29 358 11.54
Textiles 331 7.72 255 8.22
Clothing 141 3.29 110 3.54
Leather 174 4.06 125 4.03
Wood 112 2.61 85 2.74
Paper products 113 2.64 86 2.77
Printing and publishing 107 2.5 81 2.61
Coke, refined petroleum products and nuclear fuel 29 0.68 24 0.77
Chemicals 238 5.55 171 5.51
Rubber and plastics 224 5.23 169 5.45
Non-metal minerals 262 6.11 181 5.83
Metals 165 3.85 104 3.35
Metal products 545 12.71 402 12.96
Nonelectric machinery 614 14.32 430 13.86
Office equipment and computers 12 0.28 7 0.23
Electric machinery 170 3.97 113 3.64
Electronic material and communication 83 1.94 59 1.9
Medical apparels and instruments 82 1.91 60 1.93
Vehicles 74 1.73 47 1.51
Other transportation 44 1.03 25 0.81
Furniture 276 6.44 211 6.8
Missing 0.16 0.16
Total 4 287 100 3 103 100
Size
11-20 employees 948 22.11 671 21.62
21-50 employees 1 267 29.55 973 31.36
51-250 employees 1 584 36.95 1 214 39.12
251-500 employees 226 5.27 144 4.64
>500 employees 262 6.11 101 3.25
Total 4 287 100 3 103 100
22
TABLE 2.A
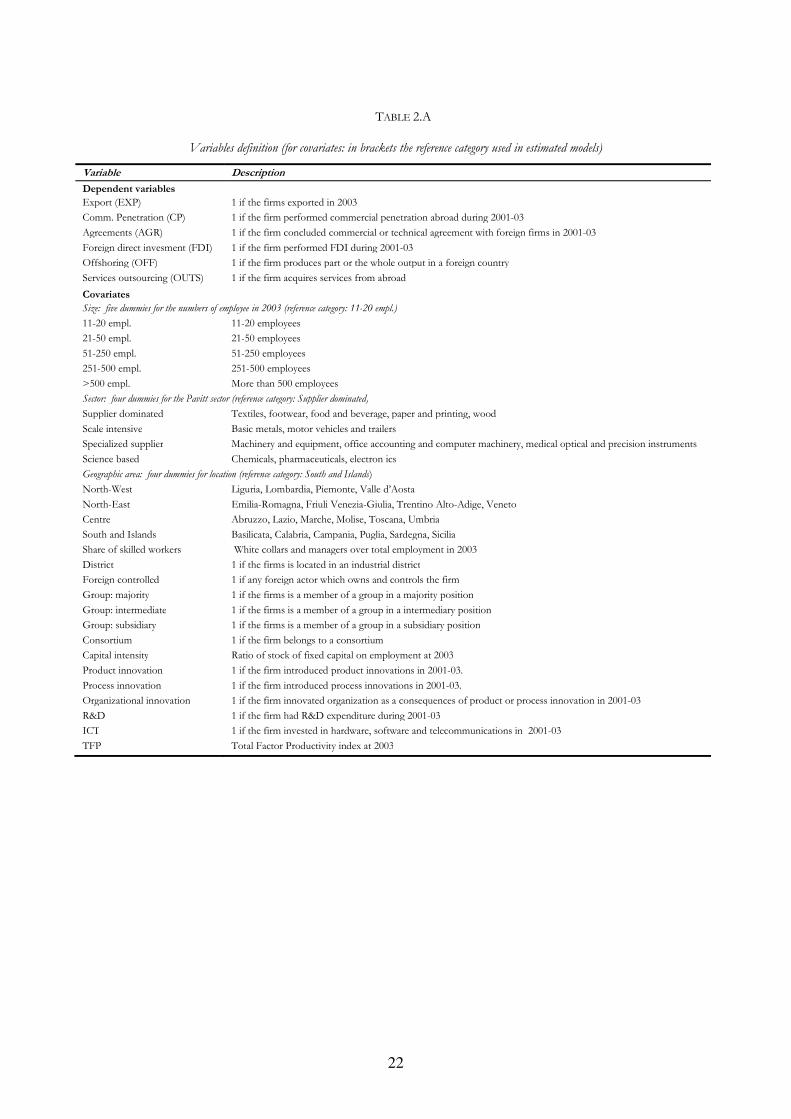
Variables definition (for covariates: in brackets the reference category used in estimated models)
Variable Description
Dependent variables
Export (EXP) 1 if the firms exported in 2003
Comm. Penetration (CP) 1 if the firm performed commercial penetration abroad during 2001-03
Agreements (AGR) 1 if the firm concluded commercial or technical agreement with foreign firms in 2001-03
Foreign direct invesment (FDI) 1 if the firm performed FDI during 2001-03
Offshoring (OFF) 1 if the firm produces part or the whole output in a foreign country
Services outsourcing (OUTS) 1 if the firm acquires services from abroad
Covariates
Size: five dummies for the numbers of employee in 2003 (reference category: 11-20 empl.)
11-20 empl. 11-20 employees
21-50 empl. 21-50 employees
51-250 empl. 51-250 employees
251-500 empl. 251-500 employees
>500 empl. More than 500 employees
Sector: four dummies for the Pavitt sector (reference category: Supplier dominated)
Supplier dominated Textiles, footwear, food and beverage, paper and printing, wood
Scale intensive Basic metals, motor vehicles and trailers
Specialized supplier Machinery and equipment, office accounting and computer machinery, medical optical and precision instruments
Science based Chemicals, pharmaceuticals, electron ics
Geographic area: four dummies for location (reference category: South and Islands)
North-West Liguria, Lombardia, Piemonte, Valle d’Aosta
North-East Emilia-Romagna, Friuli Venezia-Giulia, Trentino Alto-Adige, Veneto
Centre Abruzzo, Lazio, Marche, Molise, Toscana, Umbria
South and Islands Basilicata, Calabria, Campania, Puglia, Sardegna, Sicilia
Share of skilled workers White collars and managers over total employment in 2003
District 1 if the firms is located in an industrial district
Foreign controlled 1 if any foreign actor which owns and controls the firm
Group: majority 1 if the firms is a member of a group in a majority position
Group: intermediate 1 if the firms is a member of a group in a intermediary position
Group: subsidiary 1 if the firms is a member of a group in a subsidiary position
Consortium 1 if the firm belongs to a consortium
Capital intensity Ratio of stock of fixed capital on employment at 2003
Product innovation 1 if the firm introduced product innovations in 2001-03.
Process innovation 1 if the firm introduced process innovations in 2001-03.
Organizational innovation 1 if the firm innovated organization as a consequences of product or process innovation in 2001-03
R&D 1 if the firm had R&D expenditure during 2001-03
ICT 1 if the firm invested in hardware, software and telecommunications in 2001-03
TFP Total Factor Productivity index at 2003
23
TABLE 3.A
Estimates of correlation coefficients
Parameter Coef. Std. Err. p-value 95% Conf. Interval
ρ21 0.691 0.031 0.000 0.631 0.751
ρ31 0.438 0.040 0.000 0.360 0.516
ρ32 0.551 0.027 0.000 0.498 0.603
ρ41 0.410 0.095 0.000 0.224 0.595
ρ42 0.350 0.054 0.000 0.245 0.455
ρ43 0.366 0.054 0.000 0.261 0.471
ρ51 0.257 0.062 0.000 0.136 0.379
ρ52 0.110 0.047 0.020 0.018 0.203
ρ53 0.242 0.047 0.000 0.149 0.335
ρ54 0.760 0.035 0.000 0.692 0.828
ρ61 0.336 0.044 0.000 0.250 0.423
ρ62 0.277 0.035 0.000 0.210 0.345
ρ63 0.340 0.034 0.000 0.272 0.407
ρ64 0.153 0.060 0.010 0.036 0.270
ρ65 0.143 0.050 0.004 0.045 0.242
Wald test: ρ21= ρ31=…= ρ65=0, χ(15)=1596.08, p-value=0.000
Note 1: The indexes refer to the equations: 1=EXP, 2=CP, 3=AGR 4=FDI, 5=OFF, 6=OUTS.
Note 2: *p<0.05; **p<0.01; ***p<0.001
24
TABLE 4.A
Multivariate probit estimates – SML using GHK simulator with R=300 replications
EXP CP AGR FDI OFF OUTS
Coeff St. Error Coeff St. Error Coeff St. Error Coeff St. Error Coeff St. Error Coeff St. Error
Share of skilled workers 0.411 ** 0.154 0.687 *** 0.151 0.472 ** 0.159 0.263 0.279 0.803 *** 0.210 0.454 ** 0.165
District 0.168 ** 0.059 -0.006 0.054 -0.008 0.058 0.028 0.094 -0.029 0.078 -0.040 0.060
Foreign controlled 0.176 0.146 -0.312 ** 0.114 -0.036 0.116 -0.048 0.180 0.028 0.143 0.468 *** 0.109
Group: majority 0.025 0.123 0.127 0.097 0.337 *** 0.098 0.641 *** 0.134 0.485 *** 0.118 0.200 0.103
Group: subsid. -0.131 0.079 -0.203 ** 0.075 -0.039 0.079 -0.157 0.148 -0.077 0.111 0.084 0.079
Group: interm. 0.169 0.141 0.084 0.105 0.076 0.110 0.608 *** 0.147 0.549 *** 0.127 0.315 ** 0.108
Consortium 0.101 0.082 0.220 ** 0.074 0.107 0.078 -0.055 0.140 -0.013 0.112 0.105 0.082
Capital intensity -0.418 *** 0.104 -0.237 * 0.111 -0.465 *** 0.128 -0.351 0.246 -1.007 *** 0.228 -0.131 0.125
ICT 0.077 0.059 0.210 *** 0.061 0.140 * 0.066 0.287 * 0.132 0.242 0.096 0.168 * 0.070
Product innov. 0.319 *** 0.064 0.277 *** 0.057 0.144 * 0.061 0.066 0.105 0.073 0.085 0.079 0.064
Process innov. -0.015 0.062 -0.001 0.057 0.136 * 0.060 -0.161 0.103 -0.013 0.084 0.073 0.063
Organizat. innov. -0.046 0.066 0.152 ** 0.058 0.128 * 0.061 0.093 0.100 -0.042 0.083 0.019 0.063
R&D 0.496 *** 0.065 0.568 *** 0.060 0.390 *** 0.064 0.353 ** 0.117 0.141 0.090 0.307 *** 0.067
TFP 0.219 ** 0.073 0.087 0.067 0.017 0.071 0.017 0.127 0.068 0.094 0.093 0.071
21-50 empl. 0.308 *** 0.069 0.217 ** 0.076 0.191 * 0.082 0.500 * 0.216 0.031 0.130 0.298 ** 0.094
51-250 50 empl. 0.640 *** 0.075 0.419 *** 0.078 0.256 ** 0.084 0.718 *** 0.215 0.533 *** 0.124 0.556 *** 0.093
251-500 50 empl. 0.867 *** 0.171 0.731 *** 0.137 0.349 * 0.143 0.752 ** 0.271 0.893 *** 0.181 0.648 *** 0.148
>500 50 empl. 0.900 *** 0.227 0.516 ** 0.163 0.338 * 0.169 1.144 *** 0.288 0.981 *** 0.210 0.983 *** 0.169
North-West 0.086 0.086 -0.405 *** 0.087 -0.400 *** 0.091 0.107 0.182 -0.106 0.139 -0.002 0.099
North-East 0.029 0.088 -0.323 *** 0.089 -0.340 *** 0.093 0.117 0.184 0.067 0.138 0.066 0.101
Centre -0.038 0.091 -0.204 * 0.093 -0.253 ** 0.097 0.269 0.189 0.209 0.142 0.069 0.106
Scale Intensity -0.411 *** 0.070 -0.235 ** 0.076 -0.117 0.080 -0.424 ** 0.164 -0.681 *** 0.137 -0.316 *** 0.087
Specialized suppl. 0.336 *** 0.073 0.191 ** 0.061 0.110 0.065 -0.064 0.107 -0.292 ** 0.090 -0.009 0.068
Science based -0.463 *** 0.136 -0.072 0.131 -0.138 0.139 -0.232 0.229 -0.737 *** 0.213 -0.163 0.143
Constant -0.351 ** 0.118 -1.438 *** 0.125 -1.347 *** 0.132 -3.055 *** 0.306 -2.168 *** 0.198 -1.983 *** 0.144
Legend:*p<0.05;**p<0.01;***p<0.001
25
REFERENCES
K.G. Abraham, S.K. Taylor, Firm’s use of outside contractors: theory and evidence, Journal of Labor Economics 14 (3) (1996) 394-424.
R. Antonietti, G. Cainelli, Spatial agglomeration, technology and outsourcing of knowledge intensive business services. Empirical insights from Italy, International Journal of Services Technology and Management 10 (2-4) (2008) 273-298.
P. Antras, E. Helpman, Global Sourcing, Journal of Political Economy 112 (3) (2004) 552-580. R. Basile, A. Giunta, J. Nugent, Foreign Expansion by Italian Manufacturing Firms in the Nineties: An Ordered Probit Analysis, Review of Industrial Organization 23 (2003) 1-24.
L. Becchetti, S. Rossi, The Positive Effect of Industrial District on the Export Performance of Italian Firms, Review of Industrial Organization 16 (1) (2000) 53-68.
L. Benfratello, T. Razzolini, Firms’ productivity and internationalisation choices: evidence for a large sample of manufacturing firms, in L. Piscitello, G. Santangelo (Eds.) Multinationals and local competitiveness, Franco Angeli, Milano, 2009.
S. Bougheas, H. Gorg, Organizational Forms for Global Engagement of Firms, University of Nottingham, GEP Research Paper 2008/33 (2008). Available at SSRN: http://ssrn.com/abstract=1448554.
L. Brainard, An Empirical Assessment of the Proximity-Concentration Trade Off between Multinational Sales and Trade, American Economic Review 87 (4) (1997) 520-544.
L. Cappellari, S. P. Jenkins, Multivariate probit regression using simulated maximum likelihood, The Stata Journal 3 (2003) 278-294.
L. Cappellari, S. P. Jenkins (2006), Calculation of multivariate normal probabilities by simulation, with applications to maximum simulated likelihood estimation, The Stata Journal 6 (2) (2006) 156–189
D. Castellani, A. Zanfei, Internationalisation, innovation and productivity: how do firms differ in Italy, The World Economy 30 1 (2007).
C. Criscuolo, J. Haskel, M. Slaughter, Global engagement and the innovation activities of firms, NBER Working Paper, 11479, Cambridge, MA (2005).
L. Cusmano, M. L. Mancusi, A. Morrison, Globalisation of production and innovation: how outsourcing is reshaping an advanced manufacturing area, CESPRI Working Paper (2006) 194.
M. Frenz, G. Ietto-Gillies, Does multinationality affect the propensity to innovate? an analysis of the third UK community innovation survey, International Review of Applied Economics 21 1 (2007) 99-117, Taylor and Francis Journals.
G. Giovannetti, G.Ricchiuti, M. Velucchi, Entrepreneurship heterogeneity and internationalisation of firms: the case of Italy, working paper n. 6, Fondazione Manlio Masi (2008).
S. Girma, H. Görg, E. Strobl, Exports, international investment and plant performance. Evidence from a non-parametric test, Economics Letters 83 (2004) 317-24.
S. Girma, R. Kneller, M. Pisu, Exports versus FDI: an empirical test, Review of World Economics/Weltwirtschaftliches Archiv 141 2 (2005) 193-218.
W. H. Greene, Econometric Analysis, 5th ed., Prentice–Hall, Upper Saddle River, NJ, 2003. D. Greenaway, R. Kneller, Firm heterogeneity, exporting and foreign direct investment: a survey, Economic Journal 117 (2007).
G. Grossman, E. Helpman, A. Szeidl, Complementarities between outsourcing and foreign sourcing, American Economic Review 95 (2005) 19-24.
G. Grossman, E. Helpman, A. Szeidl, Optimal integration strategies for the multinational firm, Journal of International Economics 70 (2006) 216-38.
V. Hajivassiliou, P. Ruud, Classical estimation methods for LDV models using simulation, in R. Engle, D. McFadden (Eds.), Handbook of Econometrics IV, North-Holland, Amsterdam, 1994, pp. 2383-2441.
K. Head, J. Ries, Heterogeneity and the FDI versus export decision of Japanese manufacturers, Journal of the Japanese and International Economies 17 (2003) 448–467.
26
K. Head, J. Ries, Exporting and FDI as alternative strategies, Oxford Review of Economic Policy 20 (2004) 409-423
E. Helpman, M. Meliz, S. Yeaple, Export versus FDI with heterogeneous firms, American Economic Review 94 1 (2004) 300-316.
E. Helpman, Trade, FDI and the organization of firms, Journal of Economic Literature 44 (3) (2006) 589-630.
Intesa San Paolo, Monitor dei distretti, Servizio Studi e Ricerche 21 (2007). J. Levinsohn, A. Petrin, Estimating production functions using inputs to control for unobservables, Review of Economic Studies 70 (2) (2003) 317–342.
R.E. Lipsey, Home and host country effects of FDI, NBER Working Paper Series 9293 (2002). J. R. Markusen, Multinational Firms and the Theory of International Trade, MIT Press, Cambridge, MA, 2002.
M. Melitz, The impact of trade on aggregate industry productivity and intra-industry reallocation, Econometrica 71 6 (2003) 1695-1725.
R. Narula, A. Zanfei, The international dimension of innovation, MERIT-Infonomics Research, Memorandum Series 2003–009 (2003).
G.S. Olley, A. Pakes, The dynamics of productivity in the telecommunications equipment industry, Econometrica 64 (1996) 1263–1297.
G.I.P. Ottaviano, A. Turrini, Distance and foreign direct investment when contracts are incomplete, Journal of the European Economic Association 5 (4) (2007) 796-822.
C. Palmberg, M. Pajarinen, Internationalisation through strategic alliances - determinants of non-equity alliances of Finnish firms, Finnish Journal of Business Economics 4 (2005) 489-509.
A. Sterlacchini, The determinants of export performance: a firm-level study in Italian manufacturing, The World Economy 137 (3) (2001) 450-472.
E. Tomiura, Foreign outsourcing, exporting, and FDI: a productivity comparison at the firm level, Journal of International Economics 72 (2007) 113–127.
J. Wagner, Exports and productivity: a survey of the evidence from firm-level data, The World Economy 30 1 (2007).
S. Yeaple, The complex integration strategies of multinationals and cross country dependencies in the structure of foreign direct investment, Journal of International Economics 60 (2005) 293–314
27
TABLE 1
Marginal distribution of internationalisation modes
Modes Freq. Percent
EXP 2335 75.25
CP 943 30.39
AGR 631 20.34
FDI 116 3.74
OFF 234 7.54
OUTS 556 17.92
TABLE 2
Distribution of pattern of internationalisation
(y1, y2, y3, y4, y5, y6) Number Freq. Cum. percent
(1 0 0 0 0 0) 987 31.81 31.81
(0 0 0 0 0 0) 690 22.24 54.04
(1 1 0 0 0 0) 331 10.67 64.71
(1 1 1 0 0 0) 228 7.35 72.06
(1 0 0 0 0 1) 158 5.09 77.15
(1 1 0 0 0 1) 118 3.80 80.95
(1 1 1 0 0 1) 104 3.35 84.31
(1 0 1 0 0 0) 99 3.19 87.50
(1 0 0 0 1 0) 52 1.68 89.17
(1 0 1 0 0 1) 52 1.68 90.85
Others 284 9.15 100
Total 3103 100.00
Note: y1=EXP, y2=CP, y3=AGR, y4=FDI, y5=OFF, y6=OUTS
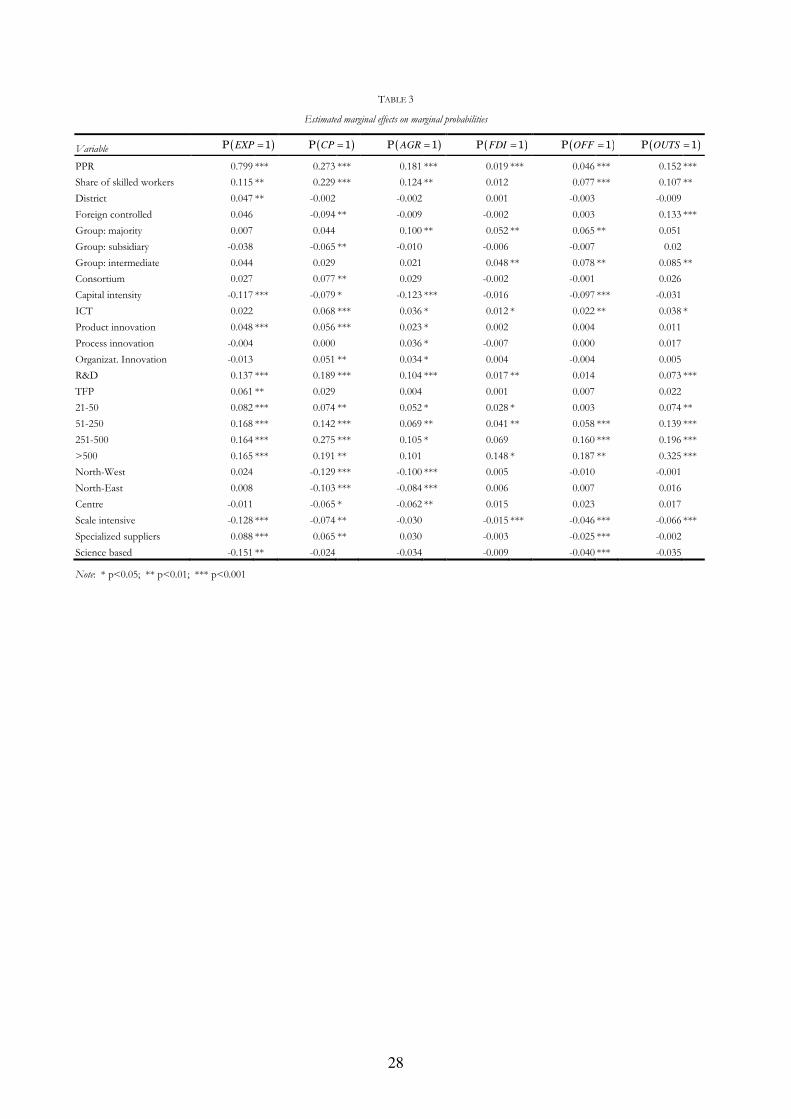
28
TABLE 3
Estimated marginal effects on marginal probabilities
Variable ( )EXPP 1= ( )CPP 1= ( )AGRP 1= ( )FDIP 1= ( )OFFP 1= ( )OUTSP 1=
PPR 0.799 *** 0.273 *** 0.181 *** 0.019 *** 0.046 *** 0.152 ***
Share of skilled workers 0.115 ** 0.229 *** 0.124 ** 0.012 0.077 *** 0.107 **
District 0.047 ** -0.002 -0.002 0.001 -0.003 -0.009
Foreign controlled 0.046 -0.094 ** -0.009 -0.002 0.003 0.133 ***
Group: majority 0.007 0.044 0.100 ** 0.052 ** 0.065 ** 0.051
Group: subsidiary -0.038 -0.065 ** -0.010 -0.006 -0.007 0.02
Group: intermediate 0.044 0.029 0.021 0.048 ** 0.078 ** 0.085 **
Consortium 0.027 0.077 ** 0.029 -0.002 -0.001 0.026
Capital intensity -0.117 *** -0.079 * -0.123 *** -0.016 -0.097 *** -0.031
ICT 0.022 0.068 *** 0.036 * 0.012 * 0.022 ** 0.038 *
Product innovation 0.048 *** 0.056 *** 0.023 * 0.002 0.004 0.011
Process innovation -0.004 0.000 0.036 * -0.007 0.000 0.017
Organizat. Innovation -0.013 0.051 ** 0.034 * 0.004 -0.004 0.005
R&D 0.137 *** 0.189 *** 0.104 *** 0.017 ** 0.014 0.073 ***
TFP 0.061 ** 0.029 0.004 0.001 0.007 0.022
21-50 0.082 *** 0.074 ** 0.052 * 0.028 * 0.003 0.074 **
51-250 0.168 *** 0.142 *** 0.069 ** 0.041 ** 0.058 *** 0.139 ***
251-500 0.164 *** 0.275 *** 0.105 * 0.069 0.160 *** 0.196 ***
>500 0.165 *** 0.191 ** 0.101 0.148 * 0.187 ** 0.325 ***
North-West 0.024 -0.129 *** -0.100 *** 0.005 -0.010 -0.001
North-East 0.008 -0.103 *** -0.084 *** 0.006 0.007 0.016
Centre -0.011 -0.065 * -0.062 ** 0.015 0.023 0.017
Scale intensive -0.128 *** -0.074 ** -0.030 -0.015 *** -0.046 *** -0.066 ***
Specialized suppliers 0.088 *** 0.065 ** 0.030 -0.003 -0.025 *** -0.002
Science based -0.151 ** -0.024 -0.034 -0.009 -0.040 *** -0.035
Note: * p<0.05; ** p<0.01; *** p<0.001
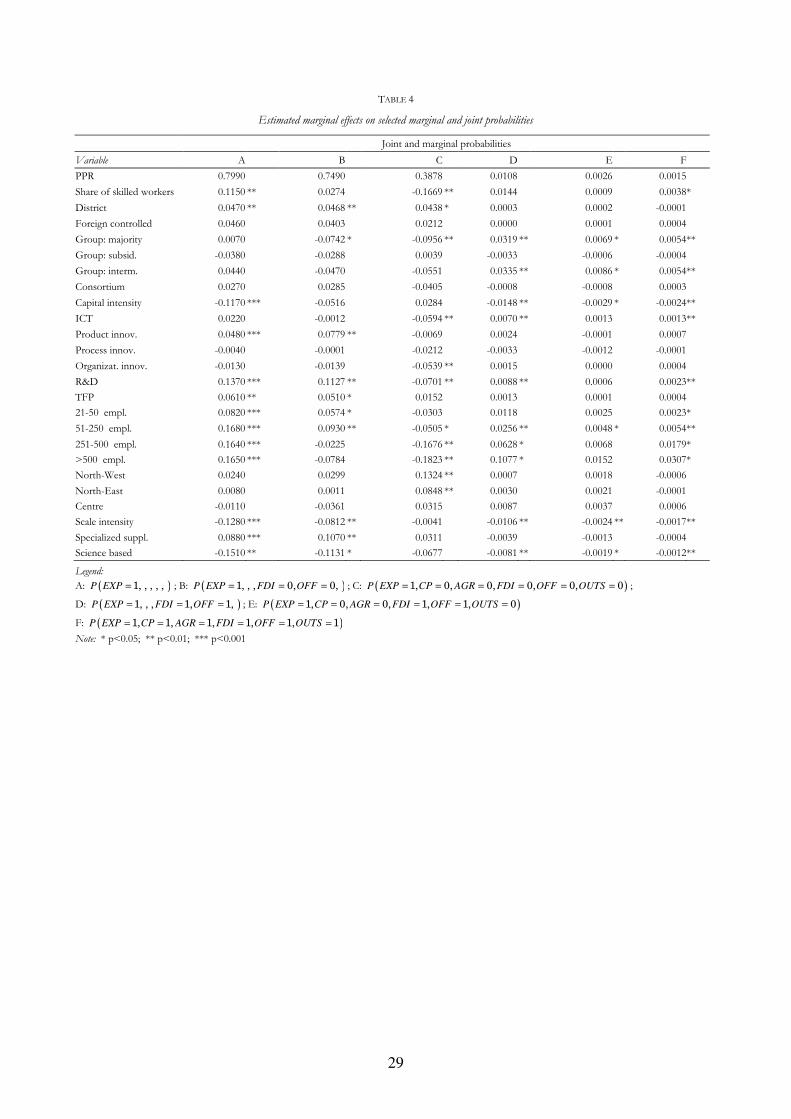
29
TABLE 4
Estimated marginal effects on selected marginal and joint probabilities
Joint and marginal probabilities
Variable A B C D E F
PPR 0.7990 0.7490 0.3878 0.0108 0.0026 0.0015
Share of skilled workers 0.1150 ** 0.0274 -0.1669 ** 0.0144 0.0009 0.0038*
District 0.0470 ** 0.0468 ** 0.0438 * 0.0003 0.0002 -0.0001
Foreign controlled 0.0460 0.0403 0.0212 0.0000 0.0001 0.0004
Group: majority 0.0070 -0.0742 * -0.0956 ** 0.0319 ** 0.0069 * 0.0054**
Group: subsid. -0.0380 -0.0288 0.0039 -0.0033 -0.0006 -0.0004
Group: interm. 0.0440 -0.0470 -0.0551 0.0335 ** 0.0086 * 0.0054**
Consortium 0.0270 0.0285 -0.0405 -0.0008 -0.0008 0.0003
Capital intensity -0.1170 *** -0.0516 0.0284 -0.0148 ** -0.0029 * -0.0024**
ICT 0.0220 -0.0012 -0.0594 ** 0.0070 ** 0.0013 0.0013**
Product innov. 0.0480 *** 0.0779 ** -0.0069 0.0024 -0.0001 0.0007
Process innov. -0.0040 -0.0001 -0.0212 -0.0033 -0.0012 -0.0001
Organizat. innov. -0.0130 -0.0139 -0.0539 ** 0.0015 0.0000 0.0004
R&D 0.1370 *** 0.1127 ** -0.0701 ** 0.0088 ** 0.0006 0.0023**
TFP 0.0610 ** 0.0510 * 0.0152 0.0013 0.0001 0.0004
21-50 empl. 0.0820 *** 0.0574 * -0.0303 0.0118 0.0025 0.0023*
51-250 empl. 0.1680 *** 0.0930 ** -0.0505 * 0.0256 ** 0.0048 * 0.0054**
251-500 empl. 0.1640 *** -0.0225 -0.1676 ** 0.0628 * 0.0068 0.0179*
>500 empl. 0.1650 *** -0.0784 -0.1823 ** 0.1077 * 0.0152 0.0307*
North-West 0.0240 0.0299 0.1324 ** 0.0007 0.0018 -0.0006
North-East 0.0080 0.0011 0.0848 ** 0.0030 0.0021 -0.0001
Centre -0.0110 -0.0361 0.0315 0.0087 0.0037 0.0006
Scale intensity -0.1280 *** -0.0812 ** -0.0041 -0.0106 ** -0.0024 ** -0.0017**
Specialized suppl. 0.0880 *** 0.1070 ** 0.0311 -0.0039 -0.0013 -0.0004
Science based -0.1510 ** -0.1131 * -0.0677 -0.0081 ** -0.0019 * -0.0012**
Legend:
A: ( )P EXP 1, , , , ,= ; B: ( )P EXP FDI OFF1, , , 0, 0,= = = ; C: ( )P EXP CP AGR FDI OFF OUTS1, 0, 0, 0, 0, 0= = = = = = ;
D: ( )P EXP FDI OFF1, , , 1, 1,= = = ; E: ( )P EXP CP AGR FDI OFF OUTS1, 0, 0, 1, 1, 0= = = = = =
F: ( )P EXP CP AGR FDI OFF OUTS1, 1, 1, 1, 1, 1= = = = = =
Note: * p<0.05; ** p<0.01; *** p<0.001
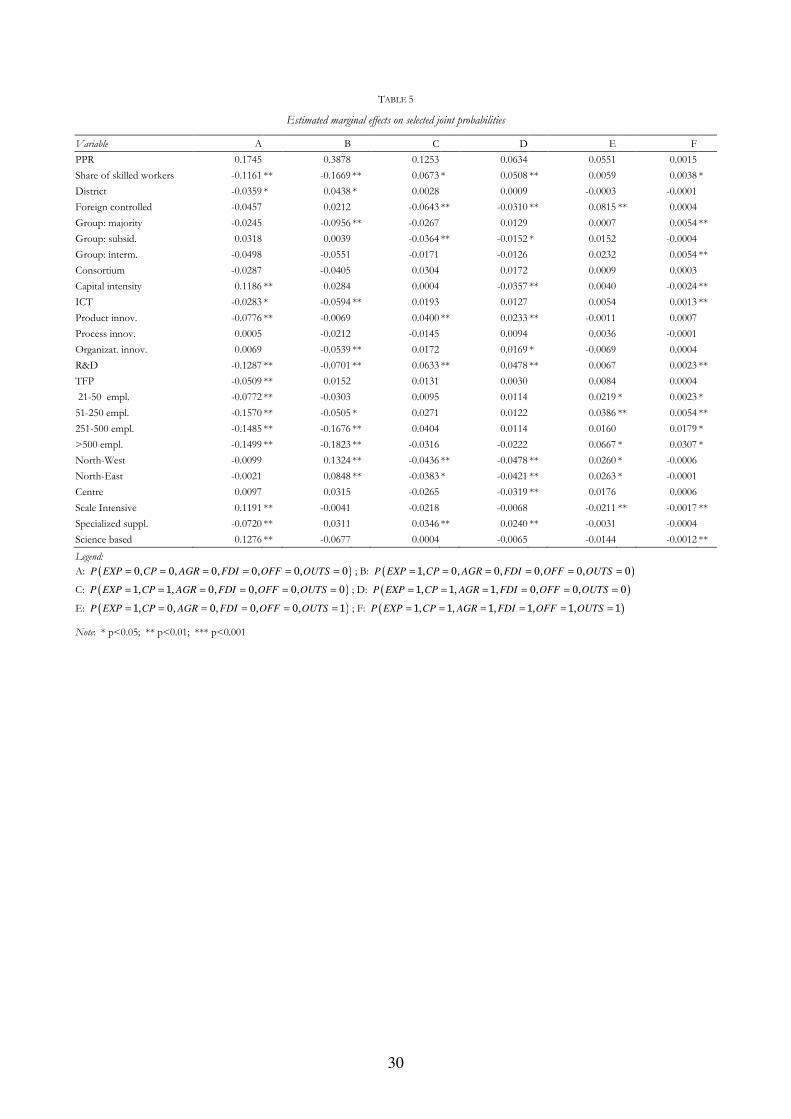
30
TABLE 5
Estimated marginal effects on selected joint probabilities
Variable A B C D E F
PPR 0.1745 0.3878 0.1253 0.0634 0.0551 0.0015
Share of skilled workers -0.1161 ** -0.1669 ** 0.0673 * 0.0508 ** 0.0059 0.0038 *
District -0.0359 * 0.0438 * 0.0028 0.0009 -0.0003 -0.0001
Foreign controlled -0.0457 0.0212 -0.0643 ** -0.0310 ** 0.0815 ** 0.0004
Group: majority -0.0245 -0.0956 ** -0.0267 0.0129 0.0007 0.0054 **
Group: subsid. 0.0318 0.0039 -0.0364 ** -0.0152 * 0.0152 -0.0004
Group: interm. -0.0498 -0.0551 -0.0171 -0.0126 0.0232 0.0054 **
Consortium -0.0287 -0.0405 0.0304 0.0172 0.0009 0.0003
Capital intensity 0.1186 ** 0.0284 0.0004 -0.0357 ** 0.0040 -0.0024 **
ICT -0.0283 * -0.0594 ** 0.0193 0.0127 0.0054 0.0013 **
Product innov. -0.0776 ** -0.0069 0.0400 ** 0.0233 ** -0.0011 0.0007
Process innov. 0.0005 -0.0212 -0.0145 0.0094 0.0036 -0.0001
Organizat. innov. 0.0069 -0.0539 ** 0.0172 0.0169 * -0.0069 0.0004
R&D -0.1287 ** -0.0701 ** 0.0633 ** 0.0478 ** 0.0067 0.0023 **
TFP -0.0509 ** 0.0152 0.0131 0.0030 0.0084 0.0004
21-50 empl. -0.0772 ** -0.0303 0.0095 0.0114 0.0219 * 0.0023 *
51-250 empl. -0.1570 ** -0.0505 * 0.0271 0.0122 0.0386 ** 0.0054 **
251-500 empl. -0.1485 ** -0.1676 ** 0.0404 0.0114 0.0160 0.0179 *
>500 empl. -0.1499 ** -0.1823 ** -0.0316 -0.0222 0.0667 * 0.0307 *
North-West -0.0099 0.1324 ** -0.0436 ** -0.0478 ** 0.0260 * -0.0006
North-East -0.0021 0.0848 ** -0.0383 * -0.0421 ** 0.0263 * -0.0001
Centre 0.0097 0.0315 -0.0265 -0.0319 ** 0.0176 0.0006
Scale Intensive 0.1191 ** -0.0041 -0.0218 -0.0068 -0.0211 ** -0.0017 **
Specialized suppl. -0.0720 ** 0.0311 0.0346 ** 0.0240 ** -0.0031 -0.0004
Science based 0.1276 ** -0.0677 0.0004 -0.0065 -0.0144 -0.0012 **
Legend:
A: ( )P EXP CP AGR FDI OFF OUTS0, 0, 0, 0, 0, 0= = = = = = ; B: ( )P EXP CP AGR FDI OFF OUTS1, 0, 0, 0, 0, 0= = = = = =
C: ( )P EXP CP AGR FDI OFF OUTS1, 1, 0, 0, 0, 0= = = = = = ; D: ( )P EXP CP AGR FDI OFF OUTS1, 1, 1, 0, 0, 0= = = = = =
E: ( )P EXP CP AGR FDI OFF OUTS1, 0, 0, 0, 0, 1= = = = = = ; F: ( )P EXP CP AGR FDI OFF OUTS1, 1, 1, 1, 1, 1= = = = = =
Note: * p<0.05; ** p<0.01; *** p<0.001
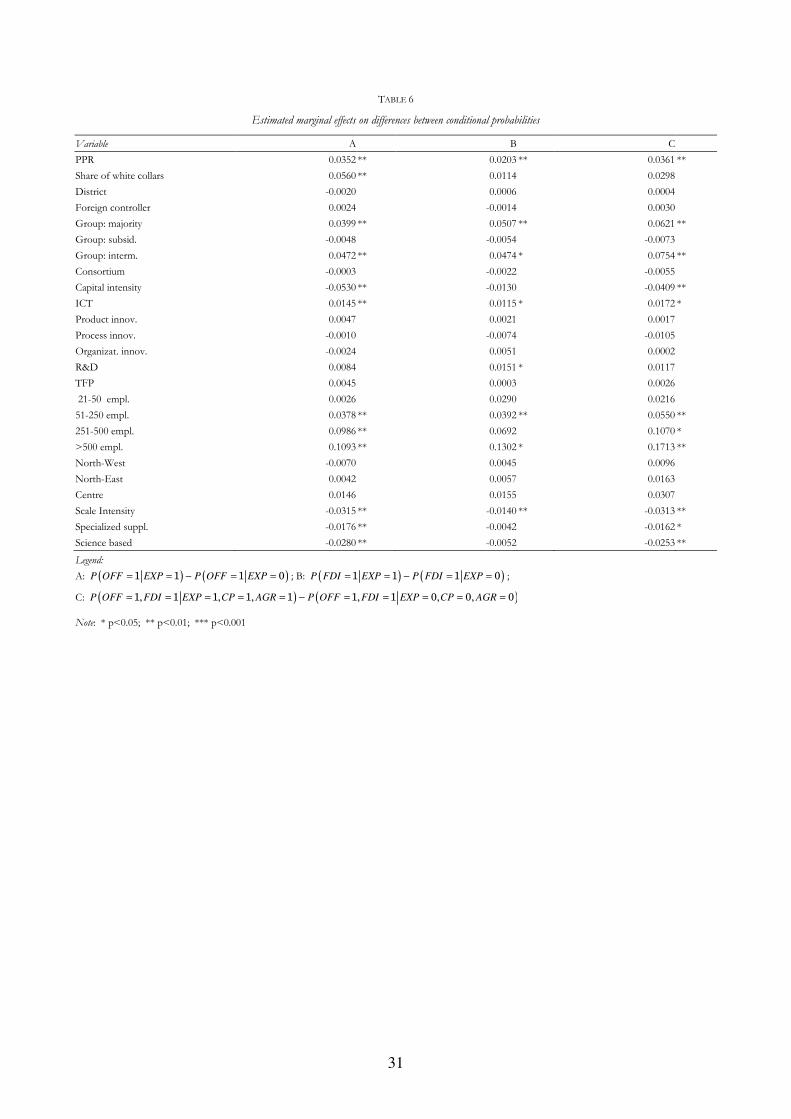
31
TABLE 6
Estimated marginal effects on differences between conditional probabilities
Variable A B C
PPR 0.0352 ** 0.0203 ** 0.0361 **
Share of white collars 0.0560 ** 0.0114 0.0298
District -0.0020 0.0006 0.0004
Foreign controller 0.0024 -0.0014 0.0030
Group: majority 0.0399 ** 0.0507 ** 0.0621 **
Group: subsid. -0.0048 -0.0054 -0.0073
Group: interm. 0.0472 ** 0.0474 * 0.0754 **
Consortium -0.0003 -0.0022 -0.0055
Capital intensity -0.0530 ** -0.0130 -0.0409 **
ICT 0.0145 ** 0.0115 * 0.0172 *
Product innov. 0.0047 0.0021 0.0017
Process innov. -0.0010 -0.0074 -0.0105
Organizat. innov. -0.0024 0.0051 0.0002
R&D 0.0084 0.0151 * 0.0117
TFP 0.0045 0.0003 0.0026
21-50 empl. 0.0026 0.0290 0.0216
51-250 empl. 0.0378 ** 0.0392 ** 0.0550 **
251-500 empl. 0.0986 ** 0.0692 0.1070 *
>500 empl. 0.1093 ** 0.1302 * 0.1713 **
North-West -0.0070 0.0045 0.0096
North-East 0.0042 0.0057 0.0163
Centre 0.0146 0.0155 0.0307
Scale Intensity -0.0315 ** -0.0140 ** -0.0313 **
Specialized suppl. -0.0176 ** -0.0042 -0.0162 *
Science based -0.0280 ** -0.0052 -0.0253 **
Legend:
A: ( ) ( )P OFF EXP P OFF EXP1 1 1 0= = − = = ; B: ( ) ( )P FDI EXP P FDI EXP1 1 1 0= = − = = ;
C: ( ) ( )P OFF FDI EXP CP AGR P OFF FDI EXP CP AGR1, 1 1, 1, 1 1, 1 0, 0, 0= = = = = − = = = = =
Note: * p<0.05; ** p<0.01; *** p<0.001