How do Electronic Cigarettes affect Adolescent Smoking...
56
How do Electronic Cigarettes affect Adolescent Smoking? Abigail S. Friedman * April 22, 2015 Abstract Understanding electronic cigarettes’ effect on tobacco smoking is a central economic and policy issue. This paper examines the causal impact of e-cigarette availability on conventional cigarette use by adolescents. First, synthetic control analyses consider how state bans on e-cigarette sales to minors influence teen smoking rates. These bans yield a statistically significant 1.0 percentage point increase in recent smoking in this age group, relative to states without such bans. Next, I examine survey data on cigarette and e-cigarette use, separating teens by estimated propensity to smoke in the absence of e-cigarettes. Among those with the highest propensity to smoke, e- cigarette use increased most while cigarette use declined: a 1.0 percentage point rise in ever use of e-cigarettes yields a 0.65 percentage point drop in this subgroup’s current smoking rate. Both sets of results indicate a harm reducing effect of e-cigarettes on adolescent cigarette smoking, at least prior to 2014. Keywords: smoking; electronic cigarettes; cigarettes; adolescent behavior " Department of Health Policy and Management, Yale School of Public Health. Email: [email protected]. I am grateful to David Cutler, Richard Frank, Claudia Goldin, Frank Sloan, Jody Sindelar, Martin Anderson, Sebastian Bauhoff, Shivaani Prakash, Mark Schlesinger, and Sam Richardson for helpful comments and discussion, and to the Radcliffe Institute for Advanced Study, for fellowship funding that helped support this research.
-
Upload
trinhnguyet -
Category
Documents
-
view
224 -
download
3
Transcript of How do Electronic Cigarettes affect Adolescent Smoking...

How do Electronic Cigarettes affect Adolescent Smoking?
Abigail S. Friedman*
April 22, 2015
Abstract
Understanding electronic cigarettes’ effect on tobacco smoking is a central economic and policy issue. This paper examines the causal impact of e-cigarette availability on conventional cigarette use by adolescents. First, synthetic control analyses consider how state bans on e-cigarette sales to minors influence teen smoking rates. These bans yield a statistically significant 1.0 percentage point increase in recent smoking in this age group, relative to states without such bans. Next, I examine survey data on cigarette and e-cigarette use, separating teens by estimated propensity to smoke in the absence of e-cigarettes. Among those with the highest propensity to smoke, e-cigarette use increased most while cigarette use declined: a 1.0 percentage point rise in ever use of e-cigarettes yields a 0.65 percentage point drop in this subgroup’s current smoking rate. Both sets of results indicate a harm reducing effect of e-cigarettes on adolescent cigarette smoking, at least prior to 2014. Keywords: smoking; electronic cigarettes; cigarettes; adolescent behavior !!
!!
!!!!!!!!!!!!!!!!!!!!!!!!!!!!!!!!!!!!!!!!!!!!!!!!!!!!!!!!"!Department of Health Policy and Management, Yale School of Public Health. Email: [email protected]. I am grateful to David Cutler, Richard Frank, Claudia Goldin, Frank Sloan, Jody Sindelar, Martin Anderson, Sebastian Bauhoff, Shivaani Prakash, Mark Schlesinger, and Sam Richardson for helpful comments and discussion, and to the Radcliffe Institute for Advanced Study, for fellowship funding that helped support this research.!
!
! 2!
Introduction
Appropriate electronic cigarette regulation has become one of the central debates in
public health policy, with particular interest in how this product affects cigarette smoking.
(Inhaling on an e-cigarette releases vapor and is thus called “vaping,” not “smoking.”) Since e-
cigarettes deliver the same addictive substance as cigarettes but can be less expensive and are
thought to be less risky, some claim that they reduce smoking by leading smokers and would-be
smokers to substitute away from cigarettes (harm reduction) (e.g., Cahn and Siegel, 2011; Polosa
et al., 2013).1 Others maintain that e-cigarettes increase smoking by inducing initiation among
users who would not otherwise smoke (gateway effects), reducing stigma around smoking
(renormalization), or lowering the full costs of addiction (e.g., by facilitating nicotine use where
smoking is prohibited) (e.g., Fairchild, Bayer, and Colgrove, 2014; Gostin and Glasner, 2014;
Time for e-cigarette regulation, 2013). As teenagers are responsible for the majority of U.S.
smoking initiation, such effects may be particularly evident in this age group. Thus, this paper
tests for a causal impact of e-cigarette access on adolescent smoking.
Several studies have examined the teen vaping-smoking relationship, yet potential
confounders limit causal interpretation. For example, Dutra and Glantz (2014) find that e-
cigarette and cigarette use are positively correlated, which some interpret as evidence of gateway
effects (e.g., Chen, 2014; Fernandez, 2014). Yet this could be explained by individuals who are
more attracted to experimentation ex ante being more likely to try both products, regardless of
any causal effect of one product on demand for the other.
Moreover, the vaping-smoking relationship may vary between population groups. For
!!!!!!!!!!!!!!!!!!!!!!!!!!!!!!!!!!!!!!!!!!!!!!!!!!!!!!!!1 An August 2009 post on blu e-cigarettes describes the starter kit as including chargers, batteries, an atomizer, and 25 cartridges, described as equivalent to 350 cigarettes, all for $59.99 (Blu Electronic Cigarette Products, 2009). At the average 2009 price of $5.68 per pack, 350 cigarettes would cost $99.40 (Orzechowski and Walker, 2012). In a few low tax states, however, the price differential does not necessarily favor e-cigarettes.

!
! 3!
example, e-cigarette use is associated with a greater intention to quit smoking among smokers in
high school (Lee, Grana, and Glantz, 2013; Dutra and Glantz, 2014) but not college (Sutfin et al.,
2013). Thus, average population estimates may mask group-specific effects.2
In testing whether e-cigarettes raise or reduce teen cigarette smoking, this paper uses
multiple identification strategies to consider both average population effects and the possibility
of varying subgroup effects. The first set of analyses considers how state bans on e-cigarette
sales to minors affect the smoking rate among 12 to 17 year olds. These regressions use state-
level data, specifically two-year average smoking rates from the National Survey on Drug Use
and Health, and control for state and period fixed effects as well as state cigarette taxes, the
presence of smoke-free air laws, a variety of demographic characteristics, and smoking rates
among 18 to 25 year olds. Considering both unweighted regressions and synthetic control
analyses, bans on e-cigarette sales to minors yield a statistically significant 1.0 percentage point
increase in the recent smoking rate among 12 to 17 year olds, relative to states without such
bans. This effect is both consistent with e-cigarettes reducing smoking among minors, and large:
on average, state smoking rates for this age group fell 1.3 percentage points per two-year interval
from 2002 to 2009, the year before the first bans went into effect. A 1.0 percentage point
increase in smoking over two years counters more than 75 percent of that downward trend.
To consider how this effect may vary among different population groups, the second set
of analyses examine respondent level data from the National Youth Tobacco Survey (NYTS),
considering concurrent changes in smoking and e-cigarette use within different percentiles of the
expected smoking distribution. This distribution is estimated by applying a propensity to smoke
!!!!!!!!!!!!!!!!!!!!!!!!!!!!!!!!!!!!!!!!!!!!!!!!!!!!!!!!2 Despite evidence suggesting that e-cigarettes may serve as an effective cessation tool among adult smokers who use them specifically for that purpose (e.g., Brown et al., 2014), adult smokers’ e-cigarette use does not appear to be associated with smoking cessation at a population level (Grana, Popova, and Ling, 2014; Adkison et al., 2013). Yet results for adults may not generalize to teenagers, particularly since shifts in teen use may operate primarily through initiation, while those for adults relate more to cessation. Thus, further discussion of adult e-cigarette use is omitted.
!
! 4!
equation derived using NYTS 2006 data—e-cigarettes entered the U.S. market in 2007—to
NYTS data from 2004 through 2012. Intuitively, if e-cigarettes reduce smoking participation,
this effect should manifest itself among those who are more likely to smoke ex ante. Indeed,
regressions examine how rates of smoking and e-cigarette use change in response to changes in
total domestic e-cigarette sales and advertising expenditure, and find that only the high
propensity to smoke groups show statistically significant smoking-responses. Taking the ratio of
that group’s sales and advertising coefficients from the cigarette regression to those in the e-
cigarette regression identifies how changes in vaping shape changes in smoking: among teens in
the top ten percent of the propensity to smoke distribution, a 1.0 percentage point increase in
ever use of e-cigarettes yields a 0.65 percentage point drop in this subgroup’s current smoking
rate.
Both the state ban and propensity to smoke results are consistent with a harm reducing
effect of e-cigarettes on adolescent smoking. Moreover, the second set of analyses find that the
reduced smoking effect acts through those teenagers who are most likely to smoke ex ante, with
no statistically significant impact on lower propensity to smoke teens. As age is a key predictor
of smoking behavior and propensity, with a notable increase in habitual smoking at age 16
(Lillard, Molloy, and Sfekas, 2013), these findings suggest that banning e-cigarette sales to those
under age 16 may be preferable to an under-18 ban, in terms of the effect on teen smoking.3
This paper offers several contributions to the e-cigarette literature. First, unobserved
factors shaping both smoking and e-cigarette use have hampered causal inference in existing
research, which tends to identify participation in one behavior directly off of engagement in the
other. This paper sidesteps that problem by identifying changes in smoking and e-cigarette use
!!!!!!!!!!!!!!!!!!!!!!!!!!!!!!!!!!!!!!!!!!!!!!!!!!!!!!!!3 This implication is based on the impact on smoking alone, and assumes (consistent with the current literature) that the health costs of conventional cigarettes exceed those of e-cigarettes (Pisinger and Døssing, 2014).

!
! 5!
off of either state policy changes or variation in total e-cigarette sales and advertising in an era
when both were strongly influenced by non-market events. Second, the analyses estimate both
average population effects and subgroup-specific effects, thus providing information on both the
overall impact of e-cigarette availability on teen smoking and how this effect differs between
those who are more versus less likely to smoke ex ante. The latter also allows for closer
consideration of several common claims about the vaping-smoking relationship, particularly the
gateway effects and harm reduction hypotheses, which pertain to different subsets of the
propensity to smoke distribution.4 The study’s empirical findings provide the first causal
evidence that e-cigarette access reduces teen smoking, particularly among those who are most
likely to smoke. All results, across multiple identification strategies and datasets, are consistent
with this conclusion, which supports the harm reduction hypothesis. No evidence is found to
suggest the existence of gateway effects.
The paper proceeds in four parts. Section I lays out a conceptual framework for the
relationship between e-cigarette and cigarette use. Section II considers how state bans on e-
cigarette sales to minors affect smoking among 12 to 17 year olds, while Section III presents the
propensity to smoke analyses. Section IV discusses these results and concludes.
Section I: Conceptual Framework
Modeling the relationship between cigarette and e-cigarette consumption facilitates closer
consideration of three common claims: first, that e-cigarette use will lead those who would not
otherwise use conventional cigarettes to do so (gateway effects); second, that e-cigarette access
will reduce smoking by leading smokers and would be smokers to substitute towards a less risky
source of nicotine (harm reduction); and third, that e-cigarettes will reduce the social stigma !!!!!!!!!!!!!!!!!!!!!!!!!!!!!!!!!!!!!!!!!!!!!!!!!!!!!!!!4 See Section I’s discussion of each claim.

!
! 6!
around smoking, and thus increase smoking rates (renormalization of smoking).
To proceed, one must first recognize that these products share the same addictive
substance, and thus cannot be treated as completely distinct drugs. Consider each good as a set of
two components valued by current and potential smokers: nicotine (N), assumed to be perfectly
substitutable between the two products (i.e., identical biochemical effects and addictiveness,
such that N=NE+NC), and use of the delivery device (DE or DC), with preference heterogeneity
for each device and nicotine. Without loss of generality, define consumption of cigarettes, C, and
e-cigarettes, E, in terms of pulls (inhalations) from the corresponding device (i.e., !DC/!C =1,
!DE/!E =1).
As the analyses focus on youths, this model applies the economic definition of addiction
—a greater addictive stock of nicotine (St) raises one’s marginal utility for nicotine consumption
(!2Ut/!St!Nt > 0)—but assumes that consumers do not anticipate adjacent complementarity in
future periods. Utility is over cigarettes (C), e-cigarettes (E), and a composite good (X):
Wt = U(Xt, Et, Ct; St) + !s "s • µt+s (Et+s-1, Ct+s-1, µt+s-1) • U(Xt+s, Et+s, Ct+s). (1)
Here, " is a typical discount factor, while µt+s captures one’s likelihood of being alive at period
t+s as a function of past e-cigarette and cigarette consumption. Utility is maximized subject to a
standard budget constraint with exogenous income, the price of X normalized to 1, and prices for
cigarettes and e-cigarettes denoted PC and PE: Y=X +E•PE + PCC .5 First order conditions yield
the following equation:
[!Ut/!Ct + !s "s Ut+s•(!µt+s /!Ct)] [!Ut/!Et + !s "s Ut+s
•(!µt+s /!Et)] ————————————— = ————————————— = !Ut/!X. (2)
PC PE
The introduction of e-cigarettes can be thought of as decreasing PE from infinite to an
!!!!!!!!!!!!!!!!!!!!!!!!!!!!!!!!!!!!!!!!!!!!!!!!!!!!!!!!5 Prices represent full costs (e.g., including the cost if caught smoking as a minor), not just the purchase price.

!
! 7!
attainable level. Representative data on e-cigarette prices is not available, nor is a conversion
factor allowing the prices of cigarettes and e-cigarettes to be compared in terms of a common
unit (e.g., cost per inhalation).6 A 2009 internet post for blu e-cigarettes’ facilitates such a
comparison for its starter kit, priced at $59.99 in that year and described as equivalent to 350
cigarettes (Blu Electronic Cigarette Products, 2009). At average 2009 prices, this many
conventional cigarettes would cost considerably more: $99.40 (Orzechowski and Walker, 2012).
Thus, e-cigarettes cost less than cigarettes (per pull) in all but the lowest cigarette tax states.
Consequently, the substitution and income effects produced by e-cigarettes’ introduction should
drive cigarette consumption in opposite directions, leaving the net effect ambiguous.
Equation 2 shows that the choice between conventional and electronic cigarettes depends,
not only on prices and the current period marginal utility of consumption, but also on each
product’s expected health effects and the consumer’s discount factor. Evidence to date suggests
that e-cigarettes are less dangerous than conventional cigarettes, though likely to have some
health costs: 0 > !µt+s/!Et > !µt+s/!Ct (Pisinger and Døssing, 2014). Thus, the first order
conditions’ future-utility terms will be negative, and only those consumers who have either
sufficiently strong preferences for a given product or sufficiently low discount factors will show
positive marginal utilities per dollar for these goods.
To examine this more closely, consider the first order conditions when prices per
inhalation are equal (PC=PE). In this case, a would-be smoker—i.e., consumers with (!Wt/!Ct)/PC
" !Wt/!Xt absent e-cigarette access—responds to e-cigarette availability with decreased smoking
if the following holds: !Ut/!Ct - !Ut/!Et < !s "s Ut+s • [(!µt+s /!Et) - (!µt+s /!Ct)]. This inequality
!!!!!!!!!!!!!!!!!!!!!!!!!!!!!!!!!!!!!!!!!!!!!!!!!!!!!!!!6 This author is aware of only one paper that analyzes consumption responses to e-cigarette prices, but these prices exclude those for online purchases (Huang, Tauras, Chaloupka, 2014). The authors find that higher cigarette prices yield consistently positive by statistically insignificant effects on e-cigarette purchases. Their analysis neither requires nor attempts a conversion factor to make the cigarette and e-cigarette prices refer to a common unit of consumption (e.g., inhalations).

!
! 8!
characterizes harm reduction—the scenario in which e-cigarette availability induces smokers or
would-be smokers to substitute away from cigarettes. Thus, harm reduction is more likely if the
consumer has a larger discount factor, perceives smoking’s health risks to be greater than those
of e-cigarettes, or is either relatively indifferent between e-cigarettes and cigarettes in the short
run or prefers e-cigarettes (i.e., !Ut/!Ct - !Ut/!Et < #).
Imposing certain assumptions on the consumer’s utility over nicotine and the two devices
lends further insight. To focus on the relationship between two distinct goods that deliver the
same addictive substance, assume that the marginal utilities of e-cigarette and cigarette use are
related through demand for nicotine only (i.e., !2Ut/!DCt!DEt=0, !2Ut/!DCt!Nt=0, and
!2Ut/!DEt!Nt=0).7 If these marginal utilities are both additive in the corresponding good’s
components (N and DE for e-cigarettes, N and DC for cigarettes)8, one can rewrite the inequality:
!Ut/!Nt • [!NCt/!Ct - !NEt/!Et] + [!Ut/!DCt – !Ut/!DEt ] < !s "s Ut+s
• [(!µt+s /!Et) - (!µt+s /!Ct)].
Thus, a would-be smoker is more likely to substitute away from cigarettes if e-cigarettes deliver
a weakly greater amount of nicotine per use (!NCt/!Ct # !NEt/!Et) or if the consumer is either
relatively indifferent between the two devices or prefers the e-cigarette device (!Ut/!DCt –
!Ut/!DEt < #). Whether these inequalities induce smoking cessation depends, among other things,
on whether consumers exhibit decreasing marginal utilities of cigarette and e-cigarettes
!!!!!!!!!!!!!!!!!!!!!!!!!!!!!!!!!!!!!!!!!!!!!!!!!!!!!!!!7 These assumptions greatly simplify the model’s exposition, but are admittedly restrictive. For example, they would not hold if using nicotine-free e-cigarettes influences one’s utility from smoking a nicotine-free conventional cigarette, or if the act of consuming an addictive substance via a particular device produces a habit formation response beyond chemical addiction (e.g., a Pavlovian response that increases the satisfaction an addict gets from using the drug delivery device, even absent the drug). 8 Under these assumptions, the current period marginal utilities can be written as follows:
!Ut/!Ct = !Ut/!Nt • !Nt/!NCt • !NCt/!Ct + !Ut/!DCt • !DCt/!Ct = !Ut/!Nt • !NCt/!Ct + !Ut/!DCt !Ut/!Et = !Ut/!Nt • !Nt/!NEt • !NEt/!Et + !Ut/!DEt • !DEt/!Et = !Ut/!Nt • !NEt/!Et + !Ut/!DEt .
These equations reduce to the right hand side version for two reasons: (1) consumption of cigarettes, and e-cigarettes have both been defined in terms of inhalations from the corresponding device, such that !DC/!C =1 and !DE/!E =1; and (2), it has been assumed that nicotine consumed via the two devices is perfectly substitutable, such that the consumer has preferences over N=NE+NC, with !N/!NC =1 and !N/!NE =1. Subtracting the two equations yields:
!Ut/!Ct - !Ut/!Et = !Ut/!Nt•[!NCt/!Ct - !NEt/!Et] + [!Ut/!DCt – !Ut/!DEt ].!

!
! 9!
consumption. If so, some smokers who substitute towards e-cigarettes will balance the inequality
by reducing cigarette consumption along the intensive margin only.
To adjust the above inequality for a scenario in which cigarette and e-cigarette prices
differ, simply divide all derivatives except !Ut/!Nt by the corresponding good’s price per
inhalation. This yields the expected implication: a higher price of cigarettes relative to e-
cigarettes yields substitution towards e-cigarettes.
Whereas harm reduction applies to smokers and would-be smokers (i.e., (!Wt/!C)/PC "
!Wt/!X absent e-cigarette access), gateway effects—the claim that e-cigarette use will induce
smoking among those who would not otherwise use conventional cigarettes—specifically
concern those who are unlikely to smoke ex ante (i.e., (!Wt/!C)/PC < !Wt/!X ex ante). Since e-
cigarettes and cigarettes deliver the same addictive substance, this application generalizes the
classic concept of gateway effects, which typically refers to use of one substance increasing
demand for a distinct second substance (e.g., Kenkel, Mathios, and Pacula, 2001). A shared
addictive chemical, however, allows one to examine this theory via the impact of a consumer’s
addictive stock on their marginal utility from each good.
Retaining the above assumptions about the structure of utility over each product’s
components (N, DE, and DC), derivatives of the marginal utility terms with respect to the
consumer’s addictive stock show that, if cigarettes and e-cigarettes deliver the same nicotine
dose per pull, a higher addictive stock affects their marginal utilities identically:
!2Ut/!Ct!St = !2Ut/!St!Nt • !NCt/!Ct,
!2Ut/!Et!St = !2Ut/!St!Nt • !NEt/!Et .9
!!!!!!!!!!!!!!!!!!!!!!!!!!!!!!!!!!!!!!!!!!!!!!!!!!!!!!!!9 Writing marginal utilities as in footnote 8 and then taking the derivative with respect to the addictive stock yields the following equations, which simplify to those presented in the text:
(!Ut/!Ct)/!St = (!Ut/!Nt • !NCt/!Ct)/!St + (!Ut/!DCt)/!St = !2Ut/!St!Nt • !NCt/!Ct + 0 (!Ut/!Et)/!St = (!Ut/!Nt • !NEt/!Et)/!St + (!Ut/!DEt)/!St = !2Ut/!St!Nt • !NEt/!Et + 0.

!
! 10!
However, if one product delivers less nicotine than the other (e.g., !NEt/!Et < !NCt/!Ct),
increased addiction via consumption of the lower nicotine product could lead a sufficiently
addicted consumer to substitute towards the higher nicotine product. Schroeder and Hoffman
(2014) find that experienced e-cigarette users can achieve nicotine concentrations comparable to
those produced by cigarette smoking, suggesting that an increased addictive stock alone would
not be expected to produce a gateway effect.
The gateway effect and harm reduction hypotheses both refer to a consumer who wants to
use e-cigarettes once they become available. The claim that e-cigarettes will renormalize
smoking does not require this restriction. Specifically, this hypothesis states that e-cigarettes
increase smoking rates by reducing the stigma associated with smoking conventional cigarettes
(i.e., !Ut,Pre-ecigs/!Ct < !Ut,Post-ecigs/!Ct). This effect is not predicated on the consumer using e-
cigarettes, but on a wider impact of e-cigarette prevalence or advertising on the social cost of
smoking. However, the implicit assumption that e-cigarettes will reduce such stigma has not
been proven. Perhaps e-cigarette availability will increase society’s disdain for those who smoke
despite access to a less risky product. A distinct analysis beyond the scope of this paper is needed
to test this claim.
A more limited version of this hypothesis, however, might consider the impact of
prevalent e-cigarette use on one’s likelihood of being perceived as a “smoker.” If a passerby is
less able to distinguish someone smoking a conventional cigarette from an e-cigarette user when
the latter habit is common, smokers may be able to pass as vapers, and thus avoid direct
expressions of stigma when smoking in public. Such situational variance in the costs and benefits
of smoking could help explain dual use—consumers’ use of both e-cigarettes and cigarettes. If
one product’s costs (e.g., stigma) or benefits (e.g., sharing cigarettes as a social tool) vary across

!
! 11!
situations, the consumer may be incentivized to use a different product in different contexts.
Reduced exposure to smoking-related stigma in public places might incentivize greater cigarette
use, particularly on the intensive margin. On the extensive margin, these effects would be most
relevant to marginal smokers (i.e., those likely to initiate smoking in response to a slight
reduction in the habit’s costs or increase in its benefits).
The discussion thus far has assumed that e-cigarettes enter the market and remain
accessible thereafter. What if e-cigarettes become inaccessible at a later point? In this case, some
e-cigarette users will have a higher addictive stock of nicotine than if e-cigarettes had never been
introduced, and thus a greater marginal utility from cigarette use. Absent access to e-cigarettes,
this could raise smoking rates.
Applied to consider the gateway effect, harm reduction, and smoking renormalization
hypotheses, the above model yields several insights, including that the existence of gateway
effects and prevalence of harm reduction depend on whether e-cigarettes deliver less nicotine per
inhalation than cigarettes. Furthermore, the first order conditions point to individual
heterogeneity in the smoking response to e-cigarette availability. For example, harm reduction
should be more common among smokers who exhibit a larger discount factor, perceive a lower
health risk from e-cigarettes, or are relatively indifferent between the two devices. Additionally,
this discussion indicates that the gateway effects and smoking renormalization hypotheses
pertain to a different subset of the population than harm reduction: that latter concerns
individuals who are likely to smoke ex ante, while gateway effects apply to those who are
unlikely to do so, and, at least on the extensive margin, renormalization seems most relevant for
the marginal smoker. Thus, while estimating average population effects will clarify the net
impact of e-cigarette access on teen smoking, tests for differential smoking-responses by

!
! 12!
teenagers who are more versus less likely to smoke ex ante may provide evidence for or against
these claims.
To this end, the empirical analyses proceed in two parts. The first uses state-level data on
smoking rates and bans on e-cigarette sales to minors to estimate the net impact of e-cigarette
availability on adolescent smoking. The second uses individual data to estimate each
respondent’s propensity to smoke absent access to e-cigarettes and then, grouping respondents
into centiles of propensity to smoke, examines concurrent changes in rates of e-cigarette use and
smoking within a given centile. All regressions focus on the cohort responsible for the majority
of U.S. smoking initiation: teenagers.
Section II: State Bans on Electronic Cigarette Sales to Minors
Electronic cigarettes entered the U.S. market in 2007, the same year that Ruyan, the
Chinese company that invented e-cigarettes, received an international patent (Riker et al., 2007).
Though the Food and Drug Administration (FDA) banned e-cigarette imports in 2008, a legal
case challenging this ban dragged from the spring of 2009 into December of 2010. Absent clear
FDA regulation, and with a variety of marketing tactics available to e-cigarettes that had been
restricted for cigarettes, states began enacting restrictions to limit youths’ e-cigarette access.10
The first such ban went into effect in New Jersey on March 13th, 2010. By January 1st of 2013,
13 states had bans on e-cigarette sale to minors in effect, with 11 more following before January
1, 2014 (Marynak et al., 2014).11 This section’s analyses use these bans as proxies for youth e-
cigarette access, identifying minors’ smoking-responses to e-cigarettes off of state-by-year
!!!!!!!!!!!!!!!!!!!!!!!!!!!!!!!!!!!!!!!!!!!!!!!!!!!!!!!!10 While recent research indicates that 2012 e-cigarette marketing emphasized harm reduction and use for cessation (Richardson et al., 2014; Richardson, Ganz, and Vallone, 2014), a 2014 Sports Illustrated swimsuit edition ad suggests that more traditional messaging (i.e., sex sells) is also in play (Elliott, 2014). 11 See the Data Appendix for a list of states whose bans went into effect on or before January 1, 2014.
!
! 13!
variation in ban presence.12
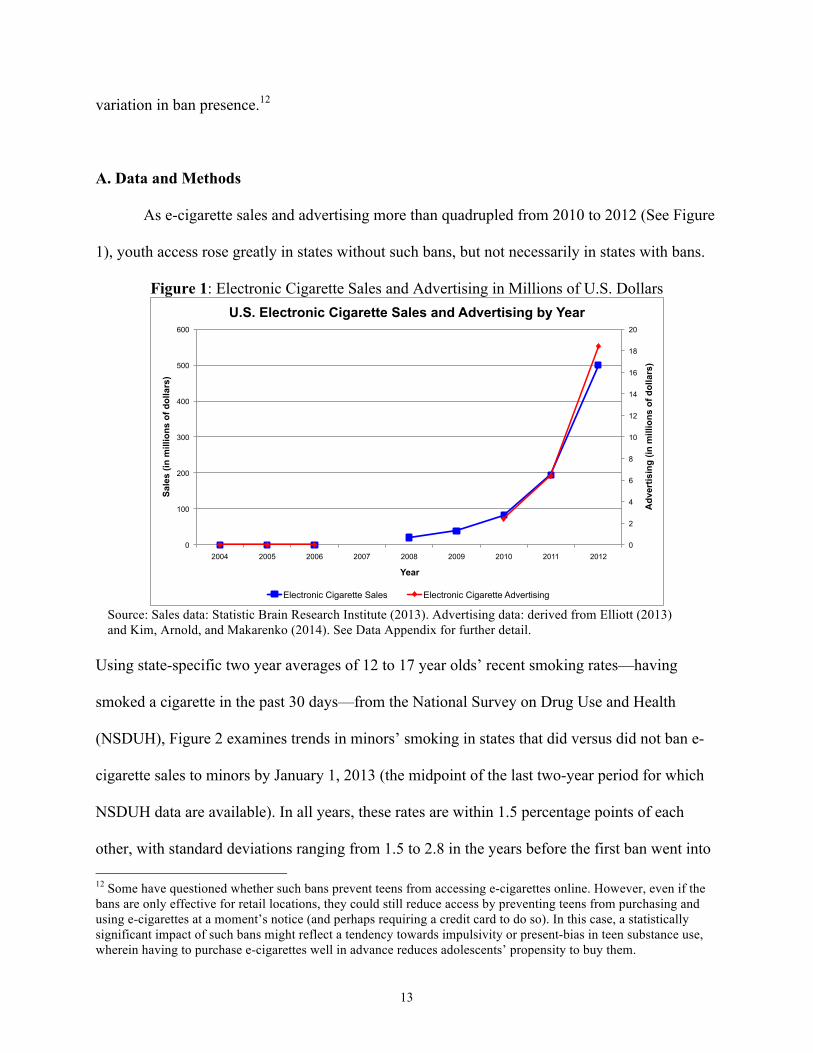
A. Data and Methods
As e-cigarette sales and advertising more than quadrupled from 2010 to 2012 (See Figure
1), youth access rose greatly in states without such bans, but not necessarily in states with bans.
Figure 1: Electronic Cigarette Sales and Advertising in Millions of U.S. Dollars
0
2
4
6
8
10
12
14
16
18
20
0
100
200
300
400
500
600
2004 2005 2006 2007 2008 2009 2010 2011 2012
Adv
ertis
ing
(in m
illio
ns o
f dol
lars
)
Sal
es (i
n m
illio
ns o
f dol
lars
)
Year
U.S. Electronic Cigarette Sales and Advertising by Year
Electronic Cigarette Sales Electronic Cigarette Advertising Source: Sales data: Statistic Brain Research Institute (2013). Advertising data: derived from Elliott (2013) and Kim, Arnold, and Makarenko (2014). See Data Appendix for further detail.
Using state-specific two year averages of 12 to 17 year olds’ recent smoking rates—having
smoked a cigarette in the past 30 days—from the National Survey on Drug Use and Health
(NSDUH), Figure 2 examines trends in minors’ smoking in states that did versus did not ban e-
cigarette sales to minors by January 1, 2013 (the midpoint of the last two-year period for which
NSDUH data are available). In all years, these rates are within 1.5 percentage points of each
other, with standard deviations ranging from 1.5 to 2.8 in the years before the first ban went into !!!!!!!!!!!!!!!!!!!!!!!!!!!!!!!!!!!!!!!!!!!!!!!!!!!!!!!!12 Some have questioned whether such bans prevent teens from accessing e-cigarettes online. However, even if the bans are only effective for retail locations, they could still reduce access by preventing teens from purchasing and using e-cigarettes at a moment’s notice (and perhaps requiring a credit card to do so). In this case, a statistically significant impact of such bans might reflect a tendency towards impulsivity or present-bias in teen substance use, wherein having to purchase e-cigarettes well in advance reduces adolescents’ propensity to buy them.

!
! 14!
effect. Additionally, teen smoking trends appear parallel in this pre-period, suggesting that these
were similar in states that would and would not go on to ban e-cigarette sales to minors by
January 1st of 2013. To test the parallel trends hypothesis, I limit consideration to the pre-2010
period (i.e., before the first ban) and regress the smoking rate among 12 to 17 year olds on an
indicator for whether the state banned sales to minors by January 1, 2013, interacted with period
fixed effects, as well as controls for state demographics, state cigarette tax rates, and indicators
for smoke-free air laws. Consistent with the parallel trends assumption, none of these interaction
terms are statistically significant, and all are close to zero (|$|<0.005).
Figure 2: State recent smoking rates for ages 12 to 17, by bans on e-cigarette sales to minors
Bans
No Bans
Pre-E-Cigarettes Pre-Bans First Bans
.05
.07
.09
.11
.13
.15
Aver
age
Stat
e Sm
okin
g R
ate
2002-2003 2004-2005 2006-2007 2008-2009 2010-2011 2012-2013Year
By State Bans on E-cigarette Sales to MinorsRecent Smoking Rates among 12 to 17 year olds
Notes: Cross-state averages of age 12 to 17 recent smoking rates—having smoked a cigarette in the past 30 days—from the National Survey of Drug Use and Health are plotted by two-year periods, grouping states by whether a ban on e-cigarette sales to minors was in effect by January 1, 2013 (“Ban”) or not (“No Ban”).
OLS analyses of the NSDUH data consider the following regression:
Smoke12to17SY = !0 + !1BanSY + !2CigTaxSY + !3SmokeFreeSY +!4Smoke18to25SY + %XSY +
"StateS + #YearY + #SY, (3)
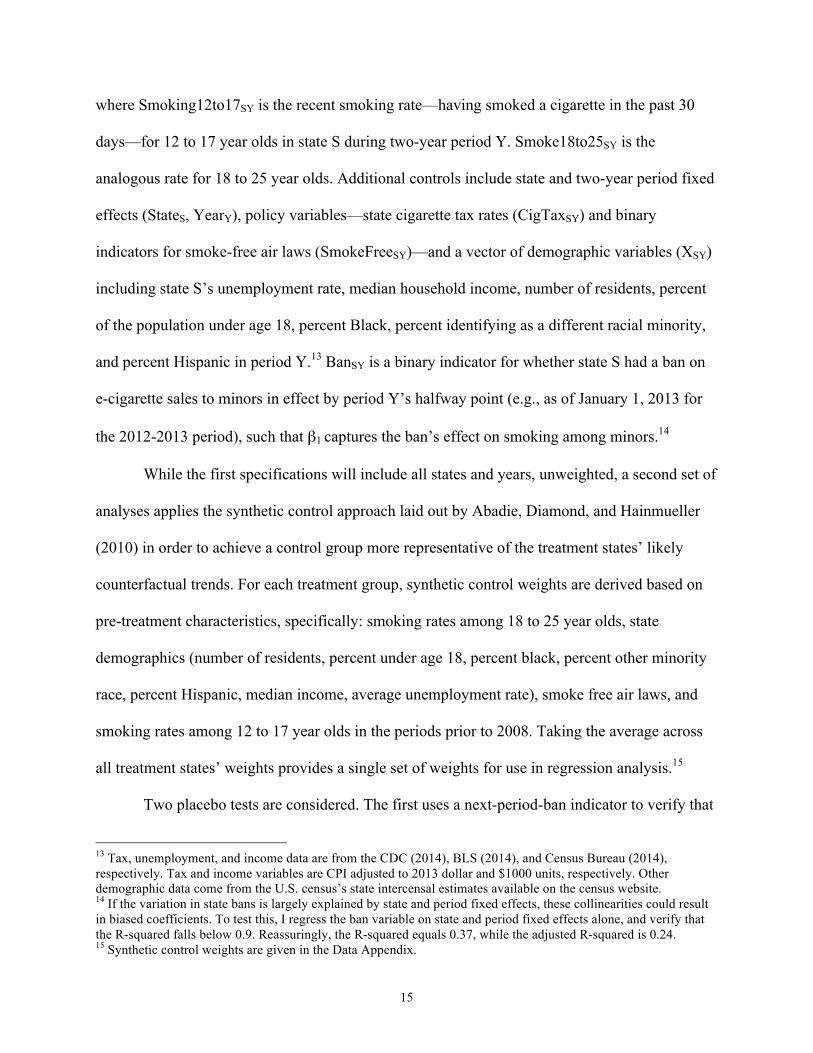
!
! 15!
where Smoking12to17SY is the recent smoking rate—having smoked a cigarette in the past 30
days—for 12 to 17 year olds in state S during two-year period Y. Smoke18to25SY is the
analogous rate for 18 to 25 year olds. Additional controls include state and two-year period fixed
effects (StateS, YearY), policy variables—state cigarette tax rates (CigTaxSY) and binary
indicators for smoke-free air laws (SmokeFreeSY)—and a vector of demographic variables (XSY)
including state S’s unemployment rate, median household income, number of residents, percent
of the population under age 18, percent Black, percent identifying as a different racial minority,
and percent Hispanic in period Y.13 BanSY is a binary indicator for whether state S had a ban on
e-cigarette sales to minors in effect by period Y’s halfway point (e.g., as of January 1, 2013 for
the 2012-2013 period), such that $1 captures the ban’s effect on smoking among minors.14
While the first specifications will include all states and years, unweighted, a second set of
analyses applies the synthetic control approach laid out by Abadie, Diamond, and Hainmueller
(2010) in order to achieve a control group more representative of the treatment states’ likely
counterfactual trends. For each treatment group, synthetic control weights are derived based on
pre-treatment characteristics, specifically: smoking rates among 18 to 25 year olds, state
demographics (number of residents, percent under age 18, percent black, percent other minority
race, percent Hispanic, median income, average unemployment rate), smoke free air laws, and
smoking rates among 12 to 17 year olds in the periods prior to 2008. Taking the average across
all treatment states’ weights provides a single set of weights for use in regression analysis.15
Two placebo tests are considered. The first uses a next-period-ban indicator to verify that
!!!!!!!!!!!!!!!!!!!!!!!!!!!!!!!!!!!!!!!!!!!!!!!!!!!!!!!!13 Tax, unemployment, and income data are from the CDC (2014), BLS (2014), and Census Bureau (2014), respectively. Tax and income variables are CPI adjusted to 2013 dollar and $1000 units, respectively. Other demographic data come from the U.S. census’s state intercensal estimates available on the census website. 14 If the variation in state bans is largely explained by state and period fixed effects, these collinearities could result in biased coefficients. To test this, I regress the ban variable on state and period fixed effects alone, and verify that the R-squared falls below 0.9. Reassuringly, the R-squared equals 0.37, while the adjusted R-squared is 0.24. !15 Synthetic control weights are given in the Data Appendix.
!
! 16!
$1 is not driven by a time-varying characteristic common to states that are about to enact such
bans. The second considers whether bans on e-cigarette sales to minors impact smoking among
non-minors, which would implicate a driver other than the ban itself (e.g., greater information
about smoking’s risks). Specifically, it runs the equation 2 regression with smoking rates among
18 to 25 year olds’ as the dependent variable, and the 26-and-older smoking rate as the control.
B. Results
Table 1 presents the full sample and synthetic control analyses of equation 3. The first
specification omits the control for smoking rates among 18 to 25 year olds. Regardless of
whether this control is included, year fixed effects show that smoking rates fell more quickly
over time, while the tax, unemployment, and household income coefficients are small and
statistically insignificant at the 5 percent level in every specification.16 Both full sample
regressions find that bans on e-cigarette sales to minors yield a positive and statistically
significant 0.7 percentage point increase in recent smoking rates among 12 to 17 year olds,
relative to the rate in states that had not implemented such bans.
The synthetic control specification indicates even larger effects: a 1 percentage point
increase in recent smoking rates due to the bans. These analyses also find a statistically
significant 0.6 percentage point reduction in smoking rates due to smoke free air laws. Other
controls exhibit coefficients similar to those from the full sample specifications.
There are several reasons to suspect that the ban coefficients estimated in Table 1
represent lower bounds on the true effect’s magnitude. First, eleven states’ bans went into effect
in 2013, but after January 1st of that year, and thus are coded as a 0 for 2012-2013. If these bans
!!!!!!!!!!!!!!!!!!!!!!!!!!!!!!!!!!!!!!!!!!!!!!!!!!!!!!!!16 These tax coefficients may reflect relatively small changes in state tax rates, alongside younger teens’ tendency to respond less to cigarette taxes than older teens.

!
! 17!
influenced teen smoking in 2013, $1 would be biased towards zero. Second, as several localities
restricted e-cigarette sales to minors, even in states that did not do so, the impact of local bans on
teen access to e-cigarettes in no-ban states could also bias $1 towards zero. Finally, some states
and localities banned e-cigarette sales to 18 year olds (e.g., Utah), potentially affecting the
control for 18 to 25 year olds’ recent smoking rates. Taken together, these observations suggest
that all ban coefficients estimated here should be viewed as lower bounds on the true effect’s
magnitude.
Table 2 presents placebo tests, with column 1 considering whether next period bans
impact current period smoking. The same-period ban effect remains statistically significant and
similarly sized, while leads on these bans show a statistically insignificant and small effect ($= -
0.0001). This result suggests that the effects are not driven by information about future bans or a
time-varying state characteristic that manifested just before the bans went into effect.
Repeating the equation 3 analysis with smoking rates among 18 to 25 year olds as the
outcome, column 2 does not find evidence that the bans on e-cigarette sales to minors influenced
smoking among groups not subject to them ($= 0.0030, p-value = 0.7).17
Alongside Table 1, the placebo tests’ results provide evidence that state bans on e-
cigarette sales to minors influenced smoking rates only once in place, and only among the target
group. Even so, all regression results indicate that reduced e-cigarette access increases smoking
among 12 to 17 year olds. Moreover, the effect is large: over the 8 years preceding the first bans
on e-cigarette sales to minors, smoking in this age group fell an average of 1.3 percentage points
per two year period. The estimated 1 percentage point rise in smoking due to bans on e-cigarette
sales to minors counters more than 75 percent of that downward trend in states with such bans.
!!!!!!!!!!!!!!!!!!!!!!!!!!!!!!!!!!!!!!!!!!!!!!!!!!!!!!!!17 Repeating this regression without controlling for the smoking rate among those ages 26 and older also yields a small and statistically insignificant ban coefficient (results not shown here). !

!
! 18!
Section III: Propensity to Smoke Analyses
Thus far, analyses have relied on state-level panel data on e-cigarette bans and smoking
rates to test the impact of e-cigarette access on teen smoking. Yet this approach does not indicate
how the smoking-vaping relationship varies between different types of teens. In particular, do e-
cigarettes increase smoking among teens who are unlikely to smoke ex ante (i.e., via gateway
effects or renormalization of smoking)? Do they decrease smoking among those who are likely
to smoke ex ante (i.e., harm reduction)?
To consider this, the following analyses use respondent-level data on e-cigarette use and
smoking from the National Youth Tobacco Survey (NYTS), whose repeated cross-sections were
carried out in 1999, 2000, 2002, 2004, 2006, 2009, 2011, and 2012. These data are nationally
representative but lack state indicators. Thus, changes in e-cigarette use and smoking are
identified off of variation in domestic e-cigarette sales and advertising expenditure, not state
bans. To aggregate respondent data into groups that can be compared over time, a propensity to
smoke equation is estimated off of the 2006 NYTS—e-cigarettes entered the U.S. market in 2007
—and applied to every respondent’s data to generate a distribution of estimated propensity to
smoke absent access to e-cigarettes. Respondents are grouped into centiles (i.e., 100 quantile
bins) of estimated propensity to smoke, and regressions examine changes in smoking and e-
cigarette rates within a given centile over time. To consider whether the evidence is consistent
with gateway effects and renormalization of smoking, harm reduction, or both, analyses test for
differential trends between high and low propensity to smoke centiles.
A. Data and Methods
The NYTS uses stratified random sampling by geographic area and school size to collect

!
! 19!
data on 6th through 12th grade students’ use of tobacco products. With sampling weights, data on
students in each grade are nationally representative of students at that grade level. Analyses
consider only post-2002 data (i.e., 2004, 2006, 2009, 2011, and 2012), as some have suggested
that the September 11th attacks may have influenced smoking rates, and these data lack the
geographic identifiers needed to control for proximity to the attacks.
While the state ban analyses examine recent smoking rates, the NYTS data allow a
stronger proxy for regular smoking.18 Specifically, to distinguish habitual smoking from
experimentation, economists often define a “current smoker” as one who has both smoked
recently and smoked at least 100 cigarettes in their lifetime. The NYTS analyses use this
definition throughout. Since conditioning current smoking on having smoked 100 cigarettes
yields extremely low and invariant smoking rates for those under age 14 (See Appendix Figure
A1), analyses limit consideration to high school students ages 14 to 18.
Table 3 presents weighted summary statistics for this sample, by survey year. Aside from
a clear increase in the percent Hispanic from 2004 (11 percent) to 2012 (20 percent),
demographic traits are similar over time, yet cigarette use falls markedly. Ever smoker rates—
having smoked 100-plus cigarettes in one’s life—and current smoker rates—ever smokers who
smoked in the past 30 days—fell 7 and 6 percentage points, respectively. This similarity reflects
low cessation rates: in any given year, 89 to 91 percent of ever-smokers have smoked in the past
30 days. Thus, the drop in teen smoking appears to stem more from reduced initiation than
increased cessation. Indeed, experimentation with cigarettes (i.e., having tried even one puff)
dropped 16 percentage points from 2004 to 2012. Over a quarter of the drop in current smoking
occurred between 2004 and 2006, before the introduction of e-cigarettes, the Great Recession,
!!!!!!!!!!!!!!!!!!!!!!!!!!!!!!!!!!!!!!!!!!!!!!!!!!!!!!!!18 The state-level NSDUH data are pre-calculated averages, with “recent smoking” the only available measure of smoking participation.

!
! 20!
and the 2009 federal cigarette tax increase.19
Trends in e-cigarette use are markedly nonlinear: from 2011 to 2012, rates of ever having
tried e-cigarettes and current use of e-cigarettes both doubled, growing as much in one year as
they had since the product’s introduction. This is consistent with rapid growth in U.S. e-cigarette
advertising and sales, both of which more than doubled from 2011 to 2012 (See Figure 1).
To consider changes in vaping and smoking rates over time with data from repeated
cross-sectional surveys, respondents are aggregated into subgroups that can be compared across
periods. Logistic regression analysis of the 2006 NYTS data (i.e., the year before e-cigarettes
entered the U.S.) is used to estimate an equation for ex ante propensity to smoke (i.e., absent
access to e-cigarettes):
CurrentSmokeri = $ + !Xi + #i , (4)
where Xi includes binary indicators for sex, race/ethnicity, age, grade, how often the student sees
cigarette use by actors on television or in movies, whether someone they live with smokes
cigarettes, whether someone they live with chews tobacco, and whether they think smoking
makes people look cool or fit in (Appendix Table A1).20 Applying the estimated version of
equation 4 to each respondent’s data (across all NYTS years) yields an estimate of their
counterfactual propensity to smoke (i.e., absent e-cigarette access). Respondents are then
grouped into centiles of propensity to smoke, such that within-centile trends in smoking and e-
cigarette use over time can be examined.
As the same equation is applied to all respondents, two teens with identical attributes will !!!!!!!!!!!!!!!!!!!!!!!!!!!!!!!!!!!!!!!!!!!!!!!!!!!!!!!!19 This result is consistent with other data sources. For example, Monitoring the Future’s (2013) 10th grade recent smoking rates show a fairly constant decline from 2002 through 2006 (See Appendix Figure A2). !20 This regression is not intended as a causal estimation of current smoking status, but as a means to estimate each respondent’s counterfactual propensity to be a current smoker in the absence of e-cigarettes. These propensities facilitate classification of respondents into centiles of propensity to smoke in a manner exogenous to trends in teen smoking. As the coefficients lack causal interpretations, they are not discussed, but can be examined in Appendix Table A1, both for the age 14 to 18 sample and for a minors-only (ages 14 to 17) subsample. Both regressions yield the same pseudo R-square value as the larger sample: 0.15 (Appendix Table A1).
!
! 21!
produce the same propensity to smoke estimate, regardless of whether they are interviewed in
2004 or 2012. Thus, if smoking rates increase over time due exclusively to a fall in the
prevalence of “high propensity types” (e.g., related to reduced parental smoking), one would find
fewer respondents in the high propensity centiles in later years but, all else equal, no substantive
change to the affected centiles’ smoking rates. However, if an outside event changes the odds of
smoking within a given centile (e.g., access to e-cigarettes), that centile’s smoking rates should
shift. Within centile analyses yield unbiased estimates of an event’s impact on teen smoking
rates as long as equation 4’s independent variables are exogenous to trends in teen smoking.21
Applying the estimated equation to each respondent yields their estimated propensity to
smoke absent access to e-cigarettes. To consider how well the propensity estimates predict actual
behavior prior to e-cigarettes’ introduction, Appendix Figure A3 plots observed versus predicted
current smoking rates in 50 propensity to smoke quantiles for 2004, 2006, and 2009.22 Both pre-
e-cigarette years exhibit trends that closely overlap the 45-degree line, with the correlation
between observed and predicted means exceeding 0.97. The 2009 data only veers off the 45-
degree line for the higher propensity to smoke quantiles, perhaps a response to that year’s federal
excise tax increase. The correlation between observed and predicted means here equals 0.95.
Overall, the concordance between observed and predicted behaviors supports using the 2006
equation to estimate propensities to smoke absent access to e-cigarettes.
!!!!!!!!!!!!!!!!!!!!!!!!!!!!!!!!!!!!!!!!!!!!!!!!!!!!!!!!21 In other words, if a hypothetical teen is likely to be sorted into a different centile when teen smoking is rising, this method may yield biased estimates. To understand this restriction, recall that respondents are categorized based on ex ante propensity to smoke. The outcome variable of interest is the change in rates of smoking or e-cigarette use. If an event that increases teen smoking rates alters a respondent’s estimated ex ante propensity to smoke (i.e., via an effect of rising teen smoking on the independent variables in equation 4), that respondent may be shifted into a different centile. This could bias within-centile changes in smoking rates towards zero, as increasing (decreasing) teen smoking rates would yield higher (lower) ex-post propensities to smoke, shifting the affected respondents into correspondingly higher (or lower) centiles. 22 While regressions divide the respondents into centiles of propensity to smoke (i.e., 100 bins), figures use 50 quantiles (i.e., 50 bins, not to be confused with “quartiles”) because it proved easier, visually, to examine the plots containing multiple different trends when using the less granular data.
!
! 22!
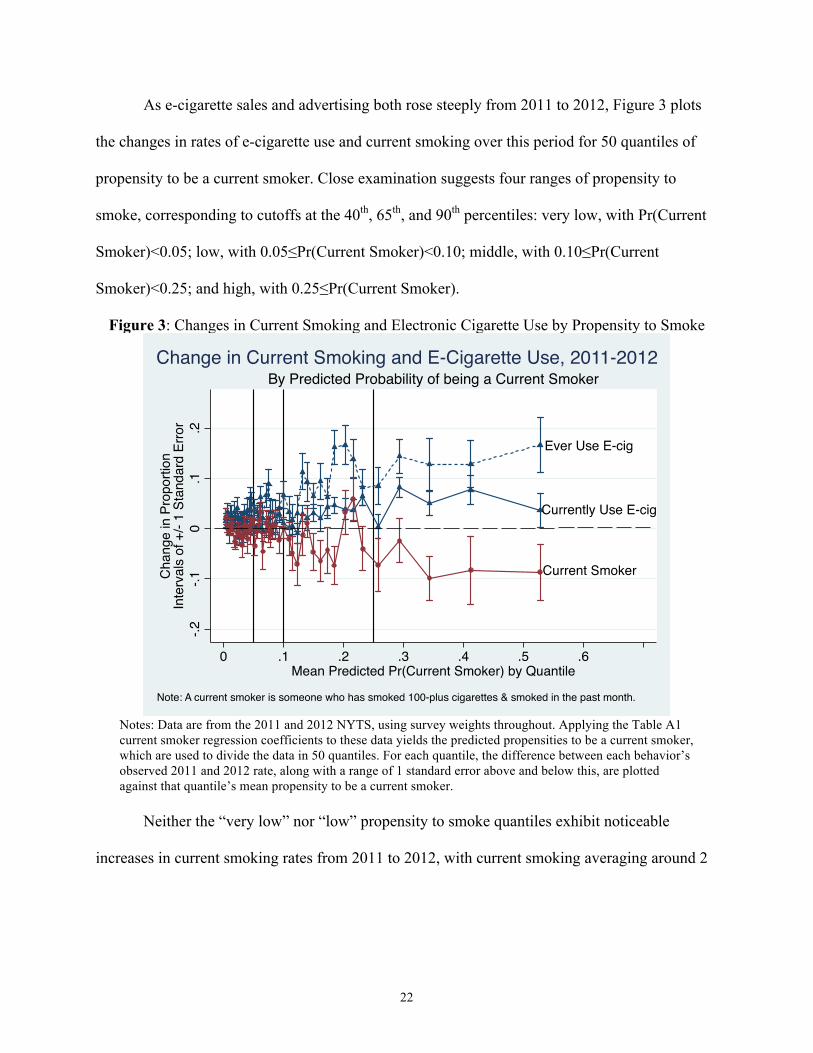
As e-cigarette sales and advertising both rose steeply from 2011 to 2012, Figure 3 plots
the changes in rates of e-cigarette use and current smoking over this period for 50 quantiles of
propensity to be a current smoker. Close examination suggests four ranges of propensity to
smoke, corresponding to cutoffs at the 40th, 65th, and 90th percentiles: very low, with Pr(Current
Smoker)<0.05; low, with 0.05#Pr(Current Smoker)<0.10; middle, with 0.10#Pr(Current
Smoker)<0.25; and high, with 0.25#Pr(Current Smoker).
Figure 3: Changes in Current Smoking and Electronic Cigarette Use by Propensity to Smoke
Ever Use E-cig
Currently Use E-cig
Current Smoker
-.2-.1
0.1
.2
Cha
nge
in P
ropo
rtion
Inte
rval
s of
+/-
1 St
anda
rd E
rror
0 .1 .2 .3 .4 .5 .6Mean Predicted Pr(Current Smoker) by Quantile
Note: A current smoker is someone who has smoked 100-plus cigarettes & smoked in the past month.
By Predicted Probability of being a Current SmokerChange in Current Smoking and E-Cigarette Use, 2011-2012
Notes: Data are from the 2011 and 2012 NYTS, using survey weights throughout. Applying the Table A1 current smoker regression coefficients to these data yields the predicted propensities to be a current smoker, which are used to divide the data in 50 quantiles. For each quantile, the difference between each behavior’s observed 2011 and 2012 rate, along with a range of 1 standard error above and below this, are plotted against that quantile’s mean propensity to be a current smoker.
Neither the “very low” nor “low” propensity to smoke quantiles exhibit noticeable
increases in current smoking rates from 2011 to 2012, with current smoking averaging around 2
!
! 23!
percent in both years for the “very low” group, and from 4 to 5 percent in the “low” group.23
Both groups show slight increases in ever-use of e-cigarettes, but no change in recent-use. Thus,
experimentation with e-cigarettes does not appear to be associated with increased smoking
among those who were unlikely to smoke ex ante.
Quantiles in the middle propensity to smoke group have much higher current smoking
rates, which drop from an average of 12 percent in 2011 to 10 percent in 2012. Those in the high
propensity to smoke group show even larger rates, falling from 26 percent in 2011 to 19 percent
in 2012. In both cases, ever-use and recent-use of e-cigarettes rise noticeably from 2011 to 2012.
The concurrence of falling smoking rates and rising e-cigarette use among those who were likely
to smoke ex ante suggests harm reduction.
To consider this more carefully, regressions examine how changes in domestic e-cigarette
availability shift rates of cigarette smoking (regression A) and e-cigarette use (regression B)
within centiles of propensity to smoke, allowing coefficients to vary between centiles in the
“very low,” “low,” “middle,” and “high” propensity to smoke groups.24 Taking the ratio of
regression A’s e-cigarette availability coefficient for a given propensity group to the
corresponding coefficient in regression B identifies the impact of e-cigarette use on smoking in
that group.
Two proxies for e-cigarette availability are considered: domestic e-cigarette sales and
domestic advertising expenditure. Prior to 2013, trends in these variables were shaped by several
nonmarket events, ranging from an e-cigarette import ban in 2008 and 2009, to patent lawsuits
!!!!!!!!!!!!!!!!!!!!!!!!!!!!!!!!!!!!!!!!!!!!!!!!!!!!!!!!23 For plots of current smoking levels in 2011 and 2012 by propensity to smoke, see Appendix Figure A4 plots current smoking levels in 2011 and 2012 by propensity to smoke. 24 Centiles are grouped based in where their mean propensity to smoke falls below the 40th percentile (very low), between the 40th and 65th (low), between the 65th and 90th (middle), and above the 90th percentile (high).

!
! 24!
that delayed the largest tobacco firms’ entry into this market.25 Thus, in the period of analysis,
changes in domestic e-cigarette sales and advertising expenditure reflect variation exogenous to
e-cigarette demand. While advertising is not typically used as a measure of “availability,” e-
cigarettes were a relatively new product over the period of analysis, such that advertising is
likely to reflect production’s ability to meet demand as well as consumer awareness of the new
product, via information and salience effects (i.e., availability in the behavioral sense). Trends in
e-cigarette sales and advertising are quite similar (See Figure 1), consistent with the idea that
advertising induces demand.
Regressions difference a basic current smoking equation. Demand for cigarettes should
be a function of cigarettes prices, income, individual determinants of tastes for smoking, and
information. Allowing differential effects between the four propensity to smoke groups:
CurrentSmokerit = !0 + !1Pricet $ Gi + !2ECigAvailt
$ Gi + !3TTt $ Gi + &Xi + #Yeart + #it. (5)
CurrentSmokerit signifies whether the individual i has both smoked 100 cigarettes in their
lifetime and smoked in the past 30 days as of time t. Binary indicators for whether person i falls
into a low, middle, and high propensity to smoke group (vector Gi) are interacted with cigarette
prices (Pricet), e-cigarette availability (ECigAvailt), and a linear time trend (TTt = yeart – 2000),
!!!!!!!!!!!!!!!!!!!!!!!!!!!!!!!!!!!!!!!!!!!!!!!!!!!!!!!!25 Electronic cigarettes entered the U.S. in 2007, the same year that Ruyan, the Chinese company that invented e-cigarettes, received an international patent. However, the U.S. Food and Drug Administration’s (FDA) barred e-cigarette imports starting in 2008, based on concerns about the product’s safety. After the FDA blocked a shipment by Sottera, Inc. in April of 2009, the importer filed suit, challenging the legal basis for the FDA ban. The case would last over a year and a half. In the meantime, PayPal cancelled e-cigarette sellers’ accounts, and Amazon.com began prohibiting e-cigarette sales on its website. Finally, in December of 2010, the U.S. Court of Appeals rejected the FDA’s original basis for e-cigarette regulation (as drug-device combinations), but found that e-cigarettes could be regulated as tobacco products under the 2009 Family Smoking Prevention and Tobacco Control Act (Riker et al., 2012). Within a month of this decision, Ruyan announced its intent to sue U.S. companies for patent infringement. Within a week of settling Ruyan’s claim against it, blu eCigs was acquired by Lorillard, marking Big the first of the top three Tobacco’s tobacco companies’ entry entries into the e-cigarette market on April 24th of 2012. Blu’s spending in that year explains the entirety of e-cigarette advertising’s 2011 to 2012 growth (Kim, Arnold, and Makarenko, 2014); its ads account for over 80 percent of youth exposure to televised e-cigarette advertising in 2013 (Duke et al., 2014).

!
! 25!
allowing each of these effects to vary between those with different ex ante tastes for smoking.26
Xi captures individual characteristics related to tastes and access to information, while year fixed
effects (Yeart) absorb the reference group (very low propensity to smoke) response to time-
varying factors. E-cigarette prices, individual income, and state identifiers (which would allow
more detailed smoking policy controls) are excluded, as they are not available in the NYTS data.
Equation 5 is differenced over centiles of propensity to smoke, retaining year fixed
effects and the constant to control for time trends in the “very low propensity” reference group:
%CurrentSmokercs=!0 +!1Gc!%CigTaxs +!2Gc
!%ECigAvails +!3Gc!%TTs +#Years + #cs. (6)
This is essentially a triple-difference analysis testing whether larger increases in the availability
of e-cigarettes yield varying changes in current smoking for different propensity to smoke
groups. The dependent variable, %CurrentSmokercs, is the within centile (c) change in current
smoker rates between survey s and the prior survey (not t, as the NYTS is not conducted
annually). Gc is a vector of three dummy variables indicating whether the mean propensity to be
a smoker among those in centile c falls into the low, middle, or high propensity ranges depicted
in Figure 3. Interacting Gc with changes in the federal cigarette tax rate (%CigTaxs) as an
exogenous measure of cigarette price, a change in time-trend variable (%TTs), and changes in a
proxy for e-cigarette availability (%ECigAvails) allows these effects to differ between groups
with particularly high or lower propensities to smoke.27 Individual characteristics potentially
related to tastes and access to information (Xi in equation 5) are differenced out (e.g., sex, race,
ethnicity, etc.) or captured by the time trend (e.g., age). Each of these traits is included as a
control in the propensity to smoke equation used to define the centiles, such that their impact on
!!!!!!!!!!!!!!!!!!!!!!!!!!!!!!!!!!!!!!!!!!!!!!!!!!!!!!!!26 Income and e-cigarette prices should also affect cigarette demand, but the NYTS lacks such data. 27 Data used to derive the e-cigarette advertising expenditure series come from Elliot (2013) and Kim, Arnold, and Makarenko (2014) (See Data Appendix). This model would also benefit from controls for changes in income, e-cigarette prices, and state smoking policies, but income and price data are not available in the NYTS, while state policy data cannot be incorporated due to a lack of state identifiers. !
!
! 26!
propensity to smoke is held relatively constant within a centile over time, by construction.
Standard errors are clustered by centile.
As e-cigarettes entered the U.S. in 2007, and the 2009 NYTS did not collect e-cigarette
use data, the analogous regression for changes in e-cigarette use considers only two sets of
within-centile changes in e-cigarettes use: 2006 to 2011, and 2011 to 2012. Consequently, the
equation cannot control for both the propensity group (Gc) by tax change and group by time
trend interactions, due to collinearity. Thus, equation 7 uses a more general specification,
interacting each of the low, middle, and high propensity group dummy variables with a year-
2011 indicator (Gc! Year2011):28
%EverECigcs =!0 + !1Gc ! Year2011 +!2Gc
!%ECigAvails + #Year2011 + #cs. (7)
The dependent variable captures the change in the rate of ever-use of e-cigarettes in centile c
between survey s and the prior survey. !2 reflects group-specific changes in e-cigarette use
associated with changes in e-cigarette availability, allowing for differential responses in each
group to influential factors occurring between 2006 and 2011.
For both equations 6 and 7, the interpretations of !2 rely on a relatively strict identifying
assumption: that any variation in changes in smoking and e-cigarette consumption over time due
to factors other than shifts in e-cigarette availability is absorbed by the combination of year fixed
effects and group specific linear time-trends (and, for the smoking specification, group-specific
responses to federal cigarettes tax changes), or uncorrelated with e-cigarette availability. In other
words, identification of a causal effect assumes there are no group specific non-linear trends
driving the changes in smoking and e-cigarette consumption that could confound !2. This
assumption is necessary for identification given the limits of current data.
!!!!!!!!!!!!!!!!!!!!!!!!!!!!!!!!!!!!!!!!!!!!!!!!!!!!!!!!28 Specification checks consider group by time trend interactions, but the group by year-2011 version is preferred, as the impact of the recession and 2009 tax change on smoking prior to 2011 may bias the time trend and !2.

!
! 27!
While one might be concerned about reverse causation in this approach, controls for
linear time-trends in each propensity group indicate that this is only a problem if changes in
youth smoking drive nonlinearities in the changes in total e-cigarette sales and advertising. Two
facts suggest that this is unlikely in the pre-2013 period. First, while total U.S. e-cigarette sales
rose from $82 million to $195 million between 2010 and 2011, youth consumption was
insufficient to propel such a large sales increase: middle and high school students accounted for
only 7 percent of ever-use of e-cigarettes in 2011.29 Second, non-market events ranging from an
FDA ban on e-cigarette imports to patent lawsuits introduced marked nonlinearities in the
growth of domestic e-cigarette sales and advertising, particularly by delaying the largest U.S.
tobacco companies’ entry into the e-cigarette market until 2012, when Lorillard acquired blu
eCigs. This entry amplified the domestic market: blu’s advertising in the year Lorillard acquired
it accounted for the entirety of 2011 to 2012’s growth in domestic e-cigarette advertising
expenditure, tripling spending on U.S. e-cigarette advertising in a single year (Kim, Arnold, and
Makarenko, 2014).30
Specification checks omit the 2009 data, as respondents’ cigarette tax rates in that year
depend on their interview dates (not provided by the NYTS) and because the e-cigarette
expenditure data lack a 2009 observation. Given that the tax was enacted prior to the first 2009
survey, and in effect for over half the survey period, baseline regressions treats all 2009
!!!!!!!!!!!!!!!!!!!!!!!!!!!!!!!!!!!!!!!!!!!!!!!!!!!!!!!!29 This percentage is based on census data on cohort size as well as 2011 rates of ever use of e-cigarettes among middle and high school students (2011 National Youth Tobacco Survey data) and among adults (King et al, 2013). 30 The logic behind the tobacco industry’s entry is fairly straightforward given the industry advantage in navigating tobacco control legislation. Even beyond that, controlling a large share of the e-cigarette market facilitates a wider array of profit maximization strategies for cigarette producers. If the products are complements, the firm can reinforce both brands and further secure its consumer base (e.g., by branding its e-cigarettes to match the target market and brand preferences of its existing cigarettes). If the products are substitutes, it has the added advantage of potentially insulating the firm from switching losses. Indeed, the dominant U.S. tobacco companies took a similar approach to High Filtration (Hi-Fi) cigarettes’ introduction in the mid-20th century, with the largest brands introducing Hi-Fi line extensions (e.g., Marlboro Lights) as a means of shoring up their market share against losses from more health conscious/concerned smokers switching to lower risk brands (Cutler and Friedman, 2014).

!
! 28!
observations as if the tax change had occurred, and use the 2010 advertising expenditure
observation in place of the 2009 observation.31 The latter substitution may be reasonable if
Sottera v. FDA (the e-cigarette import ban case that ran from early 2009 through late 2010)
affected e-cigarette advertising similarly in both years. The baseline analyses and specification
checks yield similar results.
The lack of variation in the tax data poses an additional concern. Without geographic
identifiers, only federal tax changes are observed, with only one such change occurring in the
period of analysis. Thus, the group-by-tax change coefficient will absorb any differential
smoking effects specific to the 2006 to 2009 period. In fact, this may be beneficial: if the !1 tax
coefficients absorb differential changes in cigarette smoking due to the Great Recession, the
latter is less likely to confound the e-cigarette interaction terms’ coefficients. The caveat is that
!1 cannot be interpreted as a pure tax response.32 Further concerns about tax variation are
addressed by repeating the analyses without 18 year olds in the sample, as existing work suggests
that younger teenagers are less responsive to cigarette taxes.33
B. Results
All regressions are carried out for both an ages 14 to 18 sample and 14 to 17 year old
sample. As these yield similar results, the minors-only regressions are relegated to Appendix
!!!!!!!!!!!!!!!!!!!!!!!!!!!!!!!!!!!!!!!!!!!!!!!!!!!!!!!!31 On February 4, 2009, five days before the first 2009 NYTS interview, the largest federal cigarette tax increase to date was enacted. The tax went into effect on April 1st, 2009, affecting cigarette prices for more than half of that year’s NYTS survey period. As the tax was enacted before interviews began and covered heavily in the news, it may have been salient even for those respondents surveyed before April 1st. 32 Existing research on how recessions impact smoking suggests that adult smoking decreases during recessions (Ruhm, 2005). If youths behave similarly, !1 will be biased downward. 33 Gruber and Zinman (2001) find statistically significant reductions in smoking in response to cigarette taxes among high school seniors but not younger high school students, repeating their analysis with several data sets. Plotting current smoking by birth cohort in the NYTS data yields a pattern consistent with the evidence that younger teens’ smoking participation is less responsive to cigarette tax rates than older teens’ (See Appendix Figure A5). Specifically, while the 1992/1993 birth cohort shows a distinct kink in its smoking rates in 2009, the 1994/1995 cohort’s kink is only evident two years later, in 2011.

!
! 29!
Tables A2 and A3. Coefficients discussed here concern the 14 to 18 year olds unless otherwise
indicated.
Table 4 presents the change in current smoking analyses. The baseline regression omits e-
cigarette interaction terms, and finds no statistically significant responses to the 2009 federal
cigarette tax increase for any of the propensity to smoke groups. This is not particularly
concerning as the tax coefficients here are likely absorbing responses to several concurrent
changes including the Great Recession. Adding the change in e-cigarette sales interactions, one
finds that high propensity to smoke centiles exhibit a statistically significant 2.1 percentage point
drop in current smoking for every $100 million increase in e-cigarette sales, whereas the low and
middle propensity groups exhibit small statistically insignificant responses (+0.2 and -0.1
percentage points, respectively). These results hold whether the specification includes or omits
2009 data. Using change in e-cigarette advertising expenditure in place of e-cigarette sales yields
analogous findings: a $1 million increase in domestic e-cigarette advertising is associated with a
statistically significant 0.5 percentage point drop in high propensity group smoking, but small
and statistically insignificant effects in the other groups. Overall, these findings point to harm
reduction in the high propensity to smoke group, with no evidence that greater e-cigarette
availability increases smoking in any propensity group.
To understand the magnitude of these effects relative to changes in e-cigarette use, Table
5 considers how ever-use of e-cigarettes changes with domestic e-cigarette sales and advertising,
by propensity group.34 As specifications with propensity group-by-time trend controls yield
similar results to those with group-by-2011 controls, only the latter specification is described
here. While the low propensity group shows statistically insignificant increases in e-cigarette use
!!!!!!!!!!!!!!!!!!!!!!!!!!!!!!!!!!!!!!!!!!!!!!!!!!!!!!!!34 As neither harm reduction nor gateway effects necessitate continued e-cigarette use, focusing on the change in ever-use of e-cigarettes (instead of current use) is appropriate.
!
! 30!
associated with both increased sales (0.3 percentage points per $100 million increase) and
advertising (0.08 percentage points per $1 million increase), both the middle and high propensity
groups exhibit larger, statistically significant increases (respectively, 2.1 and 3.3 percentage
points per $100 million rise in sales; 0.5 and 0.8 percentage points per $1 million increase in
advertising).
To identify the current smoking response to changes in e-cigarette use, Table 6 takes the
ratio of each propensity group’s e-cigarette sales or advertising coefficient in the smoking
regressions (Tables 4 and, for the minors-only sample, A2) to the corresponding coefficient in
the e-cigarette regressions (Tables 5 and, for the minors-only sample, A3). The group-by-2011 e-
cigarette regression specifications are used here, as these have slightly higher sales and
advertising coefficients, and thus yield a more conservative ratio. Regardless of whether
estimates are based on e-cigarette sales or advertising coefficients, the ratios are virtually
identical within each sample (i.e., ages 14 to 17 or 14 to 18). Only the high propensity group
ratios are based entirely on statistically significant coefficients. For high propensity to smoke 14
to 18 year olds, a one percentage point increase in ever use of e-cigarettes is associated with a
0.65 percentage point drop in current smoking rates. When the cohort is limited to minors, this
drop is even larger, at 0.83 percentage points.
The low propensity group’s coefficients on e-cigarette sales and advertising are
statistically insignificant in all smoking regressions and all but one e-cigarette regression, such
that the Table 6 ratios for this group are highly questionable. Yet the middle propensity group’s
ratios, based on statistically insignificant smoking response coefficients alongside statistically
significant e-cigarette responses, are similar in magnitude and direction across all specifications:
a one percentage point increase in ever use of e-cigarettes yields a smoking reduction of about

!
! 31!
0.1 percentage points for both 14 to 18 and 14 to 17 year olds in the middle propensity group. If
this propensity group has a disproportionate share of marginal smokers, its effect may reflect a
net impact of e-cigarettes on smoking (i.e., if e-cigarettes increase smoking among some and
decrease it among others, with both effects more common for individuals on the margin). This
could explain the smoking coefficients’ statistical insignificance, with the ratio itself suggesting
a larger contribution of harm reduction on net.
Overall, these analyses find evidence consistent with harm reduction in the relationship
between e-cigarettes and cigarette smoking among adolescents in the highest 10 percent of the
propensity to smoke distribution. A one percentage point increase in e-cigarette use in this high
propensity group yields a 0.83 percentage point reduction in current smoking among 14 to 17
year olds, and a 0.65 percentage point drop among 14 to 18 year olds. Contrary to the gateway
effect and renormalization of smoking claims, there is no indication across any subgroup that
greater e-cigarette use increases smoking.
Section IV: Conclusion
Across multiple datasets and identification strategies, this paper’s analyses consistently
find that electronic cigarette access reduces teen smoking. State bans on e-cigarette sales to
minors yield a statistically significant 1.0 percentage point increase in recent cigarette smoking
rates among 12 to 17 year olds, while propensity to smoke regressions suggest that this effect
operates primarily through those who are most likely to smoke ex ante. Specifically, a one
percentage point increase in ever-use of e-cigarettes yields a 0.65 to 0.83 percentage point drop
in current smoking among the highest propensity to smoke teens, a cohort comprising about 10
percent of high school students ages 14 to 18, but 29 percent of current smokers in that age
!
! 32!
group.35
This paper has several limitations. First and foremost, short panels and limited data on e-
cigarette use prevent regressions from accounting for more granular trends and limit identifying
variation (e.g., the state ban analyses can only observe bans in two periods). Further work will
address this as more data become available. On a related note, the ideal smoking variable would
capture regular cigarette use, but this is not asked directly in either dataset. With the NYTS data,
analyses are able to use an accepted proxy for habitual use, but the NSDUH state data restrict
consideration to recent smoking only. However, as the focus is on youths, even intermittent use
may be a key concern if it signals a higher likelihood of habitual smoking in the future. Next, the
propensity to smoke analyses assume that non-linear trends in e-cigarette sales and advertising
are not correlated with other non-linear trends that affect adolescent smoking or e-cigarette use
differently across the four propensity groups. Although necessitated by data limitations, this is a
particularly strict assumption. A violation of it would bias coefficient ratios away from zero if e-
cigarette sales and advertising coefficients are biased away from zero in the smoking regressions,
or if these coefficients are biased towards zero in the e-cigarette regressions.36 The fact that the
state ban results are consistent with the propensity analyses’ findings is reassuring in this regard.
A fourth limitation has to do with the e-cigarette market itself: as it is quite young and evolving
quickly, this paper’s analyses may not reflect relationships at market equilibrium. For example, if
the observed response among teens is partially a reaction to the controversy around e-cigarettes,
!!!!!!!!!!!!!!!!!!!!!!!!!!!!!!!!!!!!!!!!!!!!!!!!!!!!!!!!35 In the highest propensity to smoke cohort, dual use increased markedly from 2011 to 2012: 9 percent of these smokers had used e-cigarettes in the past 30 days in 2011, versus 29 percent in 2012. This paper does not consider whether teenage dual use reduces or increases smoking, as such an analysis requires more years of data to account for lags between e-cigarette take-up and smoking cessation, with the latter potentially occurring post-adolescence. 36 In other words, to bias these results, the omitted variable would need to:
1. Exhibit substantially larger or smaller magnitude changes from 2011 to 2012 than between prior periods; 2. Affect high propensity smokers differently than lower propensity smokers; and, 3. Either be inversely related to e-cigarette use (to bias the e-cigarette regression coefficients downward) or
directly related to cigarette use (to bias the smoking regression coefficients upward).
!
! 33!
their behavior may change as that controversy abates and the product becomes less novel.
Moreover, if the smoking-vaping relationship is responsive to marketing, a change in the
marketing context could shift this relationship. For example, if candy-like e-cigarette flavors
appeal particularly to children, these may raise the propensity for nicotine dependence (and
smoking) over younger ages and longer periods than can be considered with current data.
Finally, these analyses limit consideration to the potential costs and benefits of e-
cigarettes in terms of their relationship to cigarette smoking. The potential long run health effects
from e-cigarettes themselves, as well as complementarities with other risky behaviors (e.g.,
alcohol consumption), are not addressed. As data on such consequences becomes available, they
will clarify the product’s full costs and benefits. In particular, evidence of substantial variation in
the particulate matter and toxins produced by e-cigarettes of different types with different
flavorings suggests that future analyses should attend to the demand for and health effects of
different kinds of e-cigarettes (e.g., flavored e-liquid, higher voltage devices) (Grana, Benowitz,
and Glantz, 2014; Kosmider et al., 2014).
This paper offers several key contributions. Identifying off of state policy changes, as
well as variation in e-cigarette sales and advertising in an era strongly influenced by non-market
events, supports the contention that the estimated effects are causal. The analysis of state bans on
e-cigarette sales to minors provides the first causal evidence of e-cigarettes’ impact on
adolescent smoking, validated by both placebo tests and a synthetic control approach, and finds
that e-cigarette access reduces teen smoking rates. By estimating subgroup specific effects, the
propensity to smoke analyses present the first evidence that e-cigarettes’ impact on adolescent
smoking appears specific to those teens who are most likely to smoke ex ante, and again suggests
that e-cigarette availability reduces smoking among such youths. These results are consistent
!
! 34!
with the harm reduction hypothesis, but find no evidence supporting the claim that e-cigarettes
increase smoking (i.e., gateway effects or renormalization of smoking). Moreover, estimating
differential smoking-responses to e-cigarette access opens the door to further study of subgroup-
specific effects, which may be key to understanding future inequalities in smoking-related
morbidity and mortality. Overall, these results, from two distinct sets of analyses using different
data and identification strategies, yield consistent implications: prior to 2014, e-cigarette access
reduced adolescent smoking, operating particularly as a means of harm reduction by decreasing
smoking participation among teens who were otherwise likely to smoke.
The conceptual framework presents several implications not tested here due to a lack of
necessary data: specifically that gateway effects are more likely and harm reduction less likely if
e-cigarettes deliver less nicotine than cigarettes or have a greater price per use; that harm
reduction should be more common among those with greater discount factors and a greater
perceived health-cost of smoking relative to e-cigarette use; and that these two claims—harm
reduction and gateway effects—are not necessarily mutually exclusive, as they apply to
individuals with different ex ante preferences for smoking. Future work should test these
implications, with particular attention to individual heterogeneity in the impact of e-cigarettes on
smoking.
Notably, the evidence of harm reduction presented here is not a straightforward guide to
regulation, as the market had not reached equilibrium by 2013. Thus, these findings may not
reflect adolescent behavior in a context where e-cigarettes are less novel or controversial,
regulated differently, or marketed differently. Moreover, e-cigarettes could have costly health
effects for those who vape over longer periods, a potential rationale for limiting youth access
until further data on long run effects are available.
!
! 35!
Assuming that e-cigarettes are indeed less risky to one’s health than traditional cigarettes,
as suggested by existing evidence on the subject, this paper’s results and conceptual framework
indicate that regulations designed to reduce youth smoking should formalize a price advantage of
e-cigarettes over cigarettes (i.e., via taxes), maintain comparable nicotine levels in the two
products, and limit marketing designed to raise the appeal of e-cigarettes to youths who have a
lower propensity to smoke (e.g., younger, more risk averse), though without reducing the
attraction for high propensity to smoke teens. While the state e-cigarette ban results call the
FDA’s proposed ban on e-cigarette sales to minors into question, they are not definitive on this
point. Specifically, an FDA decision not to ban such sales might be seen as sanctioning teen use.
A middle ground could involve banning sales to those younger than 16 instead of 18, as initiation
of regular smoking first spikes at the former age (Lillard, Molloy, and Sfekas, 2013). Qualitative
research clarifying why youths use or abstain from e-cigarettes, and how they would interpret
such a policy, may be helpful in guiding regulation.

!
! 36!
Tables Table 1: Bans on E-cigarette Sales to Minors and Recent Smoking among 12 to 17 year olds,
Coefficient/Standard Error Recent Smoking Rate, 12 to 17 year olds Standard OLS Synthetic Control Specification: (1) (2) (3) (4) Ban on e-cigarette sales to minors
0.0066* 0.0069*** 0.0111*** 0.0095*** (0.0035) (0.0025) (0.0039) (0.0035)
Smoke Free Air Laws 0.0028 0.0029 -0.0084*** -0.0059** (0.0024) (0.0020) (0.0023) (0.0027)
Recent smoking rate, ages 18-25
0.2488*** 0.2451*** (0.0321) (0.0594)
State cigarette tax 0.0002 0.0018 0.0016 0.0029 (0.0023) (0.0019) (0.0028) (0.0019)
Median household income (in $1000 units)
-0.0000 -0.0000 0.0000 0.0000* (0.0000) (0.0000) (0.0000) (0.0000)
State unemployment rate
-0.0011 -0.0011 -0.0039* -0.0029* (0.0010) (0.0008) (0.0022) (0.0017)
Year effect: 2004-2005 -0.0170*** -0.0140*** -0.0166*** -0.0138*** (0.0030) (0.0027) (0.0032) (0.0038)
Year effect: 2006-2007 -0.0312*** -0.0249*** -0.0384*** -0.0301*** (0.0043) (0.0034) (0.0043) (0.0055)
Year effect: 2008-2009 -0.0427*** -0.0316*** -0.0388*** -0.0277*** (0.0050) (0.0043) (0.0041) (0.0068)
Year effect: 2010-2011 -0.0523*** -0.0376*** -0.0461*** -0.0315*** (0.0062) (0.0052) (0.0053) (0.0079)
Year effect: 2012-2013 -0.0762*** -0.0547*** -0.0788*** -0.0530*** (0.0070) (0.0062) (0.0067) (0.0113)
Constant 0.2672*** 0.1624** 0.1104 -0.0402 (0.0690) (0.0616) (0.1031) (0.0905)
Demographic Controls Yes Yes Yes Yes State Fixed Effects Yes Yes Yes Yes N 306 306 270 270 Adjusted R-square 0.896 0.923 0.926 0.948 Mean (Recent smoking rate, 12 to 17 year olds) 0.102 0.102 0.101 0.101 Notes: Using state-level data on recent smoking rates for 2002-2003, 2004-2005, 2006-2007, 2008-2009, 2010-2011, and 2012-2013, from the National Survey on Drug Use and Health. Bans on electronic cigarette sales to minors are indicated if they went into effect before the period’s halfway point (e.g., by January 1, 2011 for the 2010-2011 period). All monetary units are in real 2013 dollars. All controls are indicated. Demographic controls include number of state residents, percent Black, percent other racial minority, percent Hispanic, and percent under age 18. SEs are clustered by state. ***(**) [*] denotes statistical significance at the 1% (5%) [10%] level.

!
! 37!
Table 2: Placebo Tests for Impact of Bans on E-cigarette Sales to Minors on Recent Smoking , Coefficient/Standard Error
Dependent Variable: Smoking among 12-17 year olds
Smoking among 18-25 year olds
Specification: (1) (2) Ban on e-cigarette sales to minors
0.0070*** 0.0030 (0.0025) (0.0071)
Smoke Free Air Laws 0.0029 0.0022 (0.0020) (0.0041)
Recent smoking rate, ages 18-25
0.2488*** (0.0322)
Next period ban on e-cigarette sales to minors
-0.0001 (0.0021)
Recent smoking rate, ages 26+
0.6382*** (0.1158)
State cigarette tax 0.0018 -0.0030 (0.0019) (0.0037)
Median Income (in $1000 units)
-0.0000 -0.0000 (0.0000) (0.0000)
Unemployment rate -0.0011 0.0015 (0.0008) (0.0022)
Year effect: 2004-2005 -0.0141*** -0.0091* (0.0027) (0.0053)
Year effect: 2006-2007 -0.0249*** -0.0253*** (0.0034) (0.0074)
Year effect: 2008-2009 -0.0316*** -0.0469*** (0.0043) (0.0079)
Year effect: 2010-2011 -0.0376*** -0.0615*** (0.0052) (0.0106)
Year effect: 2012-2013 -0.0547*** -0.0885*** (0.0062) (0.0123)
Constant 0.1625** 0.2046* (0.0620) (0.1025)
Demographic Controls Yes Yes State Fixed Effects Yes Yes N 306 306 Adjusted R-square 0.922 0.890 Notes: Using state-level data on recent smoking rates by age group for 2002-2003, 2004-2005, 2006-2007, 2008-2009, 2010-2011, and 2012-2013, from the National Survey on Drug Use and Health. Bans on electronic cigarette sales to minors are indicated if they went into effect before the period’s halfway point (e.g., by January 1, 2011 for the 2010-2011 period). Median household income and tax rates are in real 2013 dollar units. All controls are indicated. Demographic controls include number of state residents, percent Black, percent other racial minority, percent Hispanic, and percent under age 18. SEs are clustered by state. ***(**) [*] denotes statistical significance at the 1% (5%) [10%] level.
!
! 38!
Table 3: National Youth Tobacco Survey Summary Statistics, Weighted Means by Survey Year 2004 2006 2009 2011 2012
N 13,413 13,431 12,093 9,477 12,695 Demographics Age 16.0 16.0 16.0 16.1 16.1 Female 51% 51% 49% 49% 49% Hispanic 11% 13% 17% 19% 20% Race: White 72% 71% 66% 67% 66% Race: Black 16% 17% 19% 18% 19% Race: Asian 5% 4% 5% 5% 6% Race: American Indian or Alaska Native 3% 4% 4% 5% 5% Race: Native Hawaiian or Pacific Islander 2% 2% 2% 2% 2% Smoking behaviors Ever tried cigarettes 52% 48% 42% 39% 36% Ever-smoker: Smoked 100+ cigarettes in life 14% 12% 10% 9% 7% Current smoker: Ever smoker + Smoked in past 30 days 12% 11% 8% 8% 6% Ever-smoker who has not smoked in past 30 days 1.2% 1.3% 1.0% 0.9% 0.7% Ever tried electronic cigarettes – – – 4.5% 10.0% Used electronic cigarettes in past 30 days – – – 1.4% 2.8% Smoking-related factors Lives with someone who smokes cigarettes 39% 38% 33% 33% 32% Lives with someone who chews tobacco 9% 11% 10% 9% 9% How often see actors using tobacco? –Does not watch TV or movies 3% 3% 3% 2% 3% How often see actors using tobacco? –Never 3% 3% 3% 6% 6% How often see actors using tobacco? –Rarely 10% 10% 12% 16% 17% How often see actors using tobacco? –Sometimes 46% 47% 49% 41% 42% How often see actors using tobacco? –Most of the time 37% 36% 29% 34% 30% Smoking makes people look cool? –Yes 10% 9% 8% 8% 8% Smoking makes people look cool? –Probably 12% 12% 12% 12% 10% Smoking makes people look cool? –Probably not 19% 18% 18% 21% 20% Smoking makes people look cool? –No 58% 60% 59% 59% 61% Smoke cigarette if friend offered it? –Yes 3% 3% 3% 3% 4% Smoke cigarette if friend offered it? –Probably 6% 6% 6% 7% 8% Smoke cigarette if friend offered it? –Probably not 14% 13% 13% 14% 15% Smoke cigarette if friend offered it? –No 76% 77% 75% 70% 71% Source: NYTS data on high school students ages 14 to 18. All statistics are weighted.

!
! 39!
Table 4: OLS analysis of Changes in Current Cigarette Smoking, Coefficient/Standard Error % Current Smoking, Ages 14-18 E-cigarette control: None Sales Advertising Period of analysis: Baseline Baseline Omit 2009 Baseline Omit 2009 Low Pr(Smoker) $ %E-cig. sales (in $100m)
0.0022 0.0015 (0.0032) (0.0036)
Mid Pr(Smoker) $ %E-cig. sales (in $100m)
-0.0009 -0.0014 (0.0043) (0.0042)
High Pr(Smoker) $ %E-cig. sales (in $100m)
-0.0213** -0.0212** (0.0062) (0.0064)
Low Pr(Smoker) $ %E-cig. ads (in $1m)
0.0003 0.0004 (0.0010) (0.0009)
Mid Pr(Smoker) $ %E-cig. ads (in $1m)
-0.0004 -0.0004 (0.0011) (0.0011)
High Pr(Smoker) $ %E-cig. ads (in $1m)
-0.0054** -0.0054** (0.0017) (0.0016)
Low Pr(Smoker) $ %Cig. tax (in dollars)
0.0156 0.0214 0.0874 0.0176 0.0881 (0.0243) (0.0265) (0.0599) (0.0254) (0.0591)
Mid Pr(Smoker) $ %Cig. tax (in dollars)
0.0015 -0.0009 0.0533 -0.0015 0.0526 (0.0347) (0.0379) (0.0613) (0.0364) (0.0621)
High Pr(Smoker) $ %Cig. tax (in dollars)
0.0047 -0.0527 -0.0691 -0.0321 -0.0796 (0.0817) (0.0871) (0.1031) (0.0861) (0.1033)
Low Pr(Smoker) $ %Time trend
-0.0055* -0.0070 -0.0122* -0.0062 -0.0122* (0.0026) (0.0036) (0.0049) (0.0035) (0.0049)
Mid Pr(Smoker) $ %Time trend
-0.0094** -0.0088 -0.0130 -0.0085 -0.0130 (0.0034) (0.0052) (0.0070) (0.0048) (0.0070)
High Pr(Smoker) $ %Time trend
-0.0177* -0.0030 -0.0017 -0.0058 -0.0017 (0.0070) (0.0092) (0.0090) (0.0092) (0.0090)
Year = 2009 -0.0027 0.0002 0.0002 (0.0094) (0.0097) (0.0097)
Year = 2011 0.0030 0.0062 -0.0071 0.0056 -0.0071 (0.0082) (0.0082) (0.0085) (0.0084) (0.0085)
Year = 2012 -0.0134* -0.0057 -0.0071 -0.0044 -0.0071 (0.0067) (0.0055) (0.0054) (0.0058) (0.0054)
Constant 0.0002 -0.0026 0.0020 -0.0026 0.0020 (0.0051) (0.0052) (0.0045) (0.0053) (0.0045)
N 396 396 297 396 297 Adjusted R-square 0.037 0.064 0.146 0.060 0.146 Mean(% Current Smoking) -0.014 -0.014 -0.013 -0.014 -0.013 Notes: Analyses use 2004, 2006, 2009, 2011, and 2012 NYTS data on 14 to 18 year olds, federal cigarette tax rates (in $1 units), e-cigarette sales (in $100 million units), and e-cigarette advertising (in $1 million units). Observations are year-specific centiles of predicted propensity to be a current smoker in the absence of e-cigarettes, estimated via logistic regression analysis of current smoking in the 2006 data (see Appendix Table A1) and applying the resulting equation to later years’ data. To consider differential effects, centiles are categorized as very low (reference group), low, middle, or high propensity to smoke, based on cutoffs at the 40th, 65th, and 90th percentiles. The calculation dropped one centile, and considers changes over 5 years, yielding N=396 (4 sets of changes each for 99 groups). All controls are listed. SEs are clustered by centile. ** [*] denotes statistical significance at the 1% [5%] level.
!
! 40!
Table 5: OLS analysis of Change in Electronic Cigarette Use, Coefficients/(Standard Error) %Ever-use of Electronic Cigarettes E-cigarette control: Sales Advertising Group-specific detrending method: Group $ 2011 Group $ Time
Trend Group $ 2011 Group $ Time Trend
Low Pr(Smoker) $ %E-cigarette sales (in $100m)
0.0032 0.0020 (0.0033) (0.0042)
Mid Pr(Smoker) $ %E-cigarette sales (in $100m)
0.0205** 0.0198** (0.0037) (0.0044)
High Pr(Smoker) $ %E-cigarette sales (in $100m)
0.0326** 0.0296** (0.0051) (0.0060)
Low Pr(Smoker) $ %E-cigarette ads (in $1m)
0.0008 0.0005 (0.0008) (0.0010)
Mid Pr(Smoker) $ %E-cigarette ads (in $1m)
0.0052** 0.0050** (0.0009) (0.0011)
High Pr(Smoker) $ %E-cigarette ads (in $1m)
0.0083** 0.0074** (0.0013) (0.0015)
Low Pr(Smoker) $ Year = 2011 0.0156 0.0166 (0.0126) (0.0117)
Mid Pr(Smoker) $ Year = 2011 0.0087 0.0150 (0.0112) (0.0103)
High Pr(Smoker) $ Year = 2011 0.0397* 0.0497** (0.0191) (0.0182)
Low Pr(Smoker) $ %Time trend 0.0036 0.0037 (0.0029) (0.0026)
Mid Pr(Smoker) $ %Time trend 0.0020 0.0034 (0.0026) (0.0023)
High Pr(Smoker) $ %Time trend 0.0091* 0.0111** (0.0044) (0.0041)
Year = 2011 -0.0052 -0.0052 -0.0052 -0.0052 (0.0054) (0.0054) (0.0054) (0.0054)
Constant 0.0226** 0.0226** 0.0226** 0.0226** (0.0034) (0.0034) (0.0034) (0.0034)
N 198 198 198 198 Adjusted R-square 0.448 0.448 0.448 0.448 Mean Change in Dependent Variable
0.050 0.050 0.050 0.050
Notes: Analyses use 2004, 2006, 2009, 2011, and 2012 NYTS data on 14 to 18 year olds, along with federal cigarette tax rates (in $1 units), e-cigarette sales (in $100 million units), and e-cigarette advertising (in $1 million units). Observations are year-specific centiles of predicted propensity to be a current smoker in the absence of e-cigarettes, estimated using logistic regression analysis of current smoking in the 2006 data (see Appendix Table A1) and applying the resulting equation to later years’ data. To consider differential effects, centiles are categorized as very low (reference group), low, middle, or high propensity to smoke, based on cutoffs at the 40th, 65th, and 90th percentiles. The calculation dropped one centile, and considers changes over 5 years, yielding N=396 (4 sets of changes each for 99 groups). All controls are listed. SEs are clustered by centile. ** [*] denotes statistical significance at the 1% [5%] level.
!
! 41!
Table 6: Relationship between Changes in Cigarette Smoking and Ever-use of E-Cigarettes A. E-cigarette Sales Coefficients
I. Ages 14-18 Propensity to be a Current Smoker % Current Smoking % E-cigarette Use Ratio Low 0.0015 0.0032 0.4688 Middle -0.0014 0.0205** -0.0683 High -0.0212** 0.0326** -0.6503 II. Ages 14-17 Propensity to be a Current Smoker % Current Smoking % E-cigarette Use Ratio Low -0.0000 0.0070* 0.0000 Middle -0.0014 0.0134** -0.1045 High -0.0251* 0.0301** -0.8339
B. E-cigarette Advertising Coefficients I. Ages 14-18 Propensity to be a Current Smoker % Current Smoking % E-cigarette Use Ratio Low 0.0004 0.0008 0.5000 Middle -0.0004 0.0052** -0.0769 High -0.0054** 0.0083** -0.6506 II. Ages 14-17 Propensity to be a Current Smoker % Current Smoking % E-cigarette Use Ratio Low -0.0000 0.0018* 0.0000 Middle -0.0004 0.0034** -0.1176 High -0.0064* 0.0077** -0.8312 Note: Coefficients presented here are each propensity group’s e-cigarette sales (Section A) or advertising (Section B) interaction term, taken from the change in current smoking regressions that omit 2009 data (in Tables 4 and A2, for 14 to 18 and 14 to 17 year olds, respectively), and the change in ever-use of e-cigarettes regressions using a group-by-2011 control (in Tables 5 and A3). For each sample, propensity to be a current smoker is estimated based on the corresponding current smoker regression in Appendix Table A1. Centiles of propensity to smoke are categorized as very low (reference group), low, middle, or high propensity to be a current smoker, based on cutoffs at the 40th, 65th, and 90th percentiles. See the notes to Tables 4, 2A, 5, and 3A for more on the specific regressions. ** [*] denotes statistical significance at the 1% [5%] level.
!
! 42!
References Abadie, A., Diamond, A., & Hainmueller, J. (2010). Synthetic control methods for comparative case studies: estimating the effect of California’s tobacco control program. Journal of the American Statistical Association, 105(490): 493-505. Adkison, S.E., O’Connor, R.J., Bansal-Travers, M., et al. (2013). Electronic nicotine delivery systems: international tobacco control four-country survey. American Journal of Preventative Medicine, 44(3): 207-215. Alcohol and Tobacco Tax and Trade Bureau (4 September 2012). “Federal Excise Tax Increase and Related Provisions.” TTB.gov. Retrieved 6 April 2014 from: http://www.ttb.gov/main_pages/schip-summary.shtml Blu eCigs (26 June 2014). Blu rechargeable pack, original and premium electronic cigarette flavor cartridges. Blucigs.com. Retrieved 30 July 2014 from: https://web.archive.org/web/20140626140842/http://store.blucigs.com/flavor-cartridges. Blu Electronic Cigarette Products. (8 August 2009). Retrieved 4 April 2014 from: http:// web.archive.org/web/20090808175316/http://www.perfectelectroniccigarette.com/blu-electronic-cigarettes. Brown, J., Beard, E., Kotz, D., Michie, S., West, R. (2014). Real-world effectiveness of e-cigarettes when used to aid smoking cessation: a cross-sectional population study. Addiction: doi:10.1111/add.12623. Bureau of Labor Statistics (April 14 2014) States and selected areas: Employment status of the civilian noninstitutional population, 1976 to 2013 annual averages. Retrieved 20 May 2014 from: http://www.bls.gov/lau/rdscnp16.htm. Cahn, Z. & Siegel, M. (2011). Electronic cigarettes as a harm reduction strategy for tobacco control: a step forward or a repeat of past mistakes? Journal of Public Health Policy, 32(1): 16-32. Camenga, D.R., Delmerico, J., Kong, G., Cavallo, D., Hyland, A., Cummings, K.M., & Krishna- Sarin, S. (2014). Trends in use of electronic nicotine delivery systems by adolescents. Addictive Behaviors, 39: 338-340. Caponnetto, P., Campagna, D. Cibella, F., Morjaria, J.B., Caruso, M., Russo, C., & Polosa, R. (2013). Efficiency and safety of an electronic cigarette (eclat) as tobacco cigarettes substitute: A prospective 12-month randomized control design study. PLOS ONE, 8(6): e66317. Carr, T. (Ed.) (2011). State Legislated Actions on Tobacco Issues 2010. New York, NY: American Lung Association. Retrieved 11 August 11, 2014 from: http://www.lungusa2.org/slati/reports/SLATI_2010_Final_Web.pdf.

!
! 43!
Chen, C. (6 March 2014). Teenage e-cigarette use likely gateway to smoking. Bloomberg. Retrieved 28 July 2014 from: http://www.bloomberg.com/news/2014-03-06/teenage-e-cigarette-use-likely-gateway-to-smoking.html. CDC (2014). State Tobacco Activities Tracking and Evaluation (STATE) System. Retrieved 8 May 2014 from: http://apps.nccd.cdc.gov/statesystem/TrendReport/ TrendReports.aspx. Craver, R. (29 July 2012). “Reynolds developing new smokeless products” Winston Salem Journal. Retrieved 6 April 2014 from: http:/m.journalnow.com/business/Reynolds-developing-new-smokeless-products/article_cf223198-c21f-5b4e-8e7b-c5fb6190dcad.html?mode=jqm. Cutler, D. & Friedman, A. (2014). Explaining the education gradient in smoking: The impact of advertising and information on smoking behaviors. In Progress. Dutra, L.M., & Glantz, S.A. (2014). Electronic cigarettes and conventional cigarette use among US adolescents: A cross-sectional study. JAMA Pediatrics, Article in Press, Published online 6 March 2014. doi:10.1001/jamapediatrics.2013.5488 Duke, J.C., Lee, Y.O., Kim, A.E., Watson, K.A., Arnold, K.Y., Nonnemaker, J.M., & Porter, L. (2014). Exposure to electronic cigarette television advertisements among youth and young adults. Pediatrics, 134: e29-e36. Elliott, D. (2014).!E-Cigarette critics worry new ads will make 'vaping' cool for kids. NPR. Retrieved 20 April 2014 from: http://www.npr.org/2014/03/03/284006424/e-cigarette-critics-worry-new-ads-will-make-vaping-cool-for-kids. Elliott, S. (29 August 2013). E-cigarette makers’ ads echo tobacco’s heyday. The New York Times. Etter, J.F. (2010). Electronic cigarettes: a survey of users. BMC Public Health, 10: 231-. Etter, J.F. & Bullen, C. (2011). Electronic cigarette: users profile, utilization, satisfaction and perceived efficacy. Addiction, 106(11): 2017–2028. Fairchild, A.L., Bayer, R., and Colgrove, J. (2014). The renormalization of smoking? E-cigarettes and the tobacco “endgame.” New England Journal of Medicine, 370: 293-295. FDA (22 July 2009). “Summary of Results: Laboratory Analysis of Electronic Cigarettes Conducted By FDA.” U.S. Food and Drug Administration, Retrieved 4 April 2014 from: http://www.fda.gov/newsevents/publichealthfocus/ucm173146.htm. Fernandez, E. (6 March 2014). E-cigarettes: gateway to nicotine addiction for U.S. teens, says UCSF study. UCSF.edu. Retrieved 28 July 2014 from: http://www.ucsf.edu/news/2014/03/ 112316/e-cigarettes-gateway-nicotine-addiction-us-teens-says-ucsf-study. GASP (11 March 2014). “Electronic Smoking Devices.” Global Advisors on Smokefree Policy.
!
! 44!
Retrieved 3 April 2014 from: http://www.njgasp.org/E-Cigs_White_Paper.pdf. Gostin, L.O., & Glasner, A.Y. (2014). E-cigarettes, vaping, and youth. JAMA: doi:10.1001/jama.2014.7883. Grana, R.A., Benowitz, N., & Glantz, S.A. (2014) E-cigarettes: A scientific review. Circulation, 129: 1972-1986. Grana, R.A., Popova, L., & Ling, P.M. (2014) A longitudinal analysis of electronic cigarette use and smoking cessation. JAMA Internal Medicine: doi:10.1001/jamainternmed.2014.187. Gruber, J., & Zinman, J. (2001). Youth smoking in the United States: Evidence and implications In Gruber, J. (Ed.), Risky behavior among youths: An economic analysis. (pp. 69-120) Chicago, IL: The University of Chicago Press. Herzog, B. & Gerberi, J. (2013). E-Cigs revolutionizing the tobacco industry. Wells Fargo Securities, LLC. Retrieved 27 April 2014 from: http://www.smallcapfinancialwire.com/wp-content/uploads/2013/11/E-Cigs-Revolutionizing-the-Tobacco-Industry-Interactive-Model.pdf Huang, J., Tauras, J., & Chaloupka, F.J. (2014). The impact of price and tobacco control policies on the demand for electronic nicotine delivery systems. Tobacco Control, 23: iii41-iii47. Kenkel, D., Mathios, A.D., & Pacula, R.L. (2001). Economics of youth drug use, addiction and gateway effects. Addiction, 96: 151-164. Kim, K.Y., Arnold, A.E., & Makarenko, O. (2014) E-cigarette advertising expenditures in the U.S., 2011–2012. American Journal of Preventive Medicine, 46(4): 409–412. King, B.A., Alam, S., Promoff, G., Arrazola, R., & Dube, S.R. (2013). Awareness and ever use of electronic cigarettes among U.S. adults, 2010–2011, Nicotine & Tobacco Research, 15(9): 1623-1627. Kopf, J. (29 November 2013). E-cigarette rules on the back burner: Still no guidance from the FDA, as more of us take up the habit. Consumer Reports. Retrieved 2 April 2012 from: http://www.consumerreports.org/cro/news/2013/11/why-are-electronic-cigarette-regulations-taking-so-long/index.htm. Kosmider, L., Sobczak, A., Fik, M., Knysak, J., Zaciera, M., Kurek, J., and Goniewicz, M.L. (2014). Carbonyl compounds in electronic cigarette vapors—Effects of nicotine solvent and battery output voltage. Nicotine and Tobacco Research. doi: 10.1093/ntr/ntu078 Legal Resource Center for Public Health Policy. (July 2014) “Laws restricting electronic smoking device sales to minors.” www.law.umaryland.edu. Retrieved 11 August 2014 from: http://www.law.umaryland.edu/programs/publichealth/documents/LRC_ESD_Legislation.pdf. Lee, S., Grana, R.A., & Glantz, S.A. (2013). Electronic cigarette use among Korean adolescents:

!
! 45!
A cross-sectional study of market penetration, dual use, and relationship to quit attempts and former smoking. Journal of Adolescent Health, Article in Press, Published online 25 November 2013. doi: 10.1016/j.jadohealth.2013.11.003 Lillard, D.R., Molloy, E., & Sfekas, A. (2013). Smoking initiation and the iron law of demand. Journal of Health Economics, 32(1):114–127. Lorillard (2013). Lorillard 2012 Annual Report. Retrieved 4 April 2014 from: http://www. lorillard.com/wp-content/uploads/2013/04/Lorillard_AnnualReport_2012.pdf. Marynak, K., Holmes, C.B., King, B.A., Promoff, G., Bunnell, R., & McAfee, T. (2014). State laws prohibiting sales to minors and indoor use of electronic nicotine delivery systems — United States, November 2014. CDC Morbidity and Mortality Weekly Report, 63(49): 1145 – 1150. Monitoring the Future (Dec. 19, 2013). “2013 Data from in-school surveys of 8th-, 10th-, and 12th-grade students.” MTF Data Tables and Figures. Retrieved 30 April 2014 from: http://www.monitoringthefuture.org/data/13data.html. NJOY (31 July 2014). NJOY Electronic Cigarette Cartridges Refills from NJOY. NJOY.com. Retrieved 31 July 2014 from: https://www.njoy.com/electronic-cigarette/rechargeables/cartridge-refills-traditional Orzechowski and Walker (2012). The tax burden on tobacco: Historical compilation (Volume 47). Retrieved 2 April 2014 from: <http://www.taxadmin.org/fta/ tobacco/papers/tax_burden_2012.pdf>. Pepper, J.K., & Brewer, N.T. (2013). Electronic nicotine delivery system (electronic cigarette) awareness, use, reactions and beliefs: a systematic review. Tobacco Control, Published Online First: 23 Nov. 2013. doi:10.1136/ tobaccocontrol-2013- 051122. Pisinger, C. & Døssing, M. (2014). A systematic review of health effects of electronic cigarettes. Preventative Medicine, 69: 248-260. Pokhrel, P., Fagan, P., Little, M.A., Kawamoto, C.T., & Herzog, T.A. (2013). Smokers who try e-cigarettes to quit smoking: Findings from a multiethnic study in Hawaii. American Journal of Public Health, 103(9): e57-e62. Polosa, R., Rodu, B., Caponnetto, P., Maglia, M., & Raciti, C. (2013). A fresh look at tobacco harm reduction: the case for the electronic cigarette. Harm Reduction Journal, 10: 19. doi:10.1186/1477-7517-10-19. R.J. Reynolds (1977). “Salem Brand Review: 20-Year Marketing History.” Retrieved 1 September 2012 from Legacy Tobacco Documents Library: <http://legacy.library.ucsf.edu /tid/nil68d00/pdf>.

!
! 46!
Richardson, A., Ganz, O., Stalgaitis, C., Abrams, D., & Vallone, D. (2014). Noncombustible tobacco product advertising: how companies are selling the new face of tobacco. Nicotine and Tobacco Research, 16: 606–14. Richardson, A., Ganz, O., & Vallone, D. (2014). Tobacco on the web: surveillance and characterisation of online tobacco and e-cigarette advertising. Tobacco Control. doi: 10.1136/tobaccocontrol-2013-051246 Riker, C.A., Lee, K, Darville, A., & Hahn, E.J. (2012). E-Cigarettes: Promise or Peril? Nursing !Clinics of North America, 47(1): 159–171. Ruhm, C.J. (2005). Healthy living in hard times. Journal of Health Economics, 24(2): 341-363. Schroeder, M.J., & Hoffman, A.C. (2014). Electronic cigarettes and nicotine clinical pharmacology. Tobacco Control, 23: ii30-ii35. Statistic Brain Research Institute (21 January 2013). Electronic Cigarette Statistics. Retrieved 26 March 2014 from: http://www.statisticbrain.com/electronic-cigarette-statistics/. Strauss, K. (24 October 2012). Why electronic cigarettes are about to explode. Forbes. Retrieved 31 March 2014 from: http://www.forbes.com/sites/karstenstrauss/2012/10/24/why-electronic-cigarettes-about-to-explode/. Sutfin, E.L., McCoy, T.P., Morrell, H.E.R., Hoeppner, B.B., & Wolfson, M. (2013). Electronic cigarette use by college students. Drug and Alcohol Dependence, 131: 214– 221. Time for e-cigarette regulation. [Editorial] October, 2013. Lancet Oncology, 14: 1027. U.S. Census Bureau (2014). “Table H-8A. Median Income of Households by State - Two-Year Moving Averages: 1984 to 2012” Retrieved 2 June 2014 from: https://www.census.gov/hhes/www/income/data/historical/household/2012/H08A_2012.xls. V2 (31 July 2014). V2 Flavor Cartridges (5-Pack) - EX Series. V2cigs.com. Retrieved 31 July 3 2014 from: http://www.v2cigs.com/products/v2-flavor-cartridges-5-pack-ex-series.
!
! 47!
Appendix Figure A1: Current Smoker Rates By Age
Age 18
Age 17
Age 16
Age 15
Age 14
Age 13
Age 120.0
5.1
.15
.2
Prop
ortio
n C
urre
nt-S
mok
er
2004 2006 2008 2010 2012Year
Note: A current smoker has smoked 100-plus cigarettes in their life and smoked in the past month.
Age-Specific Current Smoker Rates By Year
Source: National Youth Tobacco Survey data from 2004, 2006, 2009, 2011, and 2012, weighted. Figure A2: Trends in Smoking among 10th Grade Students
!"
#"
$"
%"
&"
'!"
'#"
'$"
'%"
'&"
#!"
#!!#" #!!(" #!!$" #!!)" #!!%" #!!*" #!!&" #!!+" #!'!" #!''" #!'#" #!'("
!"#$"%
&'()*+
",'-%'!./&'0
1'2.
3/'
4".#'
01'2.3'!#"5.6"%$"'*%'()*+-%7'.)*%7'81&9':#.,"'(&;,"%&/'
Source: Monitoring the Future (2013)
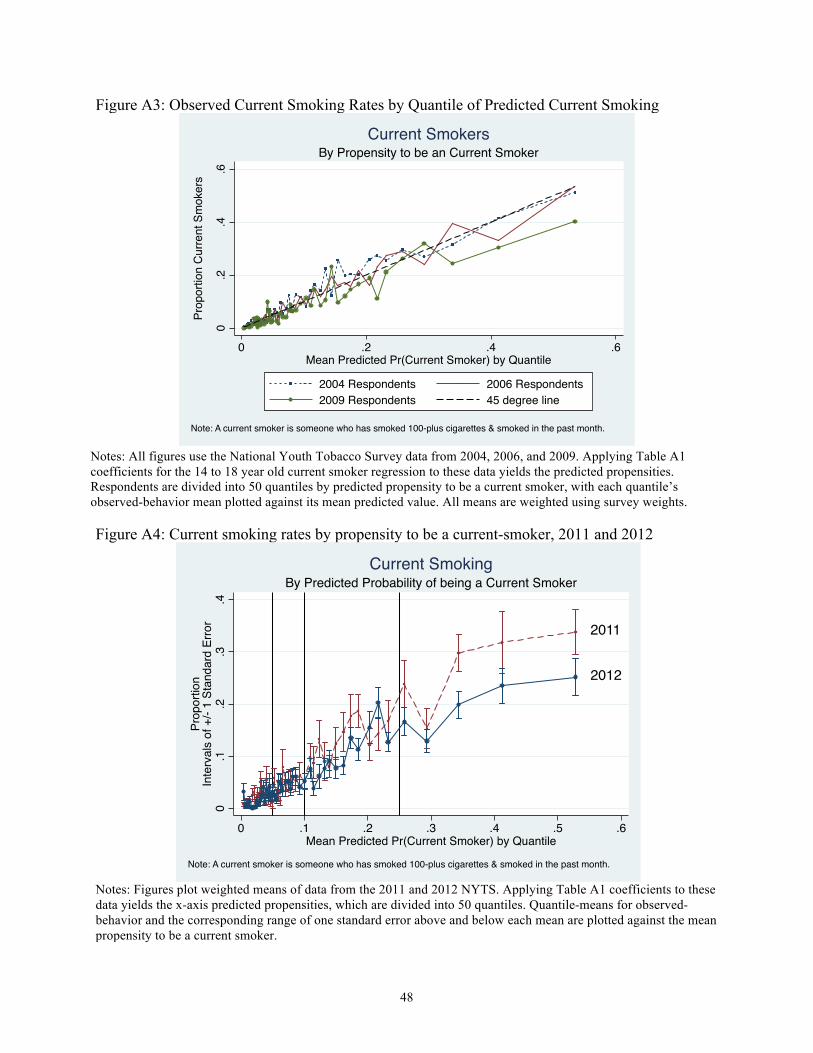
!
! 48!
Figure A3: Observed Current Smoking Rates by Quantile of Predicted Current Smoking
0.2
.4.6
Prop
ortio
n C
urre
nt S
mok
ers
0 .2 .4 .6Mean Predicted Pr(Current Smoker) by Quantile
2004 Respondents 2006 Respondents2009 Respondents 45 degree line
Note: A current smoker is someone who has smoked 100-plus cigarettes & smoked in the past month.
By Propensity to be an Current SmokerCurrent Smokers
Notes: All figures use the National Youth Tobacco Survey data from 2004, 2006, and 2009. Applying Table A1 coefficients for the 14 to 18 year old current smoker regression to these data yields the predicted propensities. Respondents are divided into 50 quantiles by predicted propensity to be a current smoker, with each quantile’s observed-behavior mean plotted against its mean predicted value. All means are weighted using survey weights. Figure A4: Current smoking rates by propensity to be a current-smoker, 2011 and 2012
2011
2012
0.1
.2.3
.4
Prop
ortio
nIn
terv
als
of +
/- 1
Stan
dard
Erro
r
0 .1 .2 .3 .4 .5 .6Mean Predicted Pr(Current Smoker) by Quantile
Note: A current smoker is someone who has smoked 100-plus cigarettes & smoked in the past month.
By Predicted Probability of being a Current SmokerCurrent Smoking
Notes: Figures plot weighted means of data from the 2011 and 2012 NYTS. Applying Table A1 coefficients to these data yields the x-axis predicted propensities, which are divided into 50 quantiles. Quantile-means for observed-behavior and the corresponding range of one standard error above and below each mean are plotted against the mean propensity to be a current smoker.

!
! 49!
Figure A5: Current Smoker Rates By Birth Cohort
b. 1990/91
b. 1992/93 b. 1994/95 b. 1996/97
0.0
5.1
.15
Prop
ortio
n C
urre
nt-S
mok
er
2004 2006 2008 2010 2012Year
Note: A current smoker has smoked 100-plus cigarettes in their life and smoked in the past month.
Cohort-Specific Current Smoker Rates By Year
Source: National Youth Tobacco Survey data from 2004, 2006, 2009, 2011, and 2012, weighted.
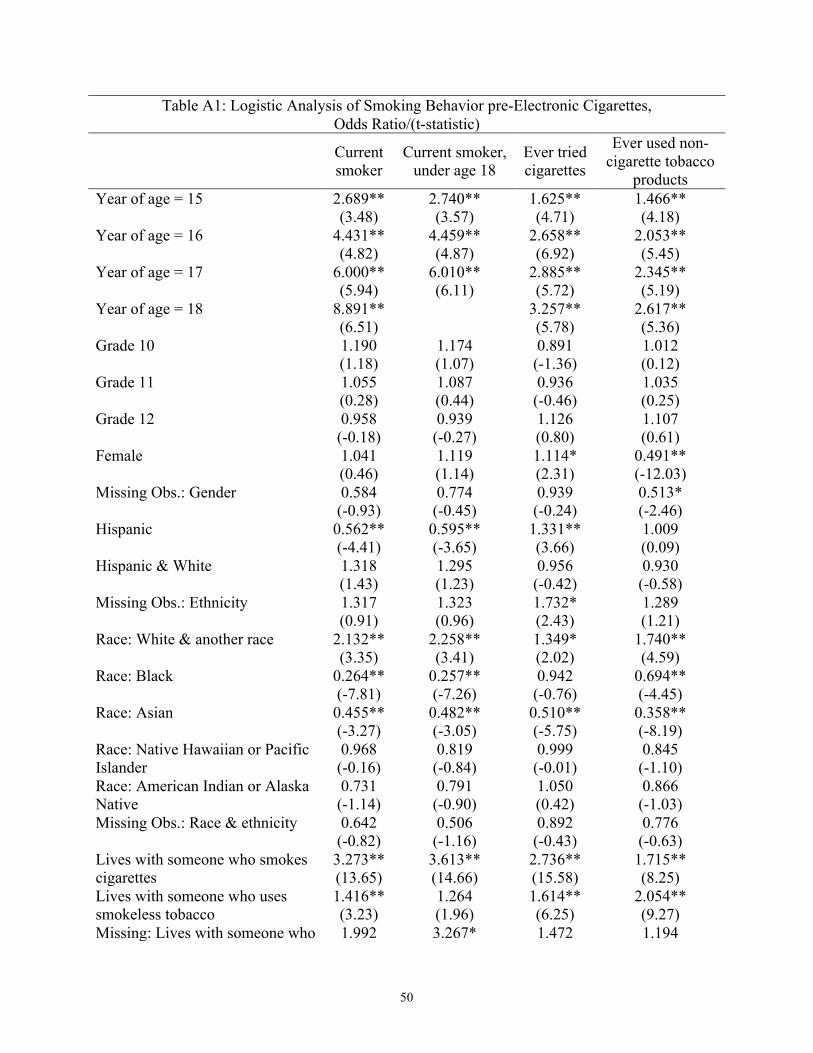
!
! 50!
Table A1: Logistic Analysis of Smoking Behavior pre-Electronic Cigarettes, Odds Ratio/(t-statistic)
Current smoker
Current smoker, under age 18
Ever tried cigarettes
Ever used non-cigarette tobacco
products Year of age = 15 2.689** 2.740** 1.625** 1.466**
(3.48) (3.57) (4.71) (4.18) Year of age = 16 4.431** 4.459** 2.658** 2.053**
(4.82) (4.87) (6.92) (5.45) Year of age = 17 6.000** 6.010** 2.885** 2.345**
(5.94) (6.11) (5.72) (5.19) Year of age = 18 8.891** 3.257** 2.617**
(6.51) (5.78) (5.36) Grade 10 1.190 1.174 0.891 1.012
(1.18) (1.07) (-1.36) (0.12) Grade 11 1.055 1.087 0.936 1.035
(0.28) (0.44) (-0.46) (0.25) Grade 12 0.958 0.939 1.126 1.107
(-0.18) (-0.27) (0.80) (0.61) Female 1.041 1.119 1.114* 0.491**
(0.46) (1.14) (2.31) (-12.03) Missing Obs.: Gender 0.584 0.774 0.939 0.513*
(-0.93) (-0.45) (-0.24) (-2.46) Hispanic 0.562** 0.595** 1.331** 1.009
(-4.41) (-3.65) (3.66) (0.09) Hispanic & White 1.318 1.295 0.956 0.930
(1.43) (1.23) (-0.42) (-0.58) Missing Obs.: Ethnicity 1.317 1.323 1.732* 1.289
(0.91) (0.96) (2.43) (1.21) Race: White & another race 2.132** 2.258** 1.349* 1.740**
(3.35) (3.41) (2.02) (4.59) Race: Black 0.264** 0.257** 0.942 0.694**
(-7.81) (-7.26) (-0.76) (-4.45) Race: Asian 0.455** 0.482** 0.510** 0.358**
(-3.27) (-3.05) (-5.75) (-8.19) Race: Native Hawaiian or Pacific Islander
0.968 0.819 0.999 0.845 (-0.16) (-0.84) (-0.01) (-1.10)
Race: American Indian or Alaska Native
0.731 0.791 1.050 0.866 (-1.14) (-0.90) (0.42) (-1.03)
Missing Obs.: Race & ethnicity 0.642 0.506 0.892 0.776 (-0.82) (-1.16) (-0.43) (-0.63)
Lives with someone who smokes cigarettes
3.273** 3.613** 2.736** 1.715** (13.65) (14.66) (15.58) (8.25)
Lives with someone who uses smokeless tobacco
1.416** 1.264 1.614** 2.054** (3.23) (1.96) (6.25) (9.27)
Missing: Lives with someone who 1.992 3.267* 1.472 1.194

!
! 51!
smokes cigarettes (1.39) (2.52) (1.15) (0.60) Missing: Lives with someone who uses smokeless tobacco
1.722 1.494 1.021 1.358 (1.07) (0.73) (0.06) (0.63)
How often see actors using tobacco: Missing
1.218 1.526 1.815* 1.655 (0.47) (1.00) (2.06) (1.66)
How often see actors using tobacco: Do not watch TV/movies
1.470 1.246 1.500* 1.809* (1.09) (0.63) (2.06) (2.28)
How often see actors using tobacco: Rarely
0.658 0.572 0.889 0.904 (-1.45) (-1.87) (-1.00) (-0.56)
How often see actors using tobacco: Sometimes
0.854 0.753 1.120 1.355 (-0.55) (-0.93) (0.88) (1.71)
How often see actors using tobacco: Most of the time
1.273 1.106 1.704** 1.900** (0.95) (0.36) (4.53) (3.61)
Smoking makes people look cool/fit in? - Missing
2.600** 1.539 3.066** 2.365** (2.73) (1.02) (3.94) (3.16)
Smoking make people look cool/fit in? - Definitely yes
4.044** 3.875** 4.653** 4.882** (7.27) (6.39) (10.69) (9.92)
Smoking make people look cool/fit in? - Probably yes
2.573** 2.450** 3.544** 2.905** (5.99) (6.03) (14.08) (11.42)
Smoking make people look cool/fit in? - Probably not
3.260** 2.976** 3.663** 2.972** (11.90) (10.61) (13.52) (11.74)
Constant 0.011** 0.012** 0.148** 0.170** (-12.06) (-11.63) (-12.73) (-9.38)
N 13332 11778 13203 13092 Pseudo R-square 0.1527 0.1470 0.1289 0.1216 Mean(Dependent Variable) 0.088 0.079 0.477 0.344 Notes: Regressions use survey-weighted 2006 National Youth Tobacco Survey data on high school students aged 14 to 18, unless otherwise noted. “Non-cigarette tobacco products” refer to chewing tobacco, snuff, dip, cigars, pipes, bidis, and kreteks. All controls are listed. Standard errors are clustered by the data’s primary sampling unit. **[*] denote statistical significance at the 1%[5%] level.
!
! 52!
Table A2: OLS analysis of Changes in Current Cigarette Smoking, Coefficient/Standard Error !Current Smoking, Ages 14-17 E-cigarette control: None Sales Advertising Period of analysis: Baseline Baseline Omit 2009 Baseline Omit 2009 Low Pr(Smoker) " !E-cig. sales (in $100m)
-0.0003 -0.0000 (0.0022) (0.0024)
Mid Pr(Smoker) " !E-cig. sales (in $100m)
-0.0013 -0.0014 (0.0041) (0.0043)
High Pr(Smoker) " !E-cig. sales (in $100m)
-0.0240* -0.0251* (0.0110) (0.0112)
Low Pr(Smoker) " !E-cig. ads (in $1m)
0.0000 -0.0000 (0.0006) (0.0006)
Mid Pr(Smoker) " !E-cig. ads (in $1m)
-0.0004 -0.0004 (0.0011) (0.0011)
High Pr(Smoker) " !E-cig. ads (in $1m)
-0.0065* -0.0064* (0.0029) (0.0029)
Low Pr(Smoker) " !Cig. tax (in dollars)
0.0207 0.0199 -0.0060 0.0209 -0.0061 (0.0291) (0.0325) (0.0366) (0.0316) (0.0368)
Mid Pr(Smoker) " !Cig. tax (in dollars)
0.0429 0.0395 0.0517 0.0404 0.0510 (0.0329) (0.0379) (0.0650) (0.0364) (0.0650)
High Pr(Smoker) " !Cig. tax (in dollars)
-0.1069 -0.1713* -0.0532 -0.1518* -0.0656 (0.0572) (0.0723) (0.0981) (0.0667) (0.0998)
Low Pr(Smoker) " !Time trend
-0.0039 -0.0037 -0.0017 -0.0040 -0.0017 (0.0029) (0.0039) (0.0039) (0.0038) (0.0039)
Mid Pr(Smoker) " !Time trend
-0.0114** -0.0105 -0.0114 -0.0105* -0.0114 (0.0034) (0.0054) (0.0064) (0.0052) (0.0064)
High Pr(Smoker) " !Time trend
-0.0043 0.0121 0.0029 0.0102 0.0029 (0.0065) (0.0118) (0.0127) (0.0108) (0.0127)
Year = 2009 -0.0054 -0.0012 -0.0018 (0.0079) (0.0081) (0.0082)
Year = 2011 0.0059 0.0107 0.0027 0.0092 0.0027 (0.0078) (0.0079) (0.0070) (0.0080) (0.0070)
Year = 2012 -0.0162* -0.0048 -0.0052 -0.0047 -0.0052 (0.0070) (0.0058) (0.0054) (0.0063) (0.0054)
Constant 0.0009 -0.0033 -0.0018 -0.0027 -0.0018 (0.0046) (0.0047) (0.0037) (0.0048) (0.0037)
N 396 396 297 396 297 Adjusted R-square 0.068 0.100 0.118 0.106 0.118 Mean (!Current Smoking) -0.011 -0.011 -0.010 -0.011 -0.010 Notes: Analyses use 2004, 2006, 2009, 2011, and 2012 NYTS data on 14 to 17 year olds, federal cigarette tax rates (in $1 units), e-cigarette sales (in $100 million units), and e-cigarette advertising (in $1 million units). Observations are year-specific centiles of predicted propensity to be a current smoker in the absence of e-cigarettes, estimated via logistic regression analysis of current smoking in the 2006 data (see Appendix Table A1) and applying the resulting equation to later years’ data. To consider differential effects, centiles are categorized as very low (reference group), low, middle, or high propensity to smoke, based on cutoffs at the 40th, 65th, and 90th percentiles. The calculation dropped one centile, and considers changes over 5 years, yielding N=396 (4 sets of changes each for 99 groups). All controls are listed. SEs are clustered by centile. ** [*] denotes statistical significance at the 1% [5%] level.
!
! 53!
Table A3: OLS analysis of Change in Electronic Cigarette Use, Coefficients/(Standard Error) !Ever-use of Electronic Cigarettes E-cigarette control: Sales Advertising Group-specific detrending method: Group " 2011 Group " Time
Trend Group " 2011 Group " Time Trend
Low Pr(Smoker) " !E-cigarette sales (in $100m)
0.0070* 0.0068 (0.0029) (0.0035)
Mid Pr(Smoker) " !E-cigarette sales (in $100m)
0.0134** 0.0117* (0.0039) (0.0048)
High Pr(Smoker) " !E-cigarette sales (in $100m)
0.0301** 0.0270** (0.0047) (0.0061)
Low Pr(Smoker) " !E-cigarette ads (in $1m)
0.0018* 0.0017 (0.0008) (0.0009)
Mid Pr(Smoker) " !E-cigarette ads (in $1m)
0.0034** 0.0029* (0.0010) (0.0012)
High Pr(Smoker) " !E-cigarette ads (in $1m)
0.0077** 0.0067** (0.0012) (0.0015)
Low Pr(Smoker) " Year = 2011 0.0022 0.0043 (0.0090) (0.0082)
Mid Pr(Smoker) " Year = 2011 0.0225 0.0266* (0.0136) (0.0126)
High Pr(Smoker) " Year = 2011 0.0422 0.0515* (0.0261) (0.0252)
Low Pr(Smoker) " !Time trend 0.0005 0.0010 (0.0021) (0.0018)
Mid Pr(Smoker) " !Time trend 0.0052 0.0060* (0.0031) (0.0028)
High Pr(Smoker) " !Time trend 0.0097 0.0115* (0.0060) (0.0056)
Year = 2011 -0.0074 -0.0074 -0.0074 -0.0074 (0.0067) (0.0067) (0.0067) (0.0067)
Constant 0.0216** 0.0216** 0.0216** 0.0216** (0.0050) (0.0050) (0.0050) (0.0050)
N 198 198 198 198 Adjusted R-square 0.380 0.380 0.380 0.380 Mean(! Dependent Variable) 0.045 0.045 0.045 0.045 Notes: Analyses use 2004, 2006, 2009, 2011, and 2012 NYTS data on 14 to 17 year olds, along with federal cigarette tax rates (in $1 units), e-cigarette sales (in $100 million units), and e-cigarette advertising (in $1 million units). Observations are year-specific centiles of predicted propensity to be a current smoker in the absence of e-cigarettes, estimated using logistic regression analysis of current smoking in the 2006 data (see Appendix Table A1) and applying the resulting equation to later years’ data. To consider differential effects, centiles are categorized as very low (reference group), low, middle, or high propensity to smoke, based on cutoffs at the 40th, 65th, and 90th percentiles. The calculation dropped one centile, and considers changes over 5 years, yielding N=396 (4 sets of changes each for 99 groups). All controls are listed. SEs are clustered by centile. ** [*] denotes statistical significance at the 1% [5%] level.

!
! 54!
Data Appendix
State Bans That Went into Effect by January 1, 2014
States that Banned E-cigarette Sales to Minors, Effective by January 1, 2014 Went into effect by
January 1, 2011 Went into effect between January
2, 2011 & January 1, 2013 Went into effect between January 2,
2013 & January 1, 2014 California Alaska Alabama Minnesota Colorado Arizona
New Hampshire Idaho Arkansas New Jersey Kansas Connecticut
Utah Maryland Delaware New York Florida Tennessee Georgia Wisconsin Hawaii Illinois Indiana Iowa Kentucky Louisiana Mississippi Missouri Nebraska Nevada North Carolina Ohio Oklahoma Rhode Island South Carolina South Dakota Vermont Virginia Washington West Virginia Wyoming
Source: Marynak, K., Holmes, C.B., King, B.A., Promoff, G., Bunnell, R., & McAfee, T. (2014). State laws prohibiting sales to minors and indoor use of electronic nicotine delivery systems — United States, November 2014. CDC Morbidity and Mortality Weekly Report, 63(49): 1145 – 1150.

!
! 55!
Synthetic Control Analysis Weights
Weights for Synthetic Control Analysis State Treatment States
(Ban in effect by January 1, 2013) Synthetic Control Weights
Alabama 0 .0164615 Alaska 1 1 Arizona 0 0 Arkansas 0 .0242308 California 1 1 Colorado 1 1 Connecticut 0 .1169231 Delaware 0 .0505385 District of Columbia 0 .1681539 Florida 0 .0362308 Georgia 0 .0032308 Hawaii 0 .1023846 Idaho 1 1 Illinois 0 .0462308 Indiana 0 .0000769 Iowa 0 .0077692 Kansas 1 1 Kentucky 0 .0183077 Louisiana 0 0 Maine 0 .0123077 Maryland 1 1 Massachusetts 0 .0449231 Michigan 0 .0168462 Minnesota 1 1 Mississippi 0 .0341538 Missouri 0 .0216154 Montana 0 0 Nebraska 0 .0128462 Nevada 0 .0253846 New Hampshire 1 1 New Jersey 1 1 New Mexico 0 .0144615 New York 1 1 North Carolina 0 0 North Dakota 0 0 Ohio 0 .0338462 Oklahoma 0 .0114615 Oregon 0 .0193077 Pennsylvania 0 .0001538 Rhode Island 0 .0110769 South Carolina 0 .0196154
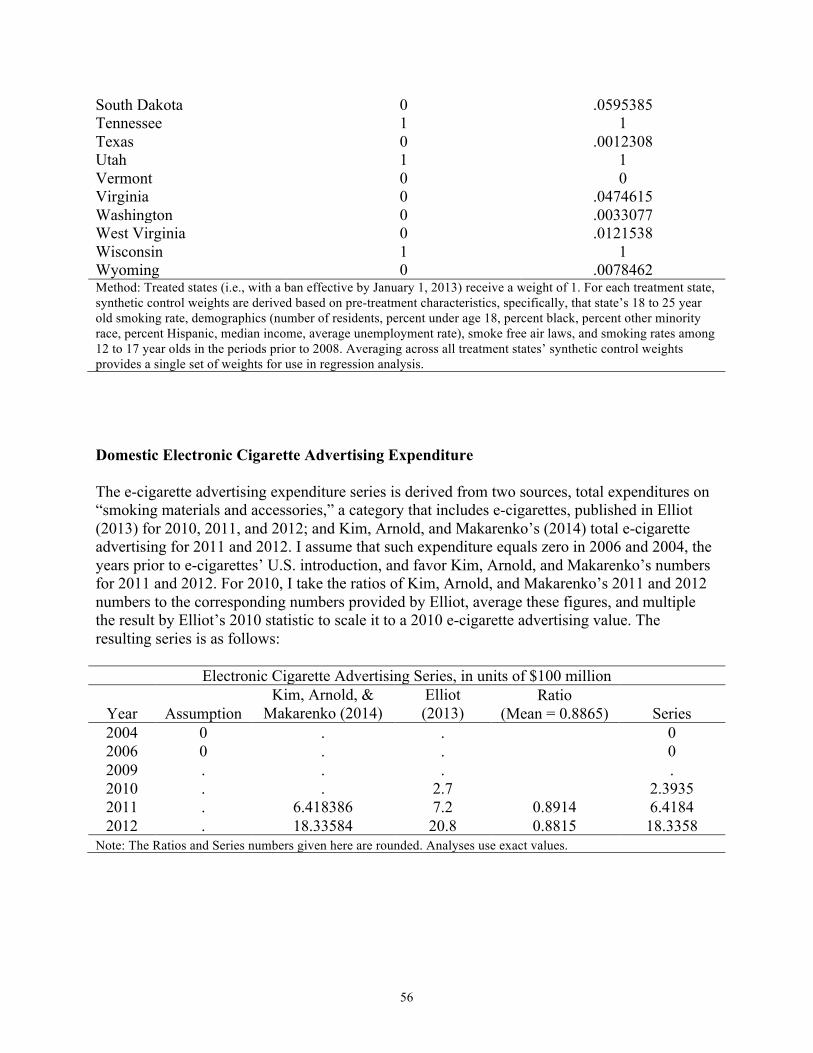
!
! 56!
South Dakota 0 .0595385 Tennessee 1 1 Texas 0 .0012308 Utah 1 1 Vermont 0 0 Virginia 0 .0474615 Washington 0 .0033077 West Virginia 0 .0121538 Wisconsin 1 1 Wyoming 0 .0078462 Method: Treated states (i.e., with a ban effective by January 1, 2013) receive a weight of 1. For each treatment state, synthetic control weights are derived based on pre-treatment characteristics, specifically, that state’s 18 to 25 year old smoking rate, demographics (number of residents, percent under age 18, percent black, percent other minority race, percent Hispanic, median income, average unemployment rate), smoke free air laws, and smoking rates among 12 to 17 year olds in the periods prior to 2008. Averaging across all treatment states’ synthetic control weights provides a single set of weights for use in regression analysis.
Domestic Electronic Cigarette Advertising Expenditure
The e-cigarette advertising expenditure series is derived from two sources, total expenditures on “smoking materials and accessories,” a category that includes e-cigarettes, published in Elliot (2013) for 2010, 2011, and 2012; and Kim, Arnold, and Makarenko’s (2014) total e-cigarette advertising for 2011 and 2012. I assume that such expenditure equals zero in 2006 and 2004, the years prior to e-cigarettes’ U.S. introduction, and favor Kim, Arnold, and Makarenko’s numbers for 2011 and 2012. For 2010, I take the ratios of Kim, Arnold, and Makarenko’s 2011 and 2012 numbers to the corresponding numbers provided by Elliot, average these figures, and multiple the result by Elliot’s 2010 statistic to scale it to a 2010 e-cigarette advertising value. The resulting series is as follows:
Electronic Cigarette Advertising Series, in units of $100 million
Year Assumption Kim, Arnold, &
Makarenko (2014) Elliot (2013)
Ratio (Mean = 0.8865) Series
2004 0 . . 0 2006 0 . . 0 2009 . . . . 2010 . . 2.7 2.3935 2011 . 6.418386 7.2 0.8914 6.4184 2012 . 18.33584 20.8 0.8815 18.3358
Note: The Ratios and Series numbers given here are rounded. Analyses use exact values.


![Stop smoking - resourcesorg.co.uk1] 2013.pdf · cigarettes. Smoking roll-up cigarettes can result in the same health risks as smoking commercially produced cigarettes -including cancer,](https://static.fdocuments.in/doc/165x107/5f18f7ea0c21316ebb29030a/stop-smoking-1-2013pdf-cigarettes-smoking-roll-up-cigarettes-can-result-in.jpg)