How Do Diversity of Opinion and Information Asymmetry ... · How Do Diversity of Opinion and...
32
How Do Diversity of Opinion and Information Asymmetry Affect Acquirer Returns? Sara B. Moeller University of Pittsburgh Frederik P. Schlingemann University of Pittsburgh Ren´ e M. Stulz The Ohio State University, NBER, and ECGI We examine the theoretical predictions that link acquirer returns to diversity of opinion and information asymmetry. Theory suggests that acquirer abnormal returns should be negatively related to information asymmetry and diversity-of-opinion proxies for equity offers but not cash offers. We find that this is the case and that, more strikingly, there is no difference in abnormal returns between cash offers for public firms, equity offers for public firms, and equity offers for private firms after controlling for one of these proxies, idiosyncratic volatility. (JEL G31, G32, G34) This article examines whether variables suggested by diversity-of-opinion models and information asymmetry models are helpful in understanding the cross-sectional variation in acquirer announcement returns using a sample of pure equity offers and pure cash offers for public and private firms from 1980 to 2002. We document that these variables, the uncertainty proxies, explain a significant fraction of the cross-sectional variation in acquirer announcement returns. Perhaps most strikingly, after controlling for the uncertainty proxies, there is no difference in abnormal returns between cash offers for public firms, equity offers for public firms, and equity offers for private firms. Using two proxies for diversity of opinion employed previously in the literature, the standard deviation of analyst forecasts and breadth of ownership, we show that bidder abnormal returns for acquisitions of We are grateful to I/B/E/S International Inc. and First Call for providing the analyst forecasts data. We thank the seminar participants at the Ohio State University, Princeton University, Texas Tech University, University of Kentucky, University of North Carolina, University of South Carolina, University of Texas-Arlington, University of Utrecht, University of Wisconsin-Milwaukee, Wake Forest University, an anonymous referee, Patrick Bolton, Eugene Fama, Bing Han, Harrison Hong, Kose John, Andrew Karolyi, Robert McDonald, Carrie Pan, Ailsa Roell, Greg Sommers, J´ erˆ ome Taillard, Wei Xiong, and Chad Zutter for helpful comments and suggestions. Tom Boulton and Carrie Pan provided valuable research assistance. Part of this research was conducted while Moeller was at Wake Forest University. Address correspondence to Ren´ e M. Stulz, The Ohio State University, Fisher School of Business, Columbus, OH 43210, or e-mail: [email protected]. © The Author 2007. Published by Oxford University Press on behalf of The Society for Financial Studies. All rights reserved. For Permissions, please email: [email protected]. doi:10.1093/rfs/hhm040 RFS Advance Access published September 21, 2007
-
Upload
nguyenlien -
Category
Documents
-
view
216 -
download
0
Transcript of How Do Diversity of Opinion and Information Asymmetry ... · How Do Diversity of Opinion and...
How Do Diversity of Opinion and InformationAsymmetry Affect Acquirer Returns?
Sara B. MoellerUniversity of Pittsburgh
Frederik P. SchlingemannUniversity of Pittsburgh
Rene M. StulzThe Ohio State University, NBER, and ECGI
We examine the theoretical predictions that link acquirer returns to diversity ofopinion and information asymmetry. Theory suggests that acquirer abnormal returnsshould be negatively related to information asymmetry and diversity-of-opinionproxies for equity offers but not cash offers. We find that this is the case and that,more strikingly, there is no difference in abnormal returns between cash offers forpublic firms, equity offers for public firms, and equity offers for private firms aftercontrolling for one of these proxies, idiosyncratic volatility. (JEL G31, G32, G34)
This article examines whether variables suggested by diversity-of-opinionmodels and information asymmetry models are helpful in understandingthe cross-sectional variation in acquirer announcement returns using asample of pure equity offers and pure cash offers for public and privatefirms from 1980 to 2002. We document that these variables, the uncertaintyproxies, explain a significant fraction of the cross-sectional variation inacquirer announcement returns. Perhaps most strikingly, after controllingfor the uncertainty proxies, there is no difference in abnormal returnsbetween cash offers for public firms, equity offers for public firms, andequity offers for private firms.
Using two proxies for diversity of opinion employed previously inthe literature, the standard deviation of analyst forecasts and breadthof ownership, we show that bidder abnormal returns for acquisitions of
We are grateful to I/B/E/S International Inc. and First Call for providing the analyst forecasts data. Wethank the seminar participants at the Ohio State University, Princeton University, Texas Tech University,University of Kentucky, University of North Carolina, University of South Carolina, University ofTexas-Arlington, University of Utrecht, University of Wisconsin-Milwaukee, Wake Forest University,an anonymous referee, Patrick Bolton, Eugene Fama, Bing Han, Harrison Hong, Kose John, AndrewKarolyi, Robert McDonald, Carrie Pan, Ailsa Roell, Greg Sommers, Jerome Taillard, Wei Xiong, andChad Zutter for helpful comments and suggestions. Tom Boulton and Carrie Pan provided valuableresearch assistance. Part of this research was conducted while Moeller was at Wake Forest University.Address correspondence to Rene M. Stulz, The Ohio State University, Fisher School of Business,Columbus, OH 43210, or e-mail: [email protected].
© The Author 2007. Published by Oxford University Press on behalf of The Society for Financial Studies.All rights reserved. For Permissions, please email: [email protected]:10.1093/rfs/hhm040
RFS Advance Access published September 21, 2007

The Review of Financial Studies / v 20 n 5 2007
public firms paid for with equity are lower the higher the diversity ofopinion. The economic significance of the relation between diversity ofopinion and abnormal returns is substantial. For instance, going from abidder with a low standard deviation of analyst forecasts (one standarddeviation below the mean) to a bidder with a high standard deviationof analyst forecasts (one standard deviation above the mean) reduces theannouncement abnormal return by roughly 2.6%. In contrast, there is nonegative relation between bidder abnormal returns and diversity of opinionfor acquisitions of private firms paid for with equity or for acquisitions ofpublic firms paid for with cash.
A firm’s idiosyncratic volatility can proxy for information asymmetry.We find this variable to be extremely helpful in understanding acquirerabnormal returns as predicted by information asymmetry models. Inregressions explaining acquirer returns for acquisitions of public firmspaid for with equity, the abnormal return falls as idiosyncratic volatilityincreases. When the proxies for diversity of opinion are added toregressions that already include idiosyncratic volatility as an explanatoryvariable, they are not significant. Finally, acquirer abnormal returnsfor acquisitions of public firms paid for with cash increase as bidderidiosyncratic volatility increases.
Though our results are supportive of the role of proxies for diversity ofopinion and information asymmetry as determinants of bidder abnormalreturns, we also find results that are difficult to reconcile with diversity-of-opinion models. We find at best limited support for the prediction of thesemodels that larger acquisitions paid for with equity should have a worseimpact on bidders with greater diversity of opinion. Further, diversity-of-opinion models cannot explain why we find some evidence that bidderreturns increase with diversity of opinion for cash offers for public firms.In contrast, the predictions of information asymmetry models hold acrossoffer types.
The article proceeds as follows. In Section 1, we review the theoriesthat motivate our uncertainty proxies and summarize the predictions ofthese theories. We describe our sample of acquisitions and acquiring firmsin Section 2. In Sections 3, 4, and 5, we examine how variables thatproxy for diversity of opinion, information asymmetry, and resolutionof uncertainty help explain acquirer abnormal returns. In Section 6, weexplore whether these variables can explain the differences in abnormalreturns across types of acquisitions. We investigate further the robustnessof our results in Section 7. We conclude in Section 8.
1. Hypotheses
In this article, we investigate the relation between bidder returnsand proxies for diversity of opinion and information asymmetry (the
2

How Do Diversity of Opinion and Information Asymmetry Affect Acquirer Returns?
uncertainty proxies). In this section, we briefly review and drawimplications about acquirer returns from the theoretical models in whichthe uncertainty proxies play a key role. Before we do so, it is useful to pointout that in a rational expectations model with normally distributed returns,the absolute expected return conditional on the sign of the return increaseswith the volatility of the return. Hence, all else equal, in such a model theexpected return conditional on bad news would be more negative for astock that is more volatile and the expected return conditional on goodnews would be more positive for such a stock.1 This simple mechanismcould explain the existence of a relation between abnormal returns andthe uncertainty proxies. However, the models we rely on for our empiricalwork predict both the sign of the announcement return and its relationwith the uncertainty proxies.
1.1 Diversity of opinionMiller (1977), Chen, Hong, and Stein (2002), and Hong, Scheinkman, andXiong (2006), among others, develop models in which diversity of opinionabout a firm’s prospects leads to a downward-sloping demand curve forits stock. With these models, the slope of the demand curve increases withdiversity of opinion among investors. As the supply of shares available fortrading (float) increases, it has to be absorbed by investors who have alower opinion of the stock. These models therefore imply that acquisitionannouncements by firms with greater diversity of opinion should haveworse returns when the acquisition increases the bidder’s float.
A more direct prediction of diversity-of-opinion models is that theadverse impact of an increase in the float increases with diversity ofopinion. If, for an equity offer for a public firm, the size of the offerrepresents the size of the increase in the bidder’s float, we expect bidderreturns to decrease in the proxy for diversity of opinion interacted withthe proportional increase in the float. However, not all newly issued sharesnecessarily add to the float. In particular, as emphasized by Baker, Coval,and Stein (2006), some target shareholders may be sleepy, so that theshares they receive do not really add to the float. In this case, for a givenincrease in the supply of shares, we would expect the bidder abnormalreturn to fall with bidder diversity of opinion and in the proportion oftarget shareholders who are not sleepy.
Cash acquisitions have no impact on the float. The impact on float ofacquisitions of private firms paid for with equity depends on if and whenthe owners of the acquired firm sell the shares. If they sell all their sharesimmediately, the impact on float is similar to acquisitions of public firmspaid for with equity. This seems unlikely, because the owners may be
1 Diamond and Verrecchia (1987) explicitly analyze returns conditional on the arrival of positive andnegative news.
3
The Review of Financial Studies / v 20 n 5 2007
prevented from doing so with lock-up agreements, they may want to beinfluential in the acquiring firm, and they may have capital gains that makeit suboptimal for them to sell the shares. We provide evidence consistentwith the hypothesis that the float increases less with acquisitions of privatefirms paid for with equity than with acquisitions of comparable publicfirms.
We use two proxies for diversity of opinion: dispersion of analystforecasts and breadth of ownership. Recent literature uses the dispersionof analyst forecasts as a measure of diversity of opinion, while Chen,Hong, and Stein (2002) propose a model in which diversity of opinion isnegatively related to breadth of ownership.2,3
1.2 Information asymmetryA traditional explanation for the negative bidder announcement returnsfor acquisitions of public firms paid for with equity, put forward by Travlos(1987) and inspired by Myers and Majluf (1984), is that the announcementsignals to the market that bidder management believes the firm’s commonstock is overvalued. We therefore expect bidder abnormal returns to benegative for equity offers. When management makes a cash offer, themarket infers that equity is worth more than its market value, which isgood news and leads to higher abnormal returns. With equity acquisitionsof private firms, the seller can obtain confidential information directlyfrom the acquirer, so the acquirer would not expect to benefit by usingoverpriced equity as a means of payment for such acquisitions. It couldeven be that the willingness of the seller to receive equity is better news foracquirers with greater information asymmetries since the seller can helpcertify that the acquiring firm is not overvalued.4 Consequently, we expecteither no relation or a positive relation between abnormal returns and theproxies for information asymmetry for acquisitions of private firms paidfor with equity.
Krasker (1986) extends the Myers and Majluf (1984) model to showthat there is a negative relation between the post-issue price and the sizeof the equity issue when management can choose the size of the issue.Krasker’s model therefore suggests a negative relation between abnormalreturns and the size of an acquisition.
An additional prediction of the information asymmetry models is that,everything else equal, the expected growth should be lower if the firm paysfor the acquisition of a public firm with equity as opposed to cash.
2 See, for instance, Diether et al. (2002); Diether (2004), and Scherbina (2003).3 We are grateful to the referee for suggesting the use of this measure.4 This argument is made in the context of private equity placements by Hertzel and Smith (1993). It would
not apply if the seller expects to sell his shares immediately. The management of a public target can alsoacquire private information. Consequently, the argument is valid only if, in that case, management cannotprovide a certification benefit, perhaps because of conflicts of interest.
4
How Do Diversity of Opinion and Information Asymmetry Affect Acquirer Returns?
Dierkens (1991) explores the relation between abnormal returns forequity issues and proxies for the nature of the information environment.Her proxies are the standard deviation of the earnings announcementabnormal return, the firm’s idiosyncratic volatility, the firm’s turnover,and the number of public announcements of the firm. We use the first twoof these as proxies for information asymmetry in our tests. One of theseproxies, the idiosyncratic volatility of the stock, has also been used in theliterature recently as a measure of diversity of opinion.5
1.3 Resolution of uncertaintyTypically, one would expect uncertainty to get resolved more for firmswith a higher level of uncertainty about growth prospects. We thereforehave to make sure that our uncertainty proxies are not just proxies forresolution of uncertainty since existing models suggest that resolution ofuncertainty could be associated with worse abnormal returns for acquirers.In the models of McCardle and Viswanathan (1994) and Jovanovic andBraguinsky (2004), an acquisition signals adverse information about thebidder’s prospects and resolves uncertainty about these prospects. Pastorand Veronesi (2006) and Johnson (2004) show that uncertainty abouta firm’s long-term growth prospects increases firm value in an efficientmarket. This effect is stronger for firms with better growth prospects.On the basis of these models, we expect an acquisition announcementthat reduces uncertainty about a firm’s long-term growth prospects tobe associated with a drop in firm value unless there is an accompanyingsynergy gain large enough to offset the resolution-of-uncertainty effect.This prediction of the resolution-of-uncertainty models should hold for alltypes of offers.
1.4 Summary of model predictionsTable 1 summarizes the predictions of the models when applied to acquirerreturns. We include the predictions associated with the resolution-of-uncertainty hypothesis even though our focus is on diversity of opinion andinformation asymmetry models. As we previously argued, the resolution-of-uncertainty hypothesis is important because we need to ensure thatour uncertainty proxies are not significant because they are correlatedwith uncertainty resolution. The models predict that, for equity offersfor public firms, acquirer abnormal returns are negatively related to theuncertainty proxies. However, each of the models has unique predictionsfor cash offers of public firms and equity offers of private firms. We canuse these predictions to see which model, if any, better explains bidderreturns. In particular, the diversity-of-opinion models predict a negativerelation between abnormal returns for equity offers for public firms but not
5 See Boehme, Danielsen, and Sorescu (2006) for references.
5

The Review of Financial Studies / v 20 n 5 2007
Table 1Model predictions
Acquirer abnormal returns
Acquisition of public Acquisition of public Acquisition of privatefirms paid for with firms paid for firms paid for with
Increase in equity with cash equity
Diversity of opinion Decrease No effect No effectInformation asymmetry Decrease Increase Increase or no effectResolution of uncertainty Decrease Decrease Decrease
for other acquisitions. The information asymmetry models make oppositepredictions for cash and equity offers for public firms. The resolution-of-uncertainty models make the same prediction for all types of acquisitions.In addition, the diversity-of-opinion models make strong predictions forthe role of the size of the offer and the composition of target shareholders.The information asymmetry models have implications for changes inexpected growth associated with the type of financing for acquisitions ofpublic firms. We investigate these various additional predictions.
2. The Data
We first describe the sample of acquisitions and then turn to thecharacteristics of bidders and targets in our sample. Finally, we introduceour proxies for diversity of opinion, information asymmetry, anduncertainty resolution.
2.1 The sample of acquisitionsTo analyze the relation between the uncertainty proxies and the acquirer’sacquisition announcement abnormal return, we start from a sample ofsuccessful and unsuccessful acquisition announcements constructed fromthe Securities Data Company’s (SDC) US Mergers and AcquisitionsDatabase. Our sample is restricted to pure cash and pure equity offers toavoid complications that arise when considering mixed offers. Since thereare too few pure cash offers for private firms, our sample is limited topure cash and pure equity offers for public firms and pure equity offers forprivate firms. None of the models we consider has predictions that wouldmake it helpful to consider mixed offers. We require that the deal valuecorresponds to at least 1% of the market value of the assets of the acquirer(defined as the book value of assets minus the book value of equity plusthe market value of equity). In addition, the sample of acquisitions meetsthe following criteria:
1. The acquisition attempt is announced in the period from 1980 to2002 and neither the acquirer nor the target has another mergerannouncement in the three-day window;
6
How Do Diversity of Opinion and Information Asymmetry Affect Acquirer Returns?
2. The acquirer controls less than 50% of the shares of the target at theannouncement date and a successful acquirer obtains 100% of thetarget shares;
3. The deal value is equal to or greater than $1 million;4. The target is a US public firm or a US private firm;5. Data on the acquirer is available from CRSP and COMPUSTAT;6. The deal is classified by SDC as either successful, unconditional, or
withdrawn;7. If successful, the deal is completed in less than 1000 days.
We find 4322 acquisition announcements that meet these criteria. Next,for tests that require analyst data, an acquiring firm must have a forecastfor long-term growth of earnings per share the month preceding theacquisition (month–1) and be followed by at least three analysts at thattime so that it is meaningful to compute a standard deviation of long-term forecasts.6 Our information on analyst forecasts is obtained fromthe Summary History File of the Institutional Brokers Estimate System(I/B/E/S) database. This requirement leaves a subset with analyst data of1553 announcements.
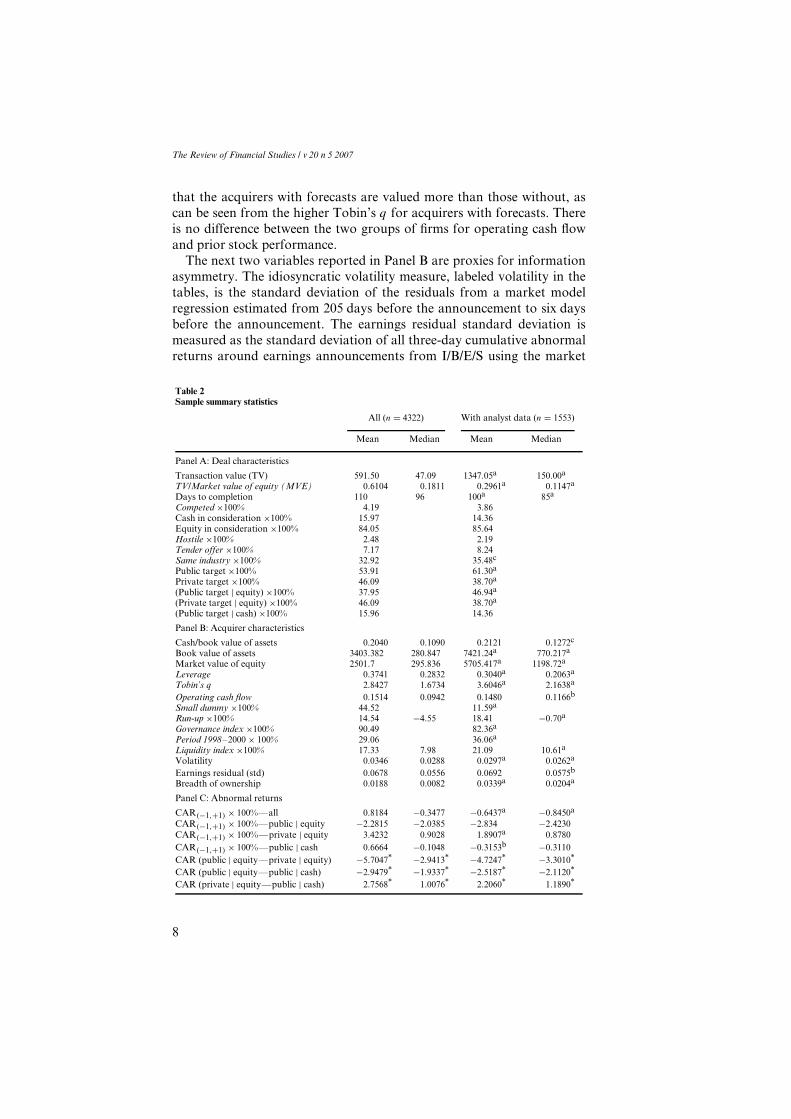
2.2 Bidder characteristicsTable 2 provides information on acquirer and deal characteristics for thefull sample of acquisitions and the subset with analyst data.Our regressionsuse the same control variables as Moeller, Schlingemann, and Stulz (2004).These variables are in italics in the table. Panel A of Table 2 shows thatimposing the requirement of analyst forecasts availability increases sharplythe mean and median transaction value for the acquisitions considered.Further, the acquisitions become less important relative to the marketvalue of equity of the acquirer or the market value of the assets. Itfollows from this comparison that the sample of acquisitions with analystforecasts is not a representative sample of all acquisitions: La Porta (1996);Hong, Lim, and Stein (2000), and Diether, Malloy, and Scherbina (2002),among others, note that the intersection of CRSP, COMPUSTAT, andI/B/E/S is severely skewed towards larger companies. Panel B shows that,whether using book value of assets, market value of assets, or marketvalue of equity, acquirers with analyst forecasts are much larger thanacquirers without such forecasts. The acquirers with forecasts also havelower leverage. We use the market-to-book ratio, computed as total assetsminus the book value of common equity plus the market value of commonequity divided by total assets, as a proxy for Tobin’s q. There is evidence
6 To compute a standard deviation, we need at least two observations, but we focus on cases where we haveat least three forecasts to avoid putting too much weight on outliers. Though we believe that this measureis more reliable, our results also hold if we require only two analyst forecasts to compute our measure ofdispersion.
7
The Review of Financial Studies / v 20 n 5 2007
that the acquirers with forecasts are valued more than those without, ascan be seen from the higher Tobin’s q for acquirers with forecasts. Thereis no difference between the two groups of firms for operating cash flowand prior stock performance.
The next two variables reported in Panel B are proxies for informationasymmetry. The idiosyncratic volatility measure, labeled volatility in thetables, is the standard deviation of the residuals from a market modelregression estimated from 205 days before the announcement to six daysbefore the announcement. The earnings residual standard deviation ismeasured as the standard deviation of all three-day cumulative abnormalreturns around earnings announcements from I/B/E/S using the market
Table 2Sample summary statistics
All (n = 4322) With analyst data (n = 1553)
Mean Median Mean Median
Panel A: Deal characteristics
Transaction value (TV) 591.50 47.09 1347.05a 150.00a
TV/Market value of equity (MVE) 0.6104 0.1811 0.2961a 0.1147a
Days to completion 110 96 100a 85a
Competed ×100% 4.19 3.86Cash in consideration ×100% 15.97 14.36Equity in consideration ×100% 84.05 85.64Hostile ×100% 2.48 2.19Tender offer ×100% 7.17 8.24Same industry ×100% 32.92 35.48c
Public target ×100% 53.91 61.30a
Private target ×100% 46.09 38.70a
(Public target | equity) ×100% 37.95 46.94a
(Private target | equity) ×100% 46.09 38.70a
(Public target | cash) ×100% 15.96 14.36
Panel B: Acquirer characteristics
Cash/book value of assets 0.2040 0.1090 0.2121 0.1272c
Book value of assets 3403.382 280.847 7421.24a 770.217a
Market value of equity 2501.7 295.836 5705.417a 1198.72a
Leverage 0.3741 0.2832 0.3040a 0.2063a
Tobin’s q 2.8427 1.6734 3.6046a 2.1638a
Operating cash flow 0.1514 0.0942 0.1480 0.1166b
Small dummy ×100% 44.52 11.59a
Run-up ×100% 14.54 −4.55 18.41 −0.70a
Governance index ×100% 90.49 82.36a
Period 1998–2000 × 100% 29.06 36.06a
Liquidity index ×100% 17.33 7.98 21.09 10.61a
Volatility 0.0346 0.0288 0.0297a 0.0262a
Earnings residual (std) 0.0678 0.0556 0.0692 0.0575b
Breadth of ownership 0.0188 0.0082 0.0339a 0.0204a
Panel C: Abnormal returns
CAR(−1,+1) × 100%—all 0.8184 −0.3477 −0.6437a −0.8450a
CAR(−1,+1) × 100%—public | equity −2.2815 −2.0385 −2.834 −2.4230CAR(−1,+1) × 100%—private | equity 3.4232 0.9028 1.8907a 0.8780CAR(−1,+1) × 100%—public | cash 0.6664 −0.1048 −0.3153b −0.3110CAR (public | equity—private | equity) −5.7047* −2.9413* −4.7247* −3.3010*
CAR (public | equity—public | cash) −2.9479* −1.9337* −2.5187* −2.1120*
CAR (private | equity—public | cash) 2.7568* 1.0076* 2.2060* 1.1890*
8

How Do Diversity of Opinion and Information Asymmetry Affect Acquirer Returns?
Table 2(Continued)
I/B/E/S Sample Firmfirms firms median
n = 439,774 n = 1553 n = 1506 Differences(1) (2) (3) (1)—(2) (1)—(3) (2)—(3)
Panel D: I/B/E/S long-term growth (LTG) forecastsLTG (std) 4.328 5.075 4.722 −0.747a −0.394b 0.353a
[3.000] [3.250] [3.690] [−0.250]a [0.690]a [0.080]b
LTG (median) 15.875 23.330 21.919 −7.455a −6.044a 1.411a
[14.000] [20.000] [20.000] [−6.000]a [−6.000]a [0.000]a, −Revision in 0.027a −0.038 −0.012 0.065 0.039a −0.026
LTG (std) [0.000]a [0.000] [0.000] [0.000] [0.000] [0.000]Revision in −0.172a −0.017 −0.009 −0.155 −0.163a −0.008
LTG (median) [0.000]a [0.000] [0.000] [0.000]c,+ [0.000]a,+ [0.000]
The table presents a sample of successful and unsuccessful acquisitions by publicly listed US acquirersobtained from the SDC Merger and Acquisition Database for the period 1980–2002. The sampleincludes all deals involving US private targets with 100% equity payment and public targets witheither 100% equity or 100% cash payment. The italicized variables are control variables in Moeller,Schlingemann, and Stulz (2004). The subsample with analyst data includes acquirers with long-termgrowth analyst forecasts by three or more analysts. In Panel A, the transaction value is from SDCand represents the total value of consideration paid by the acquirer, excluding fees and expenses. Themarket value of equity is for the fiscal year end prior to the announcement. The market value of assetsis the book value of assets minus the book value of equity plus the market value of equity. Daysto completion is the number of days between the announcement and effective date (for successfuldeals). Competed, hostile, tender offer, and cash and equity in consideration are from SDC. Sameindustry deals involve targets with the same two-digit SIC code as that of the bidder. In Panel B,cash includes cash and marketable securities. Leverage is measured as the ratio of long-term andshort-term debt to the market (book) value of assets. Tobin’s q is defined as the ratio of the marketvalue of assets to the book value of assets. Operating cash flow is defined as sales minus the cost ofgoods sold, sales and general administration, and working capital change, normalized by the bookvalue of assets. Small dummy is equal to one if the acquirer has a market value of equity equal toor less than the market value of equity of the smallest quartile of NYSE firms in the year of theacquisition. Run-up is measured as the market-adjusted buy-and-hold return over the period from205 days to six days prior to the announcement of the deal. Governance is a dummy variable equalto one if the reported Governance Index from Gompers, Ishii, and Metrick (2003) for the acquireris above the sample median. Period 1998–2000 is a dummy variable equal to one if the deal isannounced during the calendar years 1998–2000. The liquidity index for the target is calculated asthe value of corporate control transactions in the two-digit SIC code for each year divided by thetotal book value of assets of firms in the two-digit SIC code for that year. Volatility is the standarddeviation of the market-adjusted residuals of the daily stock returns measured during the periodstarting from 205 to six days prior to the acquisition announcement. Earnings Residual (std) is thestandard deviation of all three-day cumulative abnormal returns around earnings announcementsfrom I/B/E/S using the market model over the 5-year period preceding the acquisition announcement.Breadth of ownership of the acquirer is the fraction of mutual funds that own the stock in the quarterprior to the acquisition. Variables in italics are used as control variables in the regression analysis. InPanel C, the CAR(–1,+1) denotes the three-day cumulative abnormal return (in percent) measuredusing market model residuals. In Panel D, the standard deviation and median of the long-termgrowths forecasts and forecast revisions are reported in column (1) for all I/B/E/S firms with threeor more analysts and available data on long-term earnings growth forecasts, in column (2) for thesample firms the month prior to the announcement, and in column (3) for the median of the timeseries for sample firms using all available months excluding the months prior, during, and after theannouncement of the deal. The forecast revisions for the sample firms are the difference from themonth before the announcement to the month after the announcement. Forecast revisions for allI/B/E/S firms and firm median are measured over a two-month period with overlapping windows.Superscripts a, b, and c denote, respectively, statistical significance at the 1, 5, and 10% levels basedon t-tests (means) and Wilcoxon-tests (medians) of the unpaired differences between the two samplesin Panels A through C and for Panel D across the groups in columns (1)–(2) and (1)–(3) and a pairedt-test (sign-rank test) is used for the mean (median) paired difference between (2)–(3). For Panel C,*, denotes significance at the 1% level for the difference in means or medians between the abnormalreturns of the subsamples containing private targets with 100% equity payment and public targetswith either 100% equity or 100% cash payment. For Panel D, − and + respectively denote a negativeand positive test statistic in case the mean or median paired difference is rounded to zero in the table,yet is significantly different from zero.
9
The Review of Financial Studies / v 20 n 5 2007
model over the five years preceding the acquisition announcement. Thoughidiosyncratic volatility is lower for firms with analyst data, the earningsresidual standard deviation is not. The last variable shown in Panel B,breadth of ownership, is a proxy for diversity of opinion. As diversity ofopinion about a stock increases, more mutual funds would prefer to sellthe stock short if they were not prevented from doing so by short-salerestrictions. Consequently, an increase in diversity of opinion is associatedwith a decrease in the breadth of ownership, which we measure as thefraction of mutual funds that own the stock in the quarter prior to theacquisition. Breadth of ownership is greater for firms with analyst data.
We use the Center for Research in Securities Prices (CRSP) databaseto collect daily return data for our sample of acquirers and datafor the equally weighted index. We estimate the acquirer abnormalreturns, CAR(– 1,+1), associated with the three-day window surroundingthe acquisition announcements in our sample for each year using standardevent study methods (see, e.g., Brown and Warner (1985)). We computemarket model abnormal returns using the CRSP equally weighted index,where the parameters for the market model are estimated over the (−205,−6) day interval. In Panel C of Table 2, we report the mean and medianannouncement abnormal returns. Not surprisingly, we find that theabnormal returns differ significantly across offer types for the wholesample. These significant differences are preserved when we considerthe restricted sample, but the mean announcement abnormal return offirms with analyst data is roughly 150 basis points less than the meanannouncement abnormal return of firms in the unrestricted sample.The differences in acquirer size between the two samples (see Moeller,Schlingemann, and Stulz (2004)) as well as the greater prevalence of equityoffers in the restricted sample help explain this difference in abnormalreturns.
Another selection bias induced by restricting the sample to only acquirerswith at least three analyst forecasts is that the fraction of acquirers withanalyst forecasts increases over time. Consequently, the percentage ofacquisitions made by firms followed by at least three analysts is higherin recent years, so the proportion of acquisitions included in our sampleis higher on average during the last five years of the sample period. Therestricted sample includes 21.55% of the unrestricted acquisitions from1980 through 1990, 38.50% from 1991 through 2002, and 62.53% from1998 through 2002. The latest merger wave is therefore overrepresented inthe restricted sample.
2.3 Measures of diversity of opinion and uncertainty resolution constructedfrom analyst forecastsOur empirical work using analyst forecasts focuses on the long-termearnings growth forecast, which I/B/E/S defines as a three to five year
10

How Do Diversity of Opinion and Information Asymmetry Affect Acquirer Returns?
forecast of the expected annual increase in operating earnings over thecompany’s next full business cycle. The primary reason we choose thelong-term growth forecast, instead of quarterly or yearly forecasts, is thatit features prominently in valuation models. This long-term forecast alsohas several other advantages. First, quarterly or yearly earnings forecastsare affected by how close a firm is to the end of a fiscal quarter or year andby how important earnings guidance is for a firm. These considerations areless likely to influence the long-term growth forecast. Second, quarterly oryearly forecasts typically have to be normalized to be made comparableacross firms and the normalization may introduce noise in comparisonsof forecasts across firms. Because the long-term forecast is an expectedgrowth rate, it is directly comparable across firms.
The main variable of interest in our analysis is the dispersion of analystforecasts before the acquisition announcement (month-1) measured by thestandard deviation of these forecasts.7 The difficulty with this variable isthat the dispersion of analyst forecasts is somewhat higher when a firmhas few—but more than one—analysts. Therefore, we also use a differentmeasure of dispersion of analyst forecasts. For each number of analystforecasts, we rank the standard deviation of forecasts and we call highanalyst dispersion firms those that rank in the top decile of dispersion ofanalyst forecasts among firms with the same number of analyst forecasts.
Panel D of Table 2 provides information on our analyst measures. All ofour data come from the Summary File. We show the mean and median ofthe standard deviation and the median of the long-term growth forecasts.The first column is the whole I/B/E/S sample for which a long-term growthforecast is available and there are at least three analysts. The secondcolumn provides data for the sample of acquisitions.
Comparing the acquirers to all I/B/E/S firms using a Wilcoxon mediantest, we first see that the acquirers have higher long-term growth prospectsand more dispersion in long-term growth forecasts. The third column inPanel D of Table 2 is the full time-series median of the sample of acquiringfirms excluding the forecasts from one month before to one month afterthe merger announcement. The overall median of dispersion and levelsof long-term growth forecasts across all acquirers measured during themonth before the acquisition are lower and the same as, respectively,for all other months. However, the mean value of the long-term growth
7 The month of the acquisition (month 0) is defined as the I/B/E/S statistical period in which theannouncement occurs unless that announcement is within six business days of the end of the period. Forannouncements that occur within six business days of the end of the period, the next month is consideredthe month of the acquisition because only the forecasts of the next month are expected to be affectedby the acquisition (see Pound (1988)). There is a risk that this procedure will lead to a misclassificationof some forecasts as having been made before the announcement when in fact they were made after theannouncement. Though we report results using this classification method, our results hold if, instead, weuse month–2 for the acquisitions announced during the last six business days of the I/B/E/S statisticalperiod.
11

The Review of Financial Studies / v 20 n 5 2007
analyst forecasts dispersion for acquirers is higher for the month before anacquisition than for the other months. The last two rows of the table showthat neither the standard deviation of long-term growth forecasts nor themedian long-term growth forecasts change significantly from before toafter the announcement.
3. Diversity of Opinion and Abnormal Returns
We use multiple regressions to evaluate whether diversity-of-opinionproxies are helpful in explaining acquirer abnormal returns. All regressionsuse industry-fixed effects at the two-digit SIC code. We first discuss theresults for acquisitions of public firms paid for with equity. In Section 3.2,we investigate whether information about diversity of opinion of the targetis useful to explain acquirer abnormal returns. We turn to other offers inSection 3.3.
3.1 Diversity of opinion and acquisitions of public firms paid for with equityAll the regressions in the following tables have the same format. Weregress the three-day acquirer abnormal return on a constant, one or moreuncertainty proxies, and control variables:
Abnormal return = Constant +n∑
i=1
β iUncertainty proxyi
+N∑
j=n+1
β jControl variablej + ε (1)
In regression (1) of Panel A of Table 3, the uncertainty proxy is themeasure of analyst forecasts dispersion.8 The regression has no controlvariables. We find that the measure of analyst forecasts dispersion has asignificant negative coefficient. The coefficient is −0.0028. The standarddeviation of the measure of dispersion of analyst forecasts is 5.64.Consequently, a difference of two standard deviations of the measureof dispersion of analyst forecasts corresponds to an abnormal returndifference of 3.2%.
To account for known determinants of acquisition abnormal returns,we add in regression (2) variables that the literature often uses to explainacquirer abnormal returns. As discussed earlier, we use the same variablesas Moeller, Schlingemann, and Stulz (2004). To save space, we do notreport the coefficients on these variables.9 In addition, to take into account
8 We also estimate regressions to which we add the square of the dispersion of analyst forecasts. We find noevidence to support such a specification.
9 Tables with these coefficients are available from the authors.
12

How Do Diversity of Opinion and Information Asymmetry Affect Acquirer Returns?
Tab
le3
Cro
ss-s
ecti
onal
regr
essi
ons
Pan
elA
:Pub
licta
rget
san
deq
uity
paym
ent
(1)
(2)
(3)
(4)
(5)
(6)
(7)
(8)
LT
G(s
td)
−0.0
028b
−0.0
023c
−0.0
020
−0.0
026b
0.02
40.
063
0.20
00.
048
LT
G(s
td) ×
TV
MV
E−0
.000
70.
788
LT
G(s
td) ×
TV
MV
E×
Inst
itut
iona
low
ners
hip
0.00
140.
606
Top
deci
leL
TG
(std
)−0
.031
5b
0.02
1B
read
thof
owne
rshi
p0.
1064
c0.
0813
0.01
420.
060
0.22
10.
832
Bre
adth
ofow
ners
hip
×T
VM
VE
0.10
50.
576
Bre
adth
ofow
ners
hip
×T
VM
VE
×In
stit
utio
nalO
wne
rshi
p0.
7550
b
0.01
9M
utua
lfun
dho
ldin
gs−0
.126
3b−0
.013
4−0
.083
80.
031
0.86
50.
169
Mut
ualf
und
hold
ings
×T
VM
VE
−0.2
447c
0.06
9M
utua
lfun
dho
ldin
gs×
TV
MV
E×
Inst
itut
iona
lOw
ners
hip
−0.2
263c
0.08
4In
stit
utio
nalo
wne
rshi
p0.
0011
−0.0
055
0.92
90.
678
TV
MV
E−0
.025
3a−0
.025
3a−0
.017
4a−0
.022
80.
0187
−0.0
280a
−0.0
115
0.00
60.
005
0.00
40.
118
0.31
70.
005
0.10
3C
onst
ant
0.05
51c
0.04
560.
0358
0.00
930.
0445
−0.0
029
0.04
540.
0115
0.08
80.
168
0.29
00.
371
0.18
40.
798
0.18
20.
284
Obs
erva
tion
s72
472
072
015
0272
015
0272
015
02A
djus
ted
R2
0.02
50.
070
0.07
00.
046
0.06
80.
051
0.06
80.
054
(con
tinu
edov
erle
af)
13

The Review of Financial Studies / v 20 n 5 2007
Tab
le3
(Con
tinu
ed)
Pri
vate
targ
ets|E
quit
yP
ublic
targ
ets|C
ash
Pan
elB
:Pri
vate
and
cash
deal
s(1
)(2
)(3
)(4
)(5
)(6
)
LT
G(s
td)
−0.0
009
0.00
25*
0.38
00.
112
Top
deci
leL
TG
(std
)0.
0041
*0.
0254
*
0.73
5*0.
231
Bre
adth
ofow
ners
hip
−0.1
684*
−0.1
226c*
0.21
9*0.
056
Mut
ualf
und
hold
ings
−0.0
042
0.08
86*
0.95
90.
157
TV
MV
E0.
0156
*0.
0157
*0.
0100
*0.
0063
*0.
0063
*0.
0037
*
0.25
50.
253
0.20
20.
575
0.59
00.
160
Con
stan
t0.
0307
*0.
0098
*−0
.009
*−0
.042
3c−0
.028
1*0.
0315
0.20
40.
666
0.70
60.
085
0.27
60.
261
Obs
erva
tion
s59
959
916
8921
921
960
4A
djus
ted
R2
0.02
40.
023
0.02
90.
017
0.01
20.
042
The
tabl
esh
ows
the
OL
Sre
gres
sion
sfo
rw
hich
the
depe
nden
tva
riab
leis
the
thre
e-da
ycu
mul
ativ
eab
norm
alre
turn
esti
mat
edfr
omm
arke
tm
odel
resi
dual
s.p
-val
ues
are
repo
rted
belo
wth
eco
effic
ient
s.T
hesa
mpl
eof
succ
essf
ulan
dun
succ
essf
ulac
quis
itio
nsby
publ
icly
liste
dU
Sac
quir
ers
isfr
omth
eSD
CM
erge
ran
dA
cqui
siti
onD
atab
ase
for
the
peri
od19
80–
2002
.It
incl
udes
alld
eals
invo
lvin
gU
.S.p
riva
teta
rget
sus
ing
100%
equi
typa
ymen
tor
publ
icta
rget
sw
ith
100%
cash
or10
0%eq
uity
paym
ent.
The
stan
dard
devi
atio
n(s
td)
ofth
elo
ng-t
erm
earn
ings
grow
thfo
reca
sts
(LT
G)
requ
ires
thre
eor
mor
ean
alys
tsan
dis
repo
rted
inpe
rcen
tan
dis
from
I/B
/E/S
inth
em
onth
prio
rto
the
deal
.Top
deci
leL
TG
(std
)is
equa
lto
one
ifth
eac
quir
er’s
std
ofit
slo
ng-t
erm
earn
ings
grow
thfo
reca
sts
isin
the
top
deci
leof
stds
amon
gal
lacq
uire
rsw
ith
the
sam
enu
mbe
rof
anal
ysts
.Bre
adth
ofow
ners
hip
isde
fined
for
the
acqu
irer
asth
efr
acti
onof
mut
ualf
unds
who
own
the
stoc
kin
the
quar
ter
prio
rto
the
acqu
isit
ion.
Mut
ualf
und
hold
ings
are
calc
ulat
edas
the
aggr
egat
em
utua
lfun
dho
ldin
gsdi
vide
dby
the
tota
lsha
res
outs
tand
ing
onC
RSP
inth
equ
arte
rpr
ior
toth
eac
quis
itio
n.T
here
lati
vetr
ansa
ctio
nva
lue
(TV
MV
E)
isth
eto
tal
valu
eof
cons
ider
atio
npa
idby
the
acqu
irer
,ex
clud
ing
fees
and
expe
nses
,as
repo
rted
bySD
Cdi
vide
dby
the
mar
ketv
alue
ofeq
uity
.Exc
eptf
orm
odel
(1)
ofP
anel
A,a
llre
gres
sion
mod
els
incl
ude,
but
dono
tre
port
the
cont
rol
vari
able
sfr
omM
oelle
r,Sc
hlin
gem
ann
and
Stul
z(2
004)
.In
addi
tion
toth
ese
cont
rol
vari
able
s,w
eus
ea
dum
my
vari
able
equa
lto
one
ifth
ecl
oses
tre
port
edG
over
nanc
eIn
dex
from
Gom
pers
,Is
hii,
and
Met
rick
(200
3)fo
rth
eac
quir
eris
abov
eth
esa
mpl
em
edia
nan
da
dum
my
vari
able
equa
lto
1if
the
deal
isan
noun
ced
duri
ngth
eca
lend
arye
ars
1998
–20
00.
The
supe
rscr
ipts
a,
b,
and
cde
note
stat
isti
cal
sign
ifica
nce
ofth
eco
effic
ient
sat
the
1,5,
and
10%
leve
ls,
base
don
hete
rosc
edas
tici
ty-a
djus
ted
stan
dard
erro
rs.I
nP
anel
B,i
nm
odel
s(1
)–(3
)an
d(4
)–(6
),∗ d
enot
esa
sign
ifica
ntdi
ffer
ence
,att
he10
%le
velo
rbe
tter
,of
the
coef
ficie
ntre
lati
veto
the
sam
eco
effic
ient
inP
anel
Afo
rm
odel
s(2
)–(4
).
14
How Do Diversity of Opinion and Information Asymmetry Affect Acquirer Returns?
the findings of Masulis, Wang, and Xie (2007) that acquirer returns arehigher for firms with better governance, we use a dummy variable equalto one if the Gompers, Ishii, and Metrick (2003) governance index ofthe acquirer is above the median. Further, to make sure that our resultsare not due to the acquisition wave of the late 1990s, we introduce adummy variable that equals one for offers during the period 1998–2000.The variables used in the literature to explain abnormal returns capturea broad range of determinants of these returns, including variables thatcould proxy for diversity of opinion. Using these variables, therefore,poses a stringent test for the ability of proxies for diversity of opinionto explain abnormal returns. Note first that the measure of dispersionof analyst forecasts is still significant. The coefficient is now slightlysmaller in absolute value, so that the impact of a two-standard deviationchange in diversity of opinion on abnormal returns is 2.6%. It followsthat the significance of the coefficient on dispersion of analyst forecastsis not due to this variable serving as a proxy for other variables used toexplain acquirer abnormal returns. Regression (3) in Panel A shows thatour alternate measure of diversity of opinion constructed from analystforecasts, which is a dummy variable for firms in the top decile of analystforecasts dispersion given their number of analyst forecasts, has a negativesignificant coefficient for acquisitions of public firms paid for with equity.
Regression (4) in Panel A uses breadth of ownership, defined as thefraction of mutual funds that own a stock. We use this variable as analternative measure of the slope of the demand curve for shares. In thetheoretical model of Chen, Hong, and Stein (2002), breadth of ownershipis negatively correlated with diversity of opinion. In their model, there isless breadth of ownership when there are more pessimistic investors whowould like to sell short but cannot. Because mutual fund holdings becomemore important during the sample period, and since breadth of ownershipis correlated with mutual fund holdings, we follow Chen, Hong, and Stein(2002) and control for aggregate mutual fund holdings. The breadth-of-ownership variable is available for a much larger number of acquisitionsthan our proxies for diversity of opinion derived from analyst forecasts.Though we report the regression for the larger sample, the results aresimilar for the smaller sample of acquisitions for which our proxies derivedfrom analyst forecasts are available. We find that breadth of ownership ispositive and significant as predicted.
We would expect that acquisitions that are larger relative to the equitycapitalization of the acquirer have lower abnormal returns when theyincrease the float. We find that the coefficient on the relative size variable(i.e., the value of the consideration divided by the equity capitalizationof the bidder) is significantly negative as expected in regressions (2)–(4).Furthermore, the economic significance of the coefficient is substantial.The average abnormal return for equity offers for public firms in our
15
The Review of Financial Studies / v 20 n 5 2007
sample with analyst forecasts is −2.8%. An increase of one standarddeviation in the relative size of the acquisition decreases abnormal returnsby 1%, so that the abnormal return becomes −3.8%.
For regression (5), we add to regression (2) an interaction of ourdiversity-of-opinion proxy with the relative size of the offer. We expectthis variable to have a negative significant coefficient, yet it does not.However, when we add the interaction variable, neither relative size norour diversity-of-opinion proxy is significant, as is shown in regression (5).If we omit these two variables, the interaction variable has a significantnegative coefficient (not shown), suggesting that multicollinearity couldexplain the lack of success of the interaction in regression (5). Regression(6) uses breadth of ownership instead of the standard deviation of analystforecasts. The interaction of relative size with breadth of ownership is notsignificant either.
3.2 Testing the diversity-of-opinion models using target dataBaker, Coval, and Stein (2006) predict that acquirer abnormal returns ina stock acquisition fall as the proportion of sleepy investors in the targetfalls. They assume that individual investors are more likely to be sleepyinvestors than institutional investors, so the individuals hold on to theshares of the acquirer they receive without much thought. Investors whoare not sleepy are assumed to have a low opinion of the acquirer; sothey want to sell the shares received from the acquirer. Therefore, sharesreceived by target institutional investors are more likely to contribute to thefloat and hence, with a downward-sloping demand for shares, to lead to adrop in the acquirer’s share price. They relate acquirer abnormal returns tothe proportion of target shares held by institutional investors and find, asexpected, that acquirer abnormal returns fall as this proportion increases.This proportion is calculated using the shares held by institutional investorsduring the quarter prior to the takeover announcement divided by thetotal number of shares at the end of the same quarter, both collected fromthe Thomson Financial CDA/Spectrum database. In a regression we donot report, we find that the proportion of institutional investors in thetarget stock has a negative significant coefficient and the dispersion ofanalyst forecasts measure remains significant. Regression (7) of Panel Aof Table 3 adds the fraction of target shares held by institutions as anadditional interacting variable to the interaction of diversity of opinionand the relative size of the offer. The triple interaction of the diversity-of-opinion proxy, the relative size of the offer, and ownership by institutionsof target shares has a positive insignificant coefficient when we use thestandard deviation of analyst forecasts as shown in regression (7) and thetop decile dummy variable proxy (not shown). In these regressions, thediversity-of-opinion proxy has a negative significant coefficient, but theinteraction does not. The last regression, model (8), uses a triple interaction
16

How Do Diversity of Opinion and Information Asymmetry Affect Acquirer Returns?
with breadth of ownership, the relative size of the offer, and the ownershipof the target shares by institutions. In that regression, the triple interactionis significant but breadth of ownership is not.
We estimate regressions using other target characteristics. In doing so,we face the problem that requiring analyst data for the target as well asthe bidder shrinks our dataset to less than one-third its size in Table 3. Incontrast, using breadth of ownership has little impact on our sample size.We therefore reestimate regression (4) of Table 3 of Panel A by addingbreadth of ownership of the target and the target run-up. We include thetarget run-up to capture a possible capital gains lock-in effect. We wouldexpect target shareholders to be less likely to sell the shares received fromthe acquirer if their tax basis is lower, so the float increase would be smaller.As pointed out by Baker, Coval, and Stein (2006), capital gains may alsoincrease the premium paid by the acquirer if the target shareholders expectto sell their shares because they do not want to hold the shares of theacquirer. If this latter effect dominates the former effect, capital gainscould worsen the abnormal return of the acquirer. With the capital lock-ineffect we would expect the target run-up to be significantly positive foracquisitions of public firms paid for with equity but not for acquisitionsof public firms paid for with cash. Our results (not reported) are robustto the inclusion of the target run-up. The target run-up is significant andpositive, which is consistent with a capital gains lock-in effect. Breadth ofownership of the target has a positive insignificant coefficient that is notsignificantly different from the coefficient on breadth of ownership of theacquirer, which continues to have a positive significant coefficient.
3.3 Acquirer returns and diversity of opinion for private firm acquisitionsand acquisitions of public firms paid for with cashPanel B of Table 3 estimates regressions (2) through (4) of Panel A foracquisitions of private firms paid for with equity and for acquisitions ofpublic firms paid for with cash. For the diversity-of-opinion proxies, anasterisk indicates that the coefficient on the proxy is significantly differentfrom the coefficient on the same proxy in the regressions of Panel A at the10% level or better.10 All the coefficients on proxies for diversity of opinion(except for one) are significantly different from their values in Panel A and,as expected, the proxies for diversity of opinion do not have significantcoefficients. For acquisitions of public firms paid for with cash, the proxiesconstructed from analyst forecasts do not have significant coefficients.However, breadth of ownership has a significant coefficient that has theopposite sign from its sign in the regression for equity offers for public
10 To evaluate the significance of the difference, we estimate a pooled regression in which we allow theintercept and slopes of all variables except the industry dummy to depend on the type of transaction.
17
The Review of Financial Studies / v 20 n 5 2007
firms. This result is inconsistent with the predictions of the diversity-of-opinion models. We also estimate regressions with target characteristics(not reported). Strikingly, when we consider acquisitions of public firmspaid for with cash, the coefficient on target run-up is very similar, thoughinsignificant, to the coefficient on target run-up for acquisitions paid forwith equity even though the target run-up is not expected to affect thetendering decision in cash offers.11 This result is therefore not supportiveof the diversity-of-opinion models.
With the diversity-of-opinion models, we would not expect the relativesize variable to have a negative significant coefficient for acquisitions ofprivate firms and for acquisitions of public firms paid for with cash. InPanel B of Table 3, the coefficient on relative size is positive but neversignificant.
The results presented thus far show that diversity-of-opinion proxies arerelated to acquirer returns in a way consistent with our assumptions aboutthe changes in float. We assume that cash offers do not increase the float,and equity offers for public firms increase the float substantially morethan equity offers for private firms. To check whether these assumptionsare reasonable, we investigate the changes in trading volume aroundacquisitions since we cannot measure the float directly. If public firmacquisitions paid for with equity increase the float more than privatefirm acquisitions paid for with equity, we expect a greater increase inshares traded after the acquisition for acquisitions of public firms than foracquisitions of private firms paid for with equity.
To investigate this, we collect data on the acquirer’s stock tradingvolume from CRSP for two windows of 50 days. The first window ends25 days before the announcement and the second window starts 25 daysafter completion. The median percentage change in volume for publicacquisitions paid for with equity is 58.33%; in contrast, it is 29.36%for acquisitions of private firms paid for with equity and 13.07% foracquisitions of public firms paid for with cash. The median changes aresignificantly different from zero and from each other. With our assumptionthat the float increases only with acquisitions of public firms paid for withequity, the size of an acquisition of a private firm paid for with equity orof a public firm paid for with cash should have a weaker relation with thevolume percentage change. To test this, we regress the volume percentagechange on a constant, a dummy for private equity acquisitions (PrivEq), adummy for public firm acquisitions paid for with cash (PubCash), a dummyfor private firm acquisitions paid for with cash (PrivCash), the ratio ofdeal value to bidder market capitalization (TVMVE), interactions of the
11 A number of papers predict that the supply of shares in response to a tender offer for cash is upwardsloping because the realization of capital gains decreases the gain from tendering shares. Anderson andDyl (2004) review this literature and provide evidence of this effect for self-tender offers.
18

How Do Diversity of Opinion and Information Asymmetry Affect Acquirer Returns?
dummy variables with the ratio of deal value bidder market capitalization,and year dummies. The estimated regression is:
Volume percentage change = 0.6813 + 0.0291 × PrivEq
− 0.2696 × PubCash + 0.9134 × TVMVE
− 0.8133 × [PrivEq × TVMVE]
− 0.9201 × [PubCash × TVMVE] (2)
All coefficients are significant at the 1% level except for the coefficienton PrivEq. The regression is estimated on 1248 observations and has anadjusted R2 of 0.070. The impact of TVMVE on the volume percentagechange (i.e., 0.9134–0.8133) is not significantly different from zero foracquisitions of private firms paid for with equity or acquisitions ofpublic firms paid for with cash. It is therefore reasonable to believethat acquisitions of private firms paid for with equity have a negligibleeffect on the bidder’s float, and so our result that there is no relationbetween abnormal returns for such acquisitions and dispersion of analystforecasts is consistent with the diversity-of-opinion models.
In summary, we find results that are generally consistent with diversity-of-opinion models: (i) acquirer announcement returns for equity offers forpublic firms decrease as diversity of opinion increases but announcementreturns for other offer types do not, and (ii) larger equity offers for publicfirms have worse acquirer abnormal returns, while the size of the offerdoes not matter for other offers. Consistent with the diversity-of-opinionmodels, we also find that interacting breadth of ownership with the relativesize of the offer and target institutional ownership is helpful in explainingacquirer returns.
4. Information Asymmetry
Our proxies for diversity of opinion help explain the acquirer abnormalreturns for acquisitions of public firms paid for with equity as predicted bythe diversity-of-opinion models, but we also find results inconsistent withthese models. In particular, we find that an increase in breadth of ownershipleads to significantly higher returns for cash offers for public companies.Such a result could be understood if breadth-of-ownership proxies forinformation asymmetry since, in the presence of information asymmetry,a cash offer is good news about the value of the bidder’s common stock.To understand better the extent to which our results can be explainedby asymmetric information models, we investigate the relation betweenabnormal returns and the proxies for information asymmetry used inDierkens (1991) discussed earlier.
19

The Review of Financial Studies / v 20 n 5 2007
Table 4 presents the regression results explaining acquirer returns withseveral proxies for asymmetric information added to the dispersion of long-term growth forecasts and control variables (not reported) from Table 3.Regression (1) of Table 4 adds idiosyncratic volatility to regression (2) ofTable 3. We find that idiosyncratic volatility is highly significant with anegative coefficient. The economic significance of idiosyncratic volatilityis substantial. The standard deviation of idiosyncratic volatility is 1.56%.Since the regression coefficient on idiosyncratic volatility in regression(1) is −0.9560, a one-standard deviation increase in idiosyncratic volatilitycorresponds to a decrease in the abnormal return of 1.49%. Since theaverage abnormal return for equity acquisitions of public firms is −2.834%,an acquisition by an acquirer with an idiosyncratic volatility of onestandard deviation above the mean has an abnormal return of −4.42%.When idiosyncratic volatility is added to the regression, dispersion ofanalyst forecasts is no longer significant. We then use our alternativedummy variable measure of high dispersion of analyst forecasts inregression (2). That measure has an insignificant coefficient also whenidiosyncratic volatility is added. In regression (3), we add the standarddeviation of earnings announcements to regression (1). We still find thatidiosyncratic volatility has a negative significant coefficient. The standarddeviation of earnings announcement returns is not significant. Finally, inregression (4) we add breadth of ownership and the mutual fund holdingvariable to regression (1). We find that breadth of ownership is notsignificant. It follows that idiosyncratic volatility dominates our proxiesfor diversity of opinion. However, several recent papers use idiosyncraticvolatility as a proxy for diversity of opinion (see Gebhardt, Lee, andSwaminathan (2001); Danielsen and Sorescu, (2001) Diether, Malloy,and Scherbina (2002); Boehme, Danielsen, and Sorescu (2006)). Since itis possible that idiosyncratic volatility is a better measure of diversityof opinion than dispersion of analyst forecasts, these results might beconsistent with the diversity-of-opinion models and show that the diversityof opinion proxies used in Table 3 are noisy.
Regressions (5)–(8) reestimate models (1)–(4) on the sample ofacquisitions of private firms paid for with equity. The coefficient onidiosyncratic volatility is positive but insignificant in these regressions.In Table 2 we show that the average and median abnormal returns forthe announcement of acquisitions of private firms paid for with equityare significantly positive. Consequently, the lack of significance on thecoefficient of idiosyncratic volatility is inconsistent with the view that for agiven distribution of returns, the expected return conditional on good newsincreases with uncertainty. Except for regressions (6) and (7), the coefficienton idiosyncratic volatility is significantly higher than in the regressions foracquisitions of public firms paid for with equity. Surprisingly, the volatilityof the earnings residual is significant and positive in regression (7).
20

How Do Diversity of Opinion and Information Asymmetry Affect Acquirer Returns?
Tab
le4
Cro
ss-s
ecti
onal
regr
essi
ons
wit
hin
form
atio
nas
ymm
etry
mea
sure
s
Pub
licta
rget
s|E
quit
yP
riva
teta
rget
s|E
quit
yP
ublic
targ
ets|C
ash
(1)
(2)
(3)
(4)
(5)
(6)
(7)
(8)
(9)
(10)
(11)
(12)
LT
G(s
td)
−0.0
006
−0.0
003
−0.0
006
−0.0
010
−0.0
011
−0.0
010
0.00
210.
0018
0.00
31b
0.68
10.
807
0.69
20.
369
0.35
90.
406
0.13
90.
270
0.04
3T
opde
cile
LT
G(s
td)
−0.0
208
0.00
470.
0306
c*
0.17
80.
714
0.07
8V
olat
ility
−0.9
560b
−0.8
775b
−0.8
742c
−0.8
500b
0.23
40*
0.06
45−0
.138
30.
3019
*0.
8323
c*0.
8873
c*1.
0986
b*0.
4812
*
0.01
10.
012
0.06
00.
030
0.59
50.
876
0.79
50.
523
0.06
30.
041
0.04
20.
337
Ear
ning
sre
sidu
al(s
td)
−0.0
798
0.30
66c*
−0.1
776
0.52
80.
090
0.26
7B
read
thof
owne
rshi
p0.
0478
−0.1
283
0.03
150.
476
0.50
60.
695
Mut
ualf
und
hold
ings
−0.1
261
−0.0
310
0.13
29*
0.11
40.
825
0.16
1T
VM
VE
−0.0
272a
−0.0
270a
−0.0
260a
−0.0
267a
0.00
960.
0107
0.01
130.
0090
0.00
880.
0087
0.01
98a
0.01
170.
002
0.00
20.
004
0.00
50.
395
0.34
30.
294
0.42
80.
444
0.46
30.
006
0.29
7In
terc
ept
0.00
860.
0051
0.00
900.
0738
c0.
0388
*0.
0202
*0.
0383
0.04
79−0
.045
9c−0
.034
1−0
.045
8c−0
.050
9b
0.71
90.
828
0.70
50.
078
0.12
30.
381
0.15
20.
122
0.04
70.
151
0.05
00.
030
Obs
erva
tion
s68
268
267
066
555
155
152
453
821
121
119
219
6A
djus
ted
R2
0.07
60.
080
0.07
00.
073
0.02
60.
024
0.03
00.
024
0.05
90.
065
0.08
00.
059
The
tabl
egi
ves
the
OL
Sre
gres
sion
sfo
rw
hich
the
depe
nden
tva
riab
leis
the
thre
e-da
ycu
mul
ativ
eab
norm
alre
turn
esti
mat
edfr
omm
arke
tm
odel
resi
dual
s.p
-val
ues
are
repo
rted
belo
wth
eco
effic
ient
s.T
hesa
mpl
eof
succ
essf
ulan
dun
succ
essf
ulac
quis
itio
nsby
publ
icly
liste
dU
Sac
quir
ers
isfr
omth
eSD
CM
erge
ran
dA
cqui
siti
onD
atab
ase
for
the
peri
od19
80–
2002
.It
incl
udes
alld
eals
invo
lvin
gU
Spr
ivat
eta
rget
sus
ing
100%
equi
typa
ymen
tor
publ
icta
rget
sw
ith
100%
cash
or10
0%eq
uity
paym
ent.
The
stan
dard
devi
atio
n(s
td)
ofth
elo
ng-t
erm
earn
ings
grow
thfo
reca
sts
(LT
G)
uses
I/B
/E/S
data
from
the
mon
thpr
ior
toth
ean
noun
cem
ent
and
isre
port
edin
perc
ent.
Top
deci
leL
TG
(std
)is
equa
lto
one
ifth
eac
quir
er’s
stan
dard
devi
atio
nof
its
long
-ter
mea
rnin
gsgr
owth
fore
cast
sis
inth
eto
pde
cile
ofst
anda
rdde
viat
ions
amon
gal
lacq
uire
rsw
ith
the
sam
enu
mbe
rof
anal
ysts
.Vol
atili
tyis
the
stan
dard
devi
atio
nof
the
mar
ket-
adju
sted
resi
dual
sof
the
daily
stoc
kre
turn
sm
easu
red
duri
ngth
epe
riod
from
205
tosi
xda
yspr
ior
toth
eac
quis
itio
nan
noun
cem
ent.
Ear
ning
sR
esid
ual(
std)
isth
est
anda
rdde
viat
ion
ofal
lthr
ee-d
aycu
mul
ativ
eab
norm
alre
turn
sar
ound
earn
ings
anno
unce
men
tsfr
omI/
B/E
/Sus
ing
the
mar
ket
mod
elov
erth
efiv
e-ye
arpe
riod
prec
edin
gth
eac
quis
itio
nan
noun
cem
ent.
Bre
adth
ofow
ners
hip
isth
efr
acti
onof
mut
ual
fund
sth
atow
nth
eac
quir
er’s
stoc
kin
the
quar
ter
prio
rto
the
acqu
isit
ion.
Mut
ualf
und
hold
ings
are
calc
ulat
edas
the
aggr
egat
em
utua
lfun
dho
ldin
gsdi
vide
dby
the
tota
lsha
res
outs
tand
ing
onC
RSP
inth
equ
arte
rpr
ior
toth
eac
quis
itio
n.T
here
lati
vetr
ansa
ctio
nva
lue
(TV
MV
E)r
epre
sent
sth
eto
talv
alue
ofco
nsid
erat
ion
paid
byth
eac
quir
er,e
xclu
ding
fees
and
expe
nses
asre
port
edby
SDC
divi
ded
byth
em
arke
tva
lue
ofeq
uity
.Exc
ept
for
mod
el(1
)al
lreg
ress
ion
mod
els
incl
ude,
but
dono
tre
port
the
cont
rolv
aria
bles
asde
fined
inT
able
3.Su
pers
crip
tsa,b
,and
cde
note
stat
isti
cals
igni
fican
ceof
the
coef
ficie
nts
atth
e1,
5,an
d10
%,r
espe
ctiv
ely,
base
don
hete
rosc
edas
tici
ty-a
djus
ted
stan
dard
erro
rs.I
nm
odel
s(5
)–(8
)an
d(9
)–(1
2),*
deno
tes
asi
gnifi
cant
diff
eren
ceat
the
10%
leve
lor
bett
erof
the
coef
ficie
ntre
lati
veto
the
sam
eco
effic
ient
inm
odel
s(1
)–(4
).
21
The Review of Financial Studies / v 20 n 5 2007
The models that focus on diversity of opinion predict that theannouncement return of an acquisition paid for with cash should notbe related to a proxy for diversity of opinion since no new equity is issued.In contrast, information asymmetry models imply that the announcementreturn on acquisitions paid for with cash should increase with variablesthat measure information asymmetry. Not issuing equity when financingan acquisition must be interpreted as positive news about the value ofequity and it must be more positive news when there is greater uncertaintyabout the true value of the firm. Regressions (9)–(12) use the sample ofacquisitions of public firms paid for with cash. For these regressions, wefind that the coefficient on idiosyncratic volatility is positive and significant.The absolute value of the coefficient is similar to the absolute value of thecoefficient for the acquisitions of public firms paid for with equity. Thisresult is inconsistent with the predictions of diversity-of-opinion models. Itis, however, fully consistent with the information asymmetry models. Notethat this result cannot be explained by the prediction that the expectedreturn conditional on good news increases with volatility since the averageand median abnormal returns for the cash offers in our sample are negative.
The Myers and Majluf (1984) model implies that an equity issue conveysinformation about the value of assets in place. Jain (1992) tests thatimplication of the model by regressing changes in analyst forecasts aroundthe time of an equity issuance on the issue’s abnormal return. Thoughwe do not report the results in a table, we compare changes in forecastsfor the three types of acquisitions we focus on. Using median changes,we find acquisitions of private firms paid for with equity have the highestchange, public acquisitions paid for with cash have the lowest change,and acquisitions of public firms paid for with equity are the middle. Theonly significant difference using the long-term earnings growth forecasts isbetween acquisitions of private firms paid for with equity and acquisitionsof public firms paid for with cash. The change in yearly earnings forecastsnormalized by the stock price is significantly higher for private firmacquisitions paid for with equity than for public firm acquisitions paidfor with cash. However, the difference between public firm acquisitionspaid for with equity and public firm acquisitions paid for with cash isnot significant. In sum, changes in analyst forecasts are not supportiveof the Myers and Majluf (1984) prediction, since with that prediction thechange should be lowest for acquisitions of public firms paid for withequity. Of course, this conclusion is based on the assumption that thereare no systematic differences in synergies across acquisition types. For theevidence to be reconciled with Myers and Majluf, we would need to believethat somehow equity offers have greater synergy than cash offers. There isno basis in the literature to conclude this.
In summary, we find that proxies for information asymmetry helpexplain acquirer abnormal returns as predicted by the information
22
How Do Diversity of Opinion and Information Asymmetry Affect Acquirer Returns?
asymmetry models. Perhaps most importantly, we find that theannouncement return for cash offers for public firms increases withacquirer stock return volatility, a result that is inconsistent with diversity-of-opinion models if stock return volatility also proxies for diversity ofopinion. However, subsequent changes in analyst forecasts do not seemsupportive of the information asymmetry models.
5. Changes in Forecast Dispersion and Bidder Abnormal Returns
The information asymmetry models imply that investors learn fromcorporate actions, so that information asymmetry should fall following amerger announcement. Table 2 shows that the mean, but not the median,change in dispersion of analyst forecasts from before the announcementof an acquisition to after the announcement is significantly negative. Thischange in the dispersion of analyst forecasts makes it possible for thedispersion of analyst forecasts to proxy for resolution of uncertainty. Themodels of Pastor and Veronesi (2006) and Johnson (2004) predict a positiverelation between a firm’s value and uncertainty about its long-run expectedgrowth. We proxy for uncertainty regarding a firm’s long-run expectedgrowth with the dispersion of long-term growth analyst forecasts. We firstcompare the abnormal returns for bidders, where the change in dispersionis negative with the abnormal return for bidders where the change ispositive, ignoring the firms where the change is zero. The bidders with adecrease in dispersion of analyst forecasts have lower abnormal returns by1.26% on average for acquisitions of public firms paid for with equity. Afterthe beginning of 1998 the difference is a relatively large 3%. In contrast,for private firms paid for with equity, bidders experience abnormal returnsthat are 1.22% higher when the dispersion of analyst forecasts decreasesas opposed to increases during the full sample period. While the formerresult is consistent with resolution-of-uncertainty models, the latter is not.
In Panel A of Table 5, we add to regression (2) of Panel A of Table 3 thedispersion of analyst forecasts in month t + 1. The change in dispersionhas a correlation of −0.2 with the level of the dispersion of analystforecasts. Consequently, firms with high dispersion of analyst forecastsare expected to see a drop in their dispersion of analyst forecasts. Toaccount for this, we also add to the regression the median analyst forecastat t − 1 and the median analyst forecast at t + 1. We see that all fourvariables are significant. A decrease in dispersion of analyst forecasts isassociated with a worse abnormal return as predicted. Further, an increasein analyst forecasts is associated with a better abnormal return. This resultis supportive of Myers and Majluf (1984), but it could also mean thatanalysts become more pessimistic when an offer is poorly received by themarket. In regression (2), we add idiosyncratic volatility to model (1).Its coefficient is significantly negative. Regression (2) demonstrates that
23
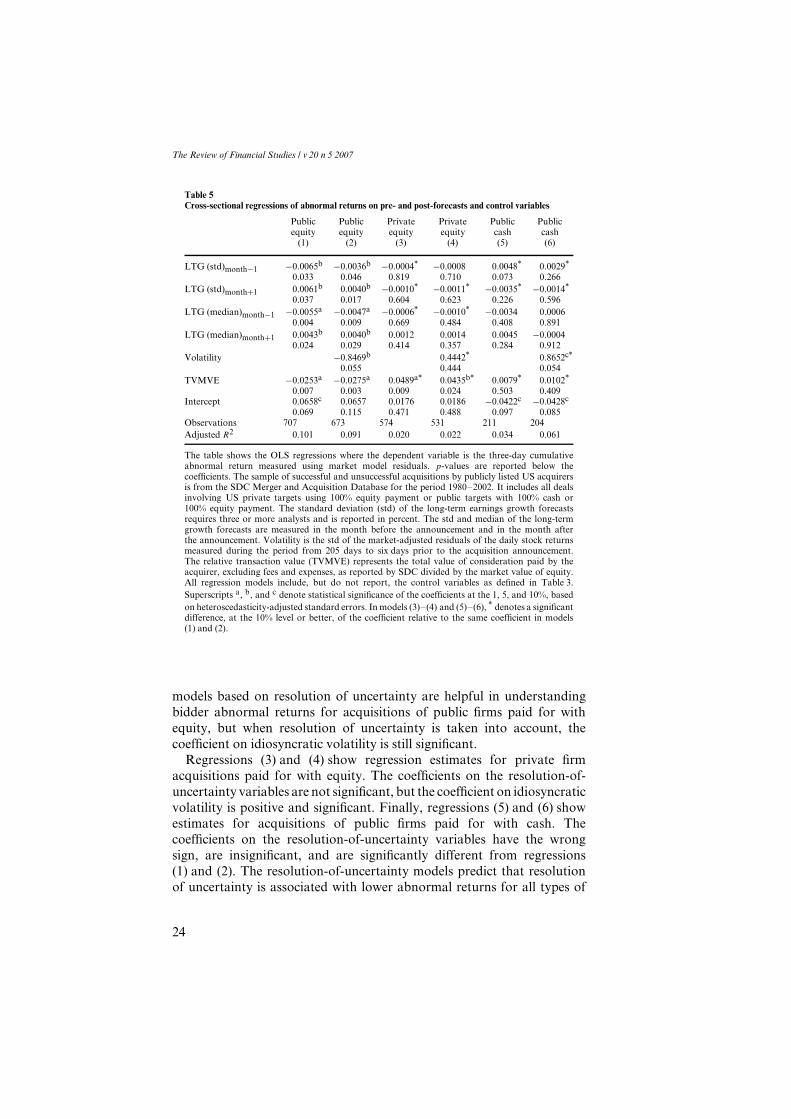
The Review of Financial Studies / v 20 n 5 2007
Table 5Cross-sectional regressions of abnormal returns on pre- and post-forecasts and control variables
Public Public Private Private Public Publicequity equity equity equity cash cash
(1) (2) (3) (4) (5) (6)
LTG (std)month−1 −0.0065b −0.0036b −0.0004* −0.0008 0.0048* 0.0029*
0.033 0.046 0.819 0.710 0.073 0.266LTG (std)month+1 0.0061b 0.0040b −0.0010* −0.0011* −0.0035* −0.0014*
0.037 0.017 0.604 0.623 0.226 0.596LTG (median)month−1 −0.0055a −0.0047a −0.0006* −0.0010* −0.0034 0.0006
0.004 0.009 0.669 0.484 0.408 0.891LTG (median)month+1 0.0043b 0.0040b 0.0012 0.0014 0.0045 −0.0004
0.024 0.029 0.414 0.357 0.284 0.912Volatility −0.8469b 0.4442* 0.8652c*
0.055 0.444 0.054TVMVE −0.0253a −0.0275a 0.0489a* 0.0435b* 0.0079* 0.0102*
0.007 0.003 0.009 0.024 0.503 0.409Intercept 0.0658c 0.0657 0.0176 0.0186 −0.0422c −0.0428c
0.069 0.115 0.471 0.488 0.097 0.085Observations 707 673 574 531 211 204Adjusted R2 0.101 0.091 0.020 0.022 0.034 0.061
The table shows the OLS regressions where the dependent variable is the three-day cumulativeabnormal return measured using market model residuals. p-values are reported below thecoefficients. The sample of successful and unsuccessful acquisitions by publicly listed US acquirersis from the SDC Merger and Acquisition Database for the period 1980–2002. It includes all dealsinvolving US private targets using 100% equity payment or public targets with 100% cash or100% equity payment. The standard deviation (std) of the long-term earnings growth forecastsrequires three or more analysts and is reported in percent. The std and median of the long-termgrowth forecasts are measured in the month before the announcement and in the month afterthe announcement. Volatility is the std of the market-adjusted residuals of the daily stock returnsmeasured during the period from 205 days to six days prior to the acquisition announcement.The relative transaction value (TVMVE) represents the total value of consideration paid by theacquirer, excluding fees and expenses, as reported by SDC divided by the market value of equity.All regression models include, but do not report, the control variables as defined in Table 3.Superscripts a, b, and c denote statistical significance of the coefficients at the 1, 5, and 10%, basedon heteroscedasticity-adjusted standard errors. In models (3)–(4) and (5)–(6), * denotes a significantdifference, at the 10% level or better, of the coefficient relative to the same coefficient in models(1) and (2).
models based on resolution of uncertainty are helpful in understandingbidder abnormal returns for acquisitions of public firms paid for withequity, but when resolution of uncertainty is taken into account, thecoefficient on idiosyncratic volatility is still significant.
Regressions (3) and (4) show regression estimates for private firmacquisitions paid for with equity. The coefficients on the resolution-of-uncertainty variables are not significant, but the coefficient on idiosyncraticvolatility is positive and significant. Finally, regressions (5) and (6) showestimates for acquisitions of public firms paid for with cash. Thecoefficients on the resolution-of-uncertainty variables have the wrongsign, are insignificant, and are significantly different from regressions(1) and (2). The resolution-of-uncertainty models predict that resolutionof uncertainty is associated with lower abnormal returns for all types of
24

How Do Diversity of Opinion and Information Asymmetry Affect Acquirer Returns?
offers. Consequently, the evidence in regressions (3)–(6) is not supportiveof these models.12
6. Understanding Differences in Acquirer Abnormal Returns Across OfferTypes
The existence of large differences in average abnormal returns among thethree types of acquisitions we focus on (shown in Table 2 for our sample)are well known (see, for instance, the references in Moeller, Schlingemann,and Stulz (2004)). In this section, we investigate whether these differencesin abnormal returns across offer types can be understood using ourproxies for diversity of opinion, information asymmetry, and resolutionof uncertainty.
To examine whether models that focus on diversity of opinion canexplain these differences, we proceed as follows. We first estimate a pooledregression with all acquisitions for which we have proxies for diversity ofopinion derived from analyst forecasts. We regress the abnormal returnson an intercept, a dummy variable for cash offers of public targets, anda dummy variable for equity offers of private targets. Regression (1) inTable 6 shows that the intercept is significantly negative and each of thedummy variables is significantly positive, so that the abnormal returns fordifferent offer types are significantly different from each other. We thenexpand the regression by adding the dispersion of analyst forecasts andinteractions of the dispersion of analyst forecasts with the two dummyvariables. Regression (2) shows that private firm acquisitions still havea significantly unconditional higher abnormal return than public firmacquisitions paid for with equity (difference of 3.85% with a p-value<0.001). However, the cash acquisitions of public firms do not have anunconditionally higher abnormal return than the equity acquisitions ofpublic firms. While cash offers have a higher abnormal return of 2.52%with a p-value smaller than 0.001 when not controlling for the dispersionof analyst forecasts, the difference falls to 0.69% with a p-value of 0.357when doing so. An even more dramatic change occurs when controlling forbreadth of ownership since the difference falls from 2.64 to −1.06% (notreported). Finally, regression (3) adds the control variables. Again, theprivate firm acquisition dummy variable is significantly positive, but thedummy for public firm acquisitions paid for with cash is not. In summary,
12 A concern with our results is that the post-announcement forecasts might be difficult to interpret becauseit is not completely clear how analysts take into account the impact of the acquisition on long-term growthif the merger has not been completed when these forecasts are made. From conversations with personnelat I/B/E/S and sell-side analysts, we understand that forecasts do not incorporate the specific acquisitionif the offer is not completed but may take into account the general implications of the offer for the firmas a stand-alone entity. To ensure this issue is not driving our results, we rerun the test with a sample ofoffers where the merger completion predates the publication of the post-announcement forecasts. We findsimilar, but stronger, results.
25

The Review of Financial Studies / v 20 n 5 2007
Tab
le6
Cro
ss-s
ecti
onal
regr
essi
ons
ofab
norm
alre
turn
sus
ing
paym
enta
ndta
rget
type
indi
cato
rs
(1)
(2)
(3)
(4)
(5)
(6)
(7)
(8)
(9)
(Pri
vate
|Equ
ity)
indi
cato
r0.
0475
a0.
0385
a0.
0248
a0.
0534
a−0
.005
9−0
.011
70.
0469
a0.
0417
a0.
0239
a
0.00
00.
000
0.00
00.
000
0.58
50.
288
0.00
00.
000
0.00
8(P
ublic
|Cas
h)in
dica
tor
0.02
52a
0.00
69−0
.004
40.
0274
a−0
.001
−0.0
101
−0.0
247a
0.00
95−0
.002
80.
000
0.35
70.
622
0.00
00.
907
0.24
90.
000
0.19
60.
759
LT
G(s
td) m
onth
−1−0
.002
9b−0
.003
0b−0
.006
3b−0
.007
1a
0.01
20.
012
0.01
80.
005
LT
G(s
td) m
onth
−1×
(Pri
vate
|Equ
ity)
0.00
230.
0028
c0.
0060
c0.
0068
b
0.10
00.
055
0.06
00.
029
LT
G(s
td) m
onth
−1×
(Pub
lic|C
ash)
0.00
47b
0.00
50b
0.01
03b
0.01
05a
0.02
00.
011
0.01
10.
006
Vol
atili
ty−0
.217
2−0
.028
90.
376
0.91
6V
olat
ility
×(P
riva
te|E
quit
y)1.
4590
a1.
3128
a
0.00
00.
000
Vol
atili
ty×
(Pub
lic|C
ash)
1.07
87a
0.75
22b
0.00
20.
030
LT
G(s
td) m
onth
+10.
0042
0.00
47c
0.10
20.
066
LT
G(s
td) m
onth
+1×
(Pri
vate
|Equ
ity)
−0.0
039
−0.0
044
0.20
90.
157
LT
G(s
td) m
onth
+1×
(Pub
lic|C
ash)
−0.0
067
−0.0
066c
0.10
10.
093
26

How Do Diversity of Opinion and Information Asymmetry Affect Acquirer Returns?
TV
MV
E−0
.020
2b−0
.021
6a−0
.020
9b
0.02
70.
000
0.03
2T
VM
VE
×(P
riva
te|E
quit
y)0.
0339
b0.
0223
a0.
0663
a
0.03
30.
000
0.00
1T
VM
VE
×(P
ublic
|Cas
h)0.
0206
0.02
10a
0.02
030.
115
0.00
30.
144
Inte
rcep
t−0
.028
6a−0
.016
4a−0
.038
5a−0
.022
9a−0
.016
5a−0
.018
7−0
.028
9a−0
.013
7b−0
.044
8a
0.00
00.
001
0.00
20.
000
0.00
70.
215
0.00
00.
014
0.00
1O
bser
vati
ons
1545
1545
1538
3880
3880
3844
1499
1499
1492
Adj
uste
dR
20.
052
0.05
90.
078
0.04
30.
073
0.09
80.
053
0.06
70.
081
The
tabl
egi
ves
the
OL
Sre
gres
sion
sw
here
the
depe
nden
tva
riab
leis
the
thre
e-da
ycu
mul
ativ
eab
norm
alre
turn
mea
sure
dus
ing
mar
ket
mod
elre
sidu
als.
p-v
alue
sar
ere
port
edbe
low
the
coef
ficie
nts.
The
sam
ple
ofsu
cces
sful
and
unsu
cces
sful
acqu
isit
ions
bypu
blic
lylis
ted
US
acqu
irer
sis
from
the
SDC
Mer
ger
and
Acq
uisi
tion
Dat
abas
efo
rth
epe
riod
1980
–20
02.
itin
clud
esal
lde
als
invo
lvin
gU
Spr
ivat
eta
rget
sus
ing
100%
equi
typa
ymen
t(P
riva
te|E
quit
y)or
publ
icta
rget
sw
ith
100%
cash
(Pub
lic|C
ash)
or10
0%eq
uity
paym
ent
(Pub
lic|E
quit
y).T
hest
anda
rdde
viat
ion
(std
)of
the
long
-ter
mea
rnin
gsgr
owth
fore
cast
sre
quir
esth
ree
orm
ore
anal
ysts
and
isre
port
edin
perc
ent.
LT
G(s
td)
mon
th+1
ism
easu
red
afte
rth
ean
noun
cem
ent
and
LT
G(s
td)
mon
th−1
ism
easu
red
befo
reth
ean
noun
cem
ent.
Vol
atili
tyis
the
std
ofth
em
arke
t-ad
just
edre
sidu
als
ofth
eda
ilyst
ock
retu
rns
mea
sure
ddu
ring
the
peri
odst
arti
ngfr
om20
5da
ysto
six
days
prio
rto
the
acqu
isit
ion
anno
unce
men
t.T
here
lati
vetr
ansa
ctio
nva
lue
(TV
MV
E)
repr
esen
tsth
eto
talv
alue
ofco
nsid
erat
ion
paid
byth
eac
quir
er,
excl
udin
gfe
esan
dex
pens
esas
repo
rted
bySD
Cdi
vide
dby
the
mar
ketv
alue
ofeq
uity
.Reg
ress
ion
mod
els
(3),
(6),
and
(9)
incl
ude,
but
dono
tre
port
the
cont
rolv
aria
bles
asde
fined
inT
able
3.M
odel
(7)
rest
rict
sth
esa
mpl
eof
mod
el(1
)to
furt
her
incl
ude
data
onL
TG
for
the
mon
thaf
ter
the
anno
unce
men
t.M
odel
s(8
)an
d(9
)inc
lude
,but
dono
tre
port
,the
med
ian
ofth
elo
ng-t
erm
earn
ings
grow
thfo
reca
sts
mea
sure
din
the
mon
thbe
fore
and
afte
rth
ean
noun
cem
ent.
Res
pect
ivel
y,Su
pers
crip
tsa,
b,an
dc
deno
test
atis
tica
lsig
nific
ance
ofth
eco
effic
ient
sat
the
1,5,
and
10%
,bas
edon
hete
rosc
edas
tici
ty-a
djus
ted
stan
dard
erro
rs.
27

The Review of Financial Studies / v 20 n 5 2007
diversity-of-opinion variables can explain the difference between cash andequity offers for public firms, but not between equity offers for public firmsand equity offers for private firms.
We turn next to the ability of information asymmetry to explaindifferences in abnormal returns across offer types. We are able to usea larger sample when we do not use proxies for diversity of opinion derivedfrom analyst forecasts. In models (4) and (5), we proceed as we did withthe dispersion of analyst forecasts and the breadth of ownership and usethe largest possible sample of acquisitions. We find that when excludingour usual control variables and without controlling for idiosyncraticvolatility, the average abnormal return of cash offers for public firmsexceeds the average abnormal return of equity offers for public firms by2.74% with a p-value of less than 0.001. Taking into account idiosyncraticvolatility, this difference falls to −0.10% with a p-value of 0.907. While thedispersion of analyst forecasts and breadth of ownership fail to explain thehigher abnormal return of private firm acquisitions paid for with equity,idiosyncratic volatility seems successful in doing so. Without taking intoaccount idiosyncratic volatility, private firm acquisitions have a higherabnormal return than public firm acquisitions paid for with equity of5.34% with a p-value of less than 0.001. This difference falls to −0.59%with a p-value of 0.585 when we take into account idiosyncratic volatility.In other words, if idiosyncratic volatility is set equal to zero, there are nosignificant differences between the abnormal returns of the three types ofacquisitions. The last regression uses the interacted control variables andshows that our result continues to hold.
Finally, we consider the resolution-of-uncertainty models for complete-ness. We already found that we can reject these models. Here, we findthat they cannot explain the differences in abnormal returns across offertypes. As can be seen in Table 6, in regressions (7)–(9) the unconditionalabnormal return for announcements of acquisitions of private firms paidfor with equity is positive and significant when we take into accountresolution of uncertainty and our control variables.
7. Additional Robustness Checks of the Results and Their Interpretation
7.1 Do diversity of opinion and information asymmetry have a permanentimpact?An additional prediction coming out of the models in this article is that theeffects documented should be permanent. If the effects we document aretemporary, acquisitions of public firms by acquirers with high valuationsand high dispersion of analyst forecasts should have a higher abnormalreturn after the acquisition announcement of similar acquisitions byacquirers with high valuations and low dispersion of analyst forecasts. Wefind no evidence consistent with this prediction when we use abnormalreturns for the 20 days following the offer announcement.
28
How Do Diversity of Opinion and Information Asymmetry Affect Acquirer Returns?
Another approach to evaluate whether the effect we document istransitory is to estimate a regression of postannouncement returns onannouncement returns, dispersion of analyst forecasts, and dispersionof analyst forecasts interacted with announcement returns. Reversal ofthe announcement return would imply a negative coefficient on theannouncement return. Reversal of the effect we document requires anegative coefficient on the interaction of dispersion of analyst forecastsand the announcement return. When we estimate this regression (notreported) for offers to acquire public firms financed with equity, thecoefficient on the announcement return is 0.0220 with a p-value of 0.064,the coefficient on the interaction is −0.0164 with a p-value of 0.399, andthe coefficient on dispersion of analyst forecasts is −0.0040 with a p-valueof 0.168. Since the coefficient on the interaction is not significant, we findno evidence of reversal for equity offers for public firms. Surprisingly,though, when we estimate a similar regression for equity offers for privatefirms, the coefficient on the interaction is negative and significant.
7.2 Do the results hold for alternate definitions of returns?The abnormal returns used so far are estimated over a short window aroundthe announcement date. Offers often get revised, so that information aboutthe offer that we use in our regressions may become available later.13
Authors have also argued that the information revealed by the acquisitionannouncement does not necessarily get impounded in the stock price allat once. We therefore estimate our regressions using a different definitionof abnormal returns, the buy-and-hold returns from the day before theannouncement to the effective date. Our results hold for this alternatedefinition of returns.
7.3 Does diversity of analyst forecasts proxy for changes in analyst forecasts?Scherbina (2003) provides evidence that analyst forecasts dispersion isrelated to the prior performance of the firm. This raises the concern thatour measure of forecast dispersion could proxy for changes in the levelof forecasts or for the level of forecasts. To examine this possibility, weestimate, but do not report, regressions where we add changes in the long-term forecast as well as the level of the forecast. We first add the past-yearchange in the long-term growth forecast to regression (2) from Table 3,which includes the forecast dispersion and prior control variables. Theforecast dispersion remains significant with no change in the coefficient,while the past-year change is not significant. Finally, we add to thatregression the quarterly earnings surprise because Scherbina concludesthat analysts are too optimistic when dispersion is high. The quarterly
13 This is only a problem for the multiple regressions in which we control for deal characteristics. None ofour key conclusions are sensitive to the use of these controls.
29
The Review of Financial Studies / v 20 n 5 2007
earnings surprise is calculated as the actual quarterly earnings minusthe most recent median (mean) analyst forecast if the announcementoccurred during the period starting one month before the announcementand ending one month after the announcement. If no announcementoccurred in that period, the earnings surprise is zero. Adding the quarterlyearnings surprise does not change our results. We repeat these regressionsfor private firm acquisitions paid for with equity. The coefficient on thedispersion of long-term forecasts is insignificant in each model for privatefirm acquisitions.
8. Conclusion
Theoretical papers predict that acquirer abnormal returns should be relatedto proxies for diversity of opinion among investors and informationasymmetry. We find that abnormal returns for equity offers for publicfirms decrease as these proxies increase, whereas abnormal returns forother offer types are either unaffected or increase.
Though some of our results can be explained by both diversity-of-opinion models and information asymmetry models, and the evidenceis not completely consistent with any of the models, we uncover someresults that can be explained only by models that emphasize informationasymmetry. This suggests that these models may offer a more completeaccount of the overall evidence than diversity-of-opinion models. This isspecifically the case for our finding that the abnormal return associatedwith acquisitions of public firms paid for with cash significantly increaseswith some measures of information asymmetry or diversity of opinion.
It is well known that the three types of acquisitions we focus on in thisarticle have significantly different average abnormal returns. The existingliterature has not succeeded in explaining these differences. We find that thedispersion of analyst forecasts and the breadth of ownership are successfulin explaining the difference in abnormal returns between cash and equityacquisitions of public firms but not between equity acquisitions of publicfirms and of private firms. Strikingly, however, differences in abnormalreturns between acquisition types can be explained by differences in therelation between abnormal returns and idiosyncratic volatility across offertypes.
ReferencesAnderson, A. M., and E. Dyl. 2004. Determinants of Premiums on Self-Tender Offers. FinancialManagement 33:25–45.
Baker, M., J. D. Coval, and J. C. Stein. 2006. Corporate Financing Decisions When Investors Take thePath of Least Resistance. Journal of Financial Economics 84:266–98.
Boehme, R.D., B. R. Danielsen, and S. M. Sorescu. 2006. Short Sale Constraints, Differences of Opinion,and Overvaluation. Journal of Financial and Quantitative Analysis 41:455–87.
30

How Do Diversity of Opinion and Information Asymmetry Affect Acquirer Returns?
Brown, S. J., and J. B. Warner. 1985. Using Daily Stock Returns, the Case of Event Studies. Journal ofFinancial Economics 14:3–31.
Chen, J., H. Hong, and J. C. Stein. 2002. Breadth of Ownership and Stock Returns. Journal of FinancialEconomics 66:171–205.
Danielsen, B. R., and S. M. Sorescu. 2001. Why Do Option Introductions Depress Stock Prices? A Studyof Diminishing Short Sale Constraints. Journal of Financial and Quantitative Analysis 36:451–84.
Diamond, D. D., and R. E. Verrecchia. 1987. Constraints on Short-Selling and Asset Price Adjustment toPrivate Information. Journal of Financial Economics 18:277–311.
Dierkens, N. 1991. Information Asymmetry and Equity Issues. Journal of Financial and QuantitativeAnalysis 26:181–200.
Diether, K. B. 2004. Long-Run Event Performance and Opinion Divergence. Working Paper, The OhioState University.
Diether, K. B., C. J. Malloy, and A. Scherbina. 2002. Differences of Opinion and the Cross Section ofStock Returns. Journal of Finance 57:2213–41.
Gebhardt, W. R., C. M. Lee, and B. Swaminathan. 2001. Toward an Implied Cost of Capital. Journal ofAccounting Research 39:135–76.
Gompers, P. A., J. L. Ishii, and A. Metrick. 2003. Corporate Governance and Equity Prices. QuarterlyJournal of Economics 118:107–55.
Hertzel, M. G., and R. L. Smith. 1993. Market Discounts and Shareholder Gains for Placing EquityPrivately. Journal of Finance 48:459–85.
Hong, H., T. Lim, and J. C. Stein. 2000. Bad News Travels Slowly: Size, Analyst Coverage, and theProfitability of Momentum Strategies. Journal of Finance 55:265–95.
Hong, H., J. Scheinkman, and W. Xiong. 2006. Asset Float and Speculative Bubbles. Journal of Finance61:1073–117.
Jain, P. C. 1992. Equity Issues and Changes in Expectations of Earnings by Financial Analysts. Review ofFinancial Studies 5:669–83.
Johnson, T. C. 2004. Forecast Dispersion and the Cross-Section of Returns. Journal of Finance 59:1957–78.
Jovanovic, B., and S. Braguinsky. 2004. Bidder Discounts and Target Premia in Takeovers. AmericanEconomic Review 94:46–56.
Krasker, W. C. 1986. Stock Price Movements in Response to Stock Issues Under Asymmetric Information.Journal of Finance 41:93–106.
La Porta, R. 1996. Expectations and the Cross-Section of Stock Returns. Journal of Finance 51:1715–42.
Masulis, R. W., C. Wang, and F. Xie. 2007. Corporate Governance and Acquirer Returns. Journal ofFinance 62:1851–89.
McCardle, K. F., and S. Viswanathan. 1994. The Direct Entry versus Takeover Decision and Stock PricePerformance around Takeovers. Journal of Business 67:1–43.
Miller, E. M. 1977. Risk, Uncertainty, and Divergence of Opinion. Journal of Finance 32:1151–68.
Moeller, S. B., F. P. Schlingemann, and R. M. Stulz. 2004. Firm Size and the Gains from Acquisitions.Journal of Financial Economics 73:201–28.
Myers, S. C., and N. S. Majluf. 1984. Corporate Financing and Investment Decisions When Firms HaveInformation That Investors Do Not Have. Journal of Financial Economics 13:187–221.
Pastor, L., and P. Veronesi. 2006. Was There a Nasdaq Bubble in the Late 1990s? Journal of FinancialEconomics 81:61–100.
Pound, J. 1988. The Information Effects of Takeover Bids and Resistance. Journal of Financial Economics22:207–27.
31

The Review of Financial Studies / v 20 n 5 2007
Scherbina, A. 2003. Analyst Disagreement, Forecast Bias and Stock Returns. Working Paper, HarvardBusiness School.
Travlos, N. G. 1987. Corporate Takeover Bids, Methods of Payment, and Bidding Firms’ Stock Returns.Journal of Finance 42:943–63.
32