How do diversity and stability depend on productivity? The relation between plant species diversity...
13
How do diversity and stability depend on productivity? The relation between plant species diversity and productivity at a continental scale Mediterranean grassland 0 100 200 300 400 500 600 700 0 50 100 Biomass [ g m -2 ] Number of species North American prairie 0 10 20 30 40 50 60 70 Productivity Number of species Excessive Drainage Poor Australian vegetation 0 50 100 150 200 250 300 0 400 800 1200 Soil PO 4 [ppm] Number of species British herbs 0 5 10 15 20 25 30 35 0 1000 2000 3000 Plant biomass + litter Number of species Mediterranean plant plots 0 50 100 150 200 0 50 100 150 Rain [cm] Number of species
-
date post
19-Dec-2015 -
Category
Documents
-
view
217 -
download
1
Transcript of How do diversity and stability depend on productivity? The relation between plant species diversity...

How do diversity and stability depend on productivity?
The relation between plant species diversity and productivity at a
continental scale
Mediterranean grassland
0100200300400500600700
0 50 100
Biomass [ g m-2]
Num
ber
of
spe
cie
s
North American prairie
0
10
20
30
40
50
60
70
Productivity
Num
ber
of
spe
cie
s
Excessive Drainage Poor
Australian vegetation
050
100150200250300
0 400 800 1200Soil PO4 [ppm]
Num
ber
of
spe
cie
s
British herbs
05
101520253035
0 1000 2000 3000
Plant biomass + litter
Num
ber
of
spe
cie
s Mediterranean plant plots
0
50
100
150
200
0 50 100 150
Rain [cm]N
umb
er o
f sp
eci
es

The relation between animal species diversity
and productivity at a continental scale
Atlantic cumaceans
05
101520253035
0 1000 2000 3000 4000 5000
Depth [m]
Num
ber
of s
peci
es
Productivity
Tropical mammals
0
10
20
30
40
50
0 50 100 150 200
Productivity
Num
ber
of s
peci
es
Texas carnivores
10
12
14
16
18
20
0 1000 2000 3000
Productivity
Num
ber
of s
peci
es

0
50
100
150
200
250
0 500 1000 1500Evapotranspiration
SPalearctic birds
0
50
100
150
200
250
0 500 1000 1500Evapotranspiration
SPalearctic butterflies
Evapotranspiration is the sum of evaporation and transpiration, hence the total amount of water going from living organismas and the soil into the atmosphere.
It is a measure of total energy input

Bird species numbers are correlated with annual evapotranspiration and temperature.

Patterns of fish species richness in China’s lakes

Fish species richness scales significantly with altitude and maximum depth of a lake
Lake volume is of minor importance
020406080
100120140
1 10 100 1000 10000
Altitude [m]
S
R2 = 0.75
020406080
100120140
1 10 100 1000
Maximum depth [m]
S
R2 = 0.34
020406080
100120140
0.001 0.1 10 1000
Lake volume [108 m3]
S
020406080
100120140
0.1 10 1000 100000
Lake area [km2]
S
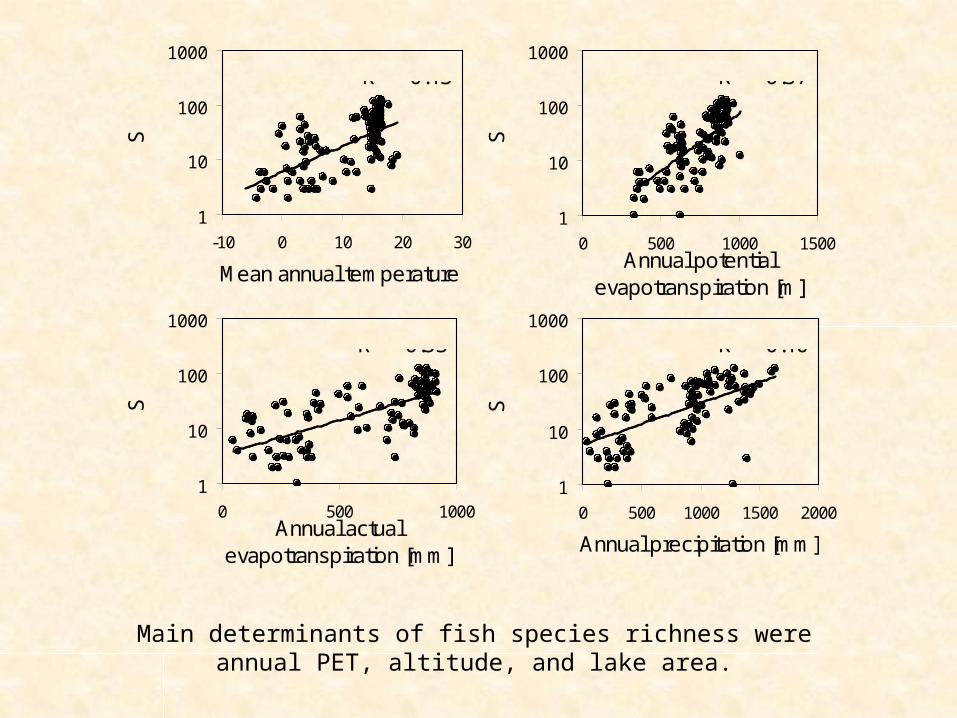
1
10
100
1000
-10 0 10 20 30
Mean annual temperature
S
R2 = 0.43
1
10
100
1000
0 500 1000 1500Annual potential
evapotranspiration [m]
S
R2 = 0.57
1
10
100
1000
0 500 1000Annual actual
evapotranspiration [mm]
S
R2 = 0.53
1
10
100
1000
0 500 1000 1500 2000
Annual precipitation [mm]
S
R2 = 0.40
Main determinants of fish species richness were annual PET, altitude, and lake area.

From local to global patterns of energy use of single speciesDefine:D: population densityW: individual body weight PET: potential evapotransirationM: individual metabolic rate (energy use) T: temperature
0.75
z
PET
M W ; Metabolic rate scales to body weight
D W ; Population density scales to body weight; 0.5<z<1
W e ; Body weight increases exponentially with evapotranspiration; 1
0.75 z 0.75 z
popM MD W W W
2z PET 0.75 z (0.75 z)z PET (0.75z z )PETpopM (e ) e e
Empirical results
Population energy use scales to body weight to -0.25 to 0.25, hence is roughly constant
Energy equivalence rule
Population energy use decreases or increases with evapotranspiration
Often it will be roughly constant
PET z z PETD (e ) e
Population densities should decrease with evapotranspiration
az T
T PET
D e
Population densities should
decrease with increasing temperature

If total biomass is at least stable or increases with evapotranspiration we can introduce species richness into the previous equations
PET z z PETD (e ) e
B PET
B SD
z PET z PETPET Se S PET e
Species richness should nonlinear increase with potential evapotranspiration

Global patterns in energy use and population characteristics in mammals as derived from the compilation of Currie and Fritz (1993).
0
2
4
6
8
10
12
14
0 0.5 1 1.5 2
Potential evapotranspiration [m / yr]lo
g (f
acto
r)
Total biomass
Individual energy use
Total energy use
Population energy use
0
2
4
6
8
10
0 0.5 1 1.5 2
Potential evapotranspiration [m / yr]
log
(fac
tor)
Population biomass
Population density
Species richness
Individual body weight

0
20
40
60
80
100
Humped Positive Negative U-shaped
None
Pe
rce
nt
z
Continental scale
0
20
40
60
80
100
Humped Positive Negative U-shaped
None
Pe
rce
nt
zRegional
0
20
40
60
80
100
Humped Positive Negative U-shaped
None
Pe
rce
nt
z
Local scale
Gillman, Wright (2006)
The influence of productivity on the species richness of plants

Productivity and stability
Are tropical populations more stable than populations in temperate or arctic regions?
0
1
2
3
4
5
0 20 40 60 80Latitude
CV
Taxon r PHemiptera 0.01 >0.1Hymenoptera -0.72 <0.01Lepidoptera -0.37 <0.001Falconiformes -0.85 <0.01Galliformes 0.22 >0.1Passeriformes -0.28 <0.01Strigiformes 0.7 >0.1Artiodactyla 0.21 >0.1Carnivora 0.71 <0.01Insectivora -0.09 >0.1Lagomorpha -0.99 <0.001Rodentia 0.32 <0.01
0
1
2
3
4
5
0 20 40 60 80
CV
There is no general latitudinal trend in population variability
Vazquez, Stevens 2004

Today’s reading
Global patterns in biodiversity:www.uesc.br/cursos/pos_graduacao/especializacao/biologia_florestas/insightnaturepadroes.pdf
Diversity and stability:www.biology.lsu.edu/webfac/kharms/12DivStabDivProd.ppt