How Cell Grow Ppt
25
1 1 Michigan Technological University David R. Shonnard Chapter 6: How Cells Grow David Shonnard Department of Chemical Engineering Michigan Technological University 2 Michigan Technological University David R. Shonnard Presentation Outline: ● Introduction ● Batch Growth Characteristics Growth Stages, Effects of Environmental Conditions, Product Formation, Mathematical Models ● Continuous Growth Characteristics Dilution Rate, Optimum Operation
-
Upload
milo-kai-hee -
Category
Documents
-
view
298 -
download
1
Transcript of How Cell Grow Ppt

1
1Michigan Technological UniversityDavid R. Shonnard
Chapter 6: How Cells Grow
David ShonnardDepartment of Chemical Engineering
Michigan Technological University
2Michigan Technological UniversityDavid R. Shonnard
Presentation Outline:
� Introduction
� Batch Growth Characteristics
Growth Stages, Effects of Environmental Conditions,
Product Formation, Mathematical Models
� Continuous Growth Characteristics
Dilution Rate, Optimum Operation

2
3Michigan Technological UniversityDavid R. Shonnard
Cell growth is the primary response of viable cells to substrates and nutrients.
Substrates/nutrients + cells → products + more cells
Product formation is a secondary response.
Introduction
specific growth rate (h-1), µ ≡ 1
X
dX
dtX = cell mass concentration (g / L)
t = time (h)
4Michigan Technological UniversityDavid R. Shonnard
Determining Cell Concentration
1. Cell number concentration
a) hemocytometer (Petroff-Hausser slide)
b) viable cell counts (petri dish)
c) electronic particle counter
“Bioprocess Engineering: Basic ConceptsShuler and Kargi, Prentice Hall, 2002

3
5Michigan Technological UniversityDavid R. Shonnard
Determining Cell Concentration (cont.)
2. Cell mass concentration
a) direct methods
→ dry weight (filtration or centrifugation)
→ packed cell volume (centrifugation)
→ optical density (light scattering, 600-700 nm)
6Michigan Technological UniversityDavid R. Shonnard
Determining Cell Concentration (cont.)
2. Cell mass concentration (cont.)
a) indirect methods
→ measure biomolecule concentration and correlate to dry cell mass concentration.
(DNA, protein, ATP, NADH, product formation)
Example 1. NH4+ utilization during growth releases H+, amount
of OH- added is proportional to growth.
Example 2. Luciferin + O2 + ATP lightluciferase

4
7Michigan Technological UniversityDavid R. Shonnard
Batch Growth Curve [Xo] [So]
Batch Reactor
X = cell Concentration(cells/mL)
Inoculum
growth medium (substrate + nutrients)
“Bioprocess Engineering: Basic ConceptsShuler and Kargi, Prentice Hall, 2002
8Michigan Technological UniversityDavid R. Shonnard
Lag Phase
→ no increase in cell numbers
→ induction of enzymes to utilized substrate(s)
→ very important to decrease lag period to ↑ productivity
i. Inoculate with exponential phase cells
ii. Pre-acclimate inoculum in growth media
iii. Use high cell inoculum size (5-10% by volume)

5
9Michigan Technological UniversityDavid R. Shonnard
Exponential Growth Phase
1. Nutrient and substrate concentrations are large
2. Growth rate is independent of nutrient and substrate conc.
3. Cell number and mass concentrations increase exponentially
4. Balanced growth occurs ⇒ cell composition constant
dX
dt = µmax X, X = Xo at t = 0
X = Xoeµ max t or ln
X
Xo
= µmax t
doubling time of cells (td ), XXo
= 2 ⇒ ln(2) = µmax td
td = ln 2
µmax
or µmax = ln 2
td
ln
X
Xo
t
o
oo
o
Slope = µmax
10Michigan Technological UniversityDavid R. Shonnard
Deceleration Phase
→ depletion of one or more nutrients
→ accumulation of toxic byproducts of growth
→ unbalanced growth and metabolism shifts for survival

6
11Michigan Technological UniversityDavid R. Shonnard
Stationary Phase
→ no net growth of cell numbers or cell mass (no cell division)
→ cell growth rate = cell death rate
→ secondary metabolites (products) produced
→ endogenous metabolism of energy stores can result in
maintaining cell viability
→ removal of inhibitory compounds will result in further growth
if additional substrate is provided
12Michigan Technological UniversityDavid R. Shonnard
Death Phase
1. Cell lysis (spillage) may occur
2. Rate of cell decline is first-order
3. Growth can be re-established by transferring to fresh media
dXdt
= - kd ’ t, ⇒ X = XS at t = 0
X = XS e-kd
’ t or lnX
Xo
= - kd ’ t

7
13Michigan Technological UniversityDavid R. Shonnard
(µmax - kd’ )
Effects of Temperature on Cell Growth
µmax = A e-Ea / RT and
kd’ = A’e-Ed / RT
Ea = activation energy for growth
≈ 10 to 20 kcal / mole
Ed = activation energy for death
≈ 60 to 80 kcal / mole
µmax doubles for each 10Û&�LQFUHDVH�QHDU�Topt
As T ↑, kd’ ↑ faster than µmax, (µmax- kd’) ↓
“Bioprocess Engineering: Basic Concepts, Shuler and Kargi, Prentice Hall, 2002
14Michigan Technological UniversityDavid R. Shonnard
pH Effects
→ acceptable pH is ± 1 to 2 pH units→ pH range varies by organism
bacteria (most) pH = 3 to 8yeast pH = 3 to 6plants pH = 5 to 6animals pH = 6.5 to 7.5
→ microorganism have the ability to control pH inside the cell, but this requires maintainance energy→ pH can change due to
• utilization of substrates; NH4+ releases H+, NO3
- consumes H+
• production of organic acids, amino acids, CO2, bases

8
15Michigan Technological UniversityDavid R. Shonnard
pH Effects (cont.)
“Bioprocess Engineering: Basic ConceptsShuler and Kargi, Prentice Hall, 2002
16Michigan Technological UniversityDavid R. Shonnard
Dissolved O2 Effects
→ O2 may be a limiting substrate for aerobic fermentation, since O2 is sparingly soluble in water
→ critical O2 concentration 5 to 10% of saturation (§ 7 mg O2/L) for bacteria/yeast
→ growth exhibits saturation kinetics with respect to O2
concentration (see next page)

9
17Michigan Technological UniversityDavid R. Shonnard
Dissolved O2 Effects (cont.)
Obligate aerobic cells
Facultativeaerobic cells
Saturation kinetics
Saturation kinetics
µ * =
µ - µmaxanaerobic
µmaxaerobic - µmax
anaerobic
“Bioprocess Engineering: Basic ConceptsShuler and Kargi, Prentice Hall, 2002
18Michigan Technological UniversityDavid R. Shonnard
Other Effects on Cell Growth
→ dissolved CO2 (DCO2); to high or low DCO2 is toxic
→ ionic strength (I); too high dissolved salts is inhibitory to membrane function (membrane transport of nutrients, osmotic pressure)
I = 1/2 Σ Ci Zi2
Ci = molar concentration of ion iZi = ion charge
→ maximum non-inhibitory concentrations of substrates, productsglucose (100 g/L), ethanol (10 g/L), NH4
+ (5 g/L), ..

10
19Michigan Technological UniversityDavid R. Shonnard
Stoichiometric Coefficients for Growth
Yield coefficients, Y, are defined based on the amount of consumption of another material
Growth Yield
Because ∆S changes with growth condition, YX/S is not a constant
YX / S = -
∆X
∆S
∆S = ∆Sassimilatedinto biomass
+ ∆Sassimilatedintoextracellularproducts
+ ∆Sgrowth energy + ∆Smaintenanceenergy
20Michigan Technological UniversityDavid R. Shonnard
Stoichiometric Coefficients for Growth (cont.)
Typical range of yield coefficients
Growth Yield
YX/S ≈ 0.4 to 0.6 g dry cells/g substrate consumedYX/S, oxidized S (0.4 to 0.6 ) < YX/S, reduced S (0.6 to 1.0)
Other Yield Coefficients:
YX/O2, reduced S (0.15 to 0.3 ) < YX/ O2, oxidized S (0.3 to 1.5)
YX / S = -
∆X
∆S
YX / O2
= -∆X
∆O2

11
21Michigan Technological UniversityDavid R. Shonnard
Stoichiometric Coefficients for Growth (cont.)
Other Yield Coefficients:
YX/ATP > complex medium (a.a.s and nucleic acids available)YX/ATP < minimal medium (only inorganic salts and substrate)
Anaerobic Fermentations:
YX/ATP § 10.5±2 (g dry cell wt./mole ATP)C6H6O6 → 2 C2H5OH + 2 CO2: 2 moles ATP/mole glucose
YX/S § YX/ATP (2)/MWglu = (10.5)(2)/180 = 0.12 g dcw/g glucose
YX / ATP =
∆X
∆ATP (
g dry cells
mole ATP generated)
22Michigan Technological UniversityDavid R. Shonnard
1. Growth associated products: products appear simultaneously
with cells in culture
2. Non-growth associated products: products appear during
stationary phase of batch growth
3. Mixed-growth associated products: products appear during
slow growth and stationary phase
Product Yield Coefficients
qP =
1
X
dP
dt = YP / X µ
qP = β
qP = αµ +β

12
23Michigan Technological UniversityDavid R. Shonnard
Product Yield Coefficients (cont.)
1. qP =
1
X
dP
dt = YP / X µ 2. qP = β 3. qP = α µ +β
“Bioprocess Engineering: Basic ConceptsShuler and Kargi, Prentice Hall, 2002
24Michigan Technological UniversityDavid R. Shonnard
Heat Generation by Growth
Only 40 to 50% of the energy stored in a carbon substrate is converted to biological energy (ATP) during aerobic metabolism. The
remainder is released as heat upon conversion to CO2 and H2O
Energy Balance:
Substrate + O2 CO2 + H2O
CO2 + H2O + Cells
Total Available
Energy of Substrate
I
= Energy Released
by Growth
II
+ Energy Available
in Biomass
III
I Combustion∆HS (kJ/g S)
II1/YH(kJ/g dcw)
III Combustion of Cells∆HC (kJ/g dcw)

13
25Michigan Technological UniversityDavid R. Shonnard
Heat Generation by Growth (cont.)
On a per gram of substrate basis
(1 g S) ∆HS = (1 g S) YX/S/YH + (1 g S) YX/S ∆HC
Solving for YH
Typical ∆HC = 20 to 25 kJ/g dcw
YH =
YX/ S
(∆HS - YX / S ∆HC )
26Michigan Technological UniversityDavid R. Shonnard
Heat Generation by Growth (cont.)
For Substrates:
S ∆HS (kJ/g S) YH (g dcw/kJ)
Glucose 15.64 0.072Methanol 22.68 0.029Ethanol 29.67 0.043n-Decane 47.64 0.038Methane 55.51 0.015
The oxidation state of S has a large effect on 1/ YH
14
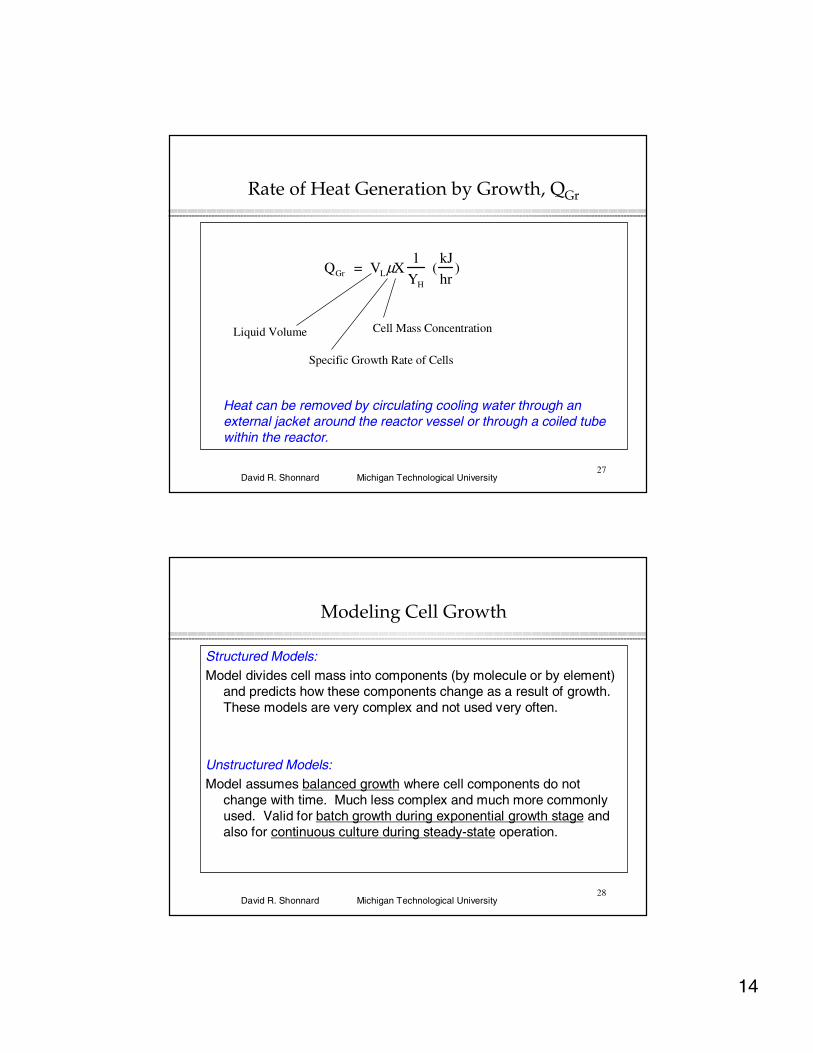
27Michigan Technological UniversityDavid R. Shonnard
Rate of Heat Generation by Growth, QGr
Heat can be removed by circulating cooling water through an external jacket around the reactor vessel or through a coiled tube within the reactor.
QGr = VLµX
1
YH
(kJ
hr)
Liquid Volume
Specific Growth Rate of Cells
Cell Mass Concentration
28Michigan Technological UniversityDavid R. Shonnard
Modeling Cell Growth
Structured Models:Model divides cell mass into components (by molecule or by element)
and predicts how these components change as a result of growth. These models are very complex and not used very often.
Unstructured Models:Model assumes balanced growth where cell components do not
change with time. Much less complex and much more commonly used. Valid for batch growth during exponential growth stage and also for continuous culture during steady-state operation.

15
29Michigan Technological UniversityDavid R. Shonnard
Monod Equation
Similar to Michaelis-Menten KineticsAssumes that a single enzyme system is responsible for the uptake of
substrate (S), and that S is limited (growth-dependent variable). This is the most common kinetic model for cell growth.
µ = specific cell growth rate (hr-1)µm = maximum specific cell growth rate (hr-1)
S = substrate concentration (g/L)KS = Saturation constant (g/L) = S when µ = 1/2 µm.
µ =
µm S
KS + S
30Michigan Technological UniversityDavid R. Shonnard
Batch Culture Growth Model
We relate changes in S to changes in X through YX/S
X - Xo = YX/S (So - S), orS = So + Xo/ YX/S - X/ YX/S
YX/S = cell mass yield (g dcw/g S consumed)Xo, So = initial concentrations of cells and substrate
µ =
1
X dX
dt =
µm S
KS + S
dX
dt =
µm (SoYX /S + Xo - X)
(KSYX/S + SoYX/ S + Xo - X)X ; at t = 0, X = Xo

16
31Michigan Technological UniversityDavid R. Shonnard
Batch Culture Growth Model (cont.)
Logistic Equation
(KSYX/S + SoYX/ S + Xo )
(SoYX/S + Xo )ln
X
Xo
-
KSYX/S
(SoYX/S + Xo )ln (SoYX / S + Xo - X)SoYX/S{ }= µm t
“Bioprocess Engineering: Basic Concepts, Shuler and Kargi, Prentice Hall, 2002
32Michigan Technological UniversityDavid R. Shonnard
Batch Growth Data and Monod Parameters
Though the Logistic Equation qualitatively predicts the shape of batch growth, it is not very useful when attempting to determine KS and µmax from X versus time data.
KS is determined differently.KS is equal to S when µ = 1/2 µmax
µ = 1/X dX/dt needs to bedetermined from available data, especially data at lowS concentrations.
ln
X
Xo
t
o
oo
o
Slope = µmaxo
o oXo + YX/S So
µ =
1
X
dX
dt
S
o
oo o
µ = 1/2 µmax
o
o oµmax
KS“Bioprocess Engineering: Basic ConceptsShuler and Kargi, Prentice Hall, 2002

17
33Michigan Technological UniversityDavid R. Shonnard
6.4 Cell Growth in Continuous Culture
Automated Chemostats
→ control ofpH, temp.agitation,dissolvedoxygen
→ sterilizationrequired
“Bioprocess Engineering: Basic ConceptsShuler and Kargi, Prentice Hall, 2002
34Michigan Technological UniversityDavid R. Shonnard
Chemostat as a Tool
→ evaluate KS, µmax, YX/S and other system parameters
→ study changes in environment and effects on cell physiology
→ select for cells with desired metabolic capabilities (e.g. selection for cells capable of degrading a toxic compound)
18
35Michigan Technological UniversityDavid R. Shonnard
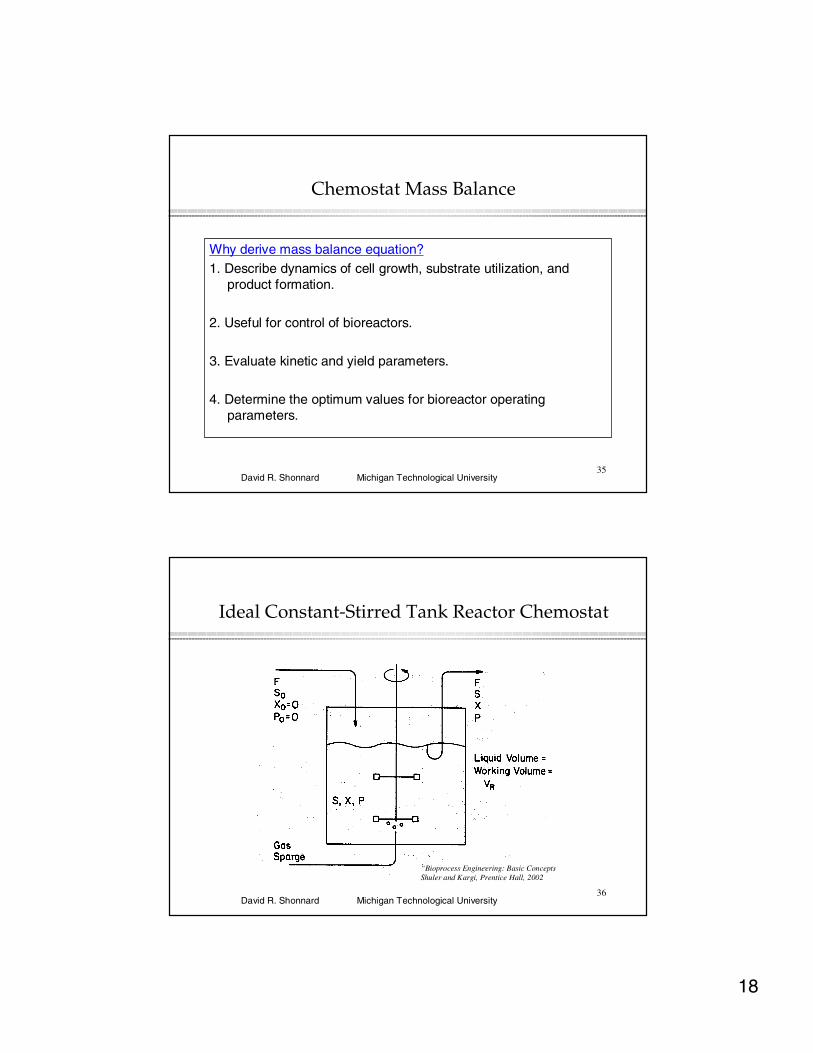
Chemostat Mass Balance
Why derive mass balance equation?1. Describe dynamics of cell growth, substrate utilization, and
product formation.
2. Useful for control of bioreactors.
3. Evaluate kinetic and yield parameters.
4. Determine the optimum values for bioreactor operating parameters.
36Michigan Technological UniversityDavid R. Shonnard
Ideal Constant-Stirred Tank Reactor Chemostat
“Bioprocess Engineering: Basic ConceptsShuler and Kargi, Prentice Hall, 2002
19
37Michigan Technological UniversityDavid R. Shonnard
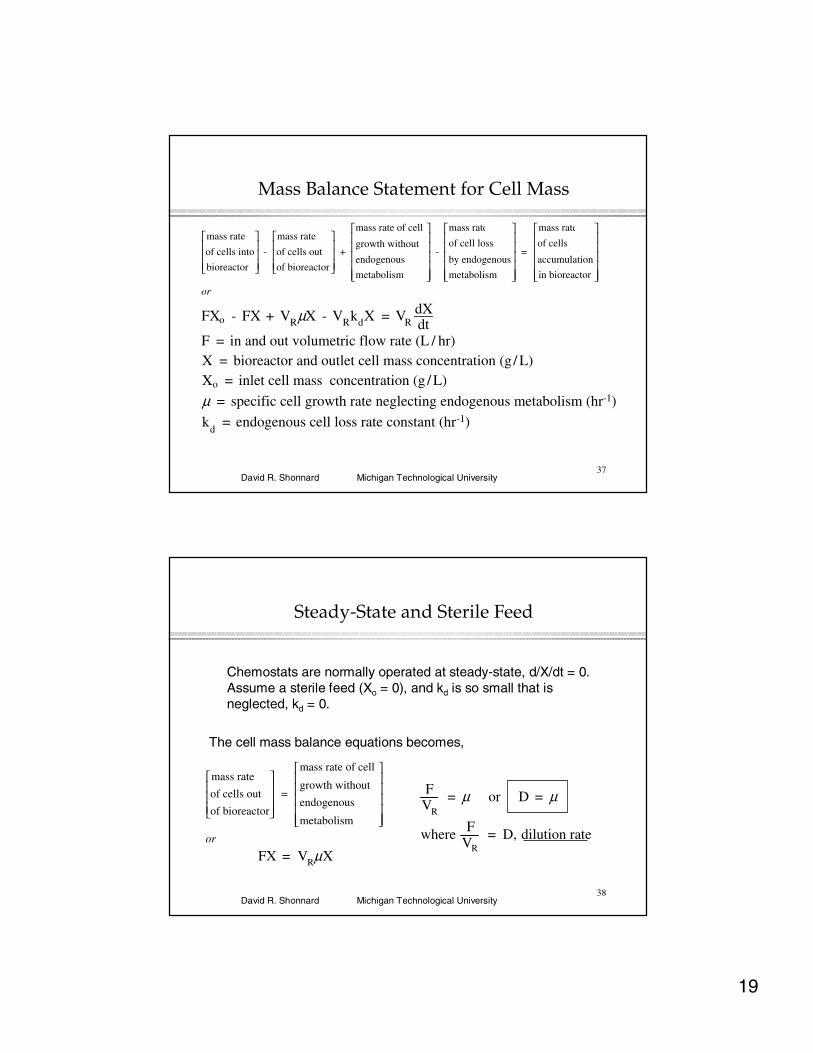
Mass Balance Statement for Cell Mass
mass rate
of cells into
bioreactor
-
mass rate
of cells out
of bioreactor
+
mass rate of cell
growth without
endogenous
metabolism
-
mass rate
of cell loss
by endogenous
metabolism
=
mass rate
of cells
accumulation
in bioreactor
or
FXo - FX + VRµX - VRkdX = VRdXdt
F = in and out volumetric flow rate (L / hr)X = bioreactor and outlet cell mass concentration (g / L)Xo = inlet cell mass concentration (g / L)
µ = specific cell growth rate neglecting endogenous metabolism (hr-1)
kd = endogenous cell loss rate constant (hr-1)
38Michigan Technological UniversityDavid R. Shonnard
Steady-State and Sterile Feed
Chemostats are normally operated at steady-state, d/X/dt = 0. Assume a sterile feed (Xo = 0), and kd is so small that is neglected, kd = 0.
The cell mass balance equations becomes,
mass rate
of cells out
of bioreactor
=
mass rate of cell
growth without
endogenous
metabolism
or
FX = VRµX
FVR
= µ or D = µ
where FVR
= D, dilution rate

20
39Michigan Technological UniversityDavid R. Shonnard
Substrate Concentration
Using the Monod Equation, we can predict the bioreactor and outlet stream concentration of Substrate.
µ = µ max S
KS + S = D
rearranging, S = KS D
µmax - D
40Michigan Technological UniversityDavid R. Shonnard
Bioreactor “Washout” Condition
There is an upper limit on D, or the cells will washed out of the bioreactor.
D ≤ µmax So
KS + So

21
41Michigan Technological UniversityDavid R. Shonnard
With Endogenous Metabolism
If endogenous metabolism is considered, it is left as an exercise for the students to show that (for kd � 0)
D = µ - kd
and
S = KS(D + kd )
µmax - D - kd
Why is S higher thanthe case when kd = 0?
Answer: X is lower!
42Michigan Technological UniversityDavid R. Shonnard
Cell Concentration
How is X affected by D? A similar mass balance equation for Sin the absence of endogenous metabolism is written to answer this question.
FSo - FS - VRµX 1YX /S
M - VRqpX 1
YP /S
= VRdSdt
S = bioreactor and outlet substrate concentration (g / L)So = inlet substrate concentration (g/ L)
YX /SM = maximum cell yield coefficient (g cells / g substrate)
YP/ S = product yield coefficient (g product / g substrate)
qp = specific rate of extracellular product formation g Pg cells •hr

22
43Michigan Technological UniversityDavid R. Shonnard
Cell Concentration (cont.)
For the simple case of no product formation (qp=0), steady-state (dS/dt=0), and no endogenous metabolism, kd=0.
D(So - S) = µXYX /S
M
at steady -state, µ = D, and solving for X,
X = YX/SM (So - S)
or
X = YX/SM (So -
KS Dµmax - D)
44Michigan Technological UniversityDavid R. Shonnard
Effects of Endogenous Metabolism
Thus far, the substrate balance eqn. Has been written assuming that YX/S is a constant at .
With endogenous metabolism, µ = D + kd
and with no extracellular product formation, the substrate mass balance is at steady-state,
where
maintenance coefficientbased on S.
YX / SM
D (So - S)X
- (D+ k
d)
YX/SM = 0
rearranging,
D (So - S)X - D
YX/SM -
kdY
X/SM = 0
and
DY
X /SAP - D
YX/SM -
kd
YX /SM = 0
1Y
X /SAP
= 1Y
X/SM
+ mSD
= 0 mS =
kd
YX /SM

23
45Michigan Technological UniversityDavid R. Shonnard
Measurement of Maximum Cell Yield and Maintenance using a Chemostat
From measurements of X, S, So, and D in a chemostatexperiment at different D values, a double reciprocal plot can be made.
with
mS =
kd
YX /SM
kd = mSYX/SM
M“Bioprocess Engineering: Basic ConceptsShuler and Kargi, Prentice Hall, 2002
46Michigan Technological UniversityDavid R. Shonnard
Using a Chemostat to Determine µmax and KS
From data collected using a chemostat, we can obtain the Monod Equation kinetic parameters.
Data include S at several Dilution Rates (D),Recall that,
D = µ − kd
D = µmax SKS + S
− kd
rearranging 1
D + kd
= 1µmax
+ KS
µmax
1S
1
D + kd
o
oo
o
1
S
slope =
KS
µmax
intercept =
1
µ max

24
47Michigan Technological UniversityDavid R. Shonnard
Productivity of a Chemostat
PrX = productivity for cell production = DXPrP = productivity for product formation = DP
The dilution rate (D) which maximizes productivity is found by taking dPr/dD = 0 and solving for D (Doptimum).
For example, Doptimum for X with kd = 0 and qP = 0
X = YX/ SM (So − KS D
µmax - D) ⇒ DX = YX /S
M D(So − KS Dµmax - D
)
take d(DX)dD
= 0 and solve for D (Dopt )
Dopt = µmax(1-KS
KS +So
) KS is usually << Sso Dopt ~ µmax (washout point)
48Michigan Technological UniversityDavid R. Shonnard
Product Mass Balance
FPo - FP + VRqPX = VR
dPdt
at steady - state, dP / dt = 0 and for Po = 0
DP = qPX or P = q
PX
D
for kd = 0, no endogenous metabolism
S = KS D
µmax - D from X mass balance
X = YX /SM (So - S)
D
(D + qP
YX/ SM
YP/S
) from S mass balance

25
49Michigan Technological UniversityDavid R. Shonnard
Product Mass Balance
for kd ≠ 0, with endogenous metabolism
S = KS (D + kd )
(µmax - D- kd ) from X mass balance
X = YX /SM (So - S)
D
(D + kd + qP
YX/SM
YP /S
) from S mass balance
to determine D for optimum P formation,
d(DP)dD
= 0 ⇒ solve for Dopt
50Michigan Technological UniversityDavid R. Shonnard
A Summary of Chemostat Response to D
Conc. ofX or S
D (hr-1)
So
washout at
D = µmax So
KS
+ So
DX (g/L•hr)
X
Dopt