How Can Multi-Detector SEC Inform our Knowledge …...Striegel, Yau, Kirkland, Bly, Modern...
50
How Can Multi-Detector SEC Inform our Knowledge of Mechanochemical Polymer Degradation? André M. Striegel National Institute of Standards & Technology
Transcript of How Can Multi-Detector SEC Inform our Knowledge …...Striegel, Yau, Kirkland, Bly, Modern...

How Can Multi-Detector SEC
Inform our Knowledge of
Mechanochemical Polymer
Degradation?
André M. Striegel
National Institute of Standards & Technology

Objectives
• Use size-exclusion chromatography with multi-angle static light scattering and viscometricdetection to study effects of polymer architecture on transient elongational flow degradation.
• Attempt to isolate effects of long-chain branching(LCB) and conformation on degradation.
• Use ultrasonication as representative transient elongational flow degradation technique.
• Combine multi-detector SEC and ultrasonicationto examine consequences for Mlim.

The Rayleigh-Plesset Equation
RR
RtPPpRRR g
24)(
1
2
30
2
2
2
dt
RdR
dt
dRR
bubbleradius of R
liquid ofdensity
liquid of tension surface
liquid ofviscosity kinematic
ressureexternal p dependenttimetP
essureambient prP
bubblere inside gas pressupg
)(
0

Adapted from K. S. Suslick, in Encyclopedia of Physical
Science and Technology, 3rd ed., R. A. Meyers, ed. (2001)
Ultrasonication

Temporal Evolution of Bubble Radius and Strain Rate
During Cavitational Bubble Collapse
Adapted from TQ Nguyen, H-H Kausch, Int. J. Polym. Anal. Charact., 4 (1998) 447

Interest in Ultrasonic Degradation
• Bubble collapse gives rise to large shear gradients responsible for ultrasound-induced bond scission.
• Collapse of cavitation bubble creates transient elongational flow.
• Two general types of flow fields:
– Shear
– Extensional
• Two types of extensional flow
– Steady state
– Transient elongational (a.k.a. fast transient)
• Note that shear field polymer degradation is extremely rare.

Interest in Ultrasonic Degradation
• Collapse of cavitation bubble creates transient elongational flow.
• In transient elongational flow, “dwell time” of fluid element very short compared to relaxation time of macromolecule.
• Results in non-random, near-midchain scission of linear polymers.
• Laboratory-created flow fields strictly analogous to those found in many real world scenarios.

Advantages of Ultrasonication
• Fluid mechanics and kinetics:
Comparable to other means of
generating transient elongational flows.a
• Relatively simple to isolate individual
experimental variables.
• Minimal sample consumption.
aTQ Nguyen, QZ Liang, H-H Kausch. Polymer, 38 (1997) 3783
TQ Nguyen, H-H Kausch. Adv. Poly. Sci., 100 (1992) 73
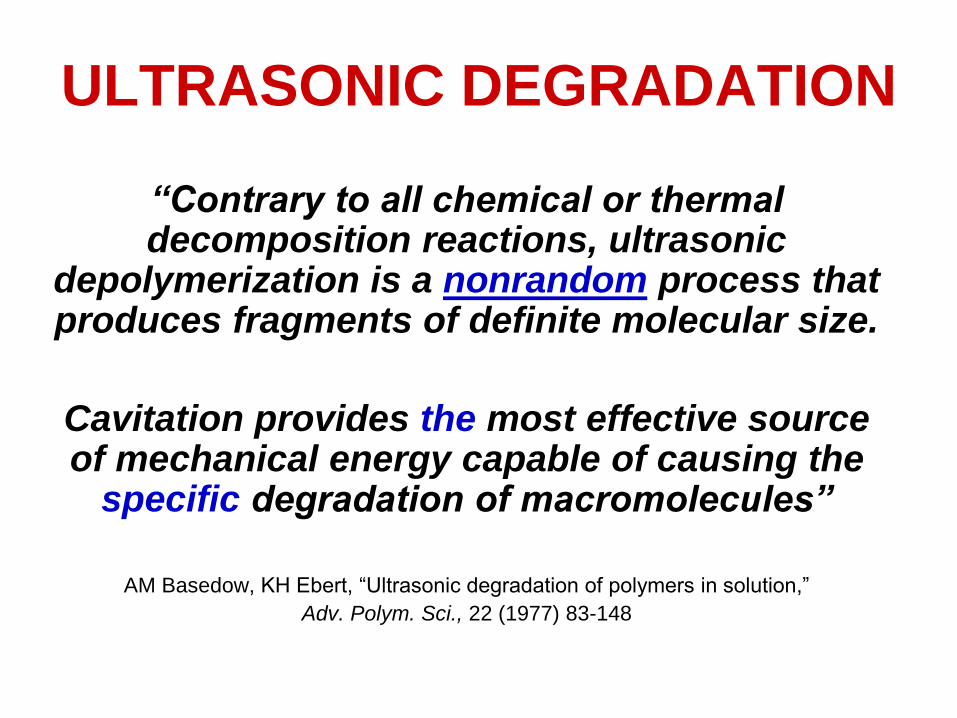
ULTRASONIC DEGRADATION
“Contrary to all chemical or thermal decomposition reactions, ultrasonic
depolymerization is a nonrandom process that produces fragments of definite molecular size.
Cavitation provides the most effective source of mechanical energy capable of causing the
specific degradation of macromolecules”
AM Basedow, KH Ebert, “Ultrasonic degradation of polymers in solution,”
Adv. Polym. Sci., 22 (1977) 83-148

Our Lab: The Last 15 Years
• AM Striegel, J. Biochem. Biophys. Methods 56 (2003) 117-139.
• AM Striegel, Biomacromolecules 8 (2007) 3944-3949.
• SG Ostlund, AM Striegel, Polym. Degrad. Stab. 93 (2008) 1510-1514.
• AM Striegel, J. Liq. Chromatogr. Rel. Technol. 31 (2008) 3105-3114.
• MJ Morris, AM Striegel, Polym. Degrad. Stab. 97 (2012) 2185-2194.
• AM Striegel, J. Chromatogr. A 1359 (2014) 147-155.
Influence of Long-Chain Branching
on
Transient Elongational Flow
Degradation

Ultrasonication of Branched Polymers
• Dextran (Lorimer et al. 1995, Côté & Willett 1999)
• Guar galactomannan (Tayal & Khan 2000)
• Xanthan (Sohn et al. 2001)
• Poly(vinyl acetate) (Madras et al. 2000, 2001…)
• Cellulose derivatives (Schittenhelm & Kulicke 2000)
• Starch derivatives (Schittenhelm & Kulicke 2000)
• Other long-chain branched glucans (Zhan et al. 2001)

POLYSTYRENE: Linear vs. Star
• 65,000 g/mol linear vs. 78,000 g/mol 8-arm star
(ea. arm: 9,800)
• 257,000 g/mol linear vs. 255,000 g/mol 3-arm star
(ea. arm: 85,000)
vs. 202,000 g/mol 8-arm star
(ea. arm: 25,300)
• 447,000 g/mol linear vs. 364,000 g/mol 8-arm star
(ea. arm: 45,500)
SG Ostlund, AM Striegel. Polym. Degrad. Stab., 93 (2008) 1510
AM Striegel. J. Biochem. Biophys. Methods, 56 (2003) 117

SEC/MALS/VISC/DRI
Solvent
Reservoir
(DMAc/0.5% LiCl)
Pump Injector Thermostatted
SEC columns
MALS
DRI VISC
Fluid connection
Electronic connection
47 kHz, 185 W

Comparison 1: PS-L 65 vs. PS-St8 9.8/78
• PS-L 65: Linear PS ~65,000 g/mol
• PS-St8 9.8/78: 8-arm star PS ~78,000 g/mol,
each arm ~9,800 g/mol

Results
• Sonicated for 4 hrs (240 min)
• PS-L 65:
– ~2% decrease in molar mass
– Increase in Mw/Mn from 1.001 to 1.004
– Decrease in []w from 0.22 to 0.21 dL/g
• PS-St8 9.8/78:
– No changes in MMD, polydispersities, etc.
• Conclusion:
“Limiting molar mass” 65,000 g/mol

Limiting Molar Mass, Mlim
• Molar mass beyond which macromolecules show no or negligible transient elongational flow-induced (ultrasonic) degradation
• Known to depend on chemical identity of polymer
• Also depends on physicochemical factors:
– Ultrasonic intensity
– Analyte concentration
– Solvent parameters: Ionic strength, temperature, viscosity, heat of vaporization, etc.
• Very limited information on architectural effects

Limiting Molar Mass, Mlim
Definition #1
A given polymer will not degrade in transient elongational
flow if M Mlim
or
Given two polymers of the same chemistry,
if M1 > Mlim and M2 Mlim,
Polymer 1 will degrade, but Polymer 2 will not.
For a given set of experimental conditions

Comparison 2: PS-L 257 vs. PS-St3 85/255
vs. PS-St8 25.3/202
• PS-L 257: Linear PS ~257,000 g/mol
• PS-St3 85/255: 3-arm star PS ~255,000
g/mol, each arm ~85,000 g/mol
• PS-St8 25.3/202: 8-arm star PS ~202,000
g/mol, each arm ~25,300 g/mol

20 22 24 26 28 30 32 34
0
1
2
3
1.298.90.35
1.449.20.36
1.9410.90.45
2.3011.90.51
2.4412.50.54
2.5112.80.56
2.5713.20.57
Mw x 105
(g/mol)
R
(nm)
[]w
(dL/g)
1.298.90.35
1.449.20.36
1.9410.90.45
2.3011.90.51
2.4412.50.54
2.5112.80.56
2.5713.20.57
Mw x 105
(g/mol)
R
(nm)
[]w
(dL/g)
0 min
10 min
20 min
40 min
120 min
DR
I R
es
po
ns
e (
arb
itra
ry u
nit
s)
Retention volume (mL)
PS-L 257
360 min
240 min
20 22 24 26 28 30 32 34
0
1
2
3
37 38 39 40 41 42 43 44 45 46 47 48 49 50 51
1.358.60.33
1.8510.20.39
2.1611.10.42
2.4612.10.46
2.4912.30.47
2.5212.30.47
2.5312.40.48
Mw x 105
(g/mol)
R
(nm)
[]w
(dL/g)
1.358.60.33
1.8510.20.39
2.1611.10.42
2.4612.10.46
2.4912.30.47
2.5212.30.47
2.5312.40.48
Mw x 105
(g/mol)
R
(nm)
[]w
(dL/g)
0 min
5 min
10 min
20 min
40 min
120 min
DR
I R
es
po
ns
e (
arb
itra
ry u
nit
s)
Retention volume (mL)
PS-St3 85/255
240 min
20 22 24 26 28 30 32 34
0
1
2
3
4
1.827.10.20
1.908.10.21
1.998.40.22
2.018.40.22
2.038.50.22
2.048.50.22
Mw x 105
(g/mol)
R
(nm)
[]w
(dL/g)
1.827.10.20
1.908.10.21
1.998.40.22
2.018.40.22
2.038.50.22
2.048.50.22
Mw x 105
(g/mol)
R
(nm)
[]w
(dL/g)
0 min
10 min
20 min
40 min
120 min
240 min
DR
I R
es
po
ns
e (
arb
itra
ry u
nit
s)
Retention volume (mL)
PS-St8 25.3/202
AM Striegel, J. Biochem. Biophys. Methods 56 (2003) 117-139

Comparison 3: PS-L 447 vs. PS-St8 45.5/364
• PS-L 447: Linear PS ~447,000 g/mol
• PS-St8 45.5/364: 8-arm star PS ~364,000
g/mol, each arm ~45,500 g/mol

0
1
2
3
4
5
20 22 24 26 28 30 32 34 36 38 40 42
0 min
5 min
10 min
360 min
20 min
DR
I R
es
po
ns
e (
arb
itra
ry u
nit
s)
40 min
120 min
240 min
600 min
PS-St8 45.5/364
Retention volume (mL)
[]w
(dL/g)
R
(nm)
Mw x 105
(g/mol)
0.38 13.0 3.81
0.36 12.6 3.58
0.36 12.3 3.40
0.34 11.5 2.97
0.33 11.1 2.84
0.31 9.9 2.24
0.27 8.4 1.66
0.24 7.2 1.11
0.22 6.2 0.73
20 22 24 26 28 30 32 34
0
1
2
3
0.887.10.26
1.348.70.32
3.0713.60.56
3.4814.80.62
4.0516.10.70
4.3216.40.73
4.4716.70.76
Mw x 105
(g/mol)
R
(nm)
[]w
(dL/g)
0.887.10.26
1.348.70.32
3.0713.60.56
3.4814.80.62
4.0516.10.70
4.3216.40.73
4.4716.70.76
Mw x 105
(g/mol)
R
(nm)
[]w
(dL/g)
0 min
5 min
10 min
20 min
40 min
DR
I R
es
po
ns
e (
arb
itra
ry u
nit
s)
Retention volume (mL)
120 min240 min
PS-L 447
AM Striegel, J. Biochem. Biophys. Methods 56 (2003) 117-139

Degradation of Linear vs. Star PS
• LCB appears to affect mechanism of degradation.
• Mechanism of degradation of high-M 8-arm star:
– Resembles degradation of intermediate-M 3-arm star more than it does degradation of intermediate-M 8-arm star.
• LCB effect on Mlim.

Revising the Definition of Mlim
• Need to include LCB effects on Mlim
• Propose (initially) that Mpath > Mlim
for ultrasonic degradation to occur.

“core”
“arm”
Marm » Mcore

If Marm > Mlim,
then degradation will occur
If Marm < Mlim, but 2Marm > Mlim,
then degradation will occur
But, if 2Marm < Mlim,
then no degradation occurs,
regardless of Mstar
Marm » Mcore

Marm < Mlim
Mlim 65 Kg/mol Marm 25.3 Kg/mol

2Marm Mlim
Mlim 65 Kg/mol 2Marm 50.6 Kg/mol

8Marm » Mlim
8Marm 202 Kg/molMlim 65 Kg/mol

Marm = 85.5 Kg/mol
2Marm = 171 Kg/mol » Mlim
20 22 24 26 28 30 32 34
0
1
2
3
37 38 39 40 41 42 43 44 45 46 47 48 49 50 51
0 min
5 min
10 min
20 min
40 min
120 min
DR
I Res
po
nse
(ar
bit
rary
un
its)
Retention volume (mL)
PS-St3 85/255
240 min
20 22 24 26 28 30 32 34
0
1
2
3
4
0 min
10 min
20 min
40 min
120 min
240 min
DR
I R
es
po
ns
e (
arb
itra
ry u
nit
s)
Retention volume (mL)
PS-St8 25.3/202
AM Striegel, J. Biochem. Biophys. Methods 56 (2003) 117-139

Limiting Molar Mass, Mlim
Definition #2
A continuous path of a given length must exist within a
polymer, such that, if Mpath > Mlim, the polymer will degrade
or
Given two polymers of the same chemistry and molar mass,
if Mpath1 > Mlim and Mpath 2 Mlim,
Polymer 1 will degrade, but Polymer 2 will not.
For a given set of experimental conditions

Monitoring Polymer Architecture
During Degradation
using
SEC/MALS/VISC/DRI

Polymer Conformation & Dimensionless Size
Radius of Gyration
31
10
3
AN
MR
i
cmiG Rrn
R2
1
1
.
Viscometric Radius
Random coil of homopolymers
Hard sphere
≈ 1.3
Rigid rod
0.3 – 0.4More extended
structure
More compact
structure
ri: location individual atom or group of atoms
Rcm: location of polymer center of mass
n: degree of polymerization
[]: intrinsic viscosity
M: molar mass
GR
R
Striegel, Yau, Kirkland, Bly, Modern Size-Exclusion Liquid Chromatography, 2nd ed. (Wiley, 2009)

Ultrasonic Degradation: Architectural Effects
0 60 120 180 240 300 360 420 480 540 600
0.6
0.7
0.8
0.9
zG
w
R
R
,
,
PS-L 65
PS-L 257
PS-L 447
Sonication time (min)
AM Striegel, J. Biochem. Biophys. Methods 56 (2003) 117-139
0 60 120 180 240 300 360 420 480 540 600
0.6
0.7
0.8
0.9
zG
w
R
R
,
,
PS-St3 85/255
PS-St8 25/202
PS-St8 46/364
Sonication time (min)

Calculating Degradation Rate Constants
o
ntn
M
kk
tkMM
'
'11
0,,
Mn,t = Number-average molar mass (in g/mol) after
t min of sonication
Mn,0 = Number-average molar mass (in g/mol) of
unsonicated sample (i.e, at t = 0 min)
t = Sonication time (in min)
Mo = Molar mass of repeat unit (for PS, 104 g/mol)
k = Degradation rate constant (in min-1)
SL Malhotra, “Ultrasonic solution degradations of poly(alkyl methacrylates),”
J. Macromol. Sci.-Chem., A, 23 (1986) 729-748.
Plot 1/Mn,t vs. t to obtain k and, consequently, k
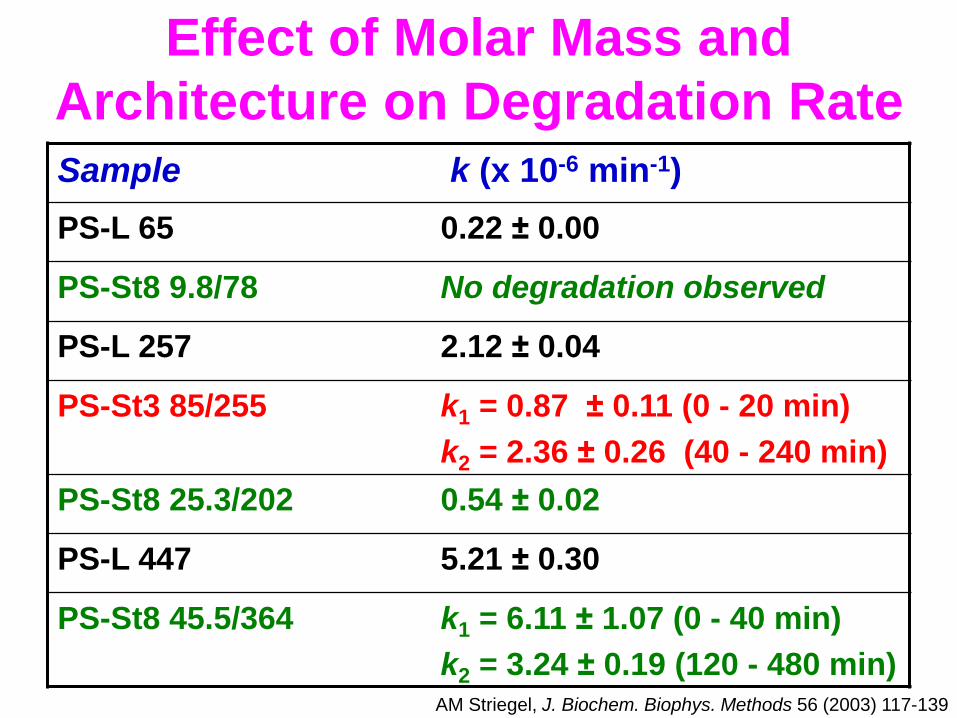
Effect of Molar Mass and
Architecture on Degradation Rate
Sample k (x 10-6 min-1)
PS-L 65 0.22 ± 0.00
PS-St8 9.8/78 No degradation observed
PS-L 257 2.12 ± 0.04
PS-St3 85/255 k1 = 0.87 ± 0.11 (0 - 20 min)
k2 = 2.36 ± 0.26 (40 - 240 min)
PS-St8 25.3/202 0.54 ± 0.02
PS-L 447 5.21 ± 0.30
PS-St8 45.5/364 k1 = 6.11 ± 1.07 (0 - 40 min)
k2 = 3.24 ± 0.19 (120 - 480 min)AM Striegel, J. Biochem. Biophys. Methods 56 (2003) 117-139

Influence of Chain Conformation on
Transient Elongational Flow
Degradation
SG Ostlund, AM Striegel. Polym. Degrad. Stab., 93 (2008) 1510
AM Striegel. Biomacromolecules, 8 (2007) 3944

Cellulose & Amylose
Structures
O
O
HO OH
O
HO
O
HO OH
HO
O
O
HO
O
OH
OH
O
HO
OH
OH( )n
mCellulose
-(14)
Amylose
-(14)
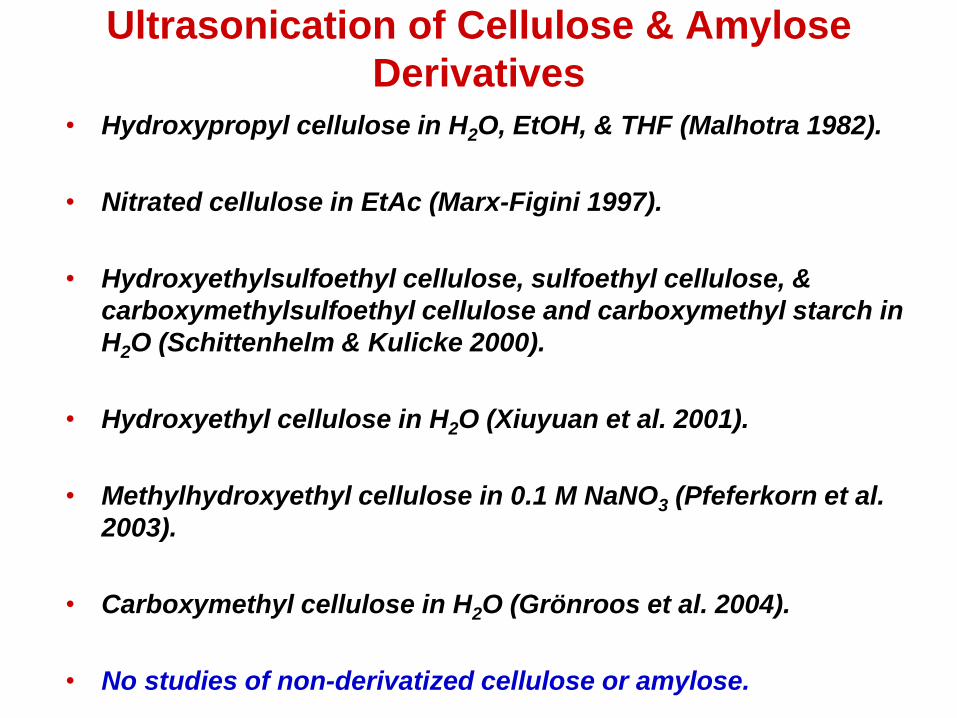
Ultrasonication of Cellulose & Amylose
Derivatives
• Hydroxypropyl cellulose in H2O, EtOH, & THF (Malhotra 1982).
• Nitrated cellulose in EtAc (Marx-Figini 1997).
• Hydroxyethylsulfoethyl cellulose, sulfoethyl cellulose, &
carboxymethylsulfoethyl cellulose and carboxymethyl starch in
H2O (Schittenhelm & Kulicke 2000).
• Hydroxyethyl cellulose in H2O (Xiuyuan et al. 2001).
• Methylhydroxyethyl cellulose in 0.1 M NaNO3 (Pfeferkorn et al.
2003).
• Carboxymethyl cellulose in H2O (Grönroos et al. 2004).
• No studies of non-derivatized cellulose or amylose.

Cellulose & Amylose
Molar Mass & Polydispersity
Sample Mn Mw Mz PDI
Cell 1 28,800 82,900 167,600 2.88
Cell 2 25,100 63,000 119,800 2.51
Cell 3 82,800 124,300 174,400 1.50
Cell 4 121,300 708,000 1,728,000 5.84
Amyl 1 83,400 148,300 245,600 1.78
Amyl 2 60,000 92,000 126,500 1.53
Data obtained using SEC/MALS, in DMAc/0.5% LiCl.
Mn, Mw, Mz in g/mol. PDI = Mw/Mn AM Striegel, Biomacromolecules, 8 (2007) 3944

Cellulose vs. Amylosea
104
105
106
0.0
0.5
1.0
1.5
2.0
Dif
fere
nti
al w
eig
ht
fra
cti
on
Molar mass (g/mol)
0 min
20 min
40 min
60 min
120 min
180 min
240 min
300 min
360 min
420 min
480 min
Amylose 1
aAmylose courtesy of Dr. Randy Shogren (USDA)
104
105
106
107
0.0
0.2
0.4
0.6
0.8
1.0
Dif
fere
nti
al w
eig
ht
fra
cti
on
Molar mass (g/mol)
0 min
40 min
120 min
180 min
420 min
780 min
Cellulose 4
AM Striegel, Biomacromolecules, 8 (2007) 3944

Mlim: Cellulose vs. Amylose
Mlim (g/mol)
Cellulose ~200,000
Amylose ~40,000
AM Striegel, Biomacromolecules, 8 (2007) 3944

Degradation of Cellulose vs. Amylose
• Cellulose & amylose are both linear polymers.
• Both are composed of D-anhydroglucose repeat
units.
• Both are (14)-linked polysaccharides.
• Anomeric configuration:
O
O
HO OH
O
HO
O
HO OH
HO
O
O
HO
O
OH
OH
O
HO
OH
OH
in amylose In cellulose

Degradation of Cellulose vs. Amylose
• -(14) linked cellulose known to be
a stiffer (more “rod-like”) polymer than
-(1 4) linked amylose.
•
• REM: Path length effect.
)(5 limlim
amylosecellulose MM

Persistence Length, Lp
Lpr
Î1
nl
Ln
i
p as ,ˆˆ
11
11 I
I
The chains of stiffer (“rod-like”)
polymers “persist” for longer
in the direction of the first statistical
repeat unit than do the chains of
more flexible (“coil-like”) polymers.
I.e., a stiff, rod-like polymer will have
a longer persistence length Lp
than will a flexible, coil-like polymer.
We can determine the persistence
length Lp using SEC/MALS.

Persistence Length, Lp
M
ML
L
M
R
M Lp
p
L
G2
31
32/12/1
2
Lpr
Î1
2/1
2
GR
M
1/M
2/1)3(2
3LpL MLM
2/1
3
p
L
L
M
Lpcellulose = 55 3 nm
Lpamylose = 11 2 nm
AM Striegel, Biomacromolecules, 8 (2007) 3944
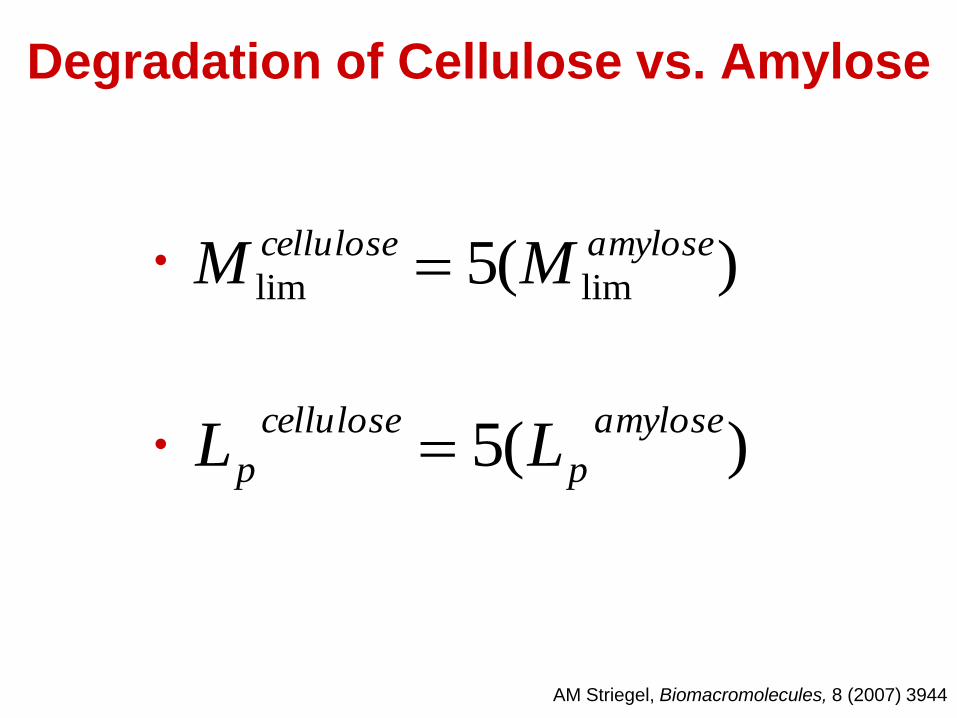
Degradation of Cellulose vs. Amylose
•
•
)(5 limlim
amylosecellulose MM
)(5amylose
p
cellulose
p LL
AM Striegel, Biomacromolecules, 8 (2007) 3944

Limiting Molar Mass, Mlim
Definition #3
For a polymer to degrade, a continuous path of a given length
and flexibility must exist within the polymer.
This path can be characterized by the persistence length, Lp,
so that:
Given two polymers of the same chemistry,
For a given set of experimental conditions
2
1
2
1
lim
lim
M
M
L
L
p
p

Ultrasonic Degradation: Architectural Effects
aAM Striegel, Biomacromolecules, 8 (2007) 3944; J. Biochem. Biophys. Methods, 56 (2003) 117bSG Ostlund, AM Striegel, Polym. Degrad. Stab., 93 (2008) 1510
Amylose
Cellulose
To
wa
rd m
ore
co
mp
act
str
uctu
re
0 100 200 300 400 500 600 700 800
0.0
0.2
0.4
0.6
0.8
1.0
1.2
1.4
Linear Random Coil Polystyrene (in DMAc/LiCl)a
R
,w/R
G,z
Sonication time (min)
Theoretical hard-sphere limit
PBLG (in DMAc/LiCl)b

CONCLUSIONS
• Macromolecular architecture affects mechanism of polymer
degradation in transient elongational flows.
• Have proposed a revised definition of Mlim that includes effects
of LCB and conformation on degradation.
• Results for degradation of rod-like polymers and copolymers
(random, block, and alternating) agree with proposed
mechanism.
• Ultrasonic laboratory studies: Can control experimental
parameters; require very little sample.
• Multi-detector SEC yields wealth of data related to architectural
and conformational effects on polymer degradation and
stability.