How can China invest in Countries where others are...
44
How can China invest in Countries where others are Expropriated? * Qianru Song † and Rodrigo Wagner-Brizzi ‡ Draft as of June 10, 2013 Abstract Poor rule of law is usually a binding constraint for foreign investment and lending. But recently Chi- nese firms disproportionally invest overseas in countries with weak institutions. How do they manage this exposure? Our model appeals to China’s buying power as importer and also to its within-country coordination to act like a single agent. These two factors allow China to credibly commit to sizable trade sanctions in case the host country expropriates. Thus, purchasing power is used to sustain other investments, analogous to trade-credit between a small firm and its main buyer. This additional “stick” becomes more important for FDI in non-traded goods, which face weaker enforcement of com- pensations post expropriation or devaluations. Using data on outward Chinese FDI (2003-2007) we find support for our model. First, China shows revealed comparative advantage as investor in coun- tries with both poor institutions and a large share of exports going to China. In contrast, simply having poor institutions is not a robust predictor of the Chinese share of FDI, suggesting that the interaction with oligopsonistic power plays a role. Second, we find that the effect is concentrated in non-traded goods; giving also less traction to explanations in which multinationals prefer to own the assets pro- ducing the exported good (e.g. Antrás, 2003). Third is the intensive margin, with Chinese projects being 50% bigger in size than those of other countries in the same destination. Overall, our results suggest an additional channel in which Chinese growth would expand capital flows to developing nations. JEL classification: F21, F23, F34, F51, G32 , G33. Key words: Foreign Direct Investment, Sovereign Debt, Sanctions, Non-Market Strategy. * [FIRST DRAFT DECEMBER 2011] Authors acknowledge the valuable suggestions made by Pierpaolo Benigno, Sebastian Bus- tos, Claudio Bravo-Ortega, Guillermo Calvo, Fritz Foley, Ricardo Hausmann, Hugo Hopenhayn, Oscar Landerretche, Donald Lessard, Noel Maurer, Dani Rodrik, Jeswald Salacuse, Jose Tessada and seminar participants at Harvard Business School, Har- vard’s Center for International Development, Tufts, LACEA (Lima), China-Goes-Global Conference, ESE, UAI, Universidad Catolica de Chile and Universidad de Chile. The project started when Wagner-Brizzi was visiting professor at U of Chile, School of Business and Economics. As usual, authors are the only responsible for the content expressed in this paper. Its content does not necessarily represent any of the institutions to which the authors are affiliated. † Researcher at U of Chile ‡ Assistant Professor at Tufts University. Associate at Center for International Development, Harvard. Affiliate to the En- trepreneurship and Firm Growth group at IPA. Corresponding Email: Rodrigo_Wagner [ @ ] tufts . edu 1
-
Upload
nguyencong -
Category
Documents
-
view
215 -
download
0
Transcript of How can China invest in Countries where others are...
How can China invest in Countries
where others are Expropriated?∗
Qianru Song† and Rodrigo Wagner-Brizzi ‡
Draft as of June 10, 2013
Abstract
Poor rule of law is usually a binding constraint for foreign investment and lending. But recently Chi-nese firms disproportionally invest overseas in countries with weak institutions. How do they managethis exposure? Our model appeals to China’s buying power as importer and also to its within-countrycoordination to act like a single agent. These two factors allow China to credibly commit to sizabletrade sanctions in case the host country expropriates. Thus, purchasing power is used to sustainother investments, analogous to trade-credit between a small firm and its main buyer. This additional“stick” becomes more important for FDI in non-traded goods, which face weaker enforcement of com-pensations post expropriation or devaluations. Using data on outward Chinese FDI (2003-2007) wefind support for our model. First, China shows revealed comparative advantage as investor in coun-tries with both poor institutions and a large share of exports going to China. In contrast, simply havingpoor institutions is not a robust predictor of the Chinese share of FDI, suggesting that the interactionwith oligopsonistic power plays a role. Second, we find that the effect is concentrated in non-tradedgoods; giving also less traction to explanations in which multinationals prefer to own the assets pro-ducing the exported good (e.g. Antrás, 2003). Third is the intensive margin, with Chinese projectsbeing 50% bigger in size than those of other countries in the same destination. Overall, our resultssuggest an additional channel in which Chinese growth would expand capital flows to developingnations.
JEL classification: F21, F23, F34, F51, G32 , G33.Key words: Foreign Direct Investment, Sovereign Debt, Sanctions, Non-Market Strategy.
∗[FIRST DRAFT DECEMBER 2011] Authors acknowledge the valuable suggestions made by Pierpaolo Benigno, Sebastian Bus-tos, Claudio Bravo-Ortega, Guillermo Calvo, Fritz Foley, Ricardo Hausmann, Hugo Hopenhayn, Oscar Landerretche, DonaldLessard, Noel Maurer, Dani Rodrik, Jeswald Salacuse, Jose Tessada and seminar participants at Harvard Business School, Har-vard’s Center for International Development, Tufts, LACEA (Lima), China-Goes-Global Conference, ESE, UAI, UniversidadCatolica de Chile and Universidad de Chile. The project started when Wagner-Brizzi was visiting professor at U of Chile,School of Business and Economics. As usual, authors are the only responsible for the content expressed in this paper. Itscontent does not necessarily represent any of the institutions to which the authors are affiliated.†Researcher at U of Chile‡Assistant Professor at Tufts University. Associate at Center for International Development, Harvard. Affiliate to the En-
trepreneurship and Firm Growth group at IPA. Corresponding Email: Rodrigo_Wagner [ @ ] tufts . edu
1
1 Introduction
Modern economic research remarks stable property-rights institutions as a crucial factor for investment,
especially if foreigners need to trust your country’s rules against expropriation or default. For example,
both Wei (2000) and Alfaro et al. (2008) blame poor institutions as the reason why capital does not flow from
rich to poor countries. Unfortunately, institutions are difficult and slow to change. So if your country hap-
pens to have weak institutions it is much harder that it receives badly needed Foreign Direct Investment
(FDI) or a sovereign loan.1
In this context of an “institutional trap” for capital flows, it would be very useful to explore alternatives
to foster FDI in the medium run; meanwhile institutions cannot be improved. Although alternatives
have been elusive, during the first decade of the twenty-first century China seems to have found a way
to invest in countries with poor governance. In this paper we want to understand how is it that China
can have this shortcut and in which conditions this strategy can potentially be generalizable. With that
purpose, we build a simple model in which the Chinese can better coordinate to effectively conduct trade
sanctions against expropriator countries that export a large fraction to China. We later find support for
our predictions using Chinese FDI investments abroad.
In response to the adoption of the “Go Global” policy,2 China’s FDI abroad has increased rapidly since
2003, becoming a growing source of outward foreign direct investment (oFDI). According to fDiMarkets
data, in 2003 China represented 1.9% of Global FDI, but only three years later it became 3% of the global
investment; growing at an annual rate of 17.5%. Although China is still a small fraction of global FDI,
it is growing three times faster than global FDI and more than twice as fast as Chinese GDP. 3 More
importantly for our purposes, in recent years China´s outward FDI into developing countries has been
growing, disproportionally being invested in countries with more limited rule of law4. Notably, this1In the paper we refer to the total amount of FDI. When countries get very high levels of financial development, foreigners
may increase relatively more the portfolio investments and debt, as argued by Hausmann and Fernández-Arias (2000). FDImay impact growth either by relaxing financial constraints or by incorporating new production methods to the economy (eitherdirectly in multinationals or as a result of spillovers). Javorcik (2004) and Javorcik and Spatareanu (2008) explore FDI spilloversand argue that firms with joint foreign-local ownership are more likely to have spillovers in the economy. Having mentionedthis motivation, though, this paper will neither focus on the effect of FDI on growth (e.g. Borensztein et al., 1998) nor in ChineseFDI in response to the international financial crisis 2008-2010, where other forces may be at play.
2The policy is initiated in 1999 by the Chinese Government to promote the domestic enterprises to invest overseas in orderto increase Chinese FDI, seek the diversification on its production, improve the quality of projects, expand financial channelswith respect to the national markets and promote Chinese enterprises´s image in the EU and US market.
3See Table 144Furthermore, among developing countries, China has become a leading source of FDI in Africa. It is geographically diver-
2
pattern of investment into poor-institutions is also present when China lends to sovereign and parastatal
companies. For example, Gallagher et al. (2012) shows that out of all the investments of Chinese banks in
Latin America between 2005 and 2011, 55% of the US$ 73 billion went to Hugo Chavez’s Venezuela, 13%
went to Argentina and 9% to Ecuador; all countries with poor sovereign credit ratings that also export
an increasingly relevant fraction to China. In short, there is important motivating evidence that China
is investing and lending where others perceive they will be expropriated. Our model aims to offer one
explanation for why it makes sense for China to do so.
A recent literature - mostly from Management and Business scholars - explored the determinants of the
overseas’ expansion of Chinese firms. The majority of these studies confirm the perception that Chi-
nese FDI is attracted by destinations with high political and economic risks (e.g. Buckley, Clegg, Cross,
Liu, Voss, and Zheng, 2007 ; Quer and Rienda, 2011; Kolstad and Wiig, 2012) as well as by economies
with abundant natural resources. From the point of view of classical theories this is puzzling, because
good institutions can reduce risk and costs of doing business for foreigners (Blonigen, 2005). A few
studies attempted to explain this “Chinese exception”, but with a focus on non-economic narratives.
One family of theories lean on the fact that many Chinese multinationals are state-owned, and their
investment decisions reflect political objectives, not necessarily consistent with the profit-maximizing
strategies of private companies (Morck and Zhao, 2008; Yeung and Liu, 2008). The second family of
explanations emphasizes that the Chinese business environment - more prone to both corruption and
market incompleteness than some developed Western economies - has been a good boot-camp, which
endowed Chinese corporations with capabilities that grant comparative advantage to invest in countries
with poor contract enforcement. 5
In contrast to this existing literature, we propose a formal political economy model in which a large
country (China) is the main buyer of the output exported by a small country. This grants the larger
country a special protection for investing in the small country, because in case the small economy de-
cides to expropriate FDI, then the large country (China) could credibly sanction quickly and unilaterally
by blocking a large share of the expropriating country’s exports. This additional “stick” facilitates the
good equilibrium of the game; in which the large country invests, the small country resists the temp-
sified, covering 48 countries in the African continent (OECD, 2008).5In the report: Bribe Payers Index, 2011, Companies from China and Russia were viewed as the most likely to pay bribes,
besides of that, Bribery is seen as most common in the public works contracts and construction sector.But there are many firm capabilities that Chinese firms have developed. For example the reader may want to look at Sandersonand Forsythe (2012) who describe how the China Development bank learned how to structure loans to Chinese towns andprovinces to finance infrastructure, a capability which was later very useful in the process of helping Chinese firms investingabroad.
3
tation to expropriate and thus, the large country does not need to punish. Importantly, this additional
“stick” is irrelevant in countries with goods institutions and/or low probability of expropriation. In
those situations, FDI and lending comes from other developed economies, the one that have lower op-
portunity cost of funds, but lack the credible punishment technology. In consequence, the main testable
prediction of the model is that Chinese outward FDI would be disproportionally important in cases
where the recipient country has both weak institutions and exports a large share to China.
We test this proposition looking at share of a country’s inward FDI that is coming from China during the
period 2003-2007, finding that the FDI share of Chinese origin is significantly bigger in countries with
poor institutions and high exports to China. For example, a country with poor rule of law that exports
25% to China could have more than 2 percentage points of additional Chinese share of FDI, which almost
doubles the global average. On the extensive margin we also find results. Chinese projects are 50% larger
in their dollar amount when compared with other investors in the same destination and industry. Both
facts are consistent with the idea that China feels more protected from expropriation in these countries.
Previous papers have explored the co-occurrence of exports and foreign direct investment. For example
Antras (2003) argues that due to organizational frictions multinationals prefer to directly control the
establishments that produce what they import, instead of having just arm’s length trade. This theory
of international vertical integration indicates a positive correlation between the share of inward FDI
coming from a particular country, and the share of exports destined to that same country. Our theory also
predicts a positive correlation between these two variables, but instead of concentrating in organizational
contract incompleteness; we focus on the holdup problem arising from political economy considerations.
In our theory we do not rely on vertical integration at home (we assume FDI is essential) , but focus
on a sanction that impacts the expropriator government. Empirically, our theory can be distinguished
from Antras (2003) because his theory explains this positive correlation only for FDI aimed at producing
tradable goods (those that will be exported to, say, the US). In contrast, our theory also encompasses
non-tradables that are subject to holdup due to relevant sunk investments, like infrastructure or even
banking.
Functionally, our theory belongs to the general literature on international sanctions, usually discussed
for reasons like sovereign defaults, trade and human rights.6. As in Eaton and Engers (1992) our model
6Obstfeld and Rogoff (1996) describe the complexities of punishing countries that default to their sovereign debt.Fuchs and Klann (2010) show how China uses its power to block imports to deliver a short-to-medium term punishment tocountries that received the Dalai-Lama. Like them we emphasize trade as tool for retaliation Unlike them, we also show thatthis matters for economic rather than human-rights behavior of countries.
4
has a receiver and a sender; with credibility playing a central role. Unlike them, for tractability reasons,
we keep the model finite because we also add a preliminary stage where different investors with het-
erogeneous technology bid for the right to do FDI in a recipient country. Our paper is also related to
Dixit (2005), who shows that in situations of lawlessness a credible threat can foster investment. It is
also related to the corporate finance theory on trade credit across firms; where the main buyer can be a
source of credit because it has some power to punish - by blocking purchases - if it is not repaid7. Our
innovation is to apply these principles to the case of multinational investment.
Dooley et al. (2007) ask a slightly different question than ours: why did China not expropriate past
American FDI in their borders? Their explanation is that, given that a large fraction of Chinese inter-
national reserves are parked in the New York Federal Reserve, then any expropriation by the Chinese
could have been sanctioned by retaining these reserves. This explanation may seem similar to ours, in
the sense that there is a differential technology for punishment. Nonetheless several features render our
mechanism more feasible and the sanctions more credible. The first challenge would be implementing
those sanctions, since the incentives of the New York Fed and those of an American multinational op-
erating in China are not aligned, with the US political system providing little room for a negotiation.
In fact Maurer (2013) describes how the US - for national security reasons - institutionally isolated the
Executive from investors’ disputes overseas to reduce what he calls “The Empire Trap”. In our case, we
model this within investor-country conflict and argue that only China could act as a single agent because
of the central planning nature of its economy and the involvement of the communist party in business,
which facilitates the application of the Coase Theorem in intra-national negotiations. A second differ-
ence is that our sanctions entail an international conflict between a small country and China, unlike the
China-US conflict in Dooley et al. (2007) which could create World War III, especially because the sanc-
tion of Dooley et al. (2007) is to a stock, while our story of export sanctions is just to the export flow.
Finally, if the New York Fed were to block access to Chinese reserves, all financial instruments that were
considered safe would no longer perceived to do so, generating another global financial turmoil, which
of course could impact more negatively the US than China. In short, our rationalization entails a more
credible sanction.8
The mechanisms we model has precedents in history. In his essay “National Power and the Structure of
Foreign Trade”Albert O.Hirschman (1945) describes how pre-WWII Germany politically controlled small
7For example,this happens in Agricultural contracts when a large firm has contracts for outgrowing the crop, as in Sugarcane. This connects us to the broader economic literature on the interlinking of contracts (for a review see Bell, 1988).
8Special thanks to Guillermo Calvo for pointing out Dooley et al. (2007)’s argument for FDI protection.
5
neighboring nations due to the threat of trade sanctions, since Germany was a crucial market for their
exports. Along the same linesSchuler (2000) describes how in 1938 the Mexican government expropri-
ated American (Standard Oil) and Dutch (Shell) oil investments to create Petroleos Mexicanos (PEMEX).
The American government, which at the time was probably much less constrained to align itself with
Standard Oil, immediately decreed trade sanctions. Moreover, the power of Standard Oil threaten tanker
ships to avoid doing business with PEMEX. After all, Mexico ended up exporting its oil to Italy at a rel-
evant haircut, just because the Fascist regime was already isolated and because Mussolini build a tanker
ship for the Mexicans. Moreover, Maurer (2013) shows how Mexico at the end compensated US in-
vestors, indicating that the US threat was indeed credible. Our contribution to this historical literature is
to formally model the mechanism and show that there is a modern equivalent in Chinese outward FDI,
which we can explore with cross country quantitative empirical evidence.
Maurer (2013) also remarks that the US moved towards less direct involvement of US executive to protect
investments after three institutional innovations that emerged during the last part of the 20th century.
First is political risk insurance, which facilitated the ex ante pricing of risks rather the ex post gun-
boat politics or trade sanctions. Second a system international investment disputes, which in the past
were simply not allowed due to sovereign immunity. Third was the signature of bilateral investment
agreements in which countries usually agree on arbitration procedures.
We think that the mechanism we study is not an obvious substitute for the above mentioned methods
(including the World Bank’s International Center for Settlement of Investment Disputes, ICSID), but
maybe a complement for situations where the negotiation environment cannot provide enough expected
penalty as to counter balance some countries’ temptations to expropriate. In fact the ICSID is defined as
a mechanism with “facilities for conciliation and arbitration of international investment disputes.”, but not as
a punishment device.9
In the model we also explore the circumstances under which Chinese investment might be efficient.
When expropriation temptations are an exogenous characteristic of the recipient country, then an addi-
tional punishment tool for the Chinese simply extends the set of possible countries where investment
can take place, which in our setting is Pareto improving. In that setup there are also rents for the Chinese
FDI, even if we assume they may have lower productivity in their FDI. These rents arise because they are
9The Economist Intelligence Unit discusses the role of the ICSID in the 2012 expropriation of YPF by the ArgentineanGovernment. It argues that “ the case seems likely to ultimately end up at the World Bank’s International Centre for Settlement ofInvestment Disputes (ICSID), where a ruling on compensation could take years. Argentina has more outstanding cases at the ICSID thanany other country, dating back from the 2001-02 debt default and devaluation, and has failed to abide by ICSID rulings to date.” (EIU,April 27 2012. Article ID # 1588998943)
6
the only ones able to invest in those tough “sub prime” situations. In the model these rents are not bad by
themselves, but symptoms of poor governance that prevents other (i.e. non-Chinese) potential investors
to bid competitively. In an extension of the model we allow for a single re-investment possibility; which
opens the room for an endogenous increase in the temptation to expropriate. Here we follow the tradition
where the threat of autarky in the second round of investment sustains the cooperative outcome with
low expropriation. But with a new investor that can securely re-invest in countries that were otherwise
“sub-prime”, the autarky threat is no longer credible. This adds a second “moral hazard” effect that was
not present in our benchmark model. In the short run, when investment is sunk, other foreign investors
lose. But in the long run the developed country’s investors anticipate this Chinese-led-renegotiation,
and they narrow down even further the set of countries that they consider “investment grade" for FDI,
reducing investment by the multinationals that could have been the first best source of capital.10
Finally, it is worth contrasting our work with other research on the political economy of investment and
China. First, some authors are concerned about the direction in which Chinese FDI impacts welfare of
the recipient countries.11 Although very important, the question of how FDI impacts growth and devel-
opment is out of the scope of our current paper. 12 Second, many authors have remarked the relevance
of political economy considerations in China. For example, Branstetter and Feenstra (2002) estimate how
the Chinese government chooses economic policies to trade-off, on the one hand, the consumer benefits
from inward FDI and exports and, on the other hand, the losses of State Owned Enterprises. In con-
trast, our work focuses on political economy issues when China invests abroad, so the relevant margin
is how the Chinese government relates to other governments rather than the above mentioned internal
trade-offs.
Nonetheless, we still argue that internal reasons are behind the comparative advantage of China as
FDI source in tough destinations. Our point is that unlike in other large countries like the US, Chinese
10Having the option that the Chinese re-invest is analogous to having a renegotiation option for contracts. Similar resultshave been described in the analysis of micro-credit contracts, when the fact that other institutions lend in the same village makeless likely that the borrower re-pays. Also in the lending relationships literature the existence of other banks may inefficientlyreduce the incentives of banks to experiment by lending to new entrepreneurs (see Petersen and Rajan, 1995). One example toapply these principles could be the 2012 expropriation of oil company YPF by the Argentinean Government. If expropriationtemptations are only exogenous, then having the Chinese re-investing in Argentina after the expropriation could be efficient.But if the Argentine government knows that the Chinese would re invest, they might be more likely to expropriate. In the longrun this can make some non-Chinese investors to be much more selective on their lending
11The main arguments is that, on the one hand, Chinese investment is really attractive for recipient countries with badinstitutions which are seeking FDI to improve their economies, for example, it can offer the fresh capital to expand the localopportunities. On the other hand, there is a concern that the Chinese investment can be conducted with a view to exploitingtheir natural resources (Onjala, 2008;Haroz, 2011).
12Across countries, the question whether FDI causes growth and development is an important literature,but without manygeneralizable facts. Some contributions not already mentioned are Borensztein, De Gregorio, and Lee (1998) and Alfaro (2003).
7
winners from sanctions (i.e. firms investing abroad) and Chinese losers from sanctions (i.e. importer
firms that break their trading relations) have an easier time negotiating under the umbrella of their
single Communist Party.13
The paper is structured as follows. Section 2 formulates our theoretical framework, with some extensions
that we leave for the Appendix. Section 3 summarizes the data and presents the basic stylized facts
supporting our theory . Section 4 shows that our stylized facts remain robust to more formal testing
in a regression framework. Section 5 argues that the findings seem unlikely to be a simple result of
alternative explanations. Finally, section 6 concludes with some remarks.
2 Basic theoretical framework
This chapter introduces our basic model. The central assumption is that even if Chinese FDI may have
lower productivity; China has a better punishment technology in case of expropriation, a combination
that grants China comparative advantage as source of FDI in countries where expropriation concerns are
a binding constraint for investment. Before describing the model, it is worth stopping for a second and
explain what is the type of expropriation that motivates us. Although it is natural to think in a tradable
natural resource like oil or minerals, which are vociferously expropriated a la Hugo Chavez or Cristina
Fernandez14; we would like to focus on more subtle cases of non-traded goods with large upfront costs F
, like roads, electricity grids, infrastructure or even banking. We argue that in the former case of tradable
goods, if the government or a local firm have a large technological gap with the foreign investor, then
even after a price shock that could have increase the temptation to expropriate, it might still be preferable
to renegotiate the terms of the contract with the foreign company and divide the surplus. We think the
problem might be harder for the above mentioned non-traded goods; for which it might be very hard to
make customers pay for the service provided. This would be the case of electricity firms that are over-
regulated with very low fares or the inability to have a paid-highway in a country with poor institutions
and poor governments.15 As an illustration of this phenomenon, in the World Bank’s Enterprise Surveys,
13Our work is associated of what has been recently called “Chinese soft power” in the International Relations literature (seeEllis, 2011). Our difference is that we explore this question with the tools of economics; with a formal model of an explicit gameand quantitatively testing our theory.
14During his weekly live TV show, Hugo Chavez from Venezuela used to expropriate various firms and other types ofproperty exclaiming the word “expropiese”. Cristina Fernandez from Argentina announced on public TV the expropriation ofYPF. A few days later she personally brought the expropriation law to the cemetery and left it in her husband’s grave, tied witha string with the colors of the Argentine flag.
15In some cases is also tough for governments to allow free market prices for tradable goods, especially if there is a largefraction of consumption by households and their expenditures in that item are either salient or used by organized groups.In Venezuela gasoline is insanely cheap; in Argentina natural gas has very low prices. In contrast, beyond taxes, there is nocurrent regulation for domestic Soybean price in Argentina , Coffee in Burundi or Copper in Chile.
8
the most frequent complaint of the surveyed firms in Africa was the lack of appropriate electricity.
2.1 Setup
This is a static partial equilibrium model where the cost of capital is not defined by foreign direct in-
vestment, but it is exogenously given. Our world has many small countries j , each one of them have
predetermined rule of law and levels of exports xii to one of the large countries i. Those long term insti-
tutional and trade patterns will be taken as given in this model, so we can concentrate on the decisions
about FDI of large country i in each host country j. Just to clarify, the types of goods exported xii are
unrelated to the nature of FDI in this model, unlike in Antras (2003).
The perfect and symmetric information game has three periods: 0, 1, 2; which for simplicity does not
include time discounting. Period t = 0 condenses the investment decisions, while period t = 1 has the
expropriation decision and period t = 2 is about inflicting sanctions and realizing the payoffs.
In each small country there is an investment opportunity that cannot be financed by domestic investors
so it is only performed if one large country i invests. The small country j is composed by a single agent,
think of j′sgovernment, that can make two decisions: (i) pick which foreign investor i would run the
FDI project and; (ii) decide whether to expropriate or not expropriate FDI after the investment of size F
is made. The way j decides is given be the following problem
maxi, exprop
uj = maxi
{bij}
+ exprop[ej − cij
]; where bij is the endogenous bid an investor i is willing to pay for running the project, and naturally
the recipient country j would prefer to have the biggest possible payment among all investors i. exprop
is a dummy variable for whether to expropriate or not. This will be determined by the net benefits of
doing so[ej − cij
]. The parameter ej is the expropriation temptation, which is inversely related to the
rule of law, while cij is the maximum credible punishment that the country i can inflict to j in case it
expropriates the investment. In particular, the sanction would a be the fraction s in which the investor
country reduces its purchases from the expropriator country j. This sanction swould be more punishing
for country i if the government depends a lot from exports to finance itself, which we capture as τ ; and
if the goods exported to i have a premium in their value when exported there, which we capture as ρ.
More importantly, the higher the share exported to country i , the higher the punishment. We capture this
relations with the following punishment cij ≡(
1− ρ · s · xij)τ . While ej would remain an exogenous
9
country characteristic, the pair(bij , c
ij
)will be determined by each investor countries.
There are N + 1 large countries that can potentially invest and these countries are, for simplicity, of
two types: N countries are identical developed economies i = DEV , and the last investor country is
i = CHN . To make it as simple as possible, each of these large countries is populated by two agents
with incentives that are not fully aligned. One agent is the foreign investor and the other is an importer
firm, that buys goods from all the small economies. Naturally, after the investment of size F is made,
the investor firm in country i would benefit from a large potential sanction s, as a way to deter potential
expropriations. But unfortunately the investor firm cannot decide the level of sanction s because it does
not control trade with country j. That is a duty of the importer firm. The bargaining between the
importer and the investor for the level of sanction s will be our shortcut to model the political process
and the business-government relations. The utility of the investor is given by uinvestor = P · s − z ;
where P is the benefit of each unit of sanctions in terms of increasing reputation of being tough with
expropriators; finally, the investor firms can make transfer payments z to other parties. The importer
does not benefit from sanctions, but can produce them, generating a positive externality for the investor.
Its utility is given by uimporter = (1− φ) · z − ψ(s,M j
); where ψ
(s,M j
)is the sanction cost function,
which is increasing and convex in s , becoming even steeper when a large fraction of imports come from
country j, M j . Technically this requires ψsM > 0;ψs > 0;ψss > 0. Notably, for every dollar of transfer
z that the investor gives, only a fraction (1− φ) reaches the importer. This “fee”, φ ∈ (0, 1), means a
departure from a perfect Coasian solution to the externality problem. Below we make two essential
assumptions.
Assumption # 1: CHN has lower internal negotiation frictions than other investor countries (φDEV >
φCHN ).
Here we mean that China is better at negotiating internal disputes between winners and losers of a
policy. If you consider the imposition of a sanction, this creates both reputational benefits and lower
expropriation concerns that overwhelmingly benefit the firms investing overseas. In contrast, the firms
that were importing commodities from the just sanctioned country face the meaningful costs of finding
new suppliers. Existing trading relationships are lost and the firm needs to incur in additional sunk
costs to find a new producer. In a developed country those competing interest would lobby and exert
pressure in government to impose sanctions, but this process takes time and we assume it is full of insti-
tutional frictions. In contrast, the Chinese government seems better at transferring utility across firms.
10
In particular, we view the complex career at the Chinese Communist Party as a technology to transfer
utility from the decision makers in winning and losing firms. Another factor behind the assumption that
φDEV > φCHN is that the single party system in China could provide lower myopia about the future
reputation of the country as investor, a concern that might be relatively more diluted in a multiparty
democracy in a developed economy. Finally, no matter the specific reason for φDEV > φCHN , our point
is that China could act closer to a unitary agent. This coordination has been implicitly assumed before.
For example Blanchard and Kremer (1997) argue that Chinese authorities have higher coercive power
vis-a-vis former Soviet republics. Maurer (2013) also describes how also the US acted like a unitary
agent in cases of expropriation until the 1980s, approx16 We also need a second assumption related to
oligopsonistic power
Assumption # 2: Valuable trading relationship
(i) Asymmetric trade: China is relatively more diversified in its import sources, so M j is small, and
(ii) Re-locating exports to other countries after a valuable trading relationship is lost has steep
convex costs.
China is a large buyer of products exported by economies with poor institutions, and each of these
small economies are usually small producers without international market power17. The latter makes
unlikely that a country by itself can threat China by not sending its exports. China being a large buyer
is interpreted as able to create a tougher punishment for expropriators; while China having a diversified
set of countries that produce these goods fits in our model as a lower cost of sanctioning.
Note however that by market power we do not necessarily mean impacting global prices, but having a
valuable trading relationship. It might be tempting to think that differentiated goods - in Rauch (1999)’s
sense - are the only ones for which this may matter, since commodities are usually traded in exchanges.
The trick is, however, that despite the existence of such formal exchanges, a large share of trade with
China happens through relational contracts where the market price and the standardized characteristics
of commodities are only some of the relevant attributes of the product, but not all. Logistics, delivery
and processing are in fact central features of commodities like copper, coffee or soybeans. Sanderson
and Forsythe (2012) remark how commodity purchases from China are based in contracts. Formally, we16Our point has some similarities with Eaton and Fernandez (1995)’s claim that negotiation frictions among creditors can be
an important friction in sovereign defaults. But this is a two edge sword, because it can be a better negotiation of the sanctions(if any), but also an easier renegotiation that could create moral hazard by the debtor. Our paper does not emphasize thecoordination problems of creditors, but the negotiations between winners and losers of these sanctions within China.
17One exception might be Chile, which produces around 20-30% of global Copper. But Chile is a country that ranks veryhigh in indexes of protection of property rights and foreign investment environment
11
need to assume that the costs of re-locating exports to a different country after being blocked by China
are convex and steep enough, so finding new customers after being blocked by China is tougher than an
export blocking from Denmark. Using again the Argentine example, Soybean oil is indeed a commodity
traded in, among other places, the Chicago Board of Trade (CBOT). But despite this trade-ability and
competition, the Chinese government was able to inflict a cost to Argentina because it took a while to
re-direct an important fraction of the lost commerce with China. In contrast, China was easily able to
source from Brazil and other producers.18 Another important assumption is that the large country is able
to avoid triangulation of trade from one country to another (e.g. Argentine soybean oil shipped to Brazil
and then redirected as “Brazilian” soybean oil). Although this is possible, and it certainly happens, the
transaction costs are high19. The fact that China is a large importer of commodities is a necessary but
not sufficient condition for being able to inflict punishment, since without significant frictions in the
triangulation of trade the “punishment” would be ineffective.
There could be additional reasons we do not model that could be behind cCHN (x) > cDEV For example,
reputational benefits might be higher for countries that have a relatively recent history of investing
abroad (e.g. the Bayesian updating about the toughness of Chinese punishment is higher when there
are fewer observations, assuming signal precision is constant) as well as for countries with deep pockets
that plan to significantly increase their quantity of outward FDI due to high liquidity.
Finally, to close the model in a simple way we argue that Chinese FDI is less productive so they do not
outbid the developed economies in other countries.
Assumption 3: Productivity Developed country’s FDI is more productive than the one for Chinese FDI:ϕDEV >
ϕCHN
Although the literature reviews cases where Chinese productivity is lower than in other countries, we
should not interpret Assumption 3 at full face value, but instead think of it as a simple shortcut to
condense all the non property-rights reasons why the multinationals from developed economies have
relative advantages if they are not expropriated. This is defensible in the sense that despite being the
second largest economy in the world, China has a much smaller fraction of Global FDI than other devel-
oped economies ( see Table 14). One could dispense this assumption and move to a general equilibrium
framework, but without obvious payoffs in terms of insights, so we chose this route.18See this nore http://en.mercopress.com/2011/04/14/argentine-soy-oil-industry-diversifies-markets-following-china-s-
ban19“According to Argentine sources, to access the Chinese market Argentine soy-oil must accept rebates of up to 30% per ton
compared to the Brazilian soy-oil” cited from the link in the previous footnote
12
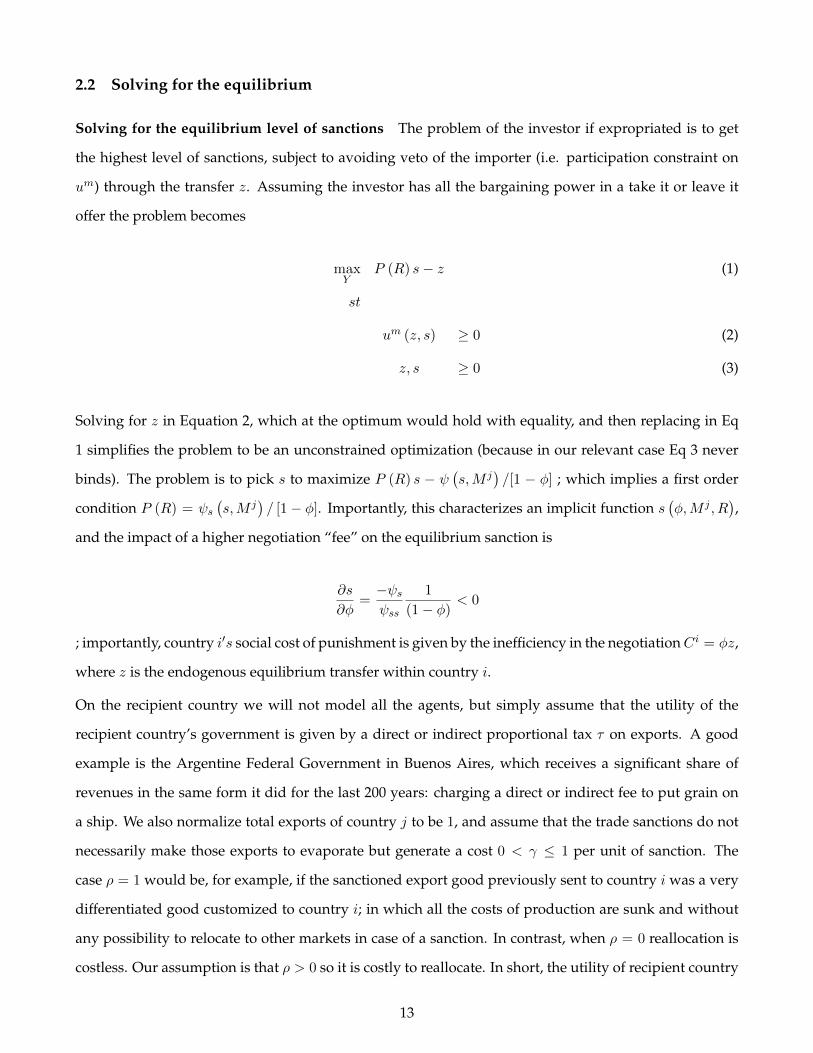
2.2 Solving for the equilibrium
Solving for the equilibrium level of sanctions The problem of the investor if expropriated is to get
the highest level of sanctions, subject to avoiding veto of the importer (i.e. participation constraint on
um) through the transfer z. Assuming the investor has all the bargaining power in a take it or leave it
offer the problem becomes
maxY
P (R) s− z (1)
st
um (z, s) ≥ 0 (2)
z, s ≥ 0 (3)
Solving for z in Equation 2, which at the optimum would hold with equality, and then replacing in Eq
1 simplifies the problem to be an unconstrained optimization (because in our relevant case Eq 3 never
binds). The problem is to pick s to maximize P (R) s − ψ(s,M j
)/[1 − φ] ; which implies a first order
condition P (R) = ψs(s,M j
)/ [1− φ]. Importantly, this characterizes an implicit function s
(φ,M j , R
),
and the impact of a higher negotiation “fee” on the equilibrium sanction is
∂s
∂φ=−ψsψss
1
(1− φ)< 0
; importantly, country i′s social cost of punishment is given by the inefficiency in the negotiationCi = φz,
where z is the endogenous equilibrium transfer within country i.
On the recipient country we will not model all the agents, but simply assume that the utility of the
recipient country’s government is given by a direct or indirect proportional tax τ on exports. A good
example is the Argentine Federal Government in Buenos Aires, which receives a significant share of
revenues in the same form it did for the last 200 years: charging a direct or indirect fee to put grain on
a ship. We also normalize total exports of country j to be 1, and assume that the trade sanctions do not
necessarily make those exports to evaporate but generate a cost 0 < γ ≤ 1 per unit of sanction. The
case ρ = 1 would be, for example, if the sanctioned export good previously sent to country i was a very
differentiated good customized to country i; in which all the costs of production are sunk and without
any possibility to relocate to other markets in case of a sanction. In contrast, when ρ = 0 reallocation is
costless. Our assumption is that ρ > 0 so it is costly to reallocate. In short, the utility of recipient country
13
j is uj = ej − τ[1− ρsxij
]; where ej is the temptation to expropriate. But since we assume that the
base level of exports and taxes are exogenous to our model (determined by fundamental comparative
advantage u other mechanism) we can simplify the utility of j’s government to be uj = ej − cij ; where
cij = τρsxij and s = s(φ,M j , R
)is determined endogenously in the negotiation within the investor
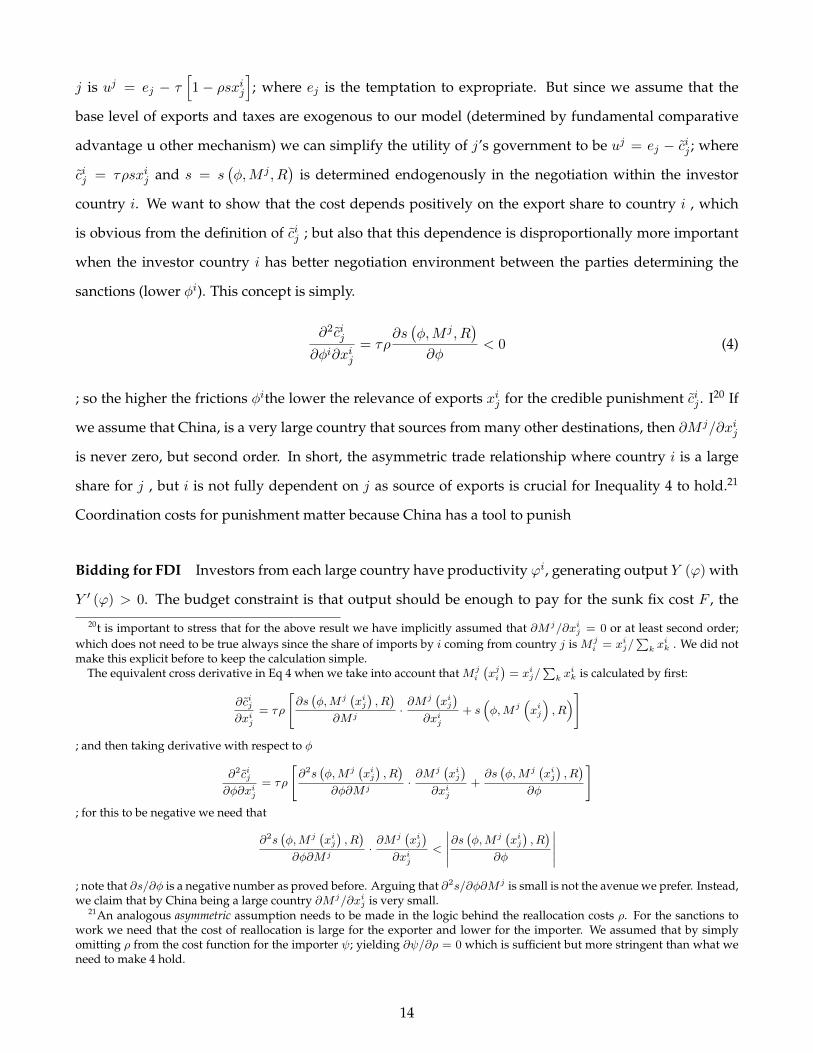
country i. We want to show that the cost depends positively on the export share to country i , which
is obvious from the definition of cij ; but also that this dependence is disproportionally more important
when the investor country i has better negotiation environment between the parties determining the
sanctions (lower φi). This concept is simply.
∂2cij∂φi∂xij
= τρ∂s(φ,M j , R
)∂φ
< 0 (4)
; so the higher the frictions φithe lower the relevance of exports xij for the credible punishment cij . I20 If
we assume that China, is a very large country that sources from many other destinations, then ∂M j/∂xij
is never zero, but second order. In short, the asymmetric trade relationship where country i is a large
share for j , but i is not fully dependent on j as source of exports is crucial for Inequality 4 to hold.21
Coordination costs for punishment matter because China has a tool to punish
Bidding for FDI Investors from each large country have productivity ϕi, generating output Y (ϕ) with
Y ′ (ϕ) > 0. The budget constraint is that output should be enough to pay for the sunk fix cost F , the
20t is important to stress that for the above result we have implicitly assumed that ∂M j/∂xij = 0 or at least second order;which does not need to be true always since the share of imports by i coming from country j is M j
i = xij/∑
k xik . We did not
make this explicit before to keep the calculation simple.The equivalent cross derivative in Eq 4 when we take into account that M j
i
(xji)
= xij/∑
k xik is calculated by first:
∂cij∂xij
= τρ
[∂s(φ,M j
(xij), R)
∂M j·∂M j
(xij)
∂xij+ s
(φ,M j
(xij
), R)]
; and then taking derivative with respect to φ
∂2cij∂φ∂xij
= τρ
[∂2s
(φ,M j
(xij), R)
∂φ∂M j·∂M j
(xij)
∂xij+∂s(φ,M j
(xij), R)
∂φ
]; for this to be negative we need that
∂2s(φ,M j
(xij), R)
∂φ∂M j·∂M j
(xij)
∂xij<
∣∣∣∣∣∂s(φ,M j
(xij), R)
∂φ
∣∣∣∣∣; note that ∂s/∂φ is a negative number as proved before. Arguing that ∂2s/∂φ∂M j is small is not the avenue we prefer. Instead,we claim that by China being a large country ∂M j/∂xij is very small.
21An analogous asymmetric assumption needs to be made in the logic behind the reallocation costs ρ. For the sanctions towork we need that the cost of reallocation is large for the exporter and lower for the importer. We assumed that by simplyomitting ρ from the cost function for the importer ψ; yielding ∂ψ/∂ρ = 0 which is sufficient but more stringent than what weneed to make 4 hold.
14
benefit for the investor B and the benefit for the recipient country’s government b.That means
Y (ϕ)− F = B + b
When there is more than one bidder, the rentB is (almost) zero since we assume all the bargaining power
is on the recipient country (investors bid their true valuations in a second price auction) . In that context
it is straightforward to prove that equilibrium bids bi would be just slightly below Y(ϕi)− F ; while Bi
would be close to zero (B = limε→0 ε). 22. In contrast, when only one investor is bidding, we assume that
bi is the result of Nash bargaining, in which they split the surplus 50-50 with the recipient country. This
environment generates the following two lemmas, which could be summarized in Figure
Lemma 1. When maximum credible punishment that i can inflict is below the expropriation temptation
(cij < ej), then the equilibrium strategy for i is to bid bij = 0. In contrast, When the maximum
credible punishment is large enough (cij > ej) , then the investors with positive productivity bid
bij > 0.
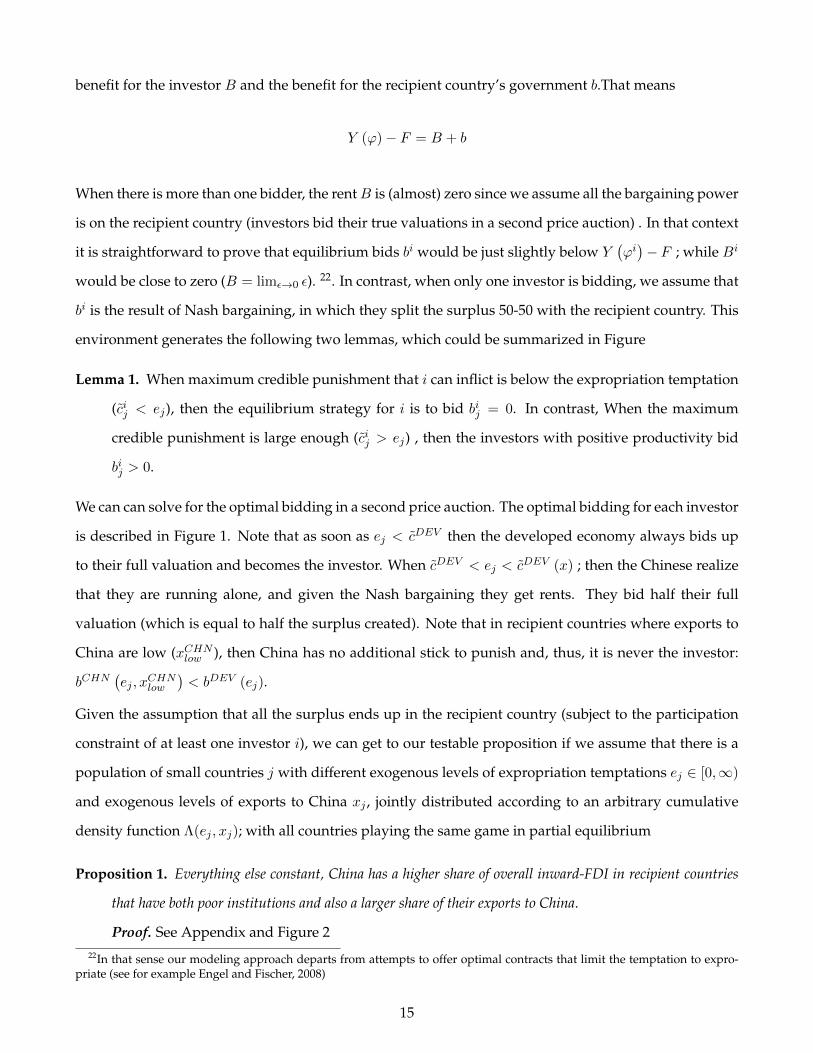
We can can solve for the optimal bidding in a second price auction. The optimal bidding for each investor
is described in Figure 1. Note that as soon as ej < cDEV then the developed economy always bids up
to their full valuation and becomes the investor. When cDEV < ej < cDEV (x) ; then the Chinese realize
that they are running alone, and given the Nash bargaining they get rents. They bid half their full
valuation (which is equal to half the surplus created). Note that in recipient countries where exports to
China are low (xCHNlow ), then China has no additional stick to punish and, thus, it is never the investor:
bCHN(ej , x
CHNlow
)< bDEV (ej).
Given the assumption that all the surplus ends up in the recipient country (subject to the participation
constraint of at least one investor i), we can get to our testable proposition if we assume that there is a
population of small countries j with different exogenous levels of expropriation temptations ej ∈ [0,∞)
and exogenous levels of exports to China xj , jointly distributed according to an arbitrary cumulative
density function Λ(ej , xj); with all countries playing the same game in partial equilibrium
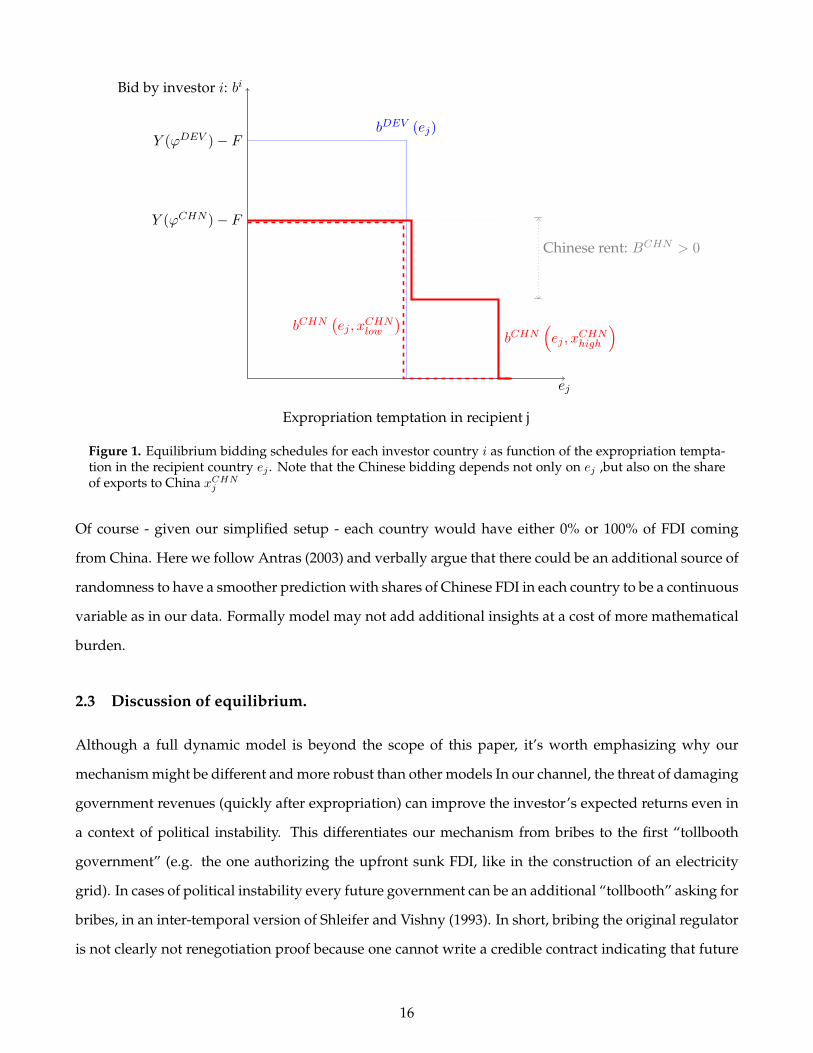
Proposition 1. Everything else constant, China has a higher share of overall inward-FDI in recipient countries
that have both poor institutions and also a larger share of their exports to China.
Proof. See Appendix and Figure 222In that sense our modeling approach departs from attempts to offer optimal contracts that limit the temptation to expro-
priate (see for example Engel and Fischer, 2008)
15
Bid by investor i: bi
ej
bDEV (ej)
bCHN(ej , x
CHNhigh
)
Y (ϕDEV )− F
Y (ϕCHN )− F
bCHN(ej , x
CHNlow
)
Expropriation temptation in recipient j
Chinese rent: BCHN > 0
Figure 1. Equilibrium bidding schedules for each investor country i as function of the expropriation tempta-tion in the recipient country ej . Note that the Chinese bidding depends not only on ej ,but also on the shareof exports to China xCHN
j
Of course - given our simplified setup - each country would have either 0% or 100% of FDI coming
from China. Here we follow Antras (2003) and verbally argue that there could be an additional source of
randomness to have a smoother prediction with shares of Chinese FDI in each country to be a continuous
variable as in our data. Formally model may not add additional insights at a cost of more mathematical
burden.
2.3 Discussion of equilibrium.
Although a full dynamic model is beyond the scope of this paper, it’s worth emphasizing why our
mechanism might be different and more robust than other models In our channel, the threat of damaging
government revenues (quickly after expropriation) can improve the investor’s expected returns even in
a context of political instability. This differentiates our mechanism from bribes to the first “tollbooth
government” (e.g. the one authorizing the upfront sunk FDI, like in the construction of an electricity
grid). In cases of political instability every future government can be an additional “tollbooth” asking for
bribes, in an inter-temporal version of Shleifer and Vishny (1993). In short, bribing the original regulator
is not clearly not renegotiation proof because one cannot write a credible contract indicating that future
16
Share exports to China xj
Expropriation temptation ej
cDEV = ej
cCHN(xCHNj
)= ej
FDI by DEV
"InvestmentGrade region"
Red Region
FDI by CHN
Desert Region
No FDI
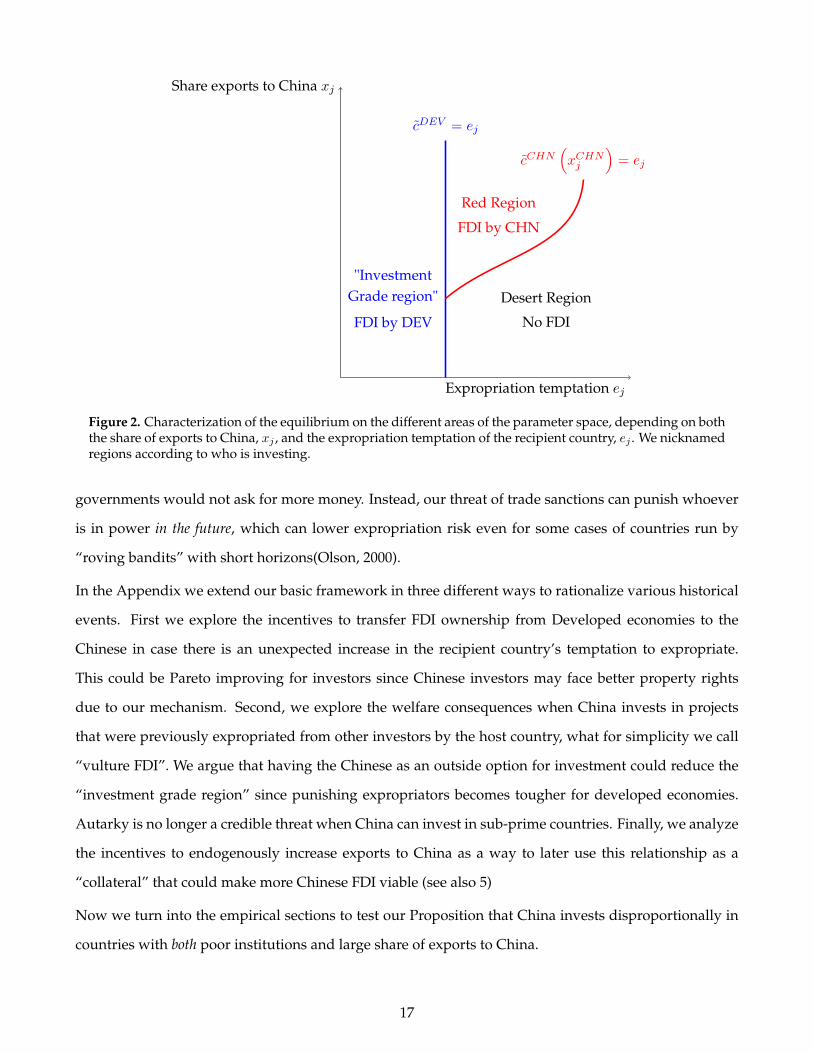
Figure 2. Characterization of the equilibrium on the different areas of the parameter space, depending on boththe share of exports to China, xj , and the expropriation temptation of the recipient country, ej . We nicknamedregions according to who is investing.
governments would not ask for more money. Instead, our threat of trade sanctions can punish whoever
is in power in the future, which can lower expropriation risk even for some cases of countries run by
“roving bandits” with short horizons(Olson, 2000).
In the Appendix we extend our basic framework in three different ways to rationalize various historical
events. First we explore the incentives to transfer FDI ownership from Developed economies to the
Chinese in case there is an unexpected increase in the recipient country’s temptation to expropriate.
This could be Pareto improving for investors since Chinese investors may face better property rights
due to our mechanism. Second, we explore the welfare consequences when China invests in projects
that were previously expropriated from other investors by the host country, what for simplicity we call
“vulture FDI”. We argue that having the Chinese as an outside option for investment could reduce the
“investment grade region” since punishing expropriators becomes tougher for developed economies.
Autarky is no longer a credible threat when China can invest in sub-prime countries. Finally, we analyze
the incentives to endogenously increase exports to China as a way to later use this relationship as a
“collateral” that could make more Chinese FDI viable (see also 5)
Now we turn into the empirical sections to test our Proposition that China invests disproportionally in
countries with both poor institutions and large share of exports to China.
17
3 Data and preliminary empirical evidence
3.1 Data sources and description
3.1.1 FDI Data from fDi Markets
Our FDI data comes from fDi Markets, a subsidiary of the Financial Times group, which is the only online
database tracking FDI at the project-level covering all sectors and countries worldwide, providing data
greenfield and expansion projects’ capital investment. Mergers and acquisition as well as other equity
investment are not included.23 Comparing with the official aggregate FDI data compiled by the Ministry
of Commerce of the People’s Republic of China (MOFCOM); which includes mergers, acquisitions and
equity investment; fDi Markets shows its advantages for our purposes. First, it is a disaggregated data-
set that allows to follow greenfield investments in terms of destination, sector and business activity.
Second, some authors (e.g.Salidjanova, 2011) argue that in general the MOFCOM data suffers from some
opacity24; while we do not necessarily agree with that statement, having data produced and compiled
out of China, using a consistent methodology (and not simply collecting and harmonizing what each
country reports) seems particularly useful given that we are working with countries with less than fully
transparent institutions.Third is that fDi Markets data starts in 2003, almost at the beginning of the “Go
Global” mandate for Chinese FDI abroad. Finally, focusing on new projects as opposed to M&A for
existing capital makes it more relevant for development and not simply a transfer from one owner to
another.
In the regressions we are just going to focus on the pre-2008 period to avoid the effect of the financial
crisis. According to the database there were 1576 Chinese investments over the period: 2003-2010, rep-
resenting 1.4% of the total number of FDI projects during this period in the world. Among all the Asian
developing countries, China ranks second after India (2088, 1.9% of the total number of FDI). In Table
10, we see that the main destination is the Asian region , representing 20.74% of the total number of
FDI projects (excluding Hong Kong and Taiwan). The US and Germany are the main recipient countries
outside of Asia, with 8.44% and 8.38% of total Chinese FDI since 2003. As far as the distribution of the
recipient countries by income level, the majority of Chinese outward FDI goes to high income coun-
tries. Our point is not that China is only investing in countries with poor institutions, but that it has a
23For a paper describing the data see Alessia Amighini and Sanfilippo (2012)24The data from fDi Markets also counts with a set of other important information, such as employment estimates, although
this information is beyond the scope of our paper.
18
comparative advantage on it. Overall, the trend of having more investments in Asia and in Developed
Economies is consistent with a simple gravity model of FDI. Of course, in the regressions we control
for this well known effect. Regarding the sectoral distribution in Table 9, slightly less than 2/3 of the
Chinese FDI projects are in traded goods, and around a third is in non-traded sectors.
3.1.2 Other sources of data.
The share of a country’s exports that are destined to China is calculated from the World Bank’s WTI
database (World Trade Indicator) as the value of exports from one particular country to China divided
the total exports of this country. Table 12in the Appendix shows the top 15 and bottom 15 countries
according to this ratio..
The main institutional variable in our analysis is the Rule of Law index from the World Bank Institute’s
(WBI) Governance Indicators (cf. Kaufmann et al. 2008). The Rule of Law index measures “the extent
to which agents have confidence in and abide by the rules of society, and in particular the quality of contract
enforcement, property rights, the police, and the courts, as well as the likelihood of crime and violence”. The index
is normalized with mean zero and unitary standard deviation. 25 We will associate negative values
of this measure as the empirical counterpart of poor institutions. To check for robustness, we also use
similar WBI institutional indicators: Control of Corruption26 and Regulatory Quality 27.
Additional control variables are GDP, culture and distance between the host economy and China. 28
In terms of economic and cultural distance we include standard controls like: Language, Distance to
Beijing29, Neighboring country, Colonial Relationship and being the same country in the past. 30 Table
25The index ranges from -2.5 to 2.5, with higher numbers signifying better institutions. This index broadly reflects thearguments about the role of institution in attracting Chinese FDI: the study from Kolstad and Wiig (2012) indicates that Chineseinvestment is found to be attracted to resource rich countries with weak rule of law instituions.
26This indicator reflects perceptions of the ability of the government to formulate and implement sound policies and regulations thatpermit and promote private sector development
27This indicator reflects perceptions of the extent to which public power is exercised for private gain, including both pretty and grandforms of corruption, as well as “capture” of the state by elite and private interests.
28We also add a number of control variables that have been found to be of importance in previous studies of host countrydeterminants of global FDI flows (see Chakrabarti (2001) or Blonigen (2005) for reviews).
GDP in many studies has been found to be robustly associated with FDI , and is commonly argued to reflect market size inhost economies and hence market-seeking motives of investors (Buckley,et.al 2007, Cheung and Qian, 2008, Cheng and Ma,2008). Nonetheless, Kolstad and Wiig (2012) suggests that market-seeking motives of investors are limited only for OECDcountries. In our specification we control for flexible forms of GDP.
29In fact, FDI is greater in nearby countries as in shown by Loungani et al. (2002) .30Buckley,et.al 2007, it has confirmed that Chinese outward investment is associated positively with the proportion of ethnic
Chinese in the host population. This argument suggests that Chinese firms will invest in countries with a large residentpopulation of ethnic Chinese. According to the Buckley´s analysis, such countries are mostly to be found in Asia, whichaccounts for some 88 per cent of all ethnic Chinese living outside of China, and the majority (66 percent) distributed moreor less evenly among Indonesia, Thailand, Singapour and Malaysia, in where therefore the Chinese idiom is used to be thecommon language among their residents.
19
8in the Appendix displays a complete the list and description of all variables.
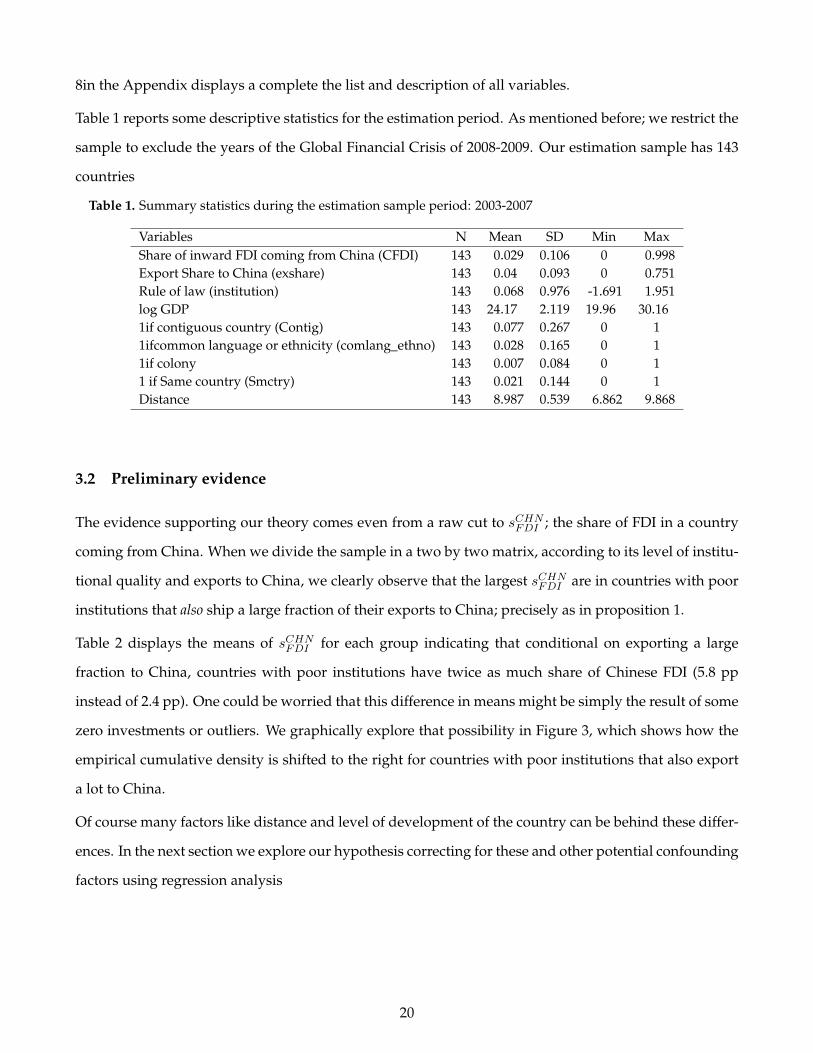
Table 1 reports some descriptive statistics for the estimation period. As mentioned before; we restrict the
sample to exclude the years of the Global Financial Crisis of 2008-2009. Our estimation sample has 143
countries
Table 1. Summary statistics during the estimation sample period: 2003-2007
Variables N Mean SD Min MaxShare of inward FDI coming from China (CFDI) 143 0.029 0.106 0 0.998Export Share to China (exshare) 143 0.04 0.093 0 0.751Rule of law (institution) 143 0.068 0.976 -1.691 1.951log GDP 143 24.17 2.119 19.96 30.161if contiguous country (Contig) 143 0.077 0.267 0 11ifcommon language or ethnicity (comlang_ethno) 143 0.028 0.165 0 11if colony 143 0.007 0.084 0 11 if Same country (Smctry) 143 0.021 0.144 0 1Distance 143 8.987 0.539 6.862 9.868
3.2 Preliminary evidence
The evidence supporting our theory comes even from a raw cut to sCHNFDI ; the share of FDI in a country
coming from China. When we divide the sample in a two by two matrix, according to its level of institu-
tional quality and exports to China, we clearly observe that the largest sCHNFDI are in countries with poor
institutions that also ship a large fraction of their exports to China; precisely as in proposition 1.
Table 2 displays the means of sCHNFDI for each group indicating that conditional on exporting a large
fraction to China, countries with poor institutions have twice as much share of Chinese FDI (5.8 pp
instead of 2.4 pp). One could be worried that this difference in means might be simply the result of some
zero investments or outliers. We graphically explore that possibility in Figure 3, which shows how the
empirical cumulative density is shifted to the right for countries with poor institutions that also export
a lot to China.
Of course many factors like distance and level of development of the country can be behind these differ-
ences. In the next section we explore our hypothesis correcting for these and other potential confounding
factors using regression analysis
20
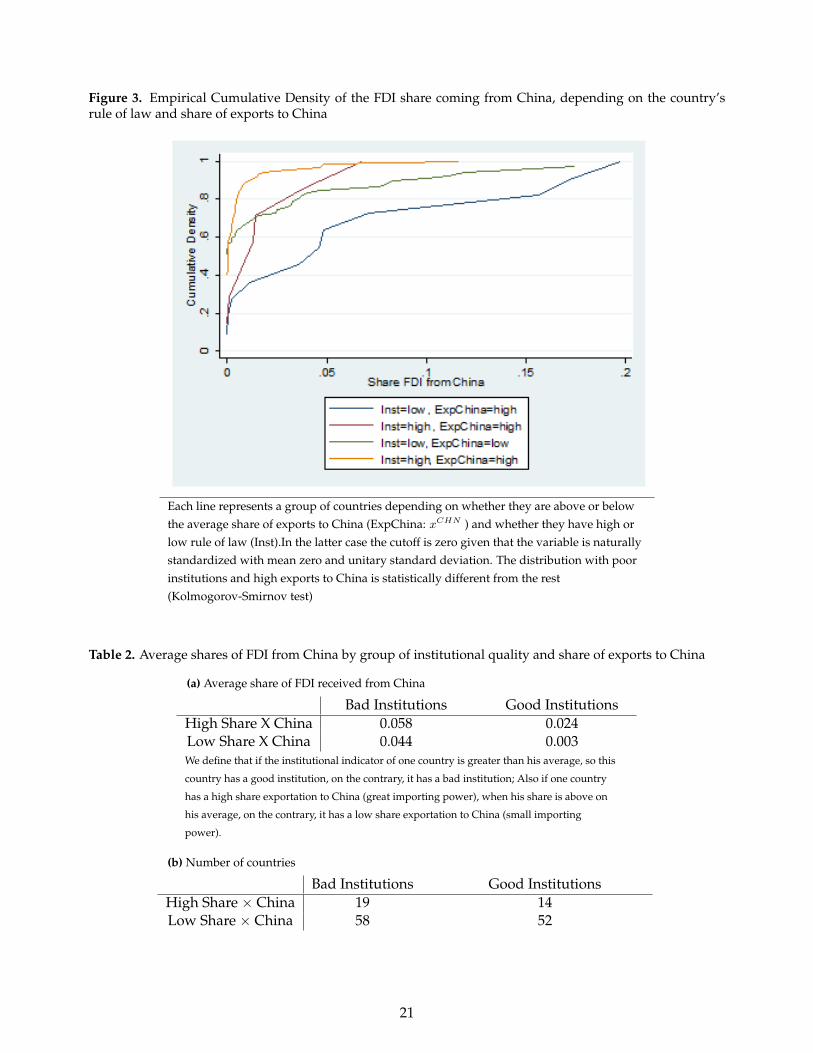
Figure 3. Empirical Cumulative Density of the FDI share coming from China, depending on the country’srule of law and share of exports to China
Each line represents a group of countries depending on whether they are above or belowthe average share of exports to China (ExpChina: xCHN ) and whether they have high orlow rule of law (Inst).In the latter case the cutoff is zero given that the variable is naturallystandardized with mean zero and unitary standard deviation. The distribution with poorinstitutions and high exports to China is statistically different from the rest(Kolmogorov-Smirnov test)
Table 2. Average shares of FDI from China by group of institutional quality and share of exports to China
(a) Average share of FDI received from China
Bad Institutions Good InstitutionsHigh Share X China 0.058 0.024Low Share X China 0.044 0.003We define that if the institutional indicator of one country is greater than his average, so this
country has a good institution, on the contrary, it has a bad institution; Also if one country
has a high share exportation to China (great importing power), when his share is above on
his average, on the contrary, it has a low share exportation to China (small importing
power).
(b) Number of countries
Bad Institutions Good InstitutionsHigh Share × China 19 14Low Share × China 58 52
21
4 Regression analysis
Consistent with the theory and hypothesis formulated above, our empirical specification includes insti-
tutions and importing power (xCHN ) as well as their interaction as explanatory variables. More precisely,
the main estimated equation is:
sCHNFDI j = α+ β1 ∗ institutionj + β2 ∗ xCHNj + β3institutionsj ∗ xCHNi + γ ∗ Zj + µj + εj
where sCHNFDI ic stands for China’s share of overall FDI flow to economy i; institutioni stands for rule of
law in economy i and xCHNj represents the country´s export share to China. Z is a set of control variables
discussed in the data section.
Our model predicts that β3 < 0 meaning that when institutions < 0 (where zero is the normalized
mean), then higher levels of exports to China are associated with more comparative advantage of China
as an investor.
Since foreign investment is lumpy, we do not expect this relationship to hold year by year in our sample.
As a result, instead of employing panel estimation techniques we restrict to a cross-section. We perform
OLS estimations using the average of Chinese outward FDI to the recipient countries for the period
2003-2007. 31
4.1 Extensive margin results
Tables 3 and 4 display the main evidence supporting our model, because the coefficient β3 shows up as
negative and statistically significant in a relevant range of cases.
In Tables 3specification (2) we pool FDI in all sectors and find that the interaction between institutions
and share of exports to China (β3) is significant; while the simple existence of Chinese importing power
or Institutions do not appear as significant. A coefficient of minus 7.4 percentage points can be inter-
preted as additional 2 percentage points of Chinese FDI over the total, for a country that exports 1/4 of
its value to China and has rule of law at the level of Argentina or Venezuela (i.e. institutions ' −1).
When we decompose the effect between tradables and non-tradables in specifications (3) and (4), we
observe that the aggregate effect that we reported on (2) was due to non-tradables; with a coefficient of
a similar magnitude than in the aggregate.That means that the Chinese are disproportionally investing
in infrastructure and other activities that they do not directly export.31This is also consistent with other studies of FDI flows, which smooth FDI flows by using period averages. As mentioned
before, to avoid our mechanism to be confounded with other phenomenon in the the Financial Crisis, we exclude the period2008-2009.
22
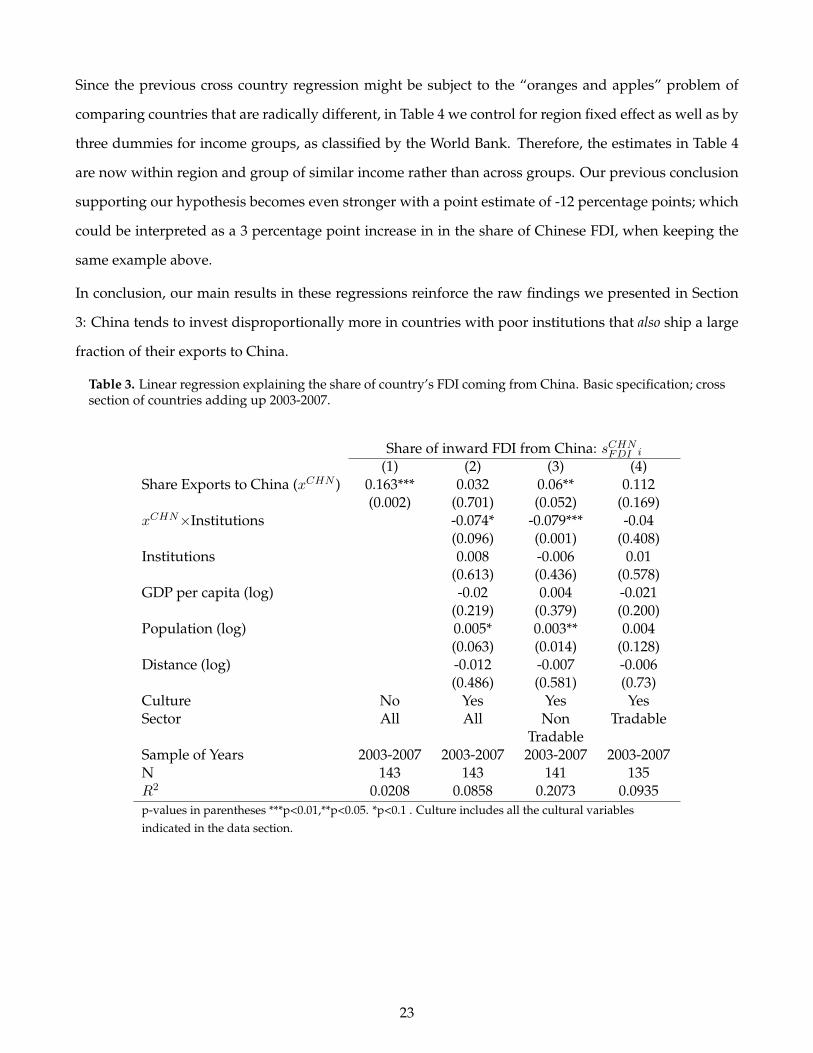
Since the previous cross country regression might be subject to the “oranges and apples” problem of
comparing countries that are radically different, in Table 4 we control for region fixed effect as well as by
three dummies for income groups, as classified by the World Bank. Therefore, the estimates in Table 4
are now within region and group of similar income rather than across groups. Our previous conclusion
supporting our hypothesis becomes even stronger with a point estimate of -12 percentage points; which
could be interpreted as a 3 percentage point increase in in the share of Chinese FDI, when keeping the
same example above.
In conclusion, our main results in these regressions reinforce the raw findings we presented in Section
3: China tends to invest disproportionally more in countries with poor institutions that also ship a large
fraction of their exports to China.
Table 3. Linear regression explaining the share of country’s FDI coming from China. Basic specification; crosssection of countries adding up 2003-2007.
Share of inward FDI from China: sCHNFDI i
(1) (2) (3) (4)Share Exports to China (xCHN ) 0.163*** 0.032 0.06** 0.112
(0.002) (0.701) (0.052) (0.169)xCHN×Institutions -0.074* -0.079*** -0.04
(0.096) (0.001) (0.408)Institutions 0.008 -0.006 0.01
(0.613) (0.436) (0.578)GDP per capita (log) -0.02 0.004 -0.021
(0.219) (0.379) (0.200)Population (log) 0.005* 0.003** 0.004
(0.063) (0.014) (0.128)Distance (log) -0.012 -0.007 -0.006
(0.486) (0.581) (0.73)Culture No Yes Yes YesSector All All Non
TradableTradable
Sample of Years 2003-2007 2003-2007 2003-2007 2003-2007N 143 143 141 135R2 0.0208 0.0858 0.2073 0.0935p-values in parentheses ***p<0.01,**p<0.05. *p<0.1 . Culture includes all the cultural variablesindicated in the data section.
23
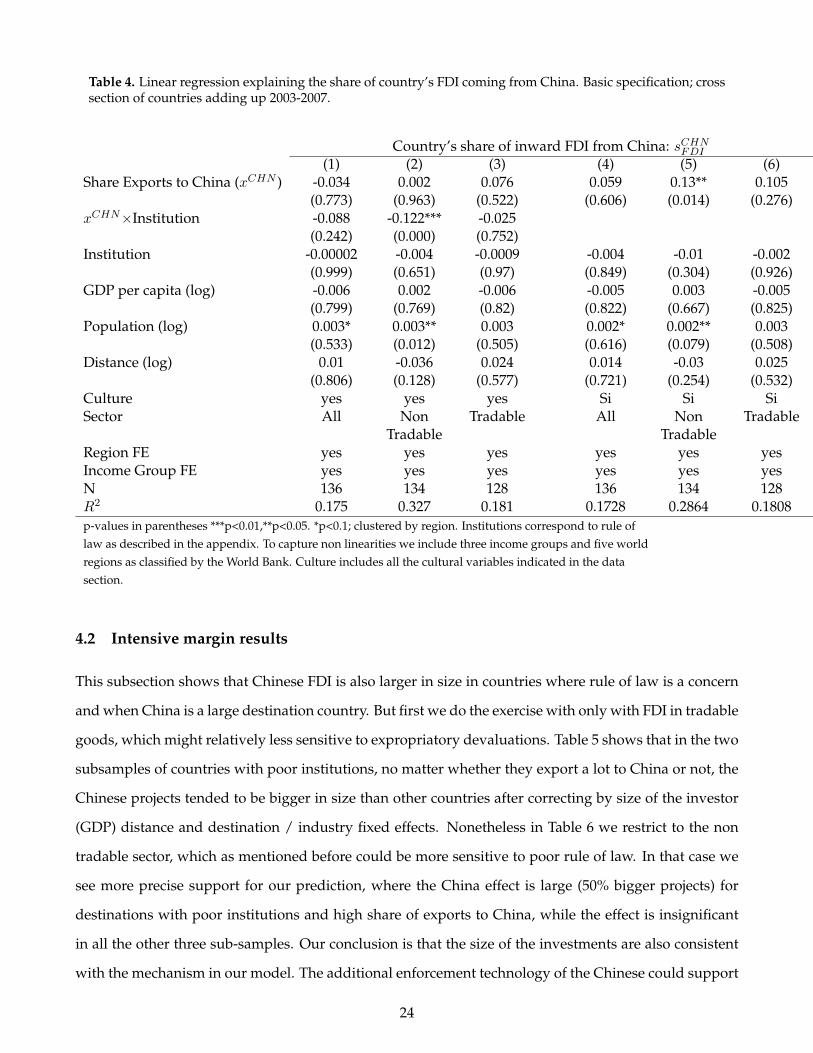
Table 4. Linear regression explaining the share of country’s FDI coming from China. Basic specification; crosssection of countries adding up 2003-2007.
Country’s share of inward FDI from China: sCHNFDI
(1) (2) (3) (4) (5) (6)Share Exports to China (xCHN ) -0.034 0.002 0.076 0.059 0.13** 0.105
(0.773) (0.963) (0.522) (0.606) (0.014) (0.276)xCHN×Institution -0.088 -0.122*** -0.025
(0.242) (0.000) (0.752)Institution -0.00002 -0.004 -0.0009 -0.004 -0.01 -0.002
(0.999) (0.651) (0.97) (0.849) (0.304) (0.926)GDP per capita (log) -0.006 0.002 -0.006 -0.005 0.003 -0.005
(0.799) (0.769) (0.82) (0.822) (0.667) (0.825)Population (log) 0.003* 0.003** 0.003 0.002* 0.002** 0.003
(0.533) (0.012) (0.505) (0.616) (0.079) (0.508)Distance (log) 0.01 -0.036 0.024 0.014 -0.03 0.025
(0.806) (0.128) (0.577) (0.721) (0.254) (0.532)Culture yes yes yes Si Si SiSector All Non
TradableTradable All Non
TradableTradable
Region FE yes yes yes yes yes yesIncome Group FE yes yes yes yes yes yesN 136 134 128 136 134 128R2 0.175 0.327 0.181 0.1728 0.2864 0.1808p-values in parentheses ***p<0.01,**p<0.05. *p<0.1; clustered by region. Institutions correspond to rule oflaw as described in the appendix. To capture non linearities we include three income groups and five worldregions as classified by the World Bank. Culture includes all the cultural variables indicated in the datasection.
4.2 Intensive margin results
This subsection shows that Chinese FDI is also larger in size in countries where rule of law is a concern
and when China is a large destination country. But first we do the exercise with only with FDI in tradable
goods, which might relatively less sensitive to expropriatory devaluations. Table 5 shows that in the two
subsamples of countries with poor institutions, no matter whether they export a lot to China or not, the
Chinese projects tended to be bigger in size than other countries after correcting by size of the investor
(GDP) distance and destination / industry fixed effects. Nonetheless in Table 6 we restrict to the non
tradable sector, which as mentioned before could be more sensitive to poor rule of law. In that case we
see more precise support for our prediction, where the China effect is large (50% bigger projects) for
destinations with poor institutions and high share of exports to China, while the effect is insignificant
in all the other three sub-samples. Our conclusion is that the size of the investments are also consistent
with the mechanism in our model. The additional enforcement technology of the Chinese could support
24
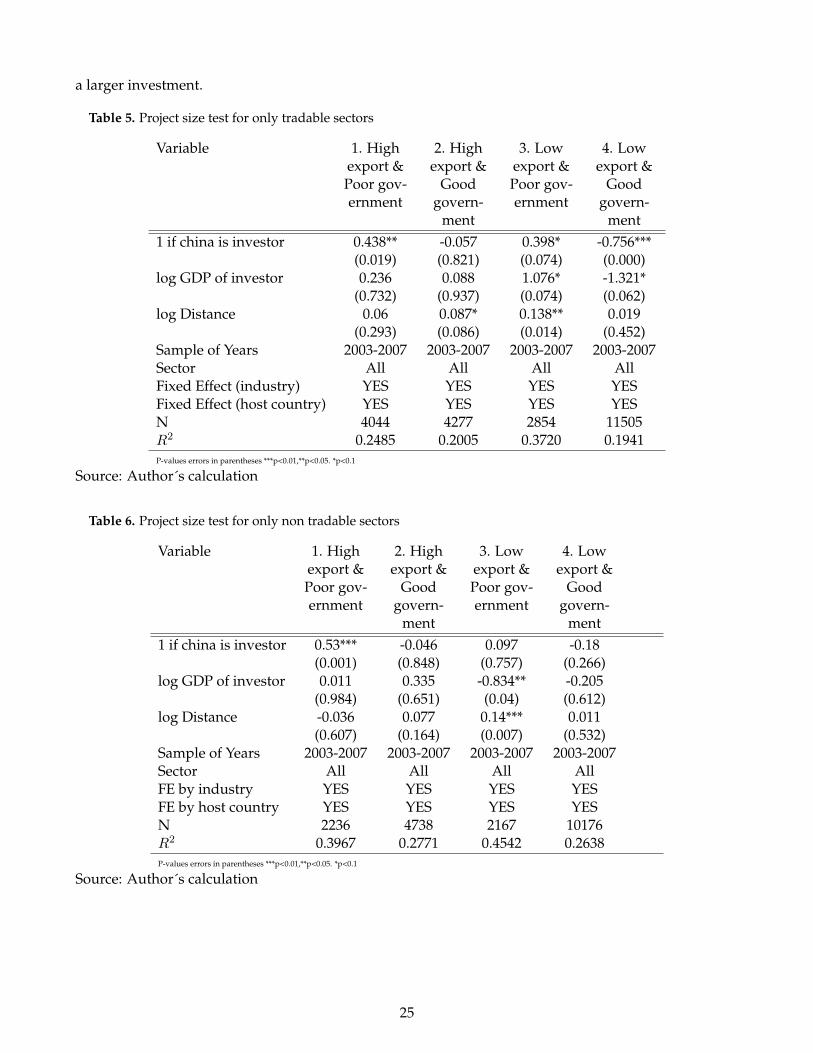
a larger investment.
Table 5. Project size test for only tradable sectors
Variable 1. Highexport &Poor gov-ernment
2. Highexport &
Goodgovern-
ment
3. Lowexport &Poor gov-ernment
4. Lowexport &
Goodgovern-
ment1 if china is investor 0.438** -0.057 0.398* -0.756***
(0.019) (0.821) (0.074) (0.000)log GDP of investor 0.236 0.088 1.076* -1.321*
(0.732) (0.937) (0.074) (0.062)log Distance 0.06 0.087* 0.138** 0.019
(0.293) (0.086) (0.014) (0.452)Sample of Years 2003-2007 2003-2007 2003-2007 2003-2007Sector All All All AllFixed Effect (industry) YES YES YES YESFixed Effect (host country) YES YES YES YESN 4044 4277 2854 11505R2 0.2485 0.2005 0.3720 0.1941P-values errors in parentheses ***p<0.01,**p<0.05. *p<0.1
Source: Author´s calculation
Table 6. Project size test for only non tradable sectors
Variable 1. Highexport &Poor gov-ernment
2. Highexport &
Goodgovern-
ment
3. Lowexport &Poor gov-ernment
4. Lowexport &
Goodgovern-
ment1 if china is investor 0.53*** -0.046 0.097 -0.18
(0.001) (0.848) (0.757) (0.266)log GDP of investor 0.011 0.335 -0.834** -0.205
(0.984) (0.651) (0.04) (0.612)log Distance -0.036 0.077 0.14*** 0.011
(0.607) (0.164) (0.007) (0.532)Sample of Years 2003-2007 2003-2007 2003-2007 2003-2007Sector All All All AllFE by industry YES YES YES YESFE by host country YES YES YES YESN 2236 4738 2167 10176R2 0.3967 0.2771 0.4542 0.2638P-values errors in parentheses ***p<0.01,**p<0.05. *p<0.1
Source: Author´s calculation
25
5 Exploring alternative explanations
Is intra-firm trade causing our results? Sending more FDI to destination countries from where you im-
port more can be caused by intra-firm trade. For example, one can argue that the Chinese want to own the
copper mines and soybean fields that produce the products they import; analogous to what Antras (2003)
modeled for the case of the US; where almost 40% of imports come from intra-firm transactions. This
channel obviously links FDI with import shares. Adding one more layer, one can argue that the value
of ownership might be more important in places with poor institutions, where contracts are harder to
enforce. This could potentially explain our interaction coefficient “Exports to China×Institutions” (β3).
In the International Business literature, there is a similar rationalization called “resource seeking” FDI, a
view under which China may want to secure the resources it imports. As plausible as it sounds, how-
ever, this alternative explanation does not seem to explain our findings. The crucial counter-argument
we provide is that this family of theories would predict that the tradable sector is receiving the dispro-
portionate investment by China. But Tables 3and 4 showed that the effect is not in tradable goods like
copper or soybean; but in non-tradables like roads, transmission lines or banks. We are not claiming that
the ownership of tradable assets is unimportant for China, but simply that our facts are unlikely to be
explained by this alternative theory
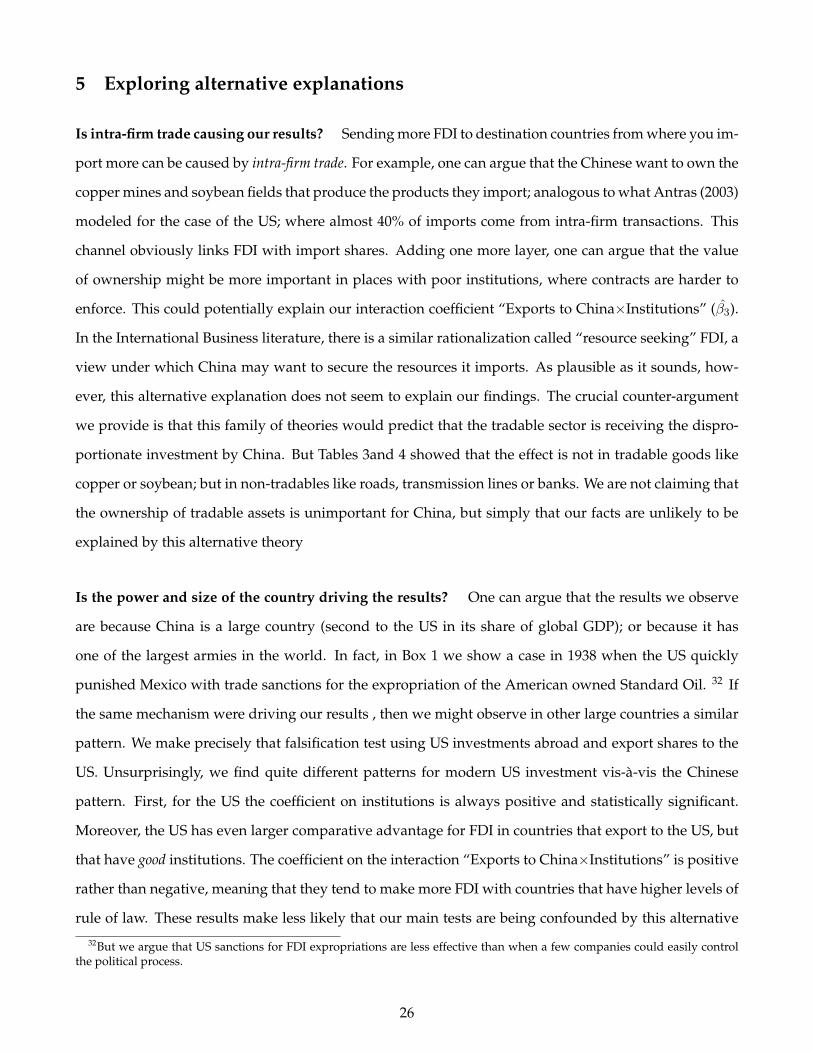
Is the power and size of the country driving the results? One can argue that the results we observe
are because China is a large country (second to the US in its share of global GDP); or because it has
one of the largest armies in the world. In fact, in Box 1 we show a case in 1938 when the US quickly
punished Mexico with trade sanctions for the expropriation of the American owned Standard Oil. 32 If
the same mechanism were driving our results , then we might observe in other large countries a similar
pattern. We make precisely that falsification test using US investments abroad and export shares to the
US. Unsurprisingly, we find quite different patterns for modern US investment vis-à-vis the Chinese
pattern. First, for the US the coefficient on institutions is always positive and statistically significant.
Moreover, the US has even larger comparative advantage for FDI in countries that export to the US, but
that have good institutions. The coefficient on the interaction “Exports to China×Institutions” is positive
rather than negative, meaning that they tend to make more FDI with countries that have higher levels of
rule of law. These results make less likely that our main tests are being confounded by this alternative
32But we argue that US sanctions for FDI expropriations are less effective than when a few companies could easily controlthe political process.
26
explanation.
Table 7. Falsification test. Analogous to Regression Table ?? but for the United States instead of China as aninvesting source
(1) (2) (3) (4)Importing Power 0.377*** 0.37*** 0.413** 0.45***
(0.000) (0.001) (0.025) (0.001)Importing Power×Institution 0.029 0.183* 0.09
(0.756) (0.09) (0.414)Institution 0.06*** 0.04 0.05**
(0.008) (0.101) (0.021)GDP 0.004 0.0008 0.007
(0.73) (0.946) (0.483)Distance -0.04 0.03 -0.08*
(0.252) (0.544) (0.071)Culture No Yes Yes YesSample of Years 2003-2007 2003-2007 2003-2007 2003-2007Sector All All Non
TradableTradable
N 132 132 131 126R2 0.1299 0.2788 0.2063 0.3437P-values errors in parentheses ***p<0.01,**p<0.05. *p<0.1
Endogenous trade to get loans
For simplicity we treated trade with China (xCHN ) as a predetermined variable. Nonetheless, there are
countries with poor institutions and with some exports to China, but not enough to sustain very large
investments. Their lack of foreign finance may lead these countries to engage in further fundamental
transformation - in Oliver Williamson’s sense - and build a stronger relationship with China so they can
later use it as “collateral” for a loan or investment. In terms of Figure 2 this would be a purposeful
agreement with China to move the country vertically, from the gray zone into the red-zone where the
relationship sustains investment. A relevant case seems to be Venezuela post 2008 which has received
more than $40 billion dollars according to Sanderson and Forsythe (2012). Box # 2 describes the case
showing how the China-Venezuela deals increase credible punishment through the use of guarantees
and commodity-based collateral. In short, although we are not modeling the endogeneity of trade, the
main channel remarked in our paper is still present, since multi-market contact allows China to invest
with less exposure to expropriation risk. (see also Section 7.3).
27
Other alternative explanations. Two related but different alternative explanations for our facts would
be that the Chinese are either (i) giving “gifts” to the recipient country or are (ii) exploiting synergies
between non-tradable goods and the product they export (e.g. building a road to get the product to the
port). Regarding aid and gifts, they should not be recorded as FDI greenfield. Regarding synergies with
exports to China, one can plausibly think that the firms/countries that benefit the most from exporting
have incentives to build complementary infrastructure, as predicted by the theory of private provision of
public goods (e.g.Bergstrom, Blume, and Varian, 1986). It is much less obvious, however, why Chinese
firms do it though ownership rather than as an arms-length transaction, which would not be classified
as FDI. Even if in some cases Chinese construction companies are building a particular infrastructure,
that is not sufficient to understand why is it that they want to own the assets. One possible explanation
is coordination. As described by Sanderson and Forsythe (2012) different Chinese firms in Ethiopia
could build the infrastructure, finance the project, export the product, while another Chinese firm is
the main buyer. Certainly firm capabilities are important for this coordination and in the same book
there is an extensive discussion on how the China Development Bank learned first to invest in Chinese
Provinces with relatively poor access to finance, and only then expanded massively overseas. This level
of coordination is close to what Blanchard and Kremer (1997) remark happened in Russia until the 1980s,
a form of coordination mediated by government coercion. But for operating overseas Chinese need to
go beyond a strong national authority to coordinate. Thus, even in this more convoluted story one needs
to have the buying power in the last stage of the game as a way to guarantee the stability of the other
agreements, which makes us come back to the spirit of our model.
28
6 Concluding remarks
Modern economic research remarks rule of law almost as a prerequisite for investment, especially if
foreigners need to trust your country’s rules. Unfortunately, however, institutions are hard and slow to
change. But despite this institutional inertia China has been able to lend to countries with poor rule of
law, especially if they export a large share to China.
We explain this by the interaction of oligopsonistic power, combined with China’s comparative ability to
coordinate policy actions within the country and act as a single agent in case of expropriation. In short,
we argue that that China could use this to create a superior commercial mechanism to enforce contracts
overseas, mitigating the pervasive problem arising from the “lack of a supranational legal authority, capable
of enforcing contracts across borders” (Obstfeld and Rogoff, 1996).
Our empirical analysis is consistent with our simple model of an “institutional shortcut” to secure FDI.
First, Chinese FDI is disproportionally directed to countries with poor institutions when a large share
of exports goes to China. In contrast, simply having poor institutions does not seem a robust predictor.
Second, we find that the effect is disproportionally for FDI in non-tradable goods; meaning that our results
are not explained by models in which multinationals prefer to own the assets producing what they
import (e.g. Antras, 2003). Third is the intensive margin, with Chinese projects being 50% bigger in size
than those of other countries in the same destination, but when both conditions are met: poor institutions
and high export share to China.
We want to end by remarking two practical implications and a challenge. First, for non-Chinese multi-
nationals our results suggest the potential benefits (although not the costs) of penetrating countries with
poor institutions through a joint venture with Chinese companies. Even if Chinese multinationals may
not provide knowledge of the destination market, which is one of the standard missing inputs remarked
by Khanna and Palepu (2010), they can in principle provide better de facto property rights when that
is the binding constraint for investment. What do we do not know, however, is how much of the joint
investment would be backed by the “full power of the Chinese government”. A second implication of
our work is an additional channel in which high Chinese growth might expand capital flows to devel-
oping nations, since higher share of exports going to China could guarantee larger amounts of FDI and
sovereign lending. To finish we have to acknowledge one data limitation of our study that forced us to
focus solely on FDI, since we have good data by source. Future researchers may want to formally test
our theory as better global data on Chinese lending to sovereigns becomes available.
29
References
Alessia Amighini, R. R., Sanfilippo, M., 2012. China’s Outward FDI: An Industry-level Analysis of HostCountry Determinants. CESifo Working Papers.
Alfaro, L., 2003. Foreign direct investment and growth: Does the sector matter? Harvard Business Schoolworking paper.
Alfaro, L., Kalemli-Ozcan, S., Volosovych, V., 2008. Why Doesn’t Capital Flow From Rich To Poor Coun-tries? An Empirical Investigation. The Review of Economics and Statistics 90 (2), 347–368.
Antras, P., 2003. Firms, contracts, and trade structure. The Quarterly Journal of Economics 118 (4), pp.1375–1418.URL http://www.jstor.org/stable/25053942
Bell, C., 1988. Chapter 16 credit markets and interlinked transactions. Vol. 1 of Handbook of Develop-ment Economics. Elsevier, pp. 763 – 830.URL http://www.sciencedirect.com/science/article/pii/S1573447188010198
Bergstrom, T., Blume, L., Varian, H., 1986. On the private provision of public goods. Journal of publiceconomics 29 (1), 25–49.
Blanchard, O., Kremer, M., 1997. Disorganization. The Quarterly Journal of Economics 112 (4), 1091–1126.URL http://qje.oxfordjournals.org/content/112/4/1091.abstract
Blonigen, B., 2005. A review of the empirical literature on fdi determinants. Atlantic Economic Journal33, 383–403.
Borensztein, E., De Gregorio, J., Lee, J.-W., 1998. How does foreign direct investment affect economicgrowth? Journal of International Economics 45 (1), 115 – 135.URL http://www.sciencedirect.com/science/article/pii/S0022199697000330
Branstetter, L. G., Feenstra, R. C., 2002. Trade and foreign direct investment in China: a political economyapproach. Journal of International Economics 58, 335–358.URL http://www.nber.org/papers/w7100.pdf
Buckley, P. J., Clegg, L. J., Cross, A. R., Liu, X., Voss, H., Zheng, P., 2007. The determinants of chineseoutward foreign direct investment. Journal of International Business Studies 38, 499–518.
Bulow, J., Rogoff, K., 1989. Sovereign debt: Is to forgive to forget? The American Economic Review 79 (1),pp. 43–50.URL http://www.jstor.org/stable/1804772
Dixit, A., 2005. Lawlessness and Economics. Priceton University Press.
Dooley, M. P., Garber, P. M., Folkerts-Landau, D., June 2007. The two crises of international eco-nomics (13197).URL http://www.nber.org/papers/w13197
Eaton, J., Engers, M., 1992. Sanctions. Journal of Political Economy 100 (5), pp. 899–928.URL http://www.jstor.org/stable/2138628
30
Eaton, J., Fernandez, R., 1995. Sovereign debt. In: Grossman, G. M., Rogoff, K. (Eds.), Handbook ofinternational economics. Vol. 3. Amsterdam: North Holland.
Ellis, E., 2011. Chinese Soft Power in Latin America: A Case Study. Joint Force Quarterly 60 (1).
Engel, E., Fischer, R., January 2008. Optimal resource extraction contracts under threat of expropria-tion (13742).URL http://www.nber.org/papers/w13742
Fuchs, A., Klann, N.-H., 2010. Paying a Visit: The "Dalai Lama Effect" on International Trade. Mimeo.
Gallagher, K. P., Irwin, A., Koleski, K., 2012. The New Banks in Town: Chinese Finance in Latin America.Inter-American Dialogue Report (March).URL http://ase.tufts.edu/gdae/Pubs/rp/GallagherChineseFinanceLatinAmericaBrief.pdf
Haroz, D., 2011. "china in africa: Symbiosis or exploitation?". The Fletcher Forum of World Affairs 35 (2),65–88.
Hausmann, R., Fernández-Arias, E., 2000. Foreign Direct Investment:Good Cholesterol? Prepared forthe Conference The New Wave of Capital Inflows: Sea Change or Just Another Tide? Inter AmericanDevelopment Bank.
Hirschman, A. O., 1945. National power and the structure of foreign trade.URL http://www.stanford.edu/class/polisci243c/readings/v0002108.pdf
Javorcik, B. S., 2004. Does Foreign Direct Investment Increase the Productivity of Domestic Firms? InSearch of Spillovers Through Backward Linkages. American Economic Review 3 (1), 605–627.
Javorcik, B. S., Spatareanu, M., 2008. To share or not to share: Does local participation matter forspillovers from foreign direct investment? Journal of Development Economics 85 (1-2), 194 – 217.URL http://www.sciencedirect.com/science/article/pii/S0304387806001398
Khanna, T., Palepu, K. G., 2010. Winning in Emerging Markets: A Road Map for Strategy and Execution.
Kolstad, I., Wiig, A., 2012. What determines chinese outward fdi? Journal of World Business 47, 26–34.
Maurer, N., 2013. The Empire Trap - The Rise and Fall of U.S. Intervention to Protect American PropertyOverseas 1893-2012. Princeton University Press.
Morck, R., Y. B., Zhao, M., 2008. Perspectives on China’s outward foreign direct investment. Journal ofInternational Business Studies 39, 337–350.
Obstfeld, M., Rogoff, K. S., 1996. Foundations of international macroeconomics. MIT press Cambridge,MA.
Olson, M., 2000. Power and prosperity: Outgrowing communist and capitalist dictatorships. Basic books.
Onjala, J., 2008. A scoping study on china-africa economic relations: the case of kenya. re-port prepared for African Economic Research Consortium (5 March). See at www. aercafrica.org/documents/china_africa_relations/Kenya. pdf.
Petersen, M. A., Rajan, R. G., 1995. The effect of credit market competition on lending relationships. TheQuarterly Journal of Economics 110 (2), pp. 407–443.URL http://www.jstor.org/stable/2118445
Quer, D., C. E., Rienda, L., 2011. Political risk, cultural distance, and outward foreign direct investment:Empirical evidence from large chinese firms. Asia Pacific Journal of Management, 1–16.
31
Rauch, J., 1999. Networks versus markets in international trade. Journal of International Economics48 (1), 7–35.
Salidjanova, N., 2011. Going out: An overview of China’s outward foreign direct investment. ChinaEconomic & Security Review Commission Staff Research Report.
Sanderson, H., Forsythe, M., 2012. China’s Superbank: Debt, Oil and Influence-How China DevelopmentBank is Rewriting the Rules of Finance. Bloomberg Press.
Schuler, F. E., 2000. Mexico between Hitler and Roosevelt. Mexican Foreigns Relations in the Age ofLázaro Cárdenas 1934-1949. University of New Mexico Press.
Shleifer, A., Vishny, R., 1993. Corruption. The Quarterly Journal of Economics.
Wei, S.-J., May 2000. How taxing is corruption on international investors? Review of Economics andStatistics (6030).URL http://www.nber.org/papers/w6030
Yeung, H. W., Liu, W., 2008. Globalizing china: The rise of mainland firms in the global economy.Eurasian Geography and Economics 49, 57–86.
7 Extending the Model: acquisitions, re-investment and endogenous
export-FDI relation.
Before testing Proposition 1 we would briefly discuss a additional predictions when we extend our basic
framework We would consider three cases. First we explore the incentives to transfer FDI ownership
from Developed economies to the Chinese in case there is an unexpected increase in the recipient coun-
try’s temptation to expropriate. Second, we explore the welfare consequences when China invests in
projects that were previously expropriated from other investors, what for simplicity we call “vulture
FDI”. Third we analyze the incentives to increase exports to China as a way to later use it as “collat-
eral” that could make more Chinese FDI viable. The reader that is not interested in these additional
predictions can simply jump to our empirical tests that continue in section 4.
7.1 Ex-post acquisition of the asset by another foreign investor
In our basic framework there is no motive for a change in ownership, but here we consider an increase
in the expropriation temptation as a motive to rationalize Chinese acquisitions.
Imagine that after investment F is sunk but before the potential expropriation takes place (i.e. t = 1), the
recipient country unexpectedly suffers an increase in its temptation to expropriate ej , represented by an
32
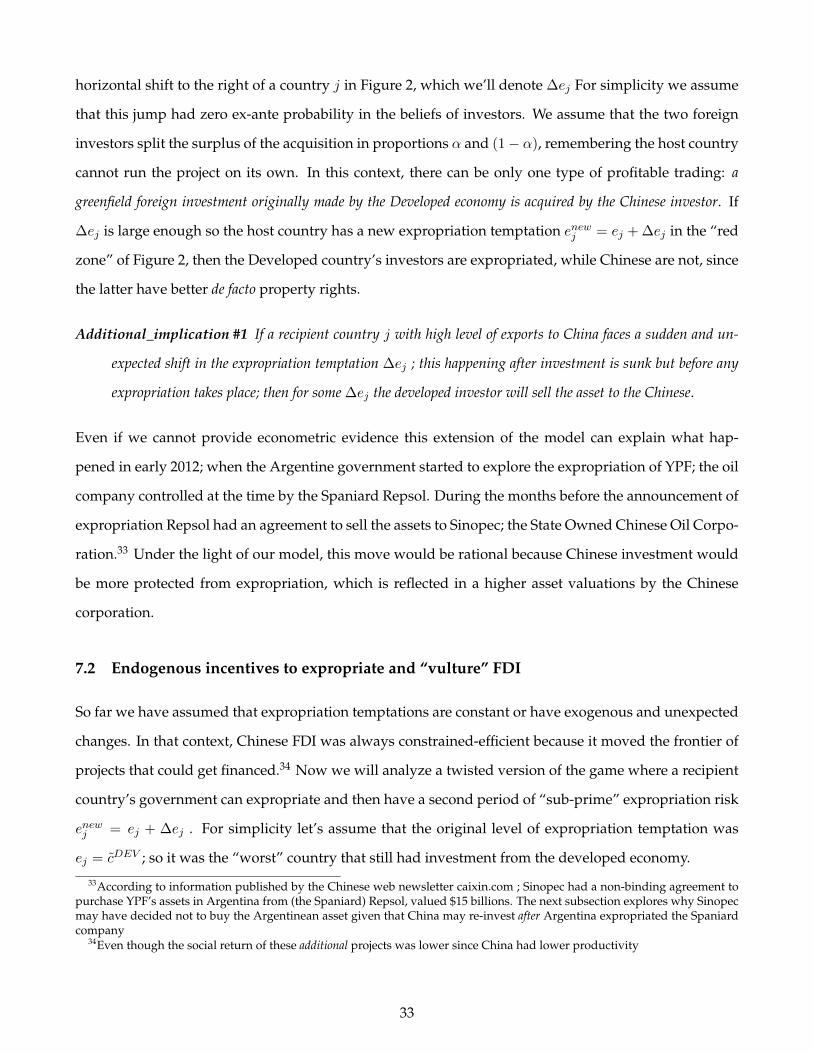
horizontal shift to the right of a country j in Figure 2, which we’ll denote ∆ej For simplicity we assume
that this jump had zero ex-ante probability in the beliefs of investors. We assume that the two foreign
investors split the surplus of the acquisition in proportions α and (1− α), remembering the host country
cannot run the project on its own. In this context, there can be only one type of profitable trading: a
greenfield foreign investment originally made by the Developed economy is acquired by the Chinese investor. If
∆ej is large enough so the host country has a new expropriation temptation enewj = ej + ∆ej in the “red
zone” of Figure 2, then the Developed country’s investors are expropriated, while Chinese are not, since
the latter have better de facto property rights.
Additional_implication #1 If a recipient country j with high level of exports to China faces a sudden and un-
expected shift in the expropriation temptation ∆ej ; this happening after investment is sunk but before any
expropriation takes place; then for some ∆ej the developed investor will sell the asset to the Chinese.
Even if we cannot provide econometric evidence this extension of the model can explain what hap-
pened in early 2012; when the Argentine government started to explore the expropriation of YPF; the oil
company controlled at the time by the Spaniard Repsol. During the months before the announcement of
expropriation Repsol had an agreement to sell the assets to Sinopec; the State Owned Chinese Oil Corpo-
ration.33 Under the light of our model, this move would be rational because Chinese investment would
be more protected from expropriation, which is reflected in a higher asset valuations by the Chinese
corporation.
7.2 Endogenous incentives to expropriate and “vulture” FDI
So far we have assumed that expropriation temptations are constant or have exogenous and unexpected
changes. In that context, Chinese FDI was always constrained-efficient because it moved the frontier of
projects that could get financed.34 Now we will analyze a twisted version of the game where a recipient
country’s government can expropriate and then have a second period of “sub-prime” expropriation risk
enewj = ej + ∆ej . For simplicity let’s assume that the original level of expropriation temptation was
ej = cDEV ; so it was the “worst” country that still had investment from the developed economy.
33According to information published by the Chinese web newsletter caixin.com ; Sinopec had a non-binding agreement topurchase YPF’s assets in Argentina from (the Spaniard) Repsol, valued $15 billions. The next subsection explores why Sinopecmay have decided not to buy the Argentinean asset given that China may re-invest after Argentina expropriated the Spaniardcompany
34Even though the social return of these additional projects was lower since China had lower productivity
33
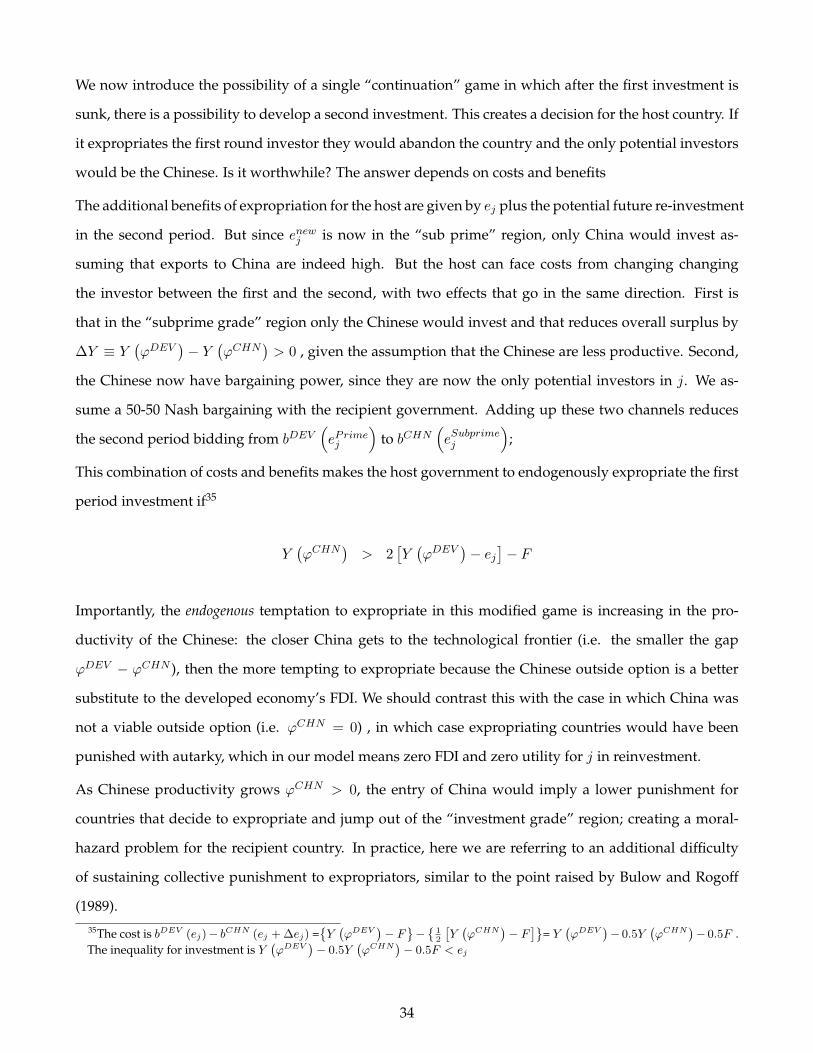
We now introduce the possibility of a single “continuation” game in which after the first investment is
sunk, there is a possibility to develop a second investment. This creates a decision for the host country. If
it expropriates the first round investor they would abandon the country and the only potential investors
would be the Chinese. Is it worthwhile? The answer depends on costs and benefits
The additional benefits of expropriation for the host are given by ej plus the potential future re-investment
in the second period. But since enewj is now in the “sub prime” region, only China would invest as-
suming that exports to China are indeed high. But the host can face costs from changing changing
the investor between the first and the second, with two effects that go in the same direction. First is
that in the “subprime grade” region only the Chinese would invest and that reduces overall surplus by
∆Y ≡ Y(ϕDEV
)− Y
(ϕCHN
)> 0 , given the assumption that the Chinese are less productive. Second,
the Chinese now have bargaining power, since they are now the only potential investors in j. We as-
sume a 50-50 Nash bargaining with the recipient government. Adding up these two channels reduces
the second period bidding from bDEV(ePrimej
)to bCHN
(eSubprimej
);
This combination of costs and benefits makes the host government to endogenously expropriate the first
period investment if35
Y(ϕCHN
)> 2
[Y(ϕDEV
)− ej
]− F
Importantly, the endogenous temptation to expropriate in this modified game is increasing in the pro-
ductivity of the Chinese: the closer China gets to the technological frontier (i.e. the smaller the gap
ϕDEV − ϕCHN ), then the more tempting to expropriate because the Chinese outside option is a better
substitute to the developed economy’s FDI. We should contrast this with the case in which China was
not a viable outside option (i.e. ϕCHN = 0) , in which case expropriating countries would have been
punished with autarky, which in our model means zero FDI and zero utility for j in reinvestment.
As Chinese productivity grows ϕCHN > 0, the entry of China would imply a lower punishment for
countries that decide to expropriate and jump out of the “investment grade” region; creating a moral-
hazard problem for the recipient country. In practice, here we are referring to an additional difficulty
of sustaining collective punishment to expropriators, similar to the point raised by Bulow and Rogoff
(1989).35The cost is bDEV (ej)− bCHN (ej + ∆ej) =
{Y(ϕDEV
)− F
}−{
12
[Y(ϕCHN
)− F
]}= Y
(ϕDEV
)− 0.5Y
(ϕCHN
)− 0.5F .
The inequality for investment is Y(ϕDEV
)− 0.5Y
(ϕCHN
)− 0.5F < ej
34
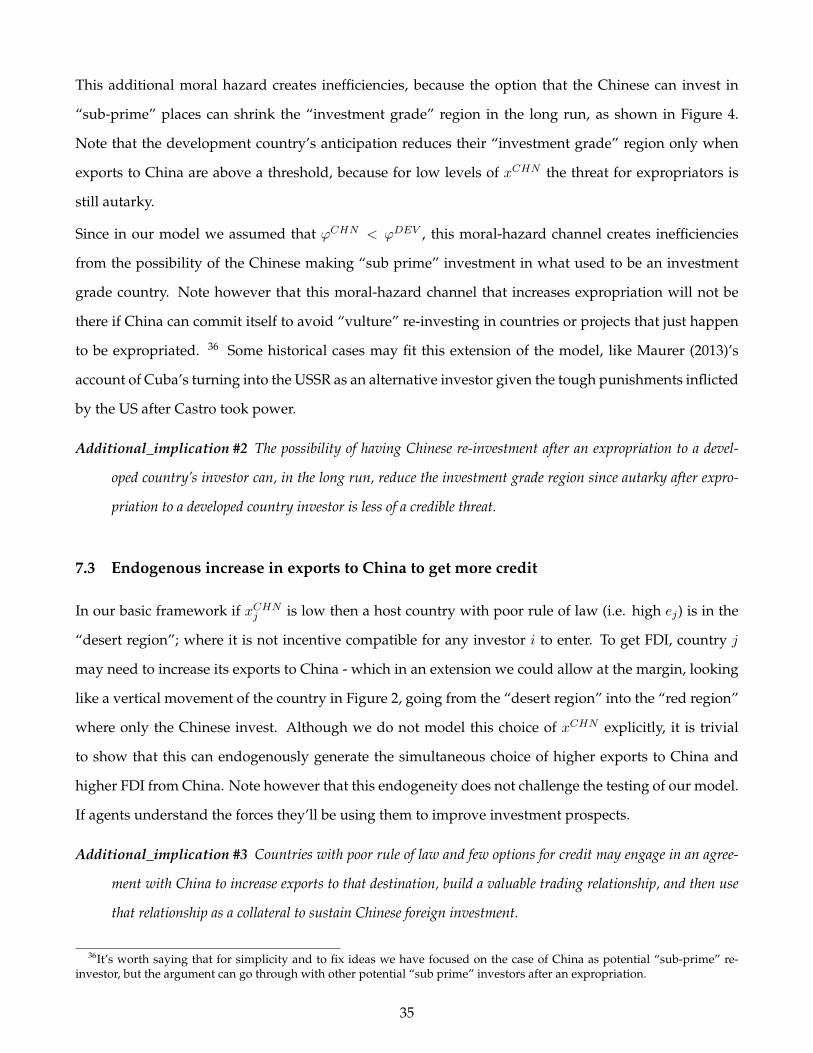
This additional moral hazard creates inefficiencies, because the option that the Chinese can invest in
“sub-prime” places can shrink the “investment grade” region in the long run, as shown in Figure 4.
Note that the development country’s anticipation reduces their “investment grade” region only when
exports to China are above a threshold, because for low levels of xCHN the threat for expropriators is
still autarky.
Since in our model we assumed that ϕCHN < ϕDEV , this moral-hazard channel creates inefficiencies
from the possibility of the Chinese making “sub prime” investment in what used to be an investment
grade country. Note however that this moral-hazard channel that increases expropriation will not be
there if China can commit itself to avoid “vulture” re-investing in countries or projects that just happen
to be expropriated. 36 Some historical cases may fit this extension of the model, like Maurer (2013)’s
account of Cuba’s turning into the USSR as an alternative investor given the tough punishments inflicted
by the US after Castro took power.
Additional_implication #2 The possibility of having Chinese re-investment after an expropriation to a devel-
oped country’s investor can, in the long run, reduce the investment grade region since autarky after expro-
priation to a developed country investor is less of a credible threat.
7.3 Endogenous increase in exports to China to get more credit
In our basic framework if xCHNj is low then a host country with poor rule of law (i.e. high ej) is in the
“desert region”; where it is not incentive compatible for any investor i to enter. To get FDI, country j
may need to increase its exports to China - which in an extension we could allow at the margin, looking
like a vertical movement of the country in Figure 2, going from the “desert region” into the “red region”
where only the Chinese invest. Although we do not model this choice of xCHN explicitly, it is trivial
to show that this can endogenously generate the simultaneous choice of higher exports to China and
higher FDI from China. Note however that this endogeneity does not challenge the testing of our model.
If agents understand the forces they’ll be using them to improve investment prospects.
Additional_implication #3 Countries with poor rule of law and few options for credit may engage in an agree-
ment with China to increase exports to that destination, build a valuable trading relationship, and then use
that relationship as a collateral to sustain Chinese foreign investment.
36It’s worth saying that for simplicity and to fix ideas we have focused on the case of China as potential “sub-prime” re-investor, but the argument can go through with other potential “sub prime” investors after an expropriation.
35
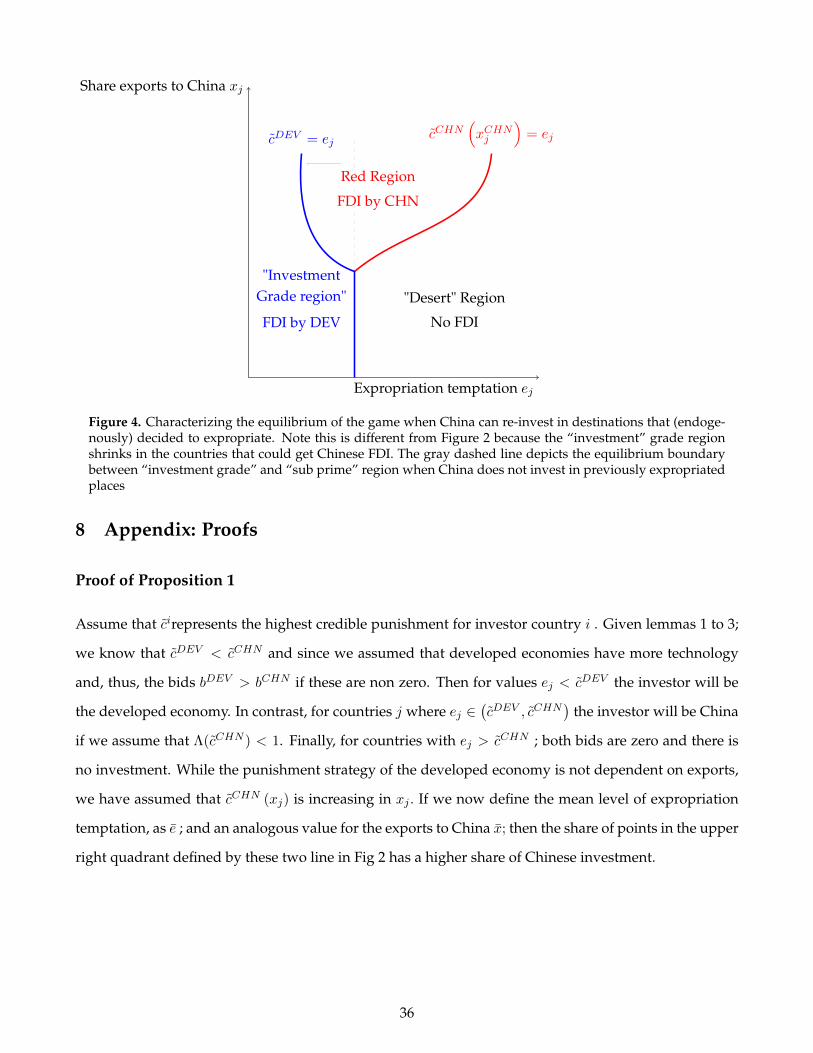
Share exports to China xj
Expropriation temptation ej
FDI by DEV
"InvestmentGrade region"
Red Region
FDI by CHN
"Desert" Region
No FDI
cCHN(xCHNj
)= ejcDEV = ej
Figure 4. Characterizing the equilibrium of the game when China can re-invest in destinations that (endoge-nously) decided to expropriate. Note this is different from Figure 2 because the “investment” grade regionshrinks in the countries that could get Chinese FDI. The gray dashed line depicts the equilibrium boundarybetween “investment grade” and “sub prime” region when China does not invest in previously expropriatedplaces
8 Appendix: Proofs
Proof of Proposition 1
Assume that cirepresents the highest credible punishment for investor country i . Given lemmas 1 to 3;
we know that cDEV < cCHN and since we assumed that developed economies have more technology
and, thus, the bids bDEV > bCHN if these are non zero. Then for values ej < cDEV the investor will be
the developed economy. In contrast, for countries j where ej ∈(cDEV , cCHN
)the investor will be China
if we assume that Λ(cCHN ) < 1. Finally, for countries with ej > cCHN ; both bids are zero and there is
no investment. While the punishment strategy of the developed economy is not dependent on exports,
we have assumed that cCHN (xj) is increasing in xj . If we now define the mean level of expropriation
temptation, as e ; and an analogous value for the exports to China x; then the share of points in the upper
right quadrant defined by these two line in Fig 2 has a higher share of Chinese investment.
36
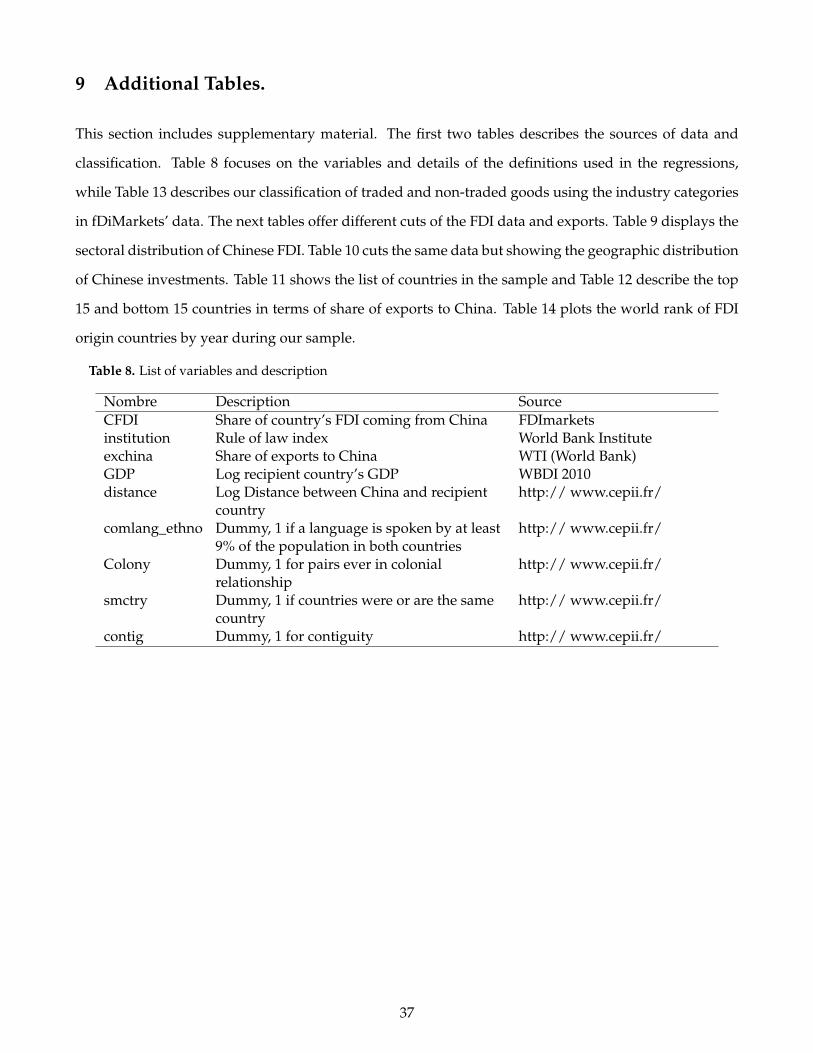
9 Additional Tables.
This section includes supplementary material. The first two tables describes the sources of data and
classification. Table 8 focuses on the variables and details of the definitions used in the regressions,
while Table 13 describes our classification of traded and non-traded goods using the industry categories
in fDiMarkets’ data. The next tables offer different cuts of the FDI data and exports. Table 9 displays the
sectoral distribution of Chinese FDI. Table 10 cuts the same data but showing the geographic distribution
of Chinese investments. Table 11 shows the list of countries in the sample and Table 12 describe the top
15 and bottom 15 countries in terms of share of exports to China. Table 14 plots the world rank of FDI
origin countries by year during our sample.
Table 8. List of variables and description
Nombre Description SourceCFDI Share of country’s FDI coming from China FDImarketsinstitution Rule of law index World Bank Instituteexchina Share of exports to China WTI (World Bank)GDP Log recipient country’s GDP WBDI 2010distance Log Distance between China and recipient
countryhttp:// www.cepii.fr/
comlang_ethno Dummy, 1 if a language is spoken by at least9% of the population in both countries
http:// www.cepii.fr/
Colony Dummy, 1 for pairs ever in colonialrelationship
http:// www.cepii.fr/
smctry Dummy, 1 if countries were or are the samecountry
http:// www.cepii.fr/
contig Dummy, 1 for contiguity http:// www.cepii.fr/
37
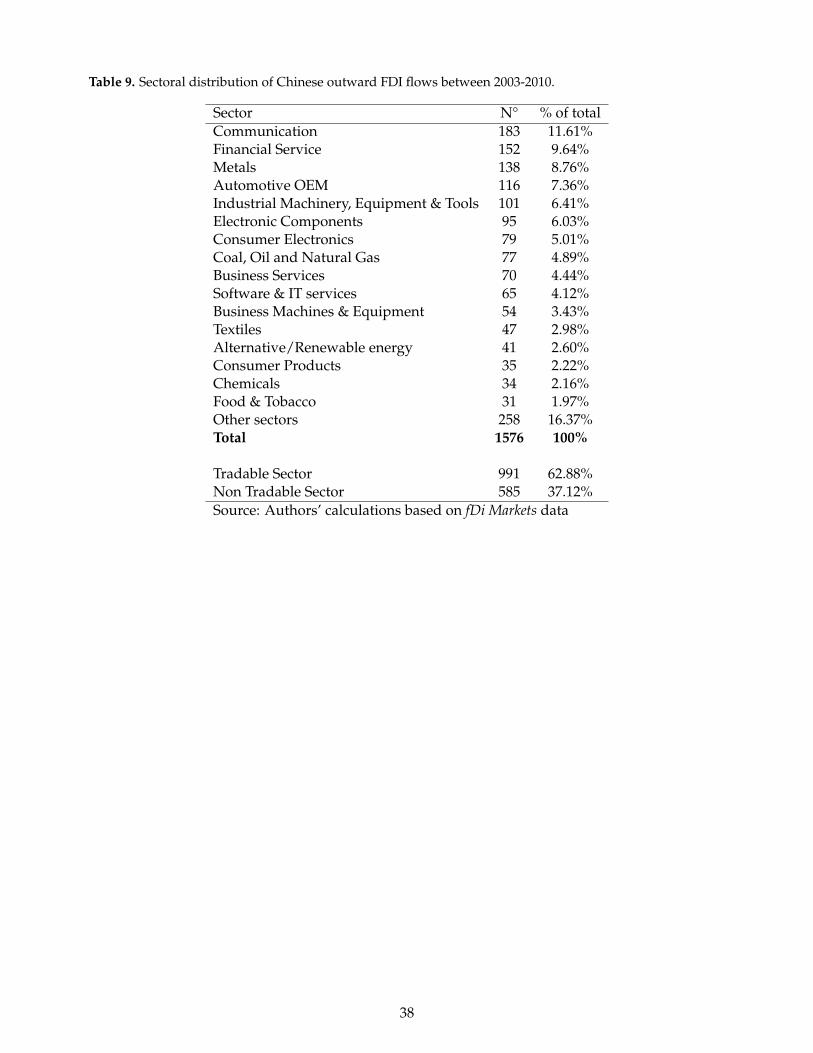
Table 9. Sectoral distribution of Chinese outward FDI flows between 2003-2010.
Sector N° % of totalCommunication 183 11.61%Financial Service 152 9.64%Metals 138 8.76%Automotive OEM 116 7.36%Industrial Machinery, Equipment & Tools 101 6.41%Electronic Components 95 6.03%Consumer Electronics 79 5.01%Coal, Oil and Natural Gas 77 4.89%Business Services 70 4.44%Software & IT services 65 4.12%Business Machines & Equipment 54 3.43%Textiles 47 2.98%Alternative/Renewable energy 41 2.60%Consumer Products 35 2.22%Chemicals 34 2.16%Food & Tobacco 31 1.97%Other sectors 258 16.37%Total 1576 100%
Tradable Sector 991 62.88%Non Tradable Sector 585 37.12%Source: Authors’ calculations based on fDi Markets data
38
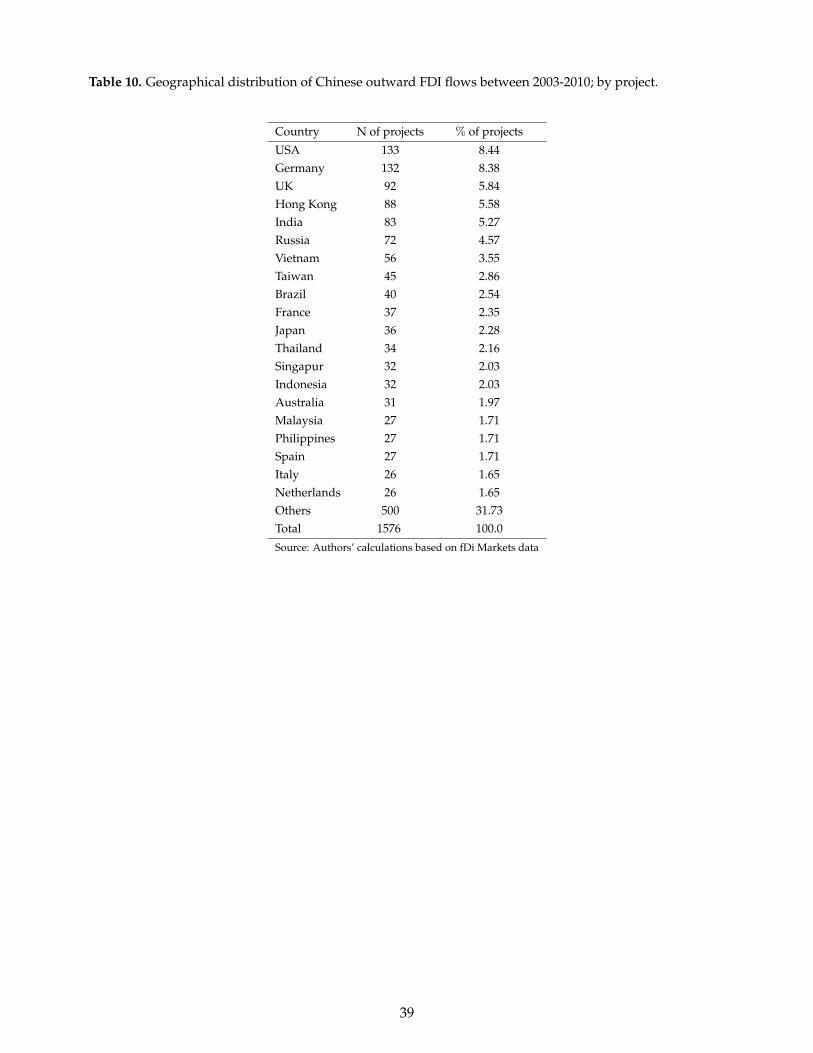
Table 10. Geographical distribution of Chinese outward FDI flows between 2003-2010; by project.
Country N of projects % of projects
USA 133 8.44Germany 132 8.38UK 92 5.84Hong Kong 88 5.58India 83 5.27Russia 72 4.57Vietnam 56 3.55Taiwan 45 2.86Brazil 40 2.54France 37 2.35Japan 36 2.28Thailand 34 2.16Singapur 32 2.03Indonesia 32 2.03Australia 31 1.97Malaysia 27 1.71Philippines 27 1.71Spain 27 1.71Italy 26 1.65Netherlands 26 1.65Others 500 31.73Total 1576 100.0
Source: Authors’ calculations based on fDi Markets data
39
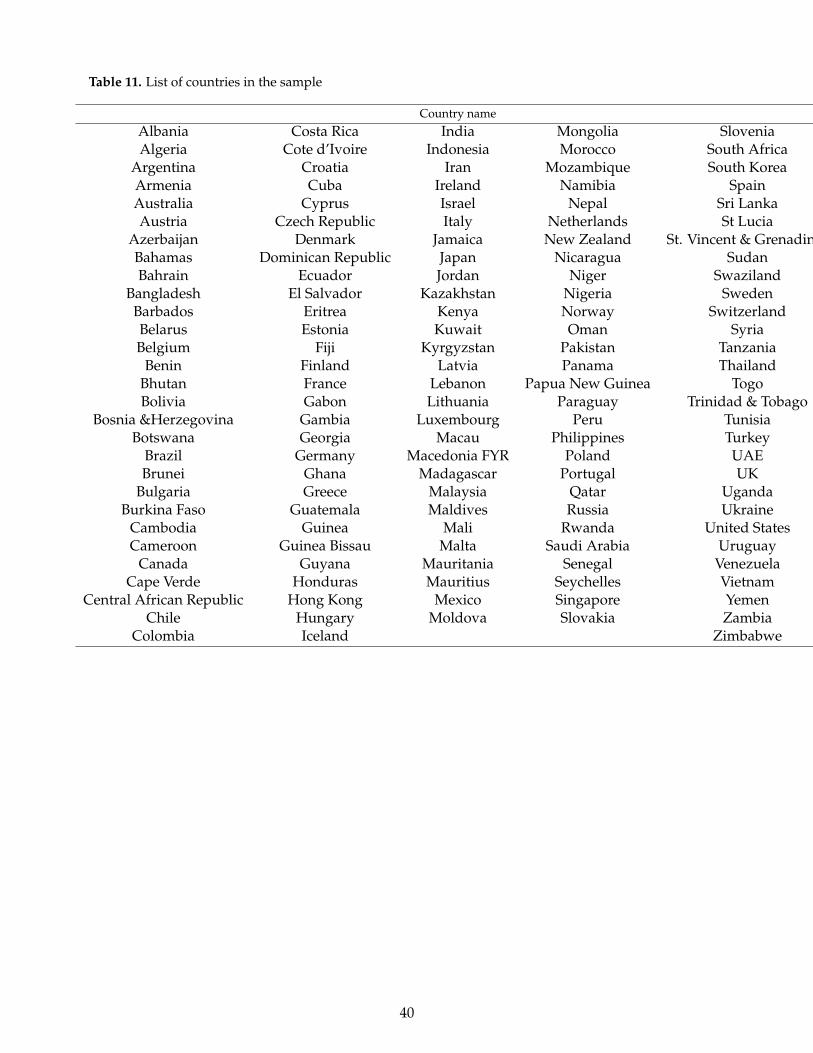
Table 11. List of countries in the sample
Country name
Albania Costa Rica India Mongolia SloveniaAlgeria Cote d’Ivoire Indonesia Morocco South Africa
Argentina Croatia Iran Mozambique South KoreaArmenia Cuba Ireland Namibia SpainAustralia Cyprus Israel Nepal Sri LankaAustria Czech Republic Italy Netherlands St Lucia
Azerbaijan Denmark Jamaica New Zealand St. Vincent & GrenadinesBahamas Dominican Republic Japan Nicaragua SudanBahrain Ecuador Jordan Niger Swaziland
Bangladesh El Salvador Kazakhstan Nigeria SwedenBarbados Eritrea Kenya Norway SwitzerlandBelarus Estonia Kuwait Oman SyriaBelgium Fiji Kyrgyzstan Pakistan Tanzania
Benin Finland Latvia Panama ThailandBhutan France Lebanon Papua New Guinea TogoBolivia Gabon Lithuania Paraguay Trinidad & Tobago
Bosnia &Herzegovina Gambia Luxembourg Peru TunisiaBotswana Georgia Macau Philippines Turkey
Brazil Germany Macedonia FYR Poland UAEBrunei Ghana Madagascar Portugal UK
Bulgaria Greece Malaysia Qatar UgandaBurkina Faso Guatemala Maldives Russia Ukraine
Cambodia Guinea Mali Rwanda United StatesCameroon Guinea Bissau Malta Saudi Arabia Uruguay
Canada Guyana Mauritania Senegal VenezuelaCape Verde Honduras Mauritius Seychelles Vietnam
Central African Republic Hong Kong Mexico Singapore YemenChile Hungary Moldova Slovakia Zambia
Colombia Iceland Zimbabwe
40
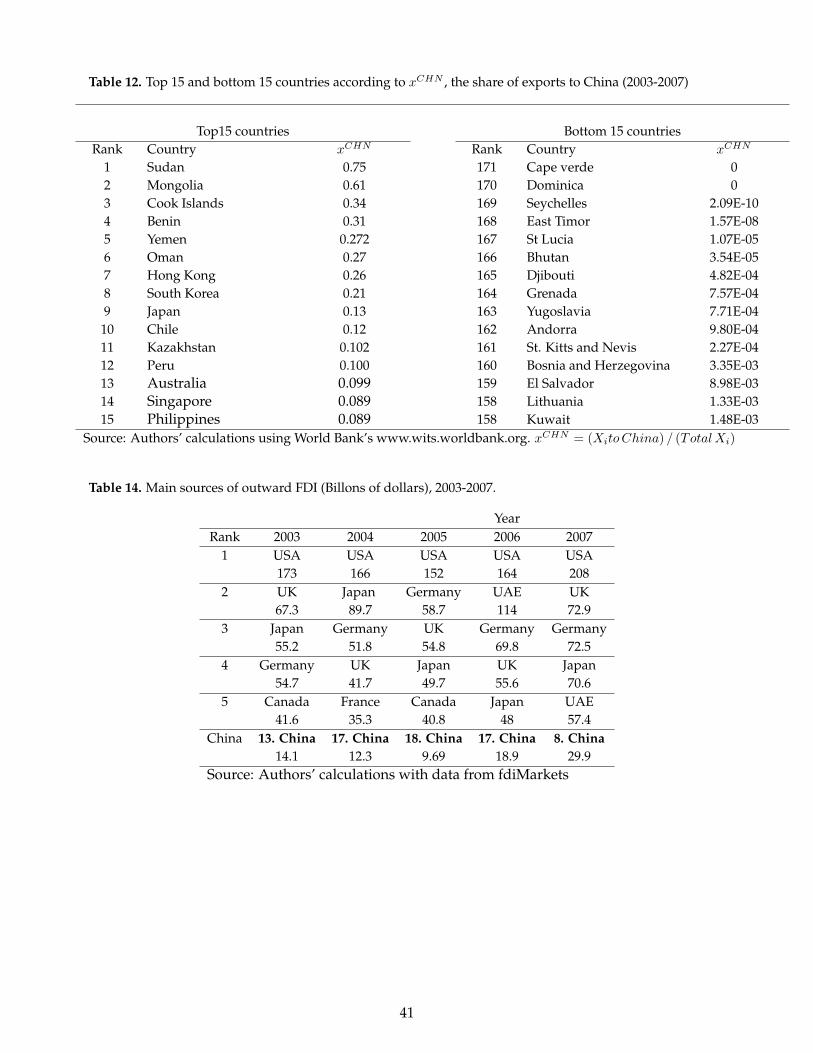
Table 12. Top 15 and bottom 15 countries according to xCHN , the share of exports to China (2003-2007)
Top15 countries Bottom 15 countriesRank Country xCHN Rank Country xCHN
1 Sudan 0.75 171 Cape verde 02 Mongolia 0.61 170 Dominica 03 Cook Islands 0.34 169 Seychelles 2.09E-104 Benin 0.31 168 East Timor 1.57E-085 Yemen 0.272 167 St Lucia 1.07E-056 Oman 0.27 166 Bhutan 3.54E-057 Hong Kong 0.26 165 Djibouti 4.82E-048 South Korea 0.21 164 Grenada 7.57E-049 Japan 0.13 163 Yugoslavia 7.71E-04
10 Chile 0.12 162 Andorra 9.80E-0411 Kazakhstan 0.102 161 St. Kitts and Nevis 2.27E-0412 Peru 0.100 160 Bosnia and Herzegovina 3.35E-0313 Australia 0.099 159 El Salvador 8.98E-0314 Singapore 0.089 158 Lithuania 1.33E-0315 Philippines 0.089 158 Kuwait 1.48E-03
Source: Authors’ calculations using World Bank’s www.wits.worldbank.org. xCHN = (XitoChina) / (Total Xi)
Table 14. Main sources of outward FDI (Billons of dollars), 2003-2007.
YearRank 2003 2004 2005 2006 2007
1 USA USA USA USA USA173 166 152 164 208
2 UK Japan Germany UAE UK67.3 89.7 58.7 114 72.9
3 Japan Germany UK Germany Germany55.2 51.8 54.8 69.8 72.5
4 Germany UK Japan UK Japan54.7 41.7 49.7 55.6 70.6
5 Canada France Canada Japan UAE41.6 35.3 40.8 48 57.4
China 13. China 17. China 18. China 17. China 8. China14.1 12.3 9.69 18.9 29.9
Source: Authors’ calculations with data from fdiMarkets
41
Box 1. In the past the US imposed strong and fast trade sanctions to expropriator countries
In the past, the US had events of relatively fast and powerful trade retaliations after the expropriation
of American companies abroad. According to the historical account of Schuler (2000), in 1938 the US
imposed trade sanctions after the Mexican Government expropriated the Oil companies operating in
Mexico. He indicates that the poweful and non counterbalanced lobby of the expropriated oil com-
panies was a crucial requirement to get this fast retaliation. The Dutch and British, whose companies
were also expropriated, displayed trade sanctions against Mexico, as well as an important diplomatic
power to avoid other countries to cooperate with Mexico. After unsuccessfully looking at new buyers in
democratic countries, the newly created State Owned Enterprise PEMEX re-directed its oil exports to the
Fascist governments in Italy and Germany. Since Mexico had a hard time trading with various countries,
many agreements included barter, like the Italian-Mexican agreement of 1939 to exchange Mexican Oil
for Italian Synthetic Fiber (rayon) and also oil Tankers. Schuler (2000) not only describes in detail the
problem of the Mexican authorities to find other buyers for their oil, but also the trouble to find logistics
companies that were not afraid of losing their long term relationship with Standard Oil and Shell. Ulti-
mately, Mexico sold its oil; pretty much like Argentine soybean oil exporters have been able to reallocate
their production after a few years. But this takes time and reduces the flow of profits and tax revenues.
The real costs and the destruction of valuable trading relationships are true and expensive costs that
cannot be under-emphasized, even for commodities.
42
Box # 2. Chinese investments in Venezuela
Even if Venezuela exported significant oil to China, for geographic reasons they export a large share to
the US. So to increase lending and FDI they needed further guarantees. And they did it. On the one hand
they set up an account in a Chinese bank where oil revenues will be payed in advance. This means this
stock of money would be lost by Venezuelans in case they default on their contracts. On the other hand,
Chinese-controlled ships take possession of oil during their travel from Venezuela to the US, owning
the product in during travel. Therefore, any expropriation would be even more painful for Venezuela
since would be losing also their exports in transit to other important markets. Overall, this could be
summarized by the words of the Governor of the China Development Bank (CDB) in 2011 “We believe
at CDB we have in place a comprehensive risk control mechanism. Most of the loans are related to the commodity
trade, and as we see oil prices are rising and China as one of the major importers of oil, and we think to put in place
a servicing mechanism such as oil for loans, we are effectively keeping the risks to a minimum level” (Chen Yuan,
quoted by Sanderson and Forsythe, 2012 )
43
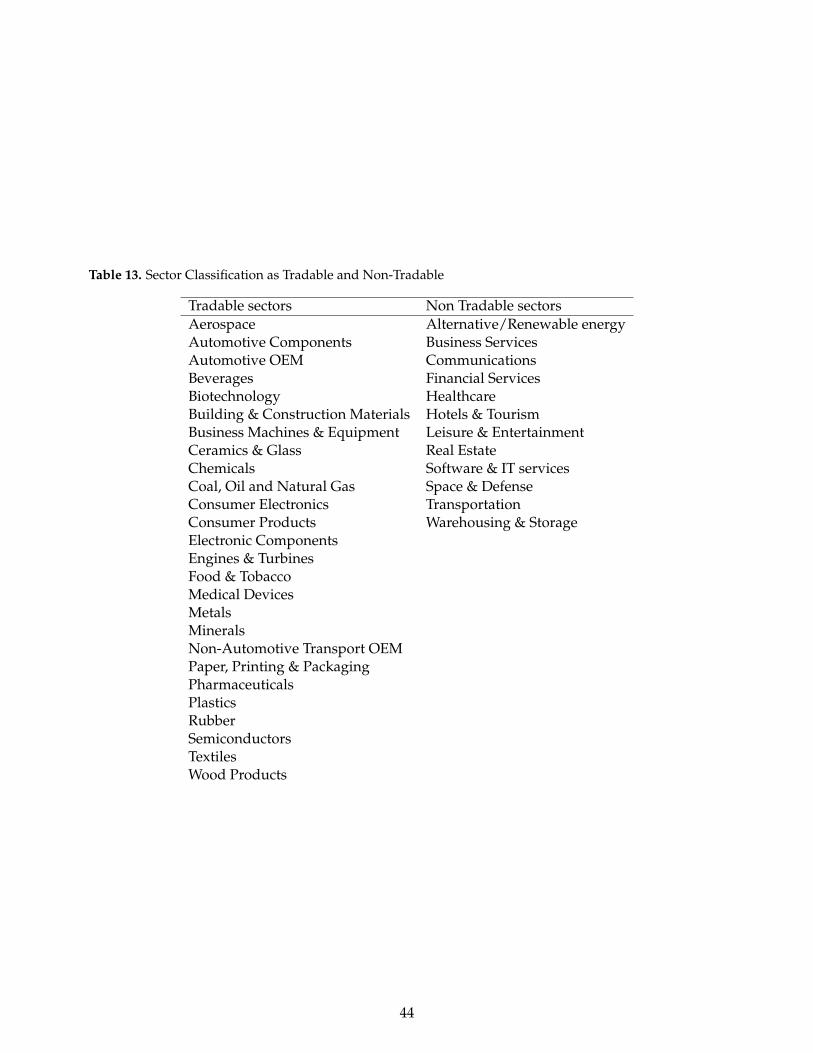
Table 13. Sector Classification as Tradable and Non-Tradable
Tradable sectors Non Tradable sectorsAerospace Alternative/Renewable energyAutomotive Components Business ServicesAutomotive OEM CommunicationsBeverages Financial ServicesBiotechnology HealthcareBuilding & Construction Materials Hotels & TourismBusiness Machines & Equipment Leisure & EntertainmentCeramics & Glass Real EstateChemicals Software & IT servicesCoal, Oil and Natural Gas Space & DefenseConsumer Electronics TransportationConsumer Products Warehousing & StorageElectronic ComponentsEngines & TurbinesFood & TobaccoMedical DevicesMetalsMineralsNon-Automotive Transport OEMPaper, Printing & PackagingPharmaceuticalsPlasticsRubberSemiconductorsTextilesWood Products
44