How Asia-Pacific States can secure Competitive Advantage ... · PDF fileE-mail: [email protected]...
23
Contact: Mr. Robert David Borthwick Axiata Group Berhad Tel: +603 2263 8979 Fax: +603 2263 8980 E-mail: [email protected] ASIA-PACIFIC TELECOMMUNITY 12 th APT Policy and Regulatory Forum Document: PRF-12/INP-18(R1) 21-23 May, 2012 – Bangkok, Thailand 21 May 2012 How Asia-Pacific States can secure Competitive Advantage through Regulating for New and Emerging Communications Developments Prepared by Mr. Robert David Borthwick
Transcript of How Asia-Pacific States can secure Competitive Advantage ... · PDF fileE-mail: [email protected]...

Contact: Mr. Robert David Borthwick
Axiata Group Berhad
Tel: +603 2263 8979
Fax: +603 2263 8980
E-mail: [email protected]
ASIA-PACIFIC TELECOMMUNITY
12th
APT Policy and Regulatory Forum
Document:
PRF-12/INP-18(R1)
21-23 May, 2012 – Bangkok, Thailand 21 May 2012
How Asia-Pacific States can secure Competitive Advantage through
Regulating for New and Emerging Communications Developments
Prepared by
Mr. Robert David Borthwick
How Asia-Pacific States can secure Competitive Advantage through Regulating for New and Emerging Communications Developments Axiata
21 May 2012
Rob Borthwick
Vice President, Group Regulatory Affairs, Axiata Group Berhad
company confidential
2 company confidential
2
Agenda
1. About Axiata
2. Current background – Macro Economic and Sector Prospects
3. Long Term View – Opportunities for Sustainable Growth and Increasing Prosperity
4. Enabling Regulatory Environment for New and Emerging Communications Developments

Axiata Group Regulatory / APT PRF May 2012 3
About Axiata: Owned and based in Asia.
Investing in communications networks and services regionally.
Idea, India
Ownership: 19.1%
Market position: #3
Re-branded and
expanded TMI
Regional Reach in South
and South East Asia
Portfolio of Developed
and Emerging Market
Assets
More than 180 million
Mobile Subscribers
With the broader purpose
of Advancing Asia
Dialog, Sri Lanka
Ownership: 85.0%
Market position: #1
XL, Indonesia
Ownership: 66.7%
Market position: #3
Hello, Cambodia
Ownership: 100.0%
Market position: #5
M1, Singapore
Ownership: 29.4%
Market position: #3
Celcom, Malaysia
Ownership: 100.0%
Market position: #2
Robi, Bangladesh
Ownership: 70.0%
Market position: #3
4 company confidential
4
Agenda
1. About Axiata
2. Current background – Macroeconomic and Sector Prospects
3. Long Term View – Opportunities for Sustainable Growth and Increasing Prosperity
4. Enabling Regulatory Environment for New and Emerging Communications Developments
Axiata Group Regulatory / APT PRF May 2012 5
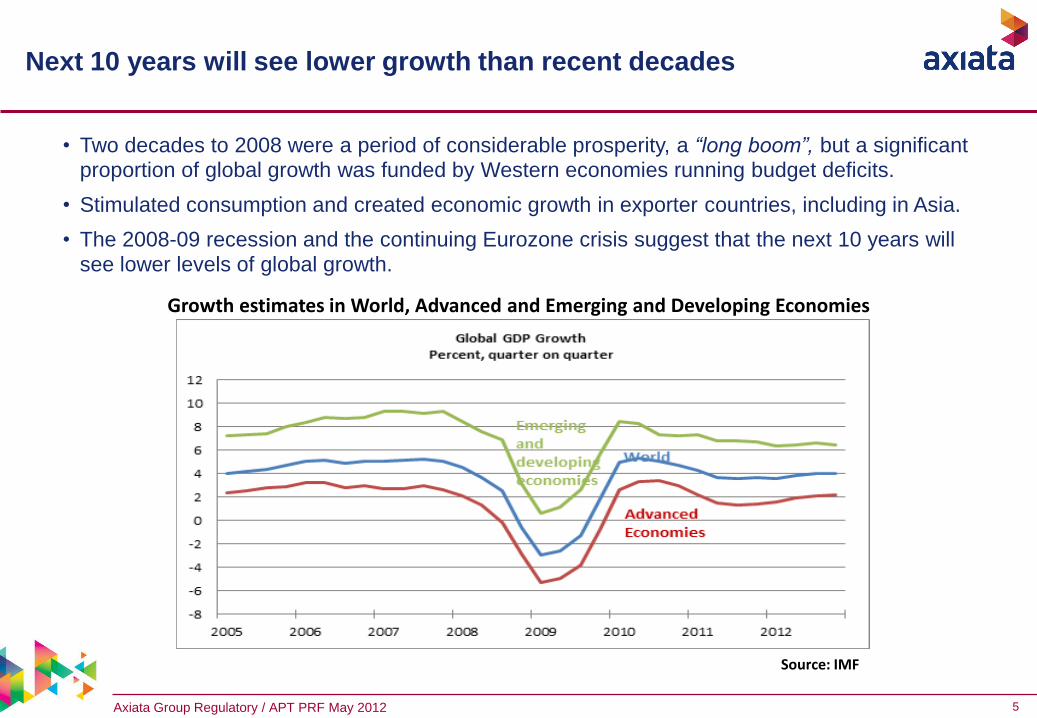
Next 10 years will see lower growth than recent decades
• Two decades to 2008 were a period of considerable prosperity, a “long boom”, but a significant proportion of global growth was funded by Western economies running budget deficits.
• Stimulated consumption and created economic growth in exporter countries, including in Asia.
• The 2008-09 recession and the continuing Eurozone crisis suggest that the next 10 years will
see lower levels of global growth.
Growth estimates in World, Advanced and Emerging and Developing Economies
Source: IMF

Axiata Group Regulatory / APT PRF May 2012 6
Core macroeconomic forecasts presume current Eurozone crisis is
progressively resolved.
• Most likely scenario for SE and South Asia is modestly slower economic growth during 2012-2017.
Asian countries will continue to grow, but at some 2-3% p.a. lower levels than during the period
before 2008-09. If other World regions stabilize, then higher growth may resume.
• But whether this happens is far from certain and it is more useful to consider different scenarios:
1. Stronger economic growth returns during 2013-14. From 2015-2017 growth returns to “long
boom” levels. How lucky do we feel? Not very < 10%
2. Lower economic growth during 2012-2017. Asian countries continue to grow, but at 2-3% p.a.
lower than prior to 2008-09. Most likely 50 to 60%
3. Major EU-led global economic downturn costs 2-3%p.a. more growth during 2012-2017.
Becoming more likely 30 to 40%
• Even in previously high-performing nations of SE and South Asia there is a significant risk of low
growth or even recession as a consequence of international economic failure.
• In particular, if there are significant national departures from the Eurozone, beyond the likely imminent
departure of Greece, and if these are “disorderly”, expect a global downturn.
Axiata Group Regulatory / APT PRF May 2012 7
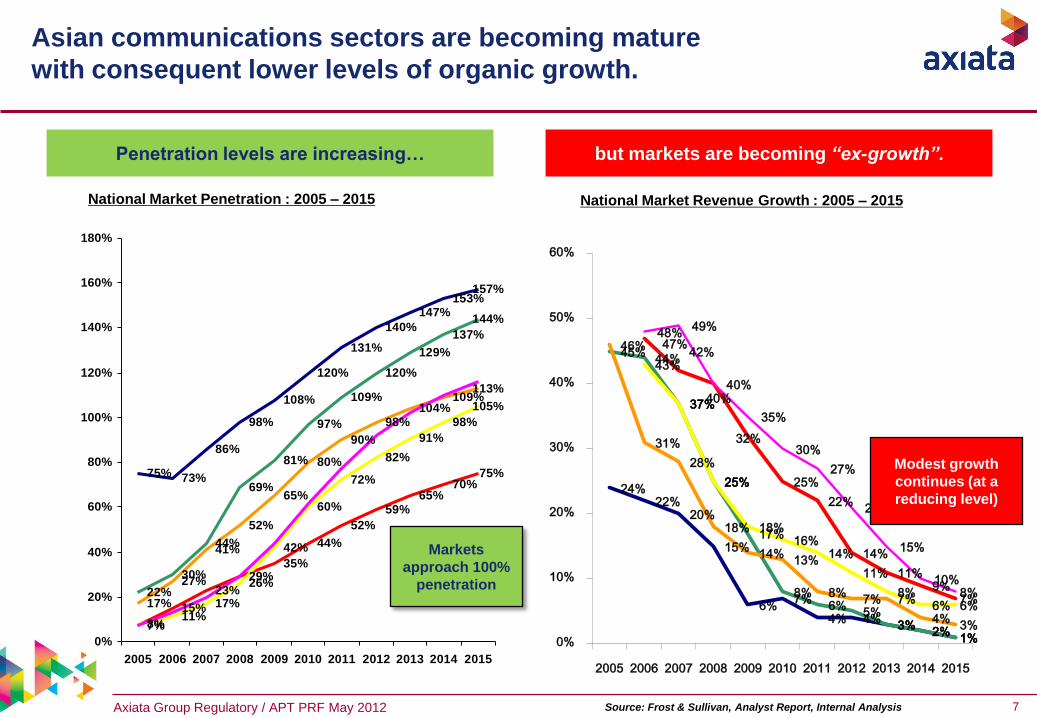
Asian communications sectors are becoming mature
with consequent lower levels of organic growth.
but markets are becoming “ex-growth”. Penetration levels are increasing…
National Market Penetration : 2005 – 2015 National Market Revenue Growth : 2005 – 2015
Source: Frost & Sullivan, Analyst Report, Internal Analysis
75% 73%
86%
98%
108%
120%
131%
140%
147%153%
157%
22%
30%
44%
69%
81%
97%
109%
120%
129%
137%
144%
17%
27%
41%
52%
65%
80%
90%
98%104%
109%113%
7%
15%
23%29%
35%
44%
52%
59%65%
70%75%
8%11%
17%
26%
42%
60%
72%
82%
91%
98%
105%
0%
20%
40%
60%
80%
100%
120%
140%
160%
180%
2005 2006 2007 2008 2009 2010 2011 2012 2013 2014 2015
24% 22%
20%
15%
6% 7%
4% 4% 3% 2% 1%
45% 44%
37%
25%
17%
8% 6% 5%
3% 2% 1%
46%
31%
28%
18%
14% 13%
8% 7% 7%
4% 3%
47% 42%
40%
32%
25%
22%
14%
11% 9%
7%
43%
37%
25%
18% 16%
14%
11%
8% 6% 6%
48% 49%
40%
35%
30%
27%
21%
15%
10% 8%
0%
10%
20%
30%
40%
50%
60%
2005 2006 2007 2008 2009 2010 2011 2012 2013 2014 2015
Markets
approach 100%
penetration
Modest growth
continues (at a
reducing level)

Axiata Group Regulatory / APT PRF May 2012 8
Against this background communications providers
face the need to address new competitive dimensions. …
1995 2000 2010
Voice coverage
(quality)
VAS content
(product range)
Broadband
(video speed)
?
• Enterprise
Applications
• Advertising
• Information
brokering
• Transactions/
Payments
• M2M
• OTT plays
2005
Voice is key Voice is commodity.
Data is key Data is commodity. Content
and applications are key.
Data will become ubiquitous, competition will be more heterogeneous
including and beyond regulated communications services sector.
Voice and SMS
(price)
2015+
Axiata Group Regulatory / APT PRF May 2012 9
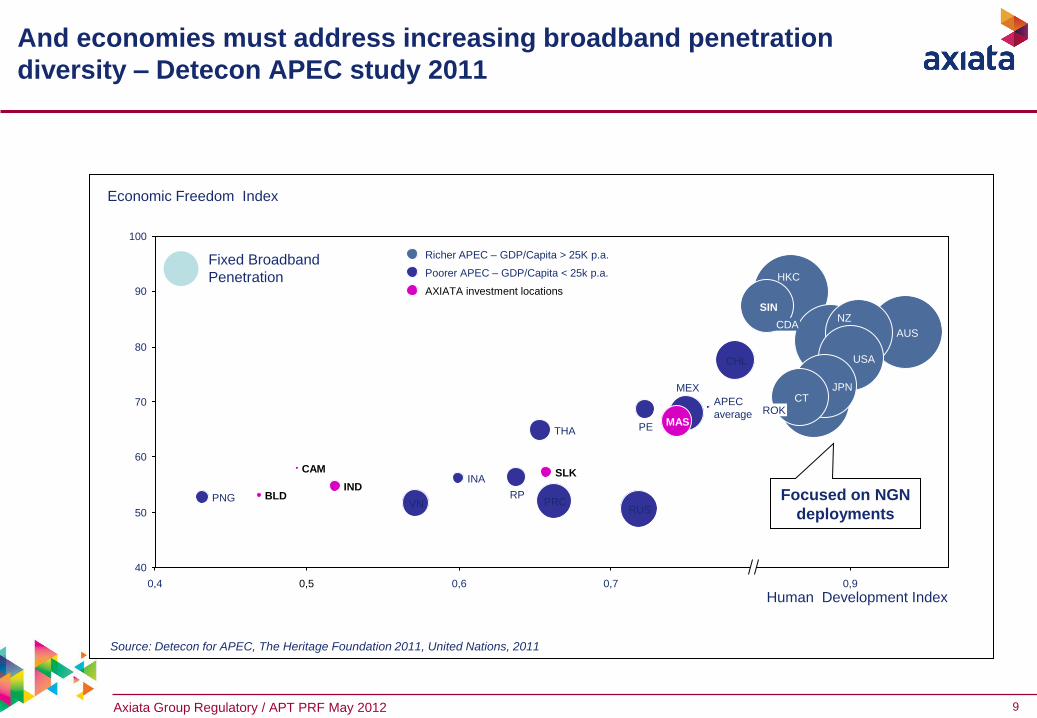
And economies must address increasing broadband penetration
diversity – Detecon APEC study 2011
100
90
60
50
40
0,9 0,7 0,6 0,5 0,4
80
70
CAM
BLD IND
SLK
APEC
average
VN
CT
USA
THA
SIN
RUS
RP
ROK
PRC PNG
PE
NZ
MEX
MAS
JPN
INA
HKC
CHL
AUS CDA
Human Development Index
Economic Freedom Index
Fixed Broadband
Penetration
Source: Detecon for APEC, The Heritage Foundation 2011, United Nations, 2011
Focused on NGN
deployments
Richer APEC – GDP/Capita > 25K p.a.
AXIATA investment locations
Poorer APEC – GDP/Capita < 25k p.a.
10 company confidential
10
Agenda
1. About Axiata
2. Current background – Macroeconomic and Sector Prospects
3. Long Term View – Opportunities for Sustainable Growth and Increasing Prosperity
4. Enabling Regulatory Environment for New and Emerging Communications Developments
Axiata Group Regulatory / APT PRF May 2012 11
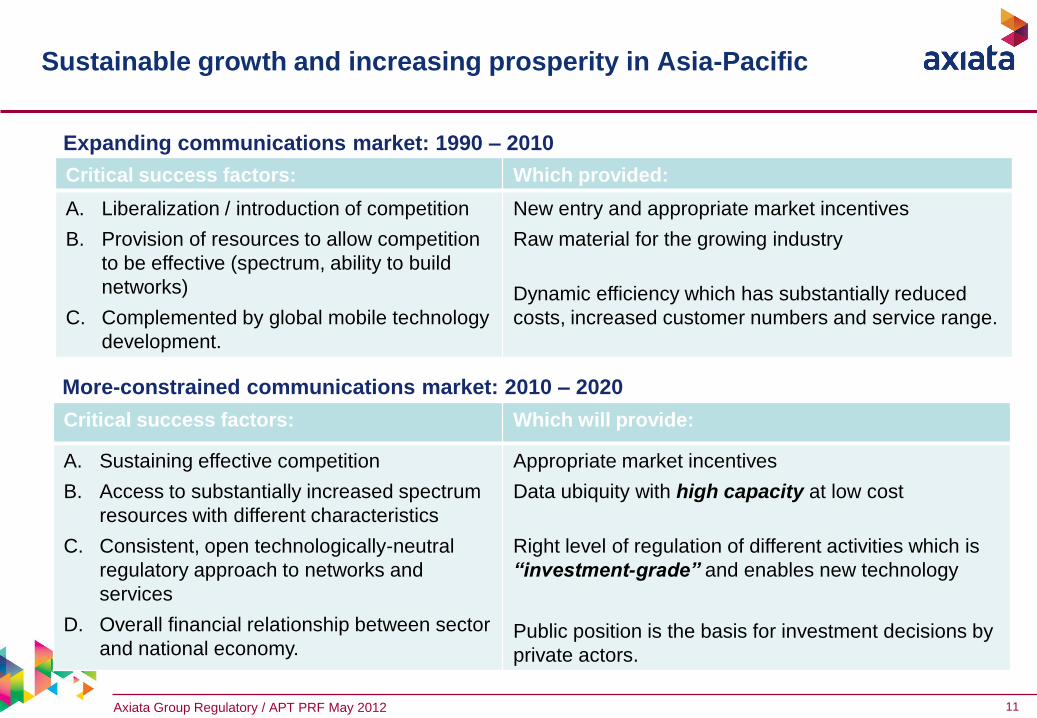
Sustainable growth and increasing prosperity in Asia-Pacific
More-constrained communications market: 2010 – 2020
Critical success factors: Which will provide:
A. Sustaining effective competition
B. Access to substantially increased spectrum
resources with different characteristics
C. Consistent, open technologically-neutral
regulatory approach to networks and
services
D. Overall financial relationship between sector
and national economy.
Appropriate market incentives
Data ubiquity with high capacity at low cost
Right level of regulation of different activities which is
“investment-grade” and enables new technology
Public position is the basis for investment decisions by
private actors.
Expanding communications market: 1990 – 2010
Critical success factors: Which provided:
A. Liberalization / introduction of competition
B. Provision of resources to allow competition
to be effective (spectrum, ability to build
networks)
C. Complemented by global mobile technology
development.
New entry and appropriate market incentives
Raw material for the growing industry
Dynamic efficiency which has substantially reduced
costs, increased customer numbers and service range.
Axiata Group Regulatory / APT PRF May 2012 12
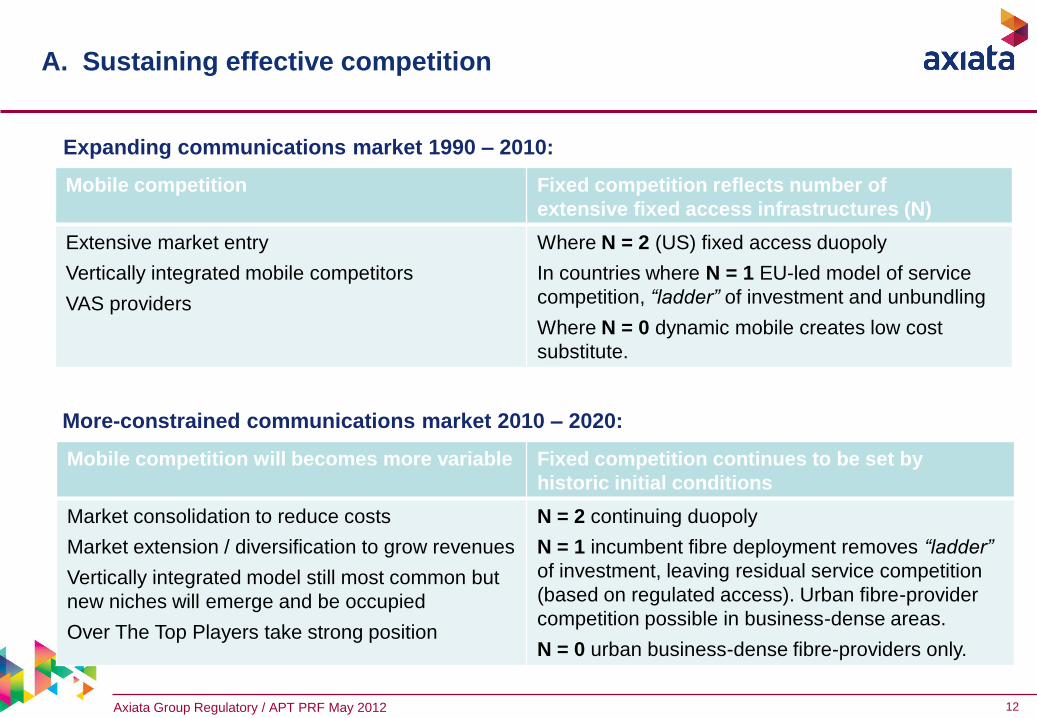
A. Sustaining effective competition
More-constrained communications market 2010 – 2020:
Expanding communications market 1990 – 2010:
Mobile competition Fixed competition reflects number of
extensive fixed access infrastructures (N)
Extensive market entry
Vertically integrated mobile competitors
VAS providers
Where N = 2 (US) fixed access duopoly
In countries where N = 1 EU-led model of service
competition, “ladder” of investment and unbundling
Where N = 0 dynamic mobile creates low cost
substitute.
Mobile competition will becomes more variable Fixed competition continues to be set by
historic initial conditions
Market consolidation to reduce costs
Market extension / diversification to grow revenues
Vertically integrated model still most common but
new niches will emerge and be occupied
Over The Top Players take strong position
N = 2 continuing duopoly
N = 1 incumbent fibre deployment removes “ladder”
of investment, leaving residual service competition
(based on regulated access). Urban fibre-provider
competition possible in business-dense areas.
N = 0 urban business-dense fibre-providers only.

Axiata Group Regulatory / APT PRF May 2012 13
B. Access to substantially increased spectrum resources
with different characteristics
Source: APEC broadband survey, Detecon analysis, data not available for fields with “-”
APEC economies
Spectrum
liberalization
tech. neutral
Spectrum
refarming
framework
Status
4G license
Status
Digital
dividend
Ratio mobile to
fixed line
subscriptions
mobile BB
penetration /
100 inhabitants
Canada - - - - 1.4 :1 33.7
Chinese Taipei planned planned completed planned 1.8 :1 57.0
Republic of Korea - - completed planned 1.9 :1 84.2
United States yes yes completed completed 2.0 : 1 53.8
China - - - - 2.4 : 1 2.0
New Zealand yes yes completed planned 2.5 : 1 47.1
Australia - yes planned planned 2.7 : 1 88.8
Japan - - completed planned 2.7 : 1 88.1
Hong Kong, China yes yes completed not started 2.9 : 1 66.8
Singapore yes - planned - 3.6 : 1 92.7
Mexico - - - - 4.3 : 1 9.0
Chile - - - - 4.6 : 1 7.3
Indonesia - - - - 4.7 : 1 9.6
Brunei Darussalam - - - - 5.1 : 1 55.2
Russia - - - - 5.1 : 1 9.5
Viet Nam yes yes not started planned 5.6 : 1 6.0
Malaysia yes yes planned planned 7.0 : 1 31.4
Peru yes planned planned planned 8.3 : 1 2.0
Thailand yes planned - planned 9.2 : 1 1.4
Philippines - - - - 13.6 : 1 13.5
Papua New Guinea - - - - 15.0 : 1 0.0
The four major levers of effective spectrum
management are spectrum availability,
spectrum assignment, license conditions and
spectrum liberalization and refarming.
Right set of license conditions are
imperative to increase geographic coverage
e.g. first coverage of all white spots, then
move to urban deployment
The digital dividend will have a massive
effect on rapidly increasing broadband
penetration and coverage in emerging
economies. So far, only the US has released
the digital dividend spectrum
Poorer APEC economies can benefit
most from spectrum liberalization and
refarming to promote mobile broadband
deployment.
Spectrum liberalization important to
accommodate for converging markets

Axiata Group Regulatory / APT PRF May 2012 14
But this potentially indicates an area of competitive concern
Expect competitive advantage to accrue to regions which maximize creation of
harmonized broadband spectrum and countries which use created spectrum efficiently
While Asia–Pacific is not homogeneous, competitor regions’ may be able to complement more
widely deployed fixed infrastructure with production of larger amounts of harmonized
spectrum – increasing their aggregate data capacity advantage at low cost.
Region Rhetoric Structure Recent examples
US “digital infrastructure will be a key source of competitive
advantage in the knowledge economy. There is no
policy more important for digital infrastructure than
assuring that scarce spectrum is efficiently allocated.”
- Larry Summers, June 28, 2010
FCC
Rules allowing single channel
sharing by broadcasters.
Proposed FCC auction 1755 –
1780 MHz band for commercial
wireless services.
EU “intelligent and coherent use of radio spectrum will be
the backbone of an Internet explosion […] Get it wrong
and it will be a bottleneck, which will hold back
development of the sector, undermine potential job
creation, and mean we risk losing our competitive edge”
- Neelie Kroes, 14th June 2011
EC Radio-
Spectrum
Policy
Committee
RSPG argues the case for new
broadband in 700 MHz is
"irresistible". Will table second
digital dividend proposal at
European RSPG June meeting.
15 company confidential
15
Agenda
1. About Axiata
2. Current background – Macroeconomic and Sector Prospects
3. Long Term View – Opportunities for Sustainable Growth and Increasing Prosperity
4. Enabling Regulatory Environment for New and Emerging Communications Developments

Axiata Group Regulatory / APT PRF May 2012 16
C. Consistent, open regulatory approach to communications
Communications license
• Single, simple set of rules for commercial operation of communications networks and services
• Without service or technology distinctions
• Communications providers determine level and boundary of their operations on a commercial basis.
Spectrum permission
• Simple description of spectrum which is being made available to a provider
• Or which is unlicensed
• With terms which deal only with spectrum-related issues, e.g. period of allocation, payment terms, management of interference.
• Again without service or technology distinctions
VAS provider code
• A code which is managed by the NRA / Value Added Services-(VAS) regulator
• With terms which deals only with VAS provision: consumer protection, transparency, pricing etc.
• VAS providers must register and be in good standing to offer services and to contract with communications licensees.
National legislation dealing consistently with horizontal concerns: customer
identification, privacy, unsolicited communications etc.

Axiata Group Regulatory / APT PRF May 2012 17
D. Financial flows between sector and economy – a key, if largely
unacknowledged, producer of future “digital divides”
General tax load on
communications is
low / reflective of
other sectors
General tax load on
communications is
medium / somewhat
above other sectors
General tax load on
communications is
high / substantially
above other sectors
Spectrum is
allocated
administratively.
Some APT countries
here
Spectrum is
allocated through
objective market-
based process.
EU
US
Australia / NZ
Some APT member
countries here
Spectrum is
allocated through
market-based
process but with
high reserve
prices.
Some APT member
countries here

Axiata Group Regulatory / APT PRF May 2012 18
Bridging the Digital Divide
APEC Member Governments think that Universal Service provision and national PPPs
are among the top measures for promoting rural broadband.
6.0
6.0
Universal Access
and Service Fund
4.0 3.0 2.5 3.5
Regional PPPs 3.3
Mobile regulatory
intervention (e.g. licensing) 4.0
Fixed regulatory
intervention (e.g. ULL, BSA) 4.0
National PPPs 5.1
Universal Service
Obligation 5.8
financial intervention
(e.g. tax incentives) 2.7
4.5 5.5 5.0
average ranking (1=min; 6=max) Detecon for APEC from: CT, HKC, MAS, NZ, PE, TH, VN
Question: “Please rank the following measures according to their importance for promoting rural
broadband access”

Axiata Group Regulatory / APT PRF May 2012 19
Historic performance depends on Critical Success Factors
Universal Access Service Fund performance has been marginal
57
74 73
86
98
108
120
129
17 17 17 17 16 16 15 15
5 7
13
20
30
45
63
75
4 4 4 3 3 3 3 3 0
20
40
60
80
100
120
140
2004 2005 2006 2007 2008 2009 2010 2011
Country A - mobile Country A - fixed
Country B - mobile Country B - fixed
57
74 73
86
98
108
120
129
5 7
13
20
30
45
63
75
0 0 0 0.3 0.5 0.7 0.98 1.3 0
20
40
60
80
100
120
140
2004 2005 2006 2007 2008 2009 2010 2011
Country A Country B Country C
What constrains UAS performance? i/ Tax-led vs. Objective-led; ii/ institutional factors
favour state-owned operators; iii/ communal solutions vulnerable to market provision.

20
Thank You Rob Borthwick
VP, Group Regulatory Affairs, Axiata Group Berhad
Email: [email protected]
Mobile: +60 19 382 2003
www.axiata.com
Axiata Group Berhad
20
Axiata Group Regulatory / APT PRF May 2012 21
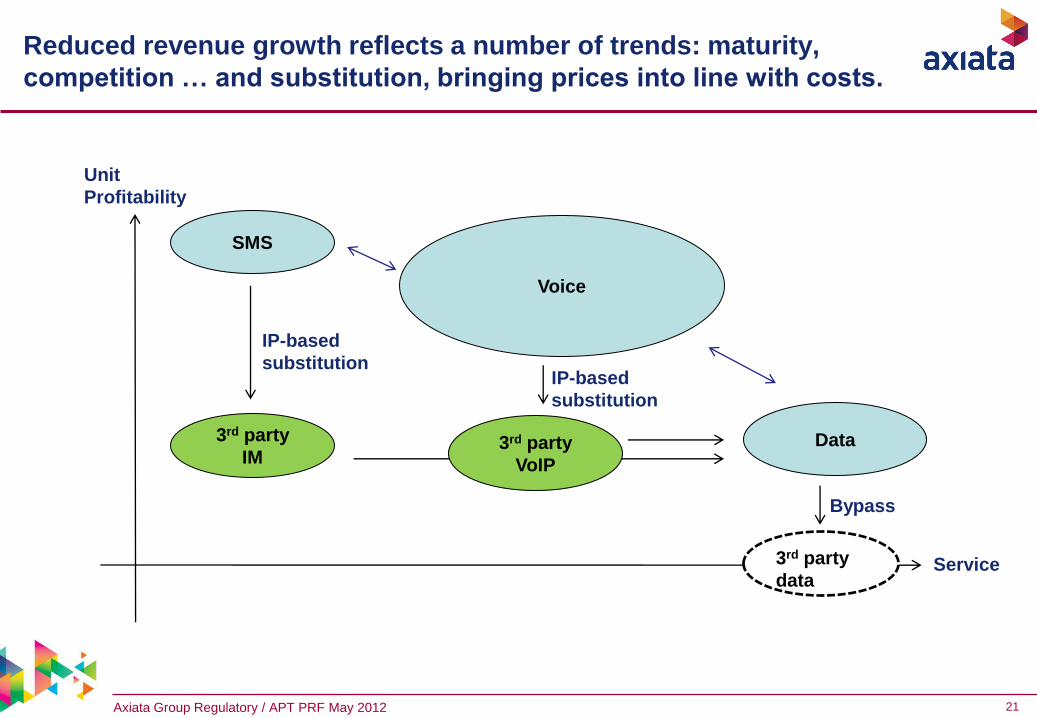
Reduced revenue growth reflects a number of trends: maturity,
competition … and substitution, bringing prices into line with costs.
SMS
Voice
Data
Unit
Profitability
Service
3rd party
IM 3rd party
VoIP
IP-based
substitution
3rd party
data
Bypass
IP-based
substitution

Axiata Group Regulatory / APT PRF May 2012 22
Addressing the Digital Divide through action in fixed Two concepts: the ladder of investment through infrastructure based competition while
the PPP approach promotes service based competition.
PPP approach supports service competition.
Applied, for example, in Singapore.
Regulatory focus on bitstream or resale of fixed
incumbent services facilitates service competition.
Inve
stm
en
t re
turn
Ris
k le
ve
l
high
low Investment cost
Product differentiation high low
Fiber ULL
Sup Loop
Full ULL
Line sharing
Bitstream
Resale
Self build
Infrastructure
Duct Access
Infrastructure
competition
Service competition
Network
competition
Ladder of investment approach in fixed Public Private Partnership approach
Pri
va
te s
ec
tor
ris
k
high
low Private sector
participation high low
Government
Design/Build
Design/Build/Maintain
Design/Build/Operate
Build/Operate/Transfer
Build/Own/Operate
Full privatization
Ladder of investment approach aims to stimulate
(fixed) infrastructure competition.
Applied, for example, in Hong Kong.
Continuing regulatory intervention is necessary to
overcome inherent tensions between fixed
incumbent and entrants in this approach.
UASF, USO,
grants, tax
exemptions