Hout, C.M. van der, Gerkema, T., Nauw, J.J. & Ridderinkhof ... · estimate for the transported mass...
31
This is a postprint of: Hout, C.M. van der, Gerkema, T., Nauw, J.J. & Ridderinkhof, H. (2015). Observations of a narrow zone of high suspended particulate matter (SPM) concentrations along the Dutch coast. Continental Shelf Research, 95, 27-38 Published version: dx.doi.org/10.1016/j.csr.2015.01.002 Link NIOZ Repository: www.vliz.be/nl/imis?module=ref&refid=245936 [Article begins on next page] The NIOZ Repository gives free access to the digital collection of the work of the Royal Netherlands Institute for Sea Research. This archive is managed according to the principles of the Open Access Movement, and the Open Archive Initiative. Each publication should be cited to its original source - please use the reference as presented. When using parts of, or whole publications in your own work, permission from the author(s) or copyright holder(s) is always needed.
Transcript of Hout, C.M. van der, Gerkema, T., Nauw, J.J. & Ridderinkhof ... · estimate for the transported mass...

This is a postprint of: Hout, C.M. van der, Gerkema, T., Nauw, J.J. & Ridderinkhof, H. (2015). Observations of a narrow zone of high suspended particulate matter (SPM) concentrations along the Dutch coast. Continental Shelf Research, 95, 27-38 Published version: dx.doi.org/10.1016/j.csr.2015.01.002 Link NIOZ Repository: www.vliz.be/nl/imis?module=ref&refid=245936
[Article begins on next page]
The NIOZ Repository gives free access to the digital collection of the work of the Royal
Netherlands Institute for Sea Research. This archive is managed according to the principles
of the Open Access Movement, and the Open Archive Initiative. Each publication should be
cited to its original source - please use the reference as presented.
When using parts of, or whole publications in your own work, permission from the author(s)
or copyright holder(s) is always needed.

1
Observations of a narrow zone of high suspended particulate matter (SPM)
concentrations along the Dutch coast
Carola M. van der Hout*, Theo Gerkema*, Janine N. Nauw*, Herman Ridderinkhof*
* Royal Netherlands Institute for Sea Research (NIOZ), Postbus 59, 1790 AB Den Burg, The
Netherlands.
Contact: [email protected], [email protected], [email protected],
Abstract
The objective of the study described in this paper is to localize the transport path of suspended
particulate matter (SPM) in the Dutch coastal zone in the southern North Sea. It is known that a large
mass of SPM is transported northward from the Strait of Dover, which is however mostly hidden
from satellite and other surface measurements. The study area is located at 80 km north of the
Rhine-Meuse estuary mouth in the far-field plume of the region of freshwater influence (ROFI). We
investigate the occurrence and persistence of a turbidity maximum zone (TMZ) in an area closer to
the coast than studied in previous observational programs. Shipboard measurements of vertical
profiles of SPM concentrations, density and current velocities with a high cross-shore spatial
resolution are presented. A turbidity maximum zone is found at a distance between 0.5 and 3 km
from the coast along 30 km of the coastline. Observed concentrations are shown to vary strongly
within a tidal cycle, and also between contrasting meteorological conditions in terms of the spring-
neap tidal cycle, the significant wave height and the wind force. Temporary stratification is observed
during spring tides, and occurs on the ebb phase of the tidal cycle. Cross-shore transports at a
transect perpendicular to the coast show an accumulation of SPM in the TMZ within one tidal cycle.
Possible mechanisms for this accumulation close to the coast are discussed.

2
Keywords
turbidity maximum zone, in-situ measurements, periodic stratification, ROFI, cross-shore SPM
transport, resuspension
Highlights
SPM concentrations were measured in the far-field plume of the Rhine ROFI .
A turbidity maximum zone (TMZ) is observed within 5 km from the coast.
In the TMZ, cross-shore accumulation occurs during calm weather.

3
1 Introduction
Along the Dutch coast a large mass of suspended particulate matter (SPM) is transported northward,
but it is often hidden from satellite and other surface measurements (Visser et al., 1991; Joordens et
al., 2001; Geyer et al., 2004; Fettweis et al., 2007; Pietrzak et al., 2011). SPM in the Dutch coastal
zone originates predominantly from the Strait of Dover. A well-accepted estimate of the yearly
average SPM transport though the Strait of Dover is 44 Mton/yr, with seasonal variability between 22
and 58 Mton/yr (McManus and Prandle, 1997; Fettweis and Van den Eynde, 2003). Other studies
show a wide range of the yearly averaged SPM transport between 13 and 44 Mton/yr (Fettweis and
Van den Eynde, 2003; De Kok, 2004). The variability in these estimates reflects both the limited
nature of the available field data and the high yearly variability of the transport itself (Van Alphen,
1990; McManus and Prandle, 1997; Fettweis and Van den Eynde, 2003). The SPM transport though
the Strait of Dover splits about 50-50 over the coasts of the UK and Belgium (McManus and Prandle,
1997; Fettweis et al., 2007). Following the SPM northward, it remains close to the coast and only
temporary settling occurs in the Belgian turbidity maximum zone at the Flemish banks and in the
Rhine-Meuse estuary (Fettweis and Van den Eynde, 2003, De Nijs, 2012). Possibly erosion of the
Flemish banks contributes up to 3 Mton/yr (Van Alphen, 1990; Fettweis et al.,2007). The resulting
estimate for the transported mass of SPM along the Dutch coast is 22±10 Mton/yr.
The study of SPM has become urgent in recent decades as the human pressure on coastal systems
has increased, and negative effects of SPM – decreasing optical depth of the water column, carrying
pollutants, harbor siltation – need to be mitigated. One of the gaps in the present day knowledge is
the transport pattern of SPM near the shore. Large engineering works in coastal areas around the
world might intervene with the SPM transport, but the effects are not always well understood. The
use of bottom landers (Souza and Howarth, 2005; Cacchione et al., 2006; Manning and Bass, 2006)
and satellite technology (Fettweis et al., 2007; Eleveld et al., 2008; Moreira et al., 2013) for
monitoring in-situ concentrations of SPM has enormously increased our understanding of the

4
transport of SPM. With bottom landers, details of the processes determining the vertical flux of SPM
have been uncovered, by observing floc formation, settling velocities and turbulent fluxes (Friedrichs
et al., 2000; Howarth et al., 2002; Manning and Bass, 2006). Satellites have proven to be useful for
monitoring large areas and the large-scale dynamics. However, in regions with (temporary) stratified
waters satellites may not be sufficient to localize the bulk of the SPM beneath the pycnocline, as is
the case in the Dutch coastal zone (Joordens et al., 2001; Pietrzak et al., 2011). Geyer et al. (2004)
concluded that the bottom part of the water column may hold most of the information with respect
to cross-shelf transport and recommend further research focusing on near-bed observations.
Therefore, in this study we use shipboard measurements with a vertical CTD profiling system to
localize the transport pathway of SPM near the bed in the Dutch coastal zone.
The Dutch coastal zone borders the east-side of the southern North Sea.The residual current along
the Dutch coast is generally northward due to a combination of the tides, the predominantly
southwesterly winds and baroclinic effects (Otto et al., 1990). The southern North Sea is a shallow
area. A tidal wave moves in an anti-clockwise direction through the sea with strong tidal currents
near the coast, similar to a Kelvin wave. Surface turbulence by wind and waves has a marked effect
on the stability of the water column and local resuspension of SPM (Stanev et al., 2009). Besides the
limited depth, the research area is characterized by the large buoyancy flux from the Rhine-Meuse
estuary. The discharge contributes to the fresher continental coastal water from Belgian waters up to
the German Bight (Otto et al., 1990; Lacroix et al., 2004). North of the estuary mouth, along the
closed Dutch coast the Rhine Region of Freshwater Influence (ROFI) is formed over a length of about
100 km. Here, the fresh water plume competes with the mixing processes of the tidal current, wind
and waves. Studies on the temporal stratification in the bulge and the plume of the Rhine ROFI show
variations on tidal scales, where both the diurnal and the fortnightly scales are important (Simpson et
al., 1990; Simpson and Souza, 1995; De Boer et al., 2006).
5
Most research on ROFI’s, river plumes and coastal buoyant currents on continental shelves has been
focused on the interaction of turbulence, stratification and mixing. SPM transport in similar systems
as the Rhine ROFI has been studied in the Liverpool Bay ROFI (Jago et al., 2007; Krivtsov et al., 2008;
Souza and Lane, 2013), the Huanghe (Wright and Friedrichs, 2006) and Cassino Beach, Patos Lagoon
(Guerra et al., 2009; Vinzon et al., 2009). These system are defined by Walsh and Nittrouer (2009) as
EAD’s, Estuarine Accumulation Dominated systems. EAD’s are systems characterized by low river
discharges. However the discharge of the Rhine-Meuse system doesn’t qualify as low. A better
definition here is to use the river plume classification proposed by Yankovsky and Chapman (1997),
where the river discharge relative to the depth of the receiving shelf is used to define the plume
along the coast. In this classification the Rhine ROFIis a bottom attached plume. The river discharge is
large relative to the depth of the receiving continental shelf. This in contrast to the more commonly
investigated surface advected plumes with a relatively small discharge compared to the shelf depth,
such as the Hudson river plume and the Eel River shelf (Jurisa and Chant, 2012; Harris et al., 2005).
Bottom attached plumes can potentially carry sediment further than surface attached plumes,
because bottom resuspension can maintain sediment in the water column at large distances from
the river mouth (Geyer et al., 2004). A difference with the plumes considered in Geyer et al. (2004) is
that the input of SPM from the river Rhine itself is low. This sets the present study area apart from
the Huanghe and the Patos Lagoon.
The research area is located in the far-field plume of the Rhine ROFI, about 80 km north of the
estuary mouth, between IJmuiden and Den Helder (Figure 1). Previous observational programs in the
Dutch coastal zone with a focus on SPM concentrations and transport concerned large-scale surface
measurements and detailed in-situ measurements at Noordwijk (which is located just 40 km north of
the estuary mouth, see Figure 1). The large-scale surface data were derived from satellite
observations (Eleveld et al., 2008; Pietrzak et al., 2011, Fettweis et al., 2012) and the long-term
surface monitoring program by the Dutch government (the so-called MWTL observations) (Visser et
al., 1991). The observational programs at Noordwijk included both observations from moorings and

6
shipboard observations at transects (Huthnance, 1997; Joordens et al., 2001; McCandliss et al., 2002;
Howarth et al., 2002). Though these programs have much contributed to our present-day knowledge
of general SPM processes and processes specific for this area, they lack the resolution in space
and/or depth of the inner shelf in the area closer than 5 km from the coastline. Van Alphen (1990)
had already found a spot of high turbidity at 5 km from the coastline at Noordwijk, but this has never
been investigated further. In particular, it has remained unclear whether this was a mere accidental
phenomenon or a persistent one. In this paper we will present repeated measurements in this zone
with a high resolution in the cross-shore direction as well as in the vertical. With this we want to
answer the research question: “Is the SPM in the Dutch coast - under the influence of a bottom
attached plume - confined in a turbidity maximum close to the coast?” Moreover, we want to
identify cross-shore transports responsible for the localized turbidity maximum. Section 2 describes
the sailing strategy to localize and monitor the SPM maximum within the water column, both along a
transect and within a tidal cycle. The results in Section 3 describe the location of a turbidity
maximum zone (TMZ) measured at several transects along the coastline. Besides localizing the TMZ,
we also show the variation of the peak concentrations with the tide as well as its variation between
two opposing meteorological conditions. This is followed by a discussion on possible mechanisms
responsible for the TMZ in Section 4, and a concluding Section 5.
2 Measurements
Measurements to obtain vertical profiles of SPM concentrations, water density and current velocities
were carried out with RV Navicula during several non-consecutive days in the years 2003, 2010 and
2011. The main purpose was to obtain insight in the spatial and temporal variability of SPM in the
nearshore coastal zone over different cross sections.

7
2.1 Study area
The study area is located on the inner shelf along the coast of The Netherlands between IJmuiden
and Den Helder (Figure 1). This coastline is characterized by a sandy shoreline with regularly spaced
groins and 2 to 3 submerged natural sand bars in the nearshore zone. The seabed is predominantly
covered with sands of size 125 – 250 µm, with some patches near the shore in which the mud
content in the upper 20 cm is up to 10% (Van Alphen, 1990; Irion and Zöllmer, 1999). South of the
study area are the IJmuiden harbor jetties, north of the study area is the first and major inlet to the
Wadden Sea situated. The tide travels along the coast in northward direction with an average tidal
range at IJmuiden of 1.7 m. Surface tidal velocities are stronger during flood than ebb and range
between 0.7 and 1.1 m/s (van der Giessen et al., 1990). The wind climate contributes significantly to
the circulation of this shallow sea (Otto et al., 1990, Fettweis et al., 2012). The main wind direction is
southwest, but most storms have a northwest direction. The study area is located in the far-field
plume of the Rhine ROFI (Simpson et al., 1993; de Boer et al., 2009). Average surface salinities near
the coast are 28-30 PSU (Visser et al., 1991). The freshwater input from the harbor of IJmuiden
situated 8 km south of the area is small (95 m³/s) as compared with the Rhine Meuse discharge (2500
m³/s).
2.2 Methods
2.2.1 Sailing strategy
As the highest horizontal variation in the SPM concentration was expected perpendicular to the coast,
a higher resolution in cross-shore than in longshore direction was taken. A number of transects was
chosen perpendicular to the coast between IJmuiden and Callantsoog (Figure 1). Further north of
Callantsoog, the Marsdiep ebb-tidal delta influences currents and sediment transport significantly
and that area is therefore not included here. Each transect runs from 0.25 km until 7 km (2010 and
2011) and 10 km (2003) from the coastline, with increased station spacing in the offshore direction of
250 to 2000 m. The inshore station is usually in a water depth smaller than 6 meters, on the slope

8
towards or on top of the outer breaker bank. It is known that further offshore from 7 km the SPM
concentrations remain low (Visser et al., 1991; Joordens et al., 2001). At each station one CTD/OBS
profile was taken and water samples were collected, while a vessel-mounted acoustic Doppler
current profiler (ADCP) was continuously measuring current velocities.
The observations are divided into 10 single transect measurements (STMs) and 3 tidal cycle transect
measurements (TCMs) (Table 1). The STMs have a high spatial and low temporal (ones a day)
resolution, except for the Egmond transect in summer 2011 (twice a day). The TCMs have a low
spatial resolution (0.5, 2 and 5 km), but a high temporal resolution as the transect is measured every
hour during the tidal cycle. The TCM is always measured along the Wijk aan Zee transect, while the
STMs are measured primarily along the upper three transects (Figure 1).
2.2.2. Instrumentation
At the stations a vertical profile of temperature, salinity and optical backscatter was made by
lowering a lightweight frame from the afterdeck with a Seabird SBE 911plus CTD and a Seapoint OBS
until it reached the seabed. The CTD instruments were located 0.5 m from the bottom of the CTD
frame, and the OBS at 1.1 m from the bottom of the CTD frame. Data of the downcast are used for
analysis and averaged within 25 cm bins. For the TCMs the upcast data are used because the
downcast lack the data of the upper 2 meters. In contrast to other surveys, in our surveys both the
upcast and downcast data can be used, because the frame does not contain Niskin bottles and the
CTD is a pumped system. On a separate winch at the side of the ship a 5-liter Niskin bottle is lowered
to take 2 water samples; one sample at about 1 meter above the bed and one sample at about 1
meter below the surface. The current velocity measurements were done with a vessel-mounted
downward looking ADCP attached to the side of the ship at a water depth of 1 m. Up to TCM1 (Table
1), a Nortek 1 MHz ADCP was used with a bin size and blanking distance of 1 m, and a measurement
interval of 1 s. From STM4 onwards, an RDI 1.2 MHz ADCP was used. Data was stored at an interval

9
of 2 s using 4 pings per ensemble; the bin height and blanking distance were 0.5 m. Data were
averaged over 20 consecutive profiles (i.e. over 40 s).
2.2.3 OBS - SPM calibration
The calibration procedure of the OBS on the CTD-frame needs an extra conversion step, as the Niskin
bottles are not connected to the CTD-frame. This causes samples and OBS measurements to be
neither simultaneous nor at the same location. Direct calibration of the OBS with the filter samples is
therefore not accurate. Instead, we used an additional Seapoint OBS located in a black box in the
laboratory on board. Each cruise a calibration of this OBSlab for SPM concentrations was established,
whereas a calibration between the OBSctd and the OBSlab was performed only during the autumn
2010 survey (Van der Hout et al., 2012). This OBS-OBS relation is applied for the measurements of
2010 and 2011. For the 2003 measurements the relationship OBSctd = OBSlab is applied. The relation
between the two OBSs was found to be stable over a year (Merckelbach and Ridderinkhof, 2006;
Nauw et al., 2014). The calibration of the OBSlab for SPM concentrations was done as follows. From
each water sample taken with the Niskin bottle, a subsample was taken for the SPM concentration
measurement by filtration and another subsample was taken for the OBSlab measurement in the
black box, resulting in a voltage reading. The SPM concentration was determined by filtrating a
subsample between 0.4 and 1 l, depending on turbidity, over a pre-dried and pre-weighted GF/F
filter. The filter was then rinsed with demineralized water to capture all the particles on and remove
excess salt from the filter. Afterwards, the filters were dried again for 2 hours at 110° and re-weighed.
The SPM concentration was calculated with the weight difference over the exact filtered volume.
Each survey required a new calibration of the OBSlab for SPM concentrations, because during each
period of the year the suspended matter can have a different composition, which backscatters the
infrared light of the OBS in a different manner (Downing, 2006). For each of the 6 different surveys
listed in Table 1, a linear regression relation was calculated between OBSlab and the SPM
concentration with the MATLAB function “robustfit” using default settings (Figure 2). This linear

10
regression method applies a weight to each data point, which is iteratively determined to reduce the
influence of possible outliers on the regression line. The number of samples used for each calibration
varied between 30 and 144, which depended on the number of transects per survey and the number
of stations per transect. The regression lines in Figure 2 show a large spread in the directional
coefficient between surveys, with a factor of 2 between the two extremes in 2003 and in autumn
2011.
2.3 Conditions
An overview of the conditions during the surveys is given in Table 1. The total of 11 days cover three
seasons; spring, summer and autumn. Maximum wave height during the surveys was 1.5 m, which is
the operational limit of the research vessel. A bias to calm conditions is thus inevitable. STMs were
done in periods with a significant wave height ranging between 0.3 - 1.5 m. This range is reflected by
the wind force conditions varying between 2 and 5 Bft. The wind direction varied considerably
between the surveys. We measured more in northerly winds as compared to a more common
southwesterly wind in the yearly average. Usually one transect per day was surveyed, which occured
during various phases of the semi-diurnal tidal cycle and of the spring-neap tidal cycle as indicated in
Table 1. The three TCMs were all measured close to spring tide and under conditions with
comparable significant wave heights (0.7-1.1 m). Main difference was the wind direction and the
wind force.
3 Results
3.1 Location of turbidity maximum
In 2003, at all three STMs peaks in the SPM concentration were observed near the bed at the
stations 0.5, 1 and 1.5 km from the shore. During the more extensive campaigns in 2010 and 2011
again near-bed peaks in the SPM concentrations were observed at all 10 STMs, similarly close to the

11
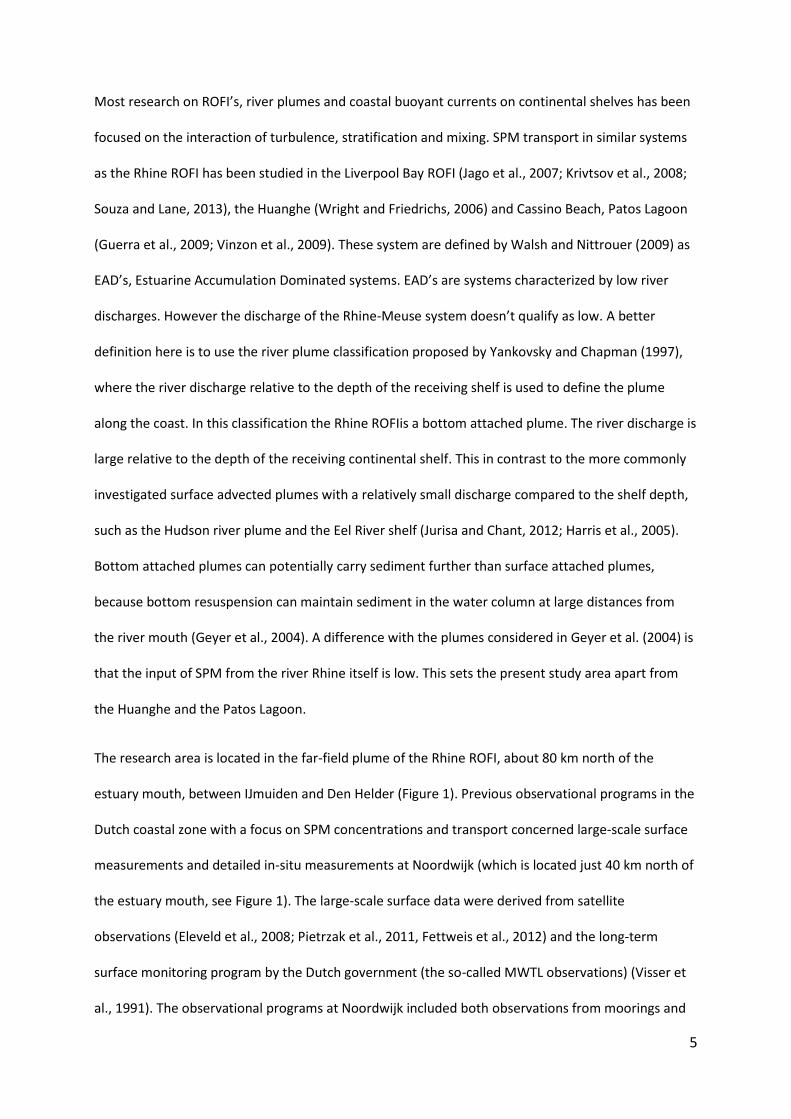
shore. Some examples of the cross-shore distribution of the SPM concentration are shown in Figure 3
(see also Table 1 for the survey list). A persistent turbidity maximum was found near the seabed
between 0.5 km and 3 km from the shore, present at each measured transect. This turbidity
maximum may extend even further inshore, as in some STMs the high near-bed SPM concentrations
extended up to the station nearest to the shore. The turbidity maximum was sometimes limited to a
few meters above the bed (Figure 3b, 3c and 3d), but at other times also visible all the way up the
surface (Figure 3a and Figure 5a). Within the turbidity maximum zone the highest concentrations
were measured at 1.25 -1.5 km from the shore in almost 50% of the surveys. In 25% of the other
surveys the second highest peak is found within this same small region. Peak concentrations varied
between 30 and 233 mg/l. The water depth at the location of the peak concentration was on average
13 meters, and the water depth of the turbidity maximum zone stretches from 15 m until 4.5 m
water depth and possibly even shallower.
3.2 SPM concentration variation within a tidal cycle
In order to evaluate the effect of the phase of the tidal current on the sediment concentration in the
water column three tidal cycle measurements (TCMs) on the southern transect (Wijk aan Zee) were
performed. We focus here on the results of TCM1 , the survey on March 30, 2010 (Table 1). Three
stations were successively occupied along the cross-section at 5 km, 2 km and 0.5 km from the
coastline. Note that the central station is located in the turbidity maximum zone and 0.5 km seaward
from the peak concentration location. The survey was started 1 hour before slack before ebb, and
was ended 1.5 hours after maximum flood currents, amounting to a series of 12 transects in 12 hours
(Figure 4a). The large variation in the depth of the profiles in Figure 4, is explained by the tidal range
(2 m) and by sailing up and down the transect over an irregular bathymetry; as the location of the
sampling stations varied slightly, so did the water depth.
Figure 4a shows the water level at IJmuiden, which has a tidal phase difference of 15 min with Wijk
aan Zee, and the depth averaged velocity derived from the ADCP measurements at the station 2 km

12
offshore. High water lagged the maximum flood velocity by one hour and low water occurs 3 hours
after maximum ebb velocities. The tidal curve is strongly modified by higher harmonics such as the
M4 tidal component, which strongly change the duration of the high and low water periods (Otto et
al., 1990). The rising tide (low to high water) lasts for 4 hours, and the falling tide for 8.5 hours. The
current velocity has a less asymmetric character with the ebb period lasting 6 hours and the flood
period 6.5 hours. Maximum depth-averaged flood and ebb velocities were 0.8 m/s and 0.5 m/s,
respectively.
The low density anomaly of a 1.5 meter thick water layer in Figure 4b is related to the presence of a
freshwater lens at the surface and is observed during the first 11 hours of the survey. At the two
other stations this freshwater lens was also present during the same period and had a similar
thickness. The lens is thought to originate from the freshwater discharge sluices at IJmuiden. Below
this lens a weak vertical stratification was present from 5:10 until 14:10. The intensity of the
stratification varied over time, being minimal during peak (flood) velocities and maximal near the
slacks. The relatively low densities in the measurement area are a result of the fresh water from the
outflow of the river Rhine and from the fresh water discharge at IJmuiden. With the alternating tidal
current, water with varying densities was advected through the measurement area. In other words,
the ROFI plume is moving back and forth through the measurement area, while being enhanced
locally by the discharge at the sluices near IJmuiden. Temperature differences had no significant
effect on the observed density variations.
Surface concentrations at the central station (2 km from the shoreline) varied between 20 and 60
mg/l (a factor 3), near-bed concentrations varied between 30 and 120 mg/l. On average the
concentration difference between the surface and near-bed was a factor of two, but varied between
1.5 and 10 within the tidal cycle. Peaks in near-bed concentrations and surface concentrations both
occurred near the peak velocities. A marked phase lag between the surface and the near-bed
concentrations is observed at the start of the ebb tidal phase, between 6:10 and 10:10 (Figure 4d). A

13
phase lag between the surface SPM concentration and the tidal current occurs by the fact that
vertical mixing of the SPM takes time. At the beginning of the ebb this phase lag was enlarged by the
stratification. At 8:10 and 9:10 UTC the stratification limited the resuspension, while at other times
the stratification did not halt resuspension. After reversal of the current at 7:10 UTC the near-bed
concentrations increased, indicating local resuspension. As ebb currents increased, sediment was
eventually mixed throughout the entire water column at 10:10. During this period the difference
between the surface and the near-bed concentrations increased to a factor of 10 at 8:10, after which
it decreased to 1.5. The depth-averaged concentration remained constant (solid red line in Figure 4d).
On the flood tidal phase, after 13:10, the near-bed and the surface concentrations started to increase
again and also deviate from each other even though there was no stratification. This is indicative of
the phase lag of the surface concentrations without stratification. Besides lower surface
concentrations, we also observed a smaller fluctuation in the surface concentrations than in the
near-bed concentrations. This phenomenon is also related to the lag in the upward diffusion under
alternating tidal currents (Yu et al., 2011).
Both the maximum and the depth averaged SPM concentrations at the offshore station (5 km
offshore)were lower than at the previously discussed central station (Figure 4d). Concentrations at
this station also showed a positive relation with the tidal current, similar to the central station. The
SPM concentrations at the inshore station (0.5 km offshore) showed no relation with the tidal
current (dashed red line in Figure 4d). Depth averaged concentrations were similar to those of the
central station, but maximum concentrations were lower; the sediment was more evenly distributed
over the vertical.
The other two TCMs (TCM2 and TCM3; Table 1) showed the same patterns as TCM1, but with a few
differences. A fresh water lens was not observed during the other two TCMs, although TCM2
contained a strong stratification in the upper 2 meters of the water column during the ebb phase of
the tide. However, the minimum observed density anomaly was 20.5 kg/m3, instead of nearly zero. In
TCM2 and TCM3 also a weak stratification during the ebb phase was present, of which the timing of

14
the onset and breakdown was slightly different. Similar correlations were found between the tidal
current and the near-bed and surface SPM concentrations as in TCM1. Only in TCM2 the surface
concentrations during ebb did not increase due to the strong stratification in the small surface layer.
The surface concentrations in TCM2 and TCM3 were lower than in TCM1, which increased the factor
between the near-bed and the surface concentration to 4, instead of 3. The depth-averaged
concentration at the inshore station showed different patterns for all three TCMs. There was a
positive relation with the tide for TCM2; while no relation for TCM3 and TCM1 was observed.
3.3 Influence of wind, waves and spring-neap cycle
In autumn 2010 the Egmond transect was surveyed in two consecutive weeks with opposing weather
conditions and spring-neap tidal phase, STM5 and STM6 (Table 1). These two surveys represent the
most extreme wind conditions in this observational program, both the most calm (STM6) and the
most energetic condition (STM5). On November 1st it was neap tide and wind speed and wave
heights were extremely low; the average wind speed was 1 Bft from the northeast and the average
wave height during the survey was 0.3 m. The preceding day the wind was easterly and 3 Bft and the
average wave height was 0.6 m, and the day before that the wave height was 1.3 m. On October 26th
it was one day after spring tide and the average wave height was 1.5 m with wind force 5 Bft from
the southwest, being still moderate wave conditions for the Dutch coastal zone. Hereafter we will
refer to it as energetic conditions, to mark the contrast with the other surveys. The preceding two
days wave heights were 1.8 and 2.5 m, and the wind speed was between 4 and 6 Bft from the north
and northwest. The concentration distributions on the two transects in Figures 5a and 5d show that
during both conditions a turbidity maximum was present at the same location i.e. at 1 - 2 km from
the shore. The distribution of the concentration during the energetic conditions was different from
the overall cross-sectional picture displayed in Figure 3 and Figure 5d, which were observed during
calm conditions. During energetic conditions, near the bed a layer of elevated concentrations of
about 1m thick was present at all measured stations in contrast to a single station at STMs during

15
calm conditions. Moreover, above that high suspension layer, up to the surface, the sediment was
almost homogeneously distributed in the vertical, and increasing in shoreward direction up to 1.25
km – the location of the peak concentration. During the energetic conditions the maximum
concentration was higher - 55 mg/l versus 30 mg/l - and overall more material - approximately 4
times - was in suspension than during the calm conditions. The maximum concentrations were
relatively low, because the measurements took place during slack after high water. In the previous
section on the variation of the SPM concentration within a tidal cycle it was shown that during this
phase of the tidal cycle the concentrations are lowest.
4 Discussion
In this study we have shown observations of a persistent turbidity maximum zone (TMZ) on various
transects located between 0.5 and 3 km from the coast. It is present during different phases of the
tide and under different meteorological conditions, which underlines its qualitative persistence. In
this section, we explore its origin and some relevant physical factors.
4.1 Tidal cycle dynamics
Within a tidal cycle, two peaks in the near-bed concentration - one around maximum ebb and
another around maximum flood currents - were found at the stations 2 km and 5 km offshore,
respectively the station in the TMZ and the station offshore of the TMZ. The depth-averaged and
peak concentrations at the stations inshore of the TMZ did not show a consistent relation with the
tide. The timing of the maximum concentration with respect to the maximum of the tidal current is
sometimes a little out of phase (Figure 4d), but it is important to realize that the sampling rate was
only about once every hour. Thus the exact moments of the peaks may have been missed. This holds
for both the concentration and the current, so, within that margin of uncertainty, the peaks can be
regarded as 'simultaneous'. This strongly suggests that local resuspension, rather than advection,

16
causes the high variations in the near-bed concentrations. The observed phase lag between the
surface concentrations and the tidal current and the amplitude attenuation of the surface
concentrations adds to the suggestion of local resuspension and settling by the tidal current being
the most important process (Bass and et al., 2002; Yu et al., 2011).
4.2 Periodic stratification
Stratification can inhibit the resuspension of bottom sediments into the upper water column (Geyer,
1993), as has been observed to occur at Noordwijk in the near-field plume of the Rhine ROFI
(Joordens et al., 2001). At each of our TCMs in the far-field of the plume, ebb phases of the tide were
stratified, whereas flood phases were either mixed or in any case weaker stratified. SPM
resuspension to the surface seemed to be inhibited due to the pycnocline only during a few
observations during the stratified period. Other, more gradual density differences did not halt mixing
of SPM into upper levels. Overall, lower surface concentrations were measured during the ebb phase
than during the flood phase, which may be attributed to a lower turbulence by both the presence of
the stratification and of the low ebb tidal current velocity. Interestingly, these observations show the
onset of periodic stratification during spring tides as also observed by Nauw and Van der Vegt (2012).
So far, modeling studies have indicated suppression of stratification during spring tides (De Boer et
al., 2006; Pietrzak et al., 2011).
4.3 Accumulating processes on the inner shelf
The tidal resuspension and settling behavior suggests that a local source of SPM has to be present in
the TMZ. There is no geological source of fine sediment in the seabed, thus the SPM has to
accumulate there after advection into the area. About 22±10 Mton/yr SPM is transported northward
with the residual northward current from the Strait of Dover. Along this transport path cross-shore
physical processes and cross-shore (and onshore) transport of SPM have been measured and
modelled at the Belgian coast (Fettweis and Van den Eynde, 2003; Lacroix et al., 2004), at the estuary
mouth of the Rhine-Meuse related to the dynamics of the fresh water bulge (De Kok, 1992; Horner-

17
Devine et al., 2014) and in the near-field plume at Noordwijk (Van der Giessen et al., 1990; Visser et
al., 1991; Visser et al., 1994; De Boer et al., 2008). The nearshore presence of a turbidity maximum
appears to be also a result of cross-shore processes related to the Rhine ROFI downstream of the
research area.
For our research area three zones can be distinguished where different processes may influence the
TMZ; 1) offshore of the TMZ: transport of offshore SPM towards the turbidity zone and 2) inshore of
the TMZ: transport of surf-zone SPM in offshore direction and 3) in the TMZ: processes sustaining the
SPM in the TMZ. Not all of these processes have been captured by the measurements described in
this paper, but we will highlight the plausible mechanisms for the accumulation zone of SPM using
literature. Onshore (offshore) transport in the near-bed layer can be caused by wind-induced
upwelling (or downwelling) (Lentz and Fewings, 2012), asymmetry in cross-shore straining (Stacey et
al., 2008) and Stokes drift from surface waves (Lentz and Fewings, 2012; Santamaria et al., 2013).
Transport of SPM from the surf-zone in an offshore direction is considered to maintain the turbidity
maximum zone at a distance from the shore. The location of the TMZ found in our surveys is also just
at a location where a sharp change in the bed slope occurs. The downslope transport of a fluid mud
layer from the surf-zone over the outer breaker bar is thought to be an offshore transport process
occurring under storm conditions, and has been modelled for the Eel River and Cassino Beach
systems (Harris et al., 2005; Vinzon et al., 2009). For the third zone two processes can be identified to
play a role in sustaining the SPM in the TMZ; 1) observed high concentrations of the benthic species
Ensis Directus can stabilize SPM in fecal pellets on the seabed (Armories and Reise, 1999; Grabowski
et al., 2011; Witbaard et al., 2015), and 2) turbulence reduction by near-bed stratification due to high
SPM concentrations will lead to SPM accumulation (Friedrichs et al., 2000).
4.4 Cross-shore transport on a tidal cycle
For the three TCMs we can identify the cross-shore transport at the three stations in and bordering
the TMZ. We calculated the vertically integrated cross-shore transport at each station and the tidally

18
integrated mass transport over the tidal cycle at each station. These values are shown in Figure 6.
Offshore transport occurs mostly during the ebb phase of the tide. This results partly from the
ellipticity of the tidal current (with a ellipticity coefficient of up to 0.1), and partly from the
orientation of the M2 tidal current. The M2 major axis is directed towards the coast with 8 degrees,
which is most likely a result of the diversion of the tidal current around the jetties at the harbor
entrance of IJmuiden 8 km south of the transect. This curvature south of the Wijk aan Zee transect is
visible in the bathymetry in Figure 1. Integrated over the tidal cycle the cross-shore transport is
onshore at all stations except the 0.5 km station in Summer 2011 (TCM2). The cross-shore transports
do not show a clear difference between the upwelling TCM1 and the downwelling TCMs; TCM2 and
TCM3, one of the processes from the list pointed out in the previous paragraph. Asymmetry in the
stratification at the slack tides has been observed and varies between the TCMs, but whether this
process is significant in the residual cross-shore transport cannot be inferred from our measurements.
The large differences in the tidally integrated mass transports between the stations show
accumulation of SPM between the stations surrounding the TMZ at all three TCMs. A back of the
envelope calculation of the average accumulation between two stations of on average 350 kg/m/tide
integrated over 30 km coastline (the distance between Wijk aan Zee and Callantsoog) and over 706
tidal cycles per year amounts to 7 Mton/year. This large accumulation in cross-shore direction is a
significant percentage with respect to the estimated yearly residual longshore transport of about 22
Mton/year. Thus, processes under calm conditions (Hs < 1.5 m, but spring tides) already contribute
to the accumulation of SPM in the TMZ.
5 Conclusion
Current velocity, density and SPM concentration observations have been obtained during three
surveys covering each an entire tidal cycle, each along a cross-shore transect at the Dutch coast near
IJmuiden. Thus, we have presented a quasi-synoptic view covering the vertical, the cross-shore

19
distance between the surf zone and up to 5 km off-coast, and the variation within a tidal cycle.
Supplemented with other transects along the coast, collected with low time and high spatial
resolution, we have been able to identify a persistent turbidity maximum zone (TMZ) at 0.5 – 3 km
from the coast, with the peak concentration located at 1.25 – 1.5 km from the coast (Figure 3). Tidal
currents, wind speed and wave height have a large effect on the resuspension of SPM due to the
shallowness of the area, as we showed by contrasting 'calm' and 'energetic' conditions (Figure 5). The
TMZ was found along a 30 km coastal stretch along the Dutch coast in the far-field plume of the
Rhine region of freshwater influence (ROFI). The influence of the freshwater discharged 80 km south
of the research area at the Rhine-Meuse mouth was still present in the form of a bottom attached
plume. Alongshore and cross-shore density differences were measured, which showed periodic
stratification during the ebb tidal phase. The much smaller freshwater discharge from IJmuiden at 8
km south of the research area was observed a single time as a freshwater lens floating on top of the
stratified Rhine ROFI waters.
Concentrations of more than 100 mg/l were observed frequently in the study area, even though it is
far from the main source area, Dover Strait.. This demonstrates the effect that bottom-attached
plumes have on the transport of SPM far downstream of their origin as indicated by Geyer et al.
(2004). We notice that Van Alphen (1990) already had found a similar turbidity maximum at 5 km
from the coast at a more southerly location (Noordwijk), closer to the mouth of the estuary. This – in
combination with several previously observed cross-shore and onshore transport processes between
the SPM source and our study area - suggests that the TMZ probably extends all the way from the
mouth of the Rhine-Meuse estuary up to Callantsoog, in the zone between the surf zone and 5 km
from the coast.
Our combined observations of current velocities and SPM concentrations indicate a cross-shore net
transport of SPM towards the TMZ over a tidal cycle, pointing to an accumulation under the
conditions of our measurements, i.e. calm weather conditions. It is beyond the dataset presented

20
here to determine what happens during storm conditions; conceivably the opposite could occur with
offshore/diffusive processes. Several processes that may be (partly) responsible for the accumulation
are listed in Section 4, but the number of observations was insufficient to determine the relative
importance of the various processes. Moreover, the wind and wave conditions during our
measurements were not representative for yearly conditions.
The measurements presented here imply that observations relying on surface measurements alone
must be treated with caution in the sense that they offer no immediate clue to the concentrations in
the water column as a whole. The observed strong vertical gradient in the concentration of SPM
varied over the tidal cycle, which especially reduced the variation in the surface concentration signal.
Three factors were observed that cause this variation in the vertical gradient; 1) a phase and
amplitude lag with respect to the tidal current, 2) asymmetrical tidal currents, both in period of the
different phases as well as in amplitude and 3) temporary stratification during the ebb phase of tide
which temporarily inhibits resuspension of SPM to the surface.
Acknowledgements
We thank the captains and crew of R.V. Navicula and the technicians –Sven Ober and Eric
Wagemaakers. Many thanks to colleagues at Royal NIOZ and students from the University of Utrecht
for their assistance during the cruises. We would like to thank the two anonymous reviewers who
helped to improve the manuscript significantly. This work was funded by the Ecoshape/Building with
Nature innovation program, under project number NTW3.1.

21
References
Armories W. and K. Reise 1999. On the population development of the razor clam Ensis americanus
near the island of Sylt (North Sea). Helgolandes Meeresforschung 52, 291-300.
Bass, S.J., Aldridge, J.N., McCave, I.N., Vincent, C.E., 2002. Phase relationships between fine sediment
suspensions and tidal currents in coastal seas. J. Geophys. Res. 107, 3146.
doi:10.1029/2001JC001269
Cacchione, D. A., Sternberg, R.W., Ogston, A. S., 2006. Bottom instrumented tripods: History,
applications, and impacts. Cont. Shelf Res. 26, 2319–2334. doi:10.1016/j.csr.2006.07.027
Downing, J., 2006. Twenty-five years with OBS sensors: The good, the bad, and the ugly. Cont. Shelf
Res. 26, 2299–2318. doi:10.1016/j.csr.2006.07.018
Eleveld, M.A., Pasterkamp, R., van Der Woerd, H.J., Pietrzak, J.D., 2008. Remotely sensed seasonality
in the spatial distribution of sea-surface suspended particulate matter in the southern North
Sea. Estuar. Coast. Shelf Sci. 80, 103–113. doi:10.1016/j.ecss.2008.07.015
Fettweis, M., Van den Eynde, D., 2003. The mud deposits and the high turbidity in the Belgian-Dutch
coastal zone, Southern bight of the North Sea. Cont. Shelf Res. 23, 669–691.
Fettweis, M., Nechad, B., Eynde, D. Van Den, 2007. An estimate of the suspended particulate matter
(SPM) transport in the southern North Sea using SeaWiFS images, in situ measurements and
numerical model results. Cont. Shelf Res. 27, 1568–1583. doi:10.1016/j.csr.2007.01.017
Fettweis, M., Monbaliu, J., Baeye, M., Nechad, B., Van den Eynde, D., 2012. Weather and climate
induced spatial variability of surface suspended particulate matter concentration in the North
Sea and the English Channel. Methods Oceanogr. 3-4, 25–39. doi:10.1016/j.mio.2012.11.001
Friedrichs, C.T., Wright, L.D., Hepworth, D.A., Kim, S.C., 2000. Bottom-boundary-layer processes
associated with fine sediment accumulation in coastal seas and bays. Cont. Shelf Res. 20,
807–841.
Geyer, W.R., 1993. The Importance of Suppression of Turbulence by Stratification on the Estuarine
Turbidity Maximum. Estuaries 16, 113. doi:10.2307/1352769
Geyer, W.R., Hill, P.S., Kineke, G.C., 2004. The transport, transformation and dispersal of sediment by
buoyant coastal flows. Cont. Shelf Res. 24, 927–949. doi:10.1016/j.csr.2004.02.006
Grabowski, R.C., Droppo, I.G., Wharton, G., 2011. Erodibility of cohesive sediment: The importance of
sediment properties. Earth-Science Rev. 105, 101–120. doi:10.1016/j.earscirev.2011.01.008
Guerra, J. V., Azevedo, M.M., Esteves, L.S., Vinzon, S.B., Violante-Carvalho, N., Schettini, C.A.F.,
Oliveira, R.F., Zaleski, A.R., 2009. Spatial and temporal variability of seawater properties,
current velocity and SPM concentration off Cassino Beach-Rio Grande-Southern Brazil. Cont.
Shelf Res. 29, 530–544. doi:10.1016/j.csr.2008.09.010

22
Harris, C.K., Traykovski, P.A., Geyer, W.R., 2005. Flood dispersal and deposition by near-bed
gravitational sediment flows and oceanographic transport: A numerical modeling study of
the Eel River shelf, northern California. J. Geophys. Res. 110, C09025.
doi:10.1029/2004JC002727
Horner-Devine, A.R., Pietrzak J., Stive M., Souza A., Meirelles S., Henriquez M., McKeon M., de Boer
G., 2014. Cross-shore sediment transport due to near-shore frontal processes in the Rhine
region of freshwater influence. American Geophysical Union, Ocean Sciences Meeting,
Honolulu, HI, February 2014.
Howarth, M.J., Simpson, J.H., Sündermann, J., van Haren, H., 2002. Processes of Vertical Exchange in
Shelf Seas ( PROVESS ). J. Sea Res. 47, 199–208.
Huthnance, J.M., 1997. The PROFILE project: an overview. J. Mar. Syst. 12, 249–261.
doi:10.1016/S0924-7963(96)00101-7
Irion, G., Zöllmer, V., 1999. Clay mineral associations in fine-grained surface sediments of the North
Sea. J. Sea Res. 41, 119–128.
Jago, C., Kennaway, G., Novarino, G., Jones, S., 2007. Size and settling velocity of suspended flocs
during a Phaeocystis bloom in the tidally stirred Irish Sea, NW European shelf. Mar. Ecol. Prog.
Ser. 345, 51–62. doi:10.3354/meps07006
Joordens, J.C.A., Souza, A.J., Visser, A., 2001. The influence of tidal straining and wind on suspended
matter and phytoplankton distribution in the Rhine outflow region. Cont. Shelf Res. 21, 301–
325. doi:10.1016/S0278-4343(00)00095-9
Jurisa, J.T., Chant, R., 2012. The coupled Hudson River estuarine-plume response to variable wind and
river forcings. Ocean Dyn. 62, 771–784. doi:10.1007/s10236-012-0527-7
Krivtsov, V., Howarth, M.J., Jones, S.E., Souza, a. J., Jago, C.F., 2008. Monitoring and modelling of the
Irish Sea and Liverpool Bay: An overview and an SPM case study. Ecol. Modell. 212, 37–52.
doi:10.1016/j.ecolmodel.2007.10.038
Lacroix, G., Ruddick, K., Ozer, J., Lancelot, C., 2004. Modelling the impact of the Scheldt and
Rhine/Meuse plumes on the salinity distribution in Belgian waters (southern North Sea). J.
Sea Res. 52, 149–163. doi:10.1016/j.seares.2004.01.003
Lentz, S.J., Fewings, M.R., 2012. The wind- and wave-driven inner-shelf circulation. Ann. Rev. Mar. Sci.
4, 317–43. doi:10.1146/annurev-marine-120709-142745
Manning, A.J., Bass, S.J., 2006. Variability in cohesive sediment settling fluxes: Observations under
different estuarine tidal conditions. Mar. Geol. 235, 177–192.
doi:10.1016/j.margeo.2006.10.013
McCandliss, R.R., Jones, S.E., Hearn, M., Latter, R., Jago, C.F., 2002. Dynamics of suspended particles
in coastal waters (southern North Sea) during a spring bloom. J. Sea Res. 47, 285–302.
doi:10.1016/S1385-1101(02)00123-5

23
McManus, J.P., Prandle, D., 1997. Development of a model to reproduce observed suspended
sediment distributions in the southern North Sea using Principal Component Analysis and
Multiple Linear Regression. Cont. Shelf Res. 17, 761–778.
Merckelbach, L.M., Ridderinkhof, H., 2006. Estimating suspended sediment concentration using
backscatterance from an acoustic Doppler profiling current meter at a site with strong tidal
currents. Ocean Dyn. 153–168. doi:10.1007/s10236-005-0036-z
Moreira, D., Simionato, C.G., Gohin, F., Cayocca, F., Luz Clara Tejedor, M., 2013. Suspended matter
mean distribution and seasonal cycle in the Río de La Plata estuary and the adjacent shelf
from ocean color satellite (MODIS) and in-situ observations. Cont. Shelf Res. 68, 51–66.
doi:10.1016/j.csr.2013.08.015
Nauw, J.J., van der Vegt, M., 2012. Hydrodynamics of the Rhine ROFI near IJmuiden. NCK-days
2012Crossing borders Coast. Res. Jubil. Conf. Proc. 1. doi:10.3990/2.191
Nauw, J.J., Merckelbach, L.M., Ridderinkhof, H., van Aken, H.M., 2014. Long-term ferry-based
observations of the suspended sediment fluxes through the Marsdiep inlet using acoustic
Doppler current profilers. J. Sea Res. 87, 17–29. doi:10.1016/j.seares.2013.11.013
Otto, L., Zimmerman, J.T.F., Furnes, G.K., Mork, M., Saetre, R., Becker, G., 1990. Review of the
physical oceanography of the North Sea. Netherlands J. Sea Res. 26, 161–238.
Pietrzak, J.D., de Boer, G.J., Eleveld, M.A., 2011. Mechanisms controlling the intra-annual mesoscale
variability of SST and SPM in the southern North Sea. Cont. Shelf Res. 31, 594–610.
doi:10.1016/j.csr.2010.12.014
Santamaria, F., Boffetta, G., Martins Afonso, M., Mazzino, a., Onorato, M., Pugliese, D., 2013. Stokes
drift for inertial particles transported by water waves. EPL (Europhysics Lett. 102, 14003.
doi:10.1209/0295-5075/102/14003
Simpson, J.H., Brown, J., Matthews, J., Allen, G., 1990. Tidal Straining, Density Currents, and Stirring
in the Control of Estuarine Stratification. Estuaries 13, 125. doi:10.2307/1351581
Simpson, J.H., Bos, W.G., Schirmer, F., Souza, A.J., Rippeth, T.P., Jones, S.E., Hydes, D., 1993. Periodic
stratification in the Rhine ROFI in the North Sea. Oceanol. Acta 16, 23–32.
Simpson, J.H., Souza, A.J., 1995. Semidiurnal switching of stratification in the region of freshwater
influence of the Rhine. J. Geophys. Res. 100, 7037–7044.
Souza, A.J., Howarth, M.J., 2005. Estimates of Reynolds stress in a highly energetic shelf sea. Ocean
Dyn. 55, 490–498. doi:10.1007/s10236-005-0012-7
Souza, A.J., Lane, A., 2013. Effects of freshwater inflow on sediment transport. J. Oper. Oceanogr. 6,
27–31.
Stacey, M.T., Fram, J.P., Chow, F.K., 2008. Role of tidally periodic density stratification in the creation
of estuarine subtidal circulation. J. Geophys. Res. 113, C08016. doi:10.1029/2007JC004581

24
Stanev, E.V., Dobrynin, M., Pleskachevsky, A., Grayek, S., Günther, H., 2009. Bed shear stress in the
southern North Sea as an important driver for suspended sediment dynamics. Ocean Dyn. 59,
183–194. doi:10.1007/s10236-008-0171-4
Van Alphen, J.S.L.J., 1990. A mud balance for Belgian-Dutch coastal waters between 1969 and 1986.
Netherlands J. Sea Res. 25, 19–30.
Van der Giessen, A., de Ruijter, W.P.M., Borst, J.C., 1990. Three-dimensional current structure in the
Dutch coastal zone. Netherlands J. Sea Res. 25, 45–55.
Van der Hout, C.M. van der, Gerkema, T., Nauw, J., Ridderinkhof, H., 2012. Observations of
suspended matter along the Dutch coast, in: NCK-Days 2012 : Crossing Borders in Coastal
Research., 13 March 2012 - 16 March 2012, Enschede, the Netherlands. pp. 213–217.
doi:10.3990/2.200
Vinzon, S.B., Winterwerp, J.C., Nogueira, R., de Boer, G.J., 2009. Mud deposit formation on the open
coast of the larger Patos Lagoon–Cassino Beach system. Cont. Shelf Res. 29, 572–588.
doi:10.1016/j.csr.2008.09.021
Visser, M., de Ruijter, W.P.M., Postma, L., 1991. The distribution of suspended matter in the Dutch
coastal zone. Netherlands J. Sea Res. 27, 127–143.
Visser, A.W., Souza, A.J., Hessner, K., Simpson, J.H., 1994. The effect of stratification on tidal current
profiles in a region of freshwater influence. Oceanol. Acta 17, 369–381.
Walsh, J.P., Nittrouer, C.A., 2009. Understanding fine-grained river-sediment dispersal on continental
margins. Mar. Geol. 263, 34–45. doi:10.1016/j.margeo.2009.03.016
Witbaard, R., Duineveld, G.C.A., Bergman, M.J.N., Witte, H.I., Groot, L., Rozemeijer, M.J.C., 2015. The
growth and dynamics of Ensis directus in the near-shore Dutch coastal zone of the North Sea.
J. Sea Res. 95, 95–105.
Wright, L.D., Friedrichs, C.T., 2006. Gravity-driven sediment transport on continental shelves: A status
report. Cont. Shelf Res. 26, 2092–2107. doi:10.1016/j.csr.2006.07.008
Yankovsky, A.E., Chapman, D.C., 1997. A Simple Theory for the Fate of Buoyant Coastal Discharges. J.
Phys. Oceanogr. 27, 1386–1401. doi:10.1175/1520-0485(1997)
Yu, Q., Flemming, B.W., Gao, S., 2011. Tide-induced vertical suspended sediment concentration
profiles: phase lag and amplitude attenuation. Ocean Dyn. 61, 403–410. doi:10.1007/s10236-
010-0335-x

25
Figures and tables
Figure 1. Maps of the study area. Left: The location of the study area along the Dutch Coast in the
southern North Sea. The red rectangle marks the study area and is enlarged on the right. Right:
Locations of the transects along the Dutch coast (water depths obtained from Rijkswaterstaat).
Transect names are indicated in white. Four transect locations are specified for 6 different transect
lines, named from north to south; Callantsoog, Camperduin, Egmond and Wijk aan Zee. The red
transects were surveyed in 2003; the yellow transects in 2010 and 2011.

26
Table 1. Details of location, time, conditions and main physical parameters for each survey. The
surveys are subdivided into STMs (single transect measurements) and TCMs (tidal cycle
measurements) and per survey week (column 2). Averaged wind, wave and tidal conditions during the
survey periods are given in columns 5-8. Wind force and direction are recorded at the IJmuiden
harbour (source: KNMI), significant wave heights and -directions at IJmuiden ammunition dumping
ground, located 36km offshore of IJmuiden (source: Rijkswaterstaat) and tidal elevation at Petten,
which is 5 km north of Camperduin (source: Rijkswaterstaat). The maximum observed SPM
concentration (Cmax), its distance from the coast and the time of its observation (indicative of the
tidal phase) are shown in columns 9-11. Columns 12 and 13 give the maximum vertical and horizontal
density difference of a survey.
Survey
# Survey week Date Location
Daily mean
wind force
(Bft) and
direction
Wave
height
Hs (m)
Time of high
water (UTC)
Neap tide (NT) -
spring tide (ST)
period
Cmax
(mg/l)
Distance
Cmax
from
coast (km)
Time
cmax
(UTC)
Δρ_max
vertical
Δρ_max
horizontal
STM1 Spring 2003 2003/04/22 Callantsoog 2 NW 0.4 7:00 / 19:30 3 days before NT 123 0.5 8:57 0.15 0.72
STM2 2003/04/22 Egmond 2 NW 0.4 7:00 / 19:30 3 days before NT 183 0.5 13:09 0.11 0.62
STM3 2003/04/23 Wijk aan Zee 3 N 0.4 8:20 / 21:00 2 days before NT 233 1.6 6:22 0.22 1.05
TCM1 Spring 2010a 2010/03/30 Wijk aan Zee 4 S 0.7 2:50 / 15:10 2 days before ST 117 2 16:10 22.31 7.82
STM4 Spring 2010b 2010/04/28 Camperduin 4 S 0.5 2:40 / 15:00 2 days before ST 74 1.5 11:12 0.38 1.25
STM5 Autumn 2010 2010/10/26 Egmond 5 SW 1.5 4:30 / 16:40 1 day after ST 55 1.5 8:10 0.18 0.81
STM6 2010/11/01 Egmond 1 NE 0.3 10:10 / 22:50 NT 30 1.25 13:34 1.49 1.37
STM7 Summer 2011 2011/08/31 Egmond 3 NW 1.1 4:10 / 17:20 ST 66 3 8:06 0.09 0.87
STM8 2011/08/31 Egmond 3 NW 1.1 4:10 / 17:20 ST 226 1.5 9:50 0.18 0.73
TCM2 2011/09/01 Wijk aan Zee 2 NE 1 5:50 / 17:20 1 day after ST 226 0.5 5:30 0.83 1.35
STM9 2011/09/02 Camperduin 3 NE 0.7 5:40 / 18:10 2 days after ST 130 1.25 6:12 0.84 1.21
TCM3 Autumn 2011 2011/10/13 Wijk aan Zee 3 E 1.1 3:30 / 15:50 1 day before ST 140 1 15:02 1.02 1.13
STM10 2011/10/14 Camperduin 3 E 0.8 4:10 / 16:20 ST 135 1 11:22 0.19 0.67
27
Figure 2. Calibration data (scattered points) and regression lines of SPM concentration and OBSlab for
the 6 different survey weeks (Table 1).
Figure 3. SPM concentrations (mg/l) at four transects perpendicular to the coast. Locations and times
of CTD/OBS-casts are indicated by a black vertical dashed line. The cross-sections correspond with the
four labeled transects indicated in Figure 1 and Table 1: a) Callantsoog: STM1; b) Camperduin: STM4;
c) Egmond: STM8; and d) Wijk aan Zee: STM3.

28
Figure 4. A tidal cycle of hydrodynamics and SPM concentrations at the transect Wijk aan Zee on
March 30, 2010 during the Spring 2010 cruise (TCM1 in Table 1). Data are from the 2 km station
unless stated otherwise. a) Water level at IJmuiden (m) (source: Rijkswaterstaat) and depth averaged
longshore velocity (m/s, positive velocities are northward). b) Vertical profiles of density anomaly
from CTD-casts in time. c) Vertical profiles of SPM concentrations (mg/l) from CTD-casts in time. d)
Depth-averaged SPM concentrations at the inshore station (0.5 km from the coast), the central
station (2 km from the coast) and the offshore station (5 km from the coast) and concentrations 1
meter above the bed (1 mab) and 1 meter below the surface (1 mbs) at the central station. Vertical
dashed lines indicate slack tide.

29
Figure 5. Contrasting weather conditions; energetic (left, STM5) versus calm (right, STM6). Cross-
shore sections of SPM concentration (a+d), density anomaly (b+e) and cross-shore current velocities
(c+f). Locations of CTD/OBS-casts are indicated as vertical dashed lines. Both surveys were carried out
at slack tide after high water. Contour lines of concentration are spaced every 7.5 mg/l, of density
anomaly every 0.25 kg/m3 and of velocity every 0.05 m/s, positive velocities are shoreward.

30
Figure 6.The cross-shore transport of SPM at different stations (indicated by different colors, with
increasing distance from the coast: black, red, blue and green) and its variation over a tidal cycle
(vertical axis). The dashed vertical lines indicate the locations of the stations, in terms of distance to
the coast. The departure of the thick line from the dashed vertical line indicates the vertically
integrated cross-shore transport; leftward displacements indicate onshore transport, rightward
displacements indicate offshore transport. The TMZ is indicated by the grey area between 0.5 and 3
km from the coast. Above each graph, the integrated cross-shore transport over the measured tidal
cycle is given with the resulting direction indicated by the arrow, and the color refers to the station.
For the 0.5 km station (black line) in TCM1 there was no overlapping ADCP and CTD data available for
the ebb tidal phase to calculate the cross-shore transport.