HOUSTON, TX METRO AREA MARKET SUMMARY206.188.3.84/webfiles/Houston/LOW RES - Market Report -...
40
MARKET SUMMARY HOUSTON, TX METRO AREA Cresa Houston 5599 San Felipe, Suite 500 Houston, Texas 77056 713.402.5800 cresa.com/houston Connect with us and get up-to-date information: Cresa : The Tenant’s Advantage Facebook.com/ cresa Follow us! @cresahouston Photo Credit: Stocksy.com
Transcript of HOUSTON, TX METRO AREA MARKET SUMMARY206.188.3.84/webfiles/Houston/LOW RES - Market Report -...
MARKET SUMMARYHOUSTON, TX METRO AREA
Cresa Houston
5599 San Felipe, Suite 500
Houston, Texas 77056
713.402.5800
cresa.com/houston
Connect with us and
get up-to-date information:
Cresa : The Tenant’s Advantage
Facebook.com/cresa
Follow us!@cresahouston
Photo Credit: Stocksy.com

TABLE OF CONTENTS 01
02
03
04
05
MARKET AT-A-GLANCE
RENTAL RATES & VACANCY
LEASING ACTIVITY
CONSTRUCTION & DELIVERIES
NET ABSORPTION
Information contained herein is provided, in part, from third party sources including: CoStar
Group, Greater Houston Partnership, Bureau of Economic Analysis, Bauer College of
Business, University of Houston - Institute for Regional Forecasting, U.S. Census Bureau,
Perryman Group, Institute for Supply Management – Houston, Houston Association of
Realtors, National Association of Realtors, C2ER Cost of Living Index 1Q’2014, Baker
Hughes U.S. Rig Count Reports.
Even though obtained from sources deemed reliable, no warranty or representation,
expressed or implied, is made as to the accuracy of the information herein. 08
06
07
MARKET OUTLOOK
SUBMARKET SNAPSHOTS
HOUSTON ECONOMY

1.9%
0.1%
0.9%
$6.23 net Industrial 4.1%
$9.38 net Flex 6.7%
$6.59 net Industrial + Flex 4.3%
0.1%
0.2%
0.0%
$32.93 Suburban: Class A 10.5%
$21.04 Suburban: Class B 12.8%
$26.64 Suburban: Class A + B 11.8%
$42.31 CBD: Class A 9.2%
$28.23 CBD: Class B 7.6%
$39.21 CBD: Class A + B 8.7%
1.2%
0.2%
0.9%
1000 Main 837,000 SF CBD Sale Office
1301 Fannin 784,000 SF CBD Sale Office
Westgate II & III 411,000 SF Katy Fwy. West Sale Office
Niagara Bottling 207,000 SF Southwest Lease Ind.
Direct Energy 192,000 SF Greenway Plaza Extension Office
Dunavant 186,000 SF Southeast Expansion Ind.
Professional Packaging 172,000 SF Southwest Lease Ind.
Swift Energy 120,000 SF Greenspoint Relocation Office
Bristow Group 115,000 SF Westchase Lease Office
Nabors Industries 98,000 SF North Belt Expansion Office
Gardere 75,000 SF CBD Renewal Office
HOUSTON MARKETAT-A-GLANCE
The answer to the question of what will happen in the
Oil & Gas industry and how it will affect Houston remains
unanswered as worldwide job cuts and reduced capital
budgets continue, and M&A activity begins to take place.
Most experts agree that Houston will not experience a
major downturn, as the city has benefited from significant
economic growth in the recent past and economic
indicators continue to see positive numbers. However,
even though absorption remained strong in 1Q’15 due to
move-ins from leases executed at the top of the market in
2014, expect the numbers to turn in the second quarter.
The office and, to a lesser degree, industrial markets, will
see fundamentals decline in the months to follow and into
2016, with the market transitioning favorably for tenants.
TENANT’S PERSPECTIVE
MARKET TRENDS
Increases in both vacancy and space available for sublease are expected to continue, while rates hold or experience small declines.
Tenants are holding off on large commitments on space or signing shorter-term leases in anticipa-tion of declining rental rates.
Landlord concessions continue to increase in order to remain competitive and retain tenants, especially in the west Houston submarkets.
Stricter construction financing, high labor costs, and a slowing energy economy have put a pause on proposed construction; however, Houston still leads the nation in development activity.
Half of the 15.2 MSF under construction is multi-tenant space, 23.5% of which is pre-leased at an average weighted gross asking rental rate of $42.50.
Large blocks of direct and sublease space are coming on the market daily due to M&A activity in Exploration & Production and the Oil & Gas Service sectors.
RECENT TRANSACTIONS RENTAL & VACANCY RATES
Tenant Size Submarket Type Sector Avg. Rate Vacancy Rate Margin from Q4
01

CBD 46,136,464 $39.21 $29.03 7.5% 1.1% 32 (50,870) 234,829 124,135 0 1,463,258
Suburban 210,346,814 $26.64 $26.52 11.1% 0.7% 557 1,647,811 8,732,086 2,515,636 4,912,504 13,966,116
E Fort Bend Co/Sugar Land 8,416,271 $24.64 $22.97 10.8% 2.2% 30 319,883 (862) 105,009 0 155,272
FM 1960 12,396,007 $19.88 $23.76 13.4% 0.4% 29 216,479 114,409 120,646 21,794 1,141,400
Galleria/West Loop 28,224,787 $32.58 $29.87 8.9% 0.9% 69 494,949 (19,299) 364,998 0 1,237,021
North Belt 12,423,300 $24.87 $17.62 20.4% 0.7% 24 (256,150) (697,094) 221,704 0 68,950
Greenway Plaza 10,623,499 $33.09 $22.84 7.8% 0.2% 45 112,993 (200,756) 383,715 0 833,275
Katy Freeway 34,860,251 $31.24 $27.30 8.5% 0.7% 82 2,656,831 351,596 331,911 1,314,589 4,376,990
Midtown 6,503,941 $29.34 $25.21 10.0% 0.0% 20 91,815 14,276 75,066 0 167,562
Northwest 13,654,677 $22.71 $21.05 15.1% 0.9% 33 334,773 599,974 98,195 1,043,344 108,633
South Main / Medical Ctr 9,395,070 $26.84 $19.99 10.7% 0.0% 19 132,430 (207,304) 47,004 0 0
Westchase 16,054,464 $31.01 $32.54 9.2% 1.7% 44 531,923 (306,506) 317,037 0 1,545,000
Woodlands 16,598,194 $28.91 $31.99 5.9% 0.4% 21 3,219,342 1,652,526 32,744 1,613,399 2,005,727
Other Suburban 41,196,353 $20.20 $24.54 14.0% 0.2% 141 876,818 346,851 417,607 247,378 2,326,286
Total 256,607,273 $28.35 $26.92 10.5% 0.8% 589 8,971,190 1,596,941 2,639,771 4,912,504 15,429,374
01 HOUSTON MARKET AT-A-GLANCE
MAJOR SUBMARKET STATS | CLASS A + B OFFICE
Submarket Inventory SFDirectRate
SubleaseRate
Direct Vacancy
SubleaseVacancy
LeasingDeals
LeasingSF
AbsorptionQtly
AbsorptionYTD
SF Delivered
SF Under Construction
SUBMARKET MAP
GALLERIA
$32.589.8%
G
REENWAY
$33.098.0%
M
ED CENTER
$26.8410.7%
CBD
$39.218.7%
KATY FWY
$31.249.2%
W
ESTCHASE
$31.0110.9%
E. F
ORT BEND CO
$24.6413.1%
N
ORTH BELT
$24.8721.1%
N
ORTHWEST
$22.7116.1%
FM 1960
$19.8813.8%
MIDTOWN
$29.3410.1%
TH
E
WOODLAND
S
$28.916.4%
$
%
Rental Rate
Vacancy Rate
AREA OVERVIEW

02
RENTAL RATES& VACANCY
Overall, rental rates for Class A and B citywide are holding
steady but starting to see small decresases in some key
submarkets. Year-over-year The Woodlands was the only
submarket to see a decrease in rate. Demand for space has
slowed a bit and citywide vacancy increased by 0.8% (80
basis points) year-over-year to 11.2%.
RENTAL RATES
• Rental rates are the highest they have been in Houston’s history.
• Rates have seen a 2.7% year-over-year increase, from $27.60
gross PSF in 1Q’14 to $28.35 in 1Q’15. Between 4Q’14 and
1Q’15, there was a modest 0.6% increase in rates.
• Class B rates showed the largest increase, 3.3% between 1Q’14
and 1Q’15, to $21.48 gross PSF; Class A rates increased by
1.2% to $34.88 gross PSF. Class B rates also showed a larger
increase quarter-over-quarter, indicating an increase in demand
for value options.
• In 1Q’15, the highest rates were found in the central submarkets
(the CBD, Greenway Plaza, Galleria/West Loop) and out west
(Katy Freeway and Westchase).
VACANCY
• Citywide, in Class A and B buildings, vacancy rates increased
by 0.8% (30 basis points) year-over-year to 11.2%; quarter-
over-quarter, vacancy rates increased by 0.9%.
• At 11.2% for Class A and B, the vacancy rate is 40 basis points
above the citywide five-year average of 11.6%.
• Year-over-year, Class A vacancy rates increased, while Class B
decreased by 0.5 percentage points.
• In 1Q’15, the lowest vacancy rates (below 9%) were in
Greenway Plaza (7.8%), Woodlands (5.9%), CBD (7.5%), and
Katy Freeway (8.5%).

02 RENTAL RATES & VACANCY
HISTORICAL DIRECT AVERAGE RATES HISTORICAL TOTAL VACANT AVAILABLE
SUBMARKET RENTAL RATES 1Q’15 SUBMARKET VACANCY RATES 1Q’15
The Woodlands
Midtown
Westchase
Katy Freeway
Galleria
Greenway Plaza
CBD
Houston
Medical Center
$0
Rental Rate Houston Avg Rate
Sugar Land
North Belt
Northwest
FM 1960
$5 $10 $15 $20 $25 $30 $35 $40
Medical Center
Westchase
Houston
Sugar Land
FM 1960
Northwest
North Belt
Midtown
Galleria
0%
Vacancy Rate Houston Avg Rate
Katy Freeway
CBD
Greenway Plaza
The Woodlands
5% 10% 15% 20%
1Q ‘08 1Q ‘09 1Q ‘10 1Q ‘11 1Q ‘12 1Q ‘13 1Q ‘14
$40.00
$35.00
$30.00
$25.00
$20.00
$15.00
$10.00
$5.00
$0.00
Class A Class B Houston Average Rate Class A Class B Houston Average Rate
16%
14%
12%
10%
8%
6%
4%
2%
0%
1Q ‘08 1Q ‘09 1Q ‘10 1Q ‘11 1Q ‘12 1Q ‘13 1Q ‘141Q ‘15 1Q ‘15

03
LEASING ACTIVITY
Lease transaction volume slowed sharply in 1Q’15 to 2.63
MSF leased compared to the previous quarter, which was
more than 4 MSF. Between 2010 and 2014, leasing activity
averaged over 20.9 MSF annually. The slowdown in leasing
activity is mainly due to the uncertainty of where oil prices
will land.
LEASING ACTIVITY NOTES
• Lease transaction volume also fell below the 15-year quarterly
average of 4.4 MSF.
• The 1st quarter only saw 2.6 MSF leased, far below the quarterly
average of the previous 5 years of over 5.2 MSF leased.
• The total number of deals was also down to 589 – lower than
the previous 36 quarters and lower when compared to the 15-
year quarterly average of 806.
• Average deal size (5,053 SF in 1Q’15) is also lower compared to
the previous four quarters and the 15-year average.
TOP 10 TRANSACTIONS HISTORICAL LEASING ACTIVITY
‘01 ‘02 ‘03 ‘04 ‘05 ‘06 ‘07 ‘08 ‘09 ‘10 ‘11 ‘12 ‘13 ‘14
25
20
15
10
5
4,500
4,000
3,500
3,000
2,500
Milli
ons
Total SF Leased Total Deals
Nabors Industries 98,000 North Belt Expansion
Gardere 75,000 CBD Renewal
General Electric 72,000 FM 1960/Hwy 249 Expansion
Lennar Homes 67,500 North Belt Lease
Superior Energy Services 64,000 FM 1960/Hwy 249 Lease
Regions Bank 62,000 Greenway Plaza Lease
LTD Financial Services 62,000 Southwest Renewal
Direct Energy 192,000 Greenway Plaza Extension
Swift Energy 120,000 Greenspoint Relocation
Bristow Group 115,000 Westchase Lease
Tenant SF Building Submarket
Millions
1 2 30
North Belt
The Woodlands
Westchase
Katy Freeway
Galleria
CBD
Greenway Plaza
Northwest
FM 1960
Sugar Land
Midtown
Medical Center
2014 Leasing Q1’15 Leasing
SUBMARKET COMPARISON
Leasing activity dwindled starting in 4Q’15. The Galleria. Greenway Plaza, Katy Freeway, and Westchase saw the most activity during the first quarter of 2015.
‘15

04
CONSTRUCTION &DELIVERIES
Nearly eight MSF was delivered across Houston during 2014
(buildings over 75,000 SF), and the momentum was even
stronger in 1Q’15 with more than 4.9 MSF – the highest
quarterly delivery rate in the past 15 years. Despite a huge
run up in construction costs, there is another 18.7 MSF un-
der construction across the Houston area.
DELIVERIES (BLDGS. OVER 100.000 SF)
• Nearly 3.8 MSF can be attributed to 9 buildings with more than
100,000 SF
• Of the 4.9 million SF delivered in 1Q’15, roughly 72.0% was
leased at the time of completion.
• The tenancy profile of approximately one third of the buildings
(3) delivered in 1Q’15 was single tenant, corporate users, taking
62.2% of the space delivered and equating to 2.3 MSF.
• 1Q’15 saw the most SF delivered over the past 15 years.
• The areas to the north and west saw the most building
completions, including Katy Freeway, Northwest Far, and The
Woodlands.
PROPOSED DEVELOPMENT
• There is an additional 23.7 MSF proposed, most of
which, given current economic conditions, will not come
out of the ground this year, particularly through at least
the next two quarters.
• The submarkets that have the most proposed
development include: Katy Freeway (5.1 MSF), the CBD
(5.1 MSF), and The Woodlands (4.2 MSF).
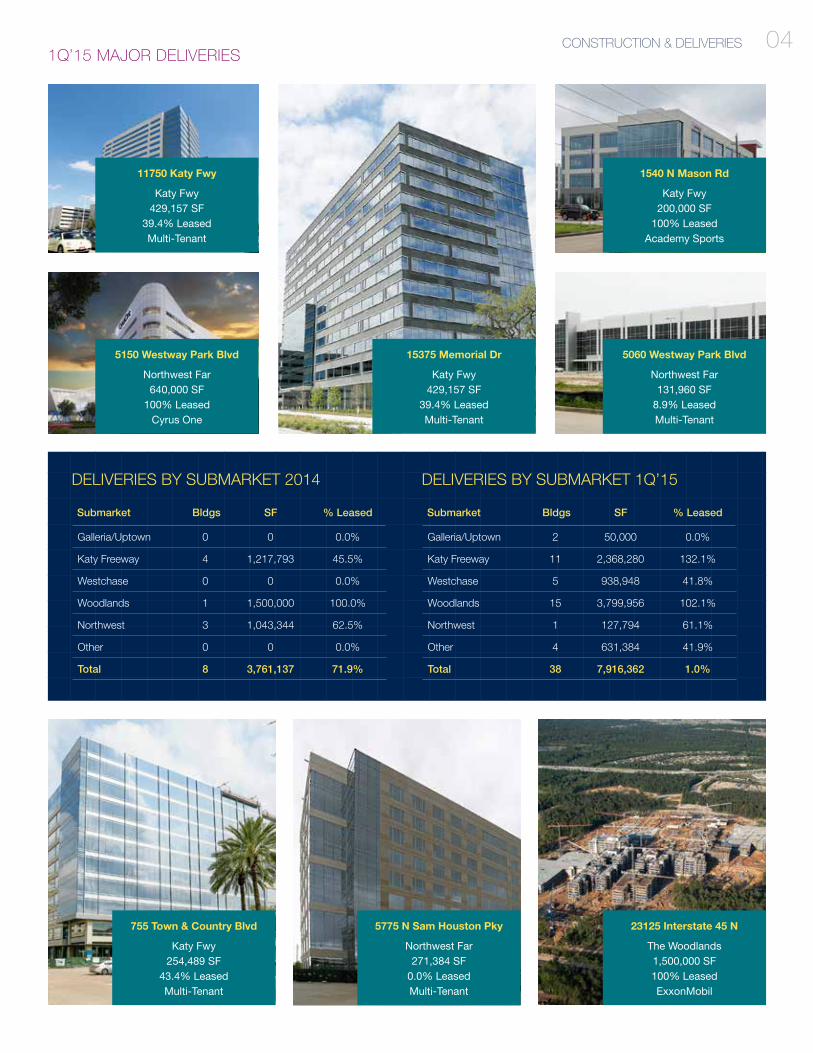
04CONSTRUCTION & DELIVERIES1Q’15 MAJOR DELIVERIES
11750 Katy Fwy
Katy Fwy429,157 SF
39.4% LeasedMulti-Tenant
5150 Westway Park Blvd
Northwest Far640,000 SF
100% LeasedCyrus One
15375 Memorial Dr
Katy Fwy429,157 SF
39.4% LeasedMulti-Tenant
1540 N Mason Rd
Katy Fwy200,000 SF
100% LeasedAcademy Sports
5060 Westway Park Blvd
Northwest Far131,960 SF
8.9% LeasedMulti-Tenant
23125 Interstate 45 N
The Woodlands1,500,000 SF100% LeasedExxonMobil
5775 N Sam Houston Pky
Northwest Far271,384 SF
0.0% LeasedMulti-Tenant
755 Town & Country Blvd
Katy Fwy254,489 SF
43.4% LeasedMulti-Tenant
DELIVERIES BY SUBMARKET 2014
Galleria/Uptown 0 0 0.0%
Katy Freeway 4 1,217,793 45.5%
Westchase 0 0 0.0%
Woodlands 1 1,500,000 100.0%
Northwest 3 1,043,344 62.5%
Other 0 0 0.0%
Total 8 3,761,137 71.9%
Submarket Bldgs SF % Leased
DELIVERIES BY SUBMARKET 1Q’15
Galleria/Uptown 2 50,000 0.0%
Katy Freeway 11 2,368,280 132.1%
Westchase 5 938,948 41.8%
Woodlands 15 3,799,956 102.1%
Northwest 1 127,794 61.1%
Other 4 631,384 41.9%
Total 38 7,916,362 1.0%
Submarket Bldgs SF % Leased
04
14.5 MSF
2Q’15 2017
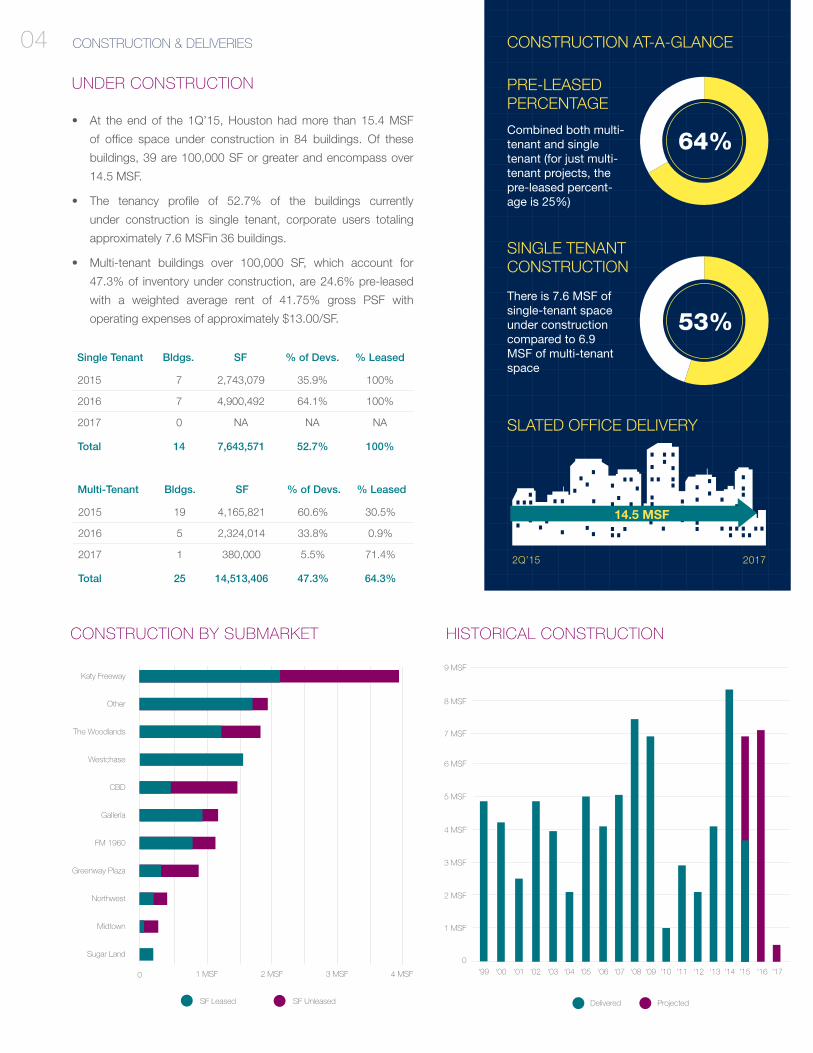
CONSTRUCTION AT-A-GLANCE
SLATED OFFICE DELIVERY
PRE-LEASEDPERCENTAGE
Combined both multi-tenant and single tenant (for just multi-tenant projects, the pre-leased percent-age is 25%)
64%
SINGLE TENANTCONSTRUCTION
There is 7.6 MSF of single-tenant space under construction compared to 6.9 MSF of multi-tenant space
53%
• At the end of the 1Q’15, Houston had more than 15.4 MSF
of office space under construction in 84 buildings. Of these
buildings, 39 are 100,000 SF or greater and encompass over
14.5 MSF.
• The tenancy profile of 52.7% of the buildings currently
under construction is single tenant, corporate users totaling
approximately 7.6 MSFin 36 buildings.
• Multi-tenant buildings over 100,000 SF, which account for
47.3% of inventory under construction, are 24.6% pre-leased
with a weighted average rent of 41.75% gross PSF with
operating expenses of approximately $13.00/SF.
UNDER CONSTRUCTION
2015 7 2,743,079 35.9% 100%
2016 7 4,900,492 64.1% 100%
2017 0 NA NA NA
Single Tenant Bldgs. SF % of Devs. % Leased
Total 14 7,643,571 52.7% 100%
2015 19 4,165,821 60.6% 30.5%
2016 5 2,324,014 33.8% 0.9%
2017 1 380,000 5.5% 71.4%
Multi-Tenant Bldgs. SF % of Devs. % Leased
Total 25 14,513,406 47.3% 64.3%
CONSTRUCTION BY SUBMARKET
FM 1960
Galleria
CBD
Westchase
The Woodlands
Other
Katy Freeway
Greenway Plaza
Northwest
0
SF Leased SF Unleased
Midtown
Sugar Land
1 MSF 2 MSF 3 MSF 4 MSF
Delivered Projected
1 MSF
0
HISTORICAL CONSTRUCTION
2 MSF
3 MSF
4 MSF
5 MSF
6 MSF
7 MSF
8 MSF
9 MSF
‘99 ‘00 ‘01 ‘02 ‘03 ‘04 ‘05 ‘06 ‘07 ‘08 ‘09 ‘10 ‘11 ‘12 ‘13 ‘14 ‘15 ‘16 ‘17
CONSTRUCTION & DELIVERIES

04CONSTRUCTION & DELIVERIES2014 1Q’15 UNDER CONSTRUCTION
915 Eldridge PkwyKaty Fwy West
526,637 SF0.0% LeasedMulti-Tenant
Delivers 4/2016
925 Eldridge PkwyKaty Fwy West
600,000 SF100% LeasedConocoPhillipsDelivers 9/2015
1500 Post Oak BlvdGalleria
600,000 SF100% LeasedBHP Billiton
Delivers 10/2016
Noble Energy Center IIFM 1960
456,000 SF100% LeasedNoble Energy
Delivers 6/2015
9811 Katy FwyKaty Fwy East
526,637 SF58.5%
Multi-TenantDelivers 11/2015
Subsea Ln @ W Lake HoustonNortheast Near1,700,000 SF100% Leased
FMC TechnologiesDelivers 6/2016
ExxonMobil Phase IIIThe Woodlands
500,000 SF100% LeasedExxonMobil
Delivers 6/2015
2101 Citywest BlvdWestchase
1,100,000 SF100% Leased
Phillips 66Delivers 6/2016
609 Main StCBD
1,057,668 SF0.0% LeasedMulti-Tenant
Delivers 12/2016
825 Town & CountryKaty Fwy East
227,063 SF62.3% LeasedMulti-Tenant
Delivers 7/2015
3737 Buffalo SpeedwayGreenway Plaza
400,000 SF22.9% LeasedMulti-Tenant
Delivers 8/2015
935 Eldridge PkwyKaty Fwy West
546,604 SF100% LeasedConocoPhillipsDelivers 9/2015
05
HISTORICAL NET ABSORPTION SUBMARKET COMPARISON
NET ABSORPTION
The 1st quarter saw total net absorption of 1.6 MSF, which
is a healthy quarterly average especially given the amount of
deliveries. The Woodlands had the highest net absorption
followed by the Northwest and Katy Freeway submarkets.
• Abosprtion in 2014 at 9.0 MSF was historically the highest it’s
been in the past 15 years.
• The Woodlands’ total net absorption in 1Q’15 was nearly 1.7
MSF. The Northwest and Katy Freeway submarkets followed
with 600,000 SF and 352,00 SF, respectively.
• The submarkets with the most negative net obsorption in 1Q’15
were the North Belt (-700,000) and Westchase (-300,000 SF).
UNDER CONSTRUCTION
0 MSF
(2) MSF
2 MSF
4 MSF
6 MSF
8 MSF
10 MSF
‘99 ‘00 ‘01 ‘02 ‘03 ‘04 ‘05 ‘06 ‘07 ‘08 ‘09 ‘10 ‘11 ‘12 ‘13 ‘14 ‘15
Class A Class B Houston Total Absorption
0 MSF(2) MSF 2 MSF 4 MSF
1Q’15 2014
Sugar Land
FM 1960
CBD
Northwest
Katy Freeway
The Woodlands
Galleria
Midtown
Westchase
Greenway Plaza
Medical Center
North Belt

06
SUBMARKET SNAPSHOTS
06
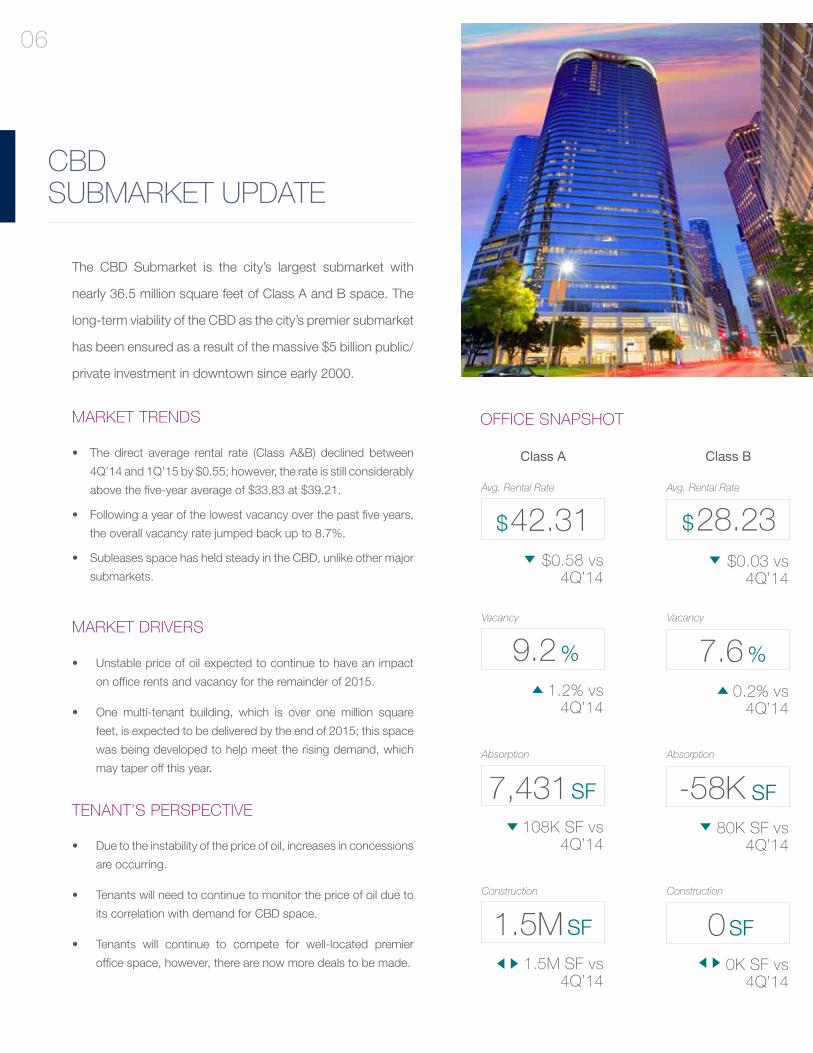
CBDSUBMARKET UPDATE
The CBD Submarket is the city’s largest submarket with
nearly 36.5 million square feet of Class A and B space. The
long-term viability of the CBD as the city’s premier submarket
has been ensured as a result of the massive $5 billion public/
private investment in downtown since early 2000.
MARKET TRENDS
MARKET DRIVERS
TENANT’S PERSPECTIVE
• The direct average rental rate (Class A&B) declined between
4Q’14 and 1Q’15 by $0.55; however, the rate is still considerably
above the five-year average of $33.83 at $39.21.
• Following a year of the lowest vacancy over the past five years,
the overall vacancy rate jumped back up to 8.7%.
• Subleases space has held steady in the CBD, unlike other major
submarkets.
• Unstable price of oil expected to continue to have an impact
on office rents and vacancy for the remainder of 2015.
• One multi-tenant building, which is over one million square
feet, is expected to be delivered by the end of 2015; this space
was being developed to help meet the rising demand, which
may taper off this year.
• Due to the instability of the price of oil, increases in concessions
are occurring.
• Tenants will need to continue to monitor the price of oil due to
its correlation with demand for CBD space.
• Tenants will continue to compete for well-located premier
office space, however, there are now more deals to be made.
$28.23$0.03 vs
4Q’14
0.2% vs 4Q’14
80K SF vs 4Q’14
Class A Class B
SF00K SF vs
4Q’14
OFFICE SNAPSHOT
Avg. Rental Rate Avg. Rental Rate
Vacancy Vacancy
Absorption Absorption
Construction Construction
$42.31$0.58 vs
4Q’14
%9.21.2% vs
4Q’14
108K SF vs 4Q’14
SF1.5M1.5M SF vs
4Q’14
SF-58KSF7,431
%7.6
0CBD SUBMARKET UPDATE
NEW DEVELOPMENT MAP 100,000 SF+Proposed Under Construction
2
5
7
4
6
3
3
6
4
7
1 2
5
1
1600 Louisiana1.7 MSF
0.0% Leased
5 Allen Center1.0 MSF
0.0% Leased
Hilcorp Energy Tower406,600 SF
100% Leased
6 Houston Center633,482 SF
4.0% Leased
Capitol Tower748,800 SF
0.0% Leased
609 Main1.1 MSF
0.0% Leased
1 Market Square750,000 SF
0.0% Leased

06 CBD SUBMARKET UPDATE
TOP 5 EMPLOYERS
8,600 Employees 7,000 Employees 4,892 Employees 3,826 Employees 2,958 Employees
TOP 5 LEASES SIGNED IN 1Q’15
75,000 SF 24,260 SF 20,000 SF 13,000 SF 10,000 SF
TOP 5 SUBLEASE SPACES
811 Main 500 Jefferson Three Allen Ctr 500 Jefferson Fulbright Tower
106,005 SF 97,953 SF 84,508 SF 77,629 SF 73,971 SF
TOP 5 LARGEST BLOCKS OF SPACE
800 Bell 2 Houston Center Two Shell Plaza Two Shell Plaza Total Plaza
1.3 MSF 234,333 SF 188,695 SF 159,665 SF 124,083 SF
UndisclosedShannon, Martin,
Finkelstein & Alvarado

GALLERIASUBMARKET UPDATE
The Galleria area has historically been one of Houston’s
most popular submarkets, providing tenants great access
and amenities. With the metro area’s nation-leading job
growth over the past few years, this submarket has grown
increasingly tight, particularly in Class A buildings.
$25.60$0.19 vs
4Q’14
1.2% vs 4Q’14
58K SF vs 4Q’14
Class A Class B
SF29K16K SF vs
4Q’14
OFFICE SNAPSHOT MARKET TRENDS
MARKET DRIVERS
TENANT’S PERSPECTIVE
• The direct average rental rate (Class A&B) has essentially
remained flat over the past three quarters. 4Q’14 and 1Q’15 by
$0.24; however, the rate is still higher than the five-year average
of $28.67 at $32.58. Quarter to quarter, Class A rates saw a
small decline of $0.19, or -0.5%
• Vacancy rates have also been somewhat flat – at 9.8% in 1Q’15
for Class A&B combined, and 9.6% the previous two quarters.
• Subleases space has held steady in the Galleria, unlike the
major submarkets in west Houston.
• The unstable price of oil has not had a large impact on office
rents and vacancy yet, however landlords have been giving in
on concessions.
• There are a few multi-tenant buildings currently under
construction that were being developed to help meet rising
demand, which has tapered off a bit this year.
• Due to the instability of the price of oil, increases in concessions
are occurring.
• Tenants will continue to compete for well-located premier
office space; however, there are now more deals to be made.
Avg. Rental Rate Avg. Rental Rate
Vacancy Vacancy
Absorption Absorption
Construction Construction
$35.41$0.19 vs
4Q’14
%4.90.5% vs
4Q’14
1.7M30K SF vs
4Q’14
SF2.0M1.3M SF vs
4Q’14
%8.1
SF SF-19K
06
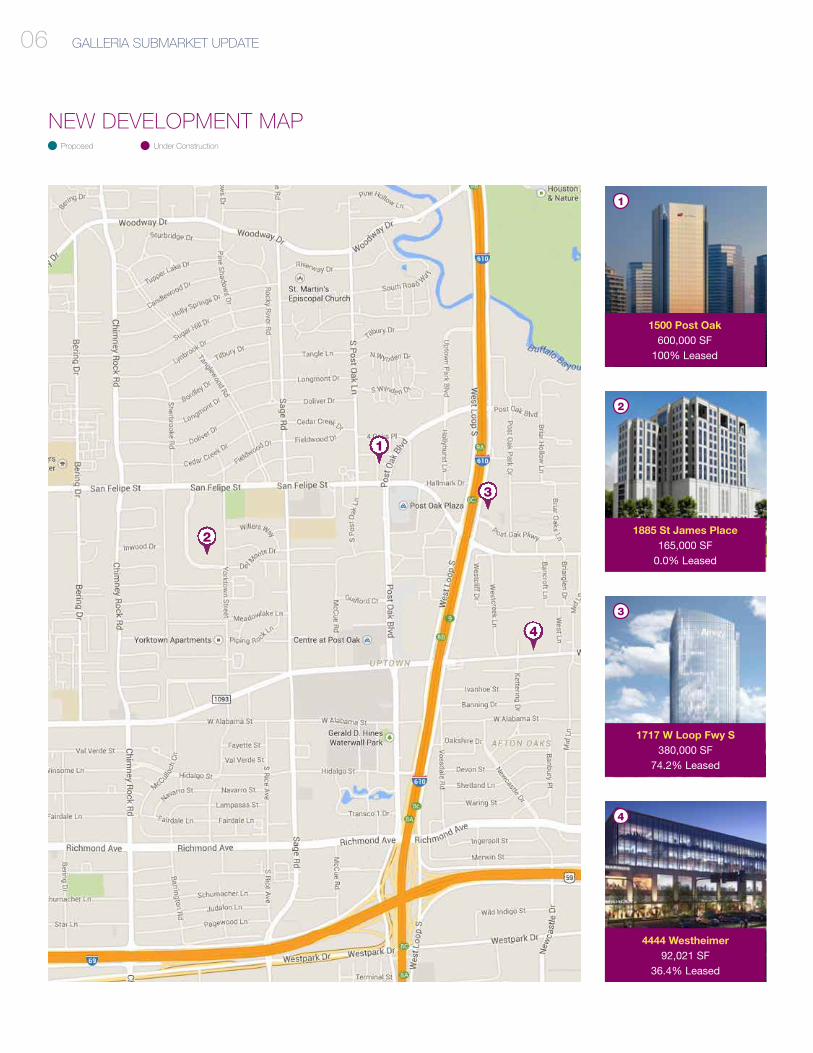
GALLERIA SUBMARKET UPDATE06
Proposed Under Construction
2
1
1
1500 Post Oak600,000 SF
100% Leased
NEW DEVELOPMENT MAP
2
1885 St James Place165,000 SF
0.0% Leased
3
1717 W Loop Fwy S380,000 SF
74.2% Leased
4
4444 Westheimer92,021 SF
36.4% Leased
3
4

06GALLERIA SUBMARKET UPDATE
TOP 5 EMPLOYERS
2,000 Employees 2,000 Employees 2,000 Employees 2,000 Employees 1,700 Employees
TOP 5 LEASES SIGNED IN 1Q’15
58,000 SF 39,000 SF 33,500 SF 29,990 SF 23,864 SF
TOP 5 SUBLEASE SPACES
Galleria Tower II 5151 San Felipe Williams Tower 1800 West Loop S. 1775 St. James
80,200 SF 62,523 SF 46,466 SF 39,626 SF 33,322 SF
TOP 5 LARGEST BLOCKS OF SPACE
5251 Westheimer Five Post Oak Park 2700 Post Oak 2425 West Loop S. 1233 West Loop S.
141,848 SF 140,618 SF 123,779 SF 111,250 SF158,084 SF

WESTCHASE SUBMARKET UPDATE0606
WESTCHASESUBMARKET UPDATE
The Westchase District’s roots trace back to the early 1960’s,
evolving from farmland into a 2,460 acre master-planned
community bustling with commercial activity. More than
500,000 people reside within five miles of this submarket,
giving area employers a large and well-educated workforce.
$20.14$0.50 vs
4Q’14
0.5% vs 4Q’14
93K SF vs 4Q’14
Class A Class B
SF00 SF vs
4Q’14
OFFICE SNAPSHOTMARKET TRENDS
MARKET DRIVERS
TENANT’S PERSPECTIVE
• The average rental (Class A&B) rate declined marginally between
1Q’15 and 1Q’14 (–0.5%), however, it is still at a historically high
level at $31.01.
• The vacancy rate increased by 2.4 percentage points to 10.9%
due to an increase in sublease space.
• Absorption decreased significantly in the first quarter of 2015.
1Q’15 absorption totaled nearly (306,506) SF.
• Leasing activity slowed, seeing about a third of the activity from
the previous year.
• Price of oil expected will have an impact on office rents and
vacancy for the remainder of 2015.
• Vacancy is the highest it’s been since 4Q’2010 due to the
instability in the price of oil.
• The 1.5 million SF under construction is 100% leased, adding
no vacant space to inventory.
• Due to the low price of oil, increases in concessions are
continuing.
• The market is currently tenant favorable.
Avg. Rental Rate Avg. Rental Rate
Vacancy Vacancy
Absorption Absorption
Construction Construction
$38.42$0.57 vs
4Q’14
%11.20.0% vs
4Q’14
554K SF vs 4Q’14
SF1.5M0K SF vs
4Q’14
SF77KSF-383K
%10.6

0606WESTCHASE SUBMARKET UPDATE
Proposed Under Construction
4
1
3
5
23
4
5
2
1
CityWest 6387,200 SF
0.0% Leased
CityWest 5306,900 SF
0.0% Leased
2101 CityWest1.1 MSF
100% Leased
10353 Richmond445,000 SF
100% Leased
6004 Rogerdale158,607 SF
0.0% Leased
NEW DEVELOPMENT MAP 100,000 SF+

06 WESTCHASE SUBMARKET UPDATE
TOP 5 EMPLOYERS
2,344 Employees 1,700 Employees 1,277 Employees 1,100 Employees 930 Employees
TOP 5 LEASES SIGNED IN 1Q’15
100,000 SF 39,471 SF 25,000 SF 25,000 SF 17,472 SF
TOP 5 SUBLEASE SPACES
CityWestPlace Bldg. 4 CityWestPlace Bldg. 2 10500 Richmond Two BriarLake Plaza Westchase Corp. Ctr.
176,193 SF 103,018 SF 93,614 SF 97,441 SF 31,563 SF
TOP 5 LARGEST BLOCKS OF SPACE
CityWestPlace Bldg. 1 Two BriarLake Plaza Westchase Park II Richmond Park 2900 Wilcrest Dr
107,088 SF 100,000 SF 99,087 SF 69,454 SF119,427 SF
Undisclosed Undisclosed Undisclosed

• Vacancy has increased significantly due to two factors – 1.3
MSF delivered in the first quarter and the unstable price of oil.
• Price of oil expected will have an impact on office rents and
vacancy for the remainder of 2015.
• Approximately 4.4 MSF under construction will drive vacancy
up further as space is delivered (only 23.9% of multi-tenant
new construction is pre-leased); this space was originally being
developed to help meet the rising demand, which is already
tapering off this year.
06
The Energy Corridor has long been one of Houston’s most
desirable submarkets and is dominated by large tenants in
the E&P and engineering sectors. This market is driven by
the price of oil and natural gas. Large users like BP, Conoco,
and Shell drive market demand.
MARKET TRENDS
MARKET DRIVERS
TENANT’S PERSPECTIVE
• The direct average rental rate (Class A&B) stayed almost flat
between 4Q’14 and 1Q’15 increasing a mere 0.3% to $31.24.
• The vacancy rate increased by 2.2 percentage points to 9.2%
since the last quarter.
• Subleases space nearly doubled since the end of the last
quarter.
• Competition for space should remain until most new
construction is delivered.
• The majority of the space being vacated is obsolete and will
need to be repositioned.
Class A Class B
OFFICE SNAPSHOT
Avg. Rental Rate
Vacancy
Absorption
Construction
$36.17$0.71 vs
4Q’14
%8.33.4% vs
4Q’14
607K SF vs 4Q’14
SF4.4M1.1 MSF vs
4Q’14
SF213K
KATY FREEWAYSUBMARKET UPDATE
Avg. Rental Rate
Vacancy
Absorption
Construction
$24.15$1.05 vs
4Q’14
%10.70.3% vs
4Q’14
0K SF vs 4Q’14
SF 23K200K SF vs
4Q’14
SF138K
WESTCHASE SUBMARKET UPDATE

1
06 KATY FREEWAY SUBMARKET UPDATE
NEW DEVELOPMENT MAP 100,000 SF+Under Construction
8
8
10
65
4
4
1
119
3
3
2
2 7 910
7
65
21700 Merchants Way127,955 SF
0.0% Leased
16200 Park Row146,429 SF
54.3% Leased
15377 Memorial Dr389,709 SF
4.7% Leased
1414 Enclave300,907 SF
0.0% Leased
915 N Eldridge Pky524,448 SF
0.0% Leased
925 N Eldridge Pky600,000 SF
100% Leased
935 N Eldridge Pky546,604 SF
100% Leased
201 N Dairy Ashford336,000 SF
100% Leased
12120 Wickchester Ln171,475 SF
100% Leased
825 Town & Country227,063 SF
62.3% Leased
12
9807 Katy Fwy143,830 SF
100% Leased
9811 Katy Fwy452,370 SF
55.2% Leased
1211

06KATY FREEWAY SUBMARKET UPDATE
TOP 5 EMPLOYERS
10,960 Employees 9,537 Employees 3,000 Employees 3,000 Employees 2,100 Employees
TOP 5 LEASES SIGNED IN 1Q’15
40,589 SF 34,611 SF 27,259 SF 27,194 SF 27,031 SF
TOP 5 SUBLEASE SPACES
Three Westlake Park 16290 Katy Fwy. Three Westlake Park Two WestLake Park Two WestLake Park
215,861 SF 155,050 SF 155,044 SF 85,065 SF 67,334 SF
TOP 5 LARGEST BLOCKS OF SPACE
13501 Katy Fwy 11750 Katy Fwy 10496 Old Katy Rd 750 Town & Country 11700 Katy Fwy
331,707 SF 260,249 SF 207,000 SF 172,907 SF 161,940 SF

06
THE WOODLANDSSUBMARKET UPDATE
With several construction cranes dotting the horizon and
expanded/new corporate headquarters including Exxon,
Southwest Energy, and Anadarko, small and medium-sized
tenants in The Woodlands are finding themselves squeezed
for space and shocked by increases in rental rates.
$25.60$0.19 vs
4Q’14
1.2% vs 4Q’14
58K SF vs 4Q’14
Class A Class B
SF29K16K SF vs
4Q’14
OFFICE SNAPSHOT
MARKET TRENDS
MARKET DRIVERS
TENANT’S PERSPECTIVE
• Both Class A and B rates have been experiencing a fluctuation,
most of which has been downward. Quarter-over-quarter, rates
declined by 5.6% (Class A) and 2.1% (Class B).
• Absorption has kept pace with deliveries, however leasing
activity in the first quarter of 2015 was the lowest it’s been in
the last 15 years, contributing to increasing vacancy rates.
• Of the 1.9 MSF currently under construction (buildings 100,000
SF+), 711,285 SF is classified as multi-tenant. This space is
only 7% pre-leased and will add a glut of availability and will
drive the vacancy rate up upon delivery in late 2015.
• Demand has come from corporate relocations and expansions
in energy, medical and chemical sectors.
• Rates for Class B space have not declined as rapidly,
presumably due to service companies looking for value space
that is near the new corporate headquarters.
• Recent headquarter moves and expansions have improved
access and drive times, spurring additional development of
other office, retail, hotels, and residential projects.
• Unstable price of oil expected to have an impact on office
rents and vacancy for the remainder of 2015.
• Increases in concessions are likely to continue.
• With higher vacancies, more space options are now available.
Avg. Rental Rate Avg. Rental Rate
Vacancy Vacancy
Absorption Absorption
Construction Construction
$32.80$0.63 vs
4Q’14
%4.90.5% vs
4Q’14
1.7M40K SF vs
4Q’14
SF2.0M 1.2M SF vs
4Q’14
%8.1
SF SF-19K

06THE WOODLANDS SUBMARKET UPDATE
NEW DEVELOPMENT MAPUnder Construction
1
123
4
6
5
4
3
6
2
5
1735 Hughes Landing331,840 SF
100% Leased
1725 Hughes Landing317,052 SF
100% Leased
1780 Hughes Landing320,815 SF
0.0% Leased
25700 Interstate 45240,470 SF
0.0% Leased
Springwoods Village150,000 SF
33.3% Leased
ExxonMobil Campus Phase III500,000 SF
100% Leased

TOP 5 EMPLOYERS
3,481 Employees 1,800 Employees 1,400 Employees 1,348 Employees 1,178 Employees
TOP 5 LEASES SIGNED IN 2014
515,000 SF 500,000 SF 95,000 SF 40,000 SF 25,576 SF
TOP 5 SUBLEASE SPACES
Technology Forest Blvd. 4
10101 Woodloch Forest
Two Hughes Landing Town Center I 4055 Technology Forest Blvd.
50,580 SF 25,879 SF 25,576 SF 24,331 SF 23,894 SF
TOP 5 LARGEST BLOCKS OF SPACE
Sierra Pines II 2455 Tech. Forest 2001 Timberloch 128 Vision Park Blvd. 2700 Research Forest
93,557 SF 87,855 SF 50,000 SF 46,310 SF153,810 SF
THE WOODLANDS SUBMARKET UPDATE06
HOUSTON ECONOMYFACTS & FIGURES
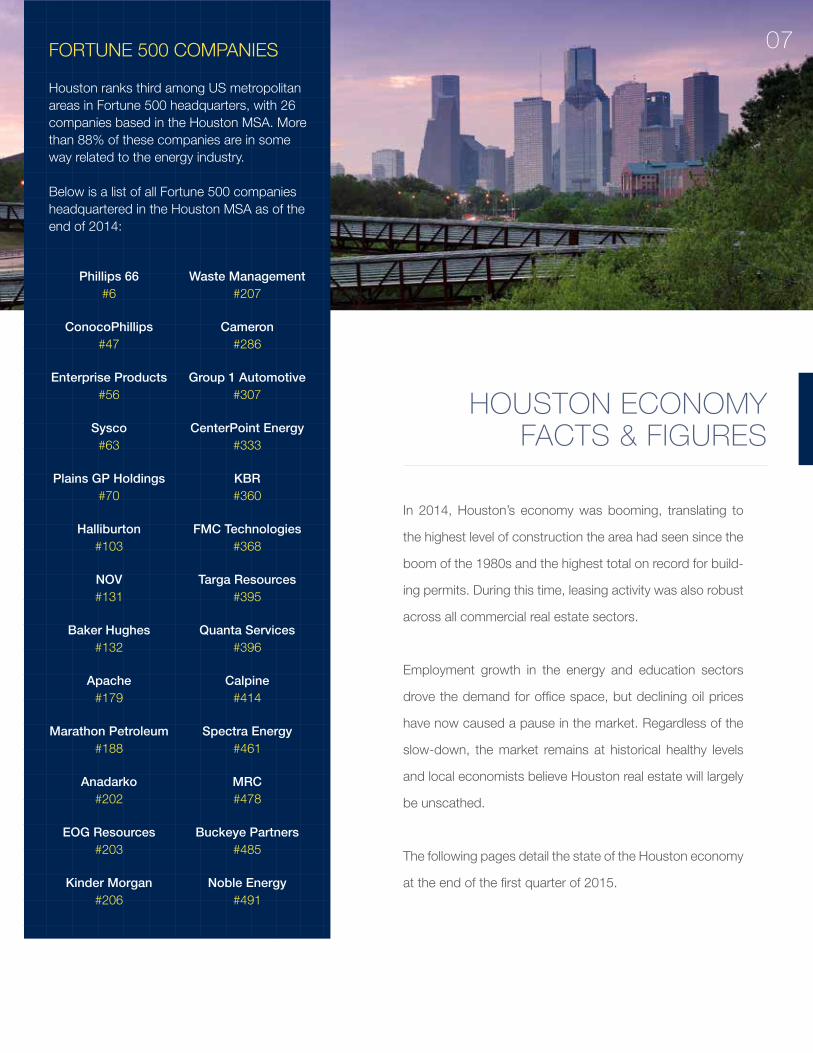
In 2014, Houston’s economy was booming, translating to
the highest level of construction the area had seen since the
boom of the 1980s and the highest total on record for build-
ing permits. During this time, leasing activity was also robust
across all commercial real estate sectors.
Employment growth in the energy and education sectors
drove the demand for office space, but declining oil prices
have now caused a pause in the market. Regardless of the
slow-down, the market remains at historical healthy levels
and local economists believe Houston real estate will largely
be unscathed.
The following pages detail the state of the Houston economy
at the end of the first quarter of 2015.
07FORTUNE 500 COMPANIES
Houston ranks third among US metropolitanareas in Fortune 500 headquarters, with 26 companies based in the Houston MSA. More than 88% of these companies are in some way related to the energy industry.
Below is a list of all Fortune 500 companies headquartered in the Houston MSA as of the end of 2014:
Phillips 66#6
ConocoPhillips #47
Enterprise Products #56
Sysco#63
Plains GP Holdings #70
Halliburton #103
NOV#131
Baker Hughes #132
Apache #179
Marathon Petroleum #188
Anadarko #202
EOG Resources #203
Kinder Morgan #206
Waste Management#207
Cameron #286
Group 1 Automotive #307
CenterPoint Energy#333
KBR #360
FMC Technologies #368
Targa Resources#395
Quanta Services #396
Calpine #414
Spectra Energy#461
MRC #478
Buckeye Partners #485
Noble Energy #491

Job growth in the Washington MSA has been
challenged by the contraction of the federal government.
Any improvement in the job growth rate will have to be
fueled by the private sector.
Job growth in the Washington MSA has been
challenged by the contraction of the federal government.
Any improvement in the job growth rate will have to be
fueled by the private sector.
Houston has benefitted from four years of exceptional
growth. Due to this rapid economic expansion, the city
now ranks fourth in the nation in GDP producing more
than $533 billion annually.
If Houston were a country, its economy would be larger
than those of Argentina and Norway, according to the
World Bank, and would rank as the world’s 25th largest
economy. The city of Houston also has a GDP greater
than 42 states.
07 HOUSTON ECONOMY FACTS & FIGURES
New York CIty$1.4 Trillion
Los Angeles$792 Billion
Chicago$586 Billion
Houston$533 Billion
Venezuela$438 Billion
Norway$512 Billion
US GDP RANKING
WORLD GDP RANKING
Job growth in the Washington MSA has been
challenged by the contraction of the federal government.
Any improvement in the job growth rate will have to be
fueled by the private sector.
Houston’s economic growth is expected to increase in
2015, albeit at a much slower pace; and is projected to
double between 2015 and 2040. Houston’s GDP also
is projected to top $1.1 trillion by the end of 2027. The
adjacent graph shows the city’s economic makeup.
ECONOMIC GROWTH
Mining
Construction
Manufacturing
Trade
Transportation, Utilities, Warehousing
Information
Finance, Insurance, Real Estate
Services
Government
Agriculture
20.9%
19.3%
18.3%
4.6%
10.5%
1.5%
0.1%
11.9%
5.7%7.2%

Houston’s economy contracted for
the second consecutive month in
February, registering 49.3 at the end
of the month. The decline in PMI was
expected given the continued decline
in oil prices.
Any reading below 50 signifies an
overall contraction in production.
Houston’s PMI had held at or above
the 50 point mark for 64 consecutive
months.
PMI RATING
Houston ranks third in lowest overall
cost of living among the nation’s 20
most populous metropolitan areas,
with costs 17.4% below the average
for this group. Houston’s housing
costs are 32.9% below this group’s
average.
Houston’s overall after-taxes living
costs are 5.2% lower than the US
average, largely due to affordable
housing prices that are 6.0% below
the national average.
COST OF LIVING
07HOUSTON ECONOMY FACTS & FIGURES
2005 2007 2008 2009 2010 2011 2012 2013
30
40
50
60
70
2014 20152006
50-Point Baseline PMI Reading
PMI Reading
Mining
Construction
Manufacturing
Trade
Transportation, Utilities, Warehousing
Information
Finance, Insurance, Real Estate
Services
Government
Agriculture

07 HOUSTON ECONOMY FACTS & FIGURES
Houston is the “Energy Capital of the World” with almost half
of its economic activity driven by the energy industry. The
city is home to the largest concentration of human capital
and infrastructure for energy research, development, and
production in the nation.
Forty of the 145 publicly traded oil and gas exploration and
production firms based in the US are located in Houston.
In December 2014, the city held 31.7% of the nation’s
202,000 jobs in oil and gas extraction and 11.6% of the
453,400 total jobs in support activities for mining.
In 2015, The Greater Houston Partnership estimates that
9,300 jobs could be cut, but may increase more as layoffs
and budget cuts are announced.
WHAT EXACTLY CAUSED THE DROP IN OIL PRICES?
The drop in oil prices is due to many factors but generally because supply is much higher than demand.
Since 2010, prices hovered in the $100 per barrel range – because of increasing oil consumption in countries like China, and because of conflicts in key oil nations like Iraq – with production not being able to keep up with the increased demand.
These high oil prices led to an increase in drilling, but then demand began to taper off across Europe, Asia, and the U.S. Unused oil was just being stockpiled away, causing the dramatic decrease in prices, and with OPEC states not agreeing to cut production, the price of oil continues to fall.
There could also soon be a storage problem, and other countries could be releasing more supply into the market, potentially driving prices down further.
WTI reached a high of $108 in June 2014 before falling
30.6% to $75 in November 2014 (prices began falling in
September). The price continued to drop, registering $47.60
at the end of the first quarter of 2015.
The increase in domestic production has greatly reduced
U.S. dependence on foreign oil. EIA forecasts that WTI will
average $55.02 in 2015 and $71.00 in 2016. Other experts
expect the price to drop as low as $20.00 per barrel.
OIL PRICES
ENERGY & OIL
84
86
88
90
92
94
96
-3
-2
-1
0
2
3
1
MB/D MB/D
1Q’09 3Q’10 1Q’12 3Q’13 1Q’15
OIL DEMAND SUPPLY BALANCE
Oil Stock Change Oil Demand Oil Supply

There is a correlation between the
success of the energy industry and
office rental rates, as well as leased
space, in Houston. As the price of
oil increases or decreases, Class A
rents usually follow suit, typically with
a six-month lag.
With the price of oil seeing a dramatic
decrease, landlord concessions have
increased while rents are starting to
decrease slightly.
RENT VS THE PRICE OF OIL
The number of U.S. oil and gas rigs in
use fell at the end of March 2015, by
790 to 1,028.
The number of drilling rigs in the US
fell for the 17th consecutive week in
March, indicating that lower profits
are causing producers to cut costs,
according to Baker Hughes.
Rig count is expected to continue to
fall, at a much slower pace now, until
mid-2015.
OIL RIG COUNT
Oil Price Rental Rates
Oil Price Rental Rates
Previous Year Current Year
Rig Count
2000 2001 2002 2003 2004 2005 2006 2007 2008 2009 2010 2011 2012
$0
$40
$80
$120
$160
2013 2014
$20
$24
$28
$32
$36
Expanding
Stable
Contracting
Jan. Feb. March April May June July Aug. Sep. Oct. Nov. Dec.
1650
1700
1750
1800
1850
1900
1950
07HOUSTON ECONOMY FACTS & FIGURES

07 HOUSTON ECONOMY FACTS & FIGURES
POPULATION
Houston is the fourth largest city (2.2 million residents) and
fifth largest MSA in the nation, with approximately 6.3 million
residents.
The MSA also led the nation in population growth in 2014,
adding 156,371 residents.
Houston is anticipated to lead the nation in population
and employment growth between 2015 and 2040, adding
125,000 new residents in 2015. The population is projected
to swell by four million residents by the end of 2040.
POPULATION GROWTH
NEW ARRIVALS
2015 2040
Houston is one of the fastest growing cities in the U.S.
35,202 residents moved to Houston in 2014. That is one
new resident every 15 minutes.
X
07HOUSTON ECONOMY FACTS & FIGURES
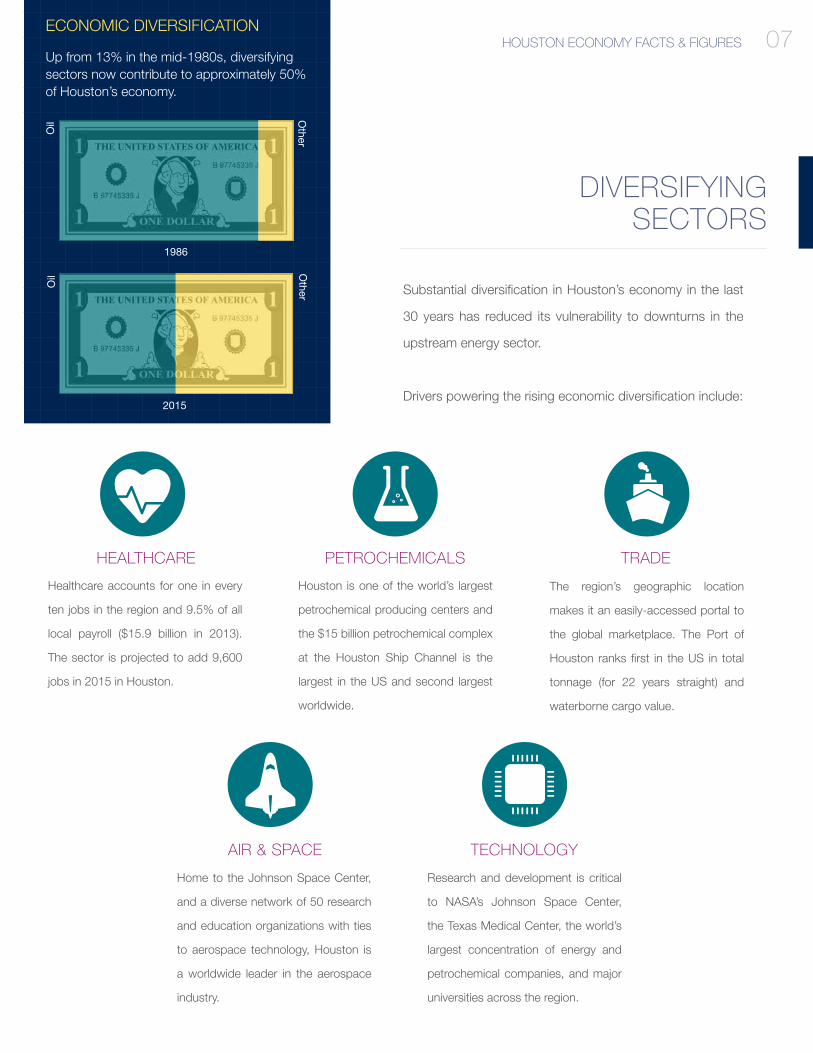
Substantial diversification in Houston’s economy in the last
30 years has reduced its vulnerability to downturns in the
upstream energy sector.
Drivers powering the rising economic diversification include:
DIVERSIFYING SECTORS
Healthcare accounts for one in every
ten jobs in the region and 9.5% of all
local payroll ($15.9 billion in 2013).
The sector is projected to add 9,600
jobs in 2015 in Houston.
Houston is one of the world’s largest
petrochemical producing centers and
the $15 billion petrochemical complex
at the Houston Ship Channel is the
largest in the US and second largest
worldwide.
The region’s geographic location
makes it an easily-accessed portal to
the global marketplace. The Port of
Houston ranks first in the US in total
tonnage (for 22 years straight) and
waterborne cargo value.
Home to the Johnson Space Center,
and a diverse network of 50 research
and education organizations with ties
to aerospace technology, Houston is
a worldwide leader in the aerospace
industry.
Research and development is critical
to NASA’s Johnson Space Center,
the Texas Medical Center, the world’s
largest concentration of energy and
petrochemical companies, and major
universities across the region.
ECONOMIC DIVERSIFICATION
Up from 13% in the mid-1980s, diversifying sectors now contribute to approximately 50% of Houston’s economy.
Oil
Other
Oil
Other
1986
2015
HEALTHCARE PETROCHEMICALS TRADE
AIR & SPACE TECHNOLOGY

07 HOUSTON ECONOMY FACTS & FIGURES
Since the lows of the recession, Houston has led the nation
in job recovery (by creating 445,000 new jobs), adding three
jobs for every one lost. Overall employment in Houston has
increased by 19.4% since 2010.
EMPLOYMENT
NON-FARM EMPLOYMENT
• Total non-farm employment in the Houston MSA jumped to 2.96
million in December 2014, up 120,600 from one year earlier.
• From December 2013 to December 2014, local non-farm
employment rose 4.2%, well above the national rate of 2.0%.
• Among the 38 largest metropolitan areas in the country, Houston
ranked third in the rate of job growth and third in the number of
jobs added.
• December has the second largest annual employment gain and
the tenth fastest pace of job growth in the past 35 years.
• Layoffs are expected in the energy industry – concentrated more
in oilfield services (blue collar) then in exploration (white collar).
JOB RECOVERY
JOB GROWTH
Houston has led the nation in job recovery, adding three new jobs for each lost.
+Houston will account for 25% of all job growth in texas between 2012 and 2040.
JOBS JOBS JOBS JOBS
Houston Rest of Texas
NATIONAL JOBS COMPARISON
The Houston MSA holds more total jobs than 35 individualstates.
EMPLOYMENT VS OCCUPANCYEMPLOYMENT VS RENTAL RATE
3,500
3,000
2,500
2,000
1,500
1,000
$40
$32
$24
$16
$8
$0
3,500
3,000
2,500
2,000
1,500
1,000
95%
90%
85%
80%
75%
70%
Employment Houston Rate Class A Rate Employment Houston Occupancy Class A Occupancy
2012 2013 20142009 2010 20112006 2007 20082005 2012 2013 20142009 2010 20112006 2007 20082005
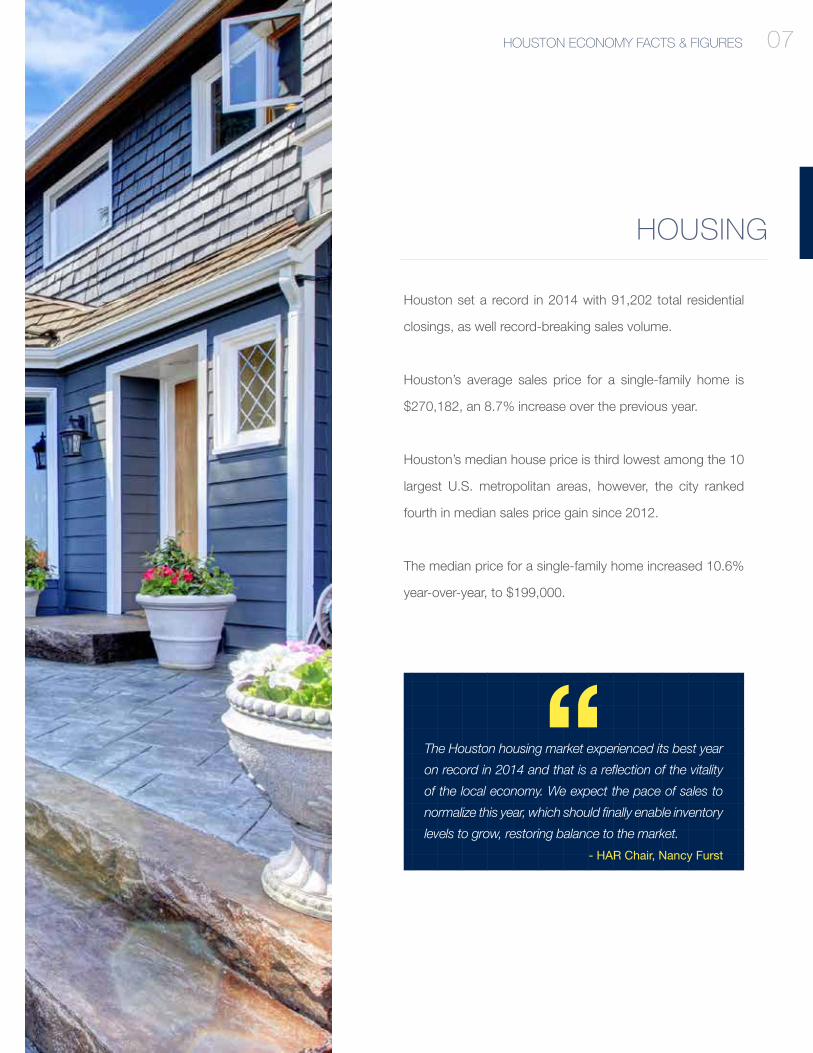
The Houston housing market experienced its best year
on record in 2014 and that is a reflection of the vitality
of the local economy. We expect the pace of sales to
normalize this year, which should finally enable inventory
levels to grow, restoring balance to the market.
- HAR Chair, Nancy Furst
“
HOUSING
Houston set a record in 2014 with 91,202 total residential
closings, as well record-breaking sales volume.
Houston’s average sales price for a single-family home is
$270,182, an 8.7% increase over the previous year.
Houston’s median house price is third lowest among the 10
largest U.S. metropolitan areas, however, the city ranked
fourth in median sales price gain since 2012.
The median price for a single-family home increased 10.6%
year-over-year, to $199,000.
07HOUSTON ECONOMY FACTS & FIGURES

FOREIGN TRADE
In 2014, more than $253.3 billion in foreign trade passed
through the Houston-Galveston Customs District, up 0.6%
from the $251.8 billion handled in 2013.
Exports accounted for a majority of the growth. Commodity
imports have declined for the past three consecutive years.
Future growth will slow due to the sluggish performance of
the global economy.
$40 $47$58
$72$90
$75$95
$119 $127 $129 $132$65
$89
$92$104$113
$151
$117
$149$147
$123 $122
07 HOUSTON ECONOMY FACTS & FIGURES

08
MARKET OUTLOOK
The outlook for Houston in 2015 is positive on most fronts
but will ultimately depend on the stability of oil and gas prices
and geopolitical events. WIth additional layoffs in the energy
sector expected, a pause in the market during 2015 is likely
but won’t be felt across all sectors.
2015 OUTLOOK
• With a robust job market (62,000 jobs projected to be added in
2015) and an increasingly diversified economy, both overall and
within the energy industry, energy prices will not have as much
of an impact as in years past (i.e. the 1980s).
• We anticipate a slight pause in the market in the first two
quarters of 2015; however with a tremendous growth in jobs,
absorption, and rental rates over the past few years, a pause
in the market will not have a profound effect and won’t be felt
across all industry sectors.
• Development will slow down (if it’s not under construction
already, it likely won’t break ground in the first half 2015).
However, 2015 will see a glut of office space delivered to the
tune of 12.3 million SF, by far the largest number on record
(no data before 1999). Half (6.2 MSF) of the space estimated
for 2015 is for single-tenant use, and is 100% pre-leased. As
30.5% of the multi-tenant spec space is already pre-leaded,
vacancy rates will increase slightly.
• As new product hits the market, there will be more options for
tenants looking to expand, renew, or move.
• Due to these market conditions we expect landlord concessions
to increase and rental rates to flatten in 2015.
MARKET OUTLOOK

CONTACT US
Cresa Houston
5599 San Felipe, Suite 500
Houston, Texas
713.402.5800
Cresa © 2014. All rights reserved.
Permission is hereby granted for internal distribution by Cresa business partners. Other
reproduction by any means in whole or part without written permission is prohibited.