HOUSING UNDERPRODUCTION IN CALIFORNIA...the shovel-ready vacant land. The Accessible Growth scenario...
24
HOUSING UNDERPRODUCTION IN CALIFORNIA Economic, Fiscal and Environmental Impacts of Enabling Transit-Oriented Accessible Growth to Address California’s Housing Affordability Challenge
Transcript of HOUSING UNDERPRODUCTION IN CALIFORNIA...the shovel-ready vacant land. The Accessible Growth scenario...

HOUSING UNDERPRODUCTION IN CALIFORNIA
Economic, Fiscal and Environmental Impacts of Enabling Transit-Oriented Accessible Growth to Address California’s Housing Affordability Challenge

WHO WE ARE
Up for Growth California is a state project of Up for Growth Action, a Washington, DC-based 501(c)(4) that seeks to improve the quality of life for working families and create communities that are accessible and affordable for all by promoting policies that enable more housing close to jobs, efficient transportation, and desirable local amenities.
RESEARCH ADVISORS
CHRISTOPHER B. LEINBERGER Charles Bendit Distinguished Scholar and Research Professor
Chair, Center for Real Estate and Urban Analysis
George Washington University
Washington, D.C.
PETER LINNEMAN, PH.D.The Wharton School, Real Estate Department
University of Pennsylvania
Philadelphia, Pennsylvania
MARK H. OBRINSKY, PH.D.Senior Vice President for Research and Chief Economist
National Multifamily Housing Council
Washington, D.C.
AUTHORS
MADELINE BARON
MARLEY BUCHMAN
MIKE KINGSELLA
RANDALL POZDENA, PH.D.
MICHAEL WILKERSON, PH.D.
ACKNOWLEDGMENTS
We would like to thank all of our members and advisors, and their teams, who provided invaluable feedback in the production of this report.
Up for GrowthECONorthwest
Copyright ©2020 Up for Growth. All rights reserved.
1875 K Street NW, 4th Floor, Washington, DC 20006Phone: 202.716.2064 | Twitter: @Up4Growth
Originally printed 10.10.18, reprinted 4.22.2020.
ECONorthwest specializes in economics, finance and planning. We work with public jurisdictions and developers throughout the United States on housing policy issues, including studies related to density bonuses and inclusionary zoning. Our work is used to inform city comprehensive planning, master planning and site-specific feasibility studies, as well as large-scale housing needs assessments. Our staff holds advanced degrees in economics, community and regional planning and public administration.
Up for Growth is a 501(c)(3) research and policy organization, driven by a diverse network of members from around the U.S. and across stakeholder groups, that is committed to fostering equitable growth across the nation by eliminating structural barriers to housing.

CONTENTS
WHO WE ARE..............................................2
EXECUTIVE SUMMARY...............................4
INTRODUCTION......................................5
COST BURDENING.....................................6
HOUSING UNDERPRODUCTION................7
MEASURING UNDERPRODUCTION............8
DISTRIBUTING NEW GROWTH.................10
COST ESTIMATES & PROTOTYPE ASSUMPTIONS....................12
THE BENEFITS OF ACCESSIBLE GROWTH..14
INFRASTRUCTURE SPENDING..................16
REMI MODEL: ECONOMIC IMPACTS.........17
FISCAL IMPACTS......................................20
POLICY DISCUSSIONS & CONCLUSIONS ..22

INTRODUCTIONEXECUTIVE SUMMARY
From 2000 to 2015, California underproduced housing by approximately 3.4 million housing units, more than 15% of the state’s total 2015 housing stock. This underproduction has created a huge supply and demand imbalance that is reflected in the housing and homelessness crisis playing out across the state.
GSP BOOST
Using a Accessible Growth develop-ment pattern, cumulative gross state product (GSP) would increase by $170 billion over a 20-year period compared to More of the Same — delivering $1.77 trillion in cumulative GSP over the baseline forecast.
More of the same growth
Shifting from current development patterns to a Accessible Growth scenario would use only 23% of the land to deliver the same number of units. These areas would be denser, transit-adjacent and near employment centers, reducing vehicle miles traveled by as much as 35%.
TAX REVENUE BENEFITS
Accessible Growth would increase the amount of taxes generated by $103 billion over the 20-year growth period. Personal income taxes would increase $39 billion and sales taxes would increase $64 billion with Accessible Growth development.
35%
$1.77T $103B
state
Accessible Growth pattern
52%MEDIUMdensity
41%low
density64%MEDIUMdensity
31%HIGH
density
6%LOW
density
7%HIGH
density
clear skies ahead
Lowdensity
medium
high
3.4 3.4 millionmillionunderproducedunderproduced
The
If housing development in California continues its current pattern with More of the Same growth, 41% of the 3.4 million new housing units would be single-family homes, while 52% would be missing middle and medium-density, and only 7% would be in residential apartment towers. Our scenar-io-based investigation of development growth potential found that if these 3.4 million units were developed in a Accessible Growth pattern — build-ing to higher density inside transit corridors and high-opportunity neighborhoods that leverage existing infrastructure — only 6% of the new units would be single-family homes, 64% would be missing middle and medium-density housing, and 31% would be in residential apartment buildings.
4 UP FOR GROWTH CALIFORNIA

INTRODUCTIONCalifornia has experienced unprecedented economic growth over the last decade, catapulting it to the world’s fifth-largest economy. Growth on this scale has been transformative for California and its urban areas — particularly surrounding Los Angeles and the San Francisco Bay Area — changing the way of life for residents across the state. Median home prices statewide are now $600,000 — in many areas median home prices are more than $1 million and average rents exceed $2,000. Housing in most parts of the state is rapidly becoming less attainable for a large segment of Americans not involved in the high-paying tech and finance sectors. In 2017, 5.3 million households, or 41% of California’s total households, were cost-burdened, paying more than 30% of their incomes on housing. In 2017, more than 134,000 people were homeless across the state — a 16% increase over 2015. In 2018 in the San Francisco Bay Area, an income of $117,000 can qualify a family of four as “low income” according to HUD, and the incomes of households arriving to the area were more than $10,000 higher than the incomes of household leaving the area. Many local sector workers — such as teachers, firefighters, and retail workers — cannot afford to live in the areas they serve and have been forced to relocate away from urban centers. This distance between home and work for so many residents has severely strained California’s transit and roadway infrastructure, increasing traffic and driving distances. Rural areas and smaller towns in California have their own housing struggles, particularly with attracting development of new housing and providing housing for low-income households. California’s extremely high cost of living has become a threat to its economic growth as many residents seek opportunities in nearby states where housing and the cost of living is lower (even after accounting for lower incomes). Generational preferences and household demographics have influenced housing demand, with Baby Boomers downsizing and millennials forming new households and transitioning from apartments to single-family homes. However, the primary factor contributing to California’s high housing prices is its severe underproduction over time. The growing housing shortage was exacerbated by the 2008-2009 recession, which nearly crippled the construction sector and stalled housing production for several years. However, this recent imbalance continues a much longer trend in California, where restrictive local development and land-use policies have curtailed housing production for decades. These policies, enacted by local jurisdictions to maintain walkable, low-density
neighborhood characteristics, have largely prohibited higher density, affordable, or multi-family housing developments that were sorely needed to keep production in line with demand. This opposition and lack of density has created a stark disparity in the housing opportunities of renters and owners — renters and households earning less than the median income struggle to afford basic housing while existing homeowners see their homes appreciate rapidly in value. While this trend has been observed in many urban areas across the country, it is particularly extreme in California.
Some of the barriers to increasing housing production include:
• Zoning restrictions, which create a shortage of zoned high-density sites and prohibit the addition of “missing middle” units in single-family neighborhoods;
• Escalating and misaligned fee structures, such as impact and linkage fees charged per unit instead of square footage;
• Poorly calibrated inclusionary housing exacerbated by rapidly changing market conditions; and
• Lengthy review processes that add cost and allow for manipulation by growth opponents.
The conclusions in this report support the need to enact innovative public-private solutions that increase the supply and reduce the cost of new housing in our urban centers. Pervasive longtime homeowner sentiments that “all new housing is bad” have become conventional wisdom, stemming from the unwarranted and factually unsupported belief that new units overburden schools, strain city finances and make traffic worse. Overcoming this unproductive narrative requires a public conversation that focuses on delivering units as cost-effectively as possible. Because California has strong land-use policies that restrict development in coastal and mountain areas, the supply of land is extremely limited. In the previous housing bubble, single-family sprawl saw the urban areas grow dramatically, utilizing most of the shovel-ready vacant land. The Accessible Growth scenario in this report describes what is possible by developing compact housing communities around transit corridors and in high-opportunity neighborhoods: narrowing the gap between supply and demand; reducing costs for local governments by leveraging existing roadway and sewer infrastructure; and building housing near jobs, transit and amenities. Focusing on developing missing middle and medium-density housing in underutilized sites and in transit corridors can also reduce transportation costs for households while creating net-positive fiscal revenue for local governments. This type of growth adds density in single-family neighborhoods through ADUs, quads and garden-style apartments to increase density in walkable, high-opportunity areas. n
HOUSING UNDERPRODUCTION IN CALIFORNIA 5

COST BURDENING
PERCENT OF HOUSEHOLDS THAT SPEND MORE THAN 30% OF GROSS INCOME ON HOUSING, 2016
NATIONAL HOUSING UNDERPRODUCTION
COST BURDENINGHouseholds are considered “cost-burdened” when they spend more than 30% of their gross income on housing expenses (not including trans-portation costs). This threshold does not change for different income levels. While it is a commonly accepted measure of the maximum amount that should be spent on housing, it fails to consider that cost burdening disproportionately affects low-income households, who have very little disposable income after paying for housing, transportation, childcare and medical expenses.
Cost burdening occurs when incomes lag behind rapidly rising rents and housing prices. Although incomes have begun to rise in recent years, they were stagnant for several decades — while housing costs increased at much higher rates. This divergence has led to increased cost burdening rates across California.
In every county in California, at least 30% of households experience cost burdening. The majority of counties have more than 40% of households that are cost-burdened, with almost 50% being cost-burdened in Los Angeles County.
Spending too much on housing reduces funds available for other family necessities, such as food, medical services, transportation, childcare and emergencies. Many California households are just one emergency — perhaps an unexpected car repair or medical bill — away from eviction or job loss. Point-in-time counts in California show an uptick in episodic homelessness, where individuals and families living close to the edge are tipped into living in shelters, motels, cars or the
street. This instability is detrimental to children’s educational outcomes and to job stability. Access to safe, affordable housing sets the foundation for opportunities for success.
In addition to impacts on household affordability, this study seeks to understand the social, economic, fiscal and environmental implications of underproduction by assessing the potential for housing production in the absence of regulatory and other supply impediments. The study does not address any complementary uses, such as office, industrial or hospitality that would accompany an increase and redistribution of housing units. There are likely significant impacts associated with those related uses, but they have been excluded from the analysis. For the purpose of this study, the focus is on understanding the incremental impact related to housing. It should be noted that this report is primarily interested in investigating the impact of different models for addressing growth and is therefore not conducting a policy analysis to determine the effectiveness of individual policies to increase housing production. This is an important area for future study. n
Source (map): St. Louis Federal Reserve GEOFRED
6 UP FOR GROWTH CALIFORNIA

23 STATES
7.3 MILLION
ESTIMATED REDUCTION IN STATEWIDE HOME PRICESIF ALL UNITS WERE PRODUCED OVER 20 YEARS
The chart above displays the states with the largest price reductions associated with the additional production of units. For example, if 3.4 million units were built in California over the next 20 years, prices would be 21% lower than they would have been without the additional production of units. Put differently, increasing the number of units produced over 20 years does not decrease the nominal prices, but does decrease the rate of growth.
COST BURDENING NATIONAL HOUSING UNDERPRODUCTION
NUMBER OF NATIONAL HOUSING UNITS UNDERPRODUCED FROM 2000-2015
3.4 MILLION CA UNITS UNDERPRODUCED
Up for Growth’s national report on housing underproduction was released in April 2018 and high-lighted the economic, political and social consequences of housing underproduction caused by inefficient land-use policies and overly burdensome regulations. It also demonstrated the potential economic, environmental and fiscal benefits that could occur if
housing development shifted from the status quo to an Accessible Growth approach, detailed in the following pages.
The report calculated the total number of units underproduced on a national basis from 2000 to 2015 by estimating each state’s historic relationship between the production of housing units and a host of demand-side indicators by using an econometric statistical model. It calculated each state’s baseline housing production through 2000 and forecasted the number of units that would have been produced in 2015 if each market maintained the historical national average (supply elasticity). Then using the actual number of housing units in 2015, the report calculated the total units that were under- or over-produced from 2000 to 2015 at the state level.
The study calculated that 23 states underproduced housing units from 2000 to 2015. The remaining 27 states produced enough housing at the statewide level, although there may be imbalances and underproduction in certain cities within each state. Residents facing supply shortages and price increases in populous urban locations are not helped by surplus housing elsewhere in their state.
The historic data needed to replicate the national report’s methodology are not available for smaller units of geography (such as counties). However, housing markets are regional and need to be examined locally. This report contributes two simple approaches to demonstrate the imbalance in supply and demand at the county level, which are detailed in the following pages (page 8 and 9). The remainder of the report focuses on the economic, fiscal and environmental benefits of producing housing at the state level, using the statewide underproduction figures from the national study. n
DATA INPUTS TO THE MODEL INCLUDE:
• Home Prices • Population• Income • Housing Stock
HOUSING UNDERPRODUCTION IN THE U.S. Economic, Fiscal and Environmental Impacts of Enabling Transit-Oriented Smart Growth to Address America’s Housing Affordability Challenge
HOUSING STARTS HAVEN’T KEPT PACE WITH HOUSEHOLD FORMATION
CaliforniaCalifornia 21.7%21.7%
HOUSING UNDERPRODUCTION IN CALIFORNIA 7

Butte1.31
Calaveras0.22
Colusa1.03
El Dorado0.65
Fresno0.72
Humboldt1.63
Lake0.57
Los Angeles0.94
Mendocino0.73
Monterey3.6
Santa Barbara0.74
Sonoma0.63
Yolo0.65
Marin0.65
Mariposa4.06
Napa1.1
Placer1.02
San Bernardino0.43
San Mateo0.93 Santa Clara
0.88
Shasta0.6
Stanislaus0.28
Ventura1.05
Yuba0.26
Amador2.9
Inyo0.79
Contra Costa0.63
Orange0.97
Tulare1
Imperial7.79
Madera0.41
San Benito0.8
Santa Cruz0.37
Alameda0.49
San Luis Obispo0.72
Riverside0.76
Merced0.24
SanJoaquin
0.51
Sacra-mento0.38
Glenn1.38
Kern0.74
Tehama0.79
San Francisco0.69
Solano0.64
Sutter0.48
San Diego0.66
Kings0.73
Mono
NevadaSierra
Alpine
Del Norte
Trinity
Tuolumne
Lassen
Modoc
Plumas
Siskiyou
Source: U.S. Census, BEA, Moody's Analytics
Housing Units to HouseholdFormation 2010 to 2016
Less than 0.50.51 - 0.75
0.76 - 1.001.01 - 1.10Greater than 1.1No housing starts or decreasein the number of households
2010 - 2016
Source: California Department of Finance, Demographic Research Unit
MEASURING UNDERPRODUCTION: HOUSEHOLD FORMATION
1.1NATIONAL AVERAGE
1960-2016
CA AVG 2010-2016
0.74
RATIO OF HOUSING UNIT PRODUCTION TO HOUSEHOLD FORMATION
2010-2016
At its most basic level, a functioning housing market needs to produce at least one new housing unit for every new household formed. However, to fully account for demolition and the obsolescence of the existing housing stock, changing consumer preferences and vacancy rates, this ratio needs to be higher than 1:1. From 1960 to 2016, approximately 1.1 housing units were built nationally for every new household formed.
Producing one additional unit for each new household formed is the minimum requirement to avoid a decrease in vacancy rates and upward pressure on prices. Historically this ratio has been closer to 1.1 nationally, which allows for a healthy vacancy rate while also accounting for changing preferences in housing types and locations. Establishing a baseline ratio of housing production to household formation is difficult because the variables are related (otherwise known in economics as “endogenous”). This means that the rate of housing production influences the rate of household formation and vice versa. For example, limited housing production increases housing prices, which in turn makes it more difficult for a young adult to move out of their parents’ house and form their own household.
From 2010-2016, California produced only 0.74 units for every household formed. Put differently, for every 100 households formed during this time period, only 74 units were built. In the housing boom leading up to the Great Recession, many areas of the state produced sufficient housing, but after the recession and housing market crash, these areas have failed to keep up with the rate of household formation. n
0.51-0.75
LESS THAN 0.5 1.01-1.10
0.76-1.00 NO HOUSING STARTS OR DECREASE IN THE NUMBER
OF HOUSEHOLDS
GREATER THAN 1.1
8 UP FOR GROWTH CALIFORNIA

RATIO OF JOBS TO HOUSING UNIT PRODUCTION 2010-2015
MEASURING UNDERPRODUCTION: JOBSMEASURING UNDERPRODUCTION: HOUSEHOLD FORMATION
Despite a robust and growing economy, California has experienced the slowest population growth rate of any state on the west coast from 2010 to 2017 — about the same rate as Montana and half the rate of growth of Utah. Record numbers of California residents are leaving the state in search of more affordable housing options. Across California there are two stark themes emerging: highly populated urban centers have seen prices grow to an unattainable and unsustainable level. At the same time the population in exurban and rural areas increased as households seek more affordable housing. This imbalance leads to transportation and environmental challenges as households are pushed further away from jobs, education, and economic opportunities.
Source: U.S. Census LODES (2015), California Department of Finance, Demographic Research Unit
1.1-3.0
LESS THAN 1 5.1-10.0
3.1-5.0 NO INCREASE IN JOBS OR DATA NOT AVAILABLE
GREATER THAN 10
While it isn’t realistic to assume a perfect balance of jobs and housing in any county given the complex relationships of regional economies throughout the state. Prior to the Great Recession, the statewide the ratio of primary jobs (which is different than total jobs by omitting secondary or multiple part time jobs) to housing units was one to one. From 2010 to 2015, the state has added 4.4 jobs for every housing unit. As we saw rapid recovery from the depths of the Great Recession, job growth rapidly outpaced housing unit production. In some parts of the Bay Area, the ratio was in excess of 10 new jobs for every housing unit produced.
Unpacking jobs to housing is complex. Not every person is going to live in the county where they work. This is certainly the case in the high population centers where regional economies straddle multiple counties. The data in the map below display the location of employment (rather than the worker location of residence), which is helpful in understanding the transportation and environmental impacts of a jobs and housing imbalance. In the Bay Area, only Contra Costa County had a ratio of lower than 4, while all the others were at least 5.5 or greater. In Southern California, LA, Orange, and San Bernardino Counties added 4 or more jobs per housing unit, with the other counties added 2.7 jobs per unit.
As a result of these imbalances, rents and home prices have rapidly increased and have surpassed the previous housing bubble’s peak prices in most areas of the state. This is particularly troubling as the end of this housing cycle nears. Housing development cycles are generally slow moving, but it appears that the peak production rate of this cycle has passed. These ratios are likely to get worse in the short run and will require substantive policy interventions to bring the ratio of units-to-households back into equilibrium. n
HOUSING UNDERPRODUCTION IN CALIFORNIA 9
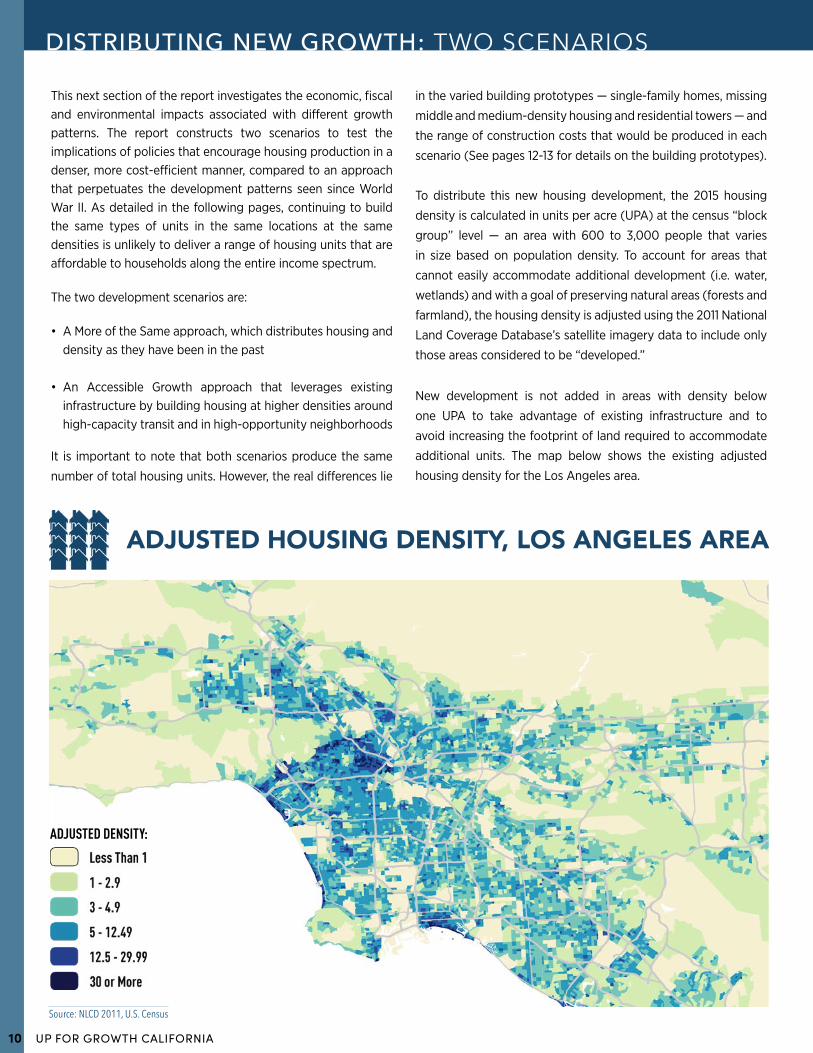
Source: NLCD 2011, U.S. Census
DISTRIBUTING NEW GROWTH: TWO SCENARIOS
This next section of the report investigates the economic, fiscal and environmental impacts associated with different growth patterns. The report constructs two scenarios to test the implications of policies that encourage housing production in a denser, more cost-efficient manner, compared to an approach that perpetuates the development patterns seen since World War II. As detailed in the following pages, continuing to build the same types of units in the same locations at the same densities is unlikely to deliver a range of housing units that are affordable to households along the entire income spectrum.
The two development scenarios are:
• A More of the Same approach, which distributes housing and density as they have been in the past
• An Accessible Growth approach that leverages existing infrastructure by building housing at higher densities around high-capacity transit and in high-opportunity neighborhoods
It is important to note that both scenarios produce the same
number of total housing units. However, the real differences lie
in the varied building prototypes — single-family homes, missing
middle and medium-density housing and residential towers — and
the range of construction costs that would be produced in each
scenario (See pages 12-13 for details on the building prototypes).
To distribute this new housing development, the 2015 housing
density is calculated in units per acre (UPA) at the census “block
group” level — an area with 600 to 3,000 people that varies
in size based on population density. To account for areas that
cannot easily accommodate additional development (i.e. water,
wetlands) and with a goal of preserving natural areas (forests and
farmland), the housing density is adjusted using the 2011 National
Land Coverage Database’s satellite imagery data to include only
those areas considered to be “developed.”
New development is not added in areas with density below
one UPA to take advantage of existing infrastructure and to
avoid increasing the footprint of land required to accommodate
additional units. The map below shows the existing adjusted
housing density for the Los Angeles area.
ADJUSTED HOUSING DENSITY, LOS ANGELES AREA
ADJUSTED DENSITY:
10 UP FOR GROWTH CALIFORNIA

DISTRIBUTING NEW GROWTH: TWO SCENARIOS
L.A. AREA ACCESSIBLE GROWTH
DISTRIBUTING NEW GROWTH: TWO SCENARIOS
This map demonstrates where new units would be built in the Los Angeles area under a Accessible Growth density distribution. As the map demonstrates, new housing units are distributed near high-capacity transit areas and in areas that already have apartment towers to align with the current built form.
ACCESSIBLE GROWTHTOTAL UNITS ADDED
LESS THAN 1,000
1,001-2,000
2,001-3,000
3,001-4,000
MORE THAN 4,000
ACCESSIBLE GROWTH300% INCREASE IN DENSITY UP TO 150 UPA
WITHIN ¼ MILE OF TRANSIT STATIONS
200% INCREASE IN DENSITY UP TO 120 UPA FROM ¼ TO ½ MILE OF TRANSIT STATIONS
MORE OF THE SAME The More of the Same scenario looks at the current share of single-family homes, missing middle and medium-density units, and high rise towers across the state, and it assigns new growth proportionally above the threshold of one UPA. If 5% of California housing units were in high-rise towers, 5% of new growth would also occur in high-rise towers. The goal of this scenario is to approximate current development patterns.
ACCESSIBLE GROWTH The Accessible Growth scenario assigns new housing units based on a formula of existing density, distance to transit stops and the share of commuters in the census block group who drive their own vehicles to work. Building prototypes are estimated using the matrix on page 13, which uses examples from the existing built environment and block group densities from 2010 to determine the estimated mix (See page 13 for more details on prototype selection). The goal of the Accessible Growth scenario is to increase density in a way that conforms with the existing urban form, focusing on delivering lower-cost, mid-rise units, and most importantly, locating units in transit corridors to reduce vehicle miles traveled (VMT) and the number of cars on the road. In order to achieve these goals, unit distribution was prioritized in:
• Locations within a quarter mile of existing transit stations;
• Locations within a half mile of a high-capacity transit station;
• Non-transit corridor locations with a low share of people using private transportation to commute to work (A proxy for low VMT, described on pages 14 and 15).
Due to the availability of low-density land in transit corridors, 50% of the new units were located within a half mile of stations, and 28% of units were within a quarter mile of transit stations. In order to achieve higher densities in priority areas, the addition of new units could triple existing density within the first quarter mile (subject to a cap of 150 UPA) and could double existing density from a quarter mile to half mile (subject to a cap of 120 UPA). n
HOUSING UNDERPRODUCTION IN CALIFORNIA 11

COST ESTIMATES AND PROTOTYPE ASSUMPTIONS
TOWER HIGH-RISE (6+ STORIES): MAX 240 UNITS PER ACRE
MISSING MIDDLE & MED.-DENSITY (UP TO 5 STORIES): MAX 120 UNITS PER ACRE
SINGLE-FAMILY HOME (UP TO 3 STORIES): MAX 5 UNITS PER ACRE
From an urban planning and design perspective, the additional units built in each block group match the existing housing prototypes observed in that block group. The goal is to avoid inevitable neighborhood opposition, where adding new high-density housing units in block groups with mostly single-family homes drastically changes the neighborhood composition. Each block group is assigned a prototype distribution based on the existing density of that block group, which can be seen on the table on page 13. The cutoffs for the prototypes were determined by looking at satellite imagery of block groups and attempting to find breakpoints that matched the existing distribution of prototypes.
The images on page 13 demonstrate examples of existing neighborhoods with different levels of housing density. The image on the left is the upper limit of density — showing a block group with 150 units per adjusted acre. Adjusted densities measure gross land and include right of ways and other non-residential uses. The achievable density on a residential parcel is higher than the average density for the block group. The picture on the right shows a block group with 30 units per adjusted acre. In the Accessible Growth scenario, block groups with more than 30 units per acre will receive additional housing units until they look more like the picture on the left. Similarly, block groups with density between 12.5 and 30 units per acre (less dense than the photo on the right), would receive a variety of missing middle housing to achieve higher densities. The table on page 13 details this density distribution.
Each growth scenario builds the same number of total units but differs on the types of prototypes built (single-family homes, medium-density units and towers). Each development prototype has different construction costs and different infrastructure investment requirements. The two different growth scenarios allow for comparison of the same number of units produced with different development patterns. For example:
• Infill projects located in urban cores do not require new roads and require minor infrastructure investment compared to greenfield development.
• Building near transit infrastructure reduces VMT and emissions (See VMT discussion on page 14).
• Missing middle housing can be built in high-opportunity single-family neighborhoods and can be built at a lower cost per unit than the existing stock of housing.
• Obtaining better locational balance between jobs and housing improves agglomeration benefits and reduces the traffic congestion in a region.
12 UP FOR GROWTH CALIFORNIA

COST ESTIMATES AND PROTOTYPE ASSUMPTIONS
UPA = 150 —100% TOWER UPA = 30 — 50% MEDIUM/50% TOWER
30.0+ Units per acre
12.5-30 Units per acre
5.0-12.5 Units per acre
3.0-5.0 Units per acre
1.0-3.0 Units per acre
CURRENT DENSITY % TOWER % MEDIUM % SFH
Less Than 1.0 UPA
100%
50% 50%
100%
25% 75%
100%
Development Threshold — No Density Added
DENSITY DISTRIBUTION & PROTOTYPE MATRIX CALIFORNIA PROTOTYPE
DISTRIBUTION BY GROWTH SCENARIO
ACCESSIBLE GROWTH
The chart demonstrates this distribution pattern, showing how many towers, medium-density units and single-family homes are allocated in each growth scenario. Continuing a More of the Same approach throughout California would deliver 41% of new units as single-family homes. Under the Accessible Growth scenario, this would be reduced to just 6% of units. Accessible Growth focuses on delivering more missing middle units, increasing these units to 64%, as opposed to just 52% in a More of the Same approach. n
COST ESTIMATES AND PROTOTYPE ASSUMPTIONS
MEDIUM
41%
52%
6%
64%
31%
7%The table above shows the prototype distribution for the Accessible Growth scenario. Block groups with more than 30 UPA see 100% of new units added in towers, until they reach the density threshold for that scenario based on the location of the block group. The scenario distribution then moves to the next-densest block group and adds units in a 50% tower/50% medium-density mix. This continues further, adding additional medium-density units and, finally, single-family units until the total number of units underproduced has been allocated. The net result of the prototype allocation is to achieve higher densities than are currently observed by including a mix of units to better utilize the existing infrastructure.
The More of the Same scenario does not use a distribution mechanism because it assigns new growth proportionally based on the currently observed distribution of prototypes. For example, an area with only 5% of units in high-rise towers will see that same share of new units built as high-rise towers.
HOUSING UNDERPRODUCTION IN CALIFORNIA 13

ENVIRONMENTAL BENEFITS OF ACCESSIBLE GROWTH
The Accessible Growth scenario targets areas of existing high density combined with low VMT in transit corridors as the priority for assigning unit growth. The goal of the Accessible Growth scenario is to achieve improved economic and fiscal impacts while also delivering additional positive environmental impacts compared to the More of the Same scenario. At its most basic level, Accessible Growth achieves higher density than current housing development patterns and therefore requires less land to accommodate the same number of units. In California, Accessible Growth requires just 23% of the land area required for the More of the Same scenario. Utilizing less land means higher economic efficiency for local jurisdiction service delivery, as well as environmental benefits such as storm water remediation and undisturbed room for forestry and farming.
In addition to land-use benefits, locating housing near public transportation reduces the burden of cars on the road. This important relationship is a focus for the Accessible Growth scenario, which prioritizes housing in transit corridors with low VMT.
To quantify the benefits of having housing units in transportation corridors, a first-of-its-kind model was developed to estimate
ENVIRONMENTAL IMPACT OF ACCESSIBLE GROWTH: LOWER VEHICLE MILES TRAVELED
the VMT of a neighborhood based on the characteristics of the built environment at the census tract level nationally. The study found a very strong relationship between VMT and the proportion of households who commute by car and truck (also known as “commute mode split”) as demonstrated by the scatterplots on page 15.
The map below shows commuting VMT for the Bay Area, with transit stations overlaid. The range of VMT is as low as 10-20 in some areas and more than 50 in others. By locating housing in areas with low VMT, the Accessible Growth scenario in California results in 38 million fewer miles travelled daily for commuters compared to the More of the Same scenario, a difference that is equivalent to 1.2 million fewer cars on the road annually.
Less Than 10
10-20
20-30
HOME-BASED VMTPER HOUSING UNIT
30-40
40-50
Greater Than 50
14 UP FOR GROWTH CALIFORNIA

ENVIRONMENTAL BENEFITS OF ACCESSIBLE GROWTH
HOUSING DENSITY
RELATIONSHIP BETWEEN HOUSING DENSITY AND PREDICTED VMT IN CALIFORNIA
P
REDI
CTED
DAI
LY V
MT
PERCENT OF COMMUTERS WHO DRIVE
The Accessible Growth strategy has numerous benefits beyond increasing GSP, jobs, tax revenues and housing density — all of which are explored in the next pages. The Accessible Growth approach also delivers meaningful environmental benefits compared to other housing development patterns. n
ENVIRONMENTAL BENEFITS OF ACCESSIBLE GROWTH
WITHIN 1/4 MILE OF HC TRANSIT OUTSIDE 1/4 MILE OF HC TRANSIT
RELATIONSHIP BETWEEN COMMUTERS WHO DRIVE AND PREDICTED VMT IN CALIFORNIA
P
REDI
CTED
DAI
LY V
MT
40
20
0 50 100 150
40
20
0 25% 50% 75%
The Accessible Growth approach has the largest increase in transit corridor density. With the relationship between VMT and commute mode spilt clearly demonstrated, increasing housing density in transit corridors would be a valuable way to reduce VMT and leverage public infrastructure investments.
The scatterplots below compare housing density and daily commuting VMT for transit corridors (yellow dots) and non-transit corridors (red dots) in California at the block group level. These scatterplots demonstrate that commuting VMTs are lower in transit corridors than in non-transit corridors, with a median of 27 VMT and 34 VMT, respectively. They also show that the median transit corridor block group has a higher housing density than the median non-transit corridor block group, with 28 units per acre compared to eight units per acre, respectively. In addition:
• The majority of transit corridor block groups have VMT below 30 miles.
• Almost all the transit corridor block groups have low commute mode splits (under 50%).
• Almost all the highest-density block groups are in transit corridors.
• There are few outliers in either scatterplot, indicating strong relationships between VMT and housing density, and between VMT and commute mode split.
99TH % HOUSING DENSITY
29
83
99TH % VMT
75
61
ACCESSIBLE GROWTH BENEFITS3.4 MILLION UNITS PRODUCED IN CALIFORNIA
DIFFERENCE
THROUGHOUT CALIFORNIA
OUTSIDE 1/4 MILE
WITHIN 1/4 MILE
OUTSIDE 1/4 MILE
WITHIN 1/4 MILE
MEDIAN HOUSING DENSITY
3.9
6.0
MEDIAN VMT
34
27
CARS PER YEAR
1.2 MILLION
VMT PER DAY38 MILLION
(35% REDUCTION)
HOUSING UNDERPRODUCTION IN CALIFORNIA 15

REMI MODEL: ECONOMIC IMPACTS
As cities grew in the post-World War II era, high rates of new housing unit growth paid for costly infrastructure projects that were generally funded by local governments with federal- and state-level subsidies. More recently, as rates of growth have decreased, cities have struggled with funding new infrastructure to support growth. This forms a classic “Catch-22.”
1Given the unavailability of land and infrastructure this scenario is unattainable.
INFRASTRUCTURE SPENDING
MORE OF THE SAME
ACCESSIBLE GROWTH
% OF TOTALDIFFERENCE
TOTAL ACRES $215K $50K -77%
TOTAL INFRA SPEND $131B $6B -95%
TOTAL O&M $5.1B $1.2B -76%
deferred maintenance costs of all the roads, sewers and other infrastructure necessary for this type of housing.
Continuing to build new housing units in this manner — away from the existing infrastructure in urban cores — not only fails to remedy the problem but also exacerbates it. One consequence has been that the development costs and prices of new single-family homes have increased faster than inflation over the past decade. Nationally, 60% of new single-family homes are priced at more than $300,000, 20% higher than at the peak of the previous housing bubble.
Remedying the problem requires cities and municipalities to compare the cost of new development infrastructure to the associated fee revenues that development produces: What are the infrastructure costs and tax revenues from a single-family home in a greenfield, and how does that compare to the costs and revenues associated with medium- or high-density development in the urban core?
In the early stages of sprawl, new growth fueled the expansion while long-term maintenance obligations had not yet been incurred, so net-negative infrastructure costs were still a minor issue. However, this dynamic is changing.
Cities now face unfunded operating liabilities that will require new units to bring in more revenues than the associated costs of installing and operating the infrastructure to service each unit. This profitability is necessary if there is hope to “right-size” municipal budget problems, and there are several ways to do this:
• Growth policies can target areas that already have existing infrastructure, thereby reducing the demand for increased infrastructure investment.
• Policies can also set impact and development fees on a per-acre, gross land, or square-foot basis, rather than a per-unit basis to reflect the true infrastructure costs.
This report demonstrates that changing development patterns for the 3.4 million units that were underproduced in California can have positive effects for local government infrastructure funding. If these units were built in an Accessible Growth approach, 77% less land would be needed compared to building in a More of the Same approach — just 50,000 acres compared with 215,000 acres. Furthermore, the cost of infrastructure is twenty times smaller in the Accessible Growth approach — $6 billion compared with $131 billion in the More of the Same approach. n
Infrastructure is needed to make greenfield development possible, but the cost of infrastructure limits the ability to develop in said “green fields.” In most cities and metro areas around the country, the prime developable areas have already been consumed. The remaining areas available for development either require costly infrastructure upgrades or are far away from existing infrastructure. As a result, the cost-per-unit of infrastructure has increased over time as homes are built further and further away from urban cores.
Cities and local governments have reacted to these higher infrastructure costs in rational ways by raising fees to cover the higher costs of installing new infrastructure. However, this response ignores difficult questions: Do the revenues generated by new units support the up-front costs? More importantly, do these recurring incremental revenues cover the continued public operations and maintenance costs of this new infrastructure?
The short answer is no, particularly for low-density housing in greenfield locations requiring new infrastructure. Because infrastructure costs for a single-family home typically exceed the local government revenues collected off such a home, municipal debt is used to finance the required infrastructure. However, adding new debt service limits the ability to properly maintain existing facilities, which leads to increased costs for deferred maintenance. In the long run, an existing property tax base consisting of primarily single-family homes cannot support the installation of new infrastructure as well as the
16 UP FOR GROWTH CALIFORNIA

REMI MODEL: ECONOMIC IMPACTS
Source: ECONorthwest estimates
250,000
200,000
150,000
100,000
50,000
2016 2017 2018 2019 2020 2021 2022 2023 2024 2025 2026 2027 2028 2029 2030 2031 2032 2033 2034 2035 2036 2037
33,775
168,877
236,428
+MAX 7% OF
UNDERPRODUCTION
Our model phases in new housing development over a 20-year period. It is not feasible to assume the housing construction industry could immediately start producing new units on this scale. The industry — including producers up the supply chain — needs time to recruit and train new employees and to increase supplies of raw materials.
(Provided by Arup Engineering based on real data from developments in Calif.)
ADDITIONAL HOUSING PRODUCTION PER YEAR
This study is the first to use the Regional Economic Model (REMI) to simulate large-scale housing development. REMI is a structural representation of a regional economy and uses publicly available data to build an economic forecast. Variables can be altered to reflect changes in public policy (e.g. lower taxes, new regulation or new consumer preferences). The model then simulates the economic impacts of such policy changes and produces a new forecast capturing these effects. By comparing the simulated forecast to the baseline forecast, the economic impacts of the policies modeled can be quantified.
The model has feedback loops to capture the cumulative impacts of development spending, as well as any time-based changes to the structure of the economy, such as migration, induced demand, lower costs, supply chain spending and tax effects, among others. Any change to one sector of the economy will ripple through the others. This is beneficial, as the model is able to capture the relationships between different economic and demographic changes, such as migration, government spending, personal income, etc.
The Accessible Growth scenario produces robust economic growth: A housing expansion under this scenario would produce a $1.77 trillion cumulative increase in California Gross State Product through 2037 compared to the baseline economic forecast.
ASSUMPTIONS• HARD CONSTRUCTION COSTS:
Calculated based on industry standards for the three different housing prototypes and adjusted for California costs.
• SOFT CONSTRUCTION COSTS:
Primarily architecture, engineering and legal costs (excluding financial costs), assumed as a percentage of hard costs.
• INFRASTRUCTURE COSTS: Includes installation costs and ongoing operations and maintenance costs. Paid for by impact fees es-timated in the state. Assumes government sector pays for infrastructure not covered by impact fees through bond issuance.
HOUSING UNDERPRODUCTION IN CALIFORNIA 17

REMI MODEL: ECONOMIC IMPACTS
MORE OF THE SAMEACCESSIBLE GROWTH
CUM
ULAT
IVE G
DP M
EASU
RED
IN B
ILLI
ONS
OF FI
XED
(201
6) D
OLLA
RS
This chart demonstrates the cumulative GSP achieved in both growth scenarios. The growth in GSP is measured against the REMI model’s baseline growth projections.
The report describes the environmental and local government financing impacts of these two development patterns. This section describes the economic impacts of developing 3.4 million units in California by comparing an Accessible Growth or a More of the Same approach.
The Accessible Growth scenario generates greater economic benefits compared to the More of the Same scenario. Leveraging existing infrastructure is a more efficient use of scarce resources, and rather than generating debt to finance the
$1,800
$1,600
$1,400
$1,200
$1,000
$800
$600
$400
$200
0
$1.77T
$1.6T
REMI MODEL: ECONOMIC IMPACTS
2016 2017 2018 2019 2020 2021 2022 2023 2024 2025 2026 2027 2028 2029 2030 2031 2032 2033 2034 2035 2036 2037
Increased housing production reduces housing prices, which increases personal income and spending, which increases GSP, which creates more jobs.
REDUCES HOUSING PRICES
INCREASES INCOME
SPENDING, GDP, JOBS
= =INCREASED
HOUSING PRODUCTION
CALIFORNIA CUMULATIVE GSP BY SCENARIO 20-YEAR PRODUCTION PERIOD COMPARED TO BASELINE
infrastructure costs, Accessible Growth focuses on generating consumer spending to benefit the regional economy.
Additionally, the Accessible Growth development approach provides more tax revenue-generating units while requiring less infrastructure. Because the Accessible Growth scenario adds additional housing to the densest areas in transit corridors, it leverages existing infrastructure while providing more tax revenue per acre. Thus, development in the Accessible Growth scenario requires fewer borrowing costs and places a smaller burden on local governments and property developers on a per-unit basis. With much of this infrastructure already in place, building density of this type in cities around the state would not require a radical restructuring of existing land-use and zoning policies.
Over the simulated 20-year period of housing production, the Accessible Growth scenario generates an additional $170 billion in cumulative GSP for a total of $1.77 trillion compared with the More of the Same scenario. With lower up-front infrastructure costs and reduced operating and maintenance costs associated with development, this scenario deploys capital more efficiently and produces higher economic output.
18 UP FOR GROWTH CALIFORNIA

REMI MODEL: ECONOMIC IMPACTS
The Accessible Growth scenario produces greater economic benefits than the More of the Same approach. This scenario targets development in transit corridors: areas with existing transportation infrastructure and a large number of households commuting by public transit. Jobs are added to the economy in each year compared to the baseline over the
This chart demonstrates the increase in “job years” above the REMI model baseline projections resulting from the Accessible Growth scenarios. Job years are an economic measure representing one year’s worth of full-time work. One job year could be one person working full time for one year, or two people working half time for one year. The increases in jobs correlate with the 20-year development time frame and span every sector.
REMI MODEL: ECONOMIC IMPACTS TO
TAL E
MPL
OYM
ENT C
HANG
ES M
EASU
RED
IN (0
00S)
OF J
OBS
1,000
800
600
400
200
0
1,200
2016 2017 2018 2019 2020 2021 2022 2023 2024 2025 2026 2027 2028 2029 2030 2031 2032 2033 2034 2035 2036 2037
ANNUAL CALIFORNIA JOBS IN ACCESSIBLE GROWTH 20-YEAR PRODUCTION PERIOD COMPARED TO BASELINE
20-year production period for both scenarios. Jobs should not be thought of as cumulative impacts. It’s not uncommon for one individual to be employed by the same company for several years, so it’s difficult to trace the number of individuals employed year by year. Looking at employment impacts, however, we can see in a given year how many more jobs are supported compared to the baseline scenario. For example, at the peak job year, Accessible Growth creates 1.18 million more jobs than the REMI baseline projection.
To summarize, both growth scenarios lead to large economic benefits for California’s economy. Producing 3.4 million housing units (in addition to expected development over the next 20 years) provides a boost to the state and local economies and fiscal revenues. However, there is opportunity for greater economic growth, fiscal health and positive environmental impacts by implementing an Accessible Growth scenario that concentrates growth in areas of existing density and transportation infrastructure.
In short, increased housing production reduces housing prices, which increases personal income and spending, which increases GSP, which creates more jobs. n
HOUSING UNDERPRODUCTION IN CALIFORNIA 19
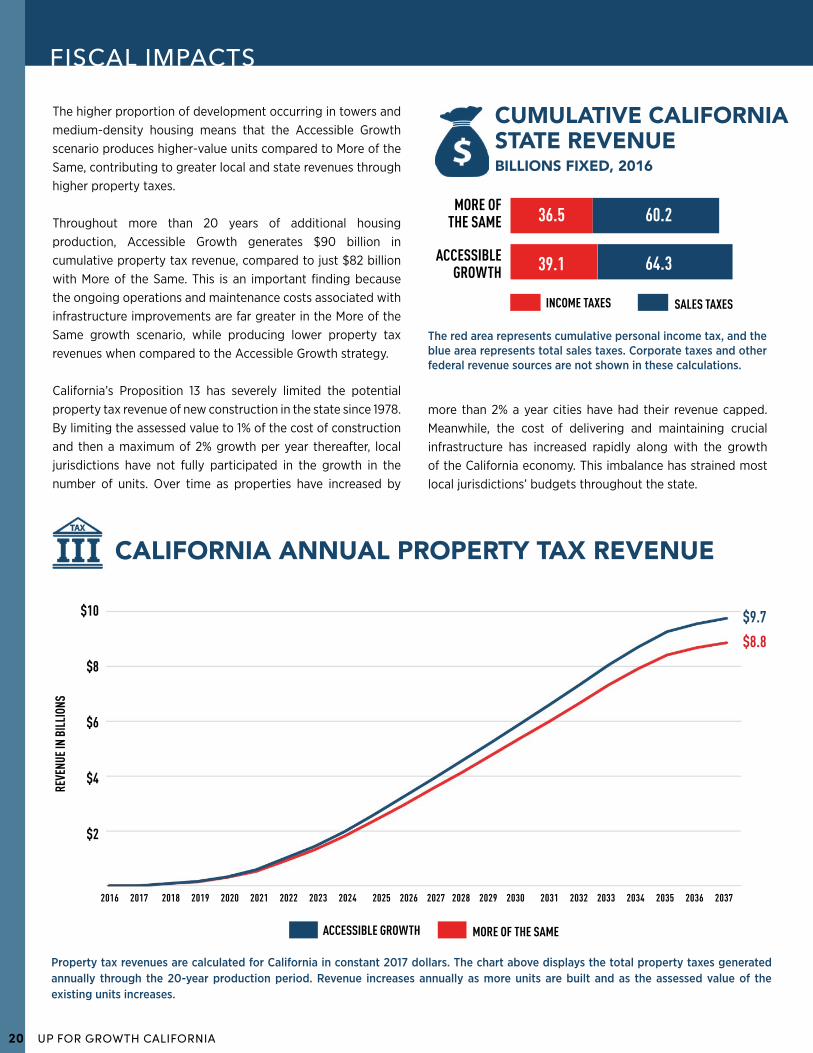
CUMULATIVE CALIFORNIA STATE REVENUEBILLIONS FIXED, 2016
The higher proportion of development occurring in towers and medium-density housing means that the Accessible Growth scenario produces higher-value units compared to More of the Same, contributing to greater local and state revenues through higher property taxes.
Throughout more than 20 years of additional housing production, Accessible Growth generates $90 billion in cumulative property tax revenue, compared to just $82 billion with More of the Same. This is an important finding because the ongoing operations and maintenance costs associated with infrastructure improvements are far greater in the More of the Same growth scenario, while producing lower property tax revenues when compared to the Accessible Growth strategy.
California’s Proposition 13 has severely limited the potential property tax revenue of new construction in the state since 1978. By limiting the assessed value to 1% of the cost of construction and then a maximum of 2% growth per year thereafter, local jurisdictions have not fully participated in the growth in the number of units. Over time as properties have increased by
Property tax revenues are calculated for California in constant 2017 dollars. The chart above displays the total property taxes generated annually through the 20-year production period. Revenue increases annually as more units are built and as the assessed value of the existing units increases.
FISCAL IMPACTS
$10
$8
$6
$4
$2
2016 2017 2018 2019 2020 2021 2022 2023 2024 2025 2026 2027 2028 2029 2030 2031 2032 2033 2034 2035 2036 2037
REVE
NUE I
N BI
LLIO
NS
MORE OF THE SAME
ACCESSIBLE GROWTH
36.5
39.1 64.3
60.2
$9.7
$8.8
The red area represents cumulative personal income tax, and the blue area represents total sales taxes. Corporate taxes and other federal revenue sources are not shown in these calculations.
SALES TAXESINCOME TAXES
CALIFORNIA ANNUAL PROPERTY TAX REVENUE
more than 2% a year cities have had their revenue capped. Meanwhile, the cost of delivering and maintaining crucial infrastructure has increased rapidly along with the growth of the California economy. This imbalance has strained most local jurisdictions’ budgets throughout the state.
MORE OF THE SAMEACCESSIBLE GROWTH
20 UP FOR GROWTH CALIFORNIA

CUMULATIVE CALIFORNIA LOCAL NET FISCAL REVENUE
FISCAL IMPACTS
2016 2017 2018 2019 2020 2021 2022 2023 2024 2025 2026 2027 2028 2029 2030 2031 2032 2033 2034 2035 2036 2037
100
80
60
40
20
0
-20
$104B
-$24B
REVE
NUE I
N BI
LLIO
NS
MORE OF THE SAME
ACCESSIBLE GROWTH
% OF TOTALDIFFERENCE
TOTAL ACRES 215K 50K -77%
TOTAL INFRA SPEND $131B $6B -95%
TOTAL O&M $5.1B $1.2B -76%
TOTAL SDC FEES $30B $22B -27%
PROP TAX REVENUE $82B $90B 10%
NET REVENUE -$24B $104B $128B
Net fiscal revenues are reported in constant 2017 dollars, where the total property taxes generated from the new units represents the total revenue. The cost of constructing the required infrastructure and the ongoing operations and maintenance is subtracted from the total revenue to equal the net revenue. As units are built in the More of the Same scenario, revenue is negative in every year through almost the entirety of the production period.
The Accessible Growth and More of the Same scenarios generate similar amounts of fiscal revenue through property taxes. The net impact of the construction varies considerably — with Accessible Growth delivering net positive income from the first unit built. Conversely, the More of the Same scenario yields net negative revenue through almost the entirety of the 20-year production period. While the fiscal revenues are positive in the last few years of production for the More of the Same scenario, the cumulative effect is still negative over the 20-year period.
Throughout the report, the benefits of Accessible Growth are evaluated against the More of the Same approach. The economic impacts of both scenarios are similar, but stark differences emerge when looking at the environmental and fiscal impacts of each scenario. VMT in a Accessible Growth approach would decline by up to 35%. In addition, while property tax revenues are similar for both approaches, this changes when the costs of infrastructure are considered. When including the cost of installing and maintaining infrastructure over time, it becomes clear that the More of the Same scenario is not financially sustainable.
Building all the underproduced housing units in a Accessible Growth approach would require only 23% of the land area required by a More of the Same approach. Further, the cost of infrastructure in the Accessible Growth approach is only 5%
compared to the More of the Same approach. The result is that Accessible Growth units produce positive fiscal revenue to contribute to the financial sustainability of local governments. Development via a More of the Same approach cannot support the required infrastructure costs and would need to rely on debt to finance the growth. As a result, for the majority of the 20-year production period, resources must be diverted from other productive uses to fund development in a More of the Same approach. n
MORE OF THE SAMEACCESSIBLE GROWTH
HOUSING UNDERPRODUCTION IN CALIFORNIA 21

POLICY DISCUSSIONS AND CONCLUSIONSOver the past two years, the California State Legislature has taken crucial first steps that attempt to create additional resources for and remove barriers to affordable housing, including the recent passage of SB 2 (2017) Building Jobs and Homes Act, which increased the document recording fee to $75 per instrument to generate increased funding for housing; SB 3 (2017) Veterans and Affordable Housing Bond Act of 2018, which authorizes a $4 billion bond for veterans and affordable housing; and, AB 2923 (2018) San Francisco Bay Area Rapid Transit District, which establishes that a transit agency can play a role in zoning on land adjacent to transit station areas. It has also passed Senate Bill 35 (2017) Planning and Zoning: Affordable Housing: Streamlined Approval Process, which protects localities that are not meeting housing allocation targets to avoid the prevention of housing being approved. Additionally, it passed SB 828 (2018) Land Use: Housing Element, which establishes better data-driven processes to set needed housing allocation targets for California’s communities. Policies that reduce the cost of delivery for new units will lead to an increase in the overall production of housing, which will help California overcome its current 3.4 million housing unit shortage and increase affordability across the income spectrum. n
California has experienced unprecedented economic growth over the last decade, catapulting it to the world’s fifth-largest economy. That growth is now threatened, however, and is slowing due to an inability to keep up with the infrastructure and housing needed to serve the increased populations. As Senator Scott Wiener has noted, “The negative impacts of California’s housing shortage threaten our state’s economic growth, environmental well-being and diversity. It is far too expensive to rent or buy a home in California, which results in displacement, evictions and families being pushed out as they grow. Teachers, retail workers, first responders and other middle-income professionals often have crushing commutes as they increasingly cannot afford to live near their jobs.”
This lack of housing affordable to all Californians has reached crisis levels in the state. There is a growing public outcry to address this crisis, and these sentiments are increasingly echoed across every sector from policy advocates to the many technology companies that have helped shape California’s explosive job growth.
As Up for Growth’s California analysis shows, we can achieve meaningful economic, fiscal and environmental benefits through incentivizing the production of more housing near high-opportunity, transit-served and employment-rich locations. However, bold policy and political actions are needed to make this happen.
22 UP FOR GROWTH CALIFORNIA

POLICY DISCUSSIONS AND CONCLUSIONS
1 CREATE PROPERTY TAX REIMBURSEMENT TOOLS THAT ENABLE HIGHER DENSITY AND MIXED-INCOME COMMUNITIES
2
3
4
STREAMLINE HOUSING PRODUCTION AND MITIGATE DISPLACEMENT
CREATE VALUE CAPTURE TOOLS TO PROMOTE SUSTAINABLE AFFORDABLE HOUSING FUNDING
RECALIBRATE IMPACT FEES TO PROMOTE MORE LOCATION EFFICIENT HOUSING SUPPLY5
INCREASE ZONED RESIDENTIAL CAPACITY IN TRANSIT SERVED AREAS TO PROMOTE LOCATION EFFICIENT HOUSING OPTIONS