Housing Task Force #6
49
Housing Task Force Work Session #6 Tuesday, April 21, 2015 6:00pm - 7:30pm Sharswood I - 1425 N.23rd Street Philadelphia, 19121 Page 1
-
Upload
sharswoodblumberg -
Category
Government & Nonprofit
-
view
196 -
download
0
Transcript of Housing Task Force #6
Housing Task Force Work Session #6 Tuesday, April 21, 2015
6:00pm - 7:30pm
Sharswood I - 1425 N.23rd Street
Philadelphia, 19121
Page 1

I. Welcome & Introductions
I. Welcome & Project Updates Philadelphia Housing Authority (PHA) – Nicholas Dema
II. Group Discussion on Housing Goals, Indicators and Metrics Wallace Roberts & Todd (WRT) – Garlen Capita
III. Overview of Market Study Findings/Highlights Real Estate Strategies (RES) – Meg Sowell
IV. Questions & Answers (ALL)
V. Closing & Next Steps Philadelphia Housing Authority (PHA) – Nicholas Dema
Page 2
Housing Task Force
Work Session #6 T U E S D AY, A P R I L 2 1 , 2 0 1 5
Welcome & Project Updates Page 3
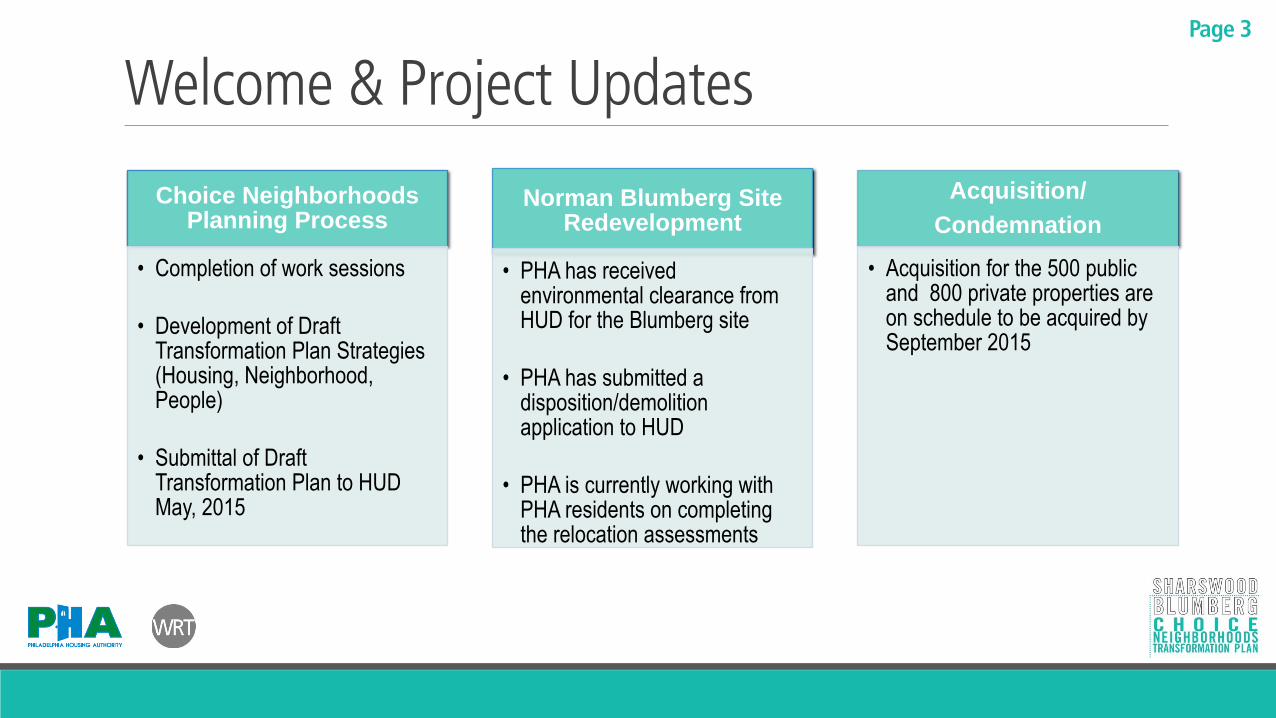
Choice Neighborhoods Planning Process
• Completion of work sessions
• Development of Draft Transformation Plan Strategies (Housing, Neighborhood, People)
• Submittal of Draft Transformation Plan to HUD May, 2015
Norman Blumberg Site Redevelopment
• PHA has received environmental clearance from HUD for the Blumberg site
• PHA has submitted a disposition/demolition application to HUD
• PHA is currently working with PHA residents on completing the relocation assessments
Acquisition/
Condemnation
• Acquisition for the 500 public and 800 private properties are on schedule to be acquired by September 2015
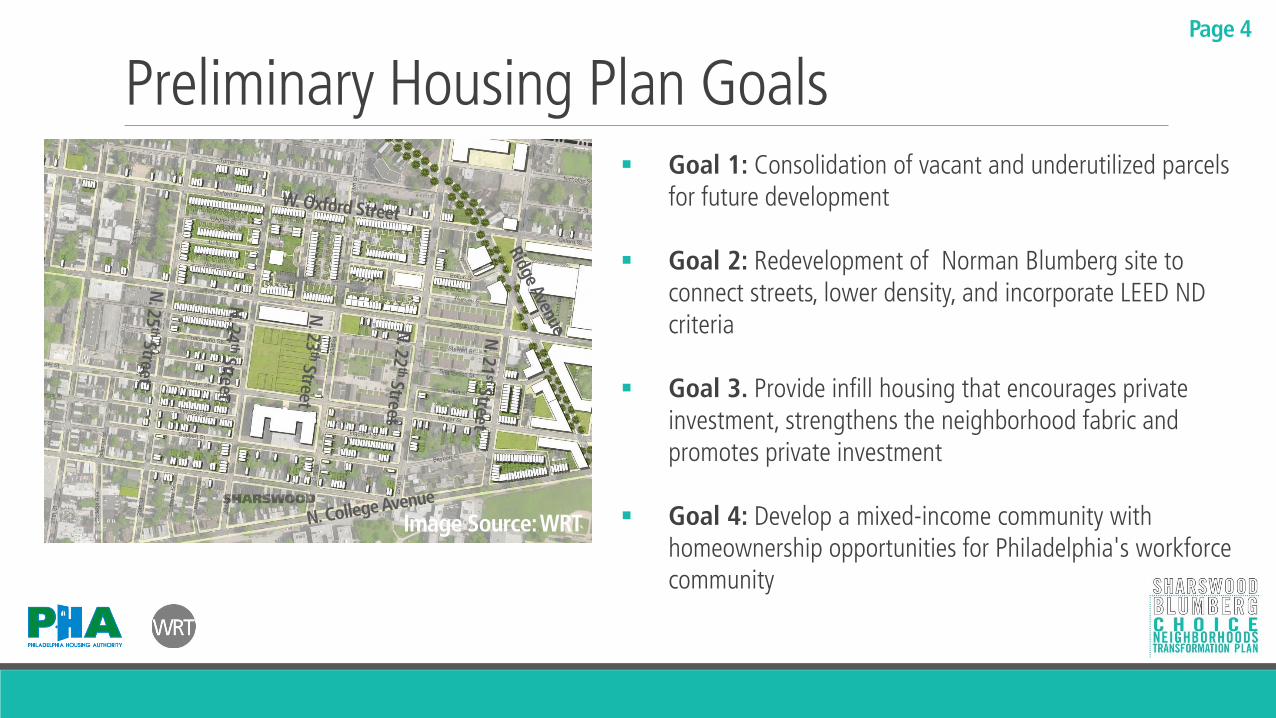
Preliminary Housing Plan Goals Goal 1: Consolidation of vacant and underutilized parcels
for future development
Goal 2: Redevelopment of Norman Blumberg site to
connect streets, lower density, and incorporate LEED ND criteria
Goal 3. Provide infill housing that encourages private investment, strengthens the neighborhood fabric and promotes private investment
Goal 4: Develop a mixed-income community with
homeownership opportunities for Philadelphia's workforce community
Page 4
Image Source: WRT
DRAFT Housing Goals and Strategies
Page 5
Need Goal Strategy Outcome/ Measure
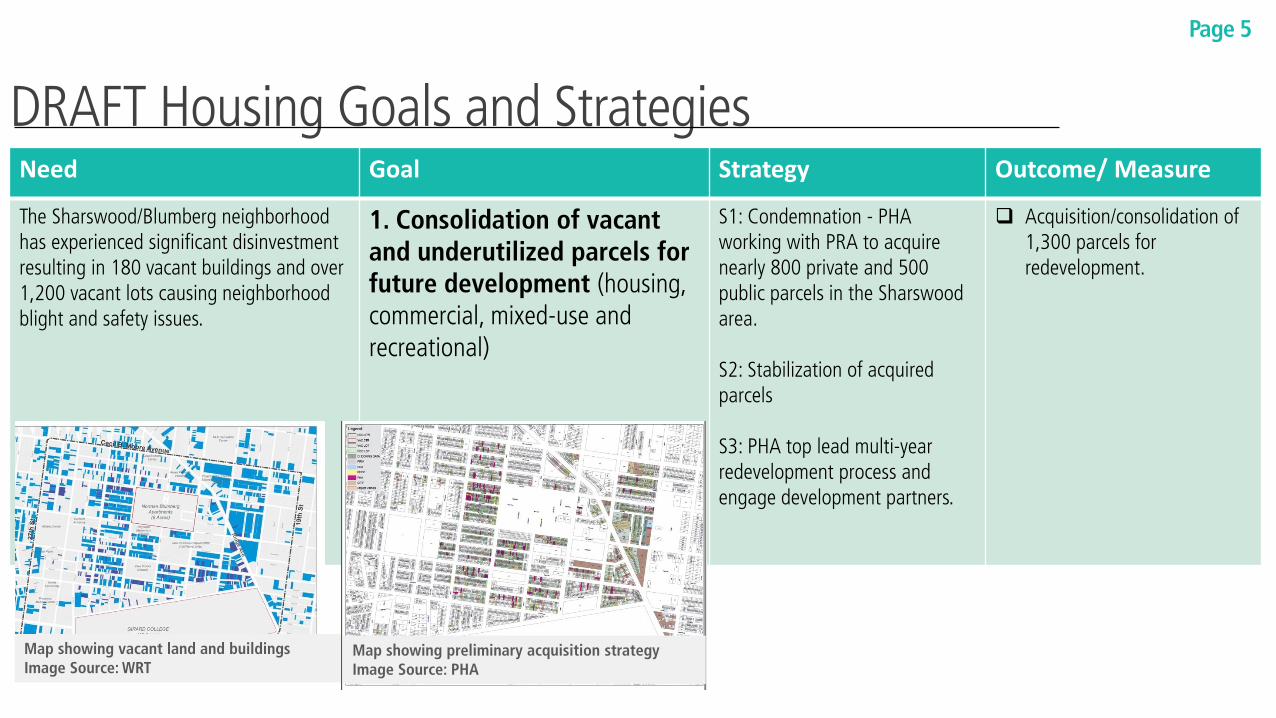
The Sharswood/Blumberg neighborhood has experienced significant disinvestment resulting in 180 vacant buildings and over 1,200 vacant lots causing neighborhood blight and safety issues.
1. Consolidation of vacant and underutilized parcels for future development (housing, commercial, mixed-use and recreational)
S1: Condemnation - PHA working with PRA to acquire nearly 800 private and 500 public parcels in the Sharswood area. S2: Stabilization of acquired parcels S3: PHA top lead multi-year redevelopment process and engage development partners.
Acquisition/consolidation of 1,300 parcels for redevelopment.
Map showing vacant land and buildings Image Source: WRT
Map showing preliminary acquisition strategy Image Source: PHA
DRAFT Housing Goals and Strategies
Page 6
Need Goal Strategy Outcome/Measure
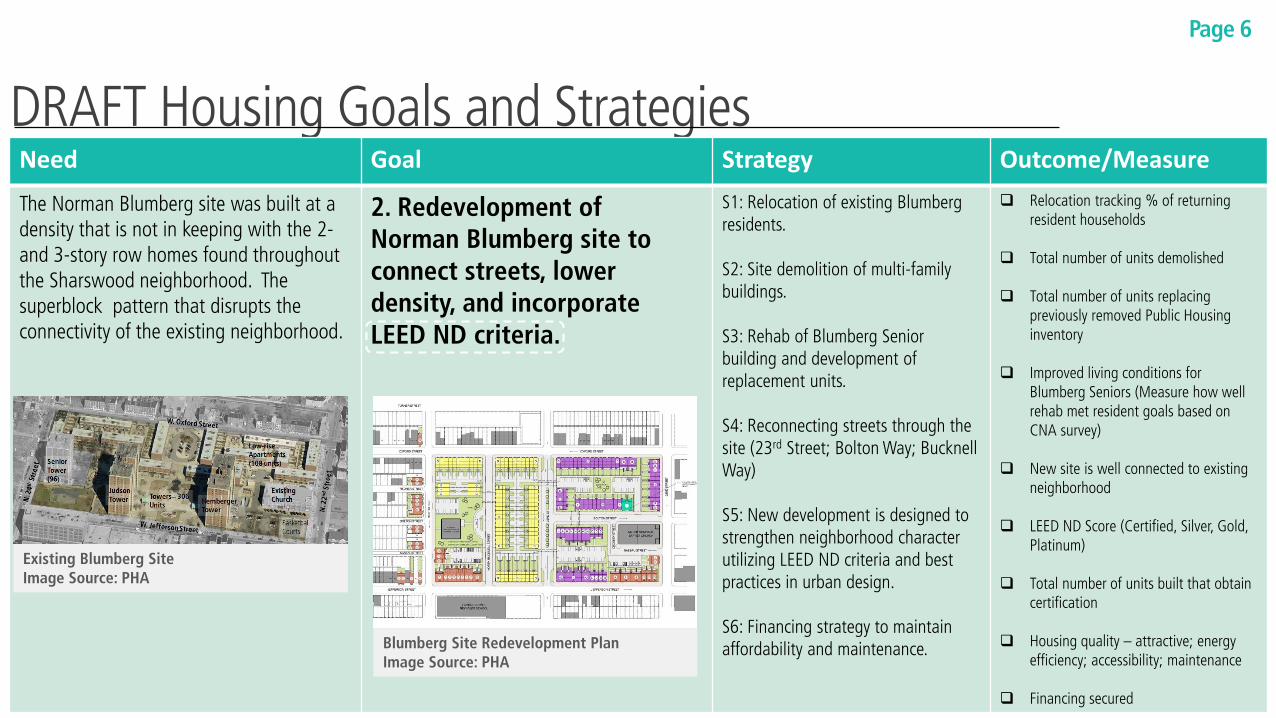
The Norman Blumberg site was built at a density that is not in keeping with the 2- and 3-story row homes found throughout the Sharswood neighborhood. The superblock pattern that disrupts the connectivity of the existing neighborhood.
2. Redevelopment of Norman Blumberg site to connect streets, lower density, and incorporate LEED ND criteria.
S1: Relocation of existing Blumberg residents. S2: Site demolition of multi-family buildings. S3: Rehab of Blumberg Senior building and development of replacement units. S4: Reconnecting streets through the site (23rd Street; Bolton Way; Bucknell Way) S5: New development is designed to strengthen neighborhood character utilizing LEED ND criteria and best practices in urban design. S6: Financing strategy to maintain affordability and maintenance.
Relocation tracking % of returning resident households
Total number of units demolished Total number of units replacing
previously removed Public Housing inventory
Improved living conditions for Blumberg Seniors (Measure how well rehab met resident goals based on CNA survey)
New site is well connected to existing neighborhood
LEED ND Score (Certified, Silver, Gold, Platinum)
Total number of units built that obtain
certification
Housing quality – attractive; energy efficiency; accessibility; maintenance
Financing secured
Existing Blumberg Site Image Source: PHA
Blumberg Site Redevelopment Plan Image Source: PHA
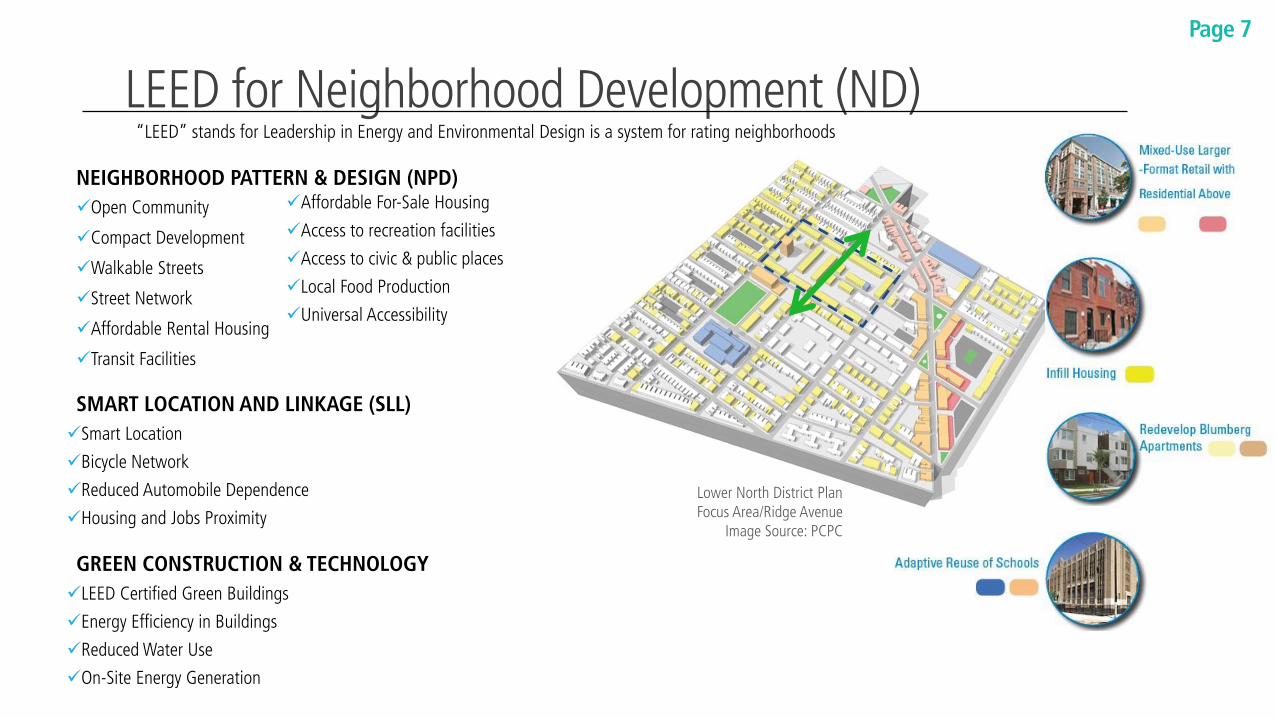
SMART LOCATION AND LINKAGE (SLL)
Smart Location
Bicycle Network
Reduced Automobile Dependence
Housing and Jobs Proximity
7
NEIGHBORHOOD PATTERN & DESIGN (NPD)
Open Community
Compact Development
Walkable Streets
Street Network
Affordable Rental Housing
Transit Facilities
Lower North District Plan Focus Area/Ridge Avenue
Image Source: PCPC
LEED for Neighborhood Development (ND)
Affordable For-Sale Housing
Access to recreation facilities
Access to civic & public places
Local Food Production
Universal Accessibility
GREEN CONSTRUCTION & TECHNOLOGY
LEED Certified Green Buildings
Energy Efficiency in Buildings
Reduced Water Use
On-Site Energy Generation
“LEED” stands for Leadership in Energy and Environmental Design is a system for rating neighborhoods
Page 7
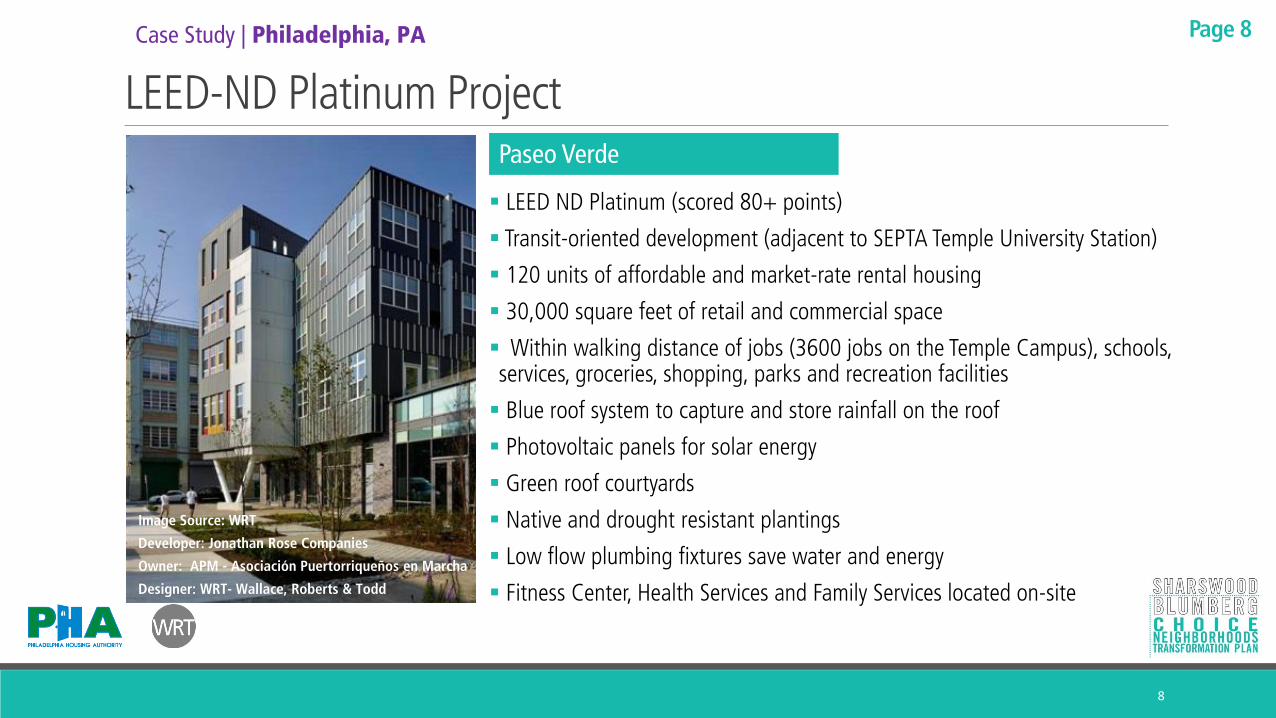
LEED-ND Platinum Project
LEED ND Platinum (scored 80+ points)
Transit-oriented development (adjacent to SEPTA Temple University Station)
120 units of affordable and market-rate rental housing
30,000 square feet of retail and commercial space
Within walking distance of jobs (3600 jobs on the Temple Campus), schools, services, groceries, shopping, parks and recreation facilities
Blue roof system to capture and store rainfall on the roof
Photovoltaic panels for solar energy
Green roof courtyards
Native and drought resistant plantings
Low flow plumbing fixtures save water and energy
Fitness Center, Health Services and Family Services located on-site
8
Paseo Verde
Case Study | Philadelphia, PA
Image Source: WRT
Developer: Jonathan Rose Companies
Owner: APM - Asociación Puertorriqueños en Marcha
Designer: WRT- Wallace, Roberts & Todd
Page 8
DRAFT Housing Goals and Strategies
Page 9
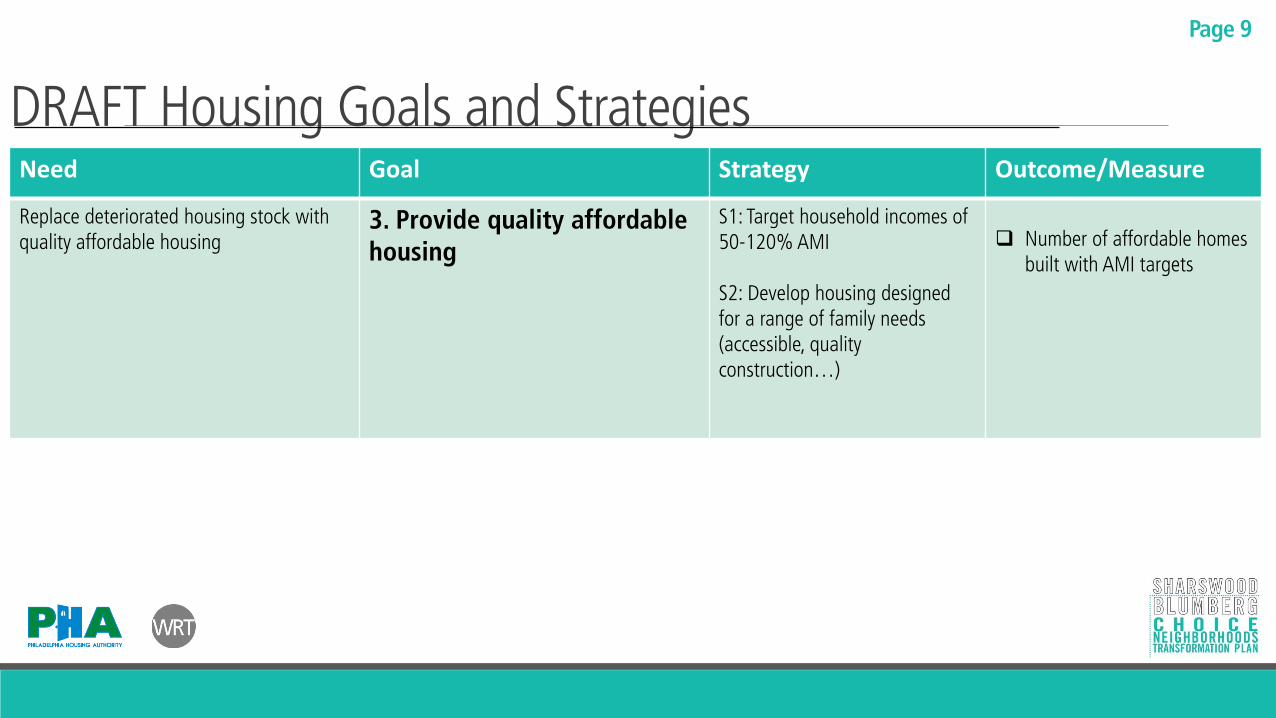
Need Goal Strategy Outcome/Measure
Replace deteriorated housing stock with quality affordable housing
3. Provide quality affordable housing
S1: Target household incomes of 50-120% AMI S2: Develop housing designed for a range of family needs (accessible, quality construction…)
Number of affordable homes built with AMI targets

DRAFT Housing Goals and Strategies
Page 10
Need Goal Strategy Outcome/Measure
The Sharswood neighborhood has a 36% long-term vacancy rate; significant blight and disinvestment. 14% of the land area in the neighborhood is vacant compared with a 5% vacancy rate for the City overall
3. Provide infill housing that encourages private investment, strengthens the neighborhood fabric and promotes private investment.
S1: PHA to lead process to identify private development partners for assembled properties S2: Unbundle development opportunities into project sizes that small local developers can successfully compete S3: Create a marketing strategy to attract investment S4: Lead a developers bootcamp to help prepare small local developers to participate
Total number of units occupied. Percent vacancy rates pre and post development.
Total number of newly constructed or rehabilitated units that do not replace any previous Public Housing
A range of development partners
from larger organizations to small for profit and non-profit developers
% of development dollars going to local developers
A range of unit types Photos of existing neighborhood blight and disinvestment Image Source: WRT

Impact of Housing Development Activities Opportunities to Create a “Neighborhood of Choice”
• One-for-one replacement of Blumberg housing in new, modern
properties
• New Housing on now vacant sites
• Development of mixed-income rental and for-sale housing
• A viable neighborhood for residents of all incomes, ages, and
ethnicities
More Patrons for Retail Stores and Service Establishments
• New retail comes after there are more customers
• Better stores, more selection
• Additional jobs at new establishments
Support for Schools, Community Facilities, and Recreation
11
Page 11
Need Goal Strategy Outcome/Measure
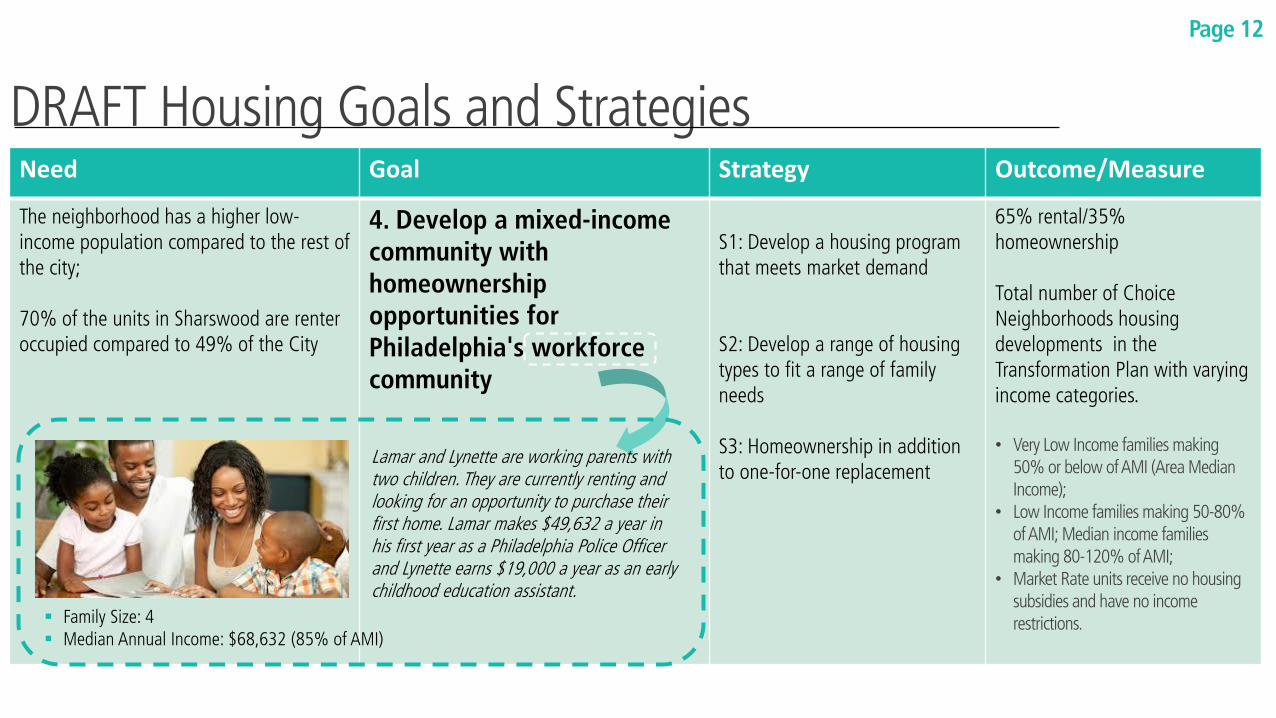
The neighborhood has a higher low-income population compared to the rest of the city; 70% of the units in Sharswood are renter occupied compared to 49% of the City
4. Develop a mixed-income community with homeownership opportunities for Philadelphia's workforce community
S1: Develop a housing program that meets market demand S2: Develop a range of housing types to fit a range of family needs S3: Homeownership in addition to one-for-one replacement
65% rental/35% homeownership Total number of Choice Neighborhoods housing developments in the Transformation Plan with varying income categories. • Very Low Income families making
50% or below of AMI (Area Median Income);
• Low Income families making 50-80% of AMI; Median income families making 80-120% of AMI;
• Market Rate units receive no housing subsidies and have no income restrictions.
DRAFT Housing Goals and Strategies
Page 12
Lamar and Lynette are working parents with two children. They are currently renting and looking for an opportunity to purchase their first home. Lamar makes $49,632 a year in his first year as a Philadelphia Police Officer and Lynette earns $19,000 a year as an early childhood education assistant.
Family Size: 4 Median Annual Income: $68,632 (85% of AMI)
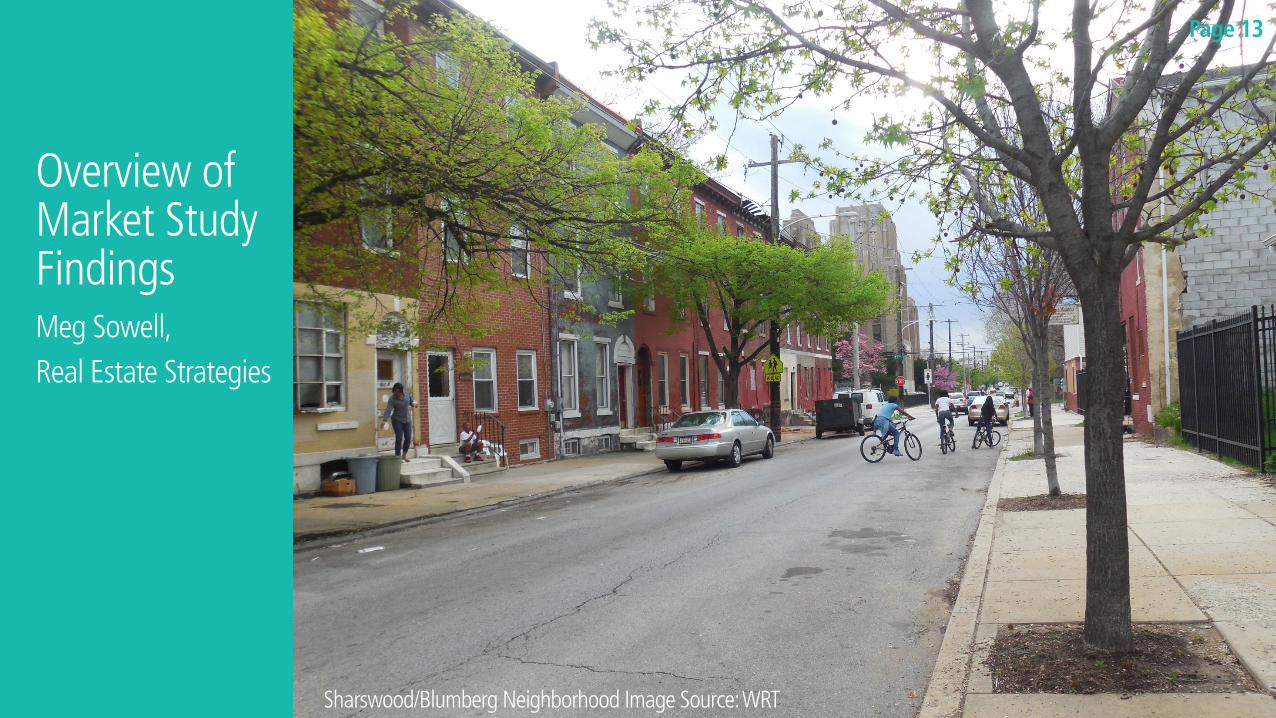
Overview of Market Study Findings Meg Sowell,
Real Estate Strategies
Sharswood/Blumberg Neighborhood Image Source: WRT
Page 13
Overview of Market Study Findings Meg Sowell,
Real Estate Strategies
14
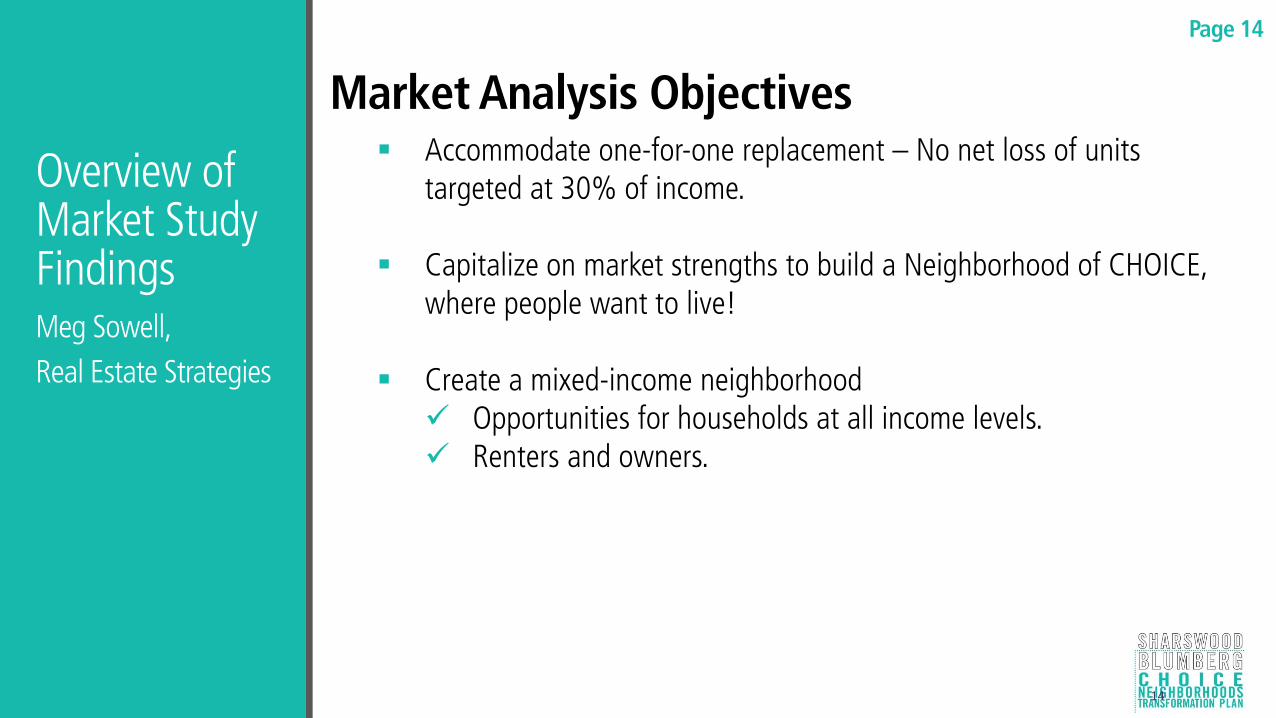
Market Analysis Objectives Accommodate one-for-one replacement – No net loss of units
targeted at 30% of income. Capitalize on market strengths to build a Neighborhood of CHOICE,
where people want to live! Create a mixed-income neighborhood
Opportunities for households at all income levels. Renters and owners.
Page 14
Overview of Market Study Findings Meg Sowell,
Real Estate Strategies
15
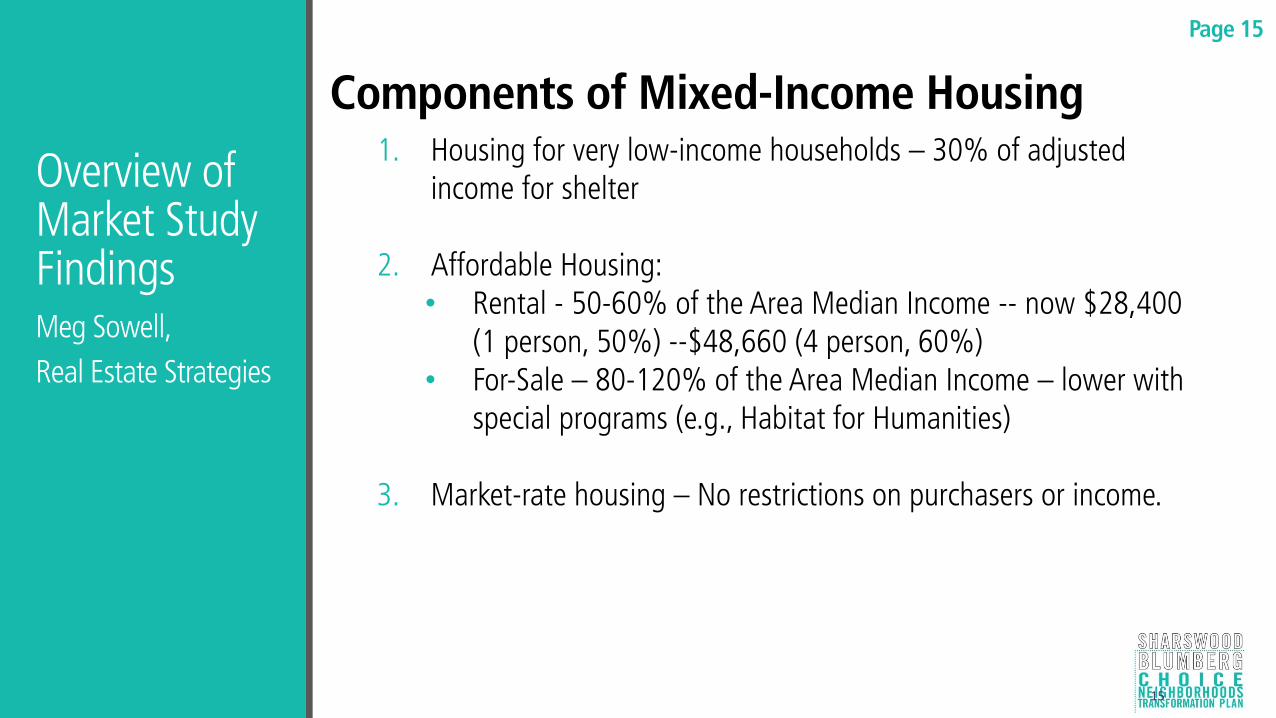
Components of Mixed-Income Housing 1. Housing for very low-income households – 30% of adjusted
income for shelter
2. Affordable Housing: • Rental - 50-60% of the Area Median Income -- now $28,400
(1 person, 50%) --$48,660 (4 person, 60%) • For-Sale – 80-120% of the Area Median Income – lower with
special programs (e.g., Habitat for Humanities) 3. Market-rate housing – No restrictions on purchasers or income.
Page 15

Choice Neighborhood Boundary and Blumberg Apartments
Primary Market Area and the Choice Neighborhood Boundary
Overview of Market Study Findings Meg Sowell,
Real Estate Strategies
16
Market Underpinnings Demographics
Choice Planning Area North Philadelphia Market Area City of Philadelphia – Broader
Setting
Housing Demand
Performance of Rental and For-Sale Housing
Page 16
Overview of Market Study Findings Meg Sowell,
Real Estate Strategies
17
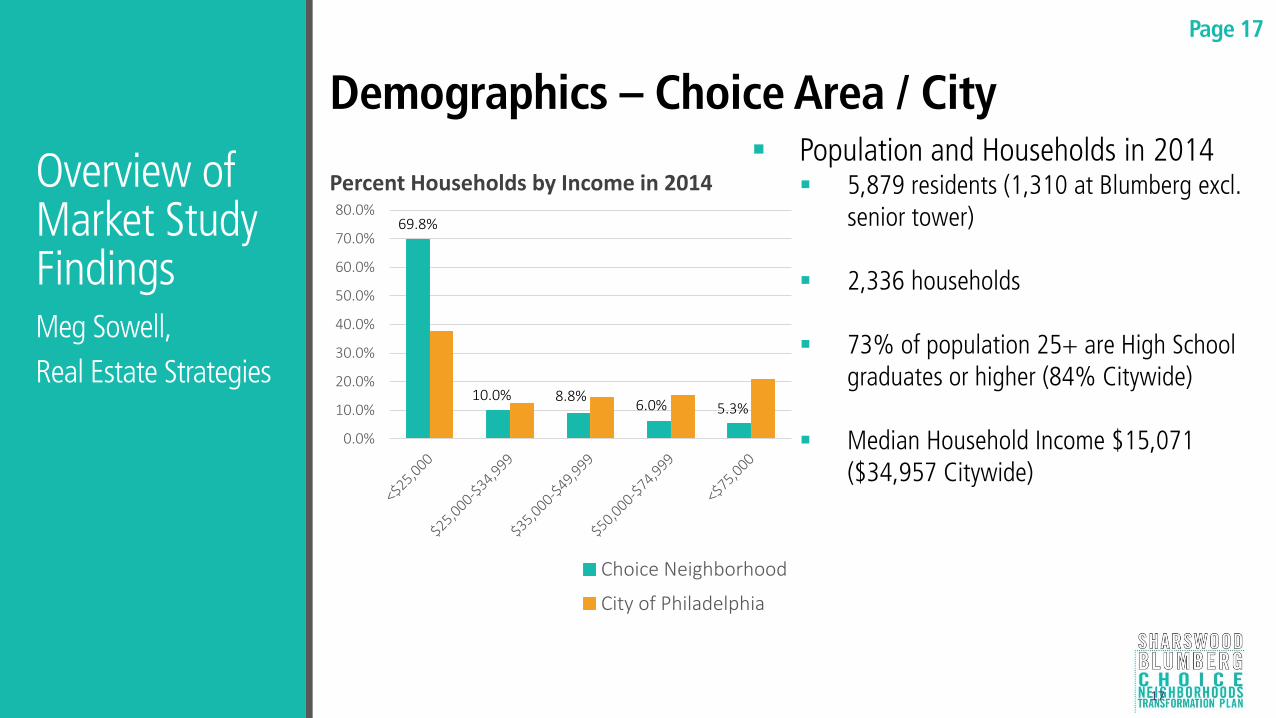
Demographics – Choice Area / City Population and Households in 2014
5,879 residents (1,310 at Blumberg excl. senior tower)
2,336 households 73% of population 25+ are High School
graduates or higher (84% Citywide)
Median Household Income $15,071 ($34,957 Citywide)
69.8%
10.0% 8.8% 6.0% 5.3%
0.0%
10.0%
20.0%
30.0%
40.0%
50.0%
60.0%
70.0%
80.0%
Choice Neighborhood
City of Philadelphia
Percent Households by Income in 2014
Page 17

Overview of Market Study Findings Meg Sowell,
Real Estate Strategies
18
Demographics – Choice Area (Age)
Median Age –
Neighborhood 31.7 years
Citywide 34.1 years
956 Choice Area Households 55+
29% Youth Population (Under 18)
Single Female with Children
Neighborhood 29%
Citywide 14%
2013 Percent of Population by Age
8.9%
19.9%
59.7%
11.5%
0.0%
10.0%
20.0%
30.0%
40.0%
50.0%
60.0%
70.0%
Under 5(1-4)
Under 18(5-17)
WorkingAge
(18-64)
Aging(65+)
Page 18

Overview of Market Study Findings Meg Sowell,
Real Estate Strategies
19
Choice Area Housing and Households
Housing Units in 2014
Total = 2,905
Vacant = 536 (19.6%) vs. 10.3% Citywide
Housing Tenure in 2014
Homeowners = 29.8% vs. 52.3% Citywide
Renters = 70.2% vs. 47.7% Citywide
In 2010, 345 Choice Area owner households
were 55+ years old!
Number Percent
1-Person 841 37.4%
2-Person 524 23.3%
3-Person 348 15.5%
4-Person 245 10.9%
5-Person 151 6.7%
6-Person 80 3.6%
7+ Person 61 2.7%
Total Households 2,250
Household Size - 2010 Census
• Small Households = 1-2 Bedrooms • Smaller number with 3-4 Bedrooms
Page 19
Overview of Market Study Findings Meg Sowell,
Real Estate Strategies
20
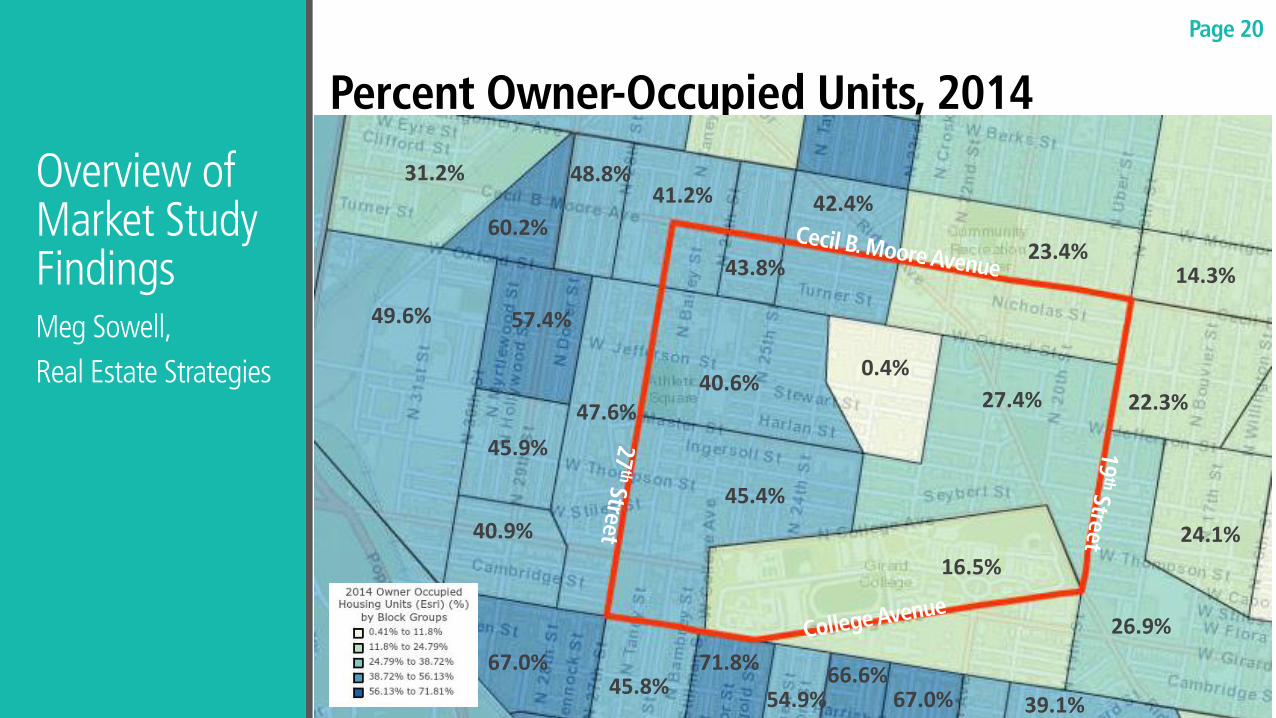
Percent Owner-Occupied Units, 2014
31.2%
49.6%
60.2%
57.4%
45.9%
40.9%
67.0% 45.8%
71.8%
54.9% 66.6%
67.0% 39.1%
26.9%
24.1%
22.3%
14.3% 23.4%
42.4%
0.4%
27.4%
16.5%
45.4%
40.6%
48.8% 41.2%
43.8%
47.6%
Page 20

Overview of Market Study Findings Meg Sowell,
Real Estate Strategies
21
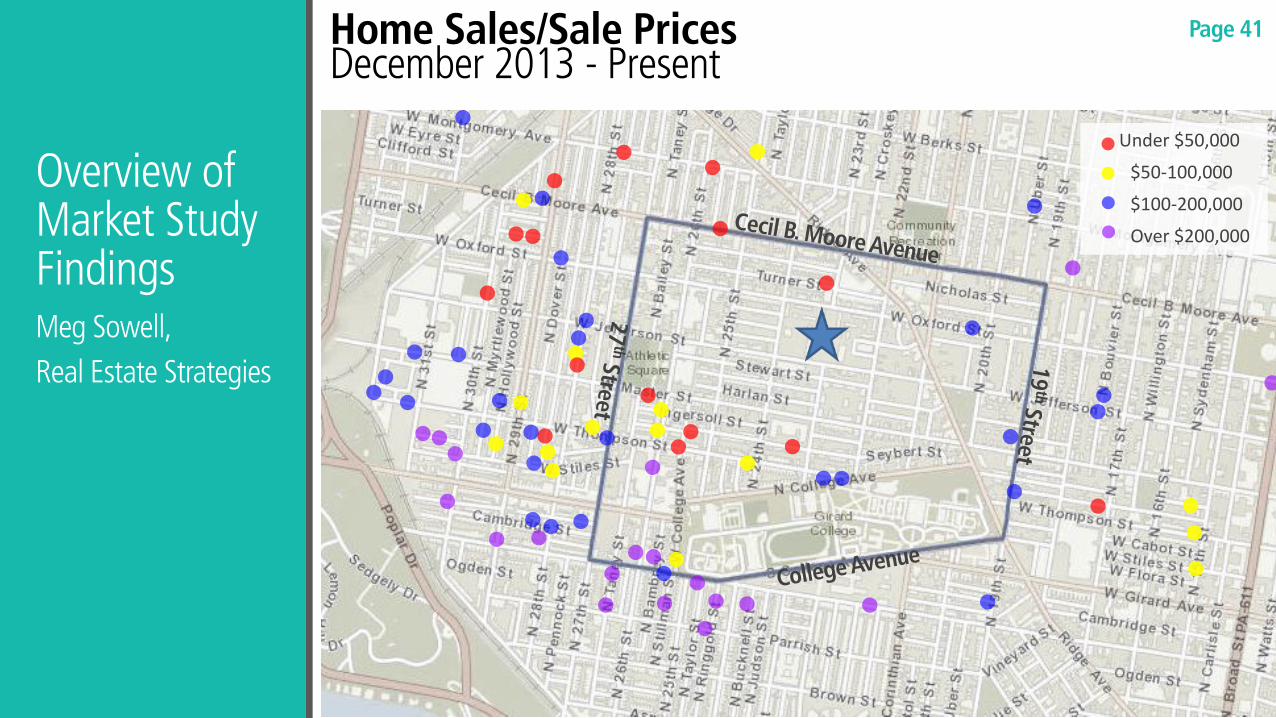
Home Sales/Sale Prices December 2013 - Present
Under $50,000
$50-100,000
$100-200,000
Over $200,000
Page 21
Overview of Market Study Findings Meg Sowell,
Real Estate Strategies
22
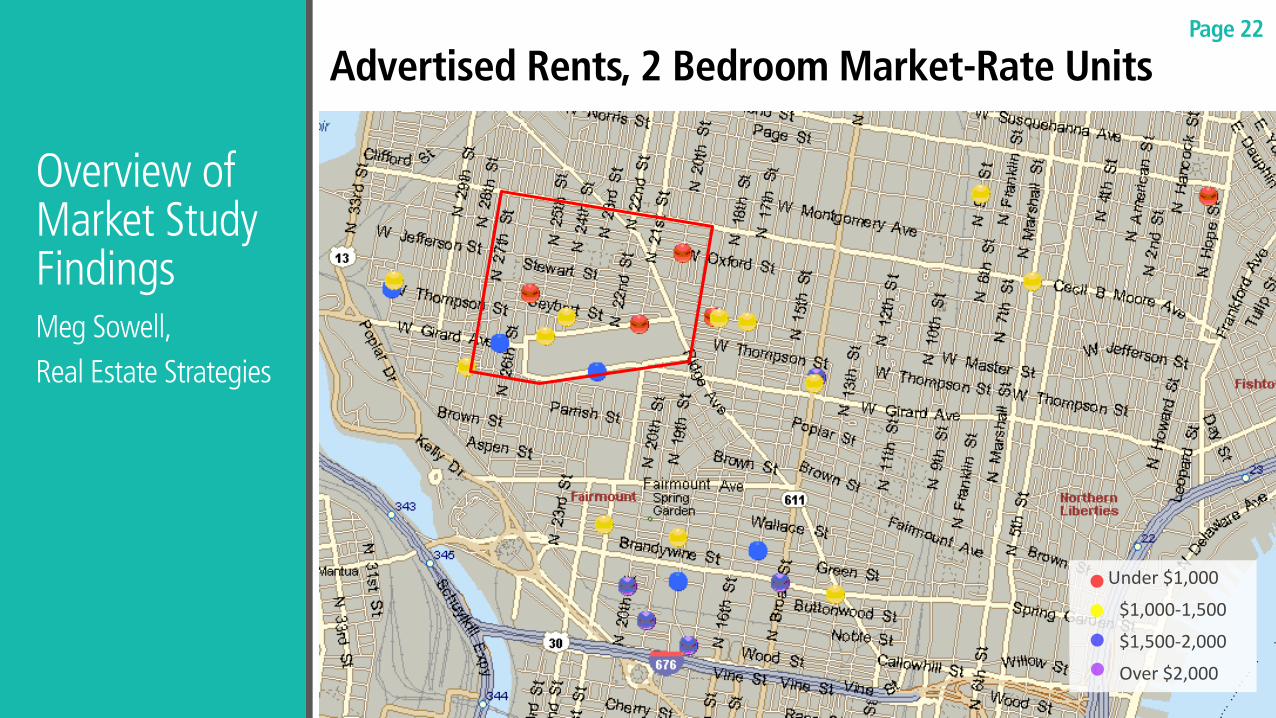
Advertised Rents, 2 Bedroom Market-Rate Units
Under $1,000
$1,000-1,500
$1,500-2,000
Over $2,000
Page 22
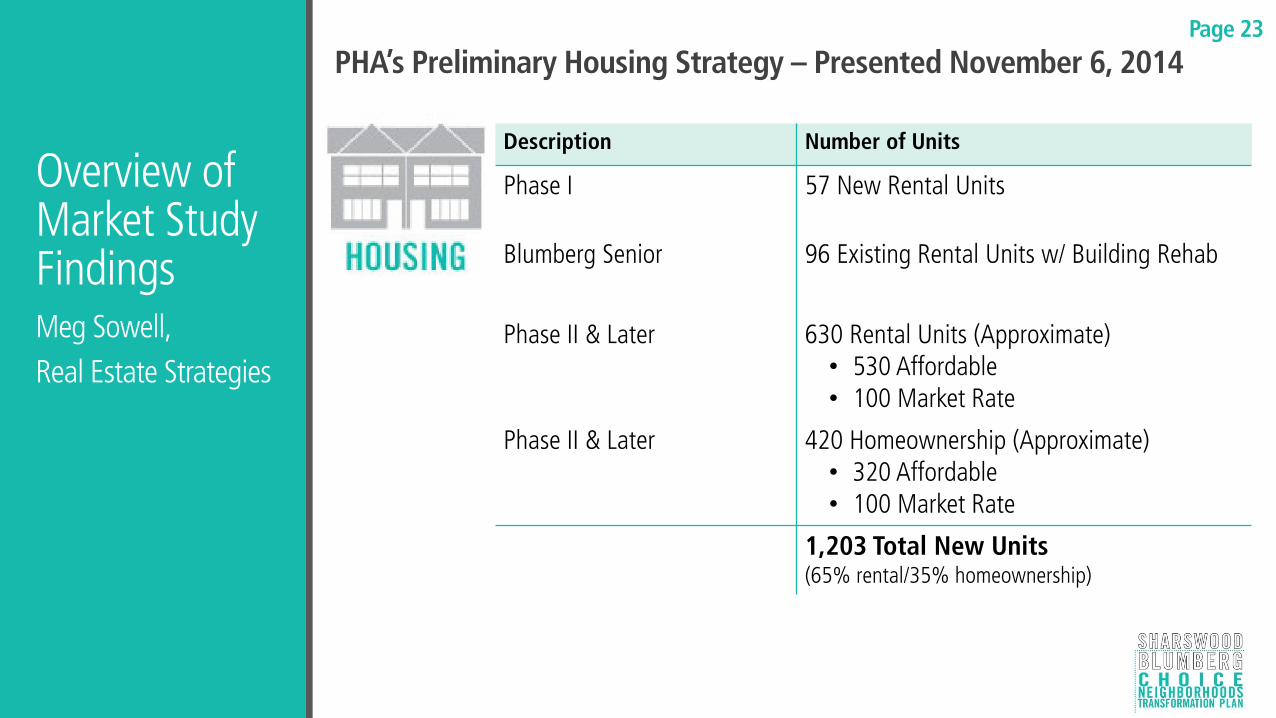
PHA’s Preliminary Housing Strategy – Presented November 6, 2014
Description Number of Units
Phase I 57 New Rental Units
Blumberg Senior 96 Existing Rental Units w/ Building Rehab
Phase II & Later 630 Rental Units (Approximate) • 530 Affordable • 100 Market Rate
Phase II & Later 420 Homeownership (Approximate) • 320 Affordable • 100 Market Rate
1,203 Total New Units (65% rental/35% homeownership)
Page 23
Overview of Market Study Findings Meg Sowell,
Real Estate Strategies
Overview of Market Study Findings Meg Sowell,
Real Estate Strategies
24
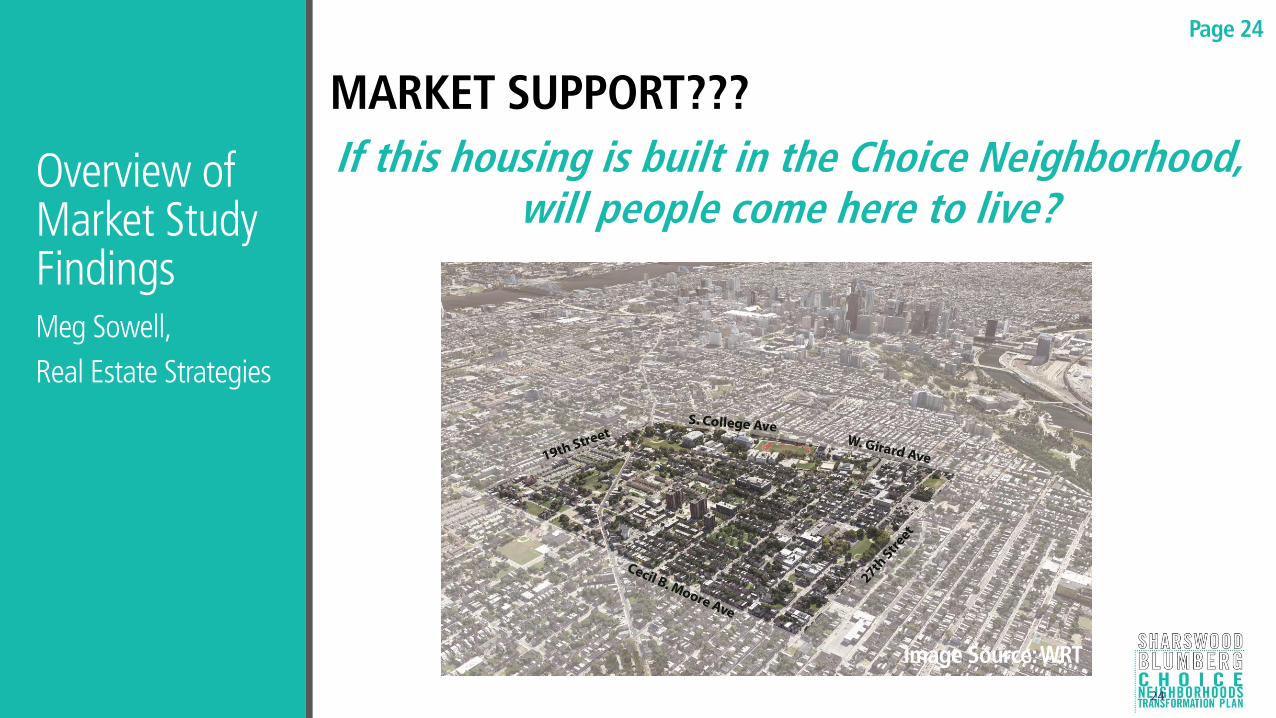
MARKET SUPPORT???
If this housing is built in the Choice Neighborhood, will people come here to live?
Page 24
Image Source: WRT
Overview of Market Study Findings Meg Sowell,
Real Estate Strategies
25
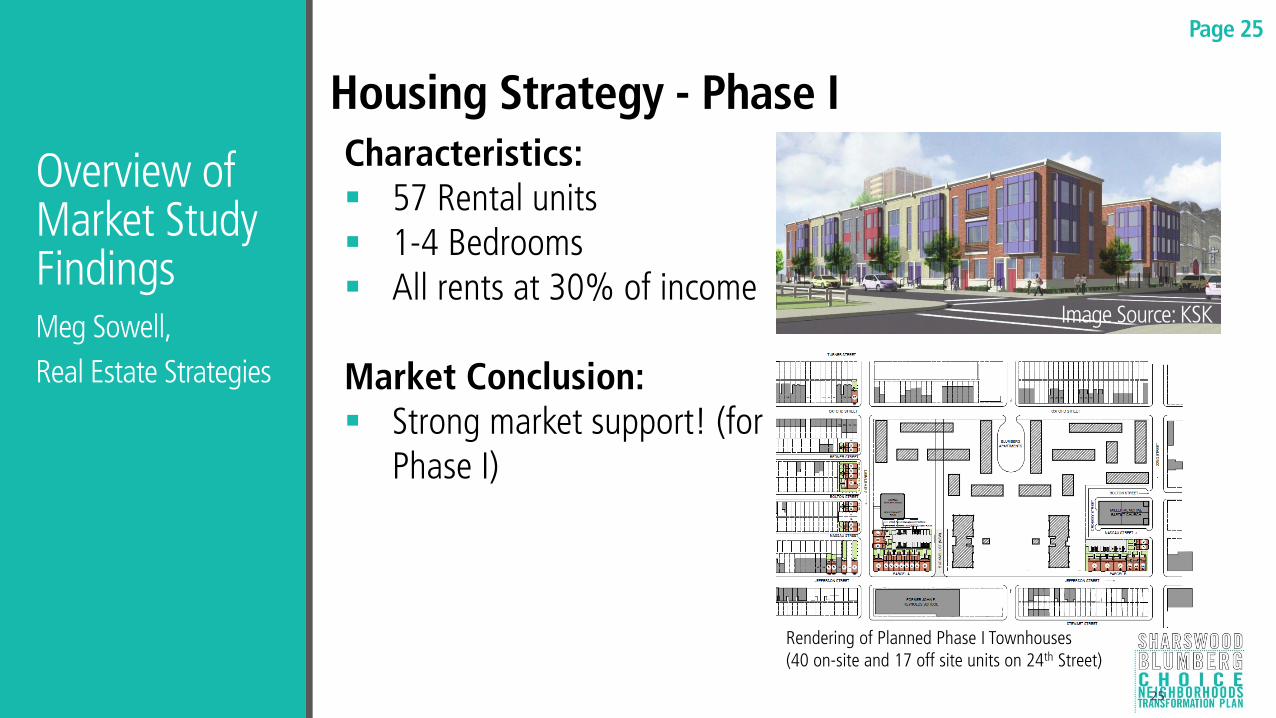
Housing Strategy - Phase I Characteristics: 57 Rental units 1-4 Bedrooms All rents at 30% of income Market Conclusion: Strong market support! (for
Phase I)
Rendering of Planned Phase I Townhouses (40 on-site and 17 off site units on 24th Street)
Image Source: KSK
Page 25
Overview of Market Study Findings Meg Sowell,
Real Estate Strategies
26
Housing Strategy – Blumberg Senior and More Senior Housing!
Proposed Development Renovations of the existing 96-unit building; likely to improve occupancy. Property will benefit from positive neighborhood change.
Market Conditions More than 7,200 seniors 55+ in the Market Area with incomes below
$15,000. Market Area senior properties had few – or no vacancies when surveyed.
Most had no vacancies. Waiting lists were very long for properties with rents at 30% of income,
but shorter for properties with higher rents.
Page 26
Overview of Market Study Findings Meg Sowell,
Real Estate Strategies
27
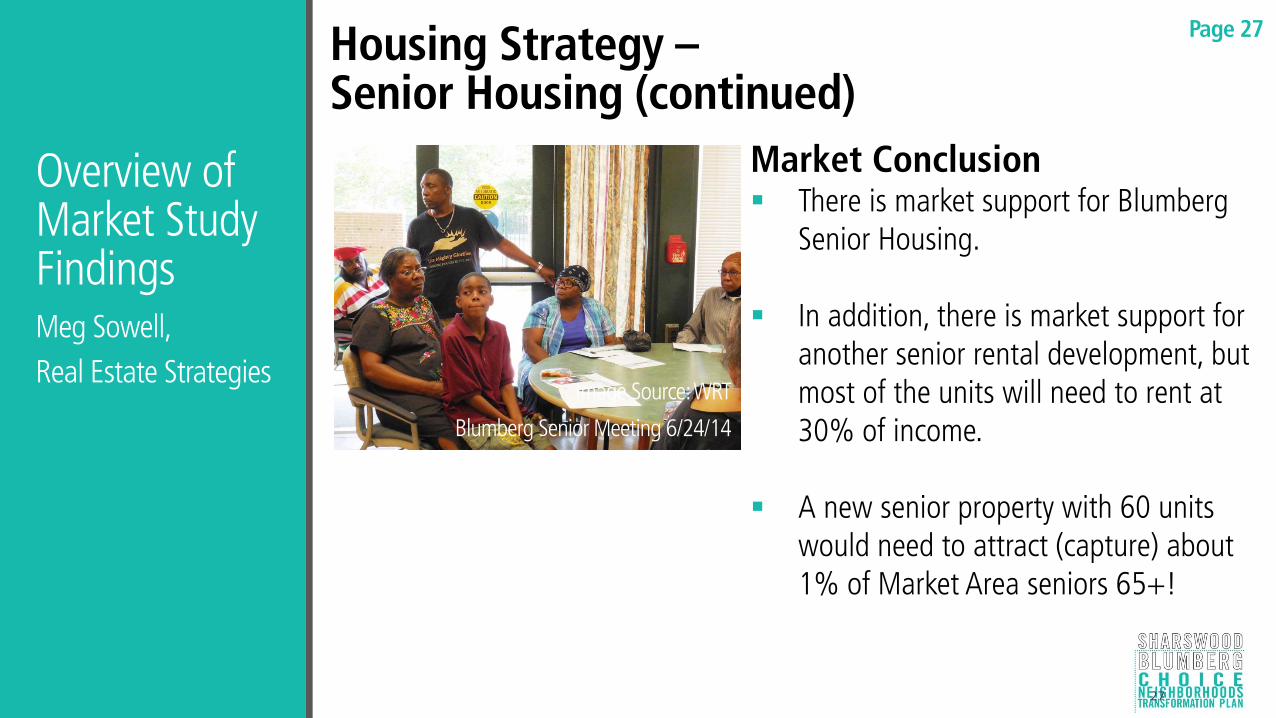
Housing Strategy – Senior Housing (continued)
Market Conclusion There is market support for Blumberg
Senior Housing. In addition, there is market support for
another senior rental development, but most of the units will need to rent at 30% of income.
A new senior property with 60 units
would need to attract (capture) about 1% of Market Area seniors 65+!
Image Source: WRT
Blumberg Senior Meeting 6/24/14
Page 27

Overview of Market Study Findings Meg Sowell,
Real Estate Strategies
Housing Strategy Rental Housing – Phase II and Later
Proposed Development (PHA Proposal): 630 Rental Units (Approximate) 530 Affordable + 100 Market-Rate
Target 348 of 530 Affordable for one-to-one replacement with rents at 30% of income. (405 existing-57Phase = 348 units)
Market Conditions
Almost 18,000 non-elderly market area households have incomes below $25,000. Housing complexes charging 30% of income are full with long waiting lists. PHA’s average wait times are 8+ years at most properties.
Market Conclusion - Ample Market Support!
Include handicap-accessible units for non-elderly families with disabled member in other developments.
Page 28
Overview of Market Study Findings Meg Sowell,
Real Estate Strategies
Phase II Rental Housing (continued) Proposed development (remainder of Phase II Rentals in PHA
Proposal) after one-for-one replacement: 182 Affordable = Tax Credits to reduce rents 100 Market-Rate
Market Recommendation: A better balance of affordable and market-rate may be more
appropriate to achieve the objective of Mixed-Income Housing
Page 29
Overview of Market Study Findings Meg Sowell,
Real Estate Strategies
Phase II Rental Housing (continued) Proposed Revision – Recommended:
150 Units with Low-Income Housing Tax Credits (LIHTCs) =
Slight reduction
150 Units market-rate = at least 50 additional units
Increase by decreasing sales housing (to be discussed soon).
Page 30
Overview of Market Study Findings Meg Sowell,
Real Estate Strategies
31
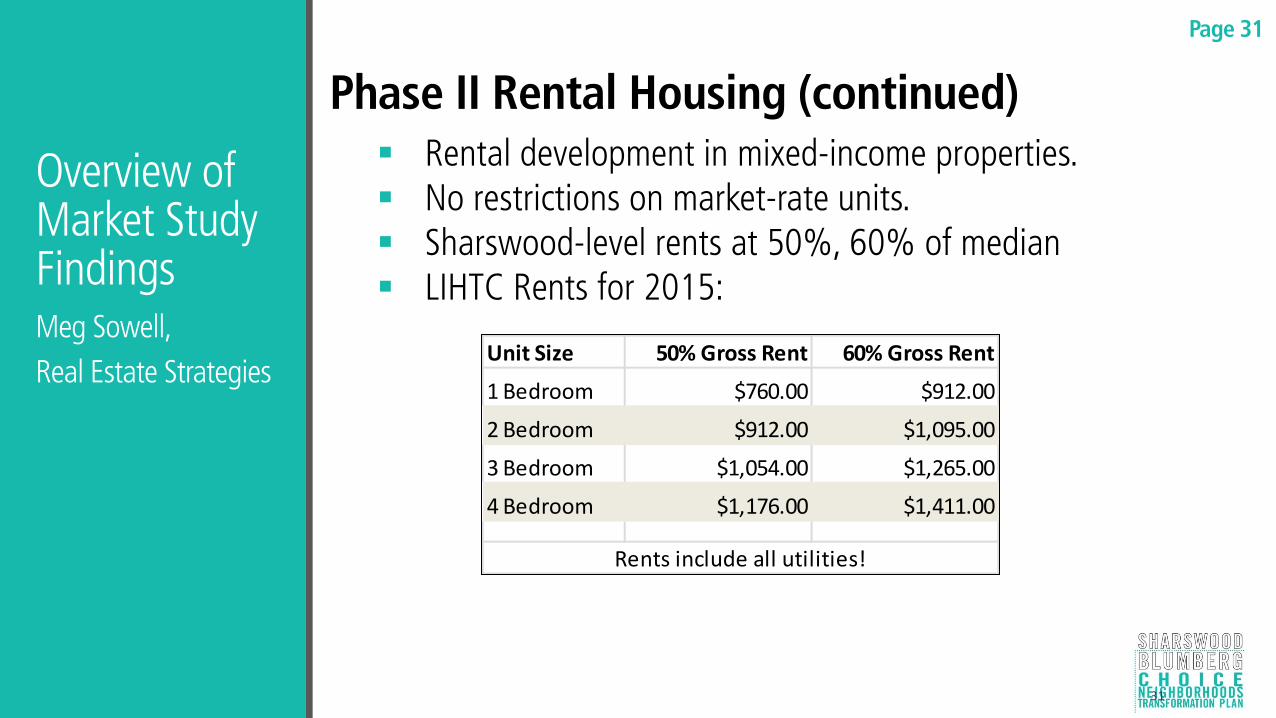
Phase II Rental Housing (continued) Rental development in mixed-income properties. No restrictions on market-rate units. Sharswood-level rents at 50%, 60% of median LIHTC Rents for 2015:
Unit Size 50% Gross Rent 60% Gross Rent
1 Bedroom $760.00 $912.00
2 Bedroom $912.00 $1,095.00
3 Bedroom $1,054.00 $1,265.00
4 Bedroom $1,176.00 $1,411.00
Rents include all utilities!
Page 31
Overview of Market Study Findings Meg Sowell,
Real Estate Strategies
32
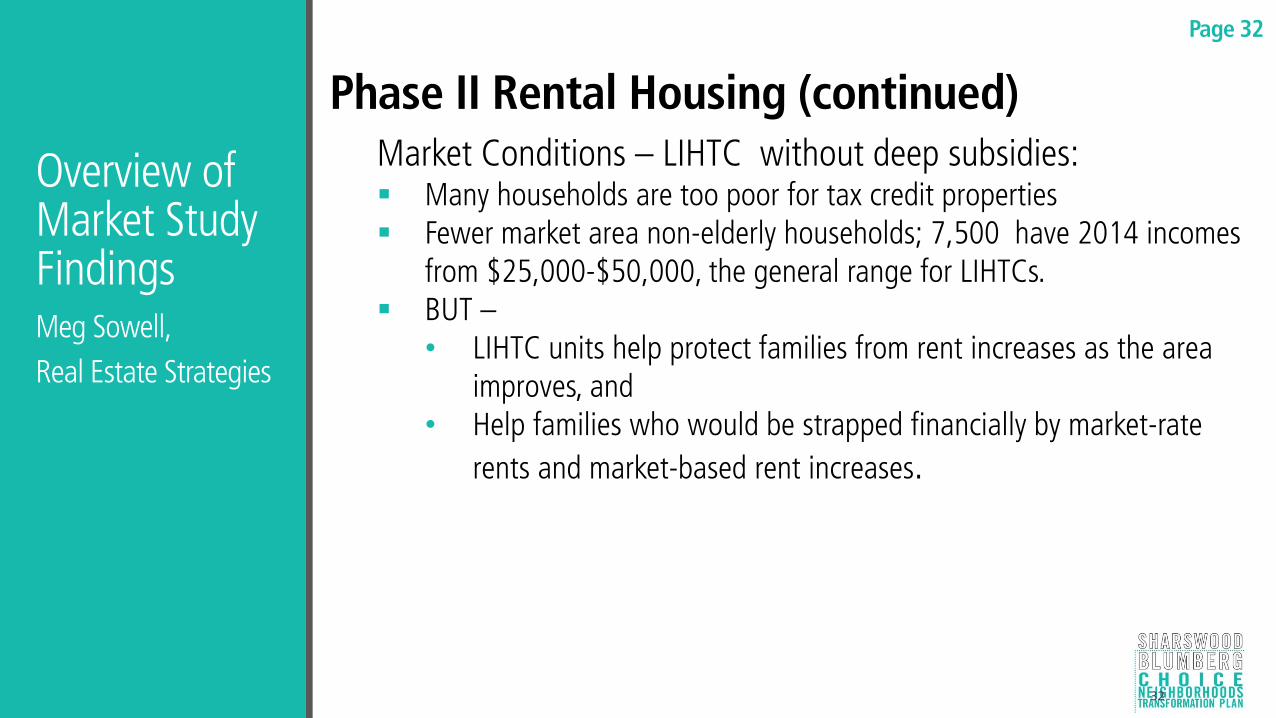
Phase II Rental Housing (continued) Market Conditions – LIHTC without deep subsidies: Many households are too poor for tax credit properties Fewer market area non-elderly households; 7,500 have 2014 incomes
from $25,000-$50,000, the general range for LIHTCs. BUT –
• LIHTC units help protect families from rent increases as the area improves, and
• Help families who would be strapped financially by market-rate
rents and market-based rent increases.
Page 32
Overview of Market Study Findings Meg Sowell,
Real Estate Strategies
33
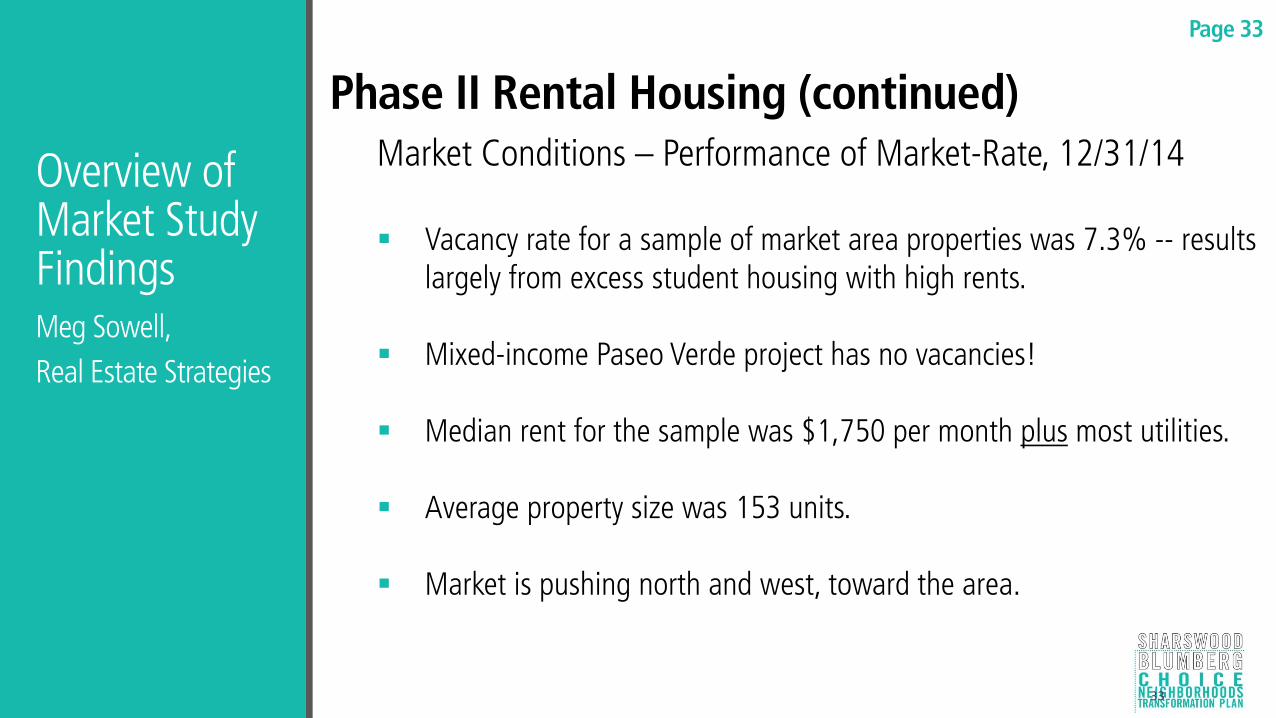
Phase II Rental Housing (continued) Market Conditions – Performance of Market-Rate, 12/31/14 Vacancy rate for a sample of market area properties was 7.3% -- results
largely from excess student housing with high rents.
Mixed-income Paseo Verde project has no vacancies!
Median rent for the sample was $1,750 per month plus most utilities.
Average property size was 153 units.
Market is pushing north and west, toward the area.
Page 33

Overview of Market Study Findings Meg Sowell,
Real Estate Strategies
34
Phase II Rental Housing (continued) Market Conclusions: Choice area can be competitive for market-rate units in a
mixed-income setting. • Can capture households with Center City workers. • Will need to be priced competitively in relation to Art Museum,
Northern Liberties.
Location within the area will be a critical key to pricing and market success. • Market rate units in well located mixed-income rental properties can
command rents from $1,250 - $1,500 • Price depends on location, unit sizes, features, amenities!
Page 34
Overview of Market Study Findings Meg Sowell,
Real Estate Strategies
35
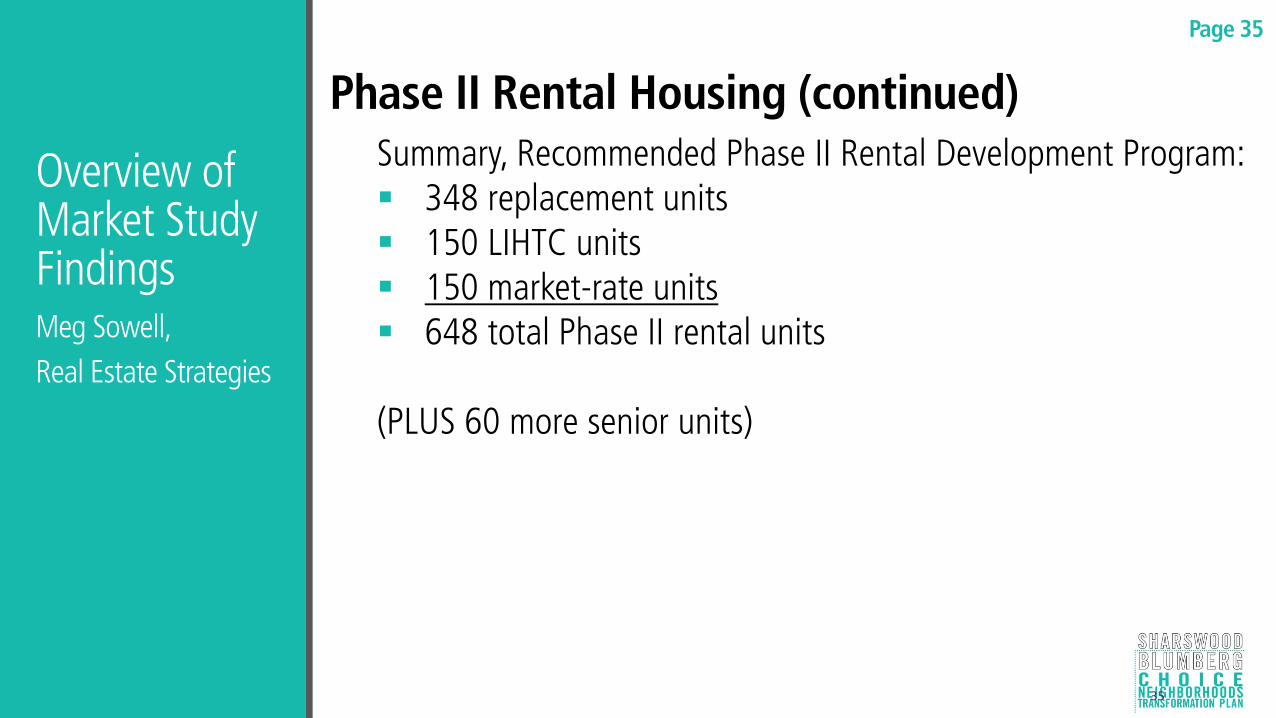
Phase II Rental Housing (continued) Summary, Recommended Phase II Rental Development Program: 348 replacement units 150 LIHTC units 150 market-rate units 648 total Phase II rental units
(PLUS 60 more senior units)
Page 35
Overview of Market Study Findings Meg Sowell,
Real Estate Strategies
36
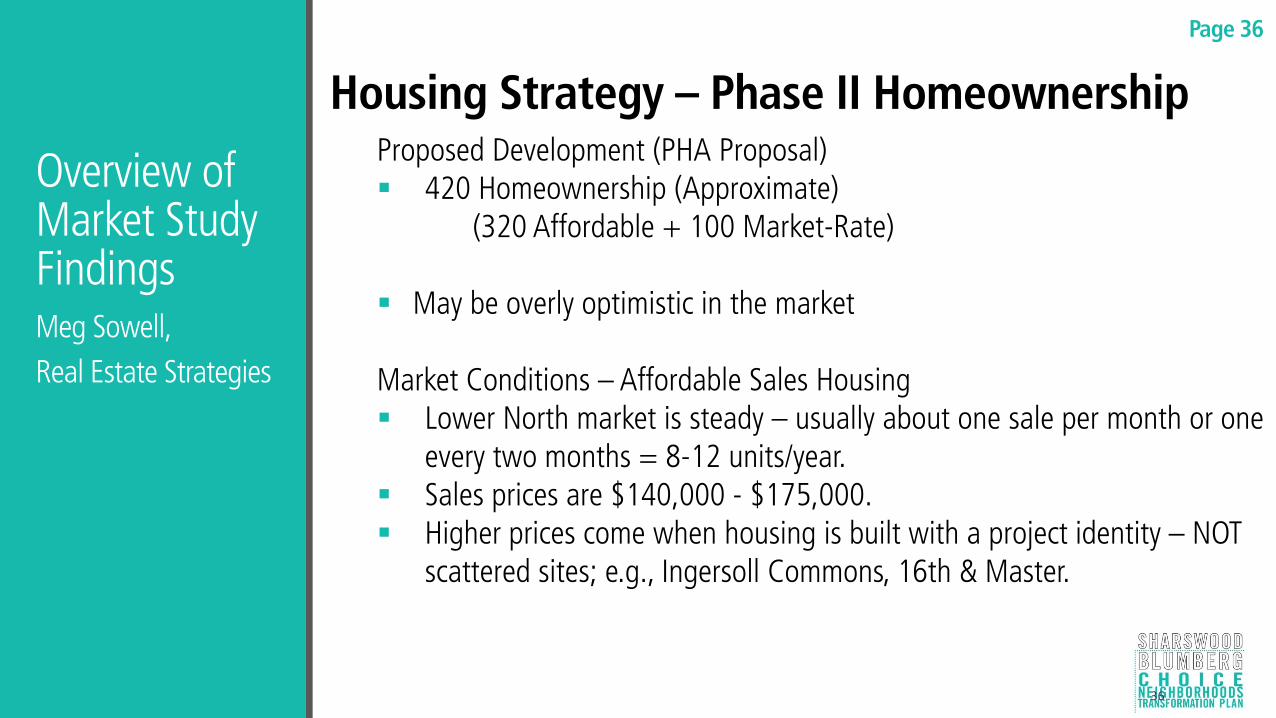
Housing Strategy – Phase II Homeownership Proposed Development (PHA Proposal) 420 Homeownership (Approximate) (320 Affordable + 100 Market-Rate) May be overly optimistic in the market Market Conditions – Affordable Sales Housing Lower North market is steady – usually about one sale per month or one
every two months = 8-12 units/year. Sales prices are $140,000 - $175,000. Higher prices come when housing is built with a project identity – NOT
scattered sites; e.g., Ingersoll Commons, 16th & Master.
Page 36
Overview of Market Study Findings Meg Sowell,
Real Estate Strategies
37
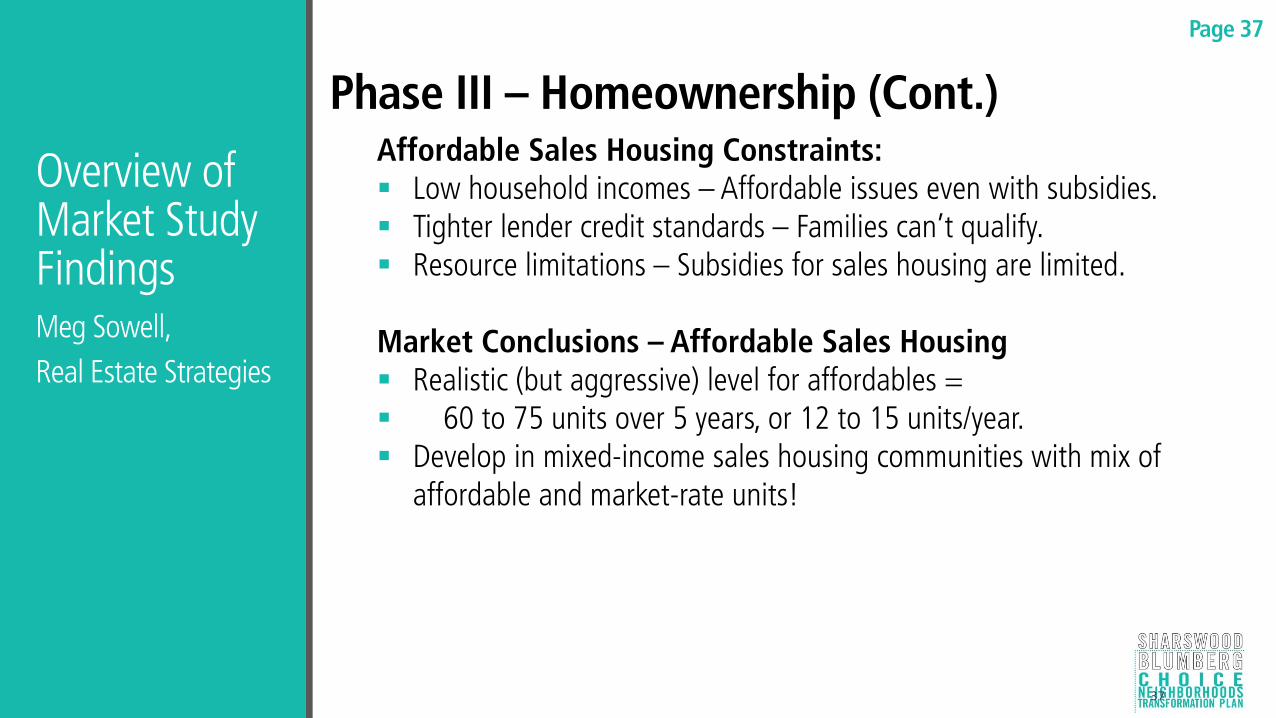
Phase III – Homeownership (Cont.) Affordable Sales Housing Constraints: Low household incomes – Affordable issues even with subsidies. Tighter lender credit standards – Families can’t qualify. Resource limitations – Subsidies for sales housing are limited. Market Conclusions – Affordable Sales Housing Realistic (but aggressive) level for affordables = 60 to 75 units over 5 years, or 12 to 15 units/year. Develop in mixed-income sales housing communities with mix of
affordable and market-rate units!
Page 37

Overview of Market Study Findings Meg Sowell,
Real Estate Strategies
38
Phase III – Homeownership (Cont.) Market-Rate Sales Housing – Prices in Zip 19121 are increasing.
Page 38
Overview of Market Study Findings Meg Sowell,
Real Estate Strategies
39
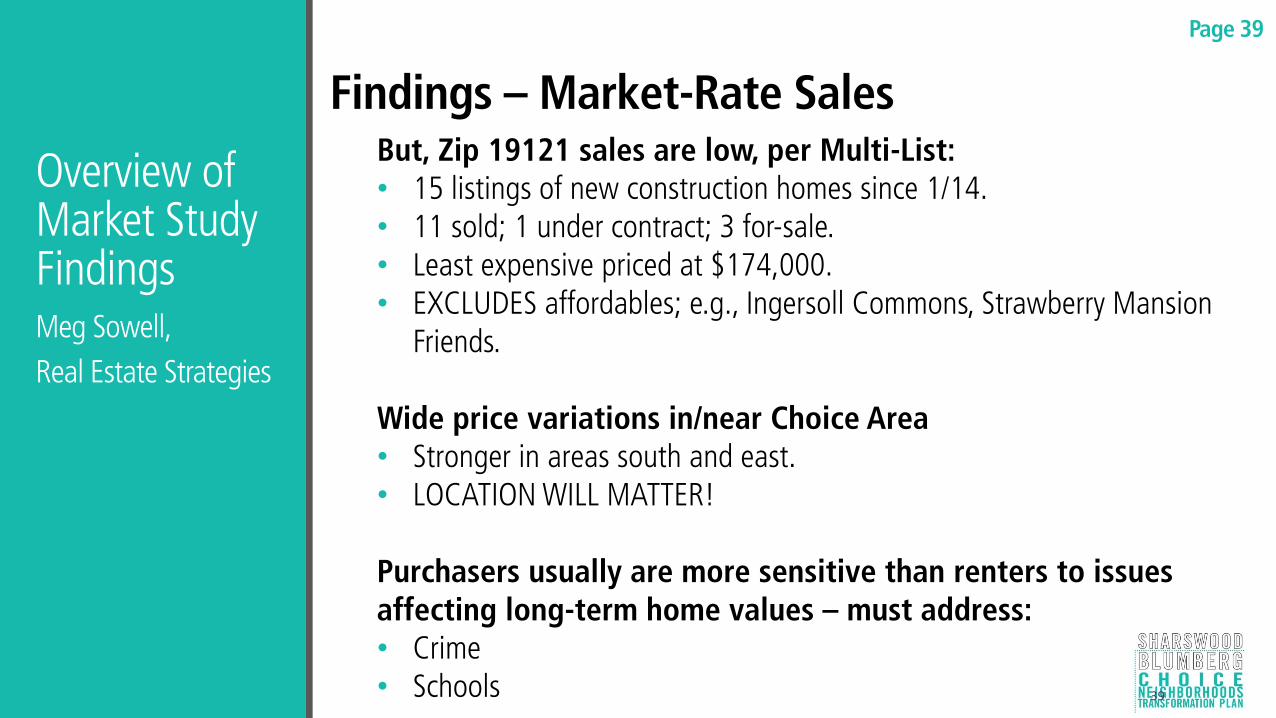
Findings – Market-Rate Sales But, Zip 19121 sales are low, per Multi-List: • 15 listings of new construction homes since 1/14. • 11 sold; 1 under contract; 3 for-sale. • Least expensive priced at $174,000. • EXCLUDES affordables; e.g., Ingersoll Commons, Strawberry Mansion
Friends.
Wide price variations in/near Choice Area • Stronger in areas south and east. • LOCATION WILL MATTER!
Purchasers usually are more sensitive than renters to issues affecting long-term home values – must address: • Crime • Schools
Page 39

Overview of Market Study Findings Meg Sowell,
Real Estate Strategies
40
Recent Home Sales – Trulia
Page 40
Overview of Market Study Findings Meg Sowell,
Real Estate Strategies
41
Home Sales/Sale Prices December 2013 - Present
Under $50,000
$50-100,000
$100-200,000
Over $200,000
Page 41
Overview of Market Study Findings Meg Sowell,
Real Estate Strategies
42
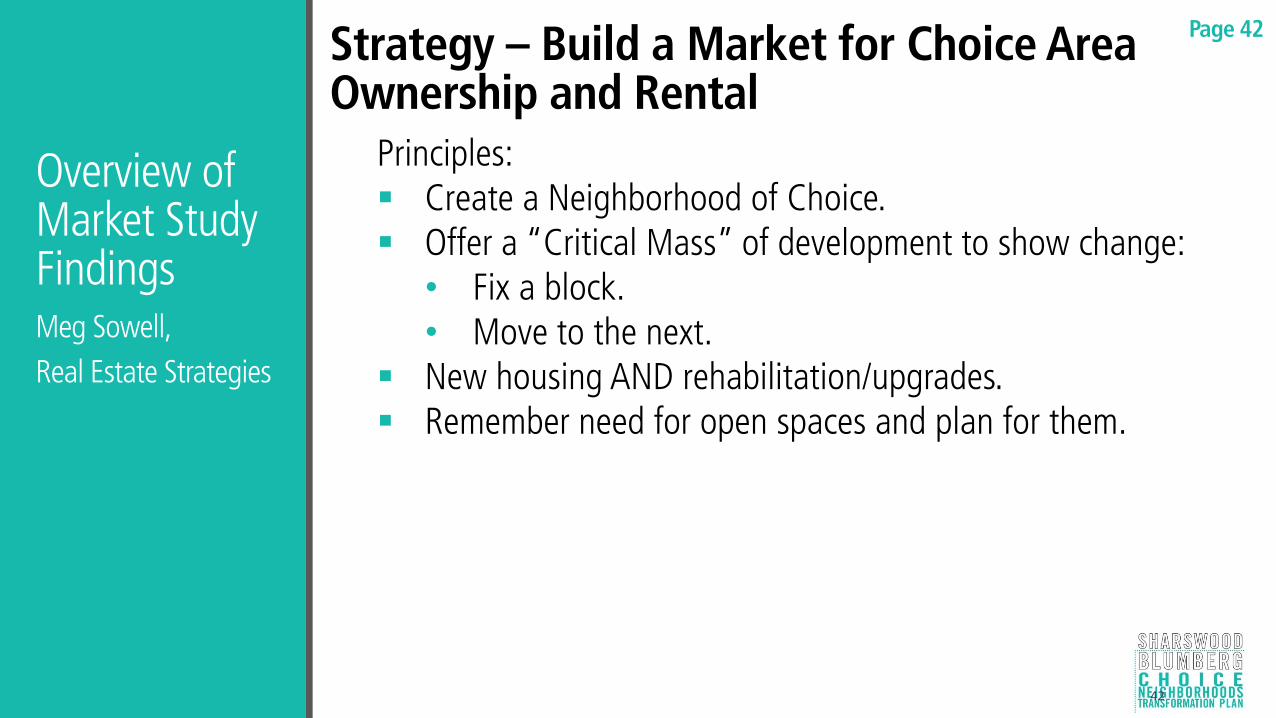
Strategy – Build a Market for Choice Area Ownership and Rental
Principles: Create a Neighborhood of Choice. Offer a “Critical Mass” of development to show change:
• Fix a block. • Move to the next.
New housing AND rehabilitation/upgrades. Remember need for open spaces and plan for them.
Page 42
Overview of Market Study Findings Meg Sowell,
Real Estate Strategies
43
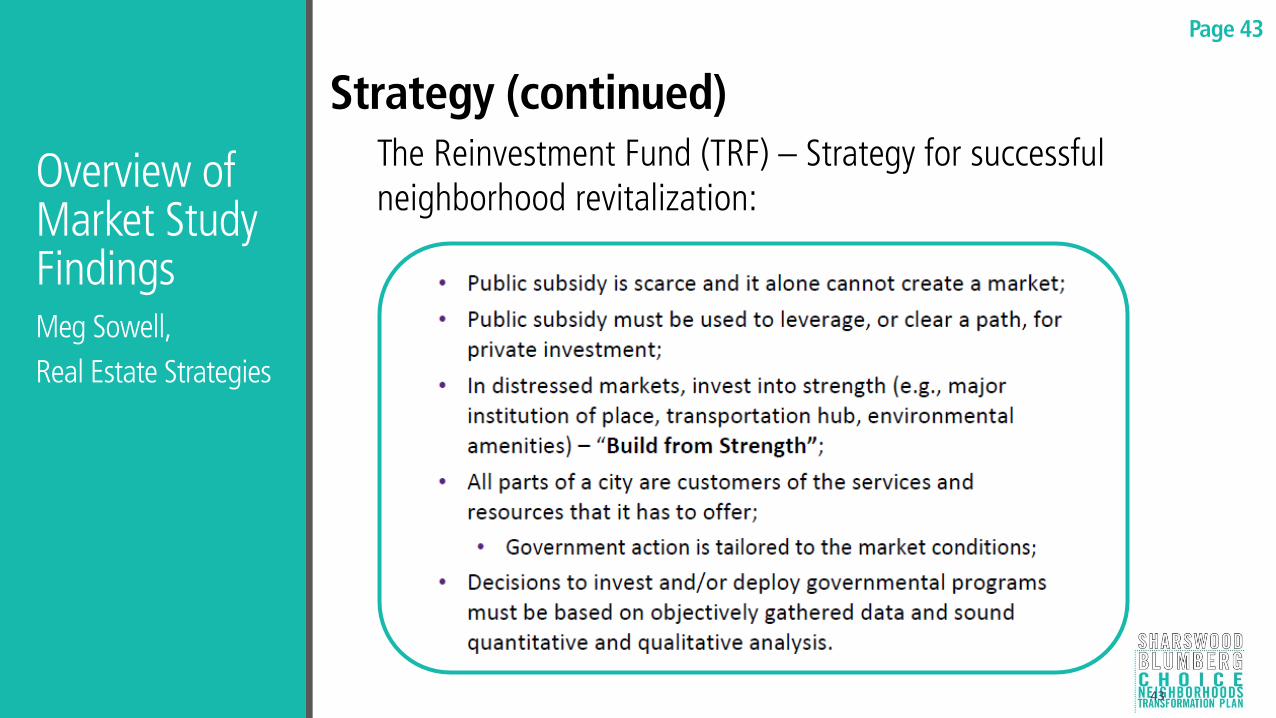
Strategy (continued) The Reinvestment Fund (TRF) – Strategy for successful neighborhood revitalization:
Page 43
Overview of Market Study Findings Meg Sowell,
Real Estate Strategies
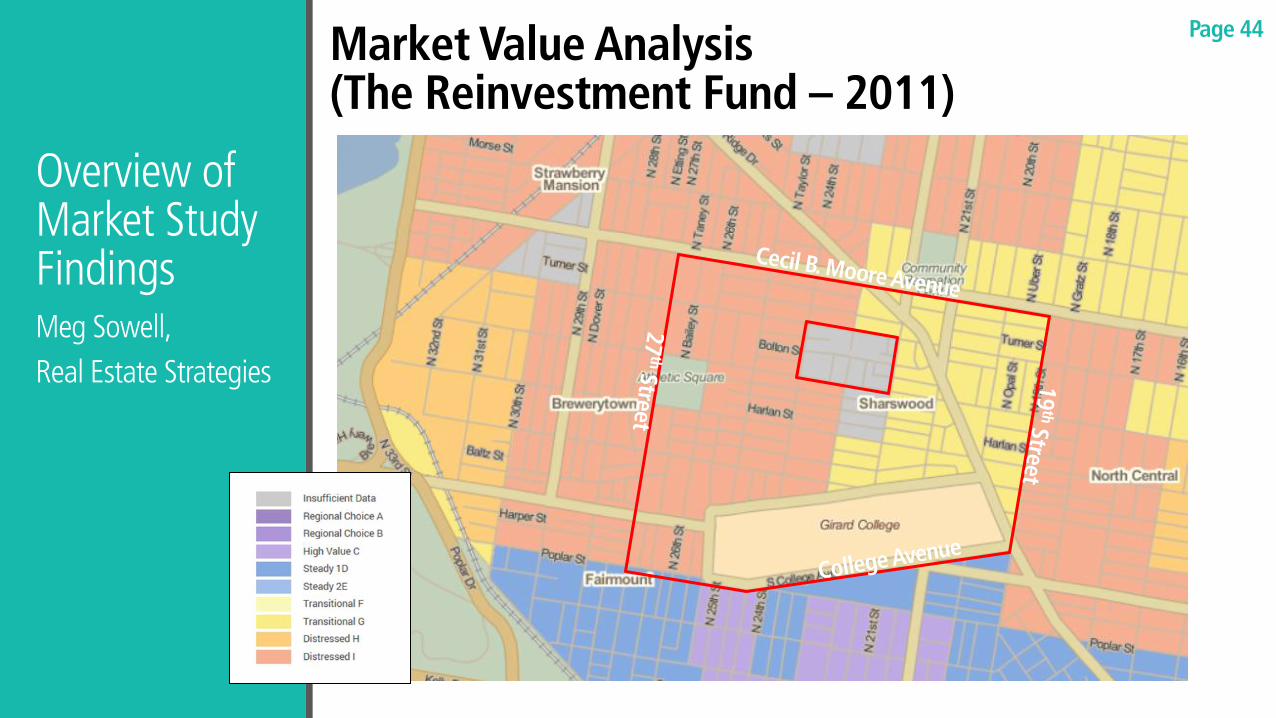
Market Value Analysis (The Reinvestment Fund – 2011)
Page 44
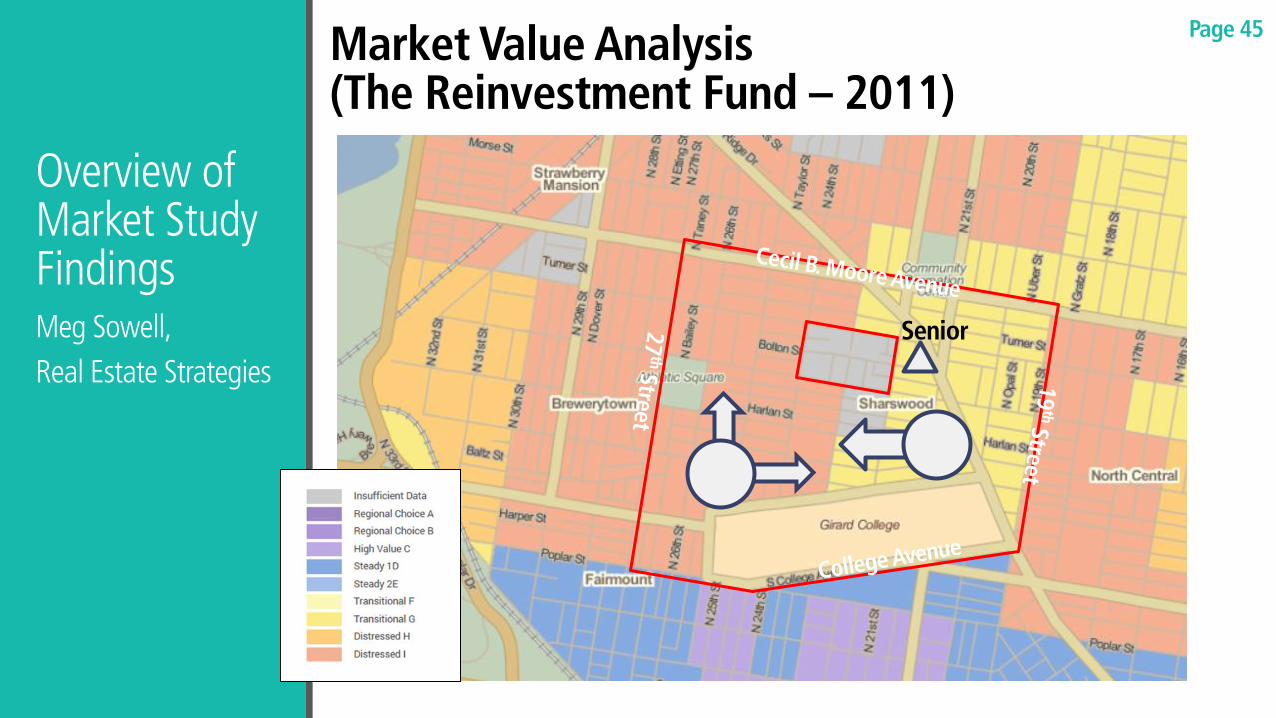
Senior
Overview of Market Study Findings Meg Sowell,
Real Estate Strategies
Market Value Analysis (The Reinvestment Fund – 2011)
Page 45
Overview of Market Study Findings Meg Sowell,
Real Estate Strategies
46
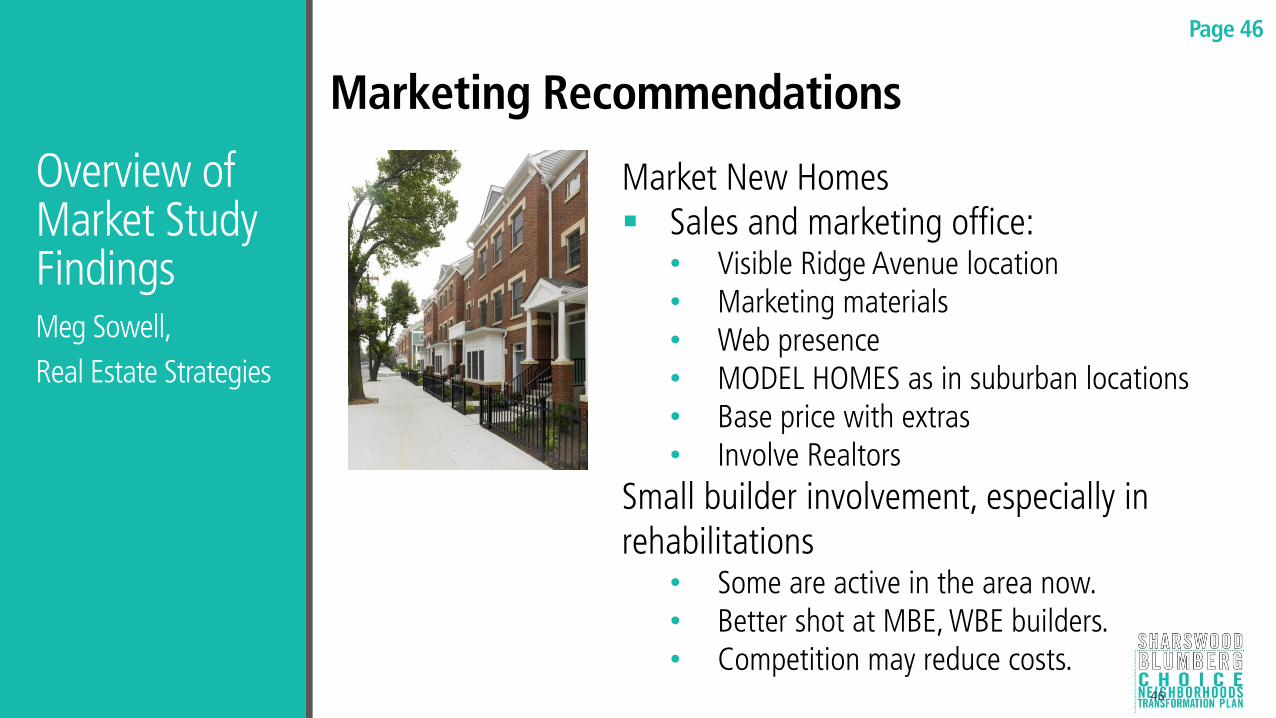
Marketing Recommendations
Market New Homes Sales and marketing office:
• Visible Ridge Avenue location • Marketing materials • Web presence • MODEL HOMES as in suburban locations • Base price with extras • Involve Realtors
Small builder involvement, especially in rehabilitations
• Some are active in the area now. • Better shot at MBE, WBE builders. • Competition may reduce costs.
Page 46

Thank You!
Questions? Comments? Suggestions?
Page 47

Closing & Next Steps
Submit Draft Transformation Plan to HUD Public Meeting – Review and Comment
on Draft Plan Revise Draft Transformation Plan Submit Final Transformation Plan
Page 48
Choice Neighborhoods Planning Process
Norman Blumberg Site Redevelopment
Relocation Demolition Redevelopment Reoccupancy

2014 – Year 1 2015 – Year 2
Jan
uar
y
Feb
ruar
y
Mar
ch
Ap
ril
May
Jun
e
July
Au
gust
Sep
tem
ber
Oct
ob
er
No
vem
ber
Dec
emb
er
Jan
uar
y
Feb
ruar
y
Mar
ch
Ap
ril
May
Jun
e
July
Au
gust
Sep
tem
ber
Oct
ob
er
No
vem
ber
Dec
emb
er
Planning Process Kick-Off
Housing Task Force Session #1
Housing Task Force Session #2
Neighborhood Economic Dev.
Needs Assessment/Community Surveys
Housing Task Force Session #3
Housing Task Force Session #4
Preliminary Plan Presentation
Plan Outline
Housing Task Force Session #5
Housing Task Force Session #6
Draft Transformation Plan
Draft Plan Presentation Open House
Final Transformation Plan
Page 49