Housing stress: How, Where, Who and Why - Home | … Housing Stress.pdf · Housing stress: How,...
28
Housing stress: How, Where, Who and Why Robert Tanton National Centre for Social and Economic Modelling
-
Upload
nguyenmien -
Category
Documents
-
view
215 -
download
0
Transcript of Housing stress: How, Where, Who and Why - Home | … Housing Stress.pdf · Housing stress: How,...

Housing stress: How, Where, Who and Why
Robert TantonNational Centre for Social and Economic Modelling

Housing Stress: How, Where, Who and Why?
How – to measure housing stress and different variantsWhere – is housing stressWho – is most likely to suffer housing stressWhy – are so many suffering housing stress todayDiscussion, implications

Housing stress: How
Traditionally 30% of income spent on housing costs (’30 rule’)Cut out top 60% of income to cut out middle to high income earners (’30/40 rule’)Cut out bottom 10% to remove odd incomes (’30/10-40 rule’)
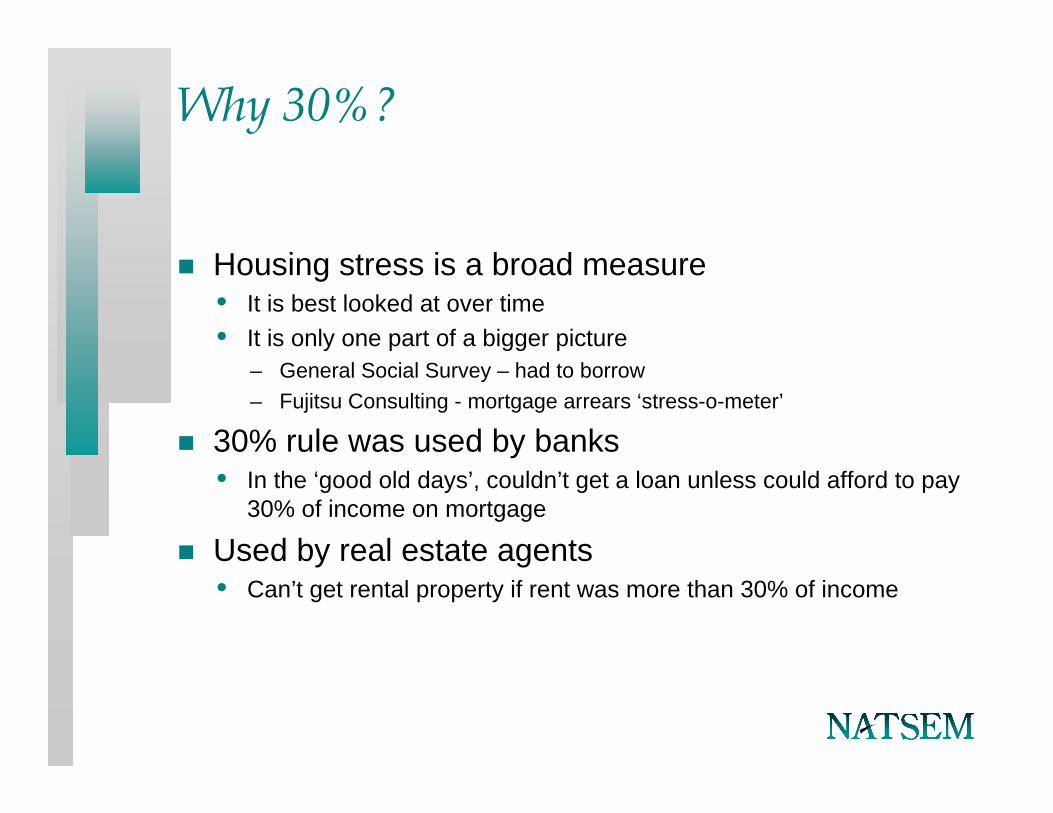
Why 30%?
Housing stress is a broad measure• It is best looked at over time• It is only one part of a bigger picture
– General Social Survey – had to borrow– Fujitsu Consulting - mortgage arrears ‘stress-o-meter’
30% rule was used by banks• In the ‘good old days’, couldn’t get a loan unless could afford to pay
30% of income on mortgage
Used by real estate agents• Can’t get rental property if rent was more than 30% of income

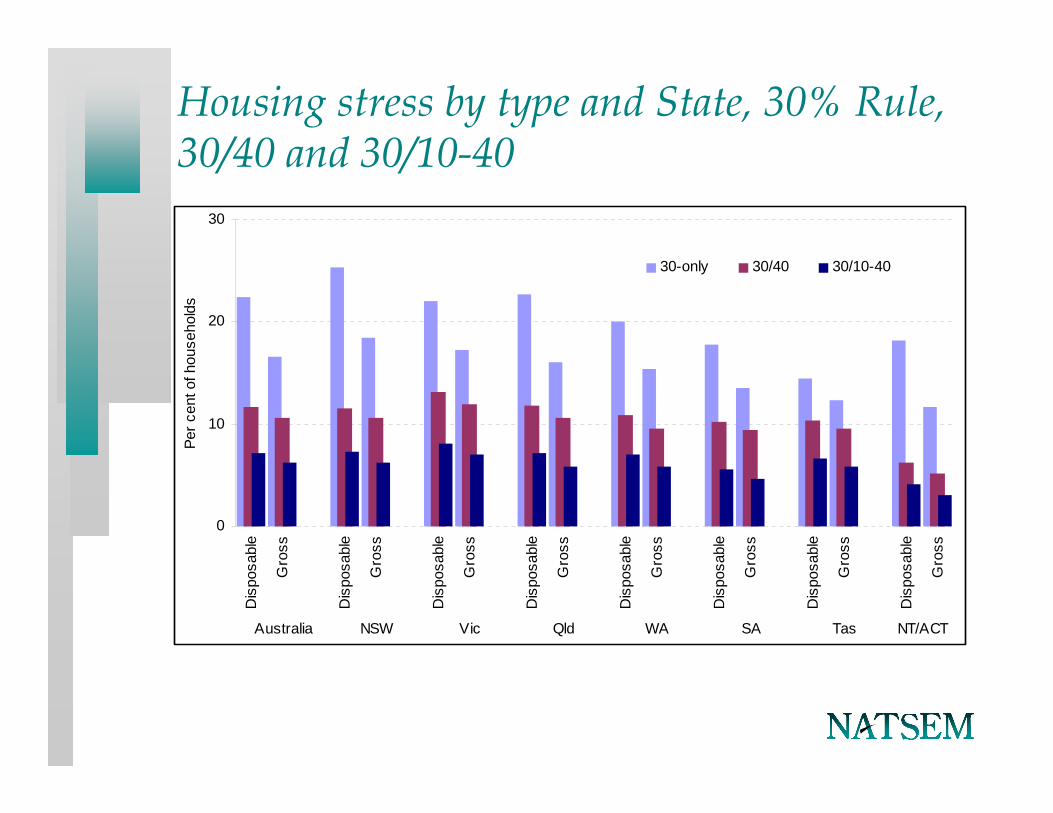
Housing stress by type and State, 30% Rule, 30/40 and 30/10-40
0
10
20
30
Dis
posa
ble
Gro
ss
Dis
posa
ble
Gro
ss
Dis
posa
ble
Gro
ss
Dis
posa
ble
Gro
ss
Dis
posa
ble
Gro
ss
Dis
posa
ble
Gro
ss
Dis
posa
ble
Gro
ss
Dis
posa
ble
Gro
ss
Australia NSW Vic Qld WA SA Tas NT/ACT
Per c
ent o
f hou
seho
lds
30-only 30/40 30/10-40

Alternatives to 30% Housing Stress measure – Reserve Bank
Reserve Bank - % dwellings accessible to persons aged 25 – 39 years based on assumptions about bank lending behaviour (30% repayment to gross income ratio, 10% deposit)• Affordability worse over last 10 years

Alternatives to 30% Housing Stress measure – Urban Development Institute of Australia
UDIA/Matusik Measure – Unnafordable when a household spending 30% of average income for area on repayments could purchase less than 15% of houses in area• In NSW, most areas had detached houses affordable in 2001,
Unaffordable or Seriously constrained in 2006• State average gone from Affordable to Seriously Constrained• For WA, State average gone from Affordable in 2001 to
Unaffordable in 2006

Alternatives to 30% - Fujitsu ‘stress-o-meter’
Propensity to default * number of defaults+ Forced sales+ Average arrears months * Affordability * Reprioritised spending70,000 households experiencing ‘severe stress’, hot spots in Sydney, Melbourne and Perth.
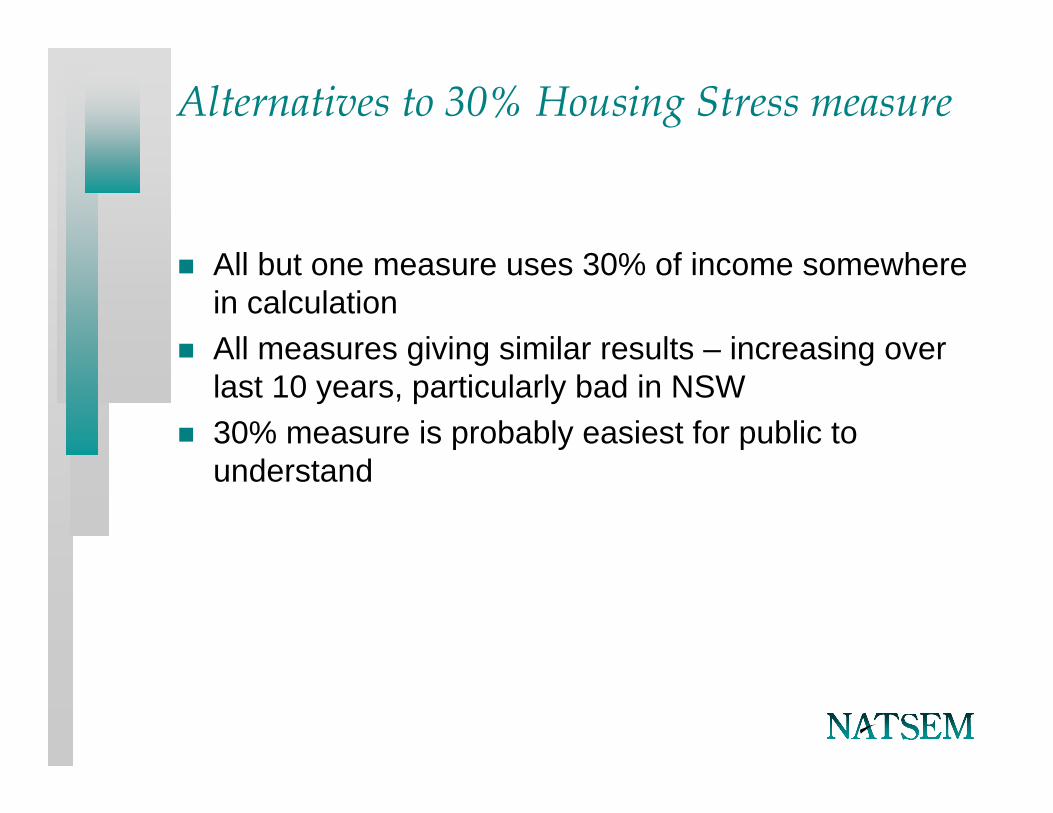
Alternatives to 30% Housing Stress measure
All but one measure uses 30% of income somewhere in calculationAll measures giving similar results – increasing over last 10 years, particularly bad in NSW30% measure is probably easiest for public to understand
Housing stress by type and State, 30% Rule, 30/40 and 30/10-40
0
10
20
30
Dis
posa
ble
Gro
ss
Dis
posa
ble
Gro
ss
Dis
posa
ble
Gro
ss
Dis
posa
ble
Gro
ss
Dis
posa
ble
Gro
ss
Dis
posa
ble
Gro
ss
Dis
posa
ble
Gro
ss
Dis
posa
ble
Gro
ss
Australia NSW Vic Qld WA SA Tas NT/ACT
Per c
ent o
f hou
seho
lds
30-only 30/40 30/10-40
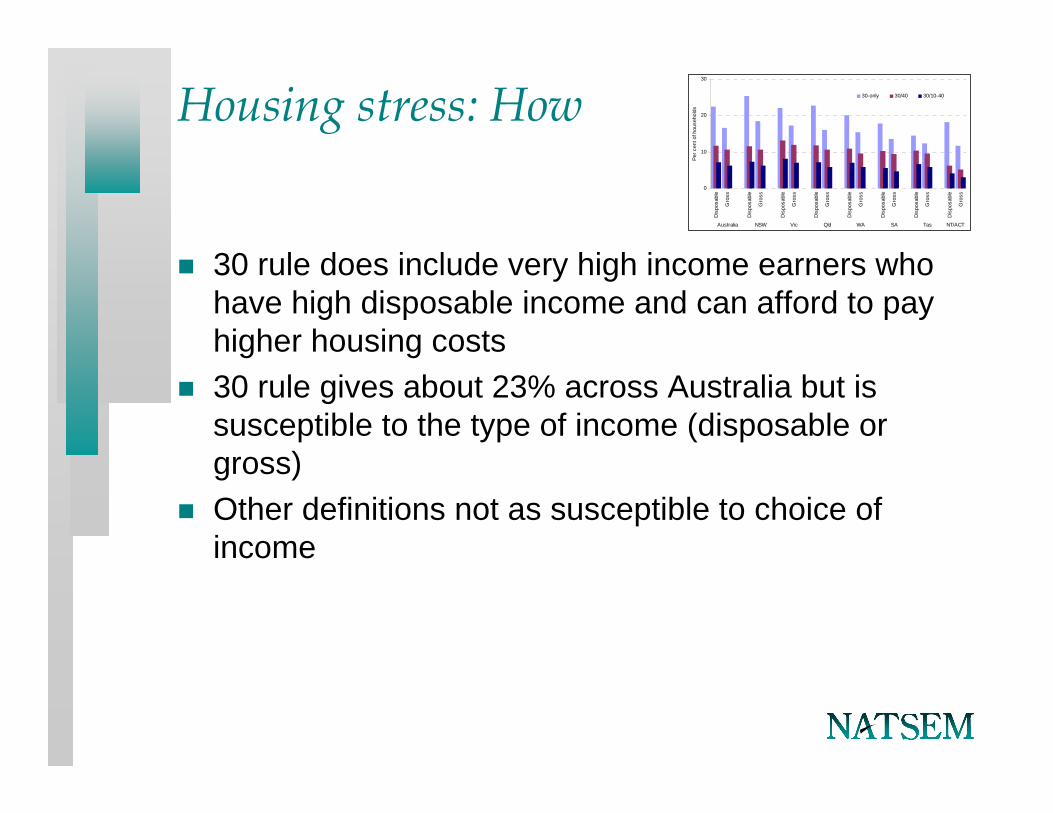
Housing stress: How
30 rule does include very high income earners who have high disposable income and can afford to pay higher housing costs30 rule gives about 23% across Australia but is susceptible to the type of income (disposable or gross)Other definitions not as susceptible to choice of income
0
10
20
30
Dis
posa
ble
Gro
ss
Dis
posa
ble
Gro
ss
Dis
posa
ble
Gro
ss
Dis
posa
ble
Gro
ss
Dis
posa
ble
Gro
ss
Dis
posa
ble
Gro
ss
Dis
posa
ble
Gro
ss
Dis
posa
ble
Gro
ss
Australia NSW Vic Qld WA SA Tas NT/ACT
Per c
ent o
f hou
seho
lds
30-only 30/40 30/10-40

Housing Stress: How
30/40 rule• Cuts out top 60% of income earners• This is those earning more than $50,000 (Australia) for couple family
with 1 child
Choice of income (disposable/gross) has little effect
0
10
20
30
Dis
posa
ble
Gro
ss
Dis
posa
ble
Gro
ss
Dis
posa
ble
Gro
ss
Dis
posa
ble
Gro
ss
Dis
posa
ble
Gro
ss
Dis
posa
ble
Gro
ss
Dis
posa
ble
Gro
ss
Dis
posa
ble
Gro
ss
Australia NSW Vic Qld WA SA Tas NT/ACT
Per c
ent o
f hou
seho
lds
30-only 30/40 30/10-40
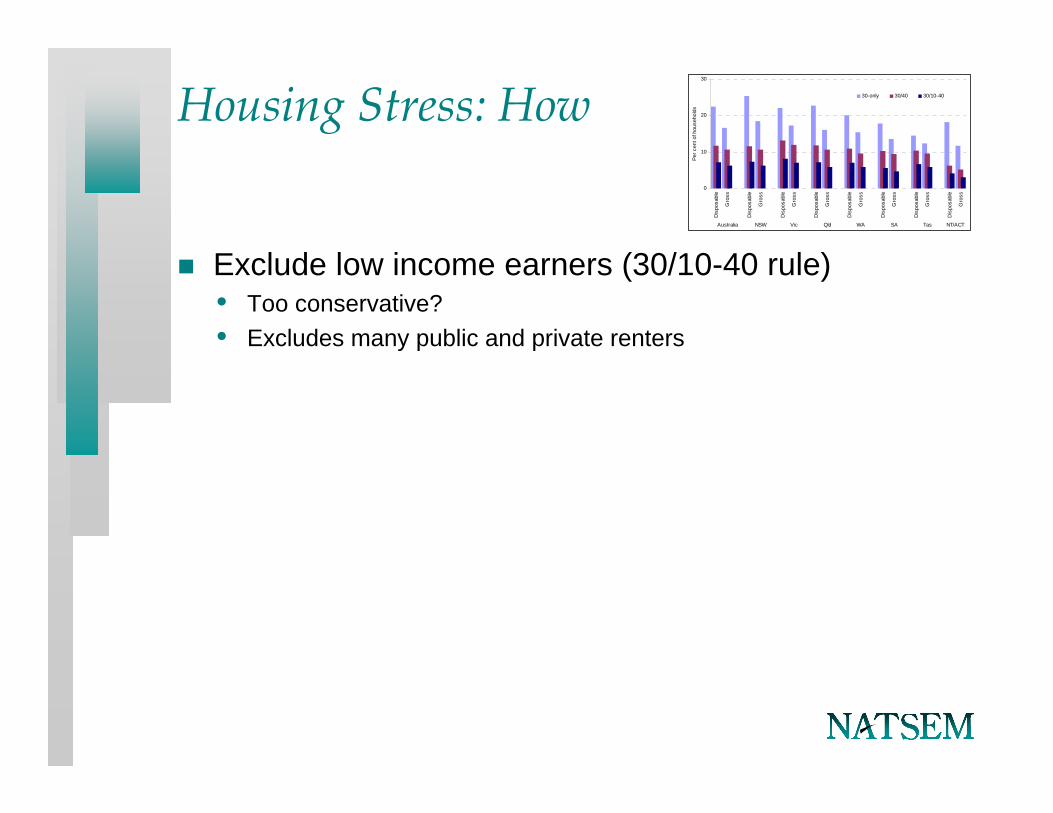
Housing Stress: How
Exclude low income earners (30/10-40 rule)• Too conservative?• Excludes many public and private renters
0
10
20
30
Dis
posa
ble
Gro
ss
Dis
posa
ble
Gro
ss
Dis
posa
ble
Gro
ss
Dis
posa
ble
Gro
ss
Dis
posa
ble
Gro
ss
Dis
posa
ble
Gro
ss
Dis
posa
ble
Gro
ss
Dis
posa
ble
Gro
ss
Australia NSW Vic Qld WA SA Tas NT/ACT
Per c
ent o
f hou
seho
lds
30-only 30/40 30/10-40

Housing Stress by Tenure type
0
10
20
30
40
Dis
posa
ble
Gro
ss
Dis
posa
ble
Gro
ss
Dis
posa
ble
Gro
ss
Dis
posa
ble
Gro
ss
Renter private Purchaser Renter public Ow ner
Per c
ent o
f hou
seho
lds
30-only 30/40 30/10-40

Housing stress: How
NATSEM tends towards 30/40 rule if data allowsSometimes the data doesn’t allow it

Housing stress: Where?Housing stress by State using the 30/40 rule
0.0
2.0
4.0
6.0
8.0
10.0
12.0
14.0
NSW Vic Qld SA
WA Tas
ACT/NT
Austra
lia
State
% in
hou
sing
stre
ss
Capital CityRest of StateState

Housing stress: Who?
30/40 rule• Labour force status• Family Type• Age

Housing Stress: Who?Housing Stress by labour force status
0.0
5.0
10.0
15.0
20.0
25.0
30.0
35.0
40.0
45.0
50.0
Employed fulltime
Employedpart time
Unemployed Not in labourforce
Australia
Labour force status
% in
hou
sing
stre
ss

Housing stress by family typeHousing stress by family type
0.0
2.0
4.0
6.0
8.0
10.0
12.0
14.0
16.0
18.0
Couplewith nochildren
Couplewith
children
Sole parent Single Others Australia
Family type
% in
hou
sing
stre
ss

Housing stress by Age of household reference person
Housing Stress by age of household reference person
0
5
10
15
20
25
15 to
20 ye
ars
21 to
29 ye
ars30
to 39
years
40 to
49 ye
ars50
to 59
years
60 to
69 ye
ars70
+yea
rsAus
tralia
Age of reference person
% in
hou
sing
str
ess

Housing stress: Who?
So far, used 30/40 ruleWhen looking at income, need to use 30 only rule, used in AMP reportAlso some other interesting splits from AMP report• Over time• Recent buyers

Housing stress (30 only) over time
21.3
18.1
20.0
15.116.9
8.5
19.0
25.4
22.0 22.7
17.8
20.1
14.5
11.5
20.922.5
0
5
10
15
20
25
30
NSW VIC QLD SA WA TAS NT ACT AUS
%H
H s
pend
ing
mor
e th
an 3
0% o
f inc
ome
on h
ousi
ng 1995-96 2005-06

Housing stress (30 only) by incomeHousing stress by income
0
5
10
15
20
25
30
35
0 to 0.5 median(poverty)
0.5 median tomedian
Median to 1.5median
Above 1.5 median(high incomehouseholds)
Income class
% in
hou
sing
str
ess

Housing stress (30 rule) by recent purchasers Housing stress for new home owners and old
0
10
20
30
40
50
60
70
Bought in thepast 3 years asthe first home
Bought in thepast 3 years butnot as the first
home
Bought more than3 years ago andnow fully owned
Bought more than3 years ago and
still payingmortgage
Type of purchase
% in
hou
sing
str
ess

Housing stress: Why?
House prices have increased 5 fold in the last 20 years, where incomes have doubled
100
200
300
400
500
600
1986
1987
1988
1989
1990
1991
1992
1993
1994
1995
1996
1997
1998
1999
2000
2001
2002
2003
2004
2005
2006
2007
Averge earning index
House price index
`

What has caused this huge increase in house prices?
Lots of complex interactions• Supply/Demand, particularly in capital cities
– Demographics• Government fees and charges• Interest rates
Means isn’t one simple solution• Land release• Banks lending less

Discussion/Implications
Housing stress is hitting people in Australia disproportionately• Low income• Unemployed• Sole parent families• First home buyers• Younger
Young and first home buyers have a long term potentialOthers are marginal groups in society also suffering other problems (stress, mental health, physical health)
Implications
Need to think about longer term• Easier ways to pass on housing wealth to younger generations• Those who are in housing stress are the marginalised – how can we
help them?– Housing assistance– Public housing