Housing Opportunity in Southwest...
21
Housing Opportunity in Southwest Baltimore Molly Carpenter, David Schlie, Ashlee Green, Imania Davis Under the supervision of Professor Chao Liu URSP688L: Planning Technologies The University of Maryland – College Park Fall, 2015 PALS - Partnership for Action Learning in Sustainability An initiative of the National Center for Smart Growth Gerrit Knaap, NCSG Executive Director Uri Avin, PALS Director
Transcript of Housing Opportunity in Southwest...

Housing Opportunity in Southwest Baltimore
Molly Carpenter, David Schlie, Ashlee Green, Imania Davis
Under the supervision of Professor Chao Liu
URSP688L: Planning Technologies
The University of Maryland – College Park
Fall, 2015
PALS - Partnership for Action Learning in Sustainability
An initiative of the National Center for Smart Growth
Gerrit Knaap, NCSG Executive Director
Uri Avin, PALS Director

1
Contents
Contents
Executive Summary ………………………………………………………………………………………. 2 Background …………………………………………………………………………………………………….. 2 Research Questions ………………………………………………………………………………………… 3 Analysis …………………………………………………………………………………………………………… 3 Interpretation of Results…………………………………………………………………………………… 5 Recommendations …………………………………………………………………………………………… 15 Appendix …………………………………………………………………………………………………………. 17

2
Executive Summary
The housing group focused on a variety of factors or variables to assess housing issues in
the Southwest Partnership neighborhoods. Our goal was to identify areas of lowest and highest
housing opportunity in the Partnership area by analyzing variables related to the characteristics
and quality of housing. These variables included housing conditions, year built, housing value,
gross rent, cost burden, vacant housing, and vacant housing compared with median age.
The resulting GIS maps are an opportunity index to determine the areas that are in need
of attention. The group determined that the Mount Clare and Franklin Square areas are the
hardest hit due to their high vacancy rates. In alignment with Southwest Partnership’s goals, the
group also determined that more affordable housing should be added to the Union Square area,
as it has the highest median value. Lastly, the group determined the Partnership should assist its
cost-burdened residents by connecting them to financial assistance programs, job training, or
other opportunity programs to help them increase their income.
Background
The Southwest Partnership area comprises seven neighborhoods: Franklin Square,
Poppleton, Hollins Market, Union Square, Mount Clare, Pigtown, and Barre Circle. The area is
almost entirely residential, and is home to the historic Hollins Market and the University of
Maryland BioPark. The area has suffered from disinvestment and failed redevelopment, which is
evidenced through its aging, poor condition housing stock.
The Housing Team’s study area was the entire southwest Baltimore area, to get a
broader picture of the condition of the housing market. The Southwest Partnership needed to
know about properties that were currently vacant, their condition and ownership, and also areas
with properties that are at the highest risk of becoming vacant. The current housing market data
required further analysis and assessment for future housing projects.

3
Research Questions
The Housing Team addressed the following research questions for this project:
1. What is the current condition of properties in the Southwest Partnership neighborhoods?
2. How old is the housing stock, and does age correlate with housing condition?
3. What is the distribution of home values and rent costs across the area?
4. What is the housing cost burden of area residents?
5. Where are vacant properties located across the area?
6. Which areas contain housing units that are the most at risk of becoming vacant?
Analysis
Part I: Housing Condition Study
The Housing Condition Study sought to examine variables that would indicate the
physical condition of housing stock in Southwest Baltimore. It examined the most current (2012)
MdProperty View data from the Maryland Department of Planning to compose three maps. The
first shows the year homes were built, with homes grouped into 50-year increments for
legibility. The second map shows the self-reported physical condition. Options for condition
were: Low Cost, Fair, Average, Good and Very Good and the homes were mapped with colors
corresponding to their condition. There were significant gaps in the available data for this map.
The third map attempts to show the overlap of older homes with homes in poor condition,
where investment is most needed. This map shows homes that are in the oldest bracket for age
(pre-1900), and are listed in Fair or lower condition.
Part II: Market Stability and Area Assets
The Market Stability Study and Assessment of Area Assets is a series of maps that
assesses the current housing market condition and its susceptibility to change. The first two
maps incorporate data from the American Community Survey’s (ACS) 2014 estimates. They
display data at the smallest available division, Census block group. All those Census block groups
that intersect with the study area were displayed. The first map displays Median Housing Value
in five quantile categories ranging from $0 to $262,500. The second map displays Median Gross
4
Rent in five quantile categories ranging from $243 per month to $1,581 per month. Two maps
were created to show the cost burden for residents in the area. One displays the percentage of
homeowners spending more than 30 percent of their annual income on a mortgage. The other
displays the percentage of renters spending more than 40 percent of their income on rent. Both
maps use 2014 ACS data and five quantile classes.
A portion of Part II examined the age of the area’s population. A series of four maps,
produced from ACS 2014 data, show the total population of a particular age bracket for a Census
block group. These maps can be found in the Appendix. The age brackets are: under 20, 21 to 39,
40-61, and 62 and older. The intersection of age trends with vacancy and condition can be
indicative of a community’s future, especially when examining where younger or older residents
are located. This portion also produced a map displaying the number of vacant properties in
each Census block group, also from the 2014 ACS data. All maps were displayed with five
quantile classes. Finally a map was created combining the age and vacancy data. This map uses
vacant property data from Open Data Baltimore juxtaposed with a map showing the distribution
of median age per census block group from the 2014 ACS data. A heat map was created from the
Open Data Baltimore dataset to show the density of vacant properties in Southwest Baltimore.
Part III: Opportunity Index
An opportunity index, created using a variety of housing variables from the ACS
2014 dataset, estimates the upward mobility of residents in the study area, based on selected:
percent of households paying less than 30 percent of income on rent, median home value,
median rent, percent of units renter-occupied, and percent of units vacant. The first three
variables were used in a direct relationship and the latter two inversely. A composite z-score was
compiled and mapped using five quantile classes.

5
Interpretation of Results
Part I: Housing Condition Study
Figure 1 maps housing condition, as represented by the proxy variable of construction
grade. The brightest green points represent good condition properties, the highest grade, and
the red points represent “low cost” condition properties, the lowest grade. The only two
neighborhoods that contain a significant amount of housing units of good condition are Union
Square and Pigtown. The majority of lower grade housing units appear to be clustered in the
neighborhoods of Pigtown and Hollins Market. The housing condition in the neighborhoods of
Franklin Square, Poppleton, and Mount Clare is largely unaccounted for. These three
neighborhoods also appear to have large numbers of vacant lots. Though there is a significant
amount of missing data, it can be concluded that there is a lack of good condition properties in
the region.
Figure 1

6
Figure 2 maps the year built of housing units. The only neighborhood containing housing
units constructed after 2000 is Pigtown. Units constructed between 1951 and 2000 appear to be
clustered in the neighborhoods of Poppleton, Franklin Square and Pigtown. Mount Clare and
Union Square do not appear to contain any units constructed after 1950.
Figure 3 is a composite map of housing condition and year built. The points shown are
classified as being in “fair” housing condition, the second lowest construction grade, and were
built before 1900. These old housing unit, in poor condition appear to be primarily clustered in
Pigtown. There are smaller concentrations of these units in Union Square and Hollins Market. It
can be concluded that the areas containing these units are most in need of revitalization and
new development. Though Pigtown has seen a small amount of new housing construction, the
area in the southwest part of the neighborhood would greatly benefit from new construction as
well.
Figure 2

7
Part II: Market Stability/Area Assets
Figure 4 maps median home values across Census block groups in Southwest Baltimore.
Darker colors correspond to higher home values. The block groups with the lowest home values
appear to be located in the neighborhoods of Poppleton, Franklin Square and Mount Clare. The
block groups with the highest home values appear to be located in the neighborhoods of Hollins
Market and Union Square. Figure 5 displays a map of median gross rents across Census block
groups. Darker colors correspond to higher median rents. The block groups with the lowest
median rents again appear to be located in the neighborhoods of Poppleton, Franklin Square,
and Mount Clare.
Figure 3

8
W
W
Figure 4
Figure 5

9
While the previous two maps examined housing costs, the next series of maps attempt to
put housing costs into the context of affordability through the analysis of cost burden. The
Census categorizes cost burden by renters and homeowners; therefore a map was made for
both categories in order to encompass all residents. Figure 6 displays a map of the percentage of
renter households spending more than 30 percent of their income on rent per block group.
Darker colors correspond to higher percentages of cost-burdened renters spending more than
30 percent of their income on rent. Block groups with the highest percentages of cost burdened
renters are located in the neighborhoods of Poppleton, Franklin Square, and Mount Clare.
Figure 6
10
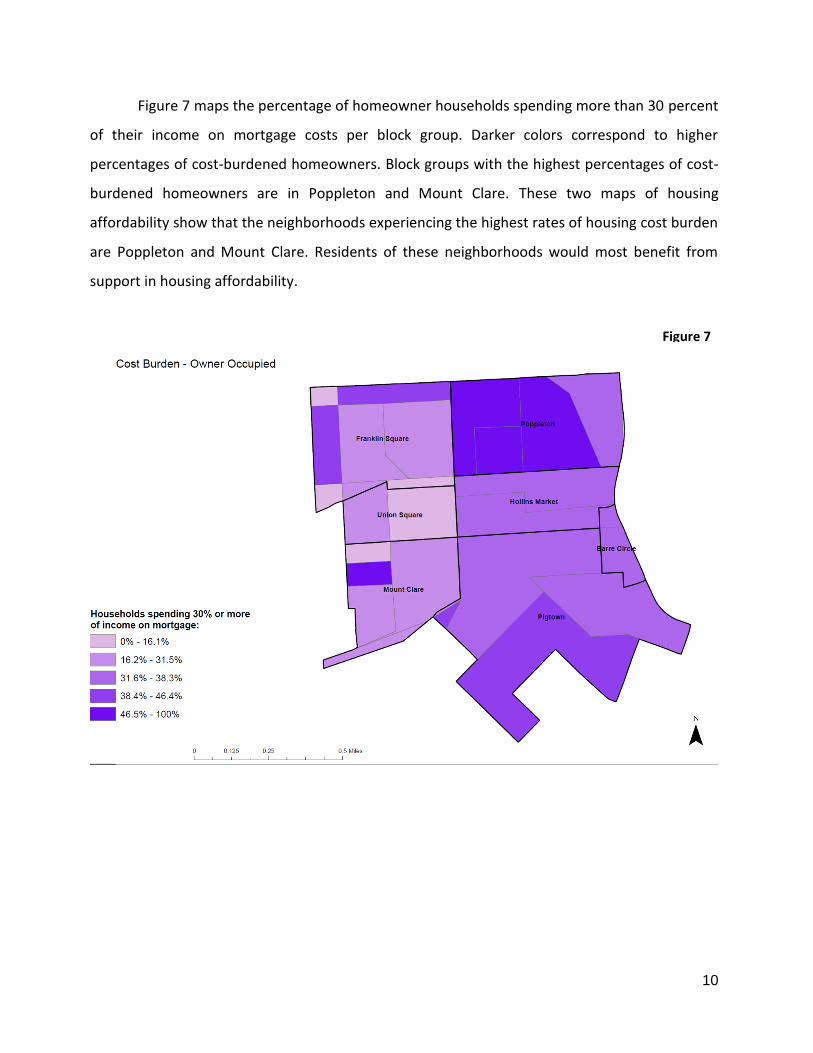
Figure 7 maps the percentage of homeowner households spending more than 30 percent
of their income on mortgage costs per block group. Darker colors correspond to higher
percentages of cost-burdened homeowners. Block groups with the highest percentages of cost-
burdened homeowners are in Poppleton and Mount Clare. These two maps of housing
affordability show that the neighborhoods experiencing the highest rates of housing cost burden
are Poppleton and Mount Clare. Residents of these neighborhoods would most benefit from
support in housing affordability.
Figure 7

11
Figure 8 maps the number of vacant housing units per block group. The Census data used
for this map defines vacant housing as a unit that no one lives in at the time of the interview, a
unit whose residents have another primary residence, and newly constructed units not yet
occupied. Units that are damaged and no longer habitable are not counted as vacant. This map
shows the concentration of vacant housing units in the area. Darker colors correspond to greater
numbers of vacant housing units. The neighborhood containing the highest concentration of
vacant housing units is Mount Clare.
Figure 8

12
Figure 9 and Figure 10 display two maps: a kernel density map of vacant buildings and a
choropleth map of the median age per block group. When juxtaposed they provide demographic
context for the vacant housing data. The kernel density map was used primarily for the sake of
comparison; darker colors represent higher densities of vacant buildings. It is difficult to pinpoint
exactly how many vacant buildings there are in a certain area just based on coloration alone;
however general statements of density can be made based on the display.
Figure 9

13
T
The kernel density map’s point data originates from the Housing Authority of Baltimore
City, which defines a vacant property as being “any unoccupied structure that is unsafe or unfit
for human habitation or other authorized use” (http://www.baltimorehousing.org/vtov_faq). A
housing unit that is simply unoccupied is not counted as vacant unless it meets the above
criteria. This data is perhaps more useful than the Census data, as it reflects the types of
properties that are detrimental to housing values and quality of life in a given neighborhood.
The Mount Clare neighborhood contains the most vacant building “hotspots” (areas of blue on
the map). According to the median age map, this neighborhood has a relatively high median age.
However there does not seem to be a significant relationship between median age and amount
of vacant properties, simply based off of these two maps.
Figure 10

14
Part III: Opportunity Index
Figure 11 displays the descriptive statistics for the composite index. These statistics
encompass all census block groups in the City of Baltimore. The results of the housing
opportunity index are displayed in Figure 11. The block groups with a z-score within the highest
quintile are located in the neighborhoods of Pigtown, Barre Circle, and Union Square. The block
groups with a z-score within the lowest quintile are located in Franklin Square and Mount Clare.
According to the index, the areas in the lowest quintile have the highest proportions of renter-
occupied units, the lowest housing values and gross rents, the highest rates of housing vacancy,
and the lowest rates of households paying less than 30 percent of their income on rent.
By viewing these variables in a composite index, block groups can be identified not just
by housing value, but through cost-burden as well, which better represents the degree of
housing affordability. The block groups in the lowest quintiles have low rents and housing
values, yet many residents are still unable to afford these housing costs, reflecting a low level of
housing opportunity in these areas. These low opportunity areas indicate a housing pattern that
contributes to the clustering and entrenchment of poverty with low quality housing, low home-
ownership rates, and is often vacant or abandoned. Housing units located in the areas identified
through this index are the most at risk of becoming vacant.
Block groups with the lowest composite z-scores are considered areas of low housing
opportunity because the features that characterize the housing stock are limiting factors for
Descriptive Statistics
Mean S.D. Relationship
Percent households paying less than 30% of income on rent
39% 23% Direct
Median housing value $160,019.60 $102,658.10 Direct
Median gross rent $980.97 $335.40 Direct
Percent of units renter-occupied
51% 25% Inverse
Percent of housing units vacant
20% 16% Inverse
Figure 11

15
residents’ economic mobility. They block groups that would benefit the most from
redevelopment, revitalization, and targeted affordable housing services to transition into a more
stable part of the housing market and a more stable living environment for residents.
Recommendations
The Southwest Partnership’s goal is to "attract and encourage the development of
diverse housing styles to attract middle-income families and professionals to the neighborhood,
while maintaining and improving existing low-income housing, especially for homeowners." The
following recommendations would help the Partnership meet that goal.
1. Focus on housing redevelopment in the Mount Clare and Franklin Square neighborhoods, as
these areas have the most vacant and aging properties.
Figure 12
16
2. Find financial assistance or higher-income job opportunities for residents who are paying
more than 30 percent of their income for housing.
3. Create affordable housing opportunities in areas such as Union Square where the median
housing value tends to be higher than other areas of Southwest Baltimore.

17
Appendix

18

19

20