
Housing Markets and Migration: Evidence from New Zealand David C Maré and Steven Stillman Motu.
19
Housing Markets and Migration: Evidence from New Zealand David C Maré and Steven Stillman Motu
-
Upload
gwen-berry -
Category
Documents
-
view
214 -
download
0
Transcript of Housing Markets and Migration: Evidence from New Zealand David C Maré and Steven Stillman Motu.

Housing Markets and Migration: Evidence from New Zealand
David C Maré and Steven StillmanMotu

Overview
Q: How does population change, international migration, including the return migration of New Zealanders abroad, as well as internal migration impact local housing markets
– Time-series relationship in New Zealand
– Evidence from the literature on the US
– Data description
– Graphical analysis
– Regressions

Background4-quarter change in house prices vs 4-quarter migration
-15.0%
-7.5%
0.0%
7.5%
15.0%
22.5%
19
86
:1
19
87
:1
19
88
:1
19
89
:1
19
90
:1
19
91
:1
19
92
:1
19
93
:1
19
94
:1
19
95
:1
19
96
:1
19
97
:1
19
98
:1
19
99
:1
20
00
:1
20
01
:1
20
02
:1
20
03
:1
20
04
:1
20
05
:1
20
06
:1
Ho
use p
ric
es
-1.50%
-0.75%
0.00%
0.75%
1.50%
2.25%
Net
mig
ra
tio
n
House price change
Coleman and Landon-Lane (2007) use a structural VAR model to examine this relationship and find that 1% net immigration inflow leads to 10% increase in house prices

US LiteratureSaiz (2003) - Examines Mariel Boatlift and finds that nearly a 1-1
relationship between the increase in Miami’s renter population and rents compared to other comparable cities
Saiz (2006) - Examines relationship between immigrant inflows, rents and house values over time across MSAs using IV based on the settlement pattern of prior immigrants from same region. An immigration inflow equal to 1% of a city’s population is associated with increases in average rents and housing values of about 1%.
Ottaviano and Peri (2007) - Estimate joint model of impact of immigrant inflows on wages and rents. Immigration produces a positive effect on the wages of native workers with elasticities in the 0.35 −0.55 range and a positive effect on housing expenditure with elasticities roughly between 0.6−0.8 when estimated on rents.
Saiz and Wachter (2006) - Examine relationship between immigration house prices within metropolitan areas and find that values have grown relatively more slowly in area of immigrant settlement.

Population Data
NZ Census 1986, 1991, 1996, 2001, 2006– Sample: All individuals aged 18+– New Immigrants: Individuals not born in NZ that
resided outside NZ 5-years previously– Return New Zealanders: Individuals born in NZ that
resided outside NZ 5-years previously – Movers vs. Stayers: Movers lived in a different place in
NZ 5-years ago based on a particular geography– Local Areas: 140 Functional labour markets (LMAs) /
73 Territorial Local Authorities (county) / 58 LMAs / 16 Regional Council (states)

Housing Market Data
Quotable Value New Zealand - Annual data covering 1982-2006 on all sales and valuations at block level– Sales Prices: Mean Sales Prices for Standalone Homes
and Flats in each Census year and geographic area
Tenancy New Zealand - Annual data covering 1992-2006 on weekly rents at the area level– Rents: Mean Weekly Rent for Standalone Homes and
Flats in each Census year and geographic area

Sample Characteristics1986-1991 1991-1996 1996-2001 2001-2006
Percent Change in Mean Sales Price for Houses 0.002 0.235 0.078 0.654(0.010) (0.014) (0.013) (0.019)
Percent Change in Mean Sales Price for Flats -0.038 0.174 0.016 0.566(0.012) (0.020) (0.021) (0.027)
Percent Change in Mean Weekly Rent for Houses 0.127 -0.038 0.191(0.012) (0.006) (0.010)
Percent Change in Mean Weekly Rent for Flats 0.122 -0.055 0.136(0.016) (0.007) (0.013)
Percent Change in Population 0.057 0.048 0.045 0.085(0.004) (0.005) (0.005) (0.005)
New Immigrants / Population 5-Years Ago 0.035 0.048 0.057 0.079(0.002) (0.003) (0.003) (0.004)
Return NZers / Population 5-Years Ago 0.019 0.024 0.018 0.025(0.000) (0.001) (0.000) (0.001)
Change in Immigrants / Population 5-Years Ago -0.019 -0.022 -0.026 -0.019(0.001) (0.001) (0.001) (0.001)
Change in NZers / Population 5-Years Ago 0.022 -0.002 -0.004 0.000(0.003) (0.003) (0.003) (0.003)
Local Population Characteristics - Changes
Local Housing Market Characteristics - Changes
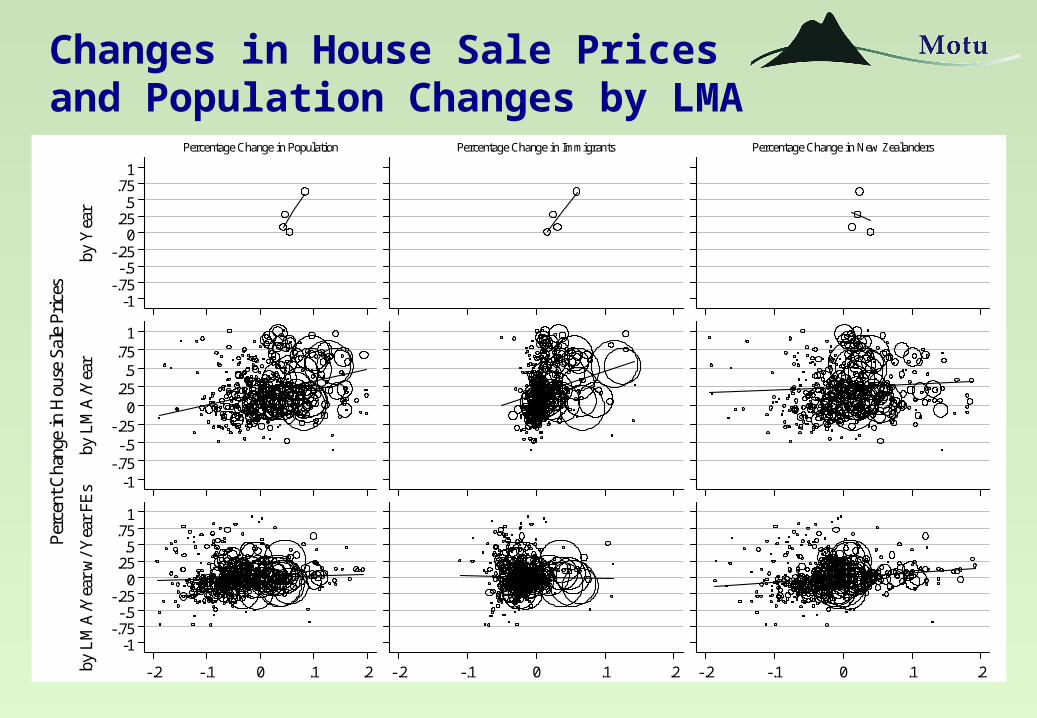
Changes in House Sale Prices and Population Changes by LMA
-1-.75
-.5-.25
0.25
.5.75
1
by Y
ear
Percentage Change in Population Percentage Change in Immigrants Percentage Change in New Zealanders
-1-.75
-.5-.25
0.25
.5.75
1
by L
MA
/Yea
r
-1-.75
-.5-.25
0.25
.5.75
1
by L
MA
/Yea
r w
/ Yea
r FE
s
-.2 -.1 0 .1 .2 -.2 -.1 0 .1 .2 -.2 -.1 0 .1 .2
Per
cent
Cha
nge
in H
ouse
Sal
e Pr
ices
The size of the circles are proportional to the average current population and population five years prior in each LMAThe solid line is the best population weighted linear fit
Figure 1: Change in House Sale Prices and Population Changes

The Relationship between the Local Population and the Local Housing Market
, , , ,( Pr ) ( )LMA t t LMA t LMA t LMA tLn House ice Ln Pop X e
Log Population 0.194** 0.070** 0.169** 0.061**(0.026) (0.017) (0.017) (0.010)
Geo/Years 675 675 399 399R-Squared 0.76 0.94 0.80 0.96Covariates No Yes No Yes
Log Mean Sales Price for Houses
Log Mean Weekly Rent for Houses

The Relationship between Changes in the Local Population and Changes in the Local Housing Market
( , 5) ( , 5) ( , 5) ,
( , 5) , , 5 , 5
( ) ( )( ) ( )
LMA t t t LMA t t LMA t t LMA t
LMA t t LMA t LMA t LMA t
Ch HP Ch Pop X eCh z z z z
% Change in Pop 0.257* 0.298 0.188* 0.123(0.129) (0.163) (0.094) (0.122)
Geo/Years 532 532 277 277R-Squared 0.70 0.80 0.55 0.76Covariates No Yes No Yes
% Change Mean Weekly Rent for Houses
% Change Mean Sales Price for Houses

The Relationship between Changes in Components of the Local Population and Changes in the Local Housing Market
( , 5) 1 , ( 5) 2 , ( 5)
3 ( , 5) 4 ( , 5) ( , 5) ,
( ) ( / ) (Re / )(Im ) ( )
LMA t t t LMA t LMA t LMA t LMA t
LMA t t LMA t t LMA t t LMA t
Ch HP NewImm Pop tNZ PopCh m Ch NZ X e
New Immigrants -0.708 -0.228 -0.438 -0.168(0.376) (0.348) (0.263) (0.280)
Return NZers 9.079** 6.083** 3.263 3.845*(2.484) (2.003) (2.109) (1.890)
% Change in Imm 1.599 1.464 -0.132 -1.299(1.120) (1.350) (1.102) (0.735)
% Change in NZ -0.268 -0.336 0.331 0.230(0.309) (0.299) (0.267) (0.300)
Geo/Years 532 532 277 277R-Squared 0.72 0.80 0.58 0.77Covariates No Yes No Yes
% Change Mean Sales Price for Houses
% Change Mean Rental Bond for Houses

The Relationship between Inflows of New Immigrants and Changes in the Local Housing Market
( , 5) , ( 5) ( , 5) ,( ) ( / )LMA t t t LMA t LMA t LMA t t LMA tLn HP Ln NewImm Pop X e
Instrument for NewImm using the location of previous immigrants from the same region of birth (13 regions)
Log Inflow Rate of 0.023** 0.059** 0.009 0.012 0.004 0.058** -0.010 -0.002 New Immigrants (0.006) (0.017) (0.004) (0.035) (0.004) (0.016) (0.005) (0.026)Geo/Years 531 531 531 531 277 277 277 277R-Squared 0.70 0.80 0.70 0.80 0.57 0.80 0.57 0.79Covariates No Yes No Yes No Yes No Yes
Change in Log Mean Rental for Houses OLS IV
Change in Log Mean Price for Houses OLS IV

The Relationship between Changes in Components of the Local Population and Changes in Neighbourhood Housing Markets
( , 5) , 1 , ( 5) 2 , ( 5)
3 ( , 5) 4 ( , 5) ( , 5) ,
( ) ( / ) (Re / )(Im ) ( )
LMA t t LMA t LMA t LMA t LMA t LMA t
LMA t t LMA t t LMA t t LMA t
Ch HP NewImm Pop tNZ PopCh m Ch NZ X e
New Immigrants -0.120* -0.075 -0.172** -0.181**(0.058) (0.074) (0.046) (0.039)
Return NZers 2.783** 1.202** 0.632** 0.117(0.283) (0.372) (0.177) (0.172)
% Change in Imm -0.131 -0.058 -0.030 0.007(0.067) (0.059) (0.042) (0.028)
% Change in NZ 0.071 0.081 0.121** 0.112**(0.048) (0.044) (0.022) (0.024)
Geo/Years 5894 5894 3017 3017Local Area/Years 423 423 176 176R-Squared 0.02 0.09 0.02 0.08Covariates No Yes No Yes
% Change Mean Sales Price for Houses
% Change Mean Rental Bond for Houses
Conclusions• A 10% pop increase in a local labour market is associated
with a 3% increase in house prices and a 2% increase in rents controling for aggregate changes over time
• Decomposing this change:– locations with 2 percentage point higher inflow rates of return
migrants have 12-18% higher house prices and 8% higher rents. – no other components are significantly related to house prices
• A weak OLS relationship between new immigrant inflows and house prices, but once controlling for the endogenous location choice of immigrants, there is no relationship
• House prices are insignificantly different in areas within local labour markets with greater inflows of new immigs
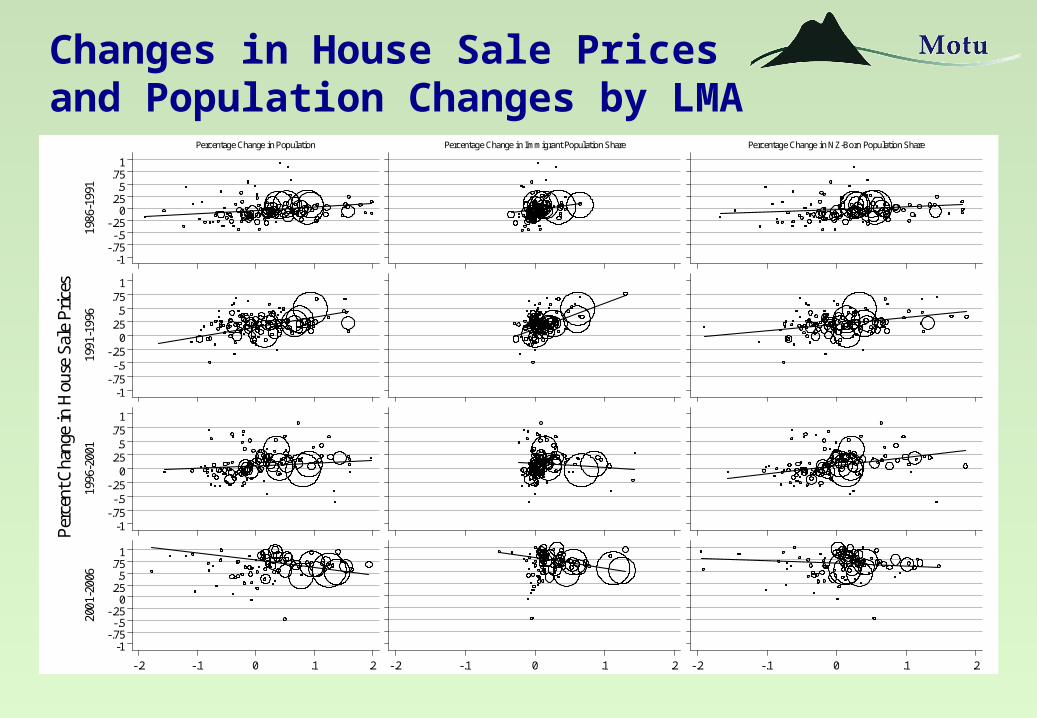
Changes in House Sale Prices and Population Changes by LMA
-1-.75
-.5-.25
0.25
.5.75
1
1986
-199
1
Percentage Change in Population Percentage Change in Immigrant Population Share Percentage Change in NZ-Born Population Share
-1-.75
-.5-.25
0.25
.5.75
1
1991
-199
6
-1-.75
-.5-.25
0.25
.5.75
1
1996
-200
1
-1-.75
-.5-.25
0.25
.5.75
1
2001
-200
6
-.2 -.1 0 .1 .2 -.2 -.1 0 .1 .2 -.2 -.1 0 .1 .2
Per
cent
Cha
nge
in H
ouse
Sal
e Pr
ices
The size of the circles are proportional to the average current population and population five years prior in each LMAThe solid line is the best population weighted linear fit
Figure 2: Change in House Sale Prices and Population Changes by Year

The Relationship between Changes in the Local Popuation and Changes in the Local Housing Market by Year
1986 - 1991 0.701** 0.535(0.200) (0.311)
1991 - 1996 1.604** 0.410 0.969** 0.421(0.211) (0.337) (0.186) (0.258)
1996 - 2001 0.347 0.005 0.086 0.232(0.227) (0.403) (0.109) (0.241)
2001 - 2006 -1.382** -1.320* -0.444* -0.322(0.328) (0.591) (0.181) (0.264)
Covariates No Yes No Yes
Change in Log Mean Price for Houses
Change in Log Mean Rental Bond for Houses

Individual Summary Statistics
Total Population
New Immigrants
Returning Kiwis
Internal Migrants -
Imm
Internal Migrants -
Kiwi
In Same LMA -
Immigrant
In Same LMA - Kiwi
Own Home 67% 43% 58% 53% 47% 72% 73%Age 44.3 36.0 34.9 50.3 45.3 43.9 37.0Aged 18-24 15% 20% 9% 7% 14% 14% 26%Aged 25-64 70% 75% 89% 70% 69% 71% 66%Aged 65+ 16% 5% 2% 23% 17% 15% 8%No Qualifications 29% 11% 15% 27% 33% 19% 25%School Quals 28% 32% 29% 28% 27% 30% 31%Post-School Quals 24% 21% 31% 23% 24% 25% 25%University Degree 10% 25% 20% 12% 7% 17% 11%Missing 9% 12% 5% 11% 9% 8% 6%Full-Time W/S 39% 38% 51% 35% 39% 37% 44%Part-Time W/S 9% 8% 8% 8% 9% 7% 8%Full-Time Other 12% 8% 12% 11% 12% 10% 9%Part-Time Other 3% 3% 3% 3% 3% 3% 3%Unemployed 4% 7% 6% 4% 4% 6% 7%NILF 33% 36% 20% 40% 33% 36% 29%Real Income 26,180 21,673 31,922 25,513 26,688 25,681 25,249Missing Income 6% 12% 4% 7% 5% 5% 5%Non-Family 27% 31% 31% 23% 25% 33% 38%Couple - No Kids 27% 23% 25% 29% 27% 28% 23%Couple - Kids 38% 40% 35% 41% 39% 33% 31%Single - Kids 9% 5% 8% 7% 9% 6% 8%% of Population 5% 2% 2% 12% 15% 64%Individuals 12,623,493 592,899 254,997 272,133 1,568,559 1,903,527 8,031,381

Probit Regression Estimates of Likelihood of Homeownership
No Controls Year FEsIndividual
DemosLFS and Income
Household Demos
Region of Birth
LMA FEs
New Immigrants -0.307 -0.296 -0.272 -0.262 -0.210 -0.217 -0.212(458) (263) (112) (69) (89) (88) (90)
Returning Kiwis -0.167 -0.166 -0.149 -0.145 -0.095 -0.095 -0.092(145) (139) (112) (107) (106) (60) (59)
Internal - Immigrant -0.188 -0.186 -0.207 -0.200 -0.136 -0.151 -0.150(54) (54) (48) (47) (42) (42) (41)
Internal - Kiwi -0.251 -0.253 -0.212 -0.207 -0.126 -0.125 -0.123(61) (61) (65) (62) (56) (40) (40)
Stayer - Immigrant -0.003 0.000 -0.025 -0.022 -0.019 -0.027 -0.024(183) (184) (151) (147) (119) (118) (116)
Individuals 5,207,244 5,207,244 5,207,244 5,207,244 5,207,244 5,207,244 5,207,244Notes: Differences are relative to New Zealanders living in the same LMA as five-years-ago. Control variables are added progressively to each specification. Marginal effects with t-stats in paretheses.

The Relationship between Different Components of the Local Population
New Immigrants 0.799** 0.840** -0.109** 0.051 -0.191** -0.358** 0.099** 0.147**(0.078) (0.092) (0.042) (0.050) (0.045) (0.051) (0.010) (0.015)
Return NZers 2.394** 2.899** 0.243 0.782** -1.088** -0.685** 2.239** 1.801**(0.322) (0.372) (0.204) (0.257) (0.098) (0.115) (0.163) (0.113)
New Immigrants 0.846** 0.696** -0.066** -0.133** -0.296** -0.407** 0.208** 0.236**(0.027) (0.057) (0.011) (0.042) (0.024) (0.021) (0.010) (0.027)
Return NZers 3.454** 2.095** -0.082 0.481* -1.332** -1.126** 3.868** 1.741**(0.220) (0.143) (0.082) (0.213) (0.078) (0.139) (0.336) (0.374)
New Immigrants 0.642** 0.631** -0.194** -0.144** -0.370** -0.495** 0.207** 0.269**(0.101) (0.101) (0.042) (0.046) (0.068) (0.036) (0.016) (0.049)
Return NZers 2.375** 1.706** -0.765* -0.242 -1.635** -1.291** 3.774** 2.239**(0.156) (0.191) (0.291) (0.232) (0.287) (0.319) (0.592) (0.409)
New Immigrants 0.849** 0.668** -0.065** -0.168** -0.291** -0.375** 0.205** 0.211**(0.046) (0.076) (0.022) (0.058) (0.031) (0.027) (0.009) (0.029)
Return NZers 3.639** 2.320** -0.091 0.648** -1.327** -0.973** 4.057** 1.644**(0.092) (0.146) (0.119) (0.235) (0.109) (0.166) (0.244) (0.363)
New Immigrants 0.901** 0.602** -0.039** -0.259* -0.238** -0.121 0.179** -0.018(0.015) (0.148) (0.010) (0.104) (0.007) (0.067) (0.007) (0.066)
Return NZers 4.632** 1.689* -0.048 1.348** -1.260** -0.441* 4.940** -0.218(0.189) (0.724) (0.064) (0.345) (0.032) (0.188) (0.240) (0.751)
Covariates No Yes No Yes No Yes No Yes No Yes
Net Change in Settled NZersChange in Population
140 Local Labour Market Areas (n=560)
58 Local Labour Market Areas (n=232)
73 Territorial Local Authorities (n=292)
16 Regional Councils (n=64)
Net Change in Settled Immigrants
New ImmigrantsReturn New Zealanders
1655 Area Units (n=6620)