Housing Market Assessment: Park City
37
2010 Bureau of Economic and Business Research David Eccles School of Business University of Utah September 2010 Housing Market Assessment: Park City
Transcript of Housing Market Assessment: Park City

2010
Bureau of Economic and Business
Research
David Eccles School of Business
University of Utah
September 2010
Housing Market Assessment: Park City


Housing Market Assessment: Park City
Produced by: James A. Wood, Director
John C. Downen, Research Analyst
Bureau of Economic and Business Research David Eccles School of Business
University of Utah 1645 E. Campus Center Drive, Room 401
Salt Lake City, UT 84112 801.581.7165
September 2010
© 2010 Bureau of Economic and Business Research, University of Utah

Housing Market Assessment: Park City i
CONTENTS
List of Tables ....................................................................................................................................................... i
List of Exhibits...................................................................................................................................................ii
Key Findings.......................................................................................................................................................1 Housing Supply Conditions: Estimates, Characteristics and Trends.....................................................1 Determinants of Housing Demand............................................................................................................2 Housing Affordability and Needs Assessment .........................................................................................3
1 Housing Supply Estimates, Characteristics and Trends ...........................................................................6 Estimates of Housing Inventory.................................................................................................................6 Housing Prices ...............................................................................................................................................7 Rental Rates....................................................................................................................................................8 Special Needs Inventory...............................................................................................................................9 Affordable Housing Inventory: Housing Resolution and Tax Credit Units ........................................9
2 Determinants of Housing Demand...........................................................................................................17 Population and Households.......................................................................................................................17 Age Structure and Minority Population ...................................................................................................17 Household Income......................................................................................................................................19 Employment and Wages ............................................................................................................................19 Mortgage and Consumer Debt..................................................................................................................22 Housing Market Conditions ......................................................................................................................22
3 Housing Affordability and Needs Assessment ........................................................................................24 Affordability Calculations ..........................................................................................................................24 Availability of Affordable Housing...........................................................................................................26
Affordability of Owner-Occupied Housing .......................................................................................26 Affordability of Renter-Occupied Housing........................................................................................28
Housing Needs Assessment ......................................................................................................................30 Owner-Occupied Units..........................................................................................................................30 Renter-Occupied Units ..........................................................................................................................31
L I S T OF TAB L ES Table A Median Rental Rates in Summit County, 2010...............................................................................2 Table B Housing Cost Burden for Renters in Park City, 2000 ...................................................................4
Table 1.1 Park City Housing Stock, 2000 & 2009.........................................................................................6 Table 1.2 Park City Median Price of Existing Single-Family Homes Sold, 2000–2009 ..........................8 Table 1.3 Park City Median Price of Existing Multifamily Homes Sold, 2000–2009..............................8 Table 1.4 Median Rental Rates in Summit County, 2010 ............................................................................8 Table 1.5 Inventory of Affordable Housing Units Produced and Pending from Nonprofit and
Government-Sponsored Programs..............................................................................................10 Table 1.6 Unit Mix for Affordable Rental Projects ....................................................................................10
Table 2.1 Park City Population Change, 2000–2009 ..................................................................................17

Housing Market Assessment: Park City ii
Table 2.2 Park City Median Household Income, 2000–2008 ...................................................................19 Table 2.3 Park City Average Covered Employment by Industry, 2001–2008........................................20 Table 2.4 Park City Employment Shares, 2001–2008 ................................................................................21 Table 2.5 Average Annual Wages by Industry in Park City, 2001–2008 .................................................21 Table 2.6 Share of Mortgage Loans 90+ Days Delinquent .......................................................................22 Table 2.7 Share of Mortgage Loans in Foreclosure by Type of Loan .....................................................22 Table 2.8 Share of Auto Loans and Bank Card Debt 60+ Days Delinquent .........................................22
Table 3.1 Household Income by AMI Level for Summit County............................................................24 Table 3.2 Affordable Home Prices by Income Category for Park City...................................................24 Table 3.3 Affordability Calculations for Park City......................................................................................25 Table 3.4 Number and Share of Housing Units Sold that Were Affordable to Median-Income
Households in Park City................................................................................................................26 Table 3.5 Number and Share of Housing Units Sold that Were Affordable to Moderate-Income
Households (80% AMI) in Park City ..........................................................................................27 Table 3.6 Number and Share of Housing Units Sold that Were Affordable to Low-Income
Households (50% AMI) in Park City ..........................................................................................28 Table 3.7 Number of Units Affordable by Income Category, 2000 and 2009 .......................................29 Table 3.8 Affordable Rental Rate Ranges by Type of Unit and Income Category
for Summit County, 2010..............................................................................................................29 Table 3.9 AMI Targets of Tax Credit Projects ............................................................................................30 Table 3.10 Housing Cost Burden for Renters in Park City, 2000.............................................................31
L I S T OF EXH I B I T S Exhibit 1.1 Park City Permit-Authorized New Dwelling Units by Type, 2000–2009.............................7 Exhibit 2.1 Park City Population by Age and Sex, Race, and Ethnicity: 2000 .......................................18

Housing Market Assessment: Park City 1
KE Y F I N D I N G S Housing Supply Conditions: Estimates, Characteristics and Trends
¶ At year-end 2009 Park City had an inventory of 8,400 housing units. Only 3,000 units were occu-pied, approximately 1,770 owner-occupied units and 1,230 renter-occupied units. Rental units ac-counted for 41 percent of the occupied housing inventory.
¶ Since 2000 Park City’s housing inventory has increased by nearly 1,700 units, from 6,700 to 8,400
units. Condominiums accounted for 60 percent of new residential construction and the remaining 40 percent was detached single-family homes.
¶ Over the past ten years two important features of housing development in Park City have been (1)
the total absence of new apartment units and (2) the high concentration of second homes. Over 80 percent of the new residential units built from 2000 to 2009 were second homes. Consequently the share of occupied housing units has dropped from 41 percent of total units to 36 percent.
¶ A corollary of the declining shares of owner- and renter-occupied units is an aging rental stock for
year-round residents. In 2010 the median age of owner-occupied units is about 25 years and for rental units 30 years.
¶ Park City is the highest-priced housing market in the state. The median sales price of a detached
single-family home in 2010 (through July) was $1.2 million. The median price of homes sold peaked in 2008 at $1.8 million, a near tripling of the median sales price only four years earlier.
¶ The median sales price for an attached condominium unit in 2010 (through July) was $1.0 million.
In 2005, the peak year for condominium sales activity, the median sales price was $380,000. Both condominiums and homes have experienced a price explosion and despite some recent weakness prices are still far above the level of just a few years ago.
¶ Countywide rental rates were used as a surrogate for Park City rental rates. The city accounts for
more than half of all rental units in the county. The rental market in Summit County is divided into two market segments: apartment units and condominiums for rent. For all types of units, condominium rental rates are higher than apartment rental rates. Due to the dominance of con-dominiums in the market the condominium rental rates are likely much closer to the prevailing rental rate. This is verified by HUD’s 2010 Fair Market Rents for Summit County, which are simi-lar to rental rates for condominiums.
¶ Renters paying close to Fair Market Rents for two and three bedroom rental units have sufficient
income to buy condominium units priced at about $180,000 and $250,000 respectively. About 60 percent of all renters in Park City have incomes above 50 percent AMI. If a fraction of these 750 higher income renters were induced by favorable interest rates and market conditions to move to homeownership a significant number of rental units would be “freed-up” thereby offsetting and alleviating some supply constraints and pressures on the local rental market.

Housing Market Assessment: Park City 2
Table A
Median Rental Rates in Summit County, 2010
Type Apartments Condominiums Fair Market
Rent*
Affordable Home Price at
FMR** Studio $650 $700 $686 $116,300
One-Bedroom $750 $850 $953 $161,700
Two-Bedroom $850 $1,150 $1,059 $179,750
Three-Bedroom $1,150 $1,600 $1,483 $251,660 *Fair Market Rent is gross rent (including utilities) at the 40th percentile. **Assumes 5 percent mortgage interest rate and 3 percent down payment. Mortgage payment includes principal, interest, mortgage insurance, home insurance and property tax. Source: Park Record.
¶ Government and nonprofit entities have provided affordable housing units for the Park City mar-
ket. There are a total of 455 existing affordable housing units sponsored through government pro-grams. Sixty-eight of these units are owner-occupied and 387 are renter-occupied. A substantial majority of these affordable housing units are tax credit units. There are six tax credit rental pro-jects in the city with a total of 326 units. The second largest source of affordable housing has been the city’s housing resolutions, which have required developers to add 59 units to the affordable housing inventory: 46 renter-occupied and 13 owner-occupied units. Through the housing resolu-tions an additional 97 affordable housing units are pending development.
Determinants of Housing Demand
¶ The population and number of households in Park City have increased at about a 1 percent annual rate over the past decade. Consequently, the demand for year-round resident housing has been quite modest. While household growth is a prime determinant of the demand for year-round housing, the demand for second homes in Park City is independent of local demographic and economic trends. Consequently, residential construction in Park City will almost always exceed household growth by a significant amount due to second-home development.
¶ The estimated population of Park City in 2009 was 8,127 and the number of households was
2,988. Since 2000 the population has increased by 665 and the number of households by 244. The relatively slow rate of growth is due to the economic recession as well as supply constraints: land prices, limited developable residential land and zoning ordinances.
¶ The slow rate of demographic growth in Park City is also inextricably linked to the high cost of
both owner- and renter-occupied housing. Few households can afford to own homes in the city and the stagnant rental inventory leaves little opportunity for the growth of renter households.
¶ The Park City population is relatively old with a median age of 32.7 years, more than five years
above the statewide median age. The city has a disproportionate share of people between 25 and 64 years old. Sixty-one percent of the population is in this age group compared with only 45 per-cent statewide. Park City has relatively few young children and seniors. This rather unique demo-graphic profile reflects the characteristics of the housing inventory.
Housing Market Assessment: Park City 3
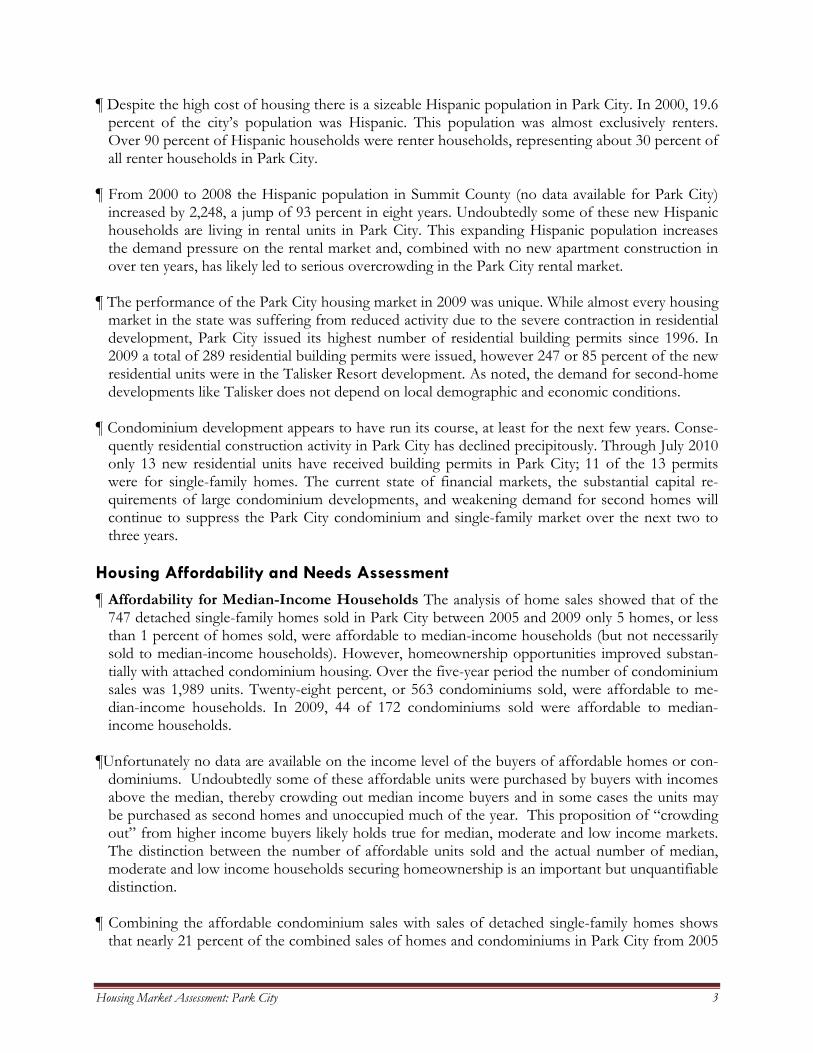
¶ Despite the high cost of housing there is a sizeable Hispanic population in Park City. In 2000, 19.6 percent of the city’s population was Hispanic. This population was almost exclusively renters. Over 90 percent of Hispanic households were renter households, representing about 30 percent of all renter households in Park City.
¶ From 2000 to 2008 the Hispanic population in Summit County (no data available for Park City)
increased by 2,248, a jump of 93 percent in eight years. Undoubtedly some of these new Hispanic households are living in rental units in Park City. This expanding Hispanic population increases the demand pressure on the rental market and, combined with no new apartment construction in over ten years, has likely led to serious overcrowding in the Park City rental market.
¶ The performance of the Park City housing market in 2009 was unique. While almost every housing
market in the state was suffering from reduced activity due to the severe contraction in residential development, Park City issued its highest number of residential building permits since 1996. In 2009 a total of 289 residential building permits were issued, however 247 or 85 percent of the new residential units were in the Talisker Resort development. As noted, the demand for second-home developments like Talisker does not depend on local demographic and economic conditions.
¶ Condominium development appears to have run its course, at least for the next few years. Conse-
quently residential construction activity in Park City has declined precipitously. Through July 2010 only 13 new residential units have received building permits in Park City; 11 of the 13 permits were for single-family homes. The current state of financial markets, the substantial capital re-quirements of large condominium developments, and weakening demand for second homes will continue to suppress the Park City condominium and single-family market over the next two to three years.
Housing Affordability and Needs Assessment
¶ Affordability for Median-Income Households The analysis of home sales showed that of the 747 detached single-family homes sold in Park City between 2005 and 2009 only 5 homes, or less than 1 percent of homes sold, were affordable to median-income households (but not necessarily sold to median-income households). However, homeownership opportunities improved substan-tially with attached condominium housing. Over the five-year period the number of condominium sales was 1,989 units. Twenty-eight percent, or 563 condominiums sold, were affordable to me-dian-income households. In 2009, 44 of 172 condominiums sold were affordable to median-income households.
¶Unfortunately no data are available on the income level of the buyers of affordable homes or con-
dominiums. Undoubtedly some of these affordable units were purchased by buyers with incomes above the median, thereby crowding out median income buyers and in some cases the units may be purchased as second homes and unoccupied much of the year. This proposition of “crowding out” from higher income buyers likely holds true for median, moderate and low income markets. The distinction between the number of affordable units sold and the actual number of median, moderate and low income households securing homeownership is an important but unquantifiable distinction.
¶ Combining the affordable condominium sales with sales of detached single-family homes shows
that nearly 21 percent of the combined sales of homes and condominiums in Park City from 2005

Housing Market Assessment: Park City 4
through 2009 were affordable to median-income households. In most communities affordability has generally returned to the 2005 level, but not so in Park City. Seventeen percent of condomini-ums and homes were affordable in 2009, the same percentage as in 2008. The highest level of af-fordability in recent years was in 2005 when 30 percent of homes and condominiums sold in Park City were affordable.
¶ Affordability for Moderate-Income Households (80% AMI) Opportunities for home owner-
ship vanish for moderate-income households. No detached single-family homes sold in Park City were affordable to moderate-income households. Again, condominiums provide opportunities with 460 affordable units sold over the five-year period. For combined single-family and condo-minium sales, 16.8 percent of all units sold from 2005 through 2009 were affordable for moderate-income households. All affordable units were condominium units.
¶ Affordability for Low-Income Households (50% AMI) Low-income households could afford
only 9.3 percent of the combined detached single-family homes and attached condominiums sold in Park City since 2005. All 254 of the affordable dwellings were condominium units. The limited opportunity of homeownership for low-income households is a characteristic of most housing markets. Housing market conditions and land and home prices generally exclude low-income households from ownership.
¶ The lack of new rental units in Park City is a serious affordability constraint. In a growing econ-
omy, with low wage rates it is almost impossible for a housing market to make any progress in im-proving affordability without producing rental units.
¶ Many renters in Park City have high housing-cost burdens. Census and HUD data show that in
2000 one-third of all renters spent more than 30 percent of their income on rent and utilities and 13 percent spent more than 50 percent. Very-low-income renters—with incomes less than 30 per-cent AMI—had the greatest share of cost-burdened renters. Nearly 70 percent of very-low-income renters had at least a 30 percent housing-cost burden and 40 percent had cost burdens above 50 percent. The relative cost burden by income category probably has not changed much over the past several years. Any increases in incomes since 2000 have likely been offset by increases in rental rates.
Table B
Housing Cost Burden for Renters in Park City, 2000
Cost Burden
Income Category Renters >30% of Income
>50% of Income
≤30% AMI 220 150 93 30%–50% AMI 170 97 33 50%–80% AMI 180 46 8 ≥80% AMI 458 55 0 Total Renters 1,028 348 134 Source: HUD CHAS 2000.
¶ Low wage rates, high rents and no apartment construction in ten years have created an urgent
need for affordable rental units for low- and very-low-income renters in Park City. The need,

Housing Market Assessment: Park City 5
however, is difficult to quantify from the characteristics of the local rental market. Demand de-rived from an analysis of the local market will understate the overall demand for rental housing since it does not account for the significant level of pent-up demand from those commuting workers who now reside outside Park City and Summit County due to the lack of affordable rental housing. In 2000 one-third of workers in Summit County lived outside of the county. Therefore a conservative assumption for 2010 is that in 2010 at least one-quarter of the workforce in Park City—3,750 workers—resides outside the county. These commuters represent a sizeable pool of pent-up demand for low- and very-low-income rental housing.
¶ At a minimum, 120 tax credit units are needed in Park City over the next five years. These units
should have target rents below 45 percent AMI. Excluding utilities, the rents should not exceed $750 for a one-bedroom unit, $890 for a two-bedroom unit and $1,025 for a three-bedroom unit. The demand for affordable rental units in Park City far exceeds the supply as the local housing market is in a position of “if we build it they will come.” Nevertheless, supply constraints will per-sist—lack of suitable land, land prices, neighborhood opposition, and zoning ordinances—consequently the development of affordable tax credit units will not occur without the strong sup-port and participation of the city.
¶ The number of full-time resident households in Park City will grow by about 2.5 percent annually
over the next five years, from 3,000 to 3,400. This growth rate will generate demand for about 400 new housing units by 2015. These additional units should include 80 affordable (median income) owner-occupied units priced from $200,000 to $275,000, 120 affordable rental units for low-wage workers with target rents below 45 percent AMI, and the remaining 200 units owner-occupied units for households with incomes above the median. Should the growth rate and number of new households change, the recommended distribution of new housing units should continue to ap-proximate 20 percent median-income owner-occupied units, 30 percent low- and very-low-income tax credit rental units, and 50 percent market-rate housing for all income categories above median income.
¶ Housing affordability has been a persistent problem in Park City and has led to slow rates of
demographic growth, a growing concentration of unoccupied housing units, a lack of housing di-versity, overcrowding in the rental market, and a limited number of new year-round residential units for the aging housing inventory. Not much, however, can be done to affect affordability of the existing housing stock and its consequences. Any improvement in affordability must rely on the type and character of new residential development and the vigorous application of affordable housing guidelines and policy.

Housing Market Assessment: Park City 6
HO U S I N G SU P P LY ES T I M AT E S, CH A R AC T E R I S T I C S A N D TR E N D S Estimates of Housing Inventory
From 2000 through 2009 Park City’s housing stock grew by one-quarter, from 6,714 dwelling units to 8,401 (Table 1.1). This growth was entirely among owned units; no new apartment buildings were constructed over the period. Note that many of these units are time-shares or other vacation proper-ties; condos and twin homes made up more than 60 percent of the new construction. Because no new rental units were built, the owned stock grew from 80 percent of the total stock in 2000 to 84 percent in 2009. Another consequence of the large number of vaca-tion properties in Park City is that it has the highest vacancy rates in the Mountainland Association of Governments, with 64 percent of all dwelling units unoccupied in 2009. The rate is even higher among the owned housing stock: 75 percent of the units were vacant in 2009 as second and recreational homes increased as a share of the owned housing stock. The rental market is relatively “tight.” Only 100 units of 1,330 rental units were vacant in 2009, a 7.5 percent vacancy rate. As of 2009, just 1,770 of 7,071 owned units were occupied and 1,230 of 1,330 rental units were occupied. Exhibit 1.1 shows annual permits issued for new residential construction in Park City from January 2000 through December 2009 by type of structure. Permits were issued for a total of 1,687 new dwelling units over the period. Condominiums ac-counted for 53 percent (893 units) and single-family homes for 40 percent (672 homes) of the new construction, with the rest being twin homes (122 dwelling units). As noted above, no new apart-ments were built. Residential construction activity in Park City declined from 195 dwelling units in 2000 to just 59 in 2002, then rebounded and peaked in 2006–07 at just over 240 units. Construction plummeted in 2008 to just 37 units, and would have been even lower in 2009 without the 262-unit luxury condo-minium project in Deer Valley.1 Prior to the credit crisis, single-family-home construction peaked in 2006 with 122 permits issued, almost 140 percent higher than its 2002 trough of 51 homes. Condo-minium construction peaked a year later with 164 permit-authorized units, versus none in 2002.
1 Note: It is not clear how many of these units are condominiums. According to the project’s web site (www.montagedeervalley.com), there will be at least 81 “private residences,” with the rest being “guest rooms and suites.”
1
Table 1.1 Park City Housing Stock,
2000 & 2009
2000 2009 Change Total Housing Stock 6,714 8,401 25.1%
Occupied 2,741 3,000 9.4% Share of Total Units 40.8% 35.7%
Vacant 3,973 5,401 35.9% Share of Total Units 59.2% 64.3%
Owned Housing Stock 5,384 7,071 31.3% Share of Total Units 80.2% 84.2% Occupied 1,681 1,770 Vacant 3,703 5,301
Vacancy Rate 68.8% 74.5% Rental Housing Stock 1,330 1,330 0.0%
Share of Total Units 19.8% 15.8% Occupied 1,060 1,230 Vacant 270 100
Vacancy Rate 20.3% 7.5% Note: 2000 figures are as of April 1; 2009 figures are as of December 31. Source: U.S. Census Bureau (2000) and Bureau of Economic and Business Research, University of Utah (2009).

Housing Market Assessment: Park City 7
Exhibit 1.1 Park City Permit-Authorized New Dwelling Units by Type, 2000–2009
Structure Type 2000 2001 2002 2003 2004 2005 2006 2007 2008 2009 Total Single-Family Homes 83 54 51 62 97 84 122 62 30 27 672 Duplexes and Twin Homes 4 4 8 8 44 10 22 18 4 0 122 Condominiums 108 61 0 22 44 130 99 164 3 262 893 Apartments (3 or more units) 0 0 0 0 0 0 0 0 0 0 0 Cabins 0 0 0 0 0 0 0 0 0 0 0 Manufactured / Mobile Homes 0 0 0 0 0 0 0 0 0 0 0 Total 195 119 59 92 185 224 243 244 37 289 1,687
0
50
100
150
200
250
300
350
2000
2001
2002
2003
2004
2005
2006
2007
2008
2009
Perm
it-A
uth
ori
zed
Dw
ell
ing
Un
its
TotalSingle-Family Homes Condominiums
0
5
10
15
20
25
30
35
40
45
50
2000
2001
2002
2003
2004
2005
2006
2007
2008
2009
Perm
it-A
uth
ori
zed
Dw
ell
ing
Un
its
Twin Homes
Source: Bureau of Economic and Business Research, Construction Database.
Housing Prices
The Park City Board of Realtors provides existing-home sales data for Park City from 2000 through 2009. In 2000, the median price of existing single-family homes sold was $635,000 (in current dol-lars) (Table 1.2). The nominal median price increased 6 percent in 2001, then fell almost 12 percent in 2002 to $596,000 in response to the recession. Single-family home prices then grew consistently to a peak median sales price of $1.8 million in 2008. The largest gains were in 2005 and 2006, when the median price jumped 44 and 51 percent, respectively. In 2009 the median single-family home price in Park City fell 23 percent to less than $1.4 million—still higher (in nominal terms) than in 2005. Prices continued to fall through the first half of 2010, with the median sale price reaching $1.2 million. The nominal median price of existing multifamily homes in Park City has been somewhat more volatile than that of single-family homes (Table 1.3). From $360,000 in 2000 (in current dollars), the median price fell almost 18 percent in 2001 to $295,750. After a 15 percent gain in 2002 prices fell 22 percent in 2003. This was followed by four years of continuous growth, with nominal prices peaking at $994,500 in 2007. Prices then fell 17 percent in 2008 and a further 10 percent in 2009 to reach $744,775. However, the first half of 2010 saw a significant turnaround, with the median multi-family home price rising by more than one-third to $1.0 million.
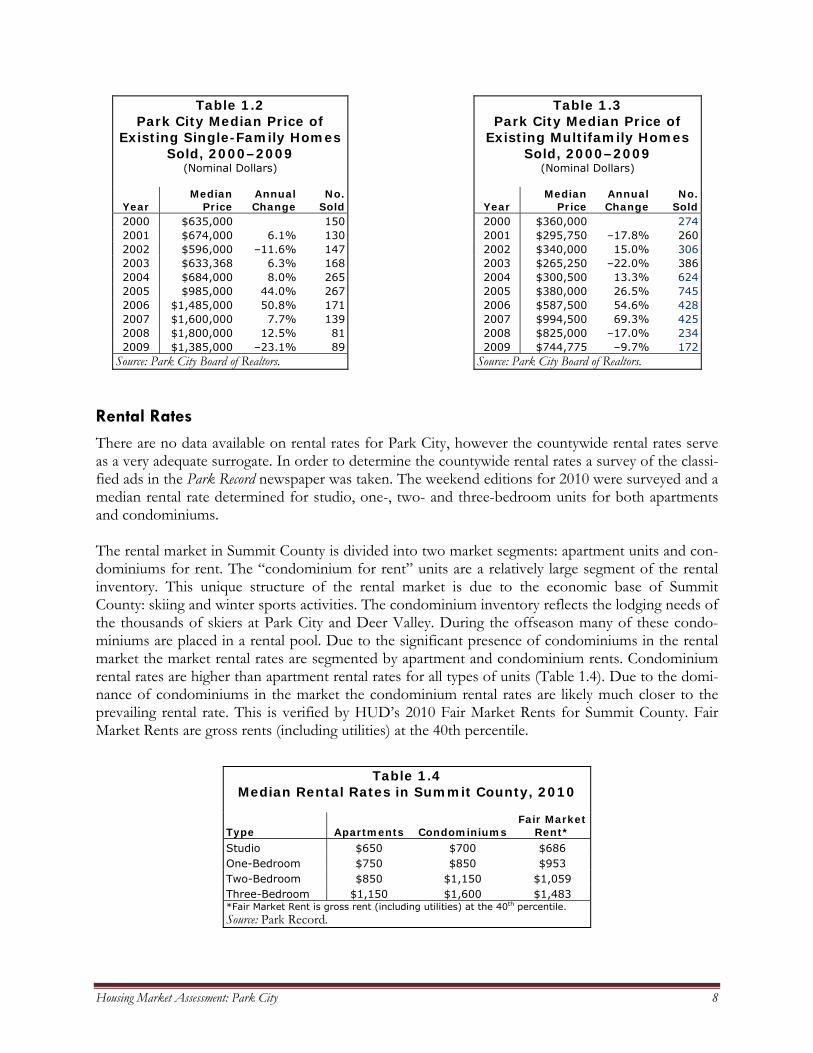
Housing Market Assessment: Park City 8
Table 1.2 Park City Median Price of
Existing Single-Family Homes Sold, 2000–2009
(Nominal Dollars)
Table 1.3 Park City Median Price of
Existing Multifamily Homes Sold, 2000–2009
(Nominal Dollars)
Year Median
Price Annual Change
No. Sold Year
Median Price
Annual Change
No. Sold
2000 $635,000 150 2000 $360,000 274 2001 $674,000 6.1% 130 2001 $295,750 –17.8% 260 2002 $596,000 –11.6% 147 2002 $340,000 15.0% 306 2003 $633,368 6.3% 168 2003 $265,250 –22.0% 386 2004 $684,000 8.0% 265 2004 $300,500 13.3% 624 2005 $985,000 44.0% 267 2005 $380,000 26.5% 745 2006 $1,485,000 50.8% 171 2006 $587,500 54.6% 428 2007 $1,600,000 7.7% 139 2007 $994,500 69.3% 425 2008 $1,800,000 12.5% 81 2008 $825,000 –17.0% 234 2009 $1,385,000 –23.1% 89 2009 $744,775 –9.7% 172
Source: Park City Board of Realtors. Source: Park City Board of Realtors. Rental Rates
There are no data available on rental rates for Park City, however the countywide rental rates serve as a very adequate surrogate. In order to determine the countywide rental rates a survey of the classi-fied ads in the Park Record newspaper was taken. The weekend editions for 2010 were surveyed and a median rental rate determined for studio, one-, two- and three-bedroom units for both apartments and condominiums. The rental market in Summit County is divided into two market segments: apartment units and con-dominiums for rent. The “condominium for rent” units are a relatively large segment of the rental inventory. This unique structure of the rental market is due to the economic base of Summit County: skiing and winter sports activities. The condominium inventory reflects the lodging needs of the thousands of skiers at Park City and Deer Valley. During the offseason many of these condo-miniums are placed in a rental pool. Due to the significant presence of condominiums in the rental market the market rental rates are segmented by apartment and condominium rents. Condominium rental rates are higher than apartment rental rates for all types of units (Table 1.4). Due to the domi-nance of condominiums in the market the condominium rental rates are likely much closer to the prevailing rental rate. This is verified by HUD’s 2010 Fair Market Rents for Summit County. Fair Market Rents are gross rents (including utilities) at the 40th percentile.
Table 1.4
Median Rental Rates in Summit County, 2010
Type Apartments Condominiums Fair Market
Rent* Studio $650 $700 $686 One-Bedroom $750 $850 $953 Two-Bedroom $850 $1,150 $1,059 Three-Bedroom $1,150 $1,600 $1,483 *Fair Market Rent is gross rent (including utilities) at the 40th percentile. Source: Park Record.
Housing Market Assessment: Park City 9
Special Needs Inventory
HUD requires state and certain local communities to prepare, every five years, a Consolidated Plan in order to receive Community Development Block Grants. In the consolidated plan HUD recom-mends that jurisdictions review the housing inventory of special needs populations defined as eld-erly, disabled, victims of domestic violence, homeless, large families and individuals with HIV/ AIDS. Generally, special needs housing is developed in counties or areas with populations much larger than Summit County or Park City. Most of the smaller communities do not provide special needs housing, however Mountainland Community Housing Trust does have a small number of units for transitional housing and victims of domestic violence in Park City. There are seven transi-tional housing units in Park City and the Peace House provides space for up to 15 victims of domes-tic violence.
Affordable Housing Inventory: Housing Resolution and Tax Credit Units
Park City has passed a number of affordable housing resolutions—the first in 1993 and the most recent in 2007—that have resulted in 59 affordable housing units: 46 rental units and 13 owner-occupied units (Table 1.5). The housing resolution units were all built between 1998 and 2009 and are located in Empire Pass, Silver Star and at 1465 Park Avenue. The rental units generally rent for $700 for a one-bedroom unit and $900 for a two-bedroom unit. The owner-occupied units generally range between $175,000 and $200,000. In addition to the developed units produced through housing resolutions, there are another 188 units that are pending. The mix of renter to owner units of the pending units has yet to be determined. Tax credit projects are the major source of affordable rental units in Park City. There are six tax credit projects with a total of 326 units. Two of the tax credit projects, Parkside and Holiday Village, carry Rural Development 515 vouchers thus providing deep subsidies to low- and very-low-income tenants. The unit mix for the affordable rental units is heavily concentrated in three-bedroom units. Fifty-three percent of all affordable rentals are three-bedroom units. Only 29 percent of affordable rentals are two-bedroom units. Typically, two-bedroom units account for about 40 percent of rental units in the rental inventory (Table 1.6).

Housing Market Assessment: Park City 10
Table 1.5 Inventory of Affordable Housing Units Produced and Pending from
Nonprofit and Government-Sponsored Programs
Project Year Built Rental Units
Owner Units
Pending Units
Total Units
Housing Resolution Units Flagstaff Mtn / Empire Pass 2005–2009 28 1 53 82 Silver Star 2005–2009 10 10 0 20 1465 Park Avenue 1998 6 2 0 8 IHC/USA Annexation 28 28 Park City Heights Annexation 16 16 Deer Crest Janna 2009 2 2 Total 46 13 97 156
Tax Credit Units Silver Meadows* 1996 29* 20 0 49 Aspen Villas 1997 88 0 0 88 Parkside 1980 42 0 0 42 Iron Horse 1998 94 0 0 94 Washington Mill 1995 8 0 0 8 Holiday Village 1978 80 0 0 80 Total 341 20 0 361
Nonprofit Developers The Line Condominiums 2006 22 0 22 Marsac Avenue (Habitat) 2 2
Park City Produced Snow Creek Cottages 2010 13 0 13 Park City Heights 35 35
Other 1440 Empire Ave. 9 9 Lower Park Ave RDA 45 45 Treasure Hill ? ?
Grand Total 387 68 188 643 *Only fourteen of these units are tax credit units – the rest are deed restricted. Source: Park City Affordable Housing Sustainability Team.
Table 1.6
Unit Mix for Affordable Rental Projects
Project Studio One-
Bedroom Two-
Bedroom Three-
Bedroom Total Units
Flagstaff Mtn / Empire Pass 23 5 28 Silver Star 4 6 10 Deer Crest Janna 2 2 1465 Park Avenue 6 6 Aspen Villas 18 70 88 Holiday Village 40 40 80 Iron Horse 94 94 Parkside 30 12 42 Silver Meadows 5 24 29 Washington Mill 8 8 Total 23 44 114 206 387 Source: Utah Housing Corporation and Park City.
Profiles and photographs of Park City’s tax credit projects are provided below.

Housing Market Assessment: Park City 11
Aspen Villas 21847 Kearns Blvd.
Park City
Total Units: 88 units Year Built: 1997
Two-Bedroom Category One-Bedroom
One-Bath Two-Bath Three-Bedroom
Number of Units 0 18 70 Average Square Feet 0 877 990 Vacant Units 0 0 0

Housing Market Assessment: Park City 12
Holiday Village 2200 Monitor Drive
Park City
Total Units: 80 units Year Built: 1978
Two-Bedroom Category One-Bedroom
One-Bath Two-Bath Three-Bedroom
Number of Units 40 40 0 0 Average Square Feet 613 789 0 0 Vacant Units 0 0 0 0
Housing Market Assessment: Park City 13
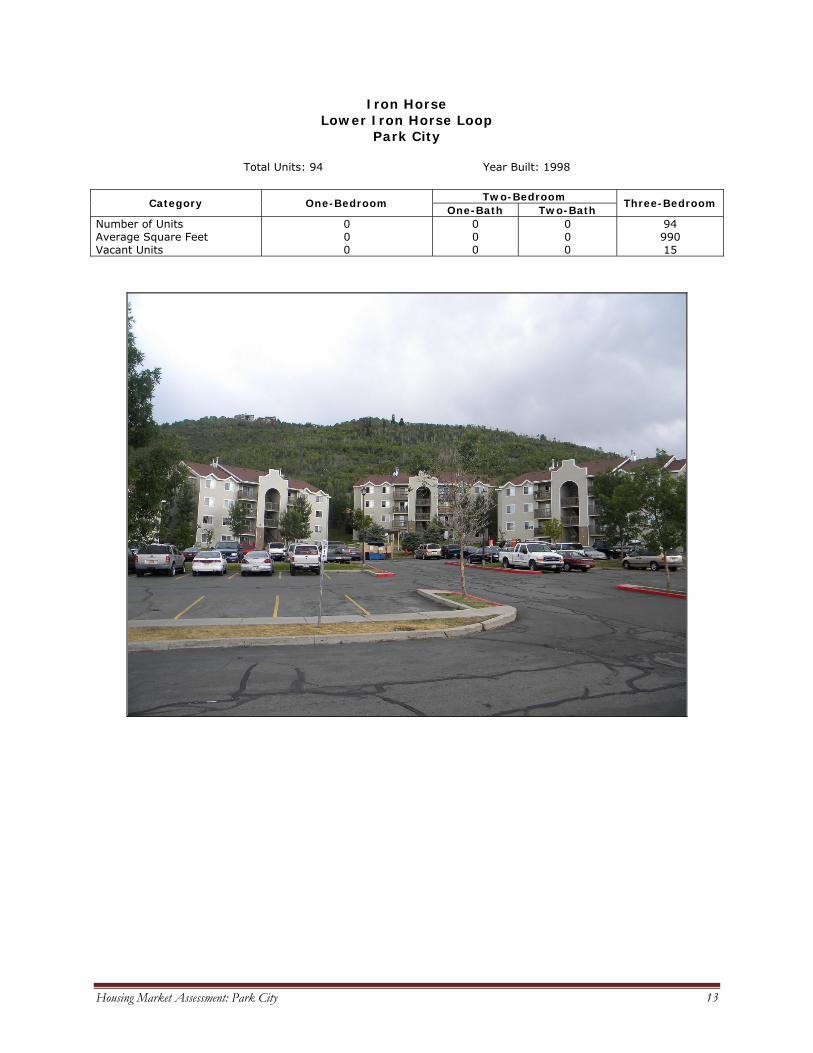
Iron Horse Lower Iron Horse Loop
Park City
Total Units: 94 Year Built: 1998
Two-Bedroom Category One-Bedroom
One-Bath Two-Bath Three-Bedroom
Number of Units 0 0 0 94 Average Square Feet 0 0 0 990 Vacant Units 0 0 0 15

Housing Market Assessment: Park City 14
Parkside 1776 Kearns Boulevard
Park City
Total Units: 42 units Year Built: 1980
Two-Bedroom Category One-Bedroom
One Bath Two Bath Three-Bedroom
Number of Units 0 30 0 12 Average Square Feet 0 834 0 1,470 Vacant Units 0 0 0 0

Housing Market Assessment: Park City 15
Silver Meadows 1847 Kearns Blvd.
Park City Total Units: 49 units Year Built: 1996
Tax Credit: 14 units Deed Restricted: 35 units 20 owned, 15 rented
Two-Bedroom
Category One-Bedroom One-Bath Two-Bath
Three-Bedroom
Number of Units 0 0 0 14 tax credit units Average Square Feet 0 0 0 1,009 Vacant Units 0 0 0 0

Housing Market Assessment: Park City 16
Washington Mill 240–270 Daly Avenue
Park City
Total Units: 8 units Year Built: 1995
Two-Bedroom Category One-Bedroom
One-Bath Two-Bath Three-Bedroom
Number of Units 0 8 0 0 Average Square Feet 0 800 0 0

Housing Market Assessment: Park City 17
DE T E R M I N A N T S O F HO U S I N G DE M A N D Population and Households
Population growth was moderate in Park City from 2000 to 2009. The city’s population added an estimated 665 persons, at an average annual growth rate of 0.95 percent, to reach 8,127 (Table 2.1). Growth was steady from 2000 through 2005, then saw a slight decline in 2006 (–1.2 percent) followed by modest growth for the remainder of the decade. Park City’s average household size was 2.72 as of April 1, 2000. The average household size for all of Summit County in 2000 was 2.87. The American Community Survey provides a 2006–2008 estimate of the county’s household size of 2.89 ±0.14, which is not significantly different from the size in 2000. There-fore, it is probably safe to assume that household size did not change significantly in Park City between 2000 and 2009. Given a constant size of 2.72 persons, there were an estimated 2,743 households as of July 1, 2000 and 2,988 as of July 1, 2009—an increase of 244. Age Structure and Minority Population
The age distribution of the population has likely not changed significantly since 2000. Exhibit 2.1 shows Park City’s population by age and sex, as well as the mi-nority population in 2000. The town’s population has a disproportionate concentration in the work-ing-age population, specifically those aged from 25 through 64. This segment represented 61 percent of Park City’s population in 2000, versus 45 percent in the state as a whole. Park City’s 2000 median age of 32.7 was 5.6 years older than the statewide median of 27.1. The narrow base of the age pyra-mid indicates low fertility rates, few children, generally small families, and an aging population. These conclusions are based on Census data, however in communities with high concentrations of minority populations the population is often undercounted by the Census. The undercount is due to reluctance of minority populations to participate in the Census. The undercount may alter the demographic characteristics of a city or county. One of the most common causes of an undercount is the doubling up of households in a single housing unit. Often the second household does not re-port their presence to the Census, thus their demographic characteristics are not recorded. Park City’s population is skewed toward males, with 119 for every 100 females in 2000. In only four of the 18 five-year age groups were there more females than males: 40 to 44, 45 to 49, 80 to 84, and 85-plus. In the younger two age groups the ratio was quite close, with 99 and 95 males per 100 fe-males, respectively. But in the older two groups women outnumbered men by 2-to-1 and 4-to-1, re-spectively. This weighting toward males is common in resort towns, which disproportionately attract young men who come to recreate and work at the resorts. The figures here may also be affected by the build-up to the 2002 Winter Olympics, which had several sites in and around Park City. Some of the more extreme imbalances in the older age groups may also be due to the fact that these are small numbers, so that small differences produce large results.
2
Table 2.1 Park City Population Change, 2000–2009
Year Population Households 2000 7,462 2,743 2001 7,680 2,824 2002 7,726 2,840 2003 7,806 2,870 2004 7,877 2,896 2005 8,019 2,948 2006 7,923 2,913 2007 8,004 2,943 2008 8,008 2,944 2009 8,127 2,988
Change 665 244 Note: Figures are as of July 1. Source: U.S. Census Bureau and Bureau of Economic and Business Research, University of Utah.

Housing Market Assessment: Park City 18
In 2000, minorities made up almost 23 percent of Park City’s population, with 86 percent of these being Hispanics. Non-Hispanic whites accounted for 77 percent of the population. After Hispanics, who represented almost 20 percent of the population, the next largest minority group in Park City was Asians, with 8 percent of the minority population and almost 2 percent of the total population. Park City’s shares of total minorities, Hispanics, and Asians were all above the state averages of 14.7, 9.0, and 1.6 percent, respectively. Only two major cities, South Salt Lake and Midvale, had a greater
Exhibit 2.1 Park City Population by Age and Sex, Race, and Ethnicity: 2000
Population by 5-Year Age Groups and Sex
500 400 300 200 100 0 100 200 300 400 500
Under 5
5 - 9
10 - 14
15 - 19
20 - 24
25 - 29
30 - 34
35 - 39
40 - 44
45 - 49
50 - 54
55 - 59
60 - 64
65 - 69
70 - 74
75 - 79
80 - 84
85 +
Male Female
Minority Population Composition
Black alone (NH)0.8%
AIAN alone (NH)1.1%
Asian alone (NH)8.1%
NHPI alone (NH)0.1%
Some other race alone
(NH)0.1%
Two or more races (NH)
3.9%
Hispanic86.0%
Age Distribution of the Park City Population Race and Ethnicity of the Park City Population
Male Female Sex
Ratio Share Share of
State Population Share Share of
State Under 5 186 186 1.00 5.0% 0.2% Total 7,371 100% 0.3%
5–9 238 201 1.18 6.0% 0.2% 10–14 286 247 1.16 7.2% 0.3% Not Hispanic or Latino 5,923 80.4% 0.3% 15–19 323 226 1.43 7.4% 0.3% White alone 5,687 77.2% 0.3% 20–24 364 303 1.20 9.0% 0.3% Black or African American alone 14 0.2% 0.1% 25–29 455 328 1.39 10.6% 0.4% American Indian and Alaska Native alone 18 0.2% 0.1% 30–34 357 233 1.53 8.0% 0.4% Asian alone 136 1.8% 0.4% 35–39 305 244 1.25 7.4% 0.4% Native Hawaiian and Other Pacific Islander alone 1 0.0% 0.0% 40–44 330 335 0.99 9.0% 0.4% Some other race alone 2 0.0% 0.1% 45–49 312 328 0.95 8.7% 0.5% Two or more races 65 0.9% 0.2% 50–54 325 311 1.05 8.6% 0.6% Ethnicity 55–59 217 171 1.27 5.3% 0.5% Hispanic or Latino 1,448 19.6% 0.7% 60–64 122 101 1.21 3.0% 0.4% 65–69 79 71 1.11 2.0% 0.3% Minority 1,684 22.8% 0.5% 70–74 60 33 1.82 1.3% 0.2% 75–79 29 19 1.53 0.7% 0.1% 80–84 10 20 0.50 0.4% 0.1%
85 + 3 13 0.23 0.2% 0.1% Total 4,001 3,370 1.19 100% 0.3%
Share 60 years+ 7.6% Median Age 32.7 Note: NH is Not Hispanic. If a cell is shaded yellow and has bold red type, this indicates that the area’s share of the state for the given category exceeds the area’s share of total population in the state. Blue shading indicates a male-to-female ratio greater than one.
Source: Bureau of the Census, Census 2000, SF1.

Housing Market Assessment: Park City 19
share of Hispanics in 2000 than Park City. In South Salt Lake Hispanics made up 22 percent of the population and in Midvale 20.6 percent. The relative size of the Hispanic population affects housing affordability, tenure and overcrowding in the Park City housing market. There are no estimates of minority population for Park City in the intercensal years, however, esti-mates have been made for Summit County and show a rapidly growing minority population. Recent estimates show that between 2000 and 2008 the minority population in Summit County increased by 2,947 individuals, accounting for nearly 30 percent of the population growth of the county. Seventy-five percent of the increase in minorities was individuals of Hispanic or Latino origin. The growth of the Hispanic population combined with the scarcity of existing and new affordable housing has likely led to more overcrowding in the Park City housing market, particularly in the rental market. Household Income
Household income data are not available at the sub-county level between censuses. In the 2000 Census, Park City’s median household income was 101.3 percent of the median for all of Summit County. To estimate median household income for Park City for the years 2001 through 2008 (the most recent year for county-level data), BEBR assumed that the income distribu-tion in Park City was well established in 2000 and has remained fairly con-stant in relation to the countywide distribution in the ensuing years. Therefore, we derived annual estimates of median household income in Park City by multiplying those for Summit County by 1.013. Note, however, that the underlying county estimates for 2001 through 2008 are subject to margins of error ranging from ±6.6 percent to ±8.8 percent of the value. Therefore, income estimates are rounded to the nearest $100 to avoid the appearance of undue accuracy. Median household income in Park City was $81,374 in 2000 (in constant 2008 dollars), about 40 percent higher than the statewide median (Table 2.2). Because of the nature of the data set and changes in the Census Bureau’s modeling methodology in 2005 and 2006, it is difficult to compare values across years. Nevertheless, Park City’s median household income generally trended downward between 2001 and 2004, and its 2008 estimated median of $80,700 was not significantly different from the level in 2000. Part of Park City’s above-average income is reflected in the area’s age distribution: its older population means that more people are in the middle and latter parts of their careers and thus earning higher wages than would a younger, early-career population. Employment and Wages
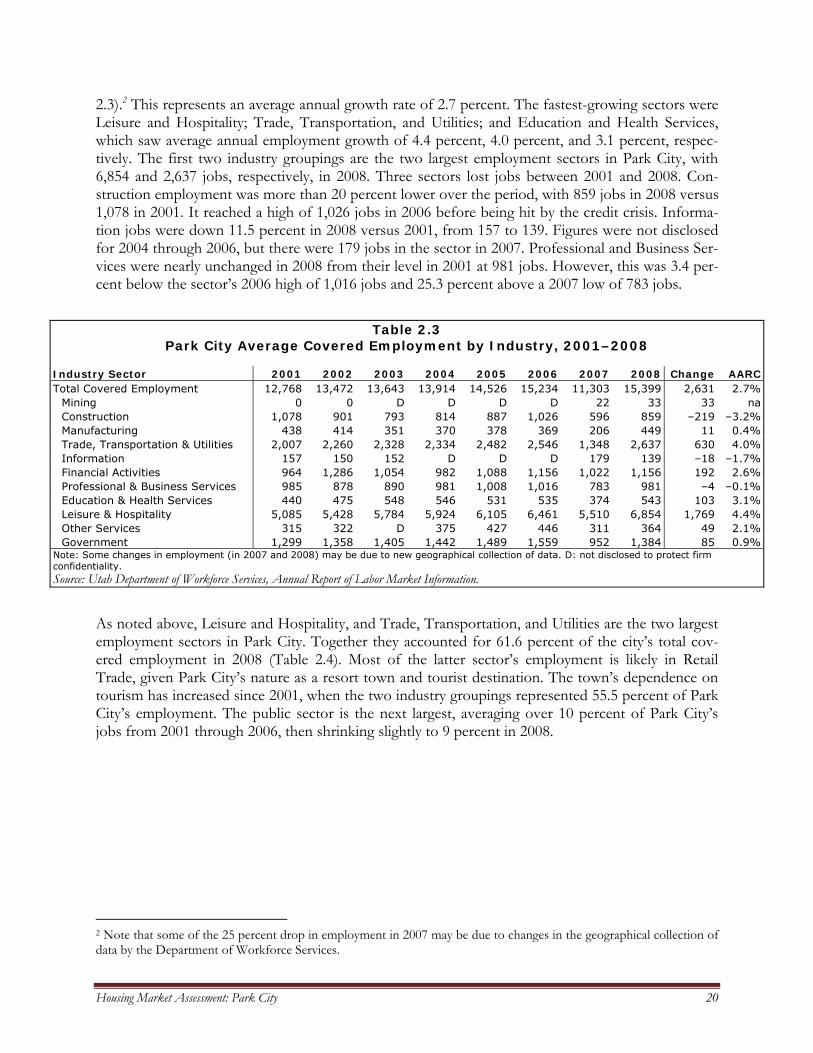
The Utah Department of Workforce Services reports average annual “covered” employment by in-dustry for many cities in the state. This is a count of jobs covered by state or federal unemployment insurance, and as such does not include farm workers and the self-employed. Total covered em-ployment in Park City grew by 2,631 jobs between 2001 and 2008, from 12,768 to 15,399 (Table
Table 2.2 Park City Median
Household Income,
2000–2008 (Constant 2008
Dollars)
Year Income 2000 $81,374 2001 $82,100 2002 $79,100 2003 $77,000 2004 $76,400 2005 $81,800 2006 $85,000 2007 $84,300 2008 $80,700
Source: Bureau of Economic and Business Research, University of Utah based on U.S. Census Bureau, Small Area Income and Poverty Estimates.
Housing Market Assessment: Park City 20
2.3).2 This represents an average annual growth rate of 2.7 percent. The fastest-growing sectors were Leisure and Hospitality; Trade, Transportation, and Utilities; and Education and Health Services, which saw average annual employment growth of 4.4 percent, 4.0 percent, and 3.1 percent, respec-tively. The first two industry groupings are the two largest employment sectors in Park City, with 6,854 and 2,637 jobs, respectively, in 2008. Three sectors lost jobs between 2001 and 2008. Con-struction employment was more than 20 percent lower over the period, with 859 jobs in 2008 versus 1,078 in 2001. It reached a high of 1,026 jobs in 2006 before being hit by the credit crisis. Informa-tion jobs were down 11.5 percent in 2008 versus 2001, from 157 to 139. Figures were not disclosed for 2004 through 2006, but there were 179 jobs in the sector in 2007. Professional and Business Ser-vices were nearly unchanged in 2008 from their level in 2001 at 981 jobs. However, this was 3.4 per-cent below the sector’s 2006 high of 1,016 jobs and 25.3 percent above a 2007 low of 783 jobs.
Table 2.3
Park City Average Covered Employment by Industry, 2001–2008
Industry Sector 2001 2002 2003 2004 2005 2006 2007 2008 Change AARC Total Covered Employment 12,768 13,472 13,643 13,914 14,526 15,234 11,303 15,399 2,631 2.7%
Mining 0 0 D D D D 22 33 33 na Construction 1,078 901 793 814 887 1,026 596 859 –219 –3.2% Manufacturing 438 414 351 370 378 369 206 449 11 0.4% Trade, Transportation & Utilities 2,007 2,260 2,328 2,334 2,482 2,546 1,348 2,637 630 4.0% Information 157 150 152 D D D 179 139 –18 –1.7% Financial Activities 964 1,286 1,054 982 1,088 1,156 1,022 1,156 192 2.6% Professional & Business Services 985 878 890 981 1,008 1,016 783 981 –4 –0.1% Education & Health Services 440 475 548 546 531 535 374 543 103 3.1% Leisure & Hospitality 5,085 5,428 5,784 5,924 6,105 6,461 5,510 6,854 1,769 4.4% Other Services 315 322 D 375 427 446 311 364 49 2.1% Government 1,299 1,358 1,405 1,442 1,489 1,559 952 1,384 85 0.9%
Note: Some changes in employment (in 2007 and 2008) may be due to new geographical collection of data. D: not disclosed to protect firm confidentiality. Source: Utah Department of Workforce Services, Annual Report of Labor Market Information.
As noted above, Leisure and Hospitality, and Trade, Transportation, and Utilities are the two largest employment sectors in Park City. Together they accounted for 61.6 percent of the city’s total cov-ered employment in 2008 (Table 2.4). Most of the latter sector’s employment is likely in Retail Trade, given Park City’s nature as a resort town and tourist destination. The town’s dependence on tourism has increased since 2001, when the two industry groupings represented 55.5 percent of Park City’s employment. The public sector is the next largest, averaging over 10 percent of Park City’s jobs from 2001 through 2006, then shrinking slightly to 9 percent in 2008.
2 Note that some of the 25 percent drop in employment in 2007 may be due to changes in the geographical collection of data by the Department of Workforce Services.

Housing Market Assessment: Park City 21
Table 2.4 Park City Employment Shares, 2001–2008
Industry Sector 2001 2002 2003 2004 2005 2006 2007 2008 Mining 0.0% 0.0% na na na na 0.2% 0.2% Construction 8.4% 6.7% 5.8% 5.9% 6.1% 6.7% 5.3% 5.6% Manufacturing 3.4% 3.1% 2.6% 2.7% 2.6% 2.4% 1.8% 2.9% Trade, Transportation & Utilities 15.7% 16.8% 17.1% 16.8% 17.1% 16.7% 11.9% 17.1% Information 1.2% 1.1% 1.1% na na na 1.6% 0.9% Financial Activities 7.6% 9.5% 7.7% 7.1% 7.5% 7.6% 9.0% 7.5% Professional & Business Services 7.7% 6.5% 6.5% 7.1% 6.9% 6.7% 6.9% 6.4% Education & Health Services 3.4% 3.5% 4.0% 3.9% 3.7% 3.5% 3.3% 3.5% Leisure & Hospitality 39.8% 40.3% 42.4% 42.6% 42.0% 42.4% 48.7% 44.5% Other Services 2.5% 2.4% na 2.7% 2.9% 2.9% 2.8% 2.4% Government 10.2% 10.1% 10.3% 10.4% 10.3% 10.2% 8.4% 9.0% Source: Utah Department of Workforce Services, Annual Report of Labor Market Information; and Bureau of Economic and Business Research, University of Utah.
The average annual wage across all industries in Park City was $32,986 in 2008 (Table 2.5). This was essentially unchanged from 2001, after adjusting for inflation, when the average annual wage was $33,016 (in constant 2008 dollars). Unfortunately, the industries that represent more than 60 percent of the jobs in Park City pay the lowest average annual wages. The average wage in 2008 for Leisure and Hospitality jobs was $24,486. Trade, Transportation, and Utilities averaged $28,268; Retail Trade jobs may pay less than this because Utilities jobs generally pay some of the highest wages and so would raise the average. The highest wages in Park City in 2008 were paid by the Mining industry, of which there were only 33 jobs earning an average of $82,634. Manufacturing and Professional and Business Services also paid relatively high wages at $56,404 and $54,569, respectively. However, to-gether they represented less than 10 percent of all jobs in the city, and in fact were the only two sec-tors to see real wages fall between 2001 and 2008. Manufacturing wages shrank by $4,780 and Professional and Business Services wages shrank by $1,775.
Table 2.5
Average Annual Wages by Industry in Park City, 2001–2008 (Constant 2008 Dollars)
Industry Sector 2001 2002 2003 2004 2005 2006 2007 2008 Change AARC Total Covered Employment $33,016 $31,747 $31,166 $31,359 $32,393 $32,537 $33,997 $32,986 –$30 –0.0%
Mining $0 $0 na na na na $87,045 $82,634 $82,634 na Construction $42,545 $42,081 $38,459 $36,407 $44,138 $43,240 $46,438 $42,556 $11 0.0% Manufacturing $61,185 $60,104 $66,121 $60,262 $57,390 $53,368 $40,777 $56,404 –$4,781 –1.2% Trade, Transportation & Utilities $28,001 $27,277 $28,097 $28,900 $31,230 $31,420 $28,516 $28,268 $266 0.1% Information $45,086 $44,522 $42,350 na na na $47,327 $47,386 $2,299 0.7% Financial Activities $41,695 $39,724 $42,837 $46,476 $48,168 $47,569 $53,429 $48,198 $6,502 2.1% Professional & Business Services $56,344 $50,967 $50,421 $48,427 $48,573 $51,697 $66,444 $54,569 –$1,775 –0.5% Education & Health Services $32,864 $33,472 $31,797 $30,465 $30,650 $30,346 $41,113 $36,589 $3,724 1.5% Leisure & Hospitality $24,299 $23,893 $23,223 $22,666 $23,192 $23,480 $24,116 $24,486 $187 0.1% Other Services $25,814 $26,355 na $37,725 $35,637 $35,969 $39,783 $36,319 $10,505 5.0% Government $33,688 $34,363 $35,298 $36,174 $33,922 $34,767 $33,726 $37,612 $3,925 1.6%
Source: Utah Department of Workforce Services, Annual Report of Labor Market Information; and Bureau of Economic and Business Research, University of Utah.
Jobs in Other Services, which includes repair and maintenance and personal services, saw real wages grow at an average annual rate of 5 percent, from $25,814 in 2001 to $36,319 in 2008 (in constant
Housing Market Assessment: Park City 22
2008 dollars). Despite this rapid growth, Other Services wages in 2008 were below their 2007 peak of $39,783. Average annual wages in the Financial Activities sector, which includes finance, insur-ance, and real estate, grew by $6,500 in real terms to $48,198 in 2008. Jobs in Education and Health Services and Government saw their real wages grow by close to $4,000 between 2001 and 2008. Mortgage and Consumer Debt
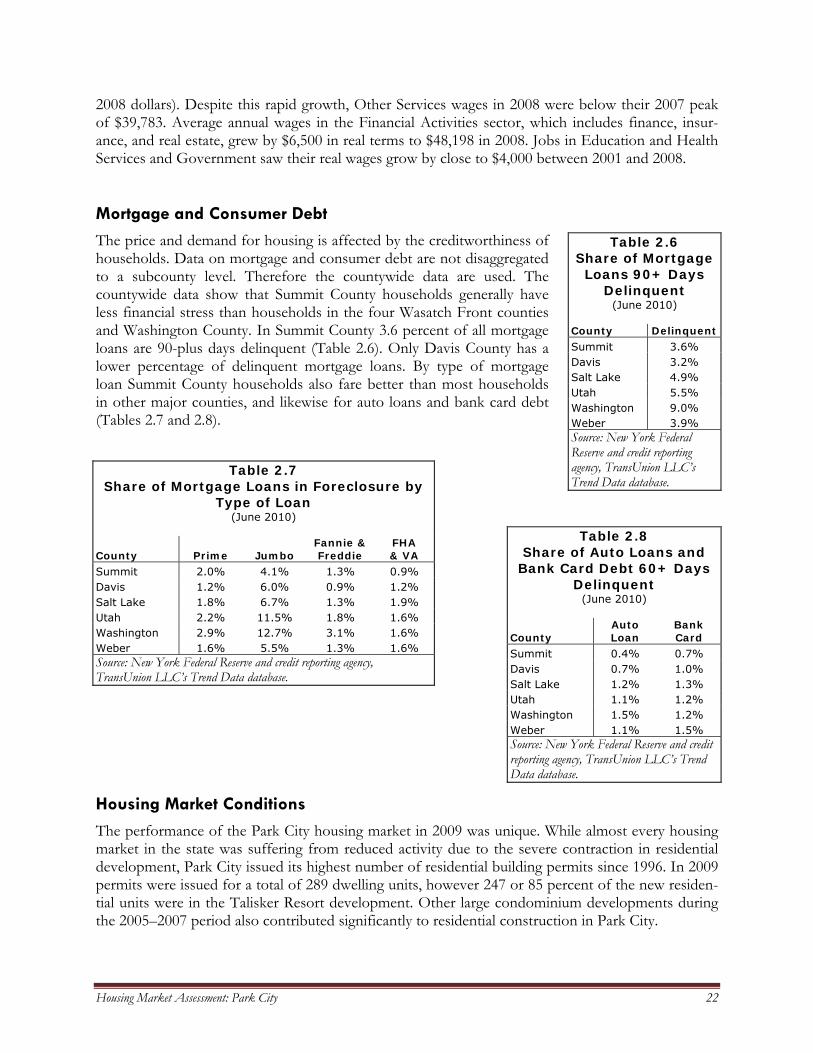
The price and demand for housing is affected by the creditworthiness of households. Data on mortgage and consumer debt are not disaggregated to a subcounty level. Therefore the countywide data are used. The countywide data show that Summit County households generally have less financial stress than households in the four Wasatch Front counties and Washington County. In Summit County 3.6 percent of all mortgage loans are 90-plus days delinquent (Table 2.6). Only Davis County has a lower percentage of delinquent mortgage loans. By type of mortgage loan Summit County households also fare better than most households in other major counties, and likewise for auto loans and bank card debt (Tables 2.7 and 2.8).
Housing Market Conditions
The performance of the Park City housing market in 2009 was unique. While almost every housing market in the state was suffering from reduced activity due to the severe contraction in residential development, Park City issued its highest number of residential building permits since 1996. In 2009 permits were issued for a total of 289 dwelling units, however 247 or 85 percent of the new residen-tial units were in the Talisker Resort development. Other large condominium developments during the 2005–2007 period also contributed significantly to residential construction in Park City.
Table 2.6 Share of Mortgage Loans 90+ Days
Delinquent (June 2010)
County Delinquent Summit 3.6% Davis 3.2% Salt Lake 4.9% Utah 5.5% Washington 9.0% Weber 3.9% Source: New York Federal Reserve and credit reporting agency, TransUnion LLC’s Trend Data database.
Table 2.7 Share of Mortgage Loans in Foreclosure by
Type of Loan (June 2010)
County Prime Jumbo Fannie & Freddie
FHA & VA
Summit 2.0% 4.1% 1.3% 0.9% Davis 1.2% 6.0% 0.9% 1.2% Salt Lake 1.8% 6.7% 1.3% 1.9% Utah 2.2% 11.5% 1.8% 1.6% Washington 2.9% 12.7% 3.1% 1.6% Weber 1.6% 5.5% 1.3% 1.6% Source: New York Federal Reserve and credit reporting agency, TransUnion LLC’s Trend Data database.
Table 2.8 Share of Auto Loans and
Bank Card Debt 60+ Days Delinquent
(June 2010)
County Auto Loan
Bank Card
Summit 0.4% 0.7% Davis 0.7% 1.0% Salt Lake 1.2% 1.3% Utah 1.1% 1.2% Washington 1.5% 1.2% Weber 1.1% 1.5% Source: New York Federal Reserve and credit reporting agency, TransUnion LLC’s Trend Data database.

Housing Market Assessment: Park City 23
Condominium development appears to have run its course, at least for the next few years, conse-quently residential construction activity has declined precipitously. Through July 2010 only 13 new residential units have received building permits in Park City; 11 of the 13 permits were for single-family homes. Given the current state of the financial markets, the substantial capital requirements of large condominium developments, and weakening demand for second homes it is almost certain there will be a much reduced level of condominium activity over the next two to three years. In the long term however, Park City’s second-home market will probably fare better than most sec-ond-home markets. Those second-home markets that target younger upper-income baby boomers are not expected to do as well as those markets that appeal to the wealthiest buyers. Park City is definitely a market for wealthy buyers. Potential buyers in Park City are those less affected by the recession, diminished earnings, tighter credit and lack of equity in their first home. In the long term, the cachet of Park City and the resort atmosphere should help to support future high-end second-home developments. In the near term however, there will continue to be serious downward adjust-ments in housing prices. Meanwhile the development of single-family and condominium construc-tion will experience very low levels of activity through 2011.
Housing Market Assessment: Park City 24
HO U S I N G AF F O R DA B I L I T Y A N D NE E D S AS S E S S M E N T In 2009 Park City had an estimated population of 8,127 in about 3,000 households. Housing for these 3,000 households includes about 1,740 owner-occupied units and 1,270 renter-occupied units. Since 2000 the owner- and renter-occupied housing inventory (which excludes second homes, vaca-tion homes and time-share units) has increased by about 250 units. Affordability Calculations
HUD provides median income estimates for counties (Table 3.1). Using these estimates the price level of affordable homes was determined for median-, moderate-, low- and very-low-income households in Park City (Table 3.2). These price estimates were derived based on the following as-sumptions: 30 percent of gross income devoted to housing, 3 percent down payment, prevailing mortgage rate, and property taxes, homeowner’s insurance and mortgage insurance of 12 percent of total mortgage payment (Table 3.3).
Table 3.1
Household Income by AMI Level for Summit County
Year Median 80% AMI 50% AMI 30% AMI 2005 $83,400 $66,720 $41,700 $25,020 2006 $81,200 $64,960 $40,600 $24,360 2007 $83,400 $66,720 $41,700 $25,020 2008 $87,000 $69,600 $43,500 $26,100 2009 $93,400 $74,720 $46,700 $28,020
Source: Bureau of Economic and Business Research, University of Utah and HUD income estimate.
Table 3.2 Affordable Home Prices by Income Category for
Park City
Affordable Price Range for Household at: Year Median Income 80% AMI 50% AMI 30% AMI 2005 ≤$315,369 ≤$250,315 ≤$152,724 ≤$87,692 2006 ≤$290,715 ≤$230,785 ≤$141,053 ≤$81,287 2007 ≤$300,847 ≤$238,988 ≤$146,114 ≤$84,255 2008 ≤$325,022 ≤$258,144 ≤$157,742 ≤$90,864 2009 ≤$379,195 ≤$303,345 ≤$189,523 ≤$113,640
Source: Bureau of Economic and Business Research, University of Utah and HUD income estimate.
3

Housing Market Assessment: Park City 25
Table 3.3 Affordability Calculations for Park City
Median 80% AMI 50% AMI 30% AMI
2009 Income $93,400 $74,720 $46,700 $28,020 Income Available for Housing @ 30% of Income $28,020 $22,416 $14,010 $8,406 Income Available Monthly $2,335 $1,868 $1,168 $701
Less Taxes , Home Insurance, Mortgage Insurance $2,078 $1,663 $1,039 $623 Mortgage Interest Rate 5.5% 5.5% 5.5% 5.5% Amount of Loan Financed $367,819 $294,245 $183,837 $110,231 Down Payment $11,376 $9,100 $5,686 $3,409 Maximum Home Price $379,195 $303,345 $189,523 $113,640 2008 Income $87,000 $69,600 $43,500 $26,100 Income Available for Housing @ 30% of Income $26,100 $20,880 $13,050 $7,830 Income Available Monthly $2,175 $1,740 $1,088 $653
Less Taxes , Home Insurance, Mortgage Insurance $1,936 $1,549 $968 $581 Mortgage Interest Rate 6.0% 6.0% 6.0% 6.0% Amount of Loan Financed $315,271 $250,400 $153,010 $88,138 Down Payment $9,751 $7,744 $4,732 $2,726 Maximum Home Price $325,022 $258,144 $157,742 $90,864 2007 Income $83,400 $66,720 $41,700 $25,020 Income Available for Housing @ 30% of Income $25,020 $20,016 $12,510 $7,506 Income Available Monthly $2,085 $1,668 $1,043 $626
Less Taxes , Home Insurance, Mortgage Insurance $1,856 $1,485 $928 $557 Mortgage Interest Rate 6.34% 6.34% 6.34% 6.34% Amount of Loan Financed $291,822 $231,818 $141,731 $81,727 Down Payment $9,025 $7,170 $4,383 $2,528 Maximum Home Price $300,847 $238,988 $146,114 $84,255 2006 Income $81,200 $64,960 $40,600 $24,360 Income Available for Housing @ 30% of Income $24,360 $19,488 $12,180 $7,308 Income Available Monthly $2,030 $1,624 $1,015 $609
Less Taxes , Home Insurance, Mortgage Insurance $1,807 $1,445 $903 $542 Mortgage Interest Rate 6.41% 6.41% 6.41% 6.41% Amount of Loan Financed $281,994 $223,861 $136,821 $78,848 Down Payment $8,721 $6,924 $4,232 $2,439 Maximum Home Price $290,715 $230,785 $141,053 $81,287 2005 Income $83,400 $66,720 $41,700 $25,020 Income Available for Housing @ 30% of Income $25,020 $20,016 $12,510 $7,506 Income Available Monthly $2,085 $1,668 $1,043 $626
Less Taxes , Home Insurance, Mortgage Insurance $1,856 $1,485 $928 $557 Mortgage Interest Rate 5.87% 5.87% 5.87% 5.87% Amount of Loan Financed $305,908 $242,806 $148,142 $85,061 Down Payment $9,461 $7,509 $4,582 $2,631 Maximum Home Price $315,369 $250,315 $152,724 $87,692 Source: Bureau of Economic and Business Research, University of Utah.
Housing Market Assessment: Park City 26
Availability of Affordable Housing
Housing affordability has been a persistent problem in Park City. The availability of affordable owner- and renter-occupied units has been limited due to land prices, housing market conditions and zoning ordinances. Affordability of Owner-Occupied Housing
In order to assess the current availability of affordable owner-occupied housing, five years of data from the Park City Multiple Listing Services were analyzed regarding affordability for median-, mod-erate- (80% AMI) and low-income (50% AMI) households. Real estate sales data were used to infer the affordability of owner-occupied housing in Park City. Sales data provide a useful measure of prices and hence affordability in a housing market. Affordability for Median-Income Households The analysis of home sales showed that of the 747 detached single-family homes sold in Park City between 2005 and 2009 only 5 homes, or less than 1 percent of homes sold, were affordable to me-dian-income households (Table 3.4). However, homeownership opportunities improved substan-tially with attached condominium housing. Over the five-year period the number of condominium sales was 1,989 units. Twenty-eight percent, or 563 condominiums sold, were affordable to median-income households. In 2009, 44 of 172 condo-miniums sold were affordable to median-income households. Combining the affordable condominium sales with sales of detached single-family homes shows that nearly 21 percent of the combined sales of homes and condominiums in Park City from 2005 through 2009 were affordable to median-income households. In most communities affordability has generally returned to the 2005 level, but not so in Park City. Seventeen percent of condominiums and homes were affordable in 2009, the same per-centage as in 2008. The highest level of afforda-bility in recent years was in 2005, when 30 percent of homes and condominiums sold in Park City were affordable to median-income households. Affordability for Moderate-Income Households (80% AMI) Opportunities for home ownership are signifi-cantly diminished for moderate-income house-holds. No detached single-family homes sold in Park City were affordable to moderate-income households (Table 3.5). Again, condominiums provide affordable opportunities, with 460 afford-able units sold over the five-year period. For com-bined single-family and condominium sales 16.8
Table 3.4 Number and Share of Housing Units
Sold that Were Affordable to Median-Income Households in Park City
Single-Family Homes
Year Total Units
Sold Affordable
Units Affordable
Share 2005 267 3 1.12% 2006 171 0 0.0% 2007 139 0 0.0% 2008 81 0 0.0% 2009 89 2 2.25% Total 747 5 0.67%
Condominiums
Year Total Units
Sold Affordable
Units Affordable
Share 2005 738 306 41.5% 2006 423 92 21.8% 2007 422 67 15.9% 2008 234 54 23.1% 2009 172 44 25.6% Total 1,989 563 28.3%
Combined Single-Family Homes and
Condominiums
Year Total Units
Sold Affordable
Units Affordable
Share 2005 1,005 309 30.8% 2006 594 92 15.5% 2007 561 67 11.9% 2008 315 54 17.1% 2009 261 46 17.6% Total 2,736 568 20.8%
Source: Park City Multiple Listing Service.

Housing Market Assessment: Park City 27
percent of all units sold from 2005 through 2009 were affordable for moderate-income households. All affordable units were condominiums.
Table 3.5
Number and Share of Housing Units Sold that Were Affordable to
Moderate-Income Households (80% AMI) in Park City
Single-Family Homes
Year Total Units
Sold Affordable
Units Affordable
Share 2005 267 0 0.0% 2006 171 0 0.0% 2007 139 0 0.0% 2008 81 0 0.0% 2009 89 0 0.0% Total 747 0 0.0%
Condominiums
Year Total Units
Sold Affordable
Units Affordable
Share 2005 738 260 35.2% 2006 423 67 15.8% 2007 422 53 12.6% 2008 234 47 20.1% 2009 172 33 19.2% Total 1,989 460 23.1%
Combined Single-Family Homes and
Condominiums
Year Total Units
Sold Affordable
Units Affordable
Share 2005 1,005 260 25.9% 2006 594 67 11.3% 2007 561 53 9.5% 2008 315 47 14.9% 2009 261 33 12.6% Total 2,736 460 16.8%
Source: Park City Multiple Listing Service.
Affordability for Low-Income Households (50% AMI) Low-income households could afford only 9.3 percent of the combined detached single-family homes and attached condominiums sold in Park City since 2005 (Table 3.6). All 254 of the afford-able dwellings were condominium units. The limited opportunity of homeownership for low-income households is a characteristic of most housing markets. Housing market conditions and land and home prices generally exclude low-income households from ownership.

Housing Market Assessment: Park City 28
Table 3.6 Number and Share of Housing Units Sold that Were Affordable to Low-Income Households (50% AMI)
in Park City
Single-Family Homes
Year Total Units
Sold Affordable
Units Affordable
Share 2005 267 0 0.0% 2006 171 0 0.0% 2007 139 0 0.0% 2008 81 0 0.0% 2009 89 0 0.0% Total 747 0 0.0%
Condominiums
Year Total Units
Sold Affordable
Units Affordable
Share 2005 738 141 19.1% 2006 423 32 7.6% 2007 422 35 8.3% 2008 234 31 13.3% 2009 172 15 8.7% Total 1,989 254 12.8%
Combined Single-Family Homes and
Condominiums
Year Total Units
Sold Affordable
Units Affordable
Share 2005 1,005 141 14.0% 2006 594 32 5.4% 2007 561 35 6.2% 2008 315 31 9.8% 2009 261 15 5.8% Total 2,736 254 9.3%
Source: Park City Multiple Listing Service.
Affordability and Condominiums As noted, condominiums have supplied a large percentage of affordable owner-occupied housing units. Ninety-nine percent of affordable units in Park City have been condominium units. Most of the condominium activity however, was concentrated in a single year, 2005. Over half of all afford-able condominiums were sold in 2005, with 306 units for median-income households, 260 for mod-erate-income households and 141 for low-income households. Sales levels since have been at 20 percent or less of the 2005 level, a disturbing trend that has led to lower levels of housing afforda-bility for Park City. Affordability of Renter-Occupied Housing
In 2000 the number of rental units totaled 1,260, as reported by HUD. (The Census reported a slightly higher rental inventory of 1,330, referred to in Section 1 of this study.) HUD estimated the number of rental units that were affordable for each income category. For example 221 units were affordable in 2000 for very-low-income households (≤30 percent AMI) and 360 for low-income households (30–50 percent AMI) (Table 3.7).

Housing Market Assessment: Park City 29
Table 3.7 Number of Units Affordable by Income Category, 2000 and 2009
Income Category Total 2000 Additions Losses Total 2009 Share Less than 30% AMI 221 0 0 221 17.5% 30%–50% AMI 360 0 0 360 28.6% 50%–80% AMI 387 0 0 387 30.7% More than 80% AMI 292 0 0 292 23.2% Total 1,260 0 0 1,260 100%
Source: HUD Affordability Mismatch and Bureau of Economic and Business Research, University of Utah.
It is difficult to estimate the current rental inventory given the dynamics of the local market. The local rental market is characterized by changing tenure for condominium and apartment units, as these units often move from rental to ownership and vice versa. Therefore, a good approximation of the number of units in the rental inventory involves some speculation, but since both 2000 and 2009 were characterized by a weak economy it was assumed that the rental inventory in Park City is ap-proximately 1,260 units. The change in tenure of a unit is likely sensitive to economic conditions. Furthermore, it was assumed that the distribution of rental units by affordability in 2009 is similar to the distribution in 2000, i.e.17.5 percent of the rental inventory was affordable to very-low-income households in 2000 and the same percentage was affordable in 2009. This conclusion assumes that the relationship between rental rates and income in Park City has remained constant over the inter-vening years—a conservative assumption given the depth of the 2008–2009 recession, which has likely put greater downward pressure on wages than rental rates. Affordable rental units in 2010 would fall within the rental rate ranges shown in Table 3.8. The rental ranges are given for type of unit and income category.
Table 3.8
Affordable Rental Rate Ranges by Type of Unit and Income Category for Summit County, 2010
(includes utilities)
Type of Unit <30% AMI 30%–50% AMI 50%–80% AMI >80% AMI Studio ≤$490 $490–$817 $817–$1,307 $1,307 One-Bedroom ≤$525 $525–$875 $875–$1,400 $1,400 Two-Bedroom ≤$631 $631–$1,051 $1,051–$1,682 $1,682 Three-Bedroom ≤$728 $728–$1,214 $1,214–$1,942 $1,942 Four-Bedroom ≤$812 $812–$1,353 $1,353–$2,165 $2,165 Source: HUD Income and Rent Schedule 2010.
Tax credit units provide 326 of the 387 affordable rental units in Park City. Table 3.9 shows the number of units by target AMI. Eighty-two percent or 267 tax credit units are targeted at 50 percent AMI or above. Only 18 percent of the tax credit units in the city are targeted for low- and very-low-income households.
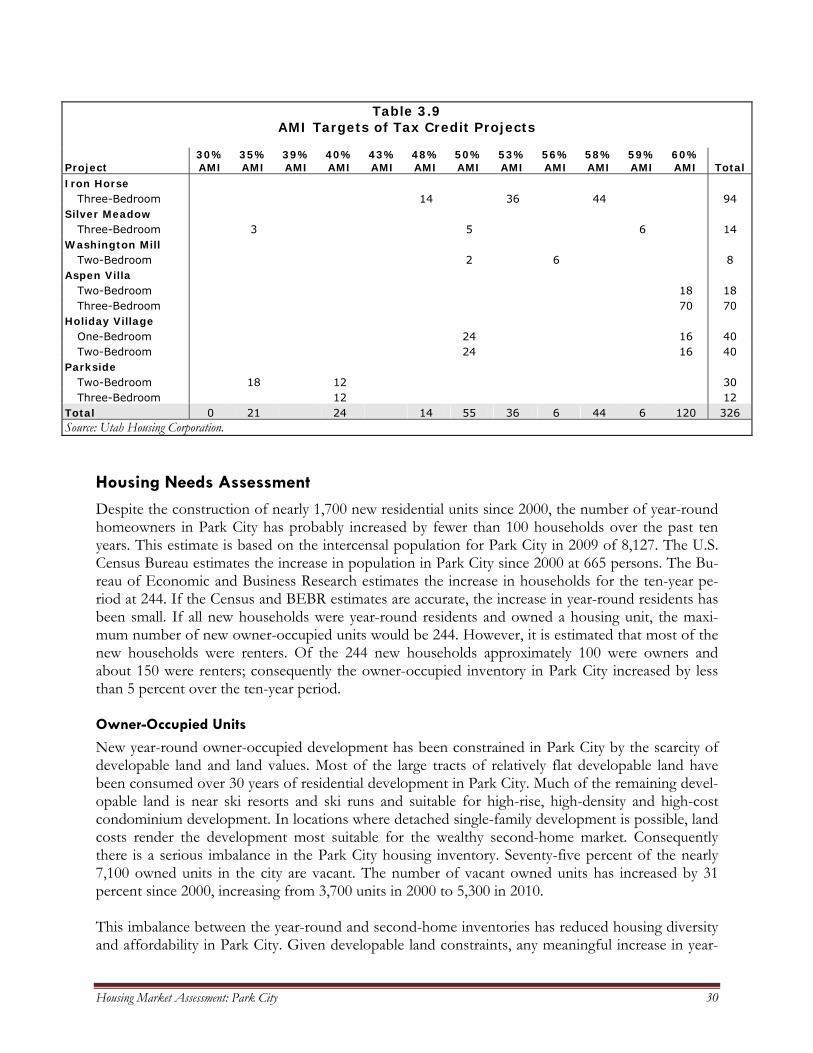
Housing Market Assessment: Park City 30
Table 3.9 AMI Targets of Tax Credit Projects
Project 30% AMI
35% AMI
39% AMI
40% AMI
43% AMI
48% AMI
50% AMI
53% AMI
56% AMI
58% AMI
59% AMI
60% AMI Total
Iron Horse Three-Bedroom 14 36 44 94
Silver Meadow Three-Bedroom 3 5 6 14
Washington Mill Two-Bedroom 2 6 8
Aspen Villa Two-Bedroom 18 18 Three-Bedroom 70 70
Holiday Village One-Bedroom 24 16 40 Two-Bedroom 24 16 40
Parkside Two-Bedroom 18 12 30 Three-Bedroom 12 12
Total 0 21 24 14 55 36 6 44 6 120 326 Source: Utah Housing Corporation.
Housing Needs Assessment
Despite the construction of nearly 1,700 new residential units since 2000, the number of year-round homeowners in Park City has probably increased by fewer than 100 households over the past ten years. This estimate is based on the intercensal population for Park City in 2009 of 8,127. The U.S. Census Bureau estimates the increase in population in Park City since 2000 at 665 persons. The Bu-reau of Economic and Business Research estimates the increase in households for the ten-year pe-riod at 244. If the Census and BEBR estimates are accurate, the increase in year-round residents has been small. If all new households were year-round residents and owned a housing unit, the maxi-mum number of new owner-occupied units would be 244. However, it is estimated that most of the new households were renters. Of the 244 new households approximately 100 were owners and about 150 were renters; consequently the owner-occupied inventory in Park City increased by less than 5 percent over the ten-year period. Owner-Occupied Units
New year-round owner-occupied development has been constrained in Park City by the scarcity of developable land and land values. Most of the large tracts of relatively flat developable land have been consumed over 30 years of residential development in Park City. Much of the remaining devel-opable land is near ski resorts and ski runs and suitable for high-rise, high-density and high-cost condominium development. In locations where detached single-family development is possible, land costs render the development most suitable for the wealthy second-home market. Consequently there is a serious imbalance in the Park City housing inventory. Seventy-five percent of the nearly 7,100 owned units in the city are vacant. The number of vacant owned units has increased by 31 percent since 2000, increasing from 3,700 units in 2000 to 5,300 in 2010. This imbalance between the year-round and second-home inventories has reduced housing diversity and affordability in Park City. Given developable land constraints, any meaningful increase in year-

Housing Market Assessment: Park City 31
round owner-occupied housing in Park City will depend on annexation of land in unincorporated Summit County. Park City has been engaged in annexation to the east and south with the Park City Heights and Empire Pass annexations. Affordable owner-occupied units ($175,000 to $225,000) are planned in the annexed property. There is a need for additional affordable owner-occupied housing in Park City. The analysis of hous-ing price data showed that less than one percent of all homes sold in Park City over a five-year pe-riod and about one-in-four condominium units were affordable to the median-income household ($93,000 in 2009). In an effort to increase housing affordability a workforce housing resolution was adopted by Park City a few years ago. New residential and commercial developments in Park City are required to produce some affordable housing units based on a formula of “affordable unit equivalents” (Resolution 20-07 Affordable Housing Guidelines and Standards for Park City). This resolution has helped to produce 13 affordable owner-occupied units and a number of pending units. Cur-rently, owner occupied affordable unit equivalents (AUE) must be affordable to Park City house-holds with incomes equal to or less than $78,419, 150 percent of median workforce wage. Rental units must be affordable to households at the median workforce wage of $52,279. The median workforce wage of $52,279 is set by the city council. Sales and construction data indicate that affordable owner-occupied opportunities have been almost entirely provided by the condominium market. Fifty to sixty condominiums are sold each year that meet the affordability criteria of the housing resolution. A closer look at the condominium sales shows that the stock of affordable condominiums, however, is relatively old. For example, in 2009 there were 42 condominiums sold that were affordable to median-income households. Many of the condominiums were located in Prospector Square. The median age of these units was 28 years old. Three were built in 2002, none in the 1990s and the remaining units were built from 1967 to 1988. The condominium stock needs an infusion of new, affordable units. The housing resolution should help produce affordable owner-occupied condominiums and in some cases detached single-family homes as residential and commercial development recovers from the recession and Park City an-nexes additional land for expansion. Renter-Occupied Units
The lack of new rental units in Park City is a serious affordability constraint. In a growing economy, with low wage rates it is almost impossible for a housing market to make any progress in improving affordability without producing rental units.
Table 3.10 Housing Cost Burden for Renters in Park City,
2000
Income Category Renters >30% Cost
Burden >50% Cost
Burden Less than 30% AMI 220 150 93 30%–50% AMI 170 97 33 50%–80% AMI 180 46 8 More than 80% AMI 458 55 0 Total Renters 1,028 348 134 Source: HUD CHAS 2000.
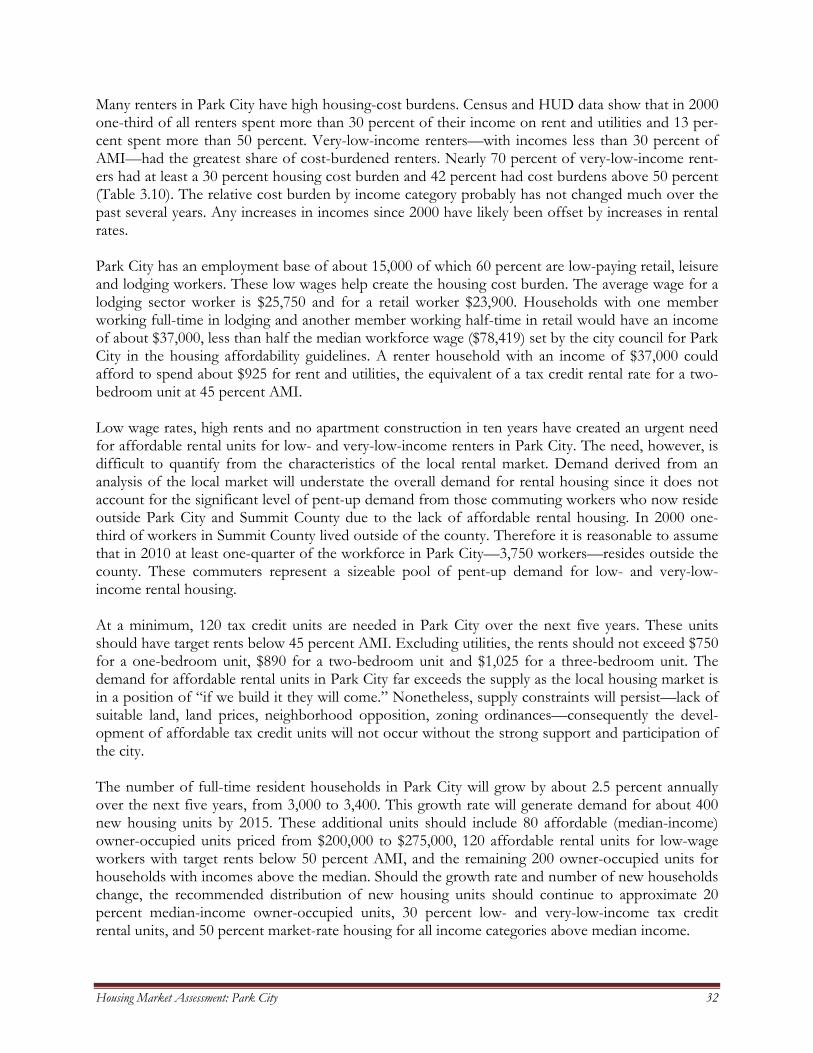
Housing Market Assessment: Park City 32
Many renters in Park City have high housing-cost burdens. Census and HUD data show that in 2000 one-third of all renters spent more than 30 percent of their income on rent and utilities and 13 per-cent spent more than 50 percent. Very-low-income renters—with incomes less than 30 percent of AMI—had the greatest share of cost-burdened renters. Nearly 70 percent of very-low-income rent-ers had at least a 30 percent housing cost burden and 42 percent had cost burdens above 50 percent (Table 3.10). The relative cost burden by income category probably has not changed much over the past several years. Any increases in incomes since 2000 have likely been offset by increases in rental rates. Park City has an employment base of about 15,000 of which 60 percent are low-paying retail, leisure and lodging workers. These low wages help create the housing cost burden. The average wage for a lodging sector worker is $25,750 and for a retail worker $23,900. Households with one member working full-time in lodging and another member working half-time in retail would have an income of about $37,000, less than half the median workforce wage ($78,419) set by the city council for Park City in the housing affordability guidelines. A renter household with an income of $37,000 could afford to spend about $925 for rent and utilities, the equivalent of a tax credit rental rate for a two-bedroom unit at 45 percent AMI. Low wage rates, high rents and no apartment construction in ten years have created an urgent need for affordable rental units for low- and very-low-income renters in Park City. The need, however, is difficult to quantify from the characteristics of the local rental market. Demand derived from an analysis of the local market will understate the overall demand for rental housing since it does not account for the significant level of pent-up demand from those commuting workers who now reside outside Park City and Summit County due to the lack of affordable rental housing. In 2000 one-third of workers in Summit County lived outside of the county. Therefore it is reasonable to assume that in 2010 at least one-quarter of the workforce in Park City—3,750 workers—resides outside the county. These commuters represent a sizeable pool of pent-up demand for low- and very-low-income rental housing. At a minimum, 120 tax credit units are needed in Park City over the next five years. These units should have target rents below 45 percent AMI. Excluding utilities, the rents should not exceed $750 for a one-bedroom unit, $890 for a two-bedroom unit and $1,025 for a three-bedroom unit. The demand for affordable rental units in Park City far exceeds the supply as the local housing market is in a position of “if we build it they will come.” Nonetheless, supply constraints will persist—lack of suitable land, land prices, neighborhood opposition, zoning ordinances—consequently the devel-opment of affordable tax credit units will not occur without the strong support and participation of the city. The number of full-time resident households in Park City will grow by about 2.5 percent annually over the next five years, from 3,000 to 3,400. This growth rate will generate demand for about 400 new housing units by 2015. These additional units should include 80 affordable (median-income) owner-occupied units priced from $200,000 to $275,000, 120 affordable rental units for low-wage workers with target rents below 50 percent AMI, and the remaining 200 owner-occupied units for households with incomes above the median. Should the growth rate and number of new households change, the recommended distribution of new housing units should continue to approximate 20 percent median-income owner-occupied units, 30 percent low- and very-low-income tax credit rental units, and 50 percent market-rate housing for all income categories above median income.