

Update on State Compacting Authority Litigation CWAG August 2009
HouseMark Benchmarking – presentation to CWAG
Paul Edwards
Director of Data Services
6 March 2015
Agenda
• Some background to HouseMark
• Our key data outputs Core benchmarking VFM Scorecard Social Housing Dashboard Priority Performance Benchmarking PlanForm
• Strategic PIs
• Discussion and next steps
HouseMark history
• Founded in 1999.• 950 member organisations including 43 ALMOs• Leading provider of comparative cost & performance
data.• Sector changed = refreshed service offer

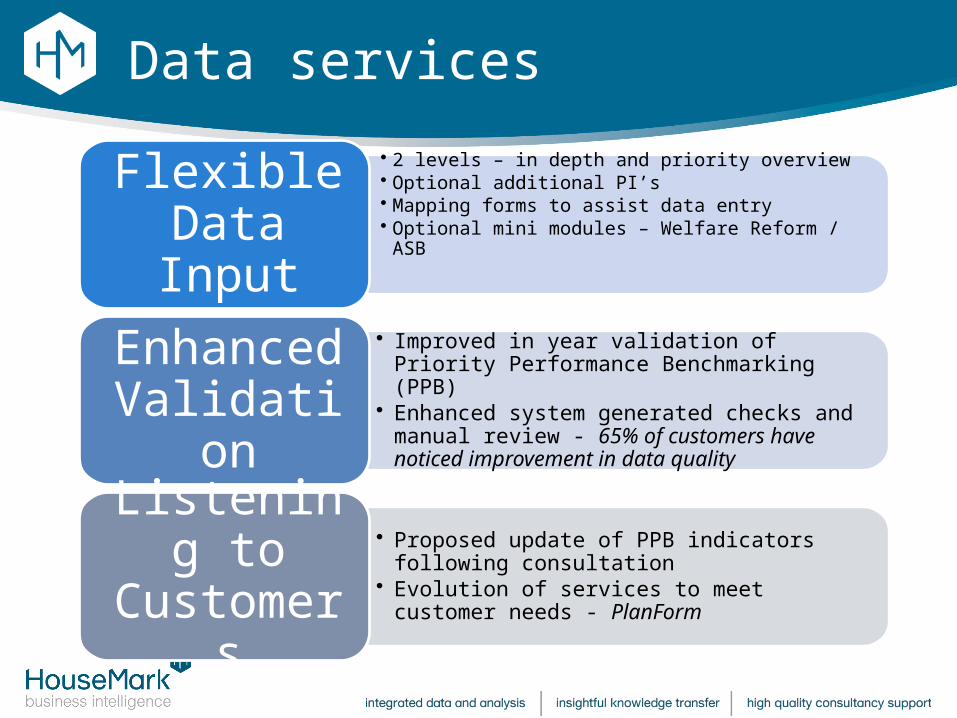
Data services
• 2 levels – in depth and priority overview• Optional additional PI’s• Mapping forms to assist data entry• Optional mini modules – Welfare Reform / ASB
Flexible Data Input
• Improved in year validation of Priority Performance Benchmarking (PPB)
• Enhanced system generated checks and manual review - 65% of customers have noticed improvement in data quality
Enhanced Validation
• Proposed update of PPB indicators following consultation
• Evolution of services to meet customer needs - PlanForm
Listening to Customers
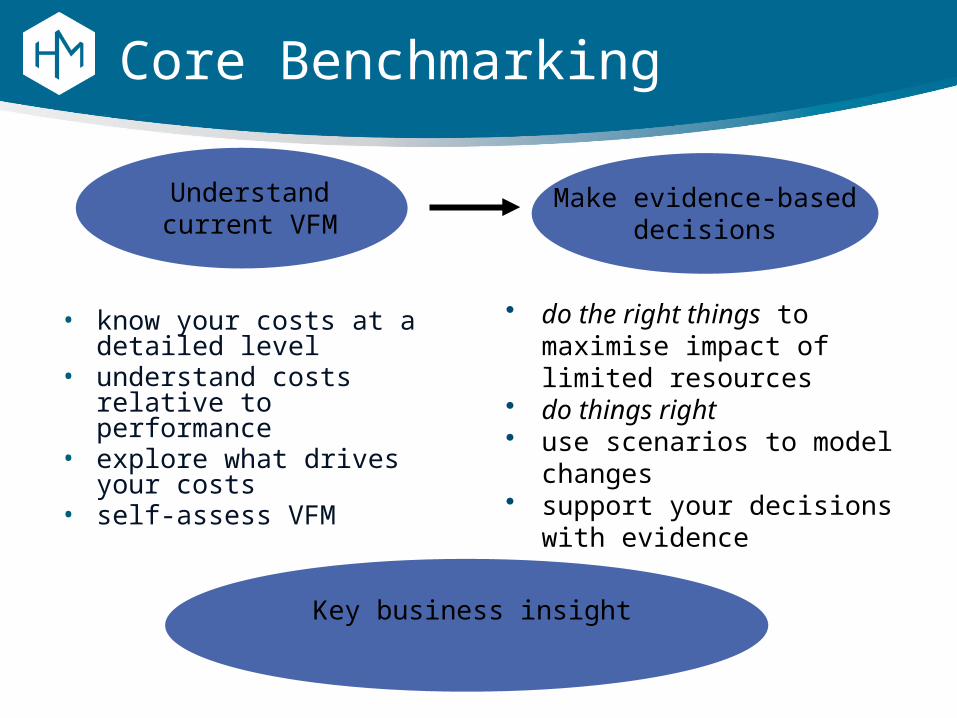
Make evidence-based decisions
Understand current VFM
Core Benchmarking
• know your costs at a detailed level
• understand costs relative to performance
• explore what drives your costs• self-assess VFM
• do the right things to maximise impact of limited resources
• do things right • use scenarios to model
changes• support your decisions with
evidence
Key business insight
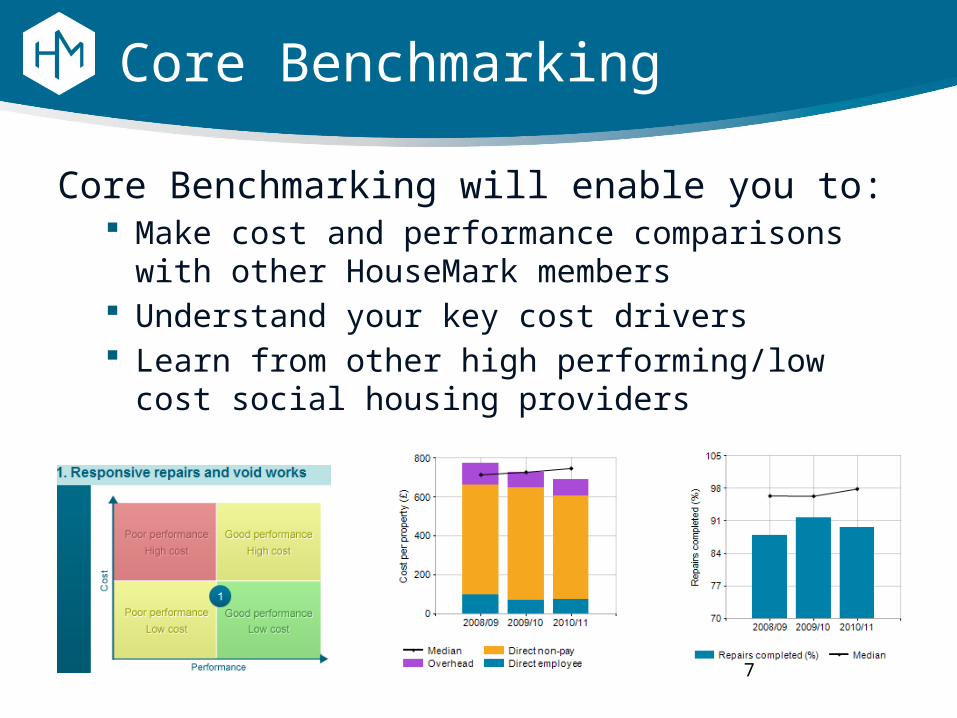
Core Benchmarking
Core Benchmarking will enable you to: Make cost and performance comparisons with other
HouseMark members Understand your key cost drivers Learn from other high performing/low cost social
housing providers
7

Core Benchmarking coverage
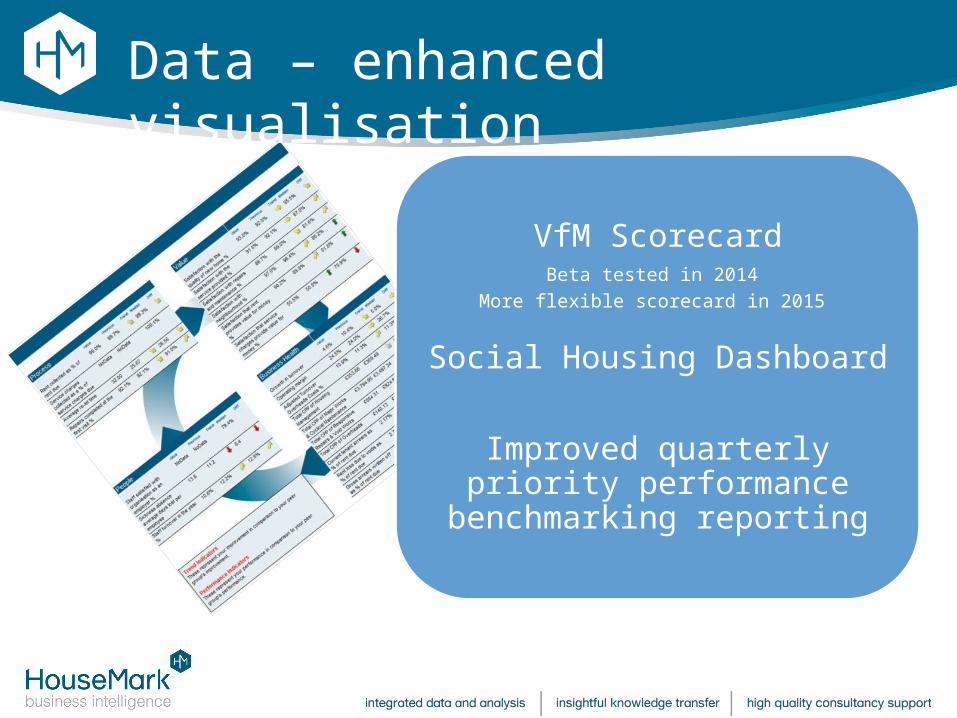
Data – enhanced visualisation
VfM ScorecardBeta tested in 2014
More flexible scorecard in 2015
Social Housing Dashboard
Improved quarterly priority performance benchmarking
reporting

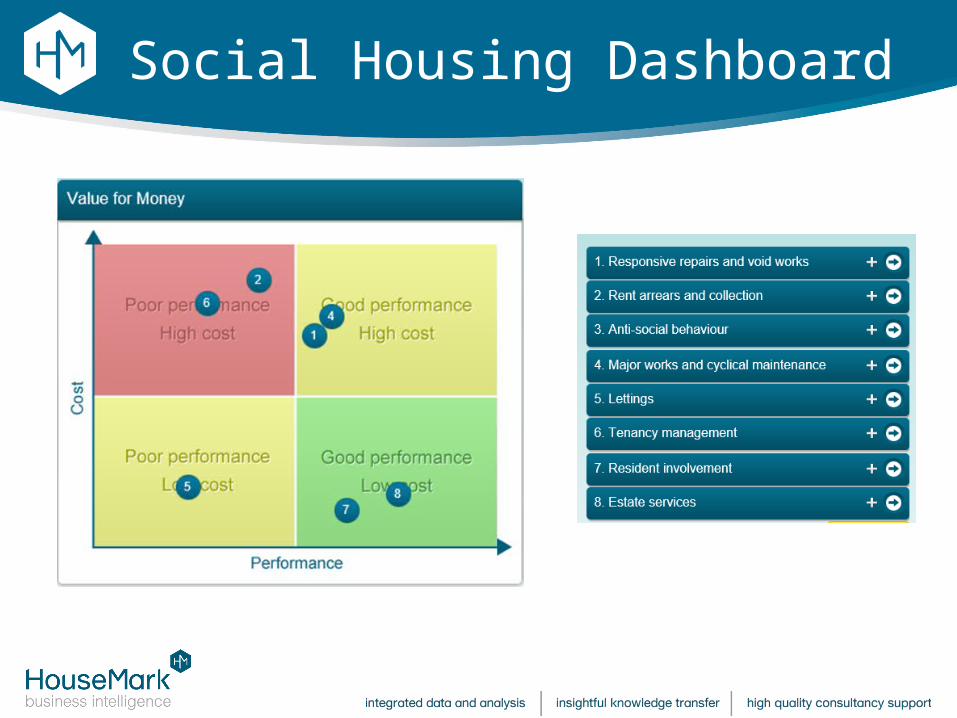
Social Housing Dashboard
Priority Performance Benchmarking
• Priority Performance Benchmarking has a quicker and easier to use data entry interface
• Reduced suite of PIs & enhanced validation• Enhanced online reporting
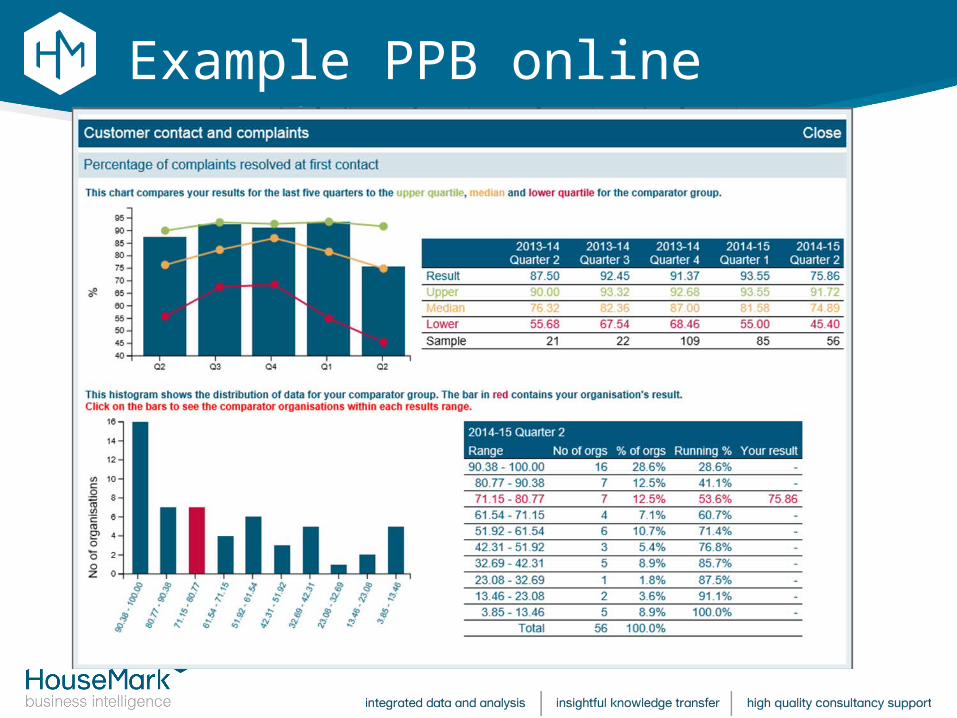
Example PPB online report
Priority PIs
• 34 priority PIs collected through our core benchmarking and PPB modules 24 quarterly PIs 10 annual PIs
Priority PIs
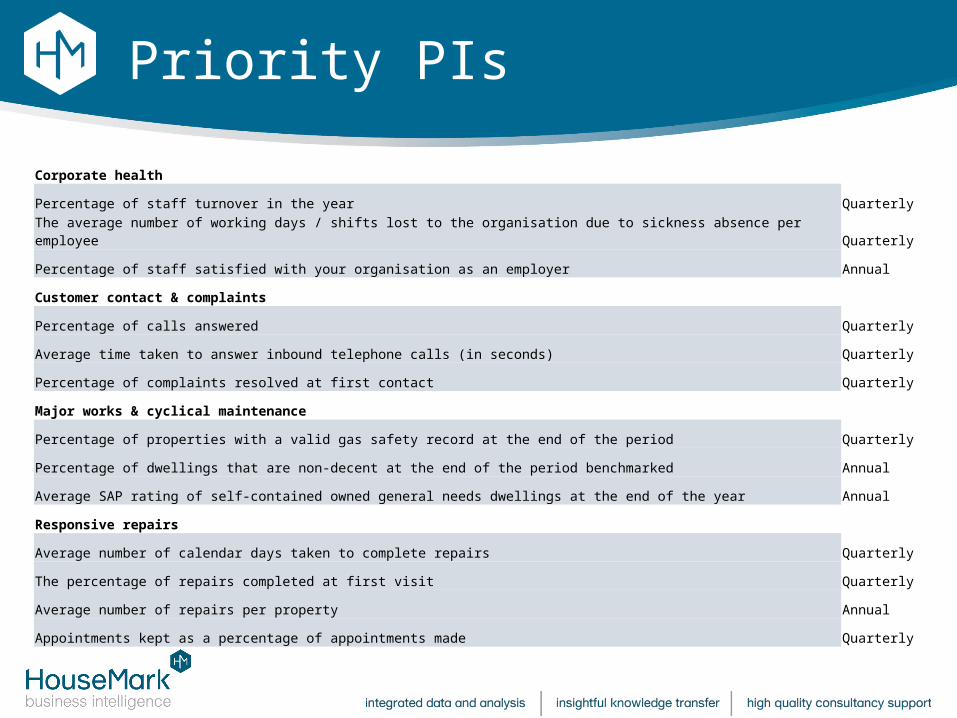
Corporate health
Percentage of staff turnover in the year Quarterly
The average number of working days / shifts lost to the organisation due to sickness absence per employee Quarterly
Percentage of staff satisfied with your organisation as an employer Annual
Customer contact & complaints
Percentage of calls answered Quarterly
Average time taken to answer inbound telephone calls (in seconds) Quarterly
Percentage of complaints resolved at first contact Quarterly
Major works & cyclical maintenance
Percentage of properties with a valid gas safety record at the end of the period Quarterly
Percentage of dwellings that are non-decent at the end of the period benchmarked Annual
Average SAP rating of self-contained owned general needs dwellings at the end of the year Annual
Responsive repairs
Average number of calendar days taken to complete repairs Quarterly
The percentage of repairs completed at first visit Quarterly
Average number of repairs per property Annual
Appointments kept as a percentage of appointments made Quarterly
Priority PIs
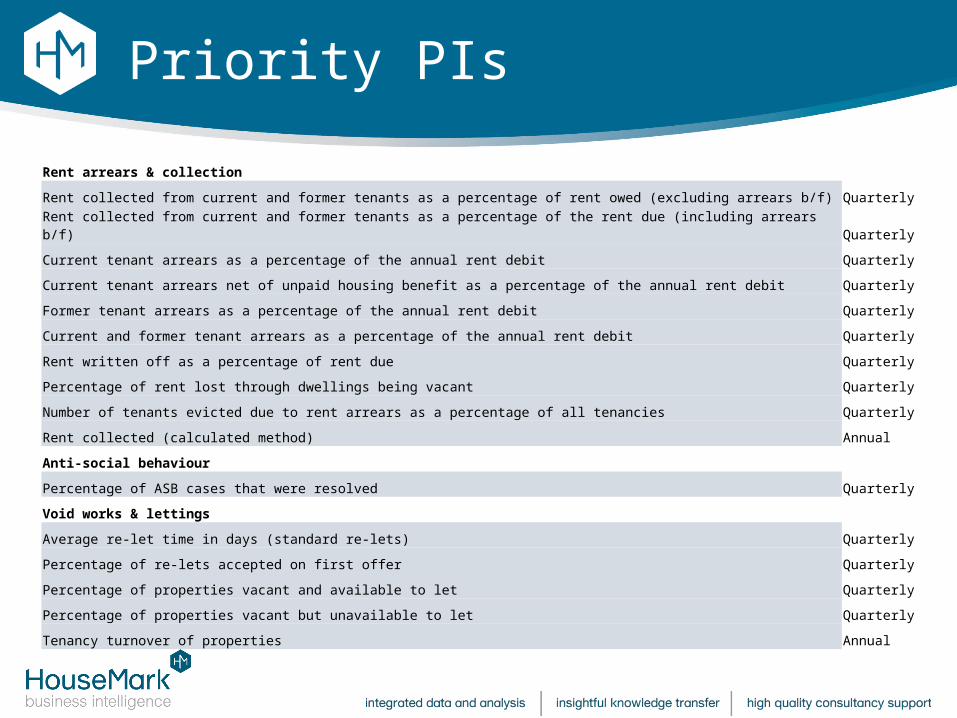
Rent arrears & collection
Rent collected from current and former tenants as a percentage of rent owed (excluding arrears b/f) Quarterly
Rent collected from current and former tenants as a percentage of the rent due (including arrears b/f) Quarterly
Current tenant arrears as a percentage of the annual rent debit Quarterly
Current tenant arrears net of unpaid housing benefit as a percentage of the annual rent debit Quarterly
Former tenant arrears as a percentage of the annual rent debit Quarterly
Current and former tenant arrears as a percentage of the annual rent debit Quarterly
Rent written off as a percentage of rent due Quarterly
Percentage of rent lost through dwellings being vacant Quarterly
Number of tenants evicted due to rent arrears as a percentage of all tenancies Quarterly
Rent collected (calculated method) Annual
Anti-social behaviour
Percentage of ASB cases that were resolved Quarterly
Void works & lettings
Average re-let time in days (standard re-lets) Quarterly
Percentage of re-lets accepted on first offer Quarterly
Percentage of properties vacant and available to let Quarterly
Percentage of properties vacant but unavailable to let Quarterly
Tenancy turnover of properties Annual
Priority PIs
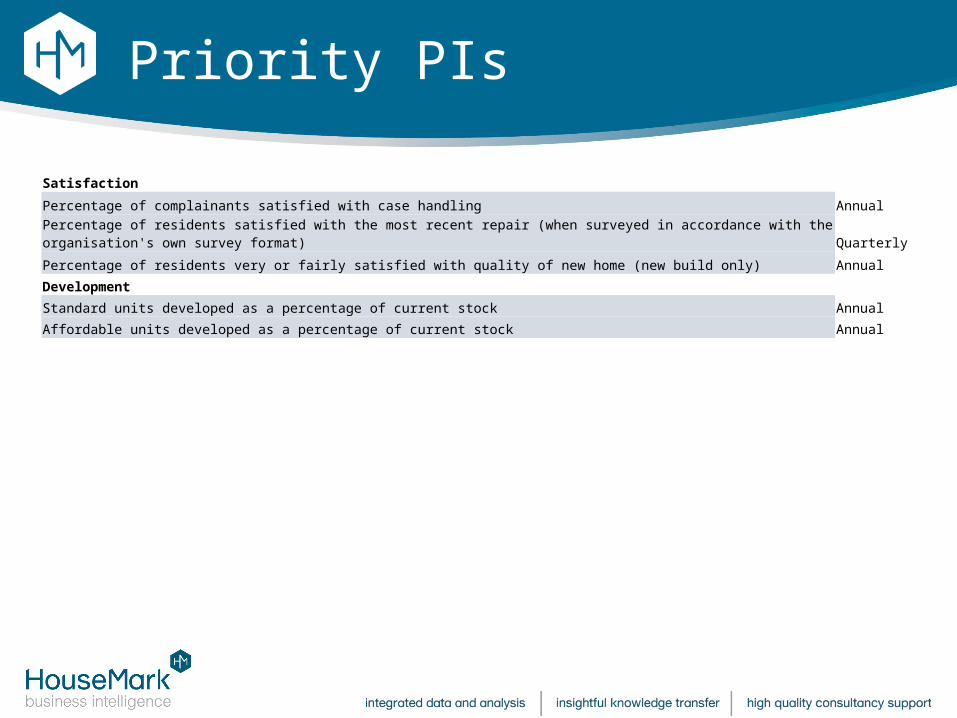
Satisfaction
Percentage of complainants satisfied with case handling Annual
Percentage of residents satisfied with the most recent repair (when surveyed in accordance with the organisation's own survey format) Quarterly
Percentage of residents very or fairly satisfied with quality of new home (new build only) Annual
Development
Standard units developed as a percentage of current stock Annual
Affordable units developed as a percentage of current stock Annual

PlanForm
• Real time HRA business plan comparison and analysis tool
• Information presented on an anonymised basis• Minimal data collection effort – data sourced direct from
business planning software – and real time reporting• Combined with benchmarking – a forward and
retrospective VFM tool – linking strategy to operations• Better business planning • Free subscription enhancement!• 24 business plans already uploaded – on target to
achieve 50 by end of March 2015

PlanForm
Open Data Zone
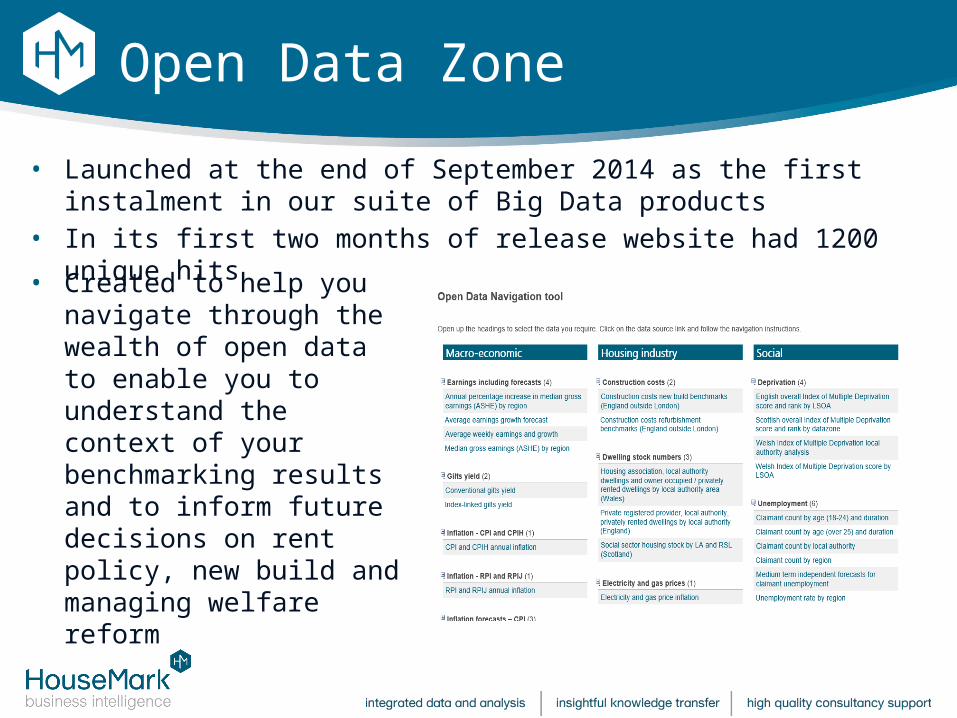
• Launched at the end of September 2014 as the first instalment in our suite of Big Data products
• In its first two months of release website had 1200 unique hits
• Created to help you navigate through the wealth of open data to enable you to understand the context of your benchmarking results and to inform future decisions on rent policy, new build and managing welfare reform
Strategic PI set
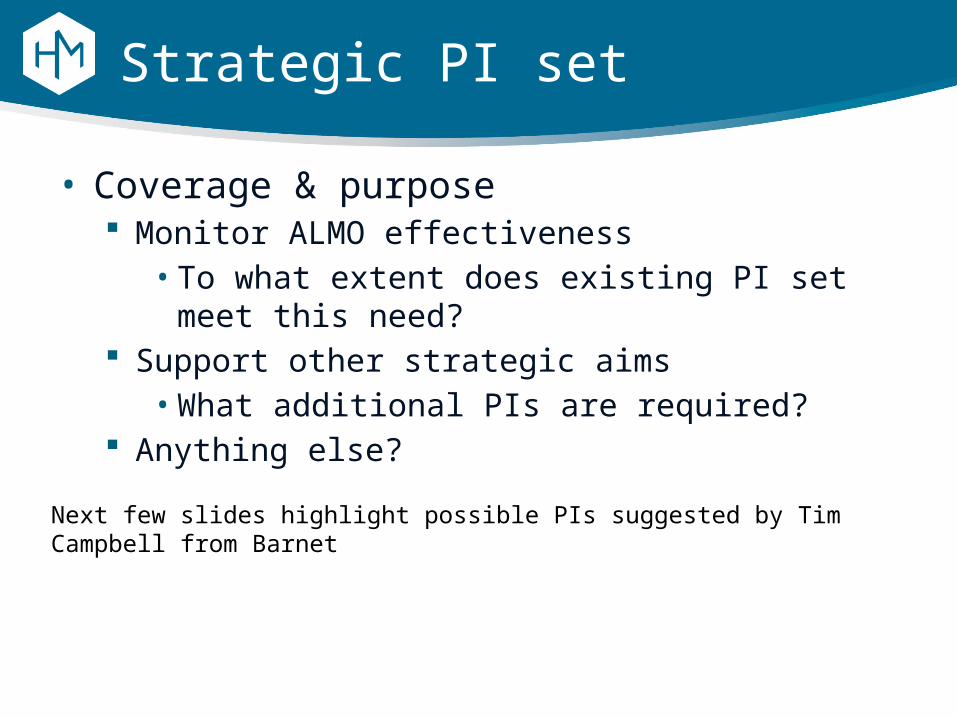
• Coverage & purpose Monitor ALMO effectiveness
• To what extent does existing PI set meet this need?
Support other strategic aims• What additional PIs are required?
Anything else?
Next few slides highlight possible PIs suggested by Tim Campbell from Barnet
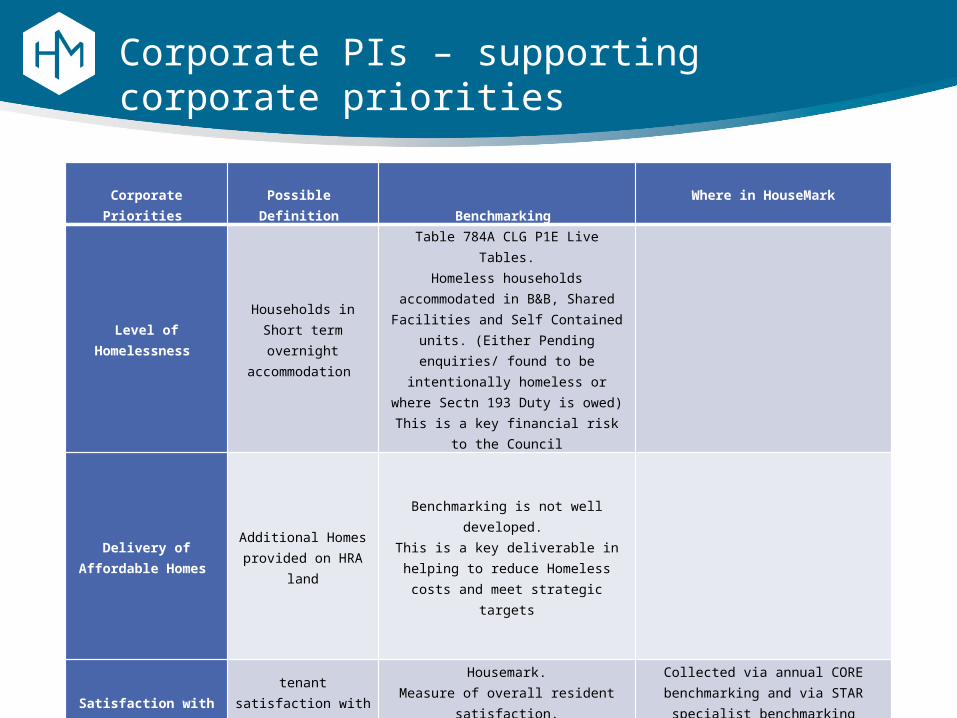
Corporate PIs – supporting corporate priorities
Corporate Priorities Possible Definition
Benchmarking
Where in HouseMark
Level of Homelessness Households in Short
term overnight accommodation
Table 784A CLG P1E Live Tables.Homeless households accommodated in
B&B, Shared Facilities and Self Contained units. (Either Pending
enquiries/ found to be intentionally homeless or where Sectn 193 Duty is
owed)This is a key financial risk to the Council
Delivery of Affordable Homes
Additional Homes provided on HRA land
Benchmarking is not well developed. This is a key deliverable in helping to
reduce Homeless costs and meet strategic targets
Satisfaction with the managing agent
tenant satisfaction with overall service
provided
Housemark.Measure of overall resident satisfaction.It is a reputational issue for the Council
as a landlord.
Collected via annual CORE benchmarking and via STAR specialist
benchmarking

Key PIs – supporting strategic service aims
Service Area
PossibleDefinition
Benchmarking
Where in HouseMark
HomelessnessFamilies B&B
accommodation for more than 6 weeks
DCLG P1E returnsFamilies in B&B for more than 6
weeks is areputational and legal risk to the
Council
Homelessness
Total Number of cases where homelessness was prevented and
relieved
P1e ReturnsThis measures the ability of the
provider to manage the Homeless caseload and prevent placing
people in Temporary Accommodation, and reduce the
financial risk to the Council.
Homelessness
The proportion of all homeless households
accommodated in B&B, Shared Facilities and Self Contained units pending enquiries or found to be intentionally homeless
Table 784A CLG Live Tables (Extract). This measures the ability of the provider to manage homeless
applications and efficiently discharge the Council’s duty to
house thus reducing thefinancial risk to the Council.
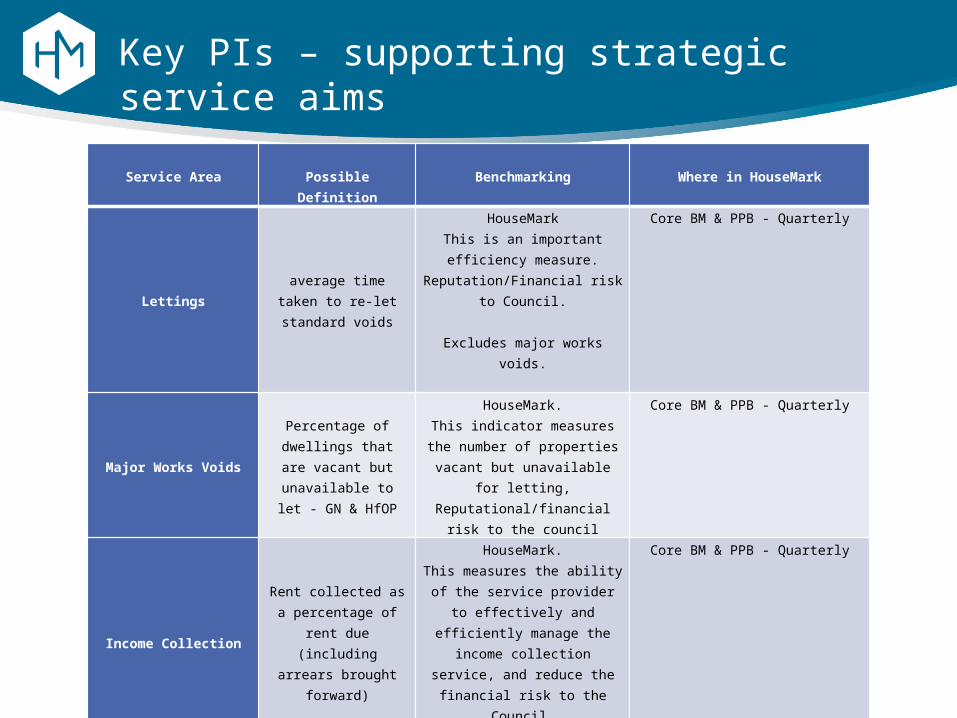
Key PIs – supporting strategic service aims
Service Area
PossibleDefinition
Benchmarking
Where in HouseMark
Lettingsaverage time taken to re-let standard voids
HouseMarkThis is an important efficiency measure. Reputation/Financial
risk to Council.
Excludes major works voids.
Core BM & PPB - Quarterly
Major Works Voids
Percentage of dwellings that are vacant but
unavailable to let - GN & HfOP
HouseMark.This indicator measures the
number of properties vacant but unavailable for letting,
Reputational/financial risk to the council
Core BM & PPB - Quarterly
Income Collection
Rent collected as a percentage of rent due
(including arrears brought forward)
HouseMark.This measures the ability of the
service provider to effectively and efficiently manage the income
collection service, and reduce thefinancial risk to the Council.
Core BM & PPB - Quarterly
Leasehold Income Collection
Leasehold service charges collected as a percentage of service
charges due
HouseMark.This measures the ability of the
service provider to effectively and efficiently manage the income
collection service, and reduce thefinancial risk to the Council.
Core BM - Annual
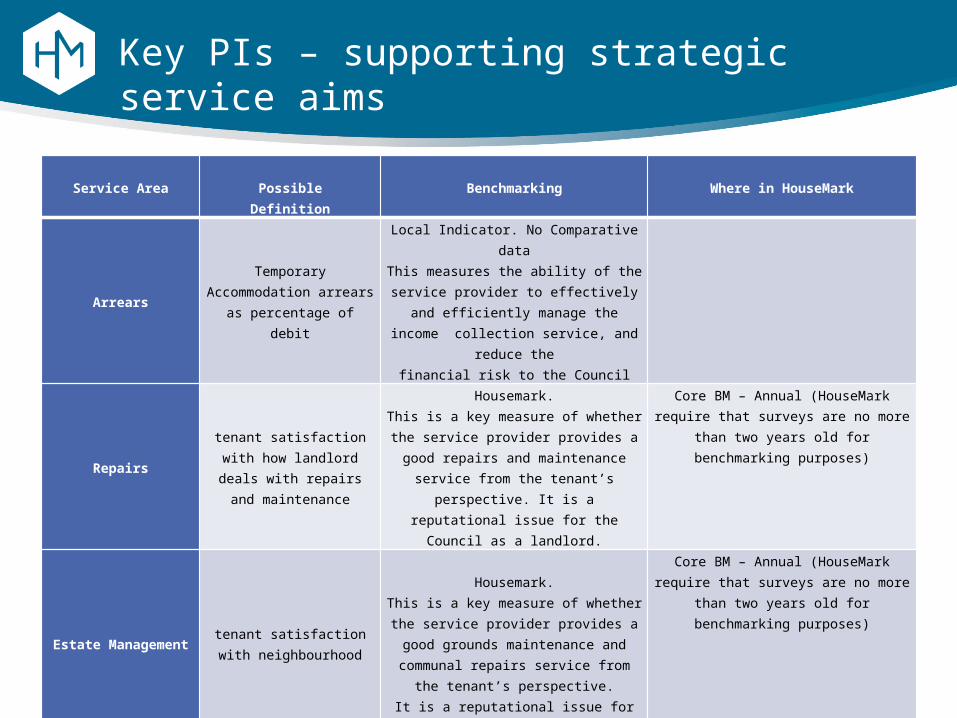
Key PIs – supporting strategic service aims
Service Area
PossibleDefinition
Benchmarking
Where in HouseMark
ArrearsTemporary Accommodation
arrears as percentage of debit
Local Indicator. No Comparative dataThis measures the ability of the service
provider to effectively and efficiently manage the income collection service, and
reduce thefinancial risk to the Council
Repairstenant satisfaction with how landlord deals with repairs
and maintenance
Housemark.This is a key measure of whether the
service provider provides a good repairs and maintenance service from the tenant’s
perspective. It is areputational issue for the Council as a
landlord.
Core BM – Annual (HouseMark require that surveys are no more than two years old for
benchmarking purposes)
Estate Managementtenant satisfaction with
neighbourhood
Housemark.
This is a key measure of whether the service provider provides a good grounds
maintenance and communal repairs service from the tenant’s perspective.
It is a reputational issue for the Council as a landlord.
Core BM – Annual (HouseMark require that surveys are no more than two years old for
benchmarking purposes)
Statutory ServicesPercentage of dwellings with a valid gas safety certificate
Housemark.This measures the ability of the service
provider to ensure that the annual safety check has been completed, when due, and
reduce thelegal and reputational risk to the Council.
Core BM – Annual – note we have amended this PI to read: ‘Percentage of
properties that require a gas safety record which had a gas safety check and record
completed’
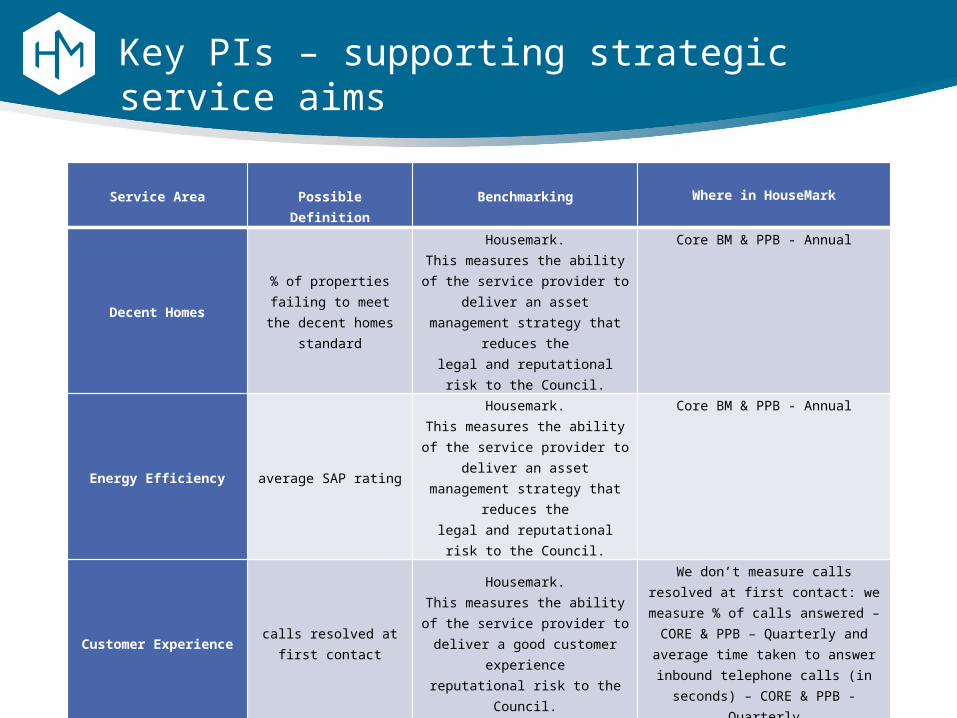
Key PIs – supporting strategic service aims
Service Area
PossibleDefinition
Benchmarking
Where in HouseMark
Decent Homes% of properties failing to meet the decent homes
standard
Housemark.This measures the ability of the
service provider to deliver an asset management strategy that reduces
thelegal and reputational risk to the
Council.
Core BM & PPB - Annual
Energy Efficiency average SAP rating
Housemark.This measures the ability of the
service provider to deliver an asset management strategy that reduces
thelegal and reputational risk to the
Council.
Core BM & PPB - Annual
Customer Experiencecalls resolved at first
contact
Housemark.This measures the ability of the
service provider to deliver a good customer experience
reputational risk to the Council.
We don’t measure calls resolved at first contact: we measure % of calls
answered – CORE & PPB – Quarterly and average time taken to answer
inbound telephone calls (in seconds) – CORE & PPB - Quarterly
Customer Experience% complaints resolved at
first contact
Housemark.This measures the ability of the
service provider to deliver a good customer experience
reputational risk to the Council.
Core & PPB - Quarterly
Discussion and next steps
Key considerations• Are these the right PIs?
Numbers Coverage
• Can the information be sourced?• Is there an appetite for collection?• Frequency of collection?