Household Wealth in China - Princeton · However, Taylor & Francis, our agents, and our licensors...
29
This article was downloaded by: [141.211.200.142] On: 26 July 2015, At: 12:02 Publisher: Routledge Informa Ltd Registered in England and Wales Registered Number: 1072954 Registered office: 5 Howick Place, London, SW1P 1WG Click for updates Chinese Sociological Review Publication details, including instructions for authors and subscription information: http://www.tandfonline.com/loi/mcsa20 Household Wealth in China Yu Xie ab & Yongai Jin c a University of Michigan, Ann Arbor, MI b Peking University, Beijing, China c Renmin University of China, Beijing, China Published online: 29 May 2015. To cite this article: Yu Xie & Yongai Jin (2015) Household Wealth in China, Chinese Sociological Review, 47:3, 203-229, DOI: 10.1080/21620555.2015.1032158 To link to this article: http://dx.doi.org/10.1080/21620555.2015.1032158 PLEASE SCROLL DOWN FOR ARTICLE Taylor & Francis makes every effort to ensure the accuracy of all the information (the “Content”) contained in the publications on our platform. However, Taylor & Francis, our agents, and our licensors make no representations or warranties whatsoever as to the accuracy, completeness, or suitability for any purpose of the Content. Any opinions and views expressed in this publication are the opinions and views of the authors, and are not the views of or endorsed by Taylor & Francis. The accuracy of the Content should not be relied upon and should be independently verified with primary sources of information. Taylor and Francis shall not be liable for any losses, actions, claims, proceedings, demands, costs, expenses, damages, and other liabilities whatsoever or howsoever caused arising directly or indirectly in connection with, in relation to or arising out of the use of the Content.
Transcript of Household Wealth in China - Princeton · However, Taylor & Francis, our agents, and our licensors...

This article was downloaded by: [141.211.200.142]On: 26 July 2015, At: 12:02Publisher: RoutledgeInforma Ltd Registered in England and Wales Registered Number: 1072954Registered office: 5 Howick Place, London, SW1P 1WG
Click for updates
Chinese Sociological ReviewPublication details, including instructions forauthors and subscription information:http://www.tandfonline.com/loi/mcsa20
Household Wealth in ChinaYu Xieab & Yongai Jinc
a University of Michigan, Ann Arbor, MIb Peking University, Beijing, Chinac Renmin University of China, Beijing, ChinaPublished online: 29 May 2015.
To cite this article: Yu Xie & Yongai Jin (2015) Household Wealth in China, ChineseSociological Review, 47:3, 203-229, DOI: 10.1080/21620555.2015.1032158
To link to this article: http://dx.doi.org/10.1080/21620555.2015.1032158
PLEASE SCROLL DOWN FOR ARTICLE
Taylor & Francis makes every effort to ensure the accuracy of all theinformation (the “Content”) contained in the publications on our platform.However, Taylor & Francis, our agents, and our licensors make norepresentations or warranties whatsoever as to the accuracy, completeness,or suitability for any purpose of the Content. Any opinions and viewsexpressed in this publication are the opinions and views of the authors, andare not the views of or endorsed by Taylor & Francis. The accuracy of theContent should not be relied upon and should be independently verified withprimary sources of information. Taylor and Francis shall not be liable for anylosses, actions, claims, proceedings, demands, costs, expenses, damages,and other liabilities whatsoever or howsoever caused arising directly orindirectly in connection with, in relation to or arising out of the use of theContent.
This article may be used for research, teaching, and private study purposes.Any substantial or systematic reproduction, redistribution, reselling, loan,sub-licensing, systematic supply, or distribution in any form to anyone isexpressly forbidden. Terms & Conditions of access and use can be found athttp://www.tandfonline.com/page/terms-and-conditions
Dow
nloa
ded
by [
] at
12:
02 2
6 Ju
ly 2
015

Chinese Sociological Review, 47(3): 203–229, 2015Copyright © Taylor & Francis Group, LLCISSN 2162-0555 print/2162-0563 onlineDOI: 10.1080/21620555.2015.1032158
Household Wealth in ChinaYu Xie, University of Michigan, Ann Arbor, MI and
Peking University, Beijing, ChinaYongai Jin, Renmin University of China, Beijing, China
Abstract: With new nationwide longitudinal survey data now available fromthe China Family Panel Studies (CFPS), we study the level, distribution,and composition of household wealth in contemporary China. We found thatthe wealth Gini coefficient of China was 0.73 in 2012. The richest 1 percentowned more than one-third of the total national household wealth, while thepoorest 25 percent owned less than 2 percent. Housing assets, which accountedfor over 70 percent, were the largest component of household wealth. Finally,the urban-rural divide and regional disparities played important roles inhousehold wealth distribution, and institutional factors significantly affectedhousehold wealth holdings, wealth growth rate, and wealth mobility.
Introduction
In the very long history of humanity, wealth was a recent phenomenon, atleast for the masses. In the early stages of all societies, productivity waslow; food, clothing, and shelter were the most important elements of liveli-hood. Wealth accumulation was possible for only a small minority of elites,as almost all ordinary people’s livings verged on subsistence (Clark 2008).The Industrial Revolution brought significant improvements in pro-ductivity, which led to savings and then the accumulation of wealth thatis typical of capitalistic economies in Western societies (Clark 2008; Piketty2014). As a result, wealth became available to a small but significant portionof the population known as capitalists––the property-owning class (Piketty
Address correspondence to Yu Xie, Population Studies Center, University ofMichigan, P. O. Box 1248, 426 Thompson Street, Ann Arbor, MI 48106–1248.E-mail: [email protected]
203
Dow
nloa
ded
by [
] at
12:
02 2
6 Ju
ly 2
015

2014). Today, wealth is one of the most important dimensions of socialstratification in the United States, Europe, and other developed nations,affecting such social outcomes as class identification, children’s education,and political views (Keister 2000).
China has experienced a historical pattern similar to that in the West,albeit later and more rapidly. For quite a long period in China, wealthwas a luxury that was available to only a select few. Before the economicreform that began in 1978, China had a planned economy in which pro-ductivity was low, private property of any substantial value was prohibited,and necessities such as housing and food were collectively produced andthen administratively distributed on egalitarian terms (Xie, Lai, and Wu2009). Therefore, wealth was seldom a topic of public discourse before sus-tained rapid economic development was launched by the economic reform in1978 (Xie 2011). The large amount of private wealth accumulated during theeconomic reform era, however, is now unequally distributed across theChinese population. Thus, wealth inequality, in sharp contrast to the egali-tarianism before the economic reform, has drawn a lot of attention fromsocial scientists and laypeople alike. Unfortunately, discussions aboutwealth inequality in China have therefore been mostly ideologically-ladenor opinion-based, as scholarly knowledge about the subject matter is quitelimited. Empirical research on this topic is much in need.
Empirical research on wealth in China began in the 1990s. Using datafrom the China Household Income Project (CHIP) survey, which coveredselected provinces, McKinley (1993) examined wealth distribution in therural areas since 1988 and found that wealth was relatively equally distrib-uted in rural China, with a wealth Gini coefficient of 0.31. Scholarly atten-tion to wealth has increased since the 2000s, the consensus being that wealthinequality has increased over time (Li, Wei, and Ding 2005; Li et al. 2008).Despite increasing interest in wealth distribution in China, however, fewempirical studies on wealth using national data, especially compared withstudies of income inequality, can be found in the literature because highquality data on wealth are difficult to collect.
In 2010, theChinaFamilyPanel Studies (CFPS)began collecting informationabout household wealth in China, laying the data foundation for this study (XieandHu 2014). As a longitudinal nationwide survey, the CFPS not only capturesa cross section of wealth holdings but also facilitates research on wealth growthand wealth dynamics over time at the family level. In this paper, we analyze theCFPS data to achieve four research objectives on household wealth in contem-porary China: (1) understanding household wealth holdings and their compo-nents, (2) assessing the level of inequality in household wealth, (3) estimatingmajor social determinants of household wealth, and (4) investigating householdwealth growth and wealth mobility between 2010 and 2012. While this paperoverlaps substantially with an earlier report in Chinese (Xie and Jin 2014), theresults slightly differ, as we adopted the latest weights in the CFPS data files.
204 CHINESE SOCIOLOGICAL REVIEW
Dow
nloa
ded
by [
] at
12:
02 2
6 Ju
ly 2
015

Data and Measures
The CFPS is an ongoing, nationally representative, longitudinal surveyconducted by the Institute of Social Science Survey at Peking University.The 2010 CFPS baseline survey interviewed 14,798 households and all theirinhabitants using a multistage probability sampling procedure (Xie and Luforthcoming). Five provinces—Liaoning, Hebei, Shanghai, Guandong, andGansu—were selected to be oversampled to be representative at the provin-cial level for regional comparison purposes. The sample size is about 1,500households in each oversampled province. In the follow-up survey conductedin 2012, about 85 percent of the original households surveyed were success-fully interviewed. See Xie and Hu (2014) and Xie, Hu, and Zhang (2014) forintroductions to the study. In the first two sections of this paper, which coverhousehold wealth holdings and wealth distributions, we supplement theCFPS data with data from the China Rich List (Hurun Report 2012a), withappropriate weights applied to the CFPS sample data of 2012 so that thecombined data are at the population level. For the remaining analyses,detailed adjusted data are not available, therefore we use only CFPS sampledata for further analyses. Still, we apply appropriate cross-sectional weightsin analyzing wealth composition and socio-economic determinants. How-ever, for the last section, which concerns wealth dynamics between 2010and 2012, considering the complexity of longitudinal weights, we useresampled data to reverse the regional oversampling and represent theChinese population without using weights (Xie and Lu forthcoming).
The CFPS dataset contains comprehensive measurements of assets, includ-ing housing assets, financial assets (e.g., savings, stock, funds, bonds, financialderivatives, and other financial assets), agricultural machinery, businessassets, detailed items of durable goods (valuables included), and liabilitiesfrom housing and other sources. Land asset is a very important componentof rural household wealth, but its value is difficult to estimate because thereis no legal market for it in China. We follow the practice of McKinley andGriffin (1993), who assume that 25 percent of the gross agricultural outputvalue can be attributed to land and that this flow can be converted into a stockvalue by assuming an 8 percent rate of return in estimating land assets.
We also make imputations for missing values. For missing housingvalues, we multiply the amount of space in square meters by the average unitvalue for the same type of housing reported at the community level. Formissing values from other sources, such as financial assets and durablegoods, we impute missing data with values reported by the household inthe same community the family income of which is closest to that of thehousehold with the missing value. See Jin and Xie (2014) for detailed proce-dures of imputation. We measure total household assets (or total householdwealth, or net worth) at the household level as the sum of land, housing,financial, and fixed assets for production and durable goods, minus housing
SPRING 2015 205
Dow
nloa
ded
by [
] at
12:
02 2
6 Ju
ly 2
015

and nonhousing liabilities. Negative values are kept in all the subsequentanalyses.
Household Wealth Holdings
A common challenge confronted by wealth researchers is that random sam-pling fails to adequately capture the wealth information of the extremelywealthy, who account for a large portion of total wealth holdings (Keister2014). The distribution of wealth in China is highly skewed, as in most othersocieties, meaning that a small minority of the population possesses a verylarge amount of the wealth (Piketty 2014). Unlike general materialresources, such as education, income, food, health, and housing space, thatare usually more evenly distributed in a population, all the wealth in asociety can theoretically be held by a single person or family. The greaterskewness in the distribution of wealth relative to that of income can be seenin the 90/10 ratio.1 In the 2012 CFPS data, the 90/10 ratio for family incomeis 13.1 (Xie et al. 2013), whereas the 90/10 ratio for wealth is up to 33. Thehighly skewed distribution of wealth indicates that traditional random sam-pling may bias the results of wealth research since it has little chance to cap-ture the extremely wealthy outliers. The poor performance of randomsampling in wealth research lies in its inability to capture small probabilityevents, as it is designed to reveal expected average statistical characteristicsof a population, such as the average family size, average age, and averageeducation level of a certain group. The presence of extreme wealth, however,is a very small probability event, but one that contains a non-negligible partof a nation’s total wealth. Thus, a random sampling strategy would not giveus an adequate picture of the top wealthiest portion of the population.
Let us assume that the richest single family possesses 5 percent of totalprivate wealth. For a large population, a random sample has almost a zeroprobability of capturing the wealthiest family. When it does not capture thewealthiest family, the total amount of wealth is underestimated by 5 percent.If, by some luck, the sample does include the wealthiest family, the totalamount of wealth is vastly overestimated. The problem, of course, is thatthere is simply no subpopulation of the wealthiest family in a population,from which we could draw a subsample. By definition, the wealthiest familyis a single phenomenon.
Since the absence of extremely wealthy people would bias the results ofwealth holdings and distribution, we supplement our random sampling datawith data from the China Rich List (Hurun Report 2012a), which includesthe 1000 richest Chinese individuals. Previous research on different countrieshas shown that the income distribution of the richest approximates thePareto distribution (Lydall 1968; Cowell 1995). A few researchers (Li, Sato,and Shi 2013; Wang and Zhou 2006) used the Pareto distribution to adjustthe income of the richest. The most recent Global Wealth Databook by the
206 CHINESE SOCIOLOGICAL REVIEW
Dow
nloa
ded
by [
] at
12:
02 2
6 Ju
ly 2
015

Credit Suisse Research Institute also used an adjustment for the wealth of therichest with the Pareto distribution. Following these works, we use the ChinaRich List (Hurun Report 2012a) data to estimate the Pareto distribution forthe wealth of the top 0.1 percent richest families in the Chinese population.Then we expand the CFPS data with the sampling weight to represent theremaining 99.9 percent population. Combining the China Rich List for thepredicted 0.1 percent richest data and the remaining 99.9 percent populationfrom the CFPS data expanded with the sampling weight, we put togethercomposite nationwide household wealth data, called “adjusted data” for brev-ity, for our analyses of the total household wealth holdings and distribution.
In Table 1, we report the descriptive statistics of nationwide householdwealth holdings, presenting both unadjusted and adjusted values. As shown,the average adjusted household wealth was 422,000 yuan, and the medianvalue was 158,000 yuan in 2012. The poorest quartile was 63,000 yuan,and the third quartile was 331,000 yuan. We show that the adjustment bythe China Rich List changes the mean value, but neither the median northe quartiles. Even the 90th and 95th percentiles are changed little by theadjustment. After the adjustment, the 90th percentile was 692,000 yuan,and the 95th percentile stood at 1,128,000 yuan.
Our estimated householdwealth holdings inChina differ from those in a pre-vious study in significant ways. Based on the China Household Finance Survey(CHFS) conducted by the SouthwesternUniversity of Finance and Economics,an earlier study reported the average net value of household assets at 1,129,838yuan in 2011, with that in urban areas at 2,365,765 yuan and that in rural areasat 310,400 yuan (Gan at al. 2014). Hence, the results from the CHFS differgreatly from our estimates. Estimates similar to ours were reported by theGlobal Wealth Databook 2012 conducted by Credit Suisse Research, showingthat the wealth per adult aged 20 and above in China in 2012 was at US$20,452, or 128,848 yuan, and the total nationwide assets amounted to US$20.2 trillion, or 127.3 trillion yuan (Davies, Lluberas, and Shorrocks 2012).
Combining our estimate of the average household net worth, the numberof households and the number of adults age 20 and above (National Bureauof Statistics 2013),2 our estimate of the wealth per adult is 174, 000 yuan,
Table 1
Mean and Quantiles of Net Worth in 2012 for China (units: 10,000 yuan)
Mean
Quantiles
25% 50% (median) 75% 90% 95%
Unadjusted 32.2 6.3 15.8 33.0 68.7 111.5
Adjusted 42.2 6.3 15.8 33.1 69.2 112.8
SPRING 2015 207
Dow
nloa
ded
by [
] at
12:
02 2
6 Ju
ly 2
015

while the total national wealth is 181.3 trillion yuan. In contrast, the esti-mated wealth per adult age 20 and above and national household’s wealthholdings with CHFS data would be 466,000 yuan and 485 trillion yuan,respectively. Therefore, our estimates are closer than those based on theCHFS to estimates provided by the Credit Suisse Research Institute afterthe currency adjustment of U.S. dollars to Chinese yuan.
To assess the plausibility of the estimates, we further examine a well-established finding that the wealth/income ratio of a nation tends to stabilizeat a fixed number. After studying the wealth/income ratios since 1870 inEurope and the United States, Piketty (2014) found that the wealth/incomeratio stabilizes at around 4 to 7 over the long run, meaning that the nationalwealth in one year is approximately the accumulation of 4 to 7 years ofnational income. He reported that the wealth/income ratio ranged from 6to 7 in Europe and around 4 to 5 in the United States.
Based on this stable wealth/income ratio theory, we calculate this ratio forChina and use it to evaluate the plausibility of our estimates for China’snational households’ wealth holdings. According to the CFPS data, the aver-age household net income in 2012 was 45,665 yuan (Xie et al. 2013), and theaverage household net wealth was 422,000 yuan, generating a wealth/incomeratio of 9.2. By comparison, the wealth/income ratio for the CHFS results is19.3 Although both estimated ratios are greater than those in Europe and theUnited States, we believe that 9.2 is more plausible than 19, even after we con-sider the inflated housing prices and other economic conditions in China.
It should be noted that our results reported in this paper pertain only toprivate assets, therefore public assets, such as schools, hospitals, and state-owned enterprises are not included in our calculation. In fact, public assetsare particularly large in China. For example, one study concluded that theproportion of assets owned by state-owned enterprises is greater than assetsowned by private or foreign enterprises: the state-owned enterprise assetsaccounted for more than half of the nation’s enterprise assets (50.1 percent)in 2008, with the remainder split between private (20.1 percent) and foreign(29.8 percent) enterprises (Liu 2013). Also, note that we do not includeassets of overseas Chinese and Chinese residents living in Taiwan, HongKong, and Macau, but some of these people own large amounts of businessassets and employ many workers, that is, generate wealth for them, inChina. For these reasons, our estimated wealth/income ratio of 9.2 seemsrelatively high. Whether this estimate is reasonable and how it should beunderstood remain to be further studied in future research.
Household Wealth Distribution
As has been repeatedly demonstrated in literature (e.g., Fireside et al. 2009;Keister 2000; Scholz and Levine 2003), wealth inequality is more severe than
208 CHINESE SOCIOLOGICAL REVIEW
Dow
nloa
ded
by [
] at
12:
02 2
6 Ju
ly 2
015

income inequality. Beginning in September 2011, the Occupy Wall Streetdemonstrators succeeded in attracting the attention of the entire world towealth inequality issues. Taking the United States as an example, wealthinequality by race is much larger than income inequality by race (Menchikand Jianakoplos 1997; Oliver and Shapiro 1997). It may be a surprise tosome readers that wealth is only weakly correlated with income. Withnationwide survey data from the 1980s, Keister (2000) showed that the cor-relation coefficient between wealth and income in the United States was only0.5. This correlation dropped to 0.26 when asset income was removed fromtotal income (Lerman and Mikesell 1988). Given the significant differencebetween household wealth and income, researchers now pay close attentionto household wealth as a different but important indicator of family finan-cial well-being (Keister and Moller 2000).
Though the Chinese are unlikely to ever hold demonstrations like OccupyWall Street, wealth inequality in China has also drawn intense interest fromscholars and social scientists. Scholars agree that the wealth gap has beenwidening more and more and that wealth distribution has become increas-ingly polarized in recent years (Li, Wei, and Ding 2005; Li et al. 2008).Despite scholarly awareness of wealth inequality, however, empirical evi-dence is scarce. With longitudinal data from the CFPS, we attempt toempirically examine wealth inequality in China in this paper. In this section,we report the household wealth distribution with multiple indexes: share intotal household wealth by several quantiles, Gini coefficient4 and the 90/10ratio. We present the main results for 2012 in Table 2.
As shown in Table 2, most of the household wealth in China is in thehands of a minority, indicating a high magnitude of inequality. To be spe-cific, the bottom 25 percent of households only held 1 percent of totalnational wealth, and the poorest half held 8 percent. In contrast, householdsabove the upper quartile possessed 79 percent of the total national wealth.And the richest 10 percent owned 62 percent of the total national wealth,while the richest 5 percent owned more than 50 percent. Notably, the top1 percent in China possessed more than one-third of the national net wealth.The 90/10 ratio tells a similar story about wealth inequality in China.
Table 2
Wealth Distribution in 2012
0–25%
0–50%
75–100%
90–100%
95–100%
99–100%
Ginicoefficient
90/10ratio
Unadjusted 1.6 9.9 72.3 50.5 37.0 16.1 0.64 32.69
Adjusted 1.2 7.5 78.8 62.1 51.7 35.3 0.73 32.94
SPRING 2015 209
Dow
nloa
ded
by [
] at
12:
02 2
6 Ju
ly 2
015

Specifically, the 90/10 ratio of wealth in 2012 was 32.9, meaning that thewealth owned by a household at the 90th percentile point was about 33 timeshigher than the wealth owned by a household at the 10th percentile point. Incontrast, the 90/10 ratio of income was 13.1 in the same year (Xie et al.2013). In short, household wealth inequality in China was much greaterand more severe than income inequality.
Comparison with the United States helps us to interpret our results.We present comparable U.S. data between 1983 and 2001, along with ourChinese results, in Table 3. We observe that the richest 1 percent of householdsowned similar proportions of private wealth––more than a third––in Chinaand the United States. However, there are differences in wealth distributionbetween the two countries. First of all, the Gini coefficient of wealth was smal-ler in China (0.73) than in the United States (over 0.8), indicating less wealthinequality in China. Another way to look at this is to examine the relativeshare of wealth after we exclude the richest households. In this perspective,we find more wealth possessed by households in the lower end of the distri-bution in China than in the United States. For example, the poorest 60 percentof households in the United States owned less than 5 percent of the wealth,while the corresponding percentage in China was 12 percent. The poorest 40percent of households in the United States owned less than 1 percent of thewealth, whereas the corresponding figure in China was 4 percent.
Thus, the richest segment of the Chinese population accounts for a largeshare of private wealth, whereas wealth distribution for the rest of thepopulation is not too extremely skewed, at least relative to the United States.This particular pattern of wealth distribution is, to some extent, a productof China’s recent history. Benefiting from the economic reform and
Table 3
Comparison of Wealth Distribution Between the United States and China
Country YearGini
coefficient0–
40%0–
60%60–
100%80–
100%90–
100%95–
100%99–
100%
UnitedStates
1983 0.799 0.9 6.1 93.9 81.3 68.2 56.1 33.81989 0.832 �0.7 4.1 95.9 83.6 70.6 59.0 37.41992 0.823 0.4 4.8 95.3 83.8 71.8 60.0 37.21995 0.828 0.2 4.7 95.3 83.9 71.8 60.3 38.51998 0.822 0.2 4.7 95.3 83.4 70.9 59.4 38.12001 0.826 0.3 4.2 95.7 84.4 71.5 59.2 33.4
China 2012 0.726 4.4 11.9 88.1 74.5 62.1 51.7 35.3
Sources: Data for America comes from “Changes in Household Wealth in the 1980s and1990s in the US” (Wolff 2004); data for China is calculated from CFPS 2012 and adjustedbased on the China Rich List (Hurun Report 2012a).
210 CHINESE SOCIOLOGICAL REVIEW
Dow
nloa
ded
by [
] at
12:
02 2
6 Ju
ly 2
015
marketization, a minority of the population have accumulated a hugeamount of wealth via private or joint stock startups and become super-rich.These individuals and families have attained their wealth in a very short per-iod of time, becoming “nouveau riche” and accounting for a large portion ofthe overall inequality. At the same time, the egalitarian government policiesprior to the economic era, especially those concerning housing before Chi-na’s housing reform that took real effect in 1998, contributed to the relativeequality in household wealth distribution. Prior to the economic reform,China had a planned economy, in which housing was publicly owned anddistributed among urban citizens for free based on demand, a system alsoknown as the welfare housing policy. The housing reform legalized the pri-vatization of housing: housing ownership was transferred to existing occu-pants at deeply discounted prices (Song and Xie 2014). The discountedprices allowed ordinary families to own housing units. For instance, 80 per-cent of urban families owned their own houses by 2000, which was muchhigher than the housing ownership rate (ranging from 50 percent to 60 per-cent) in almost all developed countries. After the housing reform, privatiza-tion of housing became the most important driving force for the increase ofhousehold wealth in China (Walder and He 2014). Moreover, the rapidincreases in housing prices in major cities, such as Beijing, Shanghai, andShenzhen have made housing assets more and more important in terms ofhousehold wealth. As a result, housing assets on average now account formore than 70 percent of household wealth, 80 percent in large cities likeBeijing and Shanghai. In other words, many working-class families havegreatly benefited from both welfare housing and housing privatization,which served as a key factor in generating household wealth for mostChinese families (Walder and He 2014). For this reason, household wealthis distributed relatively equally among middle-class families in urban China.In contrast, the accumulation of household wealth in the United States isrealized in a market economic system via income savings and personalinvestment. Consequently, low-income families and families without inher-ited wealth cannot accumulate wealth through savings and investment,leading to large household wealth inequality overall. Given the fact thatChina has now completed its housing reform and abolished its welfarehousing system, the main sources of household wealth will be based, as isthe case in the United States, on either income savings and personalinvestment or inheritance. We thus venture to predict that with furthermarketization, wealth inequality in China will likely rise in the future.
Household Wealth Composition
Wealth is a complicated social phenomenon. To understand wealth, we needto study it in more detail. In the remainder of this paper, we present theresults from our further analyses focusing on a few select topics: wealth
SPRING 2015 211
Dow
nloa
ded
by [
] at
12:
02 2
6 Ju
ly 2
015

composition, factors that shape its distribution pattern, short-term trends,and mobility at the family level. As mentioned before, data from the CFPSas a random sample can hardly capture those extreme rich outliers, so wecompensate for this deficiency by adjusting the resulting distribution by aug-menting the CFPS data with known cases of the super-rich wealth holdersusing an extra data source, the China Rich List (Hurun Report 2012a).Unfortunately, we have no detailed information about the richest, such astheir wealth composition and demographic characteristics, so we will haveto drop this added group in subsequent analyses. This section focuses onthe composition of household wealth in China, followed by analysis of socialand economic determinants of household wealth and household wealthmobility between 2010 and 2012.
In Table 4, we present the composition of household wealth, for China asa whole and separately for urban and rural China. The largest component ofhousehold wealth, housing assets contributed an average share of 74 percentto total household wealth in China. While the dominant role of housingassets in household wealth composition is well known (Gottschalck 2008;Jäntti and Sierminska 2008), the proportion is much larger in China thanin other countries. For example, the proportion of housing assets in totalhousehold wealth was 54.2 percent in Austria in 2002, 37.7 percent in Italyin 2000 (Jäntti and Sierminska 2008), and 52 percent in the United States in2002 (Gottschalck 2008). Additionally, due to housing privatization and therising prices of real estate, the share of housing assets in household wealthhas been increasing over the past two decades in China. Previous researchhas shown that the ratio of housing assets to total household wealth was35.4 percent in 1995, 57.9 percent in 2002 (Li and Zhao 2008), and reachedover 70 percent in 2012 based on our estimation.
Table 4
Composition of Household Wealth Portfolios, Urban, Rural, and ChinaOverall in 2012 (units: %)
Assets China Overall Urban China Rural China
Land assets 7.7 2.7 20.4
Housing Assets 73.9 78.7 60.9
Financial Assets 10.6 11.1 9.5
Fixed assets for production 8.5 7.7 11.0
Durable goods 5.6 5.6 5.6
Housing debts �2.3 �2.5 �1.7
Nonhousing debts �3.9 �3.2 �5.7
212 CHINESE SOCIOLOGICAL REVIEW
Dow
nloa
ded
by [
] at
12:
02 2
6 Ju
ly 2
015

Financial assets accounted for only 11 percent of the total householdwealth in China, which was a relatively small portion compared with anaverage of 30 percent or more in other countries (Jäntti and Sierminska2008). The same was true of fixed assets for production and durable goods,accounting for 9 percent and 6 percent, respectively. The share of nonhous-ing debts was slightly higher than housing debts. In sum, housing assets arethe dominant component of household wealth in China. Other types ofassets account for only small portions.
Household wealth composition in urban areas differs from that in ruralareas. Two notable differences lie in housing assets and land. Housing assetsaccounted for 79 percent of the total household wealth in urbanChina but only61 percent in rural China, an 18 percent difference. Notably, land was a veryimportant component and contributed 20 percent to household wealth in ruralChina.5 Meanwhile, financial assets accounted for a larger portion of totalhousehold wealth in urban households. However, fixed assets for productiontook up a larger portion of household wealth in rural China.Debt compositionalso differed between urban and rural families. On the whole, rural familieshad higher debts, especially nonhousing debts, than urban families.
Household wealth composition differs not only between urban and ruralareas but also across different regions. The CFPS oversampled five pro-vinces––Liaoning, Hebei, Shanghai, Gansu, and Guangzhou––to captureregional variation. We make use of this design to reveal regional variationin household wealth. First, land assets took up 16 percent of the total house-hold wealth in Gansu province, which was the highest among the five pro-vinces. In Liaoning and Henan provinces, land assets took up around 11percent of total household wealth, while families in Shanghai had minimalland assets. Second, we find a large variation in housing assets across thefive provinces, though housing assets remain consistently the largest compo-nent of household wealth. For example, housing assets took up 87 percent ofthe total household wealth in Shanghai province, which partially reflects thevery high housing prices in large cities. The lowest proportion is found inGansu, at 68 percent. Third, the provinces differ in debt structure. We findthat less developed areas suffer greater debt burdens. To illustrate, the aver-age was 13 percent in Gansu but less than 2 percent in Shanghai. Further, inless developed areas like Gansu, nonhousing debts were higher, while hous-ing debts were higher in developed areas, such as Shanghai. This regionalheterogeneity reflects not only the different levels of urbanization and mod-ernization, but also the increasingly important role of housing prices inhousehold wealth.
To further investigate the role of housing assets in household wealthinequality, we apply the method proposed by Lerman and Yitzhaki (1985)to decompose the wealth Gini coefficient. Results show that housinginequality contributed most to wealth inequality. Specifically, housing assetsinequality accounted for 73 percent of the total household wealth inequality
SPRING 2015 213
Dow
nloa
ded
by [
] at
12:
02 2
6 Ju
ly 2
015

in China, 76 percent in urban China and 59 percent in rural China. Therewas some regional variation in this, with housing assets inequality account-ing for 87 percent of the household wealth inequality in Shanghai, whichwas the highest among the five oversampled provinces.
In summary, consistent with previous findings (Li and Zhao 2008; Meng2007; Sato, Sicular, and Yue 2013; Zhao and Ding 2010), housing is themain contributor to household wealth inequality in contemporary China.The disproportional share of housing assets in household wealth may under-score underlying structural problems that may slow down China’s furthereconomic development, as little private wealth is invested in production,job creation, and research and development.
Determinants of Household Wealth
In this section, we explore the socio-economic determinants of householdwealth holdings. In particular, we focus on four factors: regional andurban/rural differences, work unit (also known as danwei) characteristicsof household members, education of household members, and householdincome. Our analyses are based on the CFPS data alone.
Table 5 highlights the large gap in household wealth holdings betweenurban and rural areas. The average household wealth holdings of rural fam-ilies were 189,000 yuan, less than half the holdings of urban families, at444,000 yuan. Meanwhile, the household wealth in rural areas was muchmore equally distributed compared with that in urban areas, as shown bythe shares of wealth owned by the quantile groups. Obviously, the bottom25 percent and 50 percent families in rural areas owned a higher percentageof the total household wealth compared with that owned by families in thesame quantile groups in urban areas. However, the story was reversed forthe top 25 percent, 10 percent, and 5 percent groups. For example, the bot-tom 50 percent of families in rural areas owned 13 percent of the total rural
Table 5
Mean Household Net Worth and Distribution in 2012, by Urban/Rural AreaType
AreaType
Meanhouseholdnet worth
(10,000 yuan) 0–25% 0–50% 75–100% 90–100% 95–100% 90/10 ratio
Urban 44.4 1.5 10.3 71.1 48.3 34.5 43.2
Rural 18.9 2.7 13.1 66.2 44.2 32.3 18.7
214 CHINESE SOCIOLOGICAL REVIEW
Dow
nloa
ded
by [
] at
12:
02 2
6 Ju
ly 2
015

household wealth, which was 3 points higher than that owned by the bottom50 percent of urban families. In contrast, the top 10 percent of urban fam-ilies owned 48 percent of the total urban household wealth, which was 4points higher than that owned by the top 10 percent of rural households.With the 90/10 ratios at 43 for urban areas and 19 for rural areas, respect-ively, we draw the same conclusion––that wealth is more equally distributedin rural than in urban areas.
To understand the importance of urban-rural differences for total wealthinequality, we calculate the Theil Index (Theil 1967). This index measure isparticularly useful because it can easily be decomposed into between-groupand within-group components. The Theil Index at the national level was0.815, the within-group component was 0.732, and the between-group coef-ficient was 0.083, meaning that the within-group and between-groupinequality constituted 89.8 percent and 10.2 percent of the total inequality,respectively. Consistent with the findings of a recent study on income thatmore than 10 percent of income inequality can be attributed to the rural-urban divide (Xie and Zhou 2014), the wealth gap between rural and urbanareas also contributes a large part to total inequality.
In addition to the urban-rural divide, regional disparities in householdwealth holdings and distribution are also evident in China. Concerningprovincial differences across the five oversampled provinces, the householdwealth holdings of Shanghai ranked first, while Gansu and Guangdong hadthe highest levels of household wealth inequality. Similarly, we use the TheilIndex to decompose total inequality into within-province and between-prov-ince inequality. Results show that 23.4 percent of the total wealth inequalitycan be explained by between-province wealth inequality, which was even lar-ger than the share of between-province inequality in the total incomeinequality (around 12 percent, see Xie and Zhou 2014). In conclusion, struc-tural factors, such as the rural-urban divide and regional disparities areimportant contributors to China’s household wealth inequality.
As has been demonstrated in the literature, a family’s socio-economicconditions are associated with wealth. In this study, we focus on three fac-tors––work unit type (within-system vs. outside-system) of household mem-bers, education of household members, and household income––asindicators of a family’s socio-economic characteristics. Following the defi-nition by Xie et al. (2013), within-system occupations are defined as posi-tions in the following organizations or enterprises: (a) party, governmentoffices, mass organizations, or army; (b) state or collectively owned publicinstitutions or research institutions; or (c) state-owned or holding enter-prises. If one or more family members worked in any of the above, weconsider this family to be within-system. Otherwise, we regard them asoutside-system. Given the fact that few families in rural areas worked forwithin-system organizations, the analysis of institutional segmentation forhousehold wealth is conducted only in urban areas.
SPRING 2015 215
Dow
nloa
ded
by [
] at
12:
02 2
6 Ju
ly 2
015
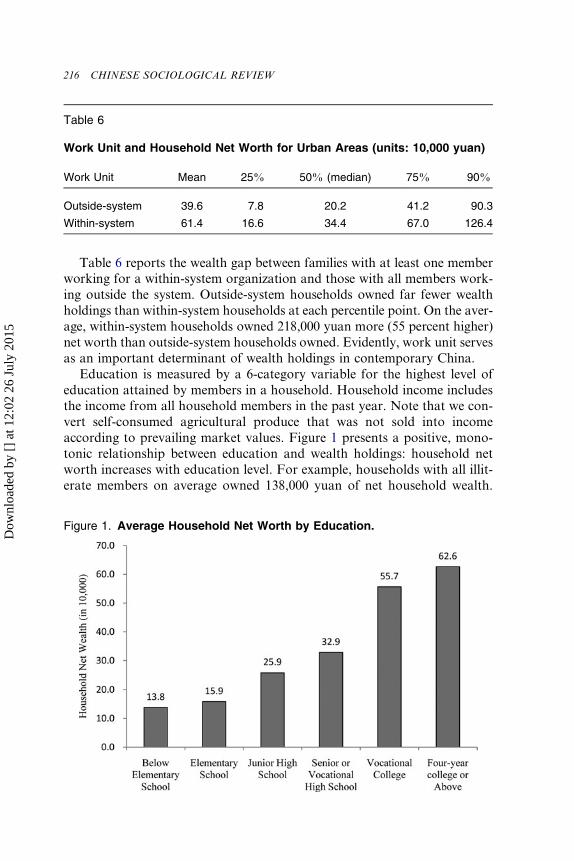
Table 6 reports the wealth gap between families with at least one memberworking for a within-system organization and those with all members work-ing outside the system. Outside-system households owned far fewer wealthholdings than within-system households at each percentile point. On the aver-age, within-system households owned 218,000 yuan more (55 percent higher)net worth than outside-system households owned. Evidently, work unit servesas an important determinant of wealth holdings in contemporary China.
Education is measured by a 6-category variable for the highest level ofeducation attained by members in a household. Household income includesthe income from all household members in the past year. Note that we con-vert self-consumed agricultural produce that was not sold into incomeaccording to prevailing market values. Figure 1 presents a positive, mono-tonic relationship between education and wealth holdings: household networth increases with education level. For example, households with all illit-erate members on average owned 138,000 yuan of net household wealth.
Table 6
Work Unit and Household Net Worth for Urban Areas (units: 10,000 yuan)
Work Unit Mean 25% 50% (median) 75% 90%
Outside-system 39.6 7.8 20.2 41.2 90.3
Within-system 61.4 16.6 34.4 67.0 126.4
Figure 1. Average Household Net Worth by Education.
216 CHINESE SOCIOLOGICAL REVIEW
Dow
nloa
ded
by [
] at
12:
02 2
6 Ju
ly 2
015

The average household net wealth was 159,000 yuan if the highest educationof a household member was elementary. It reached 626,000 yuan if the high-est education of a household member was college and above.
The relationship between income and wealth has been a long-standingtopic in household wealth studies. The two are conceptually distinct: incomemeasures the flow of economic resources, and wealth measures the stock.Due to a complicated relationship between the two over time, there is nosimple answer as to how income affects household wealth. However, onerepeatedly demonstrated finding in the literature is that wealth is weaklycorrelated with income (Keister 2000), which our data also corroborate.According to our CFPS 2012 data, the correlation coefficient betweenhousehold wealth and income was 0.35, even lower than the correlationcoefficient of 0.5 reported by Keister (2000) for the United States. As shownin Table 7, income was dispersedly distributed at each wealth level. In parti-cular, nearly half of the poorest quartile families (in wealth) earned the low-est quartile income. Similarly, nearly half of the richest quartile (in wealth)earned the highest quartile income. However, incomes were distributedwidely for the households from the second to the third quartiles in wealth.In sum, household income and wealth are more closely associated for thepoorest and the richest than for those in the middle groups.
Household Wealth Growth and Mobility
In this section, we focus on wealth mobility between 2010 and 2012. We firstdiscuss the change of wealth holdings from a macro perspective and thenlook at wealth mobility from a micro perspective at the family level. To
Table 7
The Relationship Between Wealth Distribution and Income Distribution(units: %)
Income Quartile
Wealth Quartiles
TotalQ1 Q2 Q3 Q4
Q1 45.8 29.7 16.3 8.3 100.0
Q2 25.3 29.2 27.5 18.0 100.0
Q3 18.7 26.6 30.4 24.3 100.0
Q4 10.3 14.4 25.8 49.6 100.0
Notes: Q1, Q2, Q3, and Q4 denote, respectively, the bottom, middle second, middle third,and top quartiles. The percentages do not sum to 100.0 in each row due to roundingerrors.
SPRING 2015 217
Dow
nloa
ded
by [
] at
12:
02 2
6 Ju
ly 2
015

make household wealth holdings comparable, we (1) use the Consumer Pro-duct Index (CPI) (National Bureau of Statistics 2013) to adjust the wealth in2010 to 2012 to control for price differences across years6 and (2) onlyinclude asset items surveyed in both 2010 and 2012.7 Thus, assets consideredhere are intended to capture dynamic changes in household wealth betweenthe two survey years rather than reflect the true worth of real asset holdings.
To describe the growth of household wealth from 2010 to 2012, we dividehouseholds into four wealth quartile groups in ascending order and computethe average net wealth in each group by year and area type (urban, rural, orChina overall). On average, household net wealth in 2012 increased by 18percent from the 2010 level. The growth rate differed in different groupsand area types. Specifically, the growth rate was the highest, at 62 percent,for the bottom quartile, followed by the two middle quartiles at 31 percentand 25 percent respectively, and the lowest at 15 percent for the richest quar-tile, meaning that households with less wealth experienced a higher growthrate. In parallel with the nationwide pattern, household net wealth in bothrural and urban areas grew overall. In both areas, households with lesswealth had higher growth rates, although the pattern was much more pro-nounced in urban areas than in rural areas.
To further examine factors that contributed to household wealth growth,we decomposed the total assets into four major categories and calculatedtheir absolute and relative growths. We show the results in Figure 2. Hous-ing assets still contributed more than half to the total growth, acting as aprimary contributor. The other three assets—land, financial and fixed assetsfor production and durable goods—contributed small shares to the wealthgrowth.
Table 8
Average Household Net Wealth Growth by Years, Urban, Rural and ChinaOverall (units: 10,000 yuan)
Wealthquartiles
China Overall Urban Rural
2010 2012Growthrate (%) 2010 2012
Growthrate (%) 2010 2012
Growthrate (%)
Q1 1.3 2.1 62.0 1.6 2.7 68.2 1.2 2.0 58.9
Q2 7.8 10.2 30.7 12.0 15.3 27.8 5.8 7.8 33.3
Q3 17.6 22.0 25.1 27.1 31.9 17.6 11.9 15.6 30.9
Q4 77.2 88.8 14.9 108.4 126.4 16.6 41.6 49.1 18.1
Total 26.0 30.7 18.4 37.3 44.1 18.2 15.1 18.6 22.9
Note: Q1, Q2, Q3, and Q4 denote, respectively, the bottom, middle second, middle third,and top quartiles.
218 CHINESE SOCIOLOGICAL REVIEW
Dow
nloa
ded
by [
] at
12:
02 2
6 Ju
ly 2
015

We now report findings from an analysis of wealth mobility at the familylevel between 2010 and 2012. For the analysis, we first sorted all householdsinto wealth quartiles in ascending order in respective survey years. Wethen examined quartile rank changes from 2010 to 2012, as measures ofhousehold wealth mobility, by constructing a joint distribution, shown inTable 9. To be specific, percentages located on the diagonal line indicatethe share, row-percentage, of households with no change of quartile-order,with percentages above the diagonal line indicating upward mobility andpercentages under the diagonal line indicating downward mobility.
We observe that the percentages on the diagonal line are 58 percent,42 percent, 43 percent and 65 percent, all significantly larger than the off-diagonal cells, indicating low wealth mobility. Moreover, the poorest quar-tile and the richest quartile have larger diagonal cells than the other quartilegroups, implying even more limited mobility among the poorest and richest.
Concerning the rural-urban comparison, the diagonal cells for urban areasare greater than corresponding ones for rural areas, indicating that wealthmobility is less in urban areas than in rural areas. Additionally, the mobilitydifference between rural and urban areas is particularly large for the bottomand top quartiles. For instance, 55 percent of the rural bottom quartile in2010 remained in the same quartile in 2012, while 60 percent of the urbanbottom quartile in 2010 remained in the same quartile, a 5 percent gap.Correspondingly, this gap between rural and urban areas was 10 percentfor the top quartile. In sum, household wealth structure is more rigid (i.e.,less mobile) in urban areas than in rural areas. There are two potential expla-nations for this. First, housing assets, as the main component of householdwealth in urban areas, tended to be either relatively stable or appreciate
Figure 2. Household Wealth Growth from 2010 to 2012.
SPRING 2015 219
Dow
nloa
ded
by [
] at
12:
02 2
6 Ju
ly 2
015
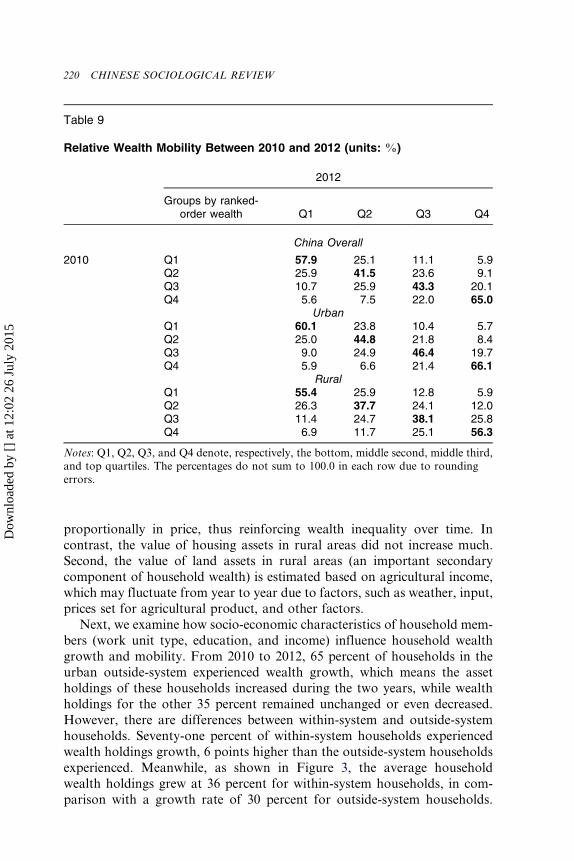
proportionally in price, thus reinforcing wealth inequality over time. Incontrast, the value of housing assets in rural areas did not increase much.Second, the value of land assets in rural areas (an important secondarycomponent of household wealth) is estimated based on agricultural income,which may fluctuate from year to year due to factors, such as weather, input,prices set for agricultural product, and other factors.
Next, we examine how socio-economic characteristics of household mem-bers (work unit type, education, and income) influence household wealthgrowth and mobility. From 2010 to 2012, 65 percent of households in theurban outside-system experienced wealth growth, which means the assetholdings of these households increased during the two years, while wealthholdings for the other 35 percent remained unchanged or even decreased.However, there are differences between within-system and outside-systemhouseholds. Seventy-one percent of within-system households experiencedwealth holdings growth, 6 points higher than the outside-system householdsexperienced. Meanwhile, as shown in Figure 3, the average householdwealth holdings grew at 36 percent for within-system households, in com-parison with a growth rate of 30 percent for outside-system households.
Table 9
Relative Wealth Mobility Between 2010 and 2012 (units: %)
2012
Groups by ranked-order wealth Q1 Q2 Q3 Q4
China Overall
2010 Q1 57.9 25.1 11.1 5.9Q2 25.9 41.5 23.6 9.1Q3 10.7 25.9 43.3 20.1Q4 5.6 7.5 22.0 65.0
UrbanQ1 60.1 23.8 10.4 5.7Q2 25.0 44.8 21.8 8.4Q3 9.0 24.9 46.4 19.7Q4 5.9 6.6 21.4 66.1
RuralQ1 55.4 25.9 12.8 5.9Q2 26.3 37.7 24.1 12.0Q3 11.4 24.7 38.1 25.8Q4 6.9 11.7 25.1 56.3
Notes: Q1, Q2, Q3, and Q4 denote, respectively, the bottom, middle second, middle third,and top quartiles. The percentages do not sum to 100.0 in each row due to roundingerrors.
220 CHINESE SOCIOLOGICAL REVIEW
Dow
nloa
ded
by [
] at
12:
02 2
6 Ju
ly 2
015

In sum, within-system households have higher levels of both wealth holdingsand wealth growth rates, widening the wealth gap between the two types ofhouseholds.
Education is positively correlated with household wealth growth: themore education household members had, the more likely its wealth hadgrown. For instance, 59 percent of the illiterate households experiencedwealth holdings growth from 2010 to 2012, compared to 71 percent experi-encing growth for households with at least one member having a bachelor’sdegree. As for growth rate, there is no consistent pattern. For example, thegrowth rates were higher for middle education groups than for other groups.Similarly, the growth rate was higher for middle income groups but lowerfor the bottom and top groups. We acknowledge that the manner in whicheducation and income affect wealth growth is complex. Future studies needto consider causal mechanisms of this relationship and include more charac-teristics of households and household members, in order to unpack thisblack box.
Discussion and Conclusion
This study paints an empirical picture of wealth in contemporary Chinabased on data from two recent waves of a nationally representative, longi-tudinal survey. We summarize our key findings as follows:
1. The average household wealth was 422,000 yuan in 2012 China,yielding total private wealth nationwide of 181.3 trillion yuan. The
Figure 3. Work Unit and Household Wealth Growth in Urban Areas.
SPRING 2015 221
Dow
nloa
ded
by [
] at
12:
02 2
6 Ju
ly 2
015

wealth/income ratio was 9.2, much higher than that in Europeancountries and the United States.
2. There is evidence that household wealth inequality in China grewrapidly in recent years. Previous research found that the wealth Ginicoefficient was 0.4 in 1995 and 0.55 in 2002. According to our data, itreached 0.73 in 2012. The richest 1 percent of households ownedmore than one-third of the total household wealth, while the poorest25 percent owned less than 2 percent of the total household wealth.
3. Although the richest 1 percent of households in China owned a simi-larly large share of total national household wealth to that owned bythe richest 1 percent in United States, wealth was more equally distrib-uted in China for the remaining 99 percent of households.
4. Housing assets accounted for 79 percent of urban and 61 percent ofrural household wealth. Over half of the wealth growth from 2010to 2012 was due to the growth of housing assets, and housinginequality was the main contributing factor to wealth inequality.
5. Structural factors, such as the rural-urban divide and regional dispa-rities, were major contributors to wealth inequality in China. Specifi-cally, the rural-urban divide accounted for more than 10 percent ofthe total wealth variation, while regional disparities accounted forabout 23 percent.
6. For most Chinese households, wealth holdings grew rapidly. Thehousehold wealth growth rate from 2010 to 2012 was 18 percent onaverage.
7. Several socio-economic characteristics were strongly associated withhousehold wealth: within-system households on average owned morewealth holdings and experienced faster wealth growth, and educationwas positively associated with household wealth holdings, though noconsistent effect was found on wealth growth rates.
8. Household wealth was weakly correlated with income and was moreunequally distributed than income.
Our next task is to interpret, sociologically, the empirical evidence that wehave assembled in this study of wealth and wealth distribution in contempor-ary China. To do so properly, we believe we need to go beyond the data weanalyzed for this study. In particular, we need to incorporate our understand-ing of the institutional changes that have been happening in China since thebeginning of the economic reform. The most pertinent questions are: (1) Whatis the sociological significance of household wealth in China? and (2) Who hasbenefited most from the emergence of private wealth in China?
There is no doubt that household wealth has become a significant socialphenomenon that increasingly affects social stratification in contemporaryChina. In this context, we can identify three distinct eras of social inequality
222 CHINESE SOCIOLOGICAL REVIEW
Dow
nloa
ded
by [
] at
12:
02 2
6 Ju
ly 2
015

in China’s recent history. The first era was before the economic reform thatbegan in 1978. During this period, social inequality in China was most sig-nificantly manifested by differential access to goods and services monopo-lized by the government (Bian 2002; Walder 1986). For this reason, workunit (or danwei) affiliation and position in the planned economy was impor-tant, but distribution within each work unit was handled, at least nominally,in accordance with egalitarian principles (Walder 1992; Xie, Lai, and Wu2009). In this first era, political power, or ability to extract governmentalresources, was paramount (Bian and Logan 1996; Nee 1989, 1991, 1996).In the second era, ushered in by the economic reform, goods and serviceswere marketized, managers and local officials were given discretion––especially after the reform sped up after 1992–and unprofitable state-ownedenterprises were closed down or downsized, pushing many former employeesout of the state-owned enterprises and into the private sector (Wu and Xie2003). During this period, earnings inequality became a prominent feature,as more and more goods and services became increasingly available for pur-chase on the open market. Commenting on changes from the first era to thesecond era with the logic of a market economy, Nee (1989, 1991, 1996) pre-dicted that the main determinants of socio-economic status should be fac-tors that contribute to economic productivity, such as human capital,rather than political capital, as in the first era. Although researchers didobserve a clear increase in the earnings/income returns to education (Hauserand Xie 2005), however, interpretation of this trend is ambiguous (Wu andXie 2003), especially in light of overwhelming evidence of the persistence ofpolitical power in determining earnings/income (Bian and Logan 1996;Walder 2002; Zhou 2000).
Beginning with the implementation of the housing reform in 1998 (Songand Xie 2014) and continuing to the present, China has arguably entered athird era, in which private wealth has become a significant aspect of socialinequality. This is a new period in which a small segment of the Chinesepopulation have rapidly amassed enormous wealth, which would have beenunthinkable in the two earlier periods. Some Chinese now are even able tolive on their private wealth without having to rely on labor income, as hasbeen the case in Western societies for more than two centuries (Piketty2014). The emerging importance of private wealth has serious consequencesfor social inequality, especially social mobility. During the first era, politicalcapital was important. During the second era, human capital became impor-tant because labor income was associated with a worker’s perceived pro-ductivity in the labor market. In the third, current era, wealth has becomeanother important factor, closely related to but independent of both polit-ical capital and human capital.
Differences across these three eras have implications for intergenerationalsocial mobility. In the first era, during which political capital dominated,high-status families could pass on their social advantages through political
SPRING 2015 223
Dow
nloa
ded
by [
] at
12:
02 2
6 Ju
ly 2
015

means, such as political ties or patronage. In the second era, when humancapital became important, high-status families could pass on their socialadvantages by investing in their children’s education. In the third era, duringwhich private wealth now matters, high-status families are able to pass ontheir private wealth directly to their children in the form of inheritance,unmediated by public institutions, such as education. In the future, wemay see reduced social mobility, because we are likely to see education play-ing a smaller role as a mediating mechanism linking parental and children’ssocial status (Blau and Duncan 1967).
While it is easily understandable that private wealth, once accumulated, islikely to be transferred from generation to generation, it is unclear who waslikely to accumulate wealth first. After all, almost all of the Chinese popu-lation lived on a subsistence level only thirty years ago, when virtually noChinese had significant private wealth. What social processes led somepeople, but not others, to accumulate wealth?
Clearly, this is an important question awaiting future research. The datawe analyzed for this paper are so limited that we are not in a position to givea credible answer. However, the evidence we have presented suggests thattwo main, seemingly contradictory mechanisms have been generating priv-ate wealth in China. The first wealth-generating mechanism is capital priva-tization and concentration. As China’s market economy has continued toexpand, a few individuals have become super-rich by amassing capital, thatis, means of production, such as factories, buildings, stocks and financialassets, that was previously public property and then using it to generatemore wealth through entrepreneurship and the financial market (CCB Priv-ate Bank and the Boston Constitute Group 2011, 2012; China MerchantBank and Bain & Company 2009, 2011; Hurun Report 2011, 2012b, 2013).
The second mechanism is middle-class housing conversion. Especially forthe urban middle class, who are the main subjects of this study, wealth gen-eration has actually been a legacy of the earlier planned economy, with a dis-tinct egalitarian flavor. Recall that most wealth among Chinese families is inthe form of housing. Prior to the economic reform, housing in urban areaswas distributed administratively as a state-sponsored entitlement benefit(Song and Xie 2014; Walder and He 2014; Xie, Lai, and Wu 2009). Currentoccupants of a large stock of housing units in urban China today paid verylittle for their housing units. In fact, their income is often too low relative tothe market value of the housing units they occupy (Ren and Hu 2013).Hence, ordinary families in urban areas have benefited significantly fromthe privatization of public welfare housing and rapid rises of housing prices.Housing assets, the main component of family wealth, help many middle-class families to gain wealth.
In conclusion, we argue that generation of private wealth in today’sChina has taken two distinct forms: capital concentration and conversionof socialist housing benefits. The former is market-based and favors a
224 CHINESE SOCIOLOGICAL REVIEW
Dow
nloa
ded
by [
] at
12:
02 2
6 Ju
ly 2
015

skewed distribution for more inequality. The latter was originally govern-ment-based and thus has promoted the equal distribution of wealth. Weinterpret the current state of wealth distribution in contemporary Chinaas being a product of this hybrid social process that was uniquely shapedby China’s recent past. Let us call our interpretation the “hybrid process”theory to highlight the contradictory forces that have affected wealth gener-ation and distribution in today’s China. We welcome future research toevaluate the empirical validity of the theory and its usefulness in understand-ing social inequality and social mobility in contemporary China.
Acknowledgements
The authors are grateful to Siwei Cheng, Cindy Glovinsky, Ping Lu, andChunni Zhang for their assistance on earlier drafts of the paper.
Funding
The research is supported by the Natural Science Foundation of China(Grant No. 71373012), the Center for Social Research and Institute of SocialScience Survey at Peking University and the Population Studies Center(with support from the National Institute of Child Health and HumanDevelopment, R24HD041028), the Survey Research Center, and the Centerfor Chinese Studies of the University of Michigan and the ChinaScholarship Council.
Notes
1. The 90/10 ratio is defined as the ratio of household assets at the 90th percentilepoint to household assets at the 10th percentile point. It is often used to measure thegap between richest and poorest.
2. According to the 2012 National 1% Population Sampling Survey, the totalnumber of households in China is 429.54 million, and the total number of adultsaged 20 or above is 1.042 billion.
3. The ratio is calculated based on data from Gan et al. (2014).4. The Gini coefficient is a well-understood measure of inequality. Based on the
distribution of an outcome variable by rank-ordered units in a population, the Ginicoefficient measures the degree of inequality in the distribution of total resources. AGini coefficient of 0 expresses perfect equality, with all units receiving an equal share.A Gini coefficient of 1 means maximal inequality, in which one unit has all theresources.
5. The reasons that urban families have land assets are (1) some families in urbanareas are originally from rural areas (also known as floating population) having theirown land assets and (2) some families in newly urbanized areas are engaged in agri-cultural activities.
SPRING 2015 225
Dow
nloa
ded
by [
] at
12:
02 2
6 Ju
ly 2
015

6. In CFPS 2010, assets except housing prices, stocks and funds referred to valuesin the past year (2009), so adjustment of 2010 used three years of CPIs from 2010 to2012. For housing prices, stocks and funds, the marked values were asked at the sur-vey time, so only two years of CPIs from 2011 to 2012 were used for adjustment.
7. Asset items not surveyed in 2010 are government bonds, financial derivativesand other financial products, so we do not include these three items in our compari-son. Note that assets from the three items only account for a very small portion ofhousehold wealth; thus, our comparison is meaningful despite the values not reflect-ing true levels.
References
Bian, Yanjie. 2002. “Chinese Social Stratification and Social Mobility.” AnnualReview of Sociology 28: 91–116.
Bian, Yanjie, and John R. Logan. 1996. “Market Transition and the Persistence ofPower: The Changing Stratification System in Urban China.” American Socio-logical Review 61(5): 739–758.
Blau, Peter, and Otis Dudley Duncan. 1967. The American Occupational Structure.New York: John Wiley & Sons.
CCB Private Bank and the Boston Constitute Group. 2011. 2011 Wealth Report inChina (in Chinese). Available at www.bcg.com.cn/cn/files/publications/reports_pdf/BCG_China_Wealth_2011_CHN_Final.pdf, accessed December 17,2014.
––––. 2012. 2012 Wealth Report in China (in Chinese). Available at www.ccb.com/CMS5_G20306002Resource?info=55051688;res=1356053254105928295148;download=, accessed December 17, 2014.
China Merchant Bank and Bain & Company. 2009. 2009 Private Wealth Report inChina (in Chinese). Available at www.bain.com/bainweb/images/cms/localOffice/Beijing/China_full_report.pdf, accessed December 17, 2014.
––––. 2011. 2011 Private Wealth Report in China (in Chinese). Available at http://images.cmbchina.com/pv_obj_cache/pv_obj_id_, accessed December 17, 2014.
Clark, Gregory. 2008. A Farewell to Alms: A Brief Economic History of the World.Princeton: Princeton University Press.
Cowell, Frank A. 1995. Measuring Inequality, 2nd edition. Bel Air, CA: HarvesterWheatsheaf, Hemel Hempstead.
Davies, James, Rodrigo Lluberas, and Anthony Shorrocks. 2012. Credit Suisse GlobalWealth Databook 2012. Credit Suisse Research Institute. Available at http://piketty.pse.ens.fr/files/capital21c/xls/RawDataFiles/WealthReportsEtc/CreditSuisse/CreditSuisseGlobalWealthDataBookOctober2012.pdf), last accessed July 1, 2014.
Fireside, Daniel, Amy Gluckman, Smriti Rao, Alejandro Reuss, and The Dollars &Sense Collective. 2009. The Wealth Inequality Reader, 3rd edition. Boston, MA:Dollars & Sense Economic Affairs Bureau.
Gan, Li, Zhichao Yin, Nan Jia, Shu Xu, Shuang Ma, and Lu Zheng. 2014. Data YouNeed to Know about China: Research Report of China Household Finance Survey2012. New York: Springer.
Gottschalck, Alfred O. 2008. Net Worth and the Assets of Households: 2002. UnitedStates Department of Commerce, Economics and Statistics Administration, andU.S. Census Bureau, Washington, DC. Available at www.census.gov/prod/2008pubs/p70-115.pdf, accessed July 10, 2014.
Hauser, Seth M., and Yu Xie. 2005. “Temporal and Regional Variation in EarningsInequality: Urban China in Transition between 1988 and 1995.” Social ScienceResearch 34: 44–79.
226 CHINESE SOCIOLOGICAL REVIEW
Dow
nloa
ded
by [
] at
12:
02 2
6 Ju
ly 2
015

Hurun Report. 2011. 2011 Hurun Wealth Report (in Chinese). Available at http://img.hurun.net/hmec/2011-08-23/201108231121092996.pdf, accessed October 25,2014.
––––. 2012a. China Rich List 2012 (in Chinese). Available at www.hurun.net/en/HuList.aspx?nid=14, accessed July 1, 2014.
––––. 2012b. 2012 Hurun Wealth Report (in Chinese). Available at http://up.hurun.net/Humaz/201312/20131218145057614.pdf, accessed October 25, 2014.
––––. 2013. 2013 Hurun Wealth Report (in Chinese). Available at http://up.hurun.net/Humaz/201312/20131218145442191.pdf, accessed October 25, 2014.
Jäntti, Markus, and Eva Sierminska. 2008. “Survey Estimates of Wealth Holdingsin OECD Countries: Evidence on the Level and Distribution across SelectedCountries.” Pp. 27–41 in Personal Wealth from a Global Perspective, edited byJames B. Davies. New York: Oxford University Press.
Jin, Yongai, and Yu Xie. 2014. “Technical Report on Household Wealth in 2010 and2012” (in Chinese). Available at www.isss.edu.cn/cfps/wd/jsbg/TR2012/, accessedDecember 19, 2014. Technical Report CFPS-29, Institute of Social ScienceSurvey, Peking University.
Keister, Lisa A. 2000. Wealth in America: Trends in Wealth Inequality. New York:Cambridge University Press.
––––. 2014. “The One Percent.” Annual Review of Sociology 40: 347–367.Keister, Lisa A., and Stephanie Moller. 2000. “Wealth Inequality in the United
States.” Annual Review of Sociology 26: 63–81.Lerman, Donald L., and James J. Mikesell. 1988. “Rural and Urban Poverty: An
Income/Net Worth Approach.” Review of Policy Research 7(4): 765–781.Lerman, Robert I., and Shlomo Yitzhaki. 1985. “Income Inequality Effects by
Income Source: A New Approach and Applications to the United States.” TheReview of Economics and Statistics 67(1): 151–156.
Li, Peilin, Guangjin Chen, Yi Zhang, and Wei Li. 2008. Social Harmony and Stabilityin China Today (in Chinese). Beijing: Social Sciences Academic Press (China).
Li, Shi, Hiroshi Sato, and Taili Shi. 2013. Analysis of the Income Gap Changein China: Studies of Income Distribution of Chinese Residents IV (in Chinese).Beijing: People’s Press.
Li, Shi, Zhong Wei, and Sai Ding. 2005. “Empirical Analysis on the Inequality andthe Reason for China Residents’ Property Distribution” (in Chinese). EconomicResearch Journal 6: 4–15.
Li, Shi, and Renwei Zhao. 2008. “Changes in the Distribution of Wealth in China,1995–2002.” Pp. 93–111 in Personal Wealth from a Global Perspective, edited byJames B. Davies. New York: Oxford University Press.
Liu, Yue. 2013. “Quantitative Analysis of the State-Owned Economy Since theImplemention of the Reform and Opening-Up Policy” (in Chinese). GuizhouSocial Science 2: 111–116.
Lydall, Harold. 1968. The Structure of Earnings. Oxford, UK: Clarendon Press.McKinley, Terry. 1993. “The Distribution of Wealth in Rural China.” Pp. 116–134
in The Distribution of Income in China, edited by Keith B. Griffin and RenweiZhao. London: Macmillan Press.
McKinley, Terry, and Keith Griffin. 1993. “The Distribution of Land in RuralChina.” The Journal of Peasant Studies 21(1): 71–84.
Menchik, Paul L., and Nancy Ammon Jianakoplos. 1997. “Black-White WealthInequality: Is Inheritance the Reason?” Economic Inquiry 35(2): 428–442.
Meng, Xin. 2007. “Wealth Accumulation and Distribution in Urban China.”Economic Development and Cultural Change 55(4): 761–791.
National Bureau of Statistics. 2013. China Statistical Yearbook 2013 (in Chinese).Beijing: China Statistics Press.
SPRING 2015 227
Dow
nloa
ded
by [
] at
12:
02 2
6 Ju
ly 2
015

Nee, Victor. 1989. “A Theory of Market Transition: From Redistribution toMarkets in State Socialism.” American Sociological Review 54: 663–681.
––––. 1991. “Social Inequalities in Reforming State Socialism: Between Redistri-bution and Markets in China.” American Sociological Review 56: 267–282.
––––. 1996. “The Emergence of a Market Society: Changing Mechanisms ofStratification in China.” American Journal of Sociology 101: 908–949.
Oliver, Melvin L., and Thomas M. Shapiro. 1997. Black Wealth/White Wealth: ANew Perspective on Racial Inequality. New York: Routledge.
Piketty, Thomas. 2014. Capital in the Twenty-First Century. Cambridge, MA:Harvard University Press.
Ren, Qiang, and Rongqin Hu. 2013. “Housing.” Pp. 281–304 in WellbeingDevelopment Report of China 2013 (in Chinese), edited by Yu Xie,Xiaobo Zhang, Jianxin Li, Xuejun Yu, and Qiang Ren. Beijing: PekingUniversity Press.
Sato, Hiroshi, Terry Sicular, and Ximing Yue. 2013. “Housing Ownership, Incomes,and Inequality in China, 2002–2007.” Pp. 85–141 in Rising Inequality in China:Challenges to a Harmonious Society, edited by Shi Li, Hiroshi Sato, and TerrySicular. New York: Cambridge University Press.
Scholz, John Karl, and Kara Levine. 2003. “US Black-White Wealth Inequality:A Survey.” Department of Economics and Institute for Research on Poverty,University of Wisconsin-Madison, Madison, WI. Unpublished manuscript.Available at www.econ.wisc.edu/~scholz/Research/Wealth_survey_v5.pdf, accessedOctober 17, 2014.
Song, Xi, and Yu Xie. 2014. “Market Transition Revisited: Changing Regimes ofHousing Inequality in China, 1988–2002.” Sociological Science 1: 277–291.
Theil, Henri. 1967. Economics and Information Theory. Chicago, Amsterdam: RandMcNally and Co. and North-Holland Publishing Company.
Walder, Andrew G. 1986. Communist Neo-Traditionalism: Work and Authority inChinese Industry. Berkeley and Los Angeles: University of California Press.
––––. 1992. “Property Rights and Stratification in Socialist RedistributiveEconomies.” American Sociological Review 57: 524–539.
––––. 2002. “Markets and Income Inequality in Rural China: Political Advantage inan Expanding Economy.” American Sociological Review 67: 231–253.
Walder, Andrew G., and Xiaobin He. 2014. “Public Housing into Private Assets:Wealth Creation in Urban China.” Social Science Research 46: 85–99.
Wang Haigang, and Kaiguo Zhou. 2006. “Is the Inequality of Income betweenUrban and Rural Residents Underestimated? An Examination Based on thePareto Distribution” (in Chinese). Statistical Research 4: 8–13.
Wolff, Edward. N. 2004. “Changes in Household Wealth in the 1980s and 1990s inthe US.” Working Paper No. 407, Levy Economics Institute of Bard College,Annandale-on-Hudson, NY. Available at www.levyinstitute.org/pubs/wp407.pdf, accessed October 17, 2014.
Wu, Xiaogang, and Yu Xie. 2003. “Does the Market Pay Off? Earnings Returns toEducation in Urban China.” American Sociological Review 68(3): 425–442.
Xie, Yu. 2011. “Evidence-Based Research on China: A Historical Imperative.”Chinese Sociological Review 44(1): 14–25.
––––. China Family Panel Studies User’s Manual (in Chinese). Institute of SocialScience Survey. Available at www.isss.edu.cn/cfps/wd/jsbg/2010jsbg/, accessedDecember 19, 2014.
Xie, Yu, and Jingwei Hu. 2014. “An Introduction to the China Family Panel Studies(CFPS).” Chinese Sociological Review 47(1): 3–29.
Xie, Yu, Jingwei Hu, and Chunni Zhang. 2014. “The China Family Panel Studies:Design and Practice” (in Chinese). Chinese Journal of Sociology 34(2): 1–32.
228 CHINESE SOCIOLOGICAL REVIEW
Dow
nloa
ded
by [
] at
12:
02 2
6 Ju
ly 2
015

Xie, Yu, and Yongai Jin. 2014. “Household Wealth.” Pp. 25–46 in WellbeingDevelopment Report of China 2014 (in Chinese), edited by Yu Xie, Xiaobo Zhang,Jianxin Li, Xuejun Yu, and Qiang Ren. Beijing, China: Peking University Press.
Xie, Yu, Qing Lai, and Xiaogang Wu. 2009. “Danwei and Social Inequality inContemporary Urban China.” Sociology of Work 19: 283–306.
Xie, Yu, and Ping Lu. forthcoming. “The Sampling Design of the China FamilyPanel Studies (CFPS).” Chinese Sociological Review.
Xie Yu, Xiaobo Zhang, Qi Xu, and Chunni Zhang. 2013. “Income Distirbution.”Pp. 27–53 in Wellbeing Development Report of China 2013 (in Chinese), editedby Yu Xie, Xiaobo Zhang, Jianxin Li, Xuejun Yu, and Qiang Ren. Beijing:Peking University Press.
Xie, Yu, and Xiang Zhou. 2014. “Income Inequality in Today’s China.” Proceedingsof the National Academy of Sciences 111(19): 6928–6933.
Zhao, Renwei, and Sai Ding. 2010. “The Distribution of Wealth in China.”Pp. 118–144 in Inequality and Public Policy in China, edited by Björn A.Gustafsson, Li Shi, and Terry Sicular. New York: Cambridge University Press.
Zhou, Xueguang. 2000. “Economic Transformation and Income Inequality inUrban China: Evidence from Panel Data.” American Journal of Sociology105(4): 1135–1174.
About the Authors
Yu Xie is Otis Dudley Duncan University distinguished professor of Sociology,Statistics, and Public Policy, and research professor at the Institute for SocialResearch (ISR), University of Michigan and visiting chair professor at PekingUniversity. His main areas of interest are social stratification, demography, stat-istical methods, Chinese studies, and sociology of science. His recently publishedworks include: Marriage and Cohabitation with Arland Thornton and WilliamAxinn (University of Chicago Press 2007), Statistical Methods for CategoricalData Analysis with Daniel Powers (Emerald 2008, second edition), and IsAmerican Science in Decline? with Alexandra Killewald (Harvard UniversityPress 2012).
Yongai Jin is a PhD candidate in Demography at Renmin University of Chinaand visiting student at Population Studies Center, University of Michigan. Herresearch interests focus on wealth inequality, fertility, and family demography.Her work (in Chinese) has been published in peer-reviewed journals, includingPopulation Research, Population & Economics, and Population Journal. Herdissertation is on wealth inequality and its determinants in China.
SPRING 2015 229
Dow
nloa
ded
by [
] at
12:
02 2
6 Ju
ly 2
015