Household and Ambient Air Pollution in India: Five New Paradigms · 2019-12-19 · Household and...
40
Household and Ambient Air Pollution in India: Five New Paradigms Kirk R. Smith, MPH, PhD Professor of Global Environmental Health University of California, Berkeley Health Effects Institute Annual Meeting Philadelphia, May 3, 2015
Transcript of Household and Ambient Air Pollution in India: Five New Paradigms · 2019-12-19 · Household and...

Household and Ambient Air Pollution in India:
Five New Paradigms
Kirk R. Smith, MPH, PhD Professor of Global Environmental Health
University of California, Berkeley
Health Effects Institute Annual Meeting Philadelphia, May 3, 2015
Declarations of Bias
• A focus on health, with other objectives secondary
• A focus on India, which does not represent all parts of the world

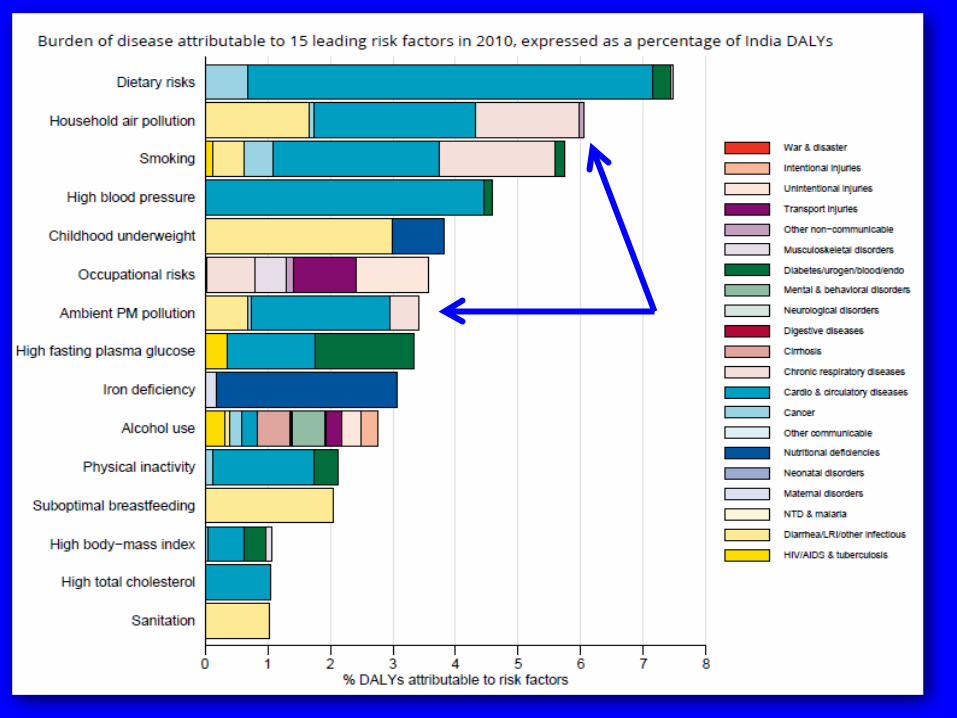
Household Air Pollution from Solid Cooking Fuels
• One of the top risk factors in the world for ill-health. • Biggest impact in adults –3.4 million premature
deaths (two-thirds the DALYs) • Still important for children ~500,000 deaths (one-
third the DALYs) • About one million premature deaths in India • Biggest single risk factor of any examined for
Indian women and girls • Important source of outdoor air pollution

What has been done-#1
• Wait for development to work. • Bottom line
– Percent using solid fuel declines with development
– But not number of people exposed

1990: 85%: 700 million people using solid fuels 2010: 60%: 700 million people ~1980 700 million people in entire country
700 million people in the Chulha* Trap
jboogaard
Typewritten Text
jboogaard
Typewritten Text
jboogaard
Typewritten Text
* Primary traditional cook stove in India

Increasing Prosperity and Development
Dec
reas
ing
Hou
seho
ld A
ir Po
llutio
n
Very Low Income
200 million
Low Income 400 million
Middle Income 400 million
High Income 200 million
Ag res- 15%
Coal – 1%
Kerosene -3%
PNG < 1%
Elec < 1%
Non-solid fuels
Solid Fuels
LPG – 30%
Biogas – 0.3%
Wood – 49%
--1.0
~~4
~~400
Household Energy Ladder in India
?

What has been done-#2 • Many hundreds of “improved” biomass stove
programs over ~60 years • Including major national programs in China and
India in the 1980s covering ~200 million households in all
• And in Peru, Mexico, Nepal and other countries today
• Hundreds of NGOs, big and small, promoting stoves around the world over the decades
• Hundreds of stove models


Bottom Line - #2 • The cleanest stove models have been
disseminated to only a few 100s of thousands of households
• And, as yet, no biomass stove in the world comes close to the boundary – is clean enough to be truly health protective in household use
• Based on our current understanding of the exposure-response relationships

Increasing Prosperity and Development
Dec
reas
ing
Hou
seho
ld A
ir Po
llutio
n
Very Low Income
200 million
Low Income 400 million
Middle Income 400 million
High Income 200 million
Crop Waste Dung
Coal
Kerosene
Natural Gas
Electricity
Non-solid fuels
Solid Fuels
Liquefied Petroleum Gas
Biogas
Wood
Indian Energy Ladder
?
Continuing to try to Make the Available Clean

Paradigm #1
Making the clean available
Five New Paradigms

Public health and environment 13 |

Secretary Vivek Rae • Doubled number of LPG distributors for the
next year ~10 million new people by adjusting requirements for distributors
• Ministry now developing plan to increase access in rural India to 90+% by 2027.
• Requires a major effort related to imports, finances, infrastructure, distribution modes.
• And, importantly, by gradual introduction of smarter subsidy schemes using modern technology, actually decrease LPG subsidies over time.

Increasing Prosperity and Development
Dec
reas
ing
Hou
seho
ld A
ir Po
llutio
n
Very Low Income
200 million
Low Income 400 million
Middle Income 400 million
High Income 200 million
Crop Waste Dung
Coal
Kerosene
Natural Gas
Electricity
Non-solid fuels
Solid Fuels
Liquefied Petroleum Gas
Biogas
Wood
Conceptual Indian Energy Ladder
? Try harder to Make the Clean Available

Paradigm #2
Stepping out of the box

If you don’t need your father’s land line, why your mother’s stove?
• Electrification, although having been slow and unreliable, is picking up in India – 4 states plus big cities now close to 24/7 – others on the way
• Electrification allows a wide range of highly efficient cooking devices – every time a switch is flicked, instead of a match, it is good for health


What is an induction cookstove? • Electric, yes, entirely different technology from
traditional electric stoves • High frequency magnetic field induces heat in pot
alone • More efficient ~90% instead of ~60% • Faster cooking ~1.5x • Safer and cooler– surface is warm but does not
burn or cause fires • Long-lived, easy to clean • Large economies of scale in manufacture like
other electrical devices

- - Bajaj Electrical Ltd. - Compton Greaves Ltd. - Eurolux
- Glen Appliances Pvt. Ltd. - Inalsa - Jaipan Industries Ltd. - Kenwood Ltd. - Khaitan Electrical Ltd - Morphy Richards - Panasonic Corp.
- Phillips - Preethi Kitchen Appliances, Ltd. -Sunflame -TTK Prestige Ltd. -Usha International Ltd.
-Westinghouse
Induction Cooktop Market in India 2012-2016 Published: March 2013 Infiniti Research Limited 35.4% per year growth predicted: 2012-2016
Factor of nearly five increase!

Flying off the shelves in China
Costs coming down dramatically
US $7.80 each (with warranty): The cost of two coffee lattes
Ecuador has $250 million loan from
Chinese Export Bank to change out every stove
in the country to induction

Increasing Prosperity and Development
Dec
reas
ing
Hou
seho
ld A
ir Po
llutio
n
Very Low Income
200 million
Low Income 400 million
Middle Income 400 million
High Income 200 million
Crop Waste Dung
Natural Gas
Electricity
Non-solid fuels
Solid Fuels
Liquefied Petroleum Gas
Biogas
Wood
Conceptual Indian Energy Ladder
?

Paradigm #3: It takes a village
Gujarat, Feb Evening
jboogaard
Typewritten Text

Changing out one chulha at a time is not as effective as
changing out whole villages • Learned in sanitation programs years ago • There are both household and community
benefits to clean fuels/stoves and latrines. • And with community interventions, a new
set of incentives and social pressures become possible.
• And more efficient provision of service

• Government of India has been promoting sanitation coverage to ensure better health and quality of life for people in rural India.
• In 2005, it launched an award-based Incentive Scheme for open-defecation-free villages, blocks, etc called “Nirmal Gram Puraskar”
• Need parallel or coordinated “Smokeless Village Schemes”
Nirmal Gram Puraskar
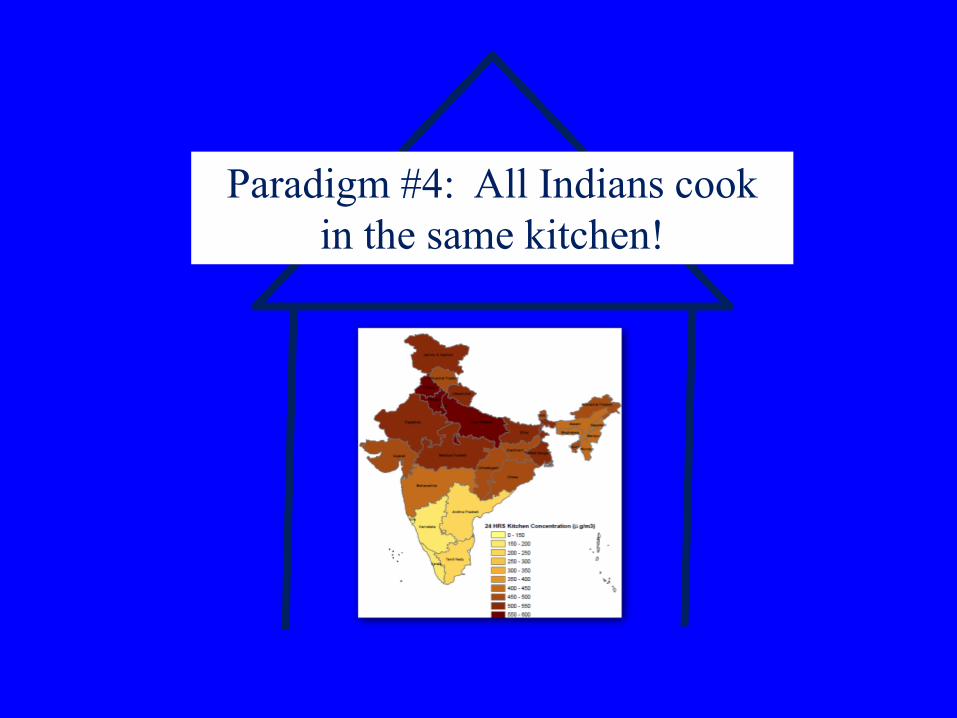
Paradigm #4: All Indians cook in the same kitchen!

How is that?
• All breathe the pollution coming from kitchens
• Clean fuel availability for cooking linked nationally
• Health impacts directly affect all – families, migration, worker productivity, etc.

%PM2.5 from “Residential” Emissions : NASA
29 Source: Asian Emission Inventory for NASA INTEX_B 2006 (accessed 2010) Chafe, 2010
~25% of primary particle
pollution in India is from
household fuels

HAP as a source not a location
avanerp
Typewritten Text
HAP = household air pollution
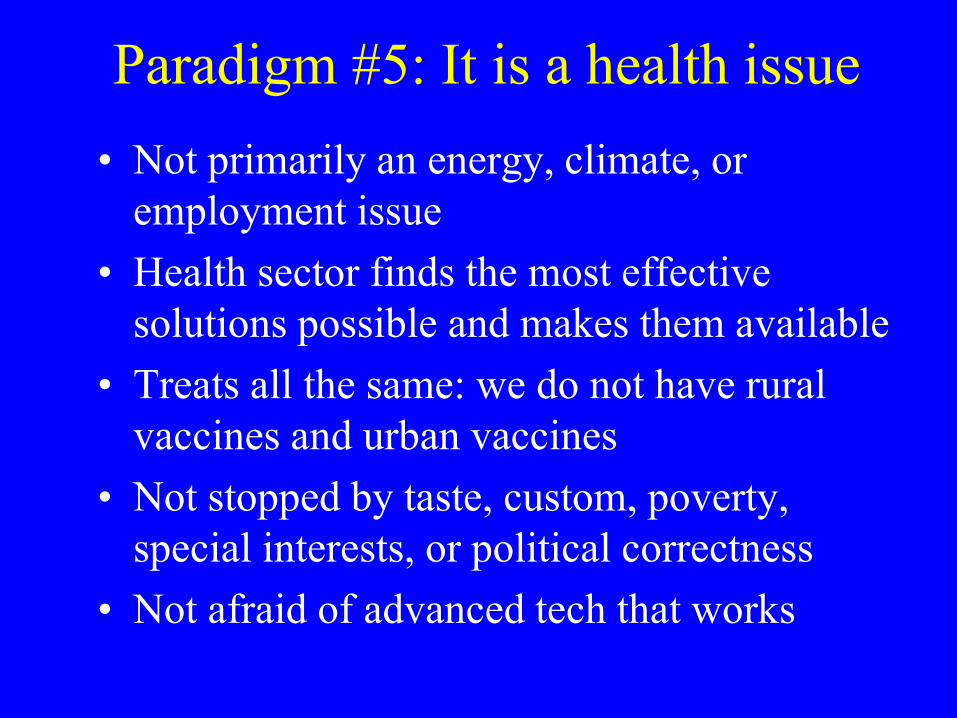
Paradigm #5: It is a health issue • Not primarily an energy, climate, or
employment issue • Health sector finds the most effective
solutions possible and makes them available • Treats all the same: we do not have rural
vaccines and urban vaccines • Not stopped by taste, custom, poverty,
special interests, or political correctness • Not afraid of advanced tech that works

Ministry of Health and Family Welfare Air Pollution Task Force (MoHFW)
• First Ministry of Health in world to treat AP as one of its major priorities and consider along with other risk factors in its mission
• First government agency in the world not to address AP by location, but by total exposure – a true health focus
• Thus, not indoor/household, not outdoor, but by what will give the most health benefit
jboogaard
Typewritten Text
jboogaard
Typewritten Text

MoHFW AP Task Force • Total exposure approach requires utilizing
estimates of intake fraction by source category.
• Broken into “near field” and “ambient” intake fractions
• Emissions weighted essentially by proximity to population
• Goal is to change source apportionment to exposure apportionment

Chennai-2012
Emissions – PM2.5
Draft MoHFW Report estimates by Guttikunda

Ambient Intake Fractions in Chennai
ppm – grams inhaled per tonne emitted Average SD
Waste.burn 109.9 14.6 Veh.exhaust 89.4 11.6
Gen.sets 89.1 14.6 Construction 85.9 10.4 Households 76.3 12.0
Dust 63.2 9.6 Industries 36.9 11.0 Brick.kilns 11.6 17.8
Power plants 8.1 8.4

Chennai-2012
Emissions – PM2.5
Draft MoHFW Report estimates by Guttikunda
Exposures – PM2.5

MoHFW AP Task Force, cont. • Nearfield intake fractions not as well
developed but important for local sources – Vehicles – Neighborhood waste burning – Gen sets – Households
• Preliminary estimates of household nearfield intake fractions are about 10x those from ambient (downwind exposures) in Chennai (750 vrs 76 ppm)
Paradigm Shifts
• Make the clean available, as well as make the available clean
• Embrace/enhance transformational leap-frog technologies
• Look for community solutions • Move subsidies for clean fuels from richer
to poorer households • Act recognizing that it is primarily a health
issue and thus treat on an exposure basis

Increasing Prosperity and Development
Dec
reas
ing
Hou
seho
ld A
ir Po
llutio
n
Very Low Income
200 million
Low Income 400 million
Middle Income 400 million
High Income 200 million
Crop Waste Dung
Coal
Kerosene
Natural Gas
Electricity
Non-solid fuels
Solid Fuels
Liquefied Petroleum Gas
Biogas
Wood
Conceptual Indian Energy Ladder
How do we help people move into
this realm?
Smith/Pillarisetti, 2014

Many thanks Publications and presentations on website – easiest to just “google” Kirk R. Smith