House prices in Tower Hamlets 5 Chart 3: House prices in Tower Hamlets by property type Jan 2000 to...
12
Private rental market and House price trends in Tower Hamlets CRU Factsheet 2013-02 June 2013
-
Upload
truongdien -
Category
Documents
-
view
216 -
download
0
Transcript of House prices in Tower Hamlets 5 Chart 3: House prices in Tower Hamlets by property type Jan 2000 to...

Private rental market and House price trends in Tower Hamlets
CRU Factsheet 2013-02 June 2013

Page 2
Summary of key findings
The Corporate Research Team is publishing a quarterly update covering changes in the Tower Hamlets housing market bringing together Land registry data1 and VOA private sector rent data.2
House prices
The average house price in Tower Hamlets in April 2013 was £370,500 which is slightly
below the London average of £375,800. Flats and Maisonettes cost on average £365,000 andTerraced houses cost on average £397,200 in the borough.
House prices grew over the last 12 month in Tower Hamlets by 4.2% which was less than
the overall London growth of 6.2% mainly driven by some central London areas.
Between Jan 2013 and April 2013, the most expensive property sold for £1,200,000 inMarsh Wall / Land Mark East Tower in Millwall. The cheapest property was a flat sold in Gower’sWalk / Whitechapel for £81,000 on a shared ownership basis.
In Feb 2013, 236 properties were sold in the Borough. On average over the last 12 months
around 300 properties are sold every month in the borough.
Private rents
For all property types, the median rental market price for private properties in TowerHamlets was higher than the London median price. Prices in Tower Hamlets are especially
higher for Studios (49%) and 1 and 3 bed room properties (27% and 30% respectively).
Over the last 12 months, median monthly rental prices have increased on average in all property
size categories in the Borough. The average private rent increased by 16.7% compared
to a London average increase of 8.9%
Private rental prices in Tower Hamlets are moving into price ranges common to areas likeIslington adopting the market characteristics of high demand / high priced central Londonboroughs.
1 Land registry data in this document is price paid data and can be found here: http://www.landregistry.gov.uk/ 2 Valuation Office Agency - private sector rent data http://www.voa.gov.uk/Corporate/statisticalReleases/120126_PrivateRentalMarket.html

Page 3
1 Tower Hamlets House prices
Average house prices and sales volume The average house price paid was £370,500 in April 2013 which was below the London average of £375,800. House prices in Tower Hamlets have been increasing steadily. The current trend indicates that the 2008 house price peak of around £380,000 could be reached this year.
Sale volumes in the borough, including seasonal peaks, stayed between 205 and 384 sales a month over the last year. In Tower Hamlets far higher sale volumes were recorded compared to former Olympic host boroughs like Hackney (210), Barking & Dagenham (110), Newham (136) or Waltham Forest (195).
While in February 2013 around 236 properties were sold, a total of 3,606 properties were sold between March 2012 and Feb 2013 in Tower Hamlets. See Chart 1 below.
Chart 1: Average house prices and sales volume in Tower Hamlets January 1995 to April 2013
0
100
200
300
400
500
600
700
£0
£50,000
£100,000
£150,000
£200,000
£250,000
£300,000
£350,000
£400,000
Sa
les
vo
lum
e
Av
era
ge
ho
use
pri
ce
in
£
Price (£) Volume
(Source: Land Registry Feb / April 2013)
House prices in Tower Hamlets and London The average house prices in Tower Hamlets and London show similar trends. However, during the Credit Crunch and the 2008/09 economic recession Tower Hamlets house prices increased for longer and declined later than the London average.
Over the last three years, house prices in London and Tower Hamlets have recovered and show a growth rate similar to the pre house price crash. See Chart 2 below.
Page 4
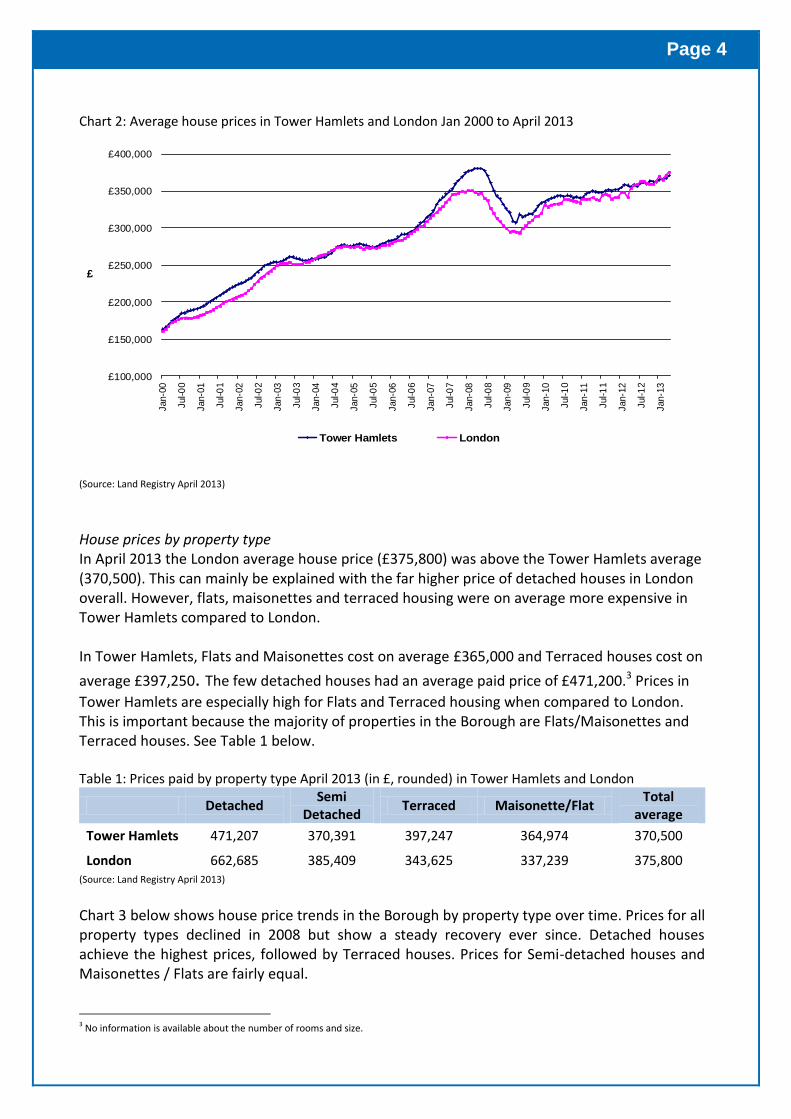
Chart 2: Average house prices in Tower Hamlets and London Jan 2000 to April 2013
£100,000
£150,000
£200,000
£250,000
£300,000
£350,000
£400,000Jan-0
0
Jul-0
0
Jan-0
1
Jul-0
1
Jan-0
2
Jul-0
2
Jan-0
3
Jul-0
3
Jan-0
4
Jul-0
4
Jan-0
5
Jul-0
5
Jan-0
6
Jul-0
6
Jan-0
7
Jul-0
7
Jan-0
8
Jul-0
8
Jan-0
9
Jul-0
9
Jan-1
0
Jul-1
0
Jan-1
1
Jul-1
1
Jan-1
2
Jul-1
2
Jan-1
3
£
Tower Hamlets London
(Source: Land Registry April 2013)
House prices by property type In April 2013 the London average house price (£375,800) was above the Tower Hamlets average (370,500). This can mainly be explained with the far higher price of detached houses in London overall. However, flats, maisonettes and terraced housing were on average more expensive in Tower Hamlets compared to London. In Tower Hamlets, Flats and Maisonettes cost on average £365,000 and Terraced houses cost on
average £397,250. The few detached houses had an average paid price of £471,200.3 Prices in
Tower Hamlets are especially high for Flats and Terraced housing when compared to London. This is important because the majority of properties in the Borough are Flats/Maisonettes and Terraced houses. See Table 1 below. Table 1: Prices paid by property type April 2013 (in £, rounded) in Tower Hamlets and London
Detached Semi
Detached Terraced Maisonette/Flat
Total average
Tower Hamlets 471,207 370,391 397,247 364,974 370,500
London 662,685 385,409 343,625 337,239 375,800 (Source: Land Registry April 2013)
Chart 3 below shows house price trends in the Borough by property type over time. Prices for all property types declined in 2008 but show a steady recovery ever since. Detached houses achieve the highest prices, followed by Terraced houses. Prices for Semi-detached houses and Maisonettes / Flats are fairly equal. 3 No information is available about the number of rooms and size.

Page 5
Chart 3: House prices in Tower Hamlets by property type Jan 2000 to April 2013
0
100,000
200,000
300,000
400,000
500,000
600,000
£
Detached (£) Semi-Detached (£) Terraced (£) Maisonette/Flat (£)
(Source: Land Registry April 2013)
Tower Hamlets Annual house price change Chart 4 below shows the annual house price changes between January 2000 and April 2013 while Table 2 shows the change over the last 12 months. Chart 4 shows the house price fall in 2009 and the recovery in 2010. The data indicates also a more modest but still steady growth in the borough over the last 2 years. Chart 4: Annual House price change between Jan 2000 to April 2013 (%)
-25
-20
-15
-10
-5
0
5
10
15
20
25
30
Jan
-20
00
Ma
y-2
000
Sep
-200
0
Jan
-20
01
Ma
y-2
001
Sep
-200
1
Jan
-20
02
Ma
y-2
002
Sep
-200
2
Jan
-20
03
Ma
y-2
003
Sep
-200
3
Jan
-20
04
Ma
y-2
004
Sep
-200
4
Jan
-20
05
Ma
y-2
005
Sep
-200
5
Jan
-20
06
Ma
y-2
006
Sep
-200
6
Jan
-20
07
Ma
y-2
007
Sep
-200
7
Jan
-20
08
Ma
y-2
008
Sep
-200
8
Jan
-20
09
Ma
y-2
009
Sep
-200
9
Jan
-20
10
Ma
y-2
010
Sep
-201
0
Jan
-20
11
Ma
y-2
011
Sep
-201
1
Jan
-20
12
Ma
y-2
012
Sep
-201
2
Jan
-20
13
Annual change in %
%
(Source: Land Registry April 2013)
Annual house price changes over the last 12 months in Tower Hamlets have been overall close to the CPI / RPI inflation rates of 2.4% & 2.9 % (ONS April 2013) respectively.

Page 6
Table 2: Annual House price change in Tower Hamlets Jan 2012 to April 2013 (%) May
2012 June 2012
July 2012
Aug 2012
Sept 2012
Oct 2012
Nov 2012
Dec 2012
Jan 2013
Feb 2013
Mar 2013
April 2013
Growth in %
2.7 2.5 3.7 3.4 2.3 3.8 2.8 3 3 2 2.8 4.2
(Source: Land Registry April 2013)
House price peaks in Tower Hamlets Between Jan 2013 and April 2013, the most expensive property sold for £1,200,000 in Marsh Wall / Land Mark East Tower in Millwall. The cheapest property, a flat in Gower’s Walk / Whitechapel sold for £81,000 on a shared ownership basis.4 House price change in the Olympic host boroughs Before the house price crash in 2008, prices in Hackney and Tower Hamlets were the highest out of the Olympic host boroughs. This remains the case in 2013. Prices paid in Hackney have increased more rapidly than in any other Olympic host borough. While Tower Hamlets prices are developing around the London average, house prices in Hackney have reached the pre-recession level and outperformed it. Over the last year, house prices in Hackney have increased by roughly 10%. House prices were lowest in Barking & Dagenham and Newham before the 2008/09 recession. This situation can also be observed in April 2013 as Newham prices stayed just above the Barking & Dagenham average. While prices in Greenwich, Waltham Forest, Newham and Barking & Dagenham had shown a post-Olympics dip in late 2012; prices have not fallen further and have increased again. See Chart 5 below. Chart 5: House prices in Olympic host Boroughs Jan 2007 to April 2013
£100,000
£150,000
£200,000
£250,000
£300,000
£350,000
£400,000
£450,000
£500,000
Jan-2007
Apr-2007
Jul-2007
Oct-2007
Jan-2008
Apr-2008
Jul-2008
Oct-2008
Jan-2009
Apr-2009
Jul-2009
Oct-2009
Jan-2010
Apr-2010
Jul-2010
Oct-2010
Jan-2011
Apr-2011
Jul-2011
Oct-2011
Jan-2012
Apr-2012
Jul-2012
Oct-2012
Jan-2013
Apr-2013
£
Tower Hamlets London Barking and Dagenham Greenwich Hackney Newham Waltham Forest
(Source: Land Registry April 2013)
4 This data covers the transactions received at Land Registry in the period [1st Jan 2013] to [April 2013]. © Crown copyright 2013.Land Registry Price paid dataset April 2013 “ If you have found an error with the data please contact Her Majesty's Land Registry (HMLR)" http://www.landregistry.gov.uk/professional/price-paid-error
Page 7
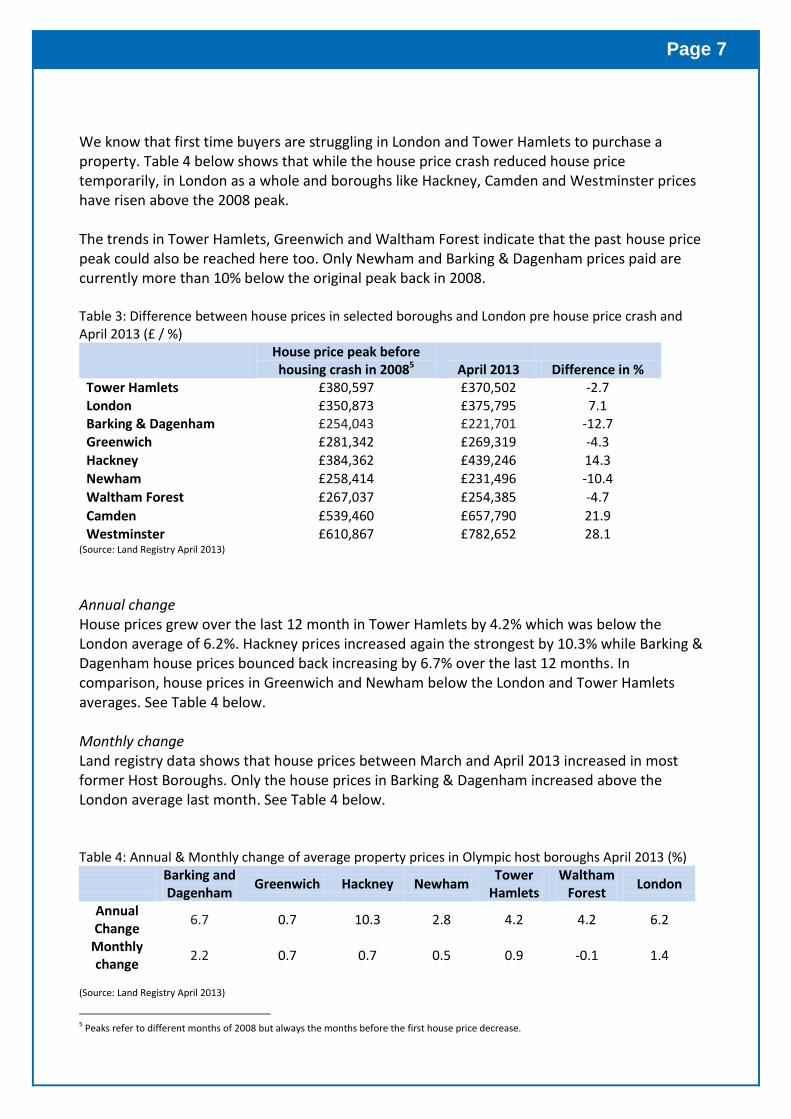
We know that first time buyers are struggling in London and Tower Hamlets to purchase a property. Table 4 below shows that while the house price crash reduced house price temporarily, in London as a whole and boroughs like Hackney, Camden and Westminster prices have risen above the 2008 peak. The trends in Tower Hamlets, Greenwich and Waltham Forest indicate that the past house price peak could also be reached here too. Only Newham and Barking & Dagenham prices paid are currently more than 10% below the original peak back in 2008. Table 3: Difference between house prices in selected boroughs and London pre house price crash and April 2013 (£ / %)
House price peak before housing crash in 20085 April 2013 Difference in %
Tower Hamlets £380,597 £370,502 -2.7 London £350,873 £375,795 7.1 Barking & Dagenham £254,043 £221,701 -12.7 Greenwich £281,342 £269,319 -4.3
Hackney £384,362 £439,246 14.3 Newham £258,414 £231,496 -10.4
Waltham Forest £267,037 £254,385 -4.7
Camden £539,460 £657,790 21.9 Westminster £610,867 £782,652 28.1
(Source: Land Registry April 2013) Annual change House prices grew over the last 12 month in Tower Hamlets by 4.2% which was below the London average of 6.2%. Hackney prices increased again the strongest by 10.3% while Barking & Dagenham house prices bounced back increasing by 6.7% over the last 12 months. In comparison, house prices in Greenwich and Newham below the London and Tower Hamlets averages. See Table 4 below. Monthly change Land registry data shows that house prices between March and April 2013 increased in most former Host Boroughs. Only the house prices in Barking & Dagenham increased above the London average last month. See Table 4 below. Table 4: Annual & Monthly change of average property prices in Olympic host boroughs April 2013 (%)
Barking and Dagenham
Greenwich Hackney Newham Tower
Hamlets Waltham
Forest London
Annual Change
6.7 0.7 10.3 2.8 4.2 4.2 6.2
Monthly change
2.2 0.7 0.7 0.5 0.9 -0.1 1.4
(Source: Land Registry April 2013)
5 Peaks refer to different months of 2008 but always the months before the first house price decrease.
Page 8
2 Tower Hamlets Private Sector Rents 6
The Valuation Office Agency provides statistics on the private rental market for Local Authorities in England. The data shows a median price over the last 12 month to the end of the date stated. The available data currently covers the period between June 2011 and March 2013 and is based on a quarterly sample of a few hundred properties in each property size group. While the sampling could cause some unusual peaks and even errors, this data is the best available to us.
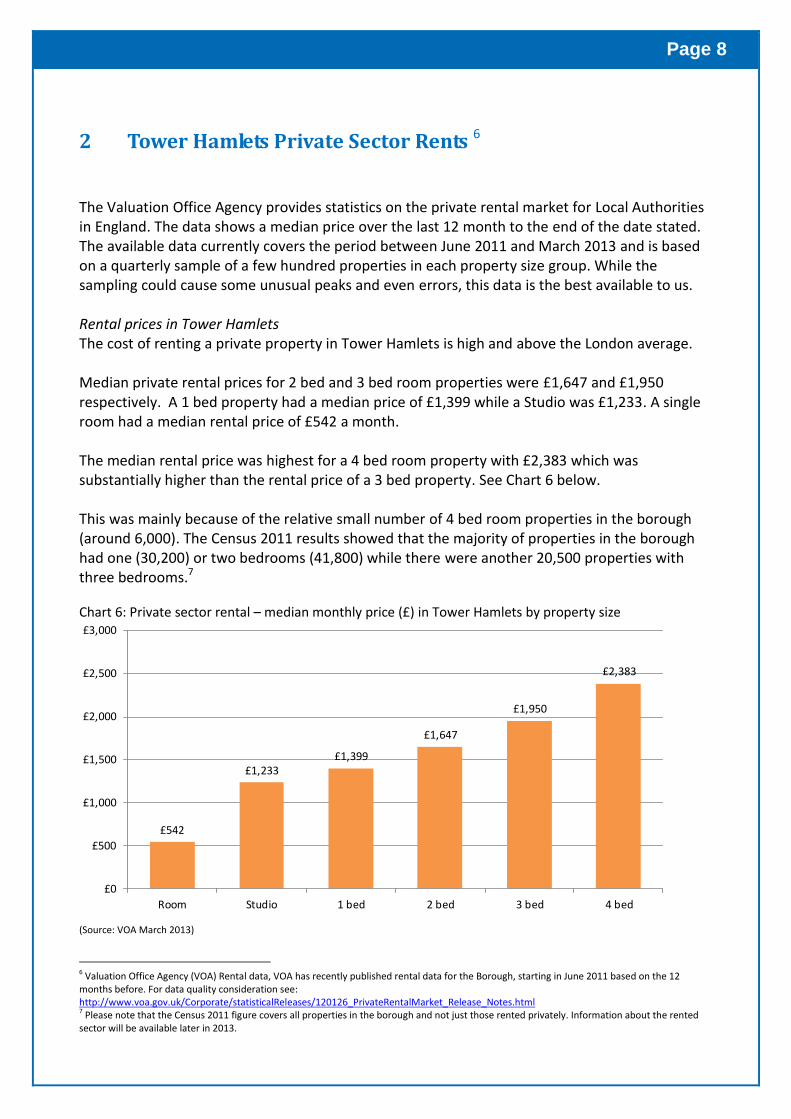
Rental prices in Tower Hamlets The cost of renting a private property in Tower Hamlets is high and above the London average.
Median private rental prices for 2 bed and 3 bed room properties were £1,647 and £1,950 respectively. A 1 bed property had a median price of £1,399 while a Studio was £1,233. A single room had a median rental price of £542 a month.
The median rental price was highest for a 4 bed room property with £2,383 which was substantially higher than the rental price of a 3 bed property. See Chart 6 below.
This was mainly because of the relative small number of 4 bed room properties in the borough (around 6,000). The Census 2011 results showed that the majority of properties in the borough had one (30,200) or two bedrooms (41,800) while there were another 20,500 properties with three bedrooms.7
Chart 6: Private sector rental – median monthly price (£) in Tower Hamlets by property size
£542
£1,233£1,399
£1,647
£1,950
£2,383
£0
£500
£1,000
£1,500
£2,000
£2,500
£3,000
Room Studio 1 bed 2 bed 3 bed 4 bed
(Source: VOA March 2013)
6 Valuation Office Agency (VOA) Rental data, VOA has recently published rental data for the Borough, starting in June 2011 based on the 12 months before. For data quality consideration see: http://www.voa.gov.uk/Corporate/statisticalReleases/120126_PrivateRentalMarket_Release_Notes.html 7 Please note that the Census 2011 figure covers all properties in the borough and not just those rented privately. Information about the rented sector will be available later in 2013.
Page 9
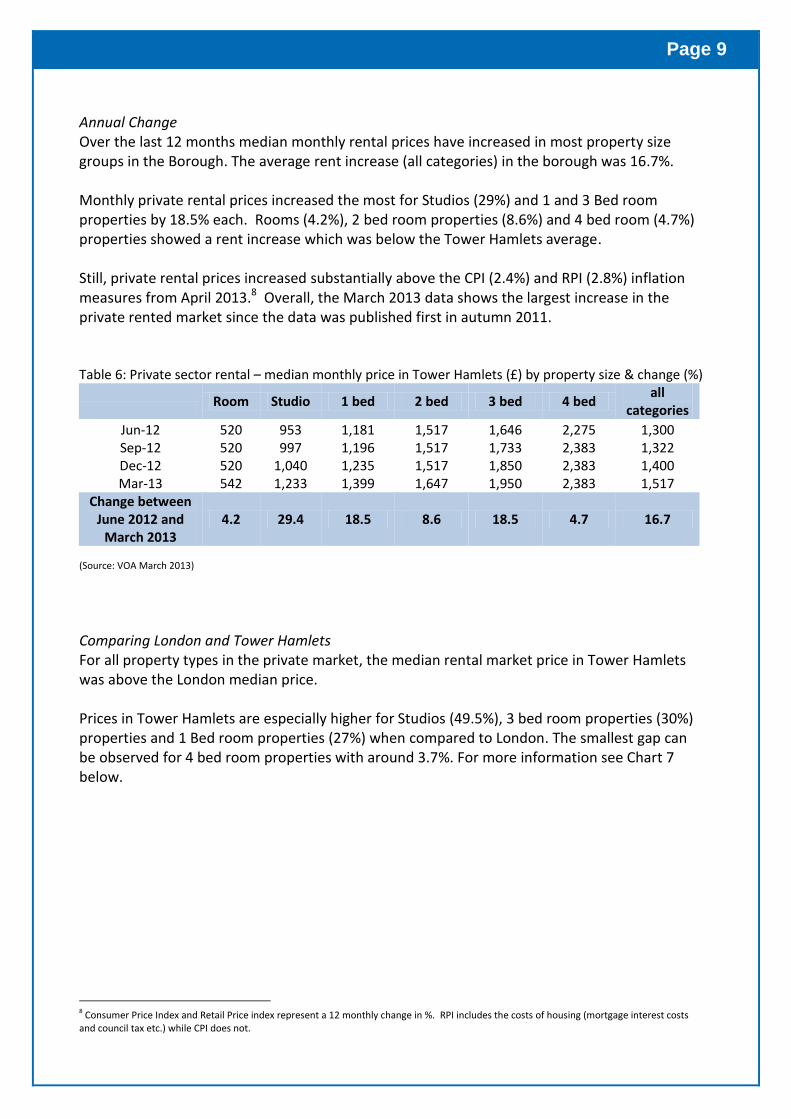
Annual Change Over the last 12 months median monthly rental prices have increased in most property size groups in the Borough. The average rent increase (all categories) in the borough was 16.7%. Monthly private rental prices increased the most for Studios (29%) and 1 and 3 Bed room properties by 18.5% each. Rooms (4.2%), 2 bed room properties (8.6%) and 4 bed room (4.7%) properties showed a rent increase which was below the Tower Hamlets average. Still, private rental prices increased substantially above the CPI (2.4%) and RPI (2.8%) inflation measures from April 2013.8 Overall, the March 2013 data shows the largest increase in the private rented market since the data was published first in autumn 2011. Table 6: Private sector rental – median monthly price in Tower Hamlets (£) by property size & change (%)
Room Studio 1 bed 2 bed 3 bed 4 bed
all categories
Jun-12 520 953 1,181 1,517 1,646 2,275 1,300 Sep-12 520 997 1,196 1,517 1,733 2,383 1,322 Dec-12 520 1,040 1,235 1,517 1,850 2,383 1,400 Mar-13 542 1,233 1,399 1,647 1,950 2,383 1,517
Change between June 2012 and
March 2013 4.2 29.4 18.5 8.6 18.5 4.7 16.7
(Source: VOA March 2013)
Comparing London and Tower Hamlets For all property types in the private market, the median rental market price in Tower Hamlets was above the London median price. Prices in Tower Hamlets are especially higher for Studios (49.5%), 3 bed room properties (30%) properties and 1 Bed room properties (27%) when compared to London. The smallest gap can be observed for 4 bed room properties with around 3.7%. For more information see Chart 7 below.
8 Consumer Price Index and Retail Price index represent a 12 monthly change in %. RPI includes the costs of housing (mortgage interest costs and council tax etc.) while CPI does not.

Page 10
Chart 7: Private sector rental prices for properties in London and Tower Hamlets March 2013 in £
542445
1,233
825
1,399
1,100
1,647
1,343
1,950
1,500
2,3832,297
1,517
1,250
0
500
1,000
1,500
2,000
2,500
3,000
To
we
r H
amle
ts
Lon
do
n
To
we
r H
amle
ts
Lon
do
n
To
we
r H
amle
ts
Lon
do
n
To
we
r H
amle
ts
Lon
do
n
To
we
r H
amle
ts
Lon
do
n
To
we
r H
amle
ts
Lon
do
n
To
we
r H
amle
ts
Lon
do
n
Room Studio 1 bed 2 bed 3 bed 4 bed all categories
£
(Source: VOA March 2013)
Annual change in Tower Hamlets and London by property type While private rents in Tower Hamlets have increased substantially above the London average, they increased most rapidly for Studios, 1 and 2 bed room properties. In comparison the rents for Rooms, 2 bed and 4 bed properties increased below the London average. See Table 7 below.
Table 7: Change between June 2012 and March 2013 in %
Room Studio 1 bed 2 bed 3 bed 4 bed all
categories
Tower Hamlets 4.2 29.4 18.5 8.6 18.5 4.7 16.7
London 2.8 8.8 10.6 9.2 5.6 6.0 8.9
(Source: VOA March 2013)
Selected London Boroughs rental property prices Private property rental prices can show substantial differences in London and the former Olympic host boroughs. The cost for renting privately in Hackney and Tower Hamlets is above the London average and at times even above the Inner London average.
In comparison, prices in Newham, Barking & Dagenham and Greenwich are below the London average and for some sizes even below the Outer London averages. See table 8.
Table 8: Private sector rental median monthly price Selected London Boroughs & London March 2013 (£)
Room Studio 1 bedroom 2 bedroom 3 bedroom 4 bedroom
LONDON 445 825 1,100 1,343 1,500 2,297
Inner London 520 997 1,300 1,603 2,058 2,773
Outer London 412 690 850 1,100 1,300 1,875
Hackney 520 867 1,213 1,517 1,950 2,470

Page 11
Newham 429 700 900 1,100 1,300 1,600
Tower Hamlets 542 1,233 1,399 1,647 1,950 2,383
Barking and Dagenham 390 650 700 888 1,050 1,425
Greenwich 450 861 835 1,100 1,300 1,600
Waltham Forest 458 696 802 1,000 1,300 1,600
Camden 672 997 1,430 1,907 2,600 3,456
Islington 563 1,040 1,408 1,733 2,167 2,643
Westminster 693 1,300 1,712 2,383 3,250 6,064
(Source: VOA March 2013)
In the last house price factsheet (Feb 2013) we discussed that prices in Tower Hamlets are moving into price ranges common in areas like Islington adopting the market characteristics of high demand / high price central London boroughs. The latest data indicates that by March 2013 this has happened. Prices in the private rent market are now comparable to Islington especially for Rooms, Studios and 1 bed room flats.
The VOA data is based on a sample; this means that while the data indicates a increase of private rents, it is most likely to be influenced by new or refurbished properties entering the market. Those properties have in general higher rents. For example the Right move website is advertising around two hundred 1-bedroom properties for more than £500 a week at the moment.9 We currently do not know if the private rent of households on long running contracts is going up with the same extend.
9 www.rightmove.co.uk website accessed 20th June 2013.

Page 12
Further information
This Factsheet was produced by the Council’s Corporate Research Unit (CRU), which is based in the Chief Executive’s Directorate. Factsheets provide timely analysis of data about Tower Hamlets and are designed to improve the use and sharing of data and evidence. Briefings can be downloaded from the Tower Hamlets Borough profile web pages.
Readers can contact the research team via email: [email protected]
Disclaimer for Public information:The London Borough of Tower Hamlets is committed to the highest standard and quality of information and every reasonable attempt has been made to present accurate information. However, the information in this publication has been provided for information purposes only and the London Borough of Tower Hamlets gives no warranty, express or implied, as to the accuracy, timeliness or decency of the information and accepts no liability for any loss, damage or inconvenience howsoever arising, caused by, or as a result of, reliance upon such information.
Crown Copyright material is reproduced with the permission of the Controller of HMSO.