Hourly In Situ Quantitation of Organic Aerosol Marker ...
108
Hourly In Situ Quantitation of Organic Aerosol Marker Compounds during CalNex 2010 Final Report Contract No. 09-316 Prepared for the California Air Resources Board Principal Investigator Professor Allen H. Goldstein Department of Environmental Science, Policy and Management University of California Berkeley 137 Mulford Hall University of California Berkeley, CA 94720-3114 (510) 643-3788 [email protected] Subcontractor Dr. Susanne V. Hering Aerosol Dynamics Inc. 935 Grayson Street, Berkeley, CA 94710 ph: (510) 649-9360 fax: (510) 649-9361 [email protected] Contributing Researchers Yunliang Zhao, PhD Candidate, UC Berkeley Dr. Nathan Kreisberg, Senior Research Scientist, Aerosol Dynamics Robin Weber, Staff Research Associate, UC Berkeley Rachel O’Brien, PhD Candidate, UC Berkeley July 8, 2013
Transcript of Hourly In Situ Quantitation of Organic Aerosol Marker ...

Hourly In Situ Quantitation of Organic Aerosol Marker
Compounds during CalNex 2010
Final Report
Contract No. 09-316
Prepared for the California Air Resources Board
Principal Investigator
Professor Allen H. Goldstein
Department of Environmental Science, Policy and Management
University of California Berkeley
137 Mulford Hall
University of California
Berkeley, CA 94720-3114
(510) 643-3788
Subcontractor
Dr. Susanne V. Hering
Aerosol Dynamics Inc.
935 Grayson Street, Berkeley, CA 94710
ph: (510) 649-9360
fax: (510) 649-9361
Contributing Researchers
Yunliang Zhao, PhD Candidate, UC Berkeley
Dr. Nathan Kreisberg, Senior Research Scientist, Aerosol Dynamics
Robin Weber, Staff Research Associate, UC Berkeley
Rachel O’Brien, PhD Candidate, UC Berkeley
July 8, 2013

i
DISCLAIMER
The statements and conclusions in this Report are those of the contractor and not
necessarily those of the California Air Resources Board. The mention of commercial products,
their source, or their use in connection with material reported herein is not to be construed as
actual or implied endorsement of such products.

ii
ACKNOWLEDGEMENTS
We acknowledge John Karlik, Rick Ramirez, and the entire UC Extension Kern County
staff, without whom we could not have successfully completed the California Research at the
Nexus of Air Quality and Climate Change Project (CalNex) in the San Joaquin Valley. We also
thank our collaborators Lynn Russell, Shang Liu, Jennifer Murphy, Jose-Luis Jimenez, Patrick
Hayes, Alexander Laskin, and Julia Laskin.
iii
Glossary of Symbols and Acronyms
AIM/IC Ambient Ion Monitor/Ion Chromatograph
ARB California Air Resources Board
CalNex California research study at the nexus of air quality and climate change
CEC California Energy Commission
CMB chemical mass balance
COA average OA concentration
Cpart particle phase concentration
CTD Collection and Thermal Desorption cell
Ctotal total concentration
DOE Department of Energy
EC elemental carbon
EPI Estimated Programs Interface
FID flame ionization detector
fpart fraction in the particle phase
GC/MS gas chromatography/mass spectrometry
HR-ToF-AMS High-Resolution Time-of –Flight Aerosol Mass Spectrometry
IVOC intermediate-volatility organic compound
kom gas/particle partitioning coefficient
MW molecular weight
NOAA National Oceanic and Atmospheric Administration
O3 ozone
OA organic aerosol
OC organic carbon
O/C oxygen to carbon ratio
OH hydroxide radical
PAH polycyclic aromatic hydrocarbon
PM particulate matter
PM1 particulate matter with aerodynamic diameter ≤ 1 µm
PM2.5 particulate matter with aerodynamic diameter ≤ 2.5 µm

iv
PMF positive matrix factorization
POA primary organic aerosol
Q-AMS Quadrupole-Aerosol Mass Spectrometer
RH relative humidity
SOA secondary organic aerosol
SOA1 PMF Factor #3 (SOA from condensable oxygenated compounds)
SOA2 PMF Factor #4 (locally formed SOA)
PSOA3 PMF Factor #5 (regionally formed SOA)
SOA4 PMF Factor #6 (nighttime SOA)
SoCAB South Coast Air Basin
SJVAB San Joaquin Valley Air Basin
SVOC semi-volatile organic compound
TAG Thermal desorption Aerosol Gas-chromatography mass spectrometry
TMB Trimethylbenzene
USEPA United States Environmental Protection Agency
VOC volatile organic compound

v
Proposed Tasks and Work Described in this Report
The tasks identified in the original proposal are outlined below:
Task 1. Field Measurements during CalNex 2010
The sampling inlet for TAG was rebuilt to include both a denuder and a bypass line, allowing
measurements of organics in both gas and particle phases by the denuder difference method.
TAG was deployed at the Bakersfield ground site during the CalNex field campaign and made
four continuous weeks of measurements (May 31 – June 27, 2010).
Task 2. Data Reduction – Organic Marker Compound Time Lines
More than 100 compounds were identified and quantified in ambient samples collected during
the campaign. Both primary and secondary organic marker compounds were identified. Final
data were archived in the CalNex database.
Task 3. Data Analysis – Source Attribution through Factor Analysis/Positive Matrix
Factorization
The SOA formation mechanisms were investigated by comparing measured fractions of
known SOA tracers in particles with predicted. The contributions of various sources to OA were
investigated by performing PMF analysis on particle-phase organic tracer compounds. Six types
of OA sources were identified, including local POA, a mixture POA and SOA, and four distinct
types of SOA. The contributions to OA from these sources and SOA formation pathways related
to each SOA factor are discussed in detail in Chapter 4.
Task 4. Final Reports
This report is submitted in fulfillment of Task 4.
In addition, the investigators have participated in conferences, workshops, and seminars as
well as written papers to publicize the research results.
vi
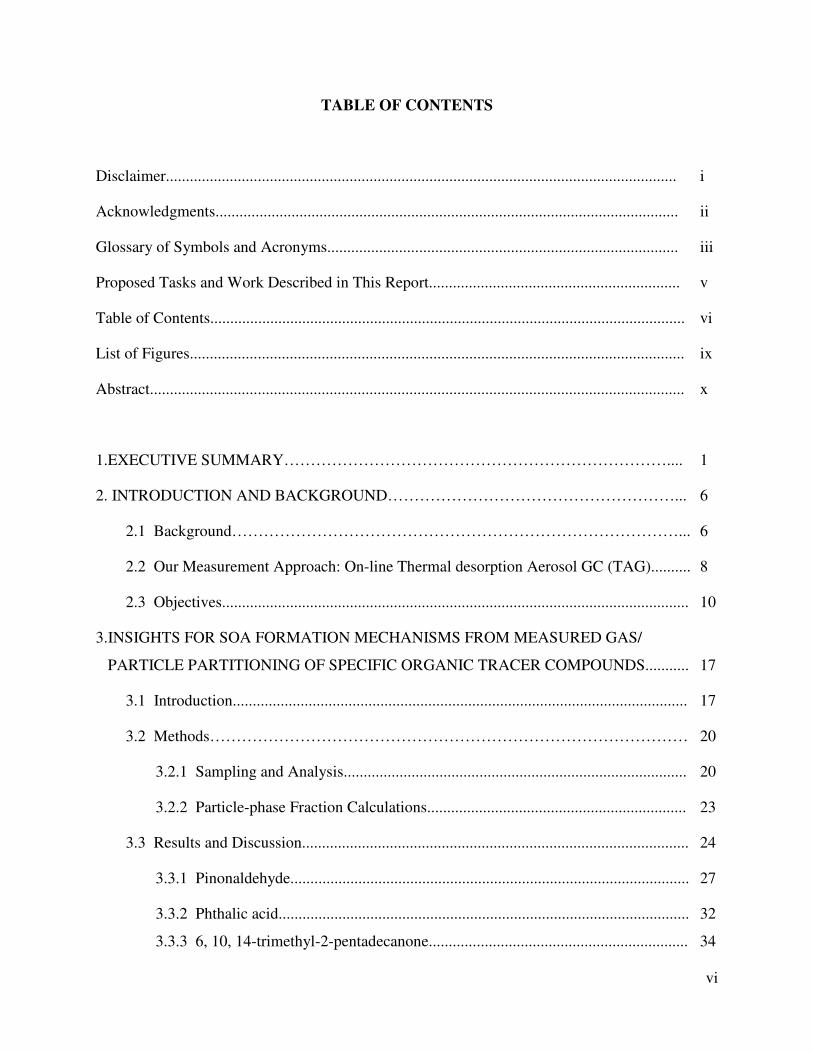
TABLE OF CONTENTS
Disclaimer................................................................................................................................ i
Acknowledgments.................................................................................................................... ii
Glossary of Symbols and Acronyms........................................................................................ iii
Proposed Tasks and Work Described in This Report............................................................... v
Table of Contents....................................................................................................................... vi
List of Figures............................................................................................................................ ix
Abstract...................................................................................................................................... x
1.EXECUTIVE SUMMARY……………………………………………………………….... 1
2. INTRODUCTION AND BACKGROUND………………………………………………... 6
2.1 Background…………………………………………………………………………... 6
2.2 Our Measurement Approach: On-line Thermal desorption Aerosol GC (TAG).......... 8
2.3 Objectives..................................................................................................................... 10
3.INSIGHTS FOR SOA FORMATION MECHANISMS FROM MEASURED GAS/
PARTICLE PARTITIONING OF SPECIFIC ORGANIC TRACER COMPOUNDS........... 17
3.1 Introduction.................................................................................................................. 17
3.2 Methods……………………………………………………………………………… 20
3.2.1 Sampling and Analysis...................................................................................... 20
3.2.2 Particle-phase Fraction Calculations................................................................. 23
3.3 Results and Discussion................................................................................................. 24
3.3.1 Pinonaldehyde.................................................................................................... 27
3.3.2 Phthalic acid....................................................................................................... 32
3.3.3 6, 10, 14-trimethyl-2-pentadecanone................................................................. 34

vii
3.4 Conclusions and Implications..................................................................................... 35
4. MAJOR COMPONENTS OF SUMMER-TIME ORGANIC AEROSOL IN BAKERSFIELD,
CA....................................................................................................................................... 37
4.1 Introduction................................................................................................................ 37
4.2 Methods...................................................................................................................... 42
4.2.1 Sampling and Chemical Analysis.................................................................... 42
4.2.2 PMF Procedures............................................................................................... 43
4.3 PMF Results............................................................................................................... 47
4.3.1 Factor 1: Local POA........................................................................................ 47
4.3.2 Factor 2: A mixture of OA sources.................................................................. 52
4.3.3 Factor 3: SOA1................................................................................................ 53
4.3.4 Factor 4: SOA2................................................................................................ 53
4.3.5 Factor 5: SOA3................................................................................................ 54
4.3.6 Factor 6: SOA4 (Nighttime SOA )................................................................... 54
4.4 Reconstructed OA...................................................................................................... 55
4.5 Source contributions to OA mass............................................................................... 56
4.6 Formation Pathways of SOA...................................................................................... 58
4.7 Conclusions and Atmospheric Implications................................................................ 62
5. ADDITIONAL ANALYSES............................................................................................... 65
5.1 Aerosol Mass Spectrometry, Fourier Transform Infrared Spectroscopy.................... 65
5.2 Ultra-High Resolution Mass Spectrometry................................................................. 66
viii
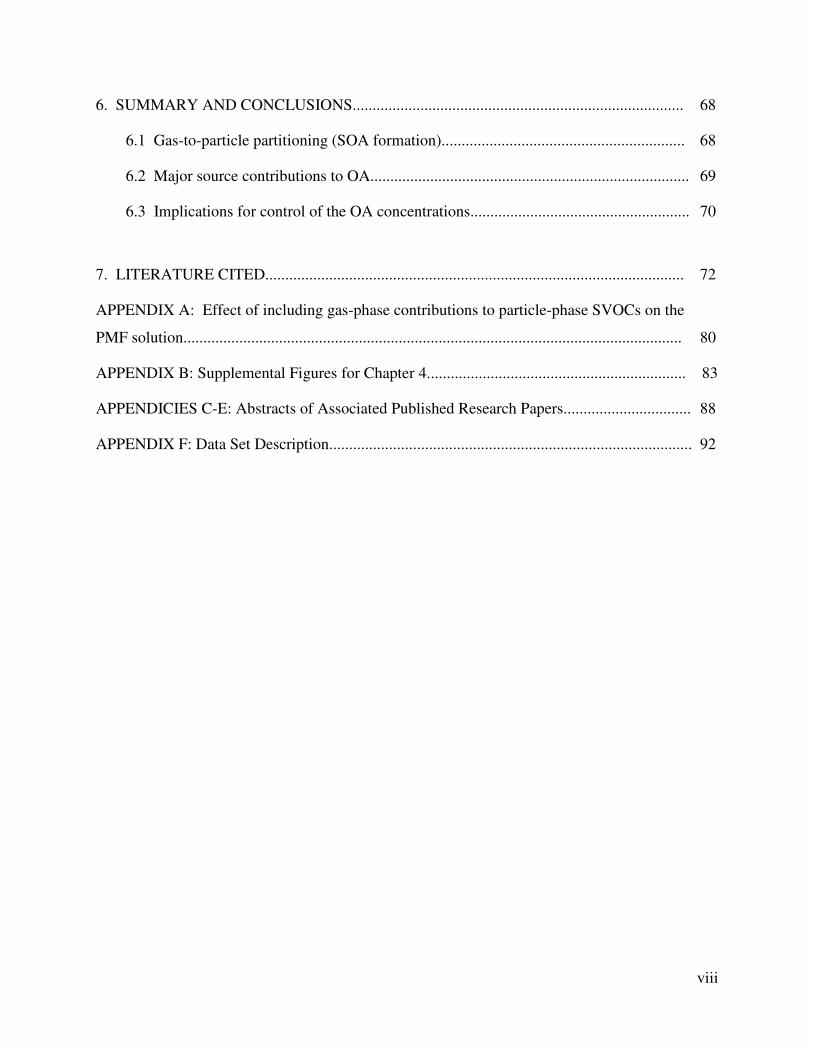
6. SUMMARY AND CONCLUSIONS................................................................................... 68
6.1 Gas-to-particle partitioning (SOA formation)............................................................. 68
6.2 Major source contributions to OA................................................................................ 69
6.3 Implications for control of the OA concentrations....................................................... 70
7. LITERATURE CITED......................................................................................................... 72
APPENDIX A: Effect of including gas-phase contributions to particle-phase SVOCs on the
PMF solution............................................................................................................................. 80
APPENDIX B: Supplemental Figures for Chapter 4................................................................. 83
APPENDICIES C-E: Abstracts of Associated Published Research Papers................................ 88
APPENDIX F: Data Set Description........................................................................................... 92

ix
LIST OF FIGURES
Figure 2.1 Schematic diagrams of the original and current TAG inlets......................... .... 10
Figure 2.2 TAG sampling duct.............................................................................................. 13
Figure 3.1 Oxygen to carbon (O/C) ratios of organic compounds measured by TAG as a
function of subcooled vapor pressure at 25oC.................................................... 25
Figure 3.2 Average measured fractions for oxygenated SVOCs and their corresponding
reference compounds shown as markers.............................................................. 27
Figure 3.3 a) Measured fraction of pinonaldehyde in the particle phase as a function of RH
b) The average cation-to-anion ratio of inorganic species (sulfate, nitrate and
ammonium) as a function of RH.......................................................................... 29
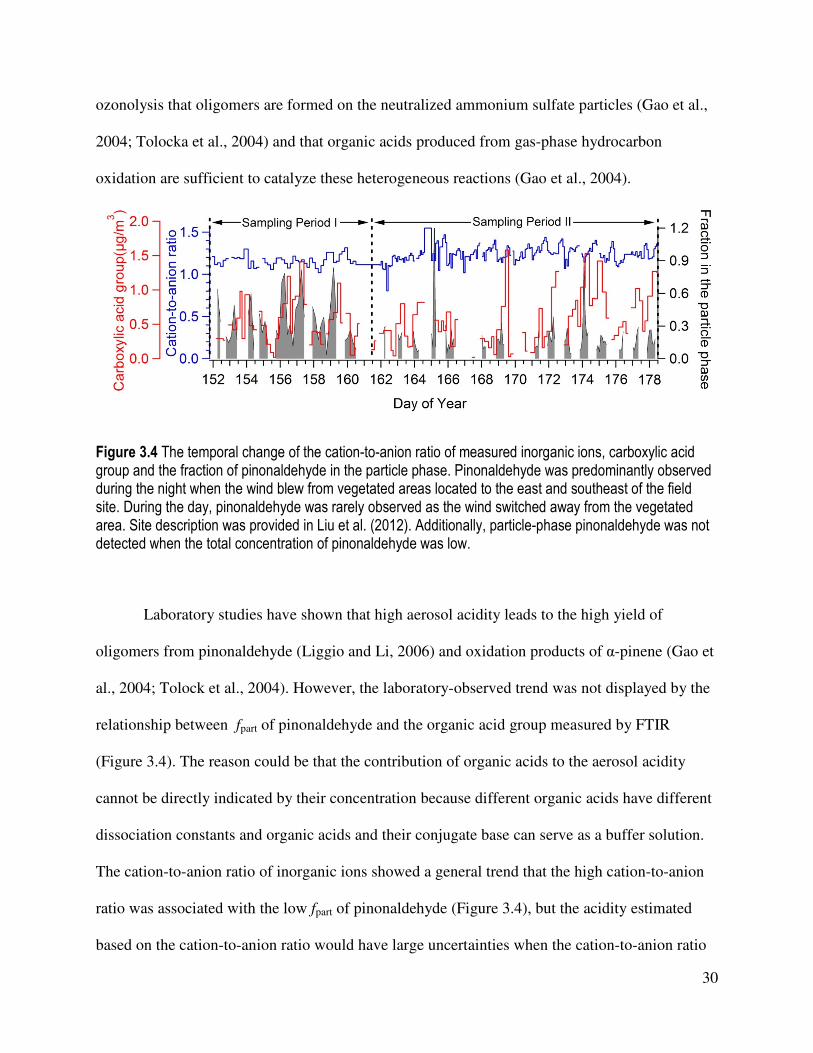
Figure 3.4 The temporal change of the cation-to-anion ratio, carboxylic acid group and the
fraction of pinonaldehyde in the particle phase.................................................. 30
Figure 3.5 Fraction of phthalic acid in the particle phase as a function of the concentration of
gas-phase ammonia.............................................................................................. 34
Figure 4.1 PMF factor profiles. Organic compounds in each factor profile....................... 49
Figure 4.2 Plots of diurnal profile of the mass concentration of each factor and the
average diurnal profile of wind direction and the ration of 1,3,5-TMB to
toluene................................................................................................................. . 50
Figure 4.3 Wind rose plots for six PMF factors using only concentrations larger than the
mean concentration in each factor to emphasize the major contributing source
directions............................................................................................................. 51
Figure 4.4 (a) The box plot of the relative difference between reconstructed and measured OA.
(b) The frequency of OA concentrations in each interval observed at night
throughout TAG measurements......................................................................... 56
Figure 4.5 Mean diurnal mass fraction contribution of each factor to total OA during six
different times of day.......................................................................................... 58
Figure 4.6 Average diurnal profiles of TAG SOA factors and AMS factors....................... 62

x
ABSTRACT
This study was conducted in Bakersfield, CA to investigate the emission sources and
chemistry controlling aerosol production in the southern San Joaquin Valley Air Basin (SJVAB),
a region that is currently out of compliance with ambient air quality standards for ozone and
particulate matter. The primary objective was to investigate the contributions of various sources
to organic aerosol (OA) and the formation pathways of secondary organic aerosol (SOA) and
subsequently provide insights into effective control strategies to reduce air pollution. An in-situ
thermal desorption aerosol gas chromatography-mass spectrometry (TAG) instrument, equipped
with a PM2.5 sharp-cut cyclone, was deployed to measure organic species in both gas and
particle phases during the California at the Nexus of Air Quality and Climate Change (CalNex)
measurement campaign from May 31st through June 27
th, 2010. More than 100 compounds were
quantified, including alkanes, polycyclic aromatic hydrocarbons (PAHs), branched PAHs, acids,
furanones, and other oxygenated compounds, which provided a large set of organic species for
the investigation of SOA formation through comparison between modeled and measured
gas/particle partitioning of known SOA tracers and OA source apportionment through positive
matrix factorization (PMF) analysis.
The gas/particle partitioning of phthalic acid, pinonaldehyde and 6, 10, 14-trimethyl-2-
pentadecanone, three known oxidation products of hydrocarbons, is discussed in detail to explore
SOA formation mechanisms. Measured fractions in the particle phase ( fpart) of 6, 10, 14-
trimethyl-2-pentadecanone were similar to those expected from gas/particle partitioning theory,
suggesting that its partitioning is dominated by absorption processes. However, fpart of phthalic
acid and pinonaldehyde were substantially higher than predicted. The formation of low-volatility
xi
products from reactions of phthalic acid with ammonia is proposed as one possible mechanism to
explain the high fpart of phthalic acid. The observations of particle-phase pinonaldehyde when
inorganic acids were fully neutralized indicate that inorganic acids are not required for the
occurrence of reactive uptake of pinonaldehyde on particles. The observed relationships between
fpart of pinonaldehyde and relative humidity (RH) suggest that the aerosol water content plays a
significant role in the formation of particle-phase pinonaldehyde. Our results clearly show it is
necessary to include multiple pathways in models to predict SOA and to include multiple tracers
in source apportionment models to reconstruct SOA mass.
PMF analysis was performed on particle-phase organic species in PM to identify major
sources of OA and examine the importance of identified SOA formation pathways. Six OA
source factors were identified, including one representing primary organic aerosol (POA), four
distinct types of SOA representing local, regional, and nighttime production, and one
representing a complex mixture of additional OA sources that were not resolvable. The average
POA contribution to total OA was 15% throughout the campaign. The four distinct types of SOA
constituted a combined 72% of total OA. The complex mixture of additional OA sources
constituted the remaining fraction of total OA. Both regional and local SOA were significant OA
sources, but regional SOA had a larger contribution to total OA than local SOA during the day,
especially in the afternoon when the observed OA concentrations were highest. The contribution
of biogenic VOC oxidation products to OA at night was evident, but its contribution is less
constrained. The formation of SOA was through multiple pathways, with the largest fraction of
SOA formed through condensation of gas-phase oxidation products onto particles. Effective
control measures to reduce OA in Bakersfield should focus on reducing sources of organic
xii
precursors during the day, especially regional sources. Controlling the chemical species actively
involved in the formation of SOA, such as ammonia, should also reduce the concentration of
SOA. However, it is worth noting that the reduction of ammonia emissions could also lead to
more nighttime SOA. Additional studies are needed to examine effects of the control of
ammonia on reductions in OA concentrations.
1
1.0 EXECUTIVE SUMMARY
The southern San Joaquin Valley Air Basin (SJVAB) is a region that is currently out of
compliance with air quality standards. Organic aerosol (OA) constitutes a major mass fraction
(20-90%) of atmospheric fine particulate matter in most environments (Kanakidou et al., 2005).
The dominance of secondary organic aerosol (SOA) in OA has been observed in many urban
areas (e.g., Williams et al., 2010a). Understanding OA sources and SOA formation is a critical
step toward elucidating its roles in climate change and human health and making effective
emission control decisions for reducing air pollution. Previous studies of source contributions to
OA in the Bakersfield area focused on OA in winter and were based on the elemental carbon
(EC) tracer and the chemical mass balance (CMB) methods (Magliano et al., 1999; Strader et al.,
1999; Schauer et al., 2000). Neither the EC-tracer nor CMB methods were able to provide
insights into the different SOA types. Past work has demonstrated the ability of positive matrix
factorization (PMF) analysis to separate multiple SOA types with distinct diurnal patterns in the
absence of known source profiles in other areas (Williams et al., 2010a). Despite its utility for
source apportionment, PMF analysis is not widely performed on organic compounds in the
particle phase because it typically requires a larger number of samples which poses significant
challenges when measurements of speciated OA are mainly made by filter sampling with 24-
hour collection periods in the field followed by solvent extraction in the laboratory for analysis.
The thermal desorption aerosol GC/MS (TAG) introduced by Williams et al. (2006) was the first
in-situ instrument capable of measuring speciated OA with hourly time resolution and capturing
the trend of gas/particle partitioning in the atmosphere and thus capable of capturing
unprecedented temporal resolution, the variability in concentrations of organic species. TAG
2
data have been analyzed by PMF in previous work to resolve nine different types of OA in an
urban environment, including various SOA and POA sources (Williams et al., 2010a).
In this study, a TAG was deployed to measure organic species in both gas and particle
phases in Bakersfield, CA (located in the southern San Joaquin valley, where the air quality
problem is greatest) during the California Research at the Nexus of Air Quality and Climate
Change (CalNex) campaign from May 31st through June 27th, 2010. Prior to the field
deployment, the sampling inlet of the TAG was rebuilt using a denuder-based method to separate
gases from particles, which represents an improved method to separate gases from particles
relative to the filter-based method in the original TAG. Measurements made with this new
sampling method enabled the investigation of gas/particle partitioning of oxygenated
compounds. Moreover, the particle-phase organic species included in PMF analysis were
measured with minimal gas-phase sampling artifacts because the denuder efficiently removed the
gas phase organics.
To investigate the SOA formation pathways important in this region, the gas/particle
partitioning of three oxygenated compounds phthalic acid, pinonaldehyde, and 6,10,14-
trimethyl-2-pentadecanone were examined in detail. These compounds contain three different
typical functional group types which may undergo different SOA formation pathways. They
were examined by comparing the measured fractions of these compounds in gas and particle
phases with those predicted by absorptive gas/particle partitioning theory. Our results indicate
that absorption into particles is the dominant pathway for 6,10,14-trimethyl-2-pentadecanone to
contribute to SOA in the atmosphere. Absorption of gas-phase phthalic acid into particles can
3
also contribute to observed particle-phase concentrations, but the major pathway to form
particle-phase phthalic acid is likely through reactions with gas-phase ammonia to form
condensable salts. The observations of pinonaldehyde in the particle phase when inorganic acids
were neutralized indicate that inorganic acids are not required for reactive uptake of
pinonaldehyde on particles to occur.
Our observations of gas/particle partitioning of oxygenated compounds provided direct
evidence that different pathways of gas-to-particle partitioning of organic compounds are present
in the atmosphere and are compound-dependent. The non-absorptive gas-to-particle partitioning
can improve SOA yields of oxygenated compounds relative to traditional absorptive gas-to-
particle partitioning. Our results clearly show it necessary to include multiple gas-to-particle
partitioning pathways into SOA formation models to better account for the contributions of
different precursors and formation pathways and to include multiple SOA tracers into source
apportionment models to reconstruct SOA.
To investigate the source contributions of a variety of sources to OA, PMF analysis was
performed on a subset of organic species. The criteria we used for inclusion of compounds were
that the timeline of observations covered the entire period of TAG measurements during CalNex,
the compounds were in the particle phase, and the percentage of above detection limit data points
was greater than 50% over the full timeline of observations. As a result, 30 compounds in 244
samples were included in the PMF analysis. Six OA source factors were identified, including a
POA source, a mixture of OA sources, and four types of SOA. The dominant primary source was
not determinable because the concentrations of organic tracers were low and the low contribution
4
(15%) of the POA to total OA. The factor of a mixture of OA sources included both POA and
SOA and accounted for an average of 13% of OA. The four types of SOA (1-4) displayed
distinct diurnal profiles. Three of the SOA factors (SOA1-3) displayed an enhancement in their
contributions to OA at different times during the day. SOA1 and 2 were indicated to be mainly
local while SOA3 was indicated to be more regional. The SOA4 factor occurred mainly during
the night and was composed of both anthropogenic and biogenic SOA. SOA was the dominant
component of OA. The four SOA factors together accounted for an average of 72% of total OA
with a diurnal variation from 66% during the night to 78% during the day. The average
contribution of SOA to OA could up to 85% if a mixture of OA sources were considered to be
entirely SOA. Regional SOA (SOA3, 56%) was the largest contributor to OA during the
afternoon and nighttime SOA (SOA4, 39%) was the largest contributor during the night. A clear
split between local and regional SOA cannot be made during the day. However, our results
showed that regional SOA had a larger contribution to OA than local SOA during the day. The
contribution of oxidation products of biogenic VOCs to nighttime SOA was evident, but their
contributions were less constrained. Because the SOA tracers, such as phthalic acid and
pinonaldehyde, have been included in PMF analysis and their contributing pathways have been
examined, the formation pathways of identified SOA types can be inferred from the tracers
present in their factor profiles. The major formation pathway of SOA 1 and 3 is indicated to be
mainly through absorptive gas/particle partitioning. The formation of condensable salts plays a
major role in the formation of SOA2 and reactive uptake of oxygenated compounds on particles
contributes to nighttime SOA (SOA4).
5
Since SOA was the dominant component of OA and included four distinct types of SOA,
which are formed through different formation pathways and impacted by regional sources, the
best control strategy for each type of SOA (SOA1-4) to enable effective reductions in the OA
concentrations may be different. Reduction of SOA precursor emissions on both local and
regional scales is needed to reduce the SOA concentration during the day, but control of regional
precursor emissions is likely more effective in reducing SOA in the afternoon when the observed
concentration was high. Control of ammonia emissions should reduce the concentrations of local
SOA (SOA2). However, control of ammonia emissions could also lead to more nighttime SOA.
Additional studies are needed to examine the effects of reducing ammonia emissions on the
reduction in OA concentrations. At night, because contributions to OA occur from both biogenic
and anthropogenic precursors and the split is poorly constrained, it remains unclear whether
control of anthropogenic VOC SOA precursors could effectively reduce nighttime SOA
concentrations.
6
2.0 Introduction and Background
2.1 Background
Many urban and rural air districts in California are now out of compliance with state and
federal air quality standards for particulate matter. Additionally, the NAAQS for annual average
PM2.5 was recently tightened from 15 to 12 µg/m3. Regulatory efforts to conform to PM2.5
standards require improvements in our knowledge of the factors controlling the concentration,
size and chemical composition of fine PM. While many advances have been made in measuring
and modeling the inorganic ionic species that are found in PM, much less is known about the
organic fraction. Yet organic matter is a major constituent of airborne particles. For example, OA
typically accounted for more than 60% of PM2.5 in Fresno, CA (Chow et al., 2007) and was one
of the dominant components of PM2.5 in Bakersfield, CA (Chow et al.2006).
The chemical composition of atmospheric organic matter is complex. Many hundreds of
organic compounds have been identified through chromatography and mass spectrometry
techniques (Rogge et al., 1997a, 1997b, 1998; Schauer et al., 1999b; Nolte et al., 1999; Fine et
al., 2001). These include alkanes, substituted phenols, alkanals, sugar derivatives, aromatic
polycyclic hydrocarbons (PAH), and mono- and di-carboxylic acids. Some organic compounds
are markers for primary emissions, such as combustion sources, while others are secondary
products formed from anthropogenic or biogenic precursors. Quantitative knowledge of the
composition of fine PM organic matter is key to identify its sources and understanding its
formation and transformation processes.
7
In 2010, the ARB and the National Oceanic and Atmospheric Administration (NOAA)
carried out a joint field study of atmospheric processes over California and the eastern Pacific
coastal region (CalNex 2010). The goal of the CalNex 2010 program was to study the important
issues at the nexus of the air quality and climate change problems, and to provide scientific
information regarding the trade-offs potentially faced by decision makers when addressing these
two inter-related issues. During this study an instrumented airplane deployed by NOAA flew
over both the South Coast Air Basin (SoCAB) and the SJVAB to provide in situ gas-phase,
aerosol and cloud measurements that will help scientists evaluate emissions (precursors of O3
and PM and also greenhouse gases), continental/regional /inter-regional transport, and day/night
chemistry of O3 and PM. The ground sites focused on intensive study of PM and O3, their
precursors, and indicator species to study the chemical production and loss of O3 and PM.
Linking these data sets can address the differences between air quality control strategies needed
in Pasadena (SoCAB) and Bakersfield (SJVAB).
The SJV air basin is bordered on the west by the coastal mountain ranges, on the east by
the Sierra Nevada range, and on the south by Tehachapi Mountains (Chow et al., 2006).
Bakersfield, CA was one of two supersites that were established for the CalNex field
measurement campaign in the early summer of 2010. Bakersfield is a major city located near the
Southern end of the SJV. Chow et al. (2006) has shown that PM2.5 concentrations can be over
100 µg/m3 in winter and OA generally contributes more than 50% of the PM2.5. Additionally,
the air quality in the Bakersfield area is influenced by various sources, including an urban area
and regional agricultural, natural, and industrial sources. Prior to the CalNex campaign, studies
of source apportionment of OA in the Bakersfield region were made with the EC-tracer and

8
CMB methods and focused on OA in winter (Magliano et al., 1999; Strader et al., 1999; Schauer
et al., 2000). Neither the EC-tracer method nor CMB model was able to provide insights into
different SOA types. Moreover, the primary sources of OA and volatile organic compounds and
the concentrations of oxidants in the atmosphere would vary significantly in different seasons.
These differences can lead to different chemical compositions of OA and require different
control strategies.
2.2 Our Measurement Approach: On-line Thermal desorption Aerosol GC
(TAG)
Our group has developed the Thermal Desorption Aerosol GC/MS (TAG), an automated
system for the in situ characterization of ambient OA species through gas chromatography /mass
spectrometry (Williams et al, 2006). TAG is designed to provide hourly data at the compound
level for semi-volatile organic species. While only a subset of the total organic fraction is
identified, those compounds that are measured serve as markers for identifying aerosol source
types and elucidating the variability in the physical and optical properties associated with
particulate organic matter. The analytical approach employed by TAG is very similar to
published protocols for filter collection and analysis of speciated organics in fine PM. As such,
our effort has the advantage of building on the existing source characterization data base for
organic compounds. The major difference from filter-based work is that our instrument provides
automated, in situ analysis with hourly time resolution, and avoids known artifacts associated
with filter collection (Williams et al., 2006).

9
Thermal desorption GC/MS was first applied to the analysis of ambient aerosols by
Greaves et al. (1985), who employed this approach for the analysis of particles collected through
filtration. They found that thermal desorption allowed direct analysis, without the need for filter
extraction, and that very small air volumes were sufficient to identify a large number of species.
More recently thermal desorption has been used successfully for the analysis of time-integrated
filter and impactor samples of atmospheric aerosols (Waterman et al., 2000, Neusüss et al., 2000,
Falkovich and Rudich, 2001). These investigators showed the equivalence of thermal desorption
to the more labor intensive solvent extraction methods for the analysis of polycyclic aromatic
compounds found in standard reference materials. The method is semi-continuous, with analysis
and collection of the next sample occurring simultaneously allowing for hourly time resolution.
A full description of the instrumental details has been published (Williams et al., 2006), as have
results from actual field measurements (Williams et al., 2007; Goldstein et al., 2008; Williams et
al., 2010; Worton et al., 2011).
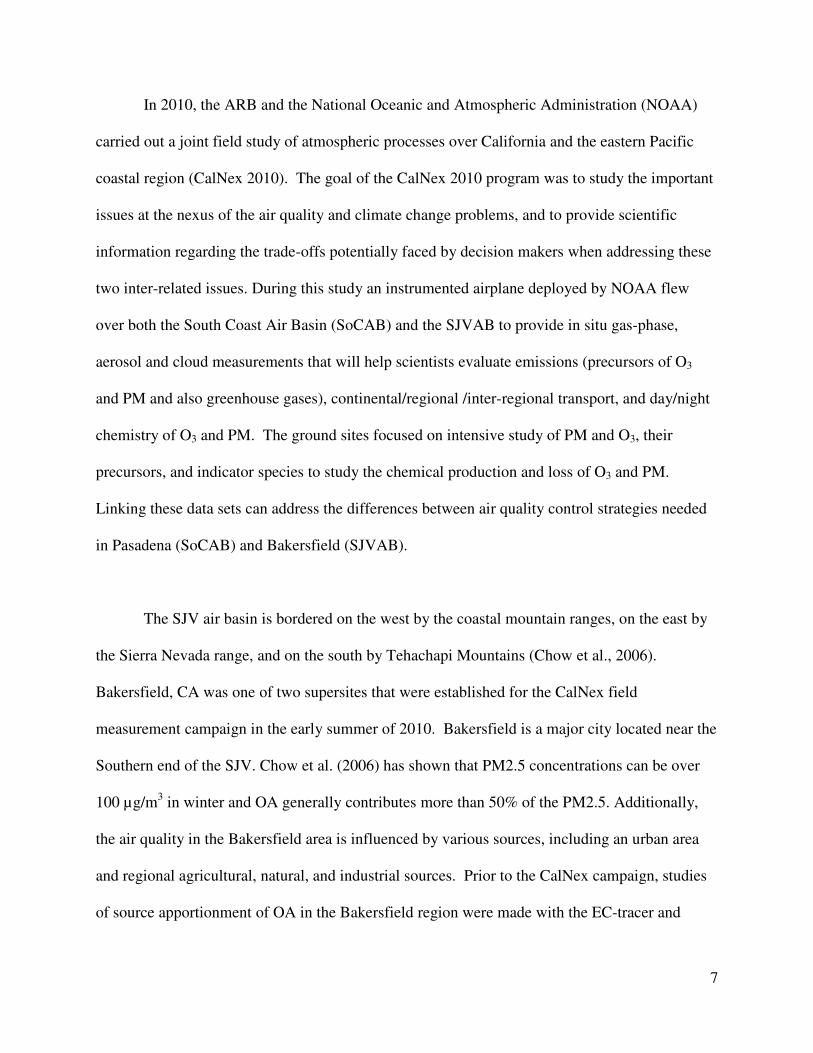
Prior to this field campaign, the TAG instrument was upgraded by adding a denuder into
the sampling inlet as a parallel sampling line to a bypass line which was made of stainless steel
tubing (Figure 2.1). The addition of the denuder enabled the measurements of organic particulate
species with minimal effects of organic vapors because the denuder efficiently removed organic
vapors while ambient air was sampled through it. With an inlet consisting of two parallel
sampling lines, the gas/particle partitioning of organic species can be examined by alternating
sampling flow between the denuder line (particle-phase organics) and the bypass line (the sum of
gas- and particle-phase organics). In addition to the sampling inlet of TAG, the sampling
approach introducing the ambient air into the TAG sampling inlet was redesigned. The present
10
sampling approach was that ambient air was sampled from a large transport flow, through a short
stainless steel tube and into the TAG sampling inlet. This new approach minimized the wall loss
of both organic vapors and particles during sampling. Detailed descriptions of the instrument are
provided in Chapters 3 and 4.
Figure 2.1 Schemaic diagrams of the sampling inlets of the original TAG (a) and the updated TAG (b)
This is the first time that in situ measurements of speciated OA were made with a
denuder being included in the sampling inlet. Particle-phase organic species measured by this
updated TAG better capture the variability in concentrations of OA in the atmosphere, which is
essential to conducting source apportionment analysis. The measurements of gas/particle
partitioning of individual SOA tracers provides insights into SOA formation pathways in the
atmosphere and subsequently these tracers can be included in PMF analysis to indicate the
relative importance of various formation pathways.
2.3 Objectives
The objective of this project was to identify the origins of organic aeosol within the
southern San Joaquin Valley of California, a region that is currently out of compliance with PM
air quality standards.
Humidifier
FilterFilter
De
nu
de
r
(a) (b)
11
There is a critical need for on-line, time-resolved, quantitative measurement of
atmospheric particulate organics at the molecular level. Marker compounds unique to specific
source types provide a means of determining the relative contributions of various primary
sources. Data at the compound level are also needed for understanding the chemical formation
and transformation mechanisms leading to secondary organic aerosol formation. This research
provided a useful new data set for air quality attainment strategies in California and the
development of the State Implementation Plan, and for understanding the pathways leading to
secondary organic aerosols that may also be of importance in climate change.
The overall objective of this project was to deploy the TAG instrument for measurements
at the Bakersfield field ground site during the CalNex 2010 campaign for approximately 1.5
months, with at least four continuous weeks of measurements, in order to investigate tracers and
sources of organic PM. Measurements in Bakersfield allowed us to quantify the speciated
organic composition in a region with high particulate loadings influenced by biogenic (natural
and agricultural), geogenic (oil and gas), and anthropogenic sources. The measurements were
part of the larger CalNex 2010 study planned in coordination with the Air Resources Board and
the National Oceanographic and Atmospheric Administration (NOAA). The hourly time
resolution data from these field measurements was used to improve our understanding of the
sources contributing to ambient PM organic composition. We used positive matrix factorization
and factor analysis to identify the major source types, and we analyzed the data in the context of
the broader CalNex 2010 suite of observations.

12
Task 1: Field Measurements at the Bakersfield Ground Site
To enable the investigation of SOA formation through measurements of gas/particle
partitioning and PMF analysis of particle-phase organic species, the sampling inlet of the TAG
was rebuilt before this campaign to have two parallel sampling lines, including a denuder line
and a bypass line. This modified TAG was deployed at the Bakersfield CalNex Supersite to
measure organic species in both gas and particle phases. The sampling flow was alternated
between the denuder line to collect particle-phase organics and the bypass line to collect total
organics, the sum of gas- and particle-phase organics. Both gas- and particle-phase organics were
collected by an impactor cell. The impactor cell is made of stainless steel and passivated with an
Inertium coating (Williams et al., 2006). Collection of particles is through inertial impaction and
collection of organic gases is through adsorption onto the surface of the impactor cell. At the low
end of t size range, the aerodynamic particle diameter corresponding to 50% collection is
~0.07 µm so that the instrument collects from 0.07 to 2.5µm particles thus the entire
accumulation mode mass falls within the instrument’s collection range (Williams et al., 2006).
The capability of the collection and thermal desorption (CTD) cell to capture trends of
concentrations of organic gases has been shown in Williams et al. (2009).
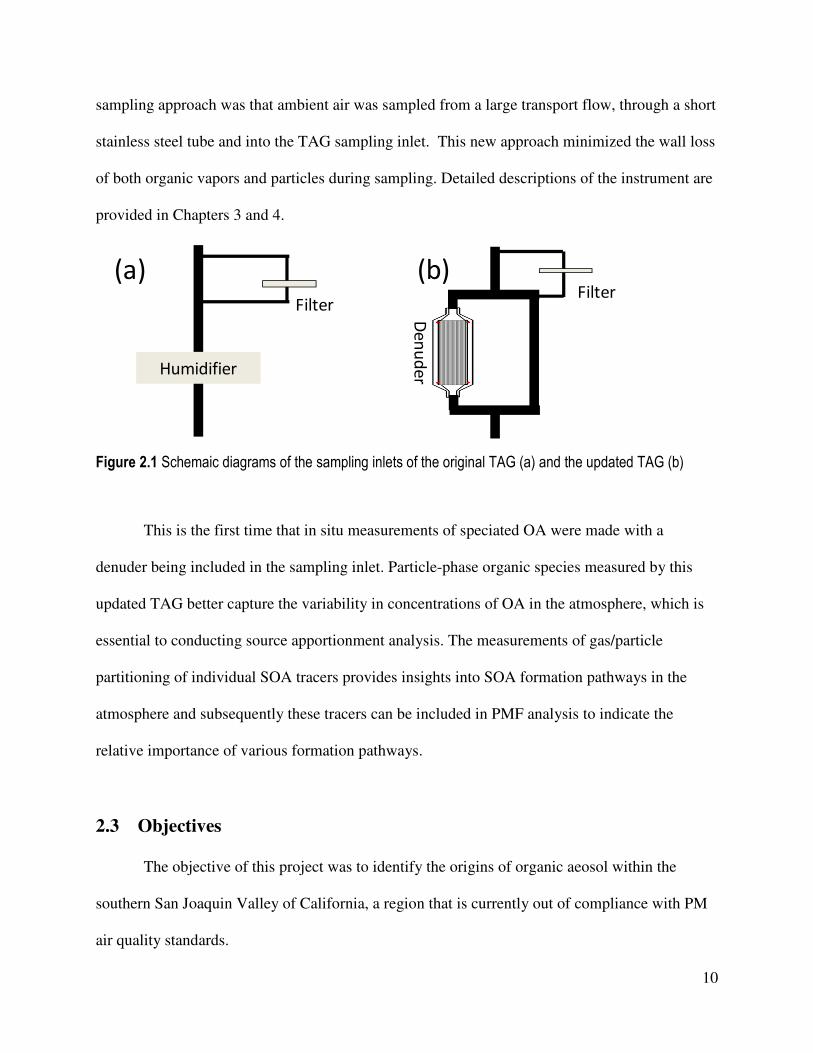
Ambient air was sampled ~ 5 m above the ground through a 6-in i.d. rigid stainless steel
duct (Mcmaster Carr) at 200 L/min (Figure 2.2). The TAG samples were collected from the
center of this large transport flow through a 1 m long section of 3/8-in stainless tubing, through a
sharpcut PM2.5 cyclone, through either the denuder sampling line or the bypass line, and
delivered into the impactor cell for collection of organics. The samples collected through the
denuder ("denuded samples”) were expected to be only particle-phase organics, while, through
13
the bypass line ("undenuded samples"), the samples were total organics (the sum of collected
gas- and particle-phase organics). Following sampling, the organic samples were thermally
desorbed and injected into a gas chromatograph-mass spectrometer (GC/MS) for analysis.
Figure 2.2 TAG sampling duct.
During this CalNex campaign, the TAG sampling durations was changed. The duration of
each sample was 90 minutes from May 31st to June 9
th (Sampling Period I) and 30 minutes from
June 10th
to 27th
(Sampling Period II). The longer sampling time in Sampling Period I was used
to collect a large amount of organics to facilitate looking for organic molecular tracers for major
OA sources. As concentrations of organic molecular tracers measured in Sampling Period I,
especially tracers for SOA, were higher than their detection limits, the sampling time was
reduced in order to better capture temporal variability in the concentrations of organic species.
Over the 27-days of measurements, 244 samples of speciated OA and gas-phase organic species,
respectively, were acquired with over 100 particle-phase organic compounds being identified and
quantified.
Sampling duct

14
Task 2: Data Reduction – Organic Marker Compound Time Lines
Many organic compounds were identified using mass spectral and retention time matches
with authentic standards. Other resolved compounds, where authentic standards were not
available, have been matched to the compounds found in the Palisade Complete Mass Spectral
Database (600 K edition, Palisade Mass Spectral Database, Ithaca, NY). More than 100
compounds were identified and quantified in the ambient samples collected during this
campaign, covering a broad vapor pressure range and including many functional groups. Both
primary and secondary organic marker compounds were identified and quantified, such as
hopanes for motor vehicles, retene for biomass burning, phthalic acid for SOA, etc.
The quantification of these organic species was made by calibration with authentic
standards. Internal standards were injected into the impactor cell at regular time intervals to track
the matrix effects due to collected organics and account for any drifts in detector response.
Task 3: Data Analysis – Source Attribution through positive matrix factorization (PMF).
The data analysis consisted of two parts: 1) investigating SOA formation pathways
through comparing measured gas/particle partitioning of SOA tracers to theory; and 2)
investigating source apportionment of OA through PMF analysis with inclusion of SOA tracers
whose gas/particle partitioning pathways were identified.
The gas/particle phase partitioning of SOA tracers were investigated to provide insights
into the pathways of gas-to-particle partitioning whereby oxygenated compounds contributed to

15
SOA. This investigation has identified the presence of different formation pathways and showed
that effective control strategies to reduce the SOA concentration should be achievable by
controlling precursor emissions leading to its formation pathways.
PMF analysis was performed on the particle-phase organic species to distinguish the
contributions to OA from various sources, including primary and secondary sources in this study.
Six types of OA sources were identified, including local POA and four types of SOA
(representing condensed oxygenates, local SOA, regional SOA, and nighttime SOA, and a
mixture of OA sources which could not be resolved. The contributions to OA from these sources,
SOA formation pathways, SOA spatial and temporal dispersion, and SOA precursors are
discussed in detail in Chapter 4. The roles of different SOA formation pathways are also
examined by inclusion of known SOA tracers with their gas-to-particle partitioning pathways
being identified. The most effective control strategy to reduce the OA concentration is proposed
according to our investigation of SOA formation pathways and contributions of various sources
determined by PMF analysis to OA.
Task 4: Dissemination of Results
In this report we describe in detail how each of these objectives were met, the results
obtained, and their implications and significance.
In addition, multiple papers and posters have been presented at various workshops,
meetings and seminars. The peer-reviewed publications using the TAG data to date include:

16
1) Zhao, Y., N. M. Kreisberg, D. R. Worton, G. Isaacman, R.J. Weber, S. Liu, D. A. Day,
L.M. Russell, M.Z. Markovic, T.C. Vandenboer, J.G. Murphy, S.V. Hering, A.H. Goldstein,
Insights into secondary organic aerosol formation mechanisms from measured gas/particle
partitioning of specific organic tracer compounds, Environmental Science & Technology, DOI:
10.1021/es304587x;
2) Zhao, Y., N. M. Kreisberg, D. R. Worton, G. Isaacman, D. R. Gentner, A. W. H.,
Chan, R.J. Weber, S. Liu, D. A. Day, L.M. Russell, S.V. Hering, A.H. Goldstein, Sources of
organic aerosol investigated using organic compounds as tracers measured during CalNex in
Bakersfield. Journal of Geophysical Resarch-Atmospheres, in review.
3) Liu, S., L. Ahlm, D.A. Day, L.M. Russell, Y. Zhao, D.R. Gentner, R.J. Weber, A.H.
Goldstein, M. Jaoui, J.H. Offenberg, T.E. Kleindienst, C. Rubitschun, J.D. Surratt, R.J. Sheesley,
and S. Scheller, Secondary organic aerosol formation from fossil fuel sources contribute majority
of summertime organic mass at Bakersfield, J. Geophys. Res., 117, D00V26,
doi:10.1029/2012JD018170, 2012.
17
3. Insights into SOA formation mechanisms from measured
gas/particle partitioning of specific organic tracer compounds
3.1. Introduction
Secondary organic aerosol (SOA) accounts for the majority of organic aerosol (OA) on a
global scale (Kanakidou et al., 2005; Goldstein and Galbally, 2007) and more than 80% in the
afternoon during summer in urban areas (Williams et al., 2010a). Understanding the formation
and distribution of SOA is important because SOA plays a significant role in affecting climate
change on both global and regional scales (Hoyle et al., 2009; Goldstein et al., 2009). However,
predictions of SOA by traditional models based on laboratory measurements of SOA yields from
volatile organic compounds and absorptive partitioning theory have been shown to substantially
underestimate the ambient SOA loadings in polluted regions (Heald et al. 2005; 2010; Volkamer
et al., 2006; Spracklen et al., 2011). The discrepancies between measurements and models could
in part be attributed to the poor understanding of formation pathways of SOA in the ambient
atmosphere.
Laboratory studies have shown that in addition to absorptive gas/particle partitioning
following the formation of low-volatility compounds through gas-phase oxidation (Pankow,
1994; Seinfeld and Pankow, 2003), other SOA formation pathways such as reactive uptake of
gaseous species (Jang et al., 2002; Kroll et al., 2005) and gas-phase non-oxidative reactions (Na
et al., 2007) could be important. However, these pathways remain poorly understood. For
example, laboratory studies have shown that reactive uptake of oxygenated organic compounds
onto acidic particles can significantly increase SOA yields, but there is no agreement on the

18
extent of enhancement of SOA yields (Jang et al., 2002; Iinuma et al., 2005; Kroll and Seinfeld,
2008). Additionally, laboratory studies of reactive uptake of oxygenated compounds have
focused primarily on small carbonyl compounds and found that not all of them significantly
contribute to SOA when the concentrations used in the laboratory studies are scaled to
atmospheric levels (e.g., Jang et al., 2002; Kroll et al., 2005). As a result, the contribution of
individual compounds to SOA cannot be generalized solely on the basis of their functional
groups. Ambient measurements are important for examining the importance of laboratory-
proposed SOA mechanisms.
Ambient measurements with an Aerodyne quadrupole aerosol mass spectrometer (Q-
AMS) were made to examine the effects of aerosol acidity on SOA formation and the results
showed that no significant enhancement in SOA formation was observed during acidic periods,
which were identified on the basis of the inorganic ion charge balance (Zhang et al., 2007).
However, the importance of acid-catalyzed reactions in SOA formation might not be evident
using the inorganic ion charge balance as the indicator of aerosol acidity because organic acids
could also provide sufficient acidity for the occurrence of these reactions (Gao et al., 2004).
Additionally, the variability in the amount of SOA formed through acid-catalyzed reactions
could be obscured by SOA formed through other pathways if there is not an analytical method to
distinguish them. Compared with the bulk organic analysis, time-resolved speciated
measurements of gas- and particle-phase organic compounds can determine concentrations of
organic compounds involved in acid-catalyzed reactions and distinguish SOA products formed
through acid-catalyzed reactions from other pathways. Moreover, these time resolved speciated
measurements provide information to examine factors affecting SOA formation that have
19
previously been investigated in laboratory studies, such as relative humidity (RH) and acidity,
and enable one to discover new pathways of SOA formation in the atmosphere (Pankow, 1994;
Jang et al., 2002; Tillmann et al., 2010).
Williams et al. (2010b) demonstrated that a Thermal desorption Aerosol Gas
chromatography (TAG) instrument was able to capture the gas/particle partitioning of individual
species, wherein a Teflon filter placed upstream of the cyclone was used to separate gases from
particles. The fraction of organic species in the particles measured with this TAG is
overestimated because the collection cell utilized in this TAG is designed for collection of
particles and incapable of complete collection of gas-phase organics. Additionally, the
gas/particle separation by a filter is subject to sorption of organic vapors on the filter and
volatilization of collected organics and consequently causes difficulty in quantifying the extent
of overestimation. In the present study, a denuder is used, representing an improved method to
separate gases from particles (Turpin et al., (2000) and allowing the upper limit of
overestimation to be quantified. The investigation of different SOA formation pathways is made
by conducting time-resolved, speciated measurements of gas/particle partitioning of oxygenated
semi-volatile/intermediate-volatility organic compounds (S/IVOCs) in the ambient atmosphere
with this modified TAG. The factors affecting these pathways are investigated using temporal
variability of measured gas/particle partitioning of organic species in combination with
supporting measurements, such as RH. This study improves the understanding of SOA formation
in the ambient atmosphere and will likely lead to useful parameterization of SOA formation.

20
3.2. Methods
3.2.1. Sampling and Analysis
TAG is an in situ instrument combining ambient sampling, thermal extraction and
injection, and GC/MS analysis into an integrated system, which is capable of measurements of
speciated OA with hourly time resolution. TAG has two basic modes of operation: (1) ambient
sampling with concurrent GC/MS analysis of previous samples and (2) thermal desorption and
subsequent injection of organics into GC (e.g., Williams et al., 2006). The key component of
TAG sampling inlet is a collection and thermal desorption (CTD) cell, which is made of stainless
steel and passivated with an Inertium coating (Williams et al., 2006). Collection of particles is
through inertial impaction and collection of organic gases is through adsorption onto the surface
of the impactor cell. The capability of the CTD cell to capture trends of concentrations of organic
gases has been shown in Williams et al. (2009).
A modified TAG instrument was deployed to measure organic species in both gas and
particle phases during the CalNex campaign from May 31st to June 27th, 2010 at the Bakersfield
California Supersite. The modification was made before this field campaign by adding an
activate charcoal denuder (30 mm OD, 40 cm length, ~490 channels, Mast carbon, UK) into the
sampling inlet as a parallel sampling line to a bypass line made of stainless steel tubing. The
denuder was housed inside a home-made aluminum cylindrical tube with a tapered cap in each
end connecting to the sampling line upstream and downstream. The separation of gases and
particles is improved by addition of the denuder into the TAG sampling inlet because the
denuder efficiently removes organic vapors and allows the particles pass through. Consequently,
21
the addition of the denuder enables TAG to determine gas/particle partitioning of organic species
through a denuder difference method.
During the sampling, ambient air was sampled at 10 L/min from the center of the main
flow, drawn from approximately 5 m above ground at 200 L/min through a 6-in (i.d.) rigid duct,
and sampled through a sharpcut PM2.5 cyclone (10 L/min, BGI Inc., Waltham, MA).
Downstream of the cyclone, the air flow was split to discard 10% of the air flow. Subsequently,
90% of the ambient flow was sampled through the denuder line (or bypass line) and delivered
into a CTD cell through a 9 L/min critical orifice for collection of organics. Gas/particle
separation was achieved by alternating ambient air between the denuder and the bypass line. The
samples collected through the denuder ("denuded samples") were expected to be only particle
phase organics while those collected through the bypass line ("undenuded samples") were the
total organics, the sum of the collected gas and particle phase organics. The sampling duration of
each sample was 90 minutes from May 31st to June 9th (Sampling Period I) and 30 minutes from
June 10th to 27th (Sampling Period II). The longer sampling time in Sampling Period I was used
to collect a large amount of organics to facilitate looking for organic molecular tracers for major
OA sources. As concentrations of organic molecular tracers measured in Sampling Period I,
especially tracers for SOA, were higher than their detection limits, the sampling time was
reduced in order to better capture temporal variability in the concentrations of organic species.
The CTD was maintained at 28°C during the ambient sampling and, at the conclusion of
ambient sampling, was held constant at the same temperature for one minute to purge residual air
out of the CTD with a helium flow of 20 ml/min. Following the purge, the thermal desorption of

22
collected organics was carried out in a helium flow by heating the CTD from 28°C to 300°C at a
rate of ~30°C/min and held at 300°C for nine minutes followed by thermal injection into a gas
chromatograph. The chromatographic separation of organic species was achieved by a capillary
GC column (Rxi-5Sil MS; 30 m length, 0.25 mm i.d., 0.25 µm film thickness, Restek). The GC
oven temperature was held at 45°C for 18 minutes for the sample injection from the CTD to GC
followed, in order, by: 1) a ramp-up to 150°C at 15°C/min; 2) a ramp-up from 150°C to 330°C
at 9°C/min; and 3) a hold at 330°C for 4 minutes. Identification and quantification was achieved
using a quadrupole mass spectrometer (Agilent, 5973) which was calibrated based on responses
to authentic standards that were manually injected into the CTD at regular time intervals (twice
per day) throughout the campaign (Kreisberg et al., 2009).
The gas collection efficiency of the denuder was determined at the beginning, middle and
end of the campaign by using the difference in the amount of gas-phase organics collected
downstream of the denuder and bypass lines with a FiberfilmTM
glass fiber filter (Pall Corp.)
placed upstream of the cyclone to remove particles. Particle penetration through the denuder was
determined using an optical particle spectrometer (model UHSAS, Droplet Measurement
Technologies) to measure the number size distributions of ambient particles at the inlet and
outlet of the denuder before this campaign.
A broad suite of complementary measurements were concurrently made at this site,
including a full range of meteorological, trace gas and aerosol measurements. The measurements
utilized in this study included non-refractory PM1 inorganic and organic aerosol components,
carboxylic acid group, gas-phase ammonia and meteorological data. Non-refractory PM1 aerosol
23
components were measured using a High-Resolution Time-of-Flight Aerosol Mass Spectrometer
(HR-ToF-AMS; Aerodyne, Billerica, MA) using the methods described in Liu et al. (2012). PM1
was also collected by Teflon filters for measurements of the organic acid group (-COOH) by
Fourier Transform Infrared (FTIR) spectroscopy (Liu et al., 2012). Liu et al. (2012) reported that
the organic mass in PM1 accounted for 75% of that in PM2.5. Gas-phase ammonia was
measured using an Ambient Ion Monitor/Ion Chromatograph (AIM-IC) (Markovic et al., 2012).
3.2.2. Particle-phase Fraction Calculations
Because the particle-phase and total organics were not collected simultaneously, the
measured fraction of a given compound in the particle phase ( fpart) in sample n is calculated
using the particle-phase concentration(Cpart,n) divided by the average of total concentrations in
the previous and subsequent total concentrations (Ctotal,n-1,, Ctotal,n+1 ):
1,1,
,2
+− +=
ntotalntotal
npart
partCC
Cf (3.1)
The gas/particle partitioning coefficient (kom) for absorptive partitioning into organic aerosol is
calculated by the equation described by Pankow (1994):
MWP
RTk
L
omδ0610
= (3.2)
where R is ideal gas constant (8.2×10⁻⁵
m3 atm mol
-1 K
-1), T is temperature (K), PL
0 is the vapor
pressure of the pure compound (atm) at the temperature of interest, δ is the activity coefficient of
the compound in the absorbing phase, and MW is the average molecular weight (g mol-1
) of the
absorbing phase. The particle-phase fraction based on partitioning theory (fpart,T) was calculated

24
from the partitioning coefficient constant (kom) and the mass concentration of organic aerosols in
µg m-3
(COA):
1
OAom
part,TC
11
−
×+=
kf (3.3)
The data collected by other instruments were averaged according to TAG sampling
duration of 30 or 90 minutes. The average OA concentration (COA) from HR-ToF-AMS
measurements was 3.7 ± 1.8 µg m-3
(0.5 - 11.2 µg m-3
in the range of OA concentrations during
the measurements). Average temperature was 26 ± 6 °C (range of 12 - 40°C). In our study, the
theoretical fractions of organic species in the particle phase were calculated using the average
temperature and average OA concentration (T =26°C, COA=3.7 µg m-3
) and both molecular
weight (MW = 200 g mole-1
) and activity coefficient (= 0.3 and 3) from literature (Pankow,
1994; Seinfeld and Pankow, 2003). Subcooled vapor pressures used in this study were from The
Estimation Programs Interface (EPI) Suite developed by the US Environmental Protection
Agency's Office of Pollution Prevention and Toxics in conjunction with the Syracuse Research
Corporation (SRC).
3.3. Results and Discussions
More than 150 compounds were measured by TAG, covering a broad vapor pressure
range and different functional groups (Figure 3.1 and Appendix F). Most identified compounds
were present in the vapor pressure range of S/IVOCs defined by Robinson et al. (2007) (Figure
3.1). The gas/particle partitioning of three oxygenated compounds, pinonaldehyde, phthalic acid
and 6, 10, 14-trimethyl-2-pentadecanone, is discussed in detail to explore SOA formation in the

25
ambient atmosphere. The functional groups of these three compounds represent the three
common functional groups for oxidation products of hydrocarbons in the atmosphere.
Pinonaldehyde is a major product of α-pinene ozonolysis with gaseous yields of pinonaldehyde
being 0.39-0.69 (Liggio and Li, 2006). Phthalic acid and 6, 10, 14-trimethyl-2-pentadecanone
have been used as SOA tracers in chemical mass balance and positive matrix factorization
modeling calculations (Zheng et al., 2002; Shrivastava et al., 2007; Williams et al., 2010a).
Figure 3.1 Oxygen to carbon (O/C) ratios of organic compounds measured by TAG as a function of subcooled vapor pressure at 25ºC. The compounds of interest are colored in red.
Though fpart of the compounds of interest were overestimated in this study because their
gas-phase organics were only partially collected by the collection cell which was designed for
collecting particle-phase organics, the extent of overestimation can be indicated by fpart of n-
alkanes. Average collection efficiencies of the denuder for pinonaldehyde, phthalic acid, and 6,
10, 14-trimethyl-2-pentadecanone were over 98%. Average losses of the particle number inside
the denuder were less than 10% for particle sizes spanning the particle spectrometer’s range

26
(0.05~1 µm). The efficient separation of organic gases and particles by the denuder limits the
source of this overestimation to under collection of gas-phase organics. The gas/particle
partitioning of n-alkanes can be well described by the gas/particle absorptive partitioning theory
(Fraser et al., 1997) and n-alkanes have the lower or same adsorption coefficient constants on the
surface of sampling substrates, relative to other compounds with the same vapor pressure (Goss
and Schwarzenbach, 1998). As a result, measured particle-phase fractions of n-alkanes, the sum
of absorptive gas/particle partitioning and overestimation caused by incomplete collection of
their vapors, provide the upper limit of the overestimation of TAG measurements in the vapor
pressure range of these n-alkanes.
The reference compounds selected based on the similar subcooled vapor pressures for
pinonaldehyde, phthalic acid, and 6, 10, 14-trimethyl-2-pentadecanone are n-tetradecane, n-
heptadecane and n-nonadecane, respectively (Figure 3.2). If measured particle-phase fractions of
these oxygenated organic compounds are far larger than those of their reference compounds, as
is the case for phthalic acid and pinonaldehyde, additional SOA formation pathways must occur,
beyond absorptive gas/particle partitioning and overestimation due to under collection of gas-
phase organics.

27
Figure 3.2 Average measured fractions for selected oxygenated organic compounds (solid markers) and their corresponding reference compounds (empty markers). The vertical bar is one standard deviation of the mean. The solid and dashed lines are the predicted fractions of organic compounds in the particle phase with different vapor pressures using the equations 2 and 3.
3.3.1. Pinonaldehyde
The mean fpart of pinonaldehyde was 20 ± 20%, which was much higher than that of its
reference compound, n-tetradecane (Figure 3.2). The fraction of pinonaldehyde in particles was
observed to increase as RH increased (Figure 3.3a).The contribution to the fraction of
pinonaldehyde in particles, estimated by using the amount of pinonaldehyde partitioning into
aerosol water, is negligible (even if a ratio of aerosol water to the dry aerosol mass equal to one
was used and all of the aerosol water is available to take up pinonaldehyde). Moreover, this
assumed ratio of the water content to dry mass is inconsistent with the average RH of 34%
observed during TAG measurements because a ratio of generally less than 0.3 is expected at this
average RH (Khlystov et al., 2005; Schuster et al., 2009; Engelhart et al., 2011). The
measurements of particle-phase pinonaldehyde reported here were with negligible sampling
artifacts due to adsorption of gas-phase pinonaldehyde to the collection cell because the denuder
28
efficiently removed organic vapors. Therefore, our observations of particle-phase pinonaldehyde
clearly show that gas-phase pinonaldehyde had been converted into forms with the lower vapor
pressures prior to the collection.
Low-volatility compounds (e.g., oligomers) formed from monomers with direct
involvement of pinonaldehyde have been observed in chamber experiments (Tolocka et al.,
2004; Liggo and Li, 2006; Tillman et al., 2010) and ambient samples (Tolocka et al., 2004). In
our study, low-volatility compounds were measured as a pinonaldehyde monomer, consistent
with previous TAG measurements in a forest area (Worton et al., 2011). The reason may be
attributed to the use of the thermal desorption method which could decompose low-volatility
compounds into their original monomers (Jang et al., 2002). These low-volatility compounds
were not directly measured in our study, but the variability in the measured concentration of
pinonaldehyde can still be used to investigate factors affecting the formation of low-volatility
compounds. In the following discussion, the term of particle-phase pinonaldehyde is taken to
include all low-volatility compounds formed with direct involvement of pinonaldehyde. The
cation-to-anion ratio, calculated using molar concentrations of ammonium and anions
(=2×[sulfate] + [nitrate]) measured by HR-ToF-AMS, is used as an indicator of availability of
acids in our study. The presence of excess ammonium is indicated when the cation-to-anion ratio
is greater than one and the presence of excess acids is indicated when the ratio is less than one.

29
Figure 3.3 (a) Measured fraction of pinonaldehyde in the particle phase as a function of RH (average 5 or 6 points in each bin in Sampling Period I; 12 points in each bin in Sampling Period II). The data were sorted according to the values of RH in ascending order and subsequently by assigning the approximately same number of data points to each interval of seven intervals. The error bar is one standard deviation of the mean. The x-axis value is the average value of RH in each bin. Fractions greater than 3 standard deviations outside of the mean in each sampling period are considered outliers (no outlier in Sampling Period I; 2 outliers in Sampling Period II) and excluded from this plot. (b) Average cation-to-anion ratio of inorganic species (sulfate, nitrate and ammonium) as a function of RH (average 7 points in each bin in Sampling Period I; 27 points in each bin in Sampling Period II).
Particle-phase pinonaldehyde was observed while the cation-to-anion ratio was greater
than one, indicating that the presence of inorganic acids were not required for the formation of
particle-phase pinonaldehyde (Figure 3.4). The excess ammonium observed in particles is
attributed to particle-phase organic acids. Since FTIR measures carboxylic acid as an acid group
(-COOH) (Russell et al., 2009), excess organic acids, unneutralized by ammonium, were
obviously present in particles (Figure 3.4). Our observations of particle-phase pinonaldehyde and
availability of acids are consistent with the results from chamber experiments of α-pinene
30
ozonolysis that oligomers are formed on the neutralized ammonium sulfate particles (Gao et al.,
2004; Tolocka et al., 2004) and that organic acids produced from gas-phase hydrocarbon
oxidation are sufficient to catalyze these heterogeneous reactions (Gao et al., 2004).
Figure 3.4 The temporal change of the cation-to-anion ratio of measured inorganic ions, carboxylic acid group and the fraction of pinonaldehyde in the particle phase. Pinonaldehyde was predominantly observed during the night when the wind blew from vegetated areas located to the east and southeast of the field site. During the day, pinonaldehyde was rarely observed as the wind switched away from the vegetated area. Site description was provided in Liu et al. (2012). Additionally, particle-phase pinonaldehyde was not detected when the total concentration of pinonaldehyde was low.
Laboratory studies have shown that high aerosol acidity leads to the high yield of
oligomers from pinonaldehyde (Liggio and Li, 2006) and oxidation products of α-pinene (Gao et
al., 2004; Tolock et al., 2004). However, the laboratory-observed trend was not displayed by the
relationship between fpart of pinonaldehyde and the organic acid group measured by FTIR
(Figure 3.4). The reason could be that the contribution of organic acids to the aerosol acidity
cannot be directly indicated by their concentration because different organic acids have different
dissociation constants and organic acids and their conjugate base can serve as a buffer solution.
The cation-to-anion ratio of inorganic ions showed a general trend that the high cation-to-anion
ratio was associated with the low fpart of pinonaldehyde (Figure 3.4), but the acidity estimated
based on the cation-to-anion ratio would have large uncertainties when the cation-to-anion ratio
31
is near one (Xue et al., 2011). Moreover, this trend was not observed when other factors affecting
the relationship between aerosol acidity and fpart of pinonaldehyde were considered, such as RH
(Figure 3.3(b)), which can change the composition and mass of SOA (Nguyen et al., 2011) and
the aerosol acidity (Liggio and Li, 2006). As shown in Figure 3.3(a), fpart of pinonaldehyde
displayed a positive dependence on RH in Sampling Period I, consistent with previous TAG
measurements in a forested area (Worton et al., 2011). However, the cation-to-anion ratio
calculated from inorganic ions did not consistently decrease as RH increased (Figure 3.3(b)). As
a result, the effect of aerosol acidity on fpart of pinonaldehyde is not shown by the relationship
between the cation-to-anion ratio and the fpart of pinonaldehyde observed in our study.
In comparison with Sampling Period I, the fpart of pinonaldehyde was generally lower in
Sampling Period II and showed a different dependence on RH (Figures 3.3(a) and 3(b)) while
this pattern was not observed for its reference compound, n-tetradecane. In addition, the
difference in the relationship between fpart and RH in the two sampling periods is supported by
independent measurements of the cation-to-anion ratio which also exhibited a different
relationship to RH in the two sampling periods (Figure 3.3(b)). Therefore, the observed
difference between fpart of pinonaldehyde on RH in the two sampling periods represents the real
relationship between them in the atmosphere. The high fpart of pinonaldehyde was not observed
at the elevated RH in Sampling Period II, although the particle-phase concentration of
pinonaldehyde was observed to increase as RH increased. The relationships between RH and fpart
of pinonaldehyde suggest that RH favors the formation of particle-phase pinonaldehyde in the
atmosphere, but it is not the main factor affecting the formation of particle-phase pinonaldehyde.
32
Further studies are needed to examine the effect of RH on the yield of particle-phase
pinonaldehyde in the atmosphere and the laboratory.
3.3.2. Phthalic acid
The mean fpart of phthalic acid was 60 ± 20%, substantially higher than that of its
reference compound, n-nonadecane (Figure 3.2). To reproduce the mean fpart for phthalic acid
using gas/particle partitioning theory, a substantially lower activity coefficient (~5×10⁻³
) than the
estimated range from 0.3 to 3 for SOA in the atmosphere (Seinfeld and Pankow, 2003) would be
needed. The partitioning of phthalic acid into aerosol water cannot explain the mean fpart for
phthalic acid, based on its Henry's law constant of 2.0×10⁻¹¹
atm m3 mole
-1 (USEPA EPI suite)
and the assumptions that the ratio of aerosol water content to the dry aerosol mass is one and all
aerosol water is available to take up phthalic acid. The dissociation of phthalic acid was also
considered, but the contribution due to its dissociation to its mean fpart was negligible even when
pH was estimated by neutralized inorganic ions without inclusion of other organic acids.
Moreover, the aerosol water content is unlikely to be that high at the average RH of 34% in the
atmosphere (Khlystov et al., 2005; Schuster et al., 2009; Engelhart et al., 2011). Therefore, there
must be at least an additional partitioning pathway whereby particle-phase phthalic acid is
formed.
We infer that a likely pathway for phthalic acid partitioning to particles is through its
reaction with gas-phase ammonia. This is supported by the presence of excess ammonium in the
particle phase as indicated by the consistently greater than one cation-to-anion ratio of inorganic

33
species measured by HR-ToF-AMS (Figure 3.4). Evidence for reactions between organic acids
and gas-phase ammonia is provided by Na et al. (2007), whose results showed that ammonia
dramatically increased SOA yields by reactions with organic acids in chamber experiments.
Furthermore, the positive correlation between gas-phase ammonia and fpart of phthalic acid
(linear regression R2=0.8 between average fpart and the ammonia concentration) supports the
hypothesis that phthalic acid partitioning to particles is through reactions with gas-phase
ammonia (Figure 3.5).
Reactions with ammonia can convert phthalic acid into ammonium salts with low vapor
pressures and subsequently favor its partitioning into particles. Subcooled vapor pressures of the
formed salts can be more than 100 times lower than that of phthalic acid, even if just the
monoammonium salt were formed (the subcooled vapor pressure drop is estimated based on the
vapor pressure drop of organic acids after forming ammonium salt from USEPA EPI suite).
Additional support needed for the presence of phthalic acid ammonium salts is that these salts
can be measured as phthalic acid by the TAG instrument using a thermal desorption technique to
extract collected organics. This support is given in Hajek et al. (1971) wherein the investigation
of the thermal decomposition of ammonium salt of isophthalic acid shows that simultaneous
release of both ammonia and isophthalic acid molecules from diammonium salts occurs without
dehydration or amide formation.

34
Figure 3.5 Fraction of phthalic acid in the particle phase as a function of the concentration of gas-phase ammonia. Each bin of seven total bins has 18 data points. The way binning the data is same as the one described in Figure 3.3.
3.3.3. 6, 10, 14-trimethyl-2-pentadecanone
The mean fpart of 6, 10, 14-trimethylpentadecanone was 4 ± 2 %, similar to that of its
reference compound (n-heptadecane), suggesting that there is no reactive uptake of it on particles
during the campaign contrary to the observations of pinonaldehyde and phthalic acid. These
results are in agreement with previous studies on the gas/particle partitioning of ketones (Esteve
and Noziere, 2005; Kroll et al., 2005). Esteve and Noziere (2005) suggested that aldol
condensation was too slow to contribute significantly to SOA under atmospheric conditions.
Kroll et al. (2005) showed that ketones did not produce observable volume growth in the
presence of acidic seeds even with concentrations of more than 500 ppb. Other measured
compounds with a ketone functional group in our study, such as benzophenone and 1-
hydroxycyclohexy- phenyl methanone, were also present primarily in the gas phase.
1.0
0.8
0.6
0.4
0.2
Fra
ction
of
ph
thalic
acid
in t
he p
art
icle
ph
ase
40353025201510
Gas-phase Ammonia (ppbv)
R2=0.8

35
3.4 Conclusions and Implications
In-situ measurements of both gas- and particle-phase organic compounds have clearly
shown that multiple gas/particle partitioning pathways occur in the atmosphere and the
contribution of oxygenated compounds to SOA can be substantially increased through other
gas/particle partitioning pathways relative to absorptive gas/particle partitioning. Our results
indicate that the occurrence of reactive uptake of pinonaldehyde into particles does not require
the availability of inorganic acids and subsequently imply that this pathway is likely widespread.
However, the pathway of formation of condensable salts indicated by our observations of the
gas/particle partitioning of phthalic acid could be only significant in ammonia-rich environments.
Additionally, a poor correlation (r=0.2) was found for fpart between pinonaldehyde and phthalic
acid. Further in-situ, time-resolved measurements of gas/particle partitioning covering more
oxygenated organic compounds are needed to investigate SOA formation in various
environments and provide parameterization for inclusion of these pathways into SOA models.
Since our results show that each of three SOA tracers investigated here has distinct pathways to
partition to particles, multiple tracers are needed in source apportionment models to adequately
represent SOA formation. Additionally, these tracers are present in both gas and particle phases.
As a result, it raises a concern about the accuracy of the source apportionment models using
these SOA tracers without correcting for gas adsorption on the sampling substrates.
These SOA tracers, whose gas/particle partitioning pathways have been identified here,
were included in PMF analysis to investigate the relative importance of each SOA formation
pathway in the atmosphere and consequently to suggest effective control measures to reduce OA

36
concentrations through reductions in SOA concentrations. Detailed discussions of the major
components of OA and SOA formation pathways are provided in Chapter 4.

37
4. Major Components of Summertime Organic Aerosol in
Bakersfield, CA
4.1 Introduction
Organic compounds constitute a major mass fraction (20-90%) of atmospheric fine
particulate matter in most environments (Kanakidou et al., 2005). These organic compounds
have been categorized into either primary organic aerosol (POA), directly emitted from various
primary sources such as food cooking and vehicle exhausts (e.g. Schauer et al. 1999a, b, 2002a),
or secondary organic aerosol (SOA), formed in the atmosphere through physical and chemical
transformations (Odum et al., 1997; Jang et al., 2002; Robinson et al., 2007; Kroll and Seinfeld,
2008). The majority of organic aerosol (OA) in both rural and urban areas is secondary (Zhang et
al., 2007; Shrivastava et al., 2007; Williams et al., 2010; Jimenez et al., 2009). Therefore,
identifying major components of OA has important implications for air quality regulation.
Quantification and characterization of OA can be made with a wide range of analytical
techniques, such as gas chromatography-mass spectrometry (GC-MS), Fourier transform infrared
spectroscopy, Aerodyne Aerosol Mass Spectrometry (AMS), and so on, with chemical resolution
spanning from individual organic compounds to functional groups to the carbon content and
characterization completeness ranges from less than 20% to 100% (e.g., Turpin et al., 2000;
Hallquist et al., 2009). None of these techniques is able to directly determine the amount of POA
and SOA or the contributions of various sources to OA, but they provide complementary aerosol
chemical composition information that can be analyzed to identify sources and their
contributions to OA through statistical analyses and knowledge of source chemical signature and
atmospheric transformation pathways.
38
Source apportionment between POA and SOA has generally been done on the basis of
chemical analyses through one of three ways: (i) bulk organic spectra measured by the
Aerodyne Aerosol Mass Spectrometer (e.g., Jimenez et al., 2009; Zhang et al., 2011), (ii)
thermal-optical elemental carbon/organic carbon analyzer (e.g., Turpin et al., 1991; Strader et al.,
1999), and (iii) molecular speciation measured by gas chromatograph/mass spectrometer
(GC/MS) (e.g., Shrivastava et al., 2007; Williams et al., 2010). Bulk analyses of OA provided by
optical-thermal elemental carbon (EC) and organic carbon (OC) analyzer or by AMS are
particular useful for the split of POA and SOA (e.g., Yu et al., 2007; Zhang et al., 2007), but are
not sufficient to conduct source apportionment of POA or SOA to specific sources or processes.
Generally, EC tracer-based analysis assumes any organics leading to a higher OC/EC ratio than
that in primary emissions must be SOA (Gray et al.,1986; Turpin et al., 1991; Strader et al.,
1999; Yu et al., 2007). PMF analysis of mass spectra produced by AMS is now routinely used to
separate several components of OA, including hydrocarbon-like OA, low-volatility oxygenated
OA, semi-volatile oxygenated OA, with POA assumed to consist of hydrocarbon-like OA and
SOA generally assumed to be represented by the sum of OOA (Ulbrich et al., 2009; Jimenez et
al., 2009; Zhang et al., 2011); however, these components of OA cannot be traced to specific
sources or processes without further information. In comparison with bulk organic analysis,
measurements of organic speciation made with GC-MS generally resolve less than 20% of the
OA mass (Hallquist et al., 2009; Williams et al., 2006), but some identified organic compounds
can serve as molecular markers which are unique to specific OA sources, such as levoglucosan
for wood combustion and phthalic acid for SOA (e.g., Schauer et al., 1996). Moreover, SOA
tracers can provide information for understanding the chemical formation and transformation
mechanisms leading to SOA (e.g., Kleindienst et al., 2007; Williams et al., 2010). Two common
39
source apportionment methods using organic compounds are the chemical mass balance (CMB)
and positive matrix factorization (PMF) models (e.g., Schauer et al., 1996; Shrivastava et al.,
2007; Williams et al., 2010).
The CMB model uses organic compounds to estimate OA contributions from a variety of
sources, such as biomass burning, meat cooking, or diesel vehicle emissions, but requires a
priori knowledge of their source profiles as inputs to solve the model (Schauer et al., 1996;
Schauer and Cass, 2000; Zheng et al., 2002). As a result, CMB analysis is sensitive to the
provided source profiles (Robinson et al., 2006; Subramanian et al., 2007). The products and
SOA yields measured for a few known volatile organic compounds (VOCs) oxidized in chamber
experiments have been considered as source profiles of SOA (Kleindienst et al., 2007; Stone et
al., 2009). However, the relevance of these source profiles is limited to these known compounds
and the specific experimental conditions used in the chamber to derive the profiles. Source
profiles for SOA are difficult to establish due to the complexity of oxidation processes and the
wide range of precursors and atmospheric conditions, so CMB models have typically been
unable to provide adequate constraints on the SOA mass or composition. Though SOA mass can
be estimated by CMB models as the difference between apportioned OA and measured OA, they
do not provide detailed information about SOA sources (Schauer et al., 1996; Zheng et al., 2002;
Subramanian et al., 2007).
The PMF model uses covariance between organic compounds to categorize them into
unique groups or factors that could represent emissions from contemporaneous source or
formation processes (Shrivastava et al., 2007; Zhang et al., 2009; Williams et al., 2010). Since a

40
priori knowledge of source profiles is not required, factors likely representing poorly
constrained or unknown sources, such as SOA, can be determined. Characterization of these
factors based on their compositions and temporal variations therefore provide an effective tool
for differentiating complex sources (Shrivastava et al., 2007; Zhang et al., 2009; Williams et al.,
2010). Past work has demonstrated the ability of this method to separate multiple SOA types
with distinct diurnal patterns in the absence of known source profiles (Williams et al., 2010).
Despite its utility for source apportionment, PMF analysis is not widely performed on organic
compounds in the particle phase because it typically requires a larger number of samples which
poses significant challenges when measurements of speciated OA are mainly made by filter
sampling with 24-hour collection periods in the field followed by solvent extraction in the
laboratory for analysis (Jaeckels et al., 2007; Shrivastava et al., 2007). Recently, speciated
measurements of OA have been facilitated by the development of an in-situ Thermal desorption
Aerosol Gas chromatography instrument (TAG) which provides hourly time-resolved chemical
speciation of OA (Williams et al., 2006). As a result of the hourly time resolution, the TAG
provides as many data points in a few weeks of measurements as solvent extracted filters are able
to in a year, thus enabling multivariate statistical analyses. TAG data have been analyzed by
PMF in previous work to resolve nine different types of OA in an urban environment, including
various SOA and POA sources (Williams et al., 2010). In this work, we focus on measurements
from a field site in Bakersfield, CA, one of two supersites established for the CALifornia at the
NEXus between Air Quality and Climate Change (CalNex) campaign in June 2010. Previous
studies of source contributions to OA in the Bakersfield area were based on the EC-tracer
method and CMB and focused on OA in winter (Magliano et al., 1999; Strader et al., 1999;
Schauer et al., 2000). Neither the EC-tracer method nor CMB were able to provide insights into
41
different SOA types. Moreover, the primary sources of OA and volatile organic compounds and
the concentrations of oxidants in the atmosphere would vary significantly in different seasons.
These differences can lead to the different chemical composition of OA and require different
control strategies. Recently, results of studies of major OA components and SOA formation in
the Bakersfield area during the CalNex campaign have been reported (Liu et al., 2012; Rollins et
al., 2012). Liu et al. (2012) showed that OA accounted for the majority of the mass of
summertime particulate matter and SOA was the dominant component of OA in the Bakersfield
site. Additionally, Liu et al. (2012) suggested that the majority of SOA was likely formed
through gas-to-particle condensation of oxidation products of VOCs. Rollins et al. (2012)
reported that organic nitrate aerosol accounted for 1/3 of nighttime increase of OA and suggested
that reductions in NOx emissions can reduce OA concentrations. In this study, we take a different
approach to investigate source contributions to OA and atmospheric processes to form SOA
using a wide range of organic tracers. Compared with bulk organic mass spectra (Liu et al. 2012)
and organic nitrates (Rollins et al. 2012), these organic tracers provide unique information for
both OA sources and SOA formation pathways. For example, Zhao et al. (2013) has shown that
multiple gas-to-particle partitioning pathways contributed to SOA formation in the Bakersfield
area by examining the measured gas/particle partitioning of known SOA tracers (Chapter 3). By
performing PMF analysis on organic compounds measured by the TAG during the CalNex field
campaign, distinct factors have been extracted, which are associated with specific source types
and atmospheric processes based on measured organic compounds, including both primary and
secondary organic tracers, in the context of an urban area and regional agricultural, natural, and
industrial sources.
42
4.2 Methods
4.2.1 Sampling and Chemical Analysis
Speciated measurements of particle-phase organics were made with the TAG instrument
during the CalNex field campaign from May 31st to June 27
th 2010 at the Bakersfield supersite,
CA. A description of TAG was provided in Chapter 3. Briefly, the TAG was updated by addition
of a denuder into the sampling inlet, as a parallel sampling line to a bypass line made of stainless
tubing, so that the gas-phase organics can be efficiently removed by this denuder in the upstream
of the collection cell while the ambient air is sampled through the denuder. The denuder
separates gases from particles on the basis of the difference in their diffusion coefficients.
Because gas-phase organics, present as molecules, have much larger diffusion coefficients than
particles, gas-phase organics tend to diffuse to the wall and be collected while particles tend to
pass through the denuder. As a result, the particle-phase organics can be measured with minimal
sampling artifacts due to the adsorption of gas-phase organics on the surface of the collection
cell.
During sampling, ambient air was pulled at 10 L/min through a PM2.5 cyclone from the
center of a main sampling flow of 200 L/min drawn from ~5 meters above the ground through a
6-inch i.d. rigid duct and gas- and particle-phase organics were collected by an impactor. The
sampling flow was alternated between the denuder line to collect only particle-phase organics,
and the bypass line to collect total organics, the sum of gas- and particle-phase organics.
Following sampling, the collected organics were thermally desorbed and injected into a gas
chromatograph-mass spectrometer (GC/MS) for analysis. Identification and quantification were
achieved using a quadrupole mass spectrometer (Agilent, 5973) calibrated to authentic standards
that were manually injected into the impactor cell at regular intervals (twice per day) throughout
43
the campaign (Kreisberg et al., 2009). During this campaign, TAG measurements were made in
two periods wherein the sampling durations were different. The duration of each sample was 90
minutes from May 31st to June 9
th (Sampling Period I) and 30 minutes from June 10
th to 27
th
(Sampling Period II). Longer sampling time in Sampling Period I was used to collect a large
amount of organics to facilitate looking for organic molecular tracers for major OA sources. As
concentrations of organic molecular tracers measured in Sampling Period I, especially tracers for
SOA, were higher than their detection limits, the sampling time was reduced in order to better
capture temporal variability in concentrations of organic species. Over the 27-days of
measurements, 244 samples of speciated OA were acquired and over 100 particle-phase organic
compounds were identified and quantified.
Supporting measurements conducted concurrently that are relevant to data analysis and
discussion in this study included detailed characterization of meteorological conditions, OA, and
volatile organic compounds (VOCs). Wind speed and direction were monitored by a propeller
wind monitor (R.M. Young, 5130). Details on measurements of submicron OA made with an
Aerodyne High-Resolution Time-of-Flight Aerosol Mass Spectrometer (HR-ToF-AMS) are
provided in Liu et al., (2012). Gas-phase VOCs were measured by an automated in-situ GC-
FID/MS system (Gentner et al., 2012). In addition, ozone was measured using a UV photometric
ozone analyzer (Dasibi Inc., model 1008 RS).
4.2.2 PMF Procedures
The positive matrix factorization (PMF) model describes observed concentrations of
organic species as the linear combination of the contributions from a number of sources with
44
constant chemical compositional profiles (Paatero and Tapper, 1993; Hopke, 2003; Reff et al.,
2007; Ulbrich et al., 2009):
ijpj
p
ipij efgx +=∑ (4.1)
where xij is the concentration of species j measured in sample i, gip is the contribution of factor p
to sample i, fpj is the concentration of species j in factor p and eij is the residual not fit by the
model. PMF solves the equations for gip and fpj to best reproduce xij without a priori knowledge
of them based on the selected number of factors (p). The solution to PMF minimizes the object
function, Q, defined as:
2
11
)(∑∑==
=m
j ij
ijn
i s
eQ (4.2)
where sij is the estimated uncertainty of species j measured in sample i.
As the PMF model allows each data point to be individually weighted, the uncertainties
associated with organic compounds at different concentration levels are estimated separately. By
estimating the uncertainty using this approach, missing data points can be weighted, so
compounds or days with many missing points do not need to be removed. This approach
provides an advantage over many other methods by achieving longer timelines of observations
(Pollissar et al., 1998). In our study, data points, which were not detected because of low
concentration, were assigned a concentration of one third of the compound detection limit, and
uncertainty was assigned to be four times its concentration, similar to the estimation made in
Polissar et al. (1998) to downweight the data points with assigned concentrations (the value of
concentrations assigned to the missing points of each compound is constant). Mass
concentrations of each factor are calculated by a multivariate fit of TAG PMF factors onto total
45
AMS measured OA mass concentrations (Reff et al., 2007; Williams et al., 2010), instead of
using the sum of the mass of compounds in each factor. As a result, the actual value assigned to
missing data points is not significant in our study. We have used one third of the compound
detection limit. The uncertainty for the measured data point was estimated using the same
equations described in Williams et al. (2010). In contrast to that work, however, the detection
limit of each compound was used in the current study to better account for the instrument noise,
instead of instrument precision derived from the standard deviation of the difference between
consecutive data points used in Williams et al. (2010).
Because PMF analysis categorizes organic species into different factors on the basis of
their temporal covariance, the factors extracted by PMF analysis are groups of compounds that
temporally co-vary. To be associated with specific sources, atmospheric processes and
properties, the variability in concentrations of these compounds is assumed to be solely caused
by emissions of sources or atmospheric processes. As a result, to better explain the variability in
concentrations of OA and explore the major components of OA, the organic compounds included
in PMF analysis should be present in the particle phase. In Appendix A, we demonstrated that
the inclusion of gas-phase contributions to semi-volatile organic compounds (SVOCs)
significantly bias the results of source apportionment of OA if the adsorption of gas-phase
organic on the sampling substrates were not corrected. The criteria we used for inclusion of a
compound in the PMF analysis were that the timeline of the compound's observations covered
the entire period of TAG measurements, the compounds were in the particle phase, and the
percentage of above detection limit data points was greater than 50% over the full timeline of
observations. As a result, 30 compounds (listed in Figure 4.1) in 244 samples were included in
46
the PMF analysis. PMF was applied using the Igor based PMF Evaluation Panel v2.04 (Ulbrich
et al., 2009).
Detailed discussions of determining the optimum number of PMF factors can be found in
the literature of Reff et al. (2007), Ulbrich et al. (2009), and Williams et al. (2010), and
interpretability (being able to associate with distinct OA sources, atmospheric processes and
properties) of these factors is an important criterion in conducting PMF analysis. In our study,
the linkage between factors and specific OA source types or atmospheric processes was initially
made based on the existing knowledge of specific sources of individual compounds in each
factor and was further corroborated by their diurnal profiles and supporting measurements, such
as VOCs and meteorological conditions.
Although the sum of concentrations of all 30 species included in PMF analysis accounts
for only a small fraction of OA concentrations measured by AMS, the mass contribution of each
factor to measured OA can be calculated by a multivariate fit of the temporal contributions of
PMF factors onto total OA mass concentrations measured by AMS (Reff et al., 2007; Williams
et al., 2010). TAG measurements were PM2.5 while AMS measurements were PM1. PM1 OA
accounted for 75% of the organic mass in PM2.5 during this field campaign (Liu et al., 2012).
The sum of these calculated mass contributions are defined as reconstructed OA. The regression
coefficients for factors provide an additional constraint on the number of factors to be included
in the PMF analysis, because negative regression coefficients are a good indication that the
number of factors exceeds the optimum (Reff et al., 2007).
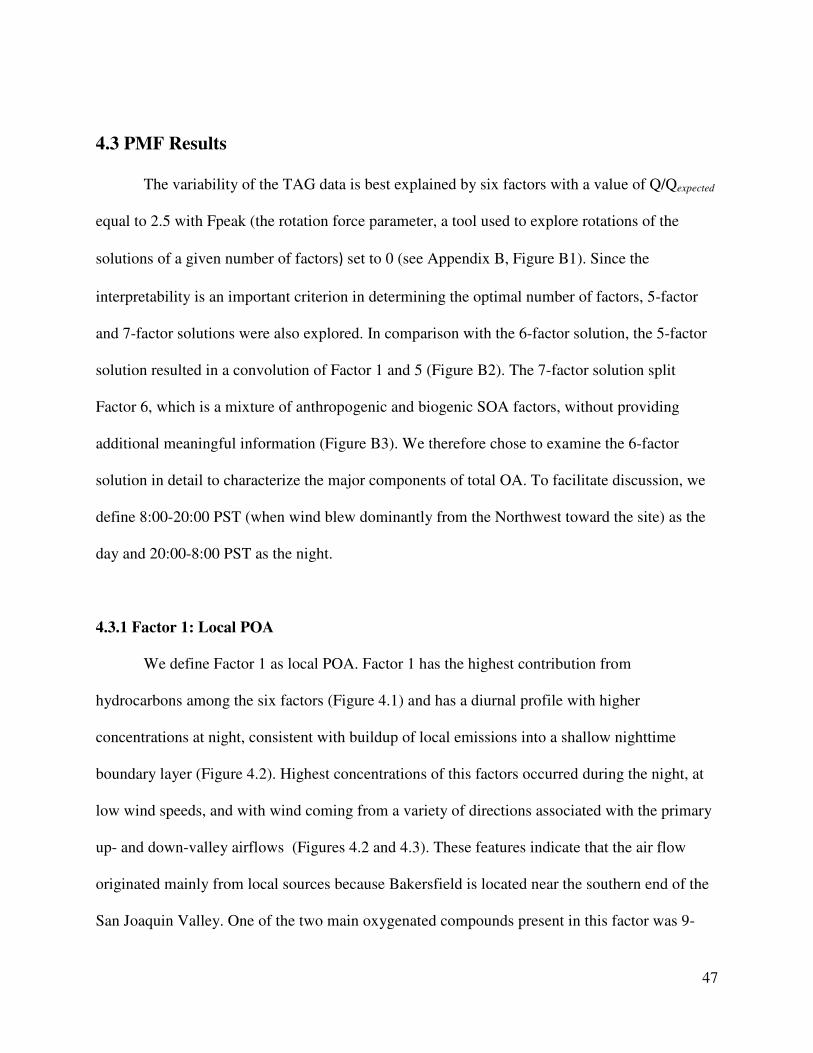
47
4.3 PMF Results
The variability of the TAG data is best explained by six factors with a value of Q/Qexpected
equal to 2.5 with Fpeak (the rotation force parameter, a tool used to explore rotations of the
solutions of a given number of factors) set to 0 (see Appendix B, Figure B1). Since the
interpretability is an important criterion in determining the optimal number of factors, 5-factor
and 7-factor solutions were also explored. In comparison with the 6-factor solution, the 5-factor
solution resulted in a convolution of Factor 1 and 5 (Figure B2). The 7-factor solution split
Factor 6, which is a mixture of anthropogenic and biogenic SOA factors, without providing
additional meaningful information (Figure B3). We therefore chose to examine the 6-factor
solution in detail to characterize the major components of total OA. To facilitate discussion, we
define 8:00-20:00 PST (when wind blew dominantly from the Northwest toward the site) as the
day and 20:00-8:00 PST as the night.
4.3.1 Factor 1: Local POA
We define Factor 1 as local POA. Factor 1 has the highest contribution from
hydrocarbons among the six factors (Figure 4.1) and has a diurnal profile with higher
concentrations at night, consistent with buildup of local emissions into a shallow nighttime
boundary layer (Figure 4.2). Highest concentrations of this factors occurred during the night, at
low wind speeds, and with wind coming from a variety of directions associated with the primary
up- and down-valley airflows (Figures 4.2 and 4.3). These features indicate that the air flow
originated mainly from local sources because Bakersfield is located near the southern end of the
San Joaquin Valley. One of the two main oxygenated compounds present in this factor was 9-

48
fluorenone, which has been identified as a primary emission from motor vehicles (Schauer et al.,
1999). The other prominent oxygenated compound present in this factor was phthalic acid.
Phthalic acid is produced from oxidation of naphthalene and has been used as a tracer for
anthropogenic SOA (Schauer et al., 2002b; Fine et al., 2004; Shrivastava et al., 2007), but its
average concentration in this factor accounts for less than 1% of its total measured concentration
so we consider this a very minor contribution of SOA adding to this POA dominated factor. The
major known POA sources previously reported in Bakersfield were wood burning, meat cooking
and motor vehicles (Schauer et al., 2000) and the average contribution of unknown POA sources
to OA was small (~10%) (Schauer et al., 2000; Strader et al., 1999). Detected tracers for primary
emissions in our study were hopanes for motor vehicles and retene for biomass burning (Schauer
et al., 1996; 2002; Schauer and Cass, 2000). These tracers were not included in PMF analysis
because over 50% of the time they were below the detection limit in denuded samples.
Concentrations of POA didn't correlate well with those of hopanes. Retene was only observed in
a few samples. The major sources of POA were not well-constrained by their measured tracers.
The reason could be that the contribution of POA to total OA is much smaller than SOA. More
information is provided in the Section 4.5 Source Contributions to OA Mass.
49
Figure 4.1 PMF factor profiles. Compounds are generally grouped into hydrocarbons and oxygenated organic compounds.
0.18
0.09
0.00
He
xa
de
ca
ne
He
pta
de
ca
ne
Octa
de
ca
ne
No
na
de
ca
ne
Eic
osa
ne
He
ne
ico
sa
ne
Prista
ne
Ph
yta
ne
Ph
en
an
thre
ne
Flu
ora
nth
en
eP
yre
ne
No
nylb
en
ze
ne
Dim
eth
yln
ap
hth
ale
ne
Dim
eth
yln
ap
hth
ale
ne
2(3
H)-
Fu
ran
on
e, 5
-bu
tyd
ihyd
ro2
(3H
)-F
ura
no
ne
, 5
-pe
nty
ldih
yd
roD
ibe
nzo
fura
nB
en
zo
ph
en
on
e9
-Flu
ore
no
ne
Xa
nth
on
e4
-Hyd
roxy-9
-Flu
ore
no
ne
9.1
0-a
nth
race
ne
dio
ne
2-P
en
tad
eca
no
ne
, 6
, 1
0, 1
4-t
rim
eth
yl
2H
-1-B
en
zo
pyra
n-2
-on
eP
ino
na
lde
hyd
eD
ieth
ylp
hth
ala
teB
is(2
-me
thylp
rop
yl)p
hth
ala
teD
ibu
tylp
hth
ala
teP
hth
alic
Acid
Me
thylp
hth
alic
acid
0.100.050.000.120.060.00
0.600.300.00
Co
ntr
ibu
tio
n t
o F
acto
r (e
ach
fa
cto
r p
rofile
su
ms t
o 1
)
0.200.100.000.30
0.15
0.00
Local POA
A mixture ofOA sources
SOA1
SOA2
SOA3
SOA4(Nighttime SOA)

50
Figure 4.2 Plots of diurnal variations in the mass concentration of each factor, wind speed, and the ratio of 1,3,5-TMB to toluene. In the box plots, the center line of each box is the median mass concentration, the top and bottom of the box are 75th and 25th percentiles and the top and bottom whiskers are 90th and 10th percentiles, and the solid square maker is the mean concentration. In diurnal profiles of wind speed and the ratio of 1,3,5-TMB to toluene, the mean value is plotted with ± one standard deviation.

51
Figure 4.3 Wind rose plots for six PMF factors using only concentrations larger than the mean concentration in each factor to emphasize the major contributing source directions. The direction from which the wind blows is shown in degrees with 0 (360) as north, 90 as east, 180 as south and 270 as west. The relative concentration level is indicated by different colors: yellow > blue > green > red. The frequency of observations is represented by the length of each wedge.

52
4.3.2 Factor 2: A mixture of OA sources
We define Factor 2 as a mixture of OA sources with contributions from both POA and
SOA. While hydrocarbons accounted for a significant fraction of this factor, relative to local
POA there was a smaller fraction of each PAH and a larger fraction of each phthalate (Figure
4.1). Additionally, an SOA tracer, 6, 10, 14-methyl-2-pentadecanone (Shrivastava et al., 2007),
apparently contributed to this factor, relative to Factor #1 (POA), which did not exhibit this
tracer. The composition of this factor suggests that it was composed of a variety of different
sources and atmospheric chemical processes. The large variation in the concentrations of Factor
#2 in alternating intervals of its 2-hr diurnal profile is caused by very different concentrations
observed during two sampling periods. The concentrations in Sampling Period I (when the
sampling time was 90 minutes) were higher than those in Sampling Period II (when the sampling
time was 30 minutes and were plotted in every other sampling interval). As shown in Figure B4,
the concentrations of Factor 1 (POA) also displayed differences between the two sampling
periods and were smaller in Sampling Period I than those in Sampling Period II. Therefore, the
higher concentrations of Factor 2 in Sampling Period I could be ascribed to inclusion of more
inseparable POA components. Because strong agreement was found between factors extracted
from TAG and AMS data (see section Formation Pathways of SOA), we infer that the lower
amount of POA resolved from Factor 2 in Sampling Period I better represents the real
atmospheric conditions. The diurnal profile for the concentration of this factor was examined
separately for each sampling period, but neither period had a clear diurnal cycle, suggesting
again that this factor is mostly likely a mixture of OA sources.
53
4.3.3 Factor 3: SOA1
We define Factor 3 as SOA1. The contribution of organic species to this factor was
dominated by oxygenated compounds (Figure 4.1). Methyl phthalic acid has been used as a
tracer for anthropogenic SOA (Fine et al., 2004; Williams et al., 2010) and 9,10-anthraquinone
has been observed as oxidation products of PAHs (Helmig et al., 1992; Helmig and Harger,
1994). The elevated concentration of this factor during 20:00-24:00 PST (Figure 4.2) is
attributed to the low wind speed and low temperature, which favors the accumulation of gas-
phase oxygenated compounds in the afternoon and subsequent condensation of them onto
particles to contribute to SOA. These condensable oxygenated compounds can be formed locally,
and probably include some organic nitrates (Rollins et al., 2012), and can also be produced
upwind and transported to the site during the afternoon along with SOA3 (discussed below).
4.3.4 Factor 4: SOA2
We define Factor 4 as SOA2. This factor was overwhelmingly dominated by two SOA
tracers, phthalic acid and methyl-phthalic acid, though other compounds, both hydrocarbons and
oxygenated compounds, were present but with negligible contributions (Figure 4.1). Evidence
that this factor was associated with photochemically produced SOA is apparent when comparing
the diurnal profile of this factor with that of the ratio of 1,3,5-trimenthylbenzene (TMB) to
toluene. Because both 1,3,5-TMB and toluene have similar source types in Bakersfield (Gentner
et al., 2012) and1,3,5-TMB reacts faster with OH radicals than toluene does (Atkinson and
Arey, 2003), a smaller ratio of 1,3,5-TMB to toluene indicates that the air mass is more oxidized.
An opposite trend between the average diurnal profile of this factor and that of the ratio of 1,3,5-
TMB to toluene clearly shows that higher concentrations of this factor occurred when gas-phase

54
organics were more oxidized (Figure 4.2). The highest concentration of this factor occurred in
the morning (8:00-9:00 PST) when the wind speed was low (Figure 4.2), indicating that this
SOA was formed locally.
4.3.5 Factor 5: SOA3
We define Factor 5 as SOA3. This factor had the highest concentrations in the afternoon
(Figure 4.2) and correlated with ozone (r=0.62). The dominant contribution of organic species to
this factor was from oxygenated compounds (Figure 4.1). However, the diurnal patterns of the
ratio of 1,3,5-TMB to toluene did not correlate well with this factor, especially in the afternoon
(Figure 4.2). The afternoon ratio of 1,3,5-TMB to toluene was close to the nighttime ratio,
indicating that observed VOCs were fresh and emitted locally without having undergone
significant oxidation. Therefore, we infer that SOA in this factor was not formed through local
VOC oxidation, but instead was composed primarily of regionally formed, transported SOA.
This inference is supported by relatively high wind speeds (from the northwest) during the
observations of high concentrations of this factor (Figure 4.3) would carry regional source
contributions to the observation site, but would dilute local source contributions.
4.3.6 Factor 6: SOA4 (Nighttime SOA )
We define Factor 6 as nighttime SOA (SOA4). This factor had the highest concentrations
at night with the dominant contribution from SOA tracers phthalic acid, methyl phthalic acid, 6,
10, 14-methyl-2-pentadecanone and pinonaldehyde. Pinonaldehyde is a volatile oxidation
product of a biogenic VOC, α-pinene, and can contribute to SOA by forming low vapor pressure
products, such as dimers (Tolocka et al., 2004; Liggio and Li, 2006). The factors controlling
55
gas/particle partitioning of pinonaldehyde at this site has been analyzed in a separate paper (Zhao
et al., 2013). Deconvolution of biogenic and anthropogenic contributions is difficult due to the
co-variation of chemical transformations leading to SOA. However, it is evident that SOA from
biogenic VOC oxidation contributed significantly to SOA4 as the highest concentrations of this
factor were most frequently observed when the wind blew from the vegetated areas (e.g.,
Sequoia National Forest) located to the east of the field site (Figure 4.3).
4.4 Reconstructed OA
Reconstructed OA based on TAG-derived factors was compared with the measured OA
to evaluate the capability of the TAG-derived factors to replicate the variability of OA measured
by AMS. The average concentration of submicron OA measured by AMS was 3.7 ± 1.8 µg m-3
throughout the period of TAG measurements and the average concentration of reconstructed OA
was 3.5 ± 1.6 µg m-3
. Furthermore, good agreement between the reconstructed and measured OA
was demonstrated, with differences between them of less than 20% for over 70% of the
observations (Figure 4.4a). The reconstructed OA had largest uncertainties at the lowest
measured OA concentrations and was generally lower than the measured OA at high measured
OA concentrations. This could be attributed to larger uncertainties related to organic species
when the atmospheric OA concentration was low and lack of inclusion of additional organic
tracers in the current dataset when the atmospheric OA concentration was high (because they
were below detection limit in more than 50% of observations or cannot be measured by TAG).
As shown by Figure 4.4b, high OA concentrations (≥4 µg/m3) were mostly observed most
frequently at night. Organic nitrates have been shown to significantly contribute to nighttime OA
in this region (Rollins et al., 2012). However, no tracers for organic nitrates were identified
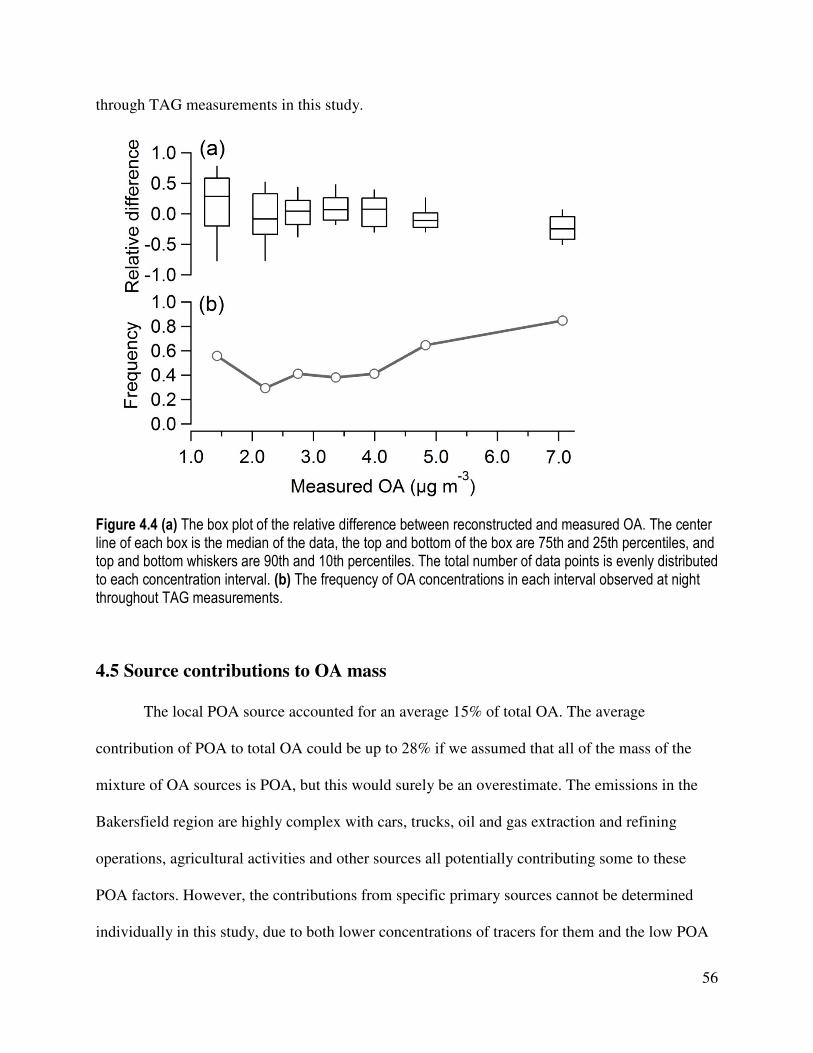
56
through TAG measurements in this study.
Figure 4.4 (a) The box plot of the relative difference between reconstructed and measured OA. The center line of each box is the median of the data, the top and bottom of the box are 75th and 25th percentiles, and top and bottom whiskers are 90th and 10th percentiles. The total number of data points is evenly distributed to each concentration interval. (b) The frequency of OA concentrations in each interval observed at night throughout TAG measurements.
4.5 Source contributions to OA mass
The local POA source accounted for an average 15% of total OA. The average
contribution of POA to total OA could be up to 28% if we assumed that all of the mass of the
mixture of OA sources is POA, but this would surely be an overestimate. The emissions in the
Bakersfield region are highly complex with cars, trucks, oil and gas extraction and refining
operations, agricultural activities and other sources all potentially contributing some to these
POA factors. However, the contributions from specific primary sources cannot be determined
individually in this study, due to both lower concentrations of tracers for them and the low POA

57
contribution to total OA. PMF analysis cannot reliably separate very small factors among the
noise and variation of the larger factors.
The average contribution of the sum of SOA (SOA1-4) was 72% of total OA and the
contribution of SOA could be up to 85% if the mass in the mixture of OA sources is only
considered to be only SOA. The dominance of SOA in total OA derived from organic species in
this study is consistent with the results reported by Liu et al. (2012) based on PMF analysis of
AMS observations from the same site which showed that 80% to 90% of total OA is accounted
for by SOA. We conclude that efforts to control atmospheric OA in this region must focus on
understanding and then controlling the sources of SOA precursors or factors leading their
transformation into SOA.
We calculated the diurnal cycle of the relative contribution from each identified
component to OA (Figure 4.5; Figure B5) to highlight the dominant components of OA in
different periods of the day and night. The factors contributing the largest fraction of total OA
was different during the day and night, but both of them were SOA. The largest daytime
contribution to total OA was from regional SOA formation (SOA3), and this factor accounted for
~50% of the total OA throughout the day. The nighttime SOA factor (SOA4) accounted for 39%
of total OA at night, but provided only a very small contribution to total OA during the day. The
more local SOA factor (SOA2) also contributed substantially to total OA, accounting for 21% of
the total OA when it reached its highest concentration in the morning (8:00 - 12:00 (PST)). The
smaller local SOA factor (SOA1) accounted for < 10% of total OA during all periods of the day.
Both local and regional SOA (i.e., SOA2 and SOA3) contributed significantly to total OA

58
(12~21% and 40~56%, respectively) during the day. We conclude that control of SOA precursor
emissions on both local and regional scales should reduce the daytime OA concentration, with
the dominant contribution being regional.
Figure 4.5 Mean diurnal mass fraction contribution of each factor to total OA displayed in six different periods. The mass concentrations of each factor in corresponding time intervals are shown in Figure B5.
4.6 Formation Pathways of SOA
Controlling emissions of pollutants involved in the formation pathways of SOA has the
potential to play a significant role in reducing regional OA concentrations (e.g., Liggio and Li,
2006; Na et al., 2007). In areas where biogenic emissions are oxidized in the presence of
anthropogenic pollutants such as SO2, NOx and black carbon, it has become increasingly

59
apparent that SOA formation from biogenic VOC is substantially enhanced (Goldstein et al.,
2009; Surratt et al., 2010; Carlton et al., 2010; Spracklen et al., 2011). Rollins et al. (2012) has
shown that reductions in NOx can reduce the OA concentration in the Bakersfield region because
of the involvement of NOx in formation of organic nitrates. Here we suggest that TAG-derived
factors can be indicative of the dominant formation pathway for each SOA type identified. The
pathways of oxygenated compounds contributing to SOA in each factor can be used to draw a
distinction between direct gas-to-particle condensation wherein oxidation reactions produce low
volatility products that condense, secondary gas-to-particle condensation wherein non-oxidation
reactions produce lower volatility products that condense, such as reactions between carboxylic
acids and ammonia, and reactive uptake wherein compounds expected to be in the gas-phase
enter the particle phase through acid-catalyzed reactions. Evidence for these formation pathways
in Bakersfield during CalNex based on individual compounds – specifically phthalic acid,
pinonaldehyde and 6, 10, 14-trimethyl-2-pentadecanone has been explored and reported by Zhao
et al. (2013). Ketones enter the particle phase primarily through direct gas-to-particle
condensation, while phthalic acid was shown to enter the particle phase mainly through reaction
with ammonia in the gas phase (Zhao et al., 2013). It is likely that SOA1 and SOA3 were formed
at least partially by direct gas-to-particle condensation because the dominant contribution to the
factor profiles of these two factors are from compounds with ketone functional groups. The
factor profile of SOA2 is primarily determined by particle-phase phthalic acid formed through
reactions with gas-phase ammonia, indicating the reactions of carboxylic acids and ammonia
play a significant role in the formation of SOA2. This formation pathway is also supported by
the correlation (r>0.5) between the concentration of SOA2 and the concentration of excess
ammonium calculated using ammonium, sulfate and nitrate measured by AMS. This formation
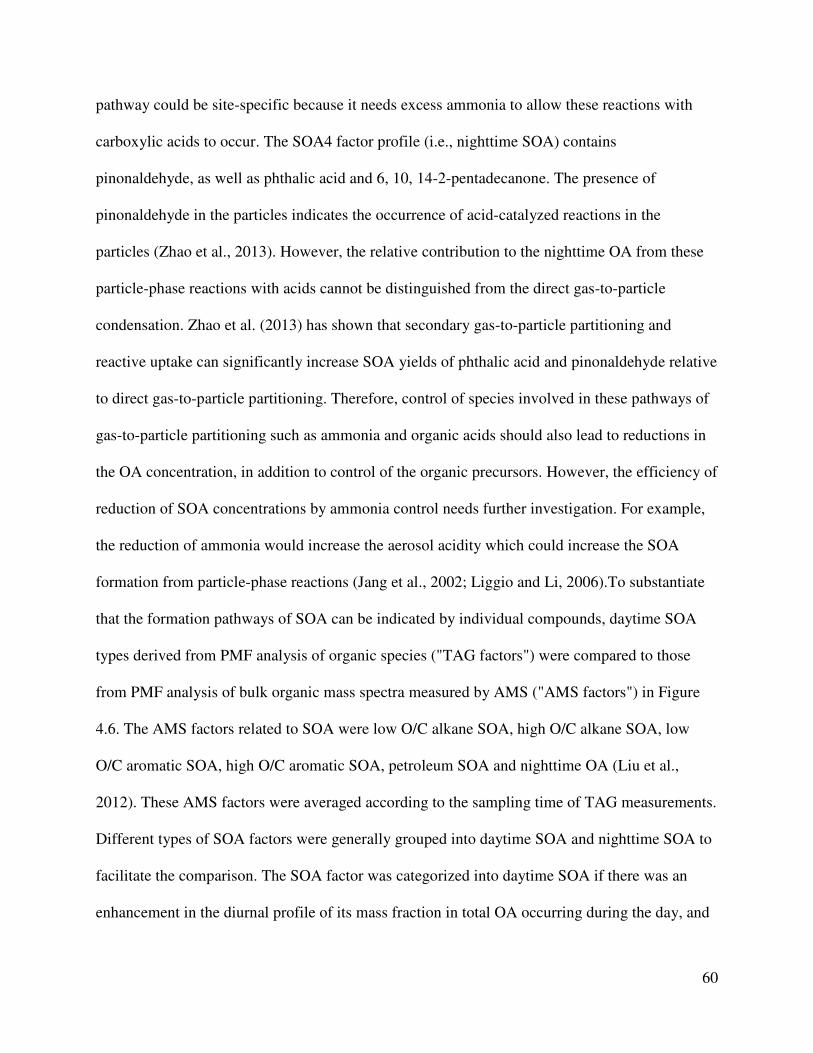
60
pathway could be site-specific because it needs excess ammonia to allow these reactions with
carboxylic acids to occur. The SOA4 factor profile (i.e., nighttime SOA) contains
pinonaldehyde, as well as phthalic acid and 6, 10, 14-2-pentadecanone. The presence of
pinonaldehyde in the particles indicates the occurrence of acid-catalyzed reactions in the
particles (Zhao et al., 2013). However, the relative contribution to the nighttime OA from these
particle-phase reactions with acids cannot be distinguished from the direct gas-to-particle
condensation. Zhao et al. (2013) has shown that secondary gas-to-particle partitioning and
reactive uptake can significantly increase SOA yields of phthalic acid and pinonaldehyde relative
to direct gas-to-particle partitioning. Therefore, control of species involved in these pathways of
gas-to-particle partitioning such as ammonia and organic acids should also lead to reductions in
the OA concentration, in addition to control of the organic precursors. However, the efficiency of
reduction of SOA concentrations by ammonia control needs further investigation. For example,
the reduction of ammonia would increase the aerosol acidity which could increase the SOA
formation from particle-phase reactions (Jang et al., 2002; Liggio and Li, 2006).To substantiate
that the formation pathways of SOA can be indicated by individual compounds, daytime SOA
types derived from PMF analysis of organic species ("TAG factors") were compared to those
from PMF analysis of bulk organic mass spectra measured by AMS ("AMS factors") in Figure
4.6. The AMS factors related to SOA were low O/C alkane SOA, high O/C alkane SOA, low
O/C aromatic SOA, high O/C aromatic SOA, petroleum SOA and nighttime OA (Liu et al.,
2012). These AMS factors were averaged according to the sampling time of TAG measurements.
Different types of SOA factors were generally grouped into daytime SOA and nighttime SOA to
facilitate the comparison. The SOA factor was categorized into daytime SOA if there was an
enhancement in the diurnal profile of its mass fraction in total OA occurring during the day, and

61
was categorized into nighttime SOA if there was an enhancement in the diurnal profile of its
mass fraction in total OA occurring during the night. The diurnal profile of the mass fraction of
each SOA factor was used for selection of daytime and nighttime SOA because the enhancement
in the mass fraction of each SOA factor in total OA indicates that this factor plays a more
significant role in the increase of OA concentrations. As a result, daytime SOA factors were
SOA2 and SOA3 in TAG factors and high O/C alkane, high O/C aromatic and petroleum SOA in
AMS factors in Liu et al. (2012). As evidenced in Figure 4.6a, the diurnal profile of the mass
fraction of TAG daytime SOA (the sum of SOA2 and SOA3) was consistent with that of AMS
daytime SOA (the sum of high O/C alkane, high O/C aromatic and petroleum SOA). Consistency
in the diurnal profile of the mass fraction of nighttime SOA between TAG nighttime SOA (the
sum of SOA1 and SOA4) and AMS nighttime SOA factors (the sum of low O/C alkane SOA and
nighttime OA) is also found in Figure 4.6b. Liu et al. (2012) suggested that nighttime OA in
AMS factors included both SOA and POA signature, but nighttime OA was considered as SOA
for comparison. The remaining factors related to SOA were a mixture of OA sources in TAG
factors and low O/C aromatic SOA in AMS factors. The average mass fraction of a mixture of
OA sources was approximately the same as that of low O/C aromatic SOA. The consistency of
SOA factors between these two studies supports the claim that oxygenated organic compounds
measured by the TAG are able to capture the trend of SOA formation.
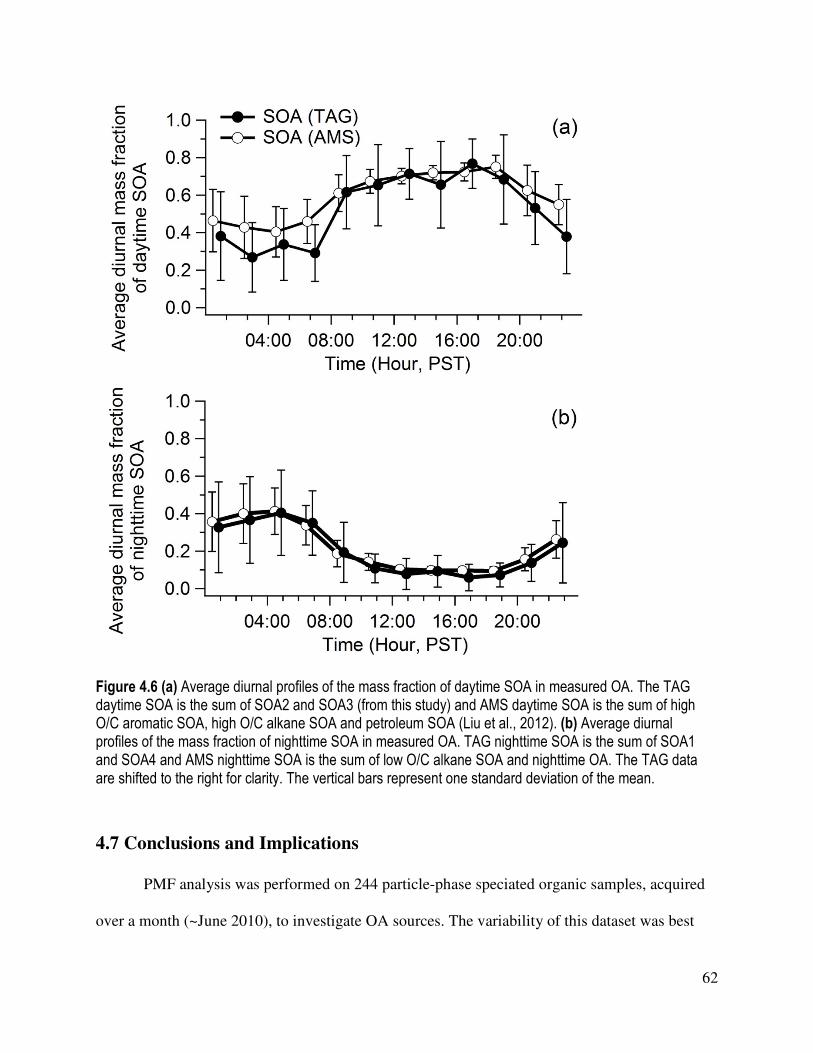
62
Figure 4.6 (a) Average diurnal profiles of the mass fraction of daytime SOA in measured OA. The TAG daytime SOA is the sum of SOA2 and SOA3 (from this study) and AMS daytime SOA is the sum of high O/C aromatic SOA, high O/C alkane SOA and petroleum SOA (Liu et al., 2012). (b) Average diurnal profiles of the mass fraction of nighttime SOA in measured OA. TAG nighttime SOA is the sum of SOA1 and SOA4 and AMS nighttime SOA is the sum of low O/C alkane SOA and nighttime OA. The TAG data are shifted to the right for clarity. The vertical bars represent one standard deviation of the mean.
4.7 Conclusions and Implications
PMF analysis was performed on 244 particle-phase speciated organic samples, acquired
over a month (~June 2010), to investigate OA sources. The variability of this dataset was best
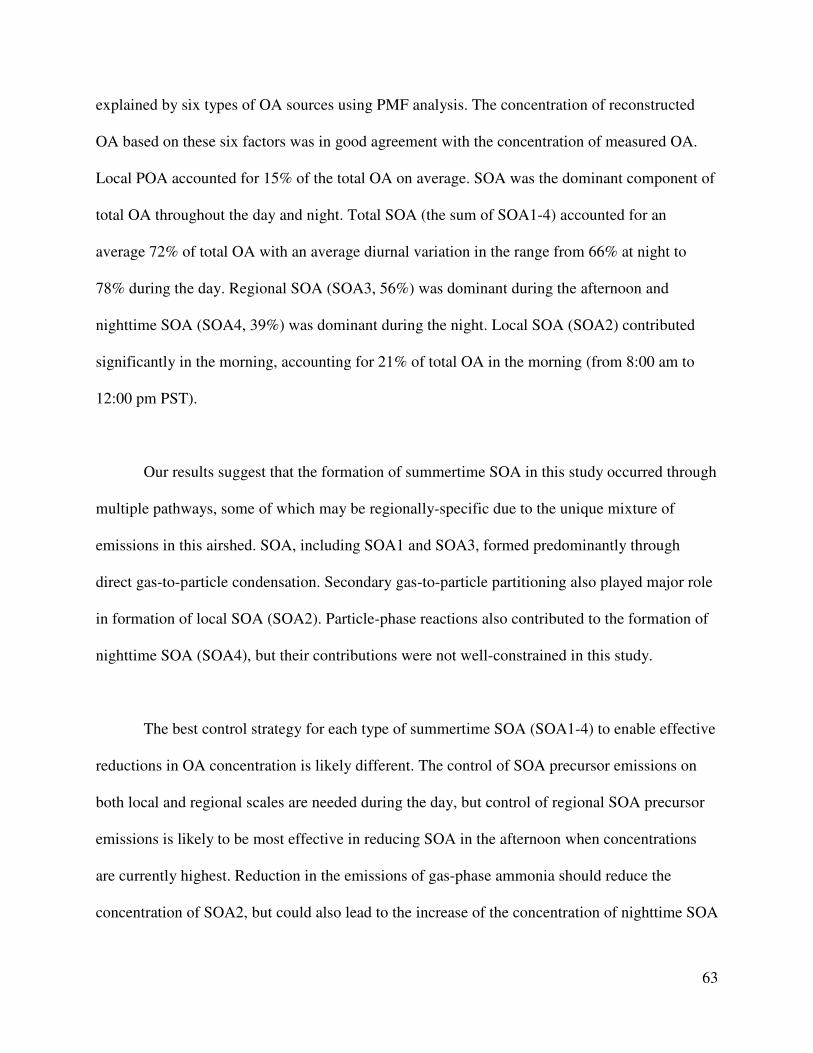
63
explained by six types of OA sources using PMF analysis. The concentration of reconstructed
OA based on these six factors was in good agreement with the concentration of measured OA.
Local POA accounted for 15% of the total OA on average. SOA was the dominant component of
total OA throughout the day and night. Total SOA (the sum of SOA1-4) accounted for an
average 72% of total OA with an average diurnal variation in the range from 66% at night to
78% during the day. Regional SOA (SOA3, 56%) was dominant during the afternoon and
nighttime SOA (SOA4, 39%) was dominant during the night. Local SOA (SOA2) contributed
significantly in the morning, accounting for 21% of total OA in the morning (from 8:00 am to
12:00 pm PST).
Our results suggest that the formation of summertime SOA in this study occurred through
multiple pathways, some of which may be regionally-specific due to the unique mixture of
emissions in this airshed. SOA, including SOA1 and SOA3, formed predominantly through
direct gas-to-particle condensation. Secondary gas-to-particle partitioning also played major role
in formation of local SOA (SOA2). Particle-phase reactions also contributed to the formation of
nighttime SOA (SOA4), but their contributions were not well-constrained in this study.
The best control strategy for each type of summertime SOA (SOA1-4) to enable effective
reductions in OA concentration is likely different. The control of SOA precursor emissions on
both local and regional scales are needed during the day, but control of regional SOA precursor
emissions is likely to be most effective in reducing SOA in the afternoon when concentrations
are currently highest. Reduction in the emissions of gas-phase ammonia should reduce the
concentration of SOA2, but could also lead to the increase of the concentration of nighttime SOA

64
(i.e, SOA4). Further studies are needed to examine the effects on OA concentrations of
controlling gas-phase ammonia. Our observations suggest that biogenic SOA could contribute a
significant fraction of the total OA at night; however, ammonia’s role is not well-constrained.

65
5. Additional Analyses
Additional analyses from both concurrent measurements and subsequent analysis of
collected samples provide further details on the major components of summer-time organic
aerosol in Bakersfield, CA. Citations and abstracts for papers published on this work are listed in
Appendices C-E; the following is a brief summary of these research efforts.
5.1 Aerosol Mass Spectrometry (AMS), Fourier Transform Infrared (FTIR) Spectroscopy
A high-resolution time-of-flight aerosol mass spectrometer was deployed during the
CalNex-Bakersfield study to measure organic matter (OM), sulfate, nitrate, ammonium, and
chloride with approximately 5-minute time resolution. This instrument enables size-resolved
chemical composition measurements of submicron particles. FTIR analysis was conducted on
PM1 and PM2.5 filter samples. Five filter samples were collected per day for the PM 1 samples
representing morning, early afternoon, late afternoon, evening, and nighttime. A single 23-hour
PM2.5 sample was also collected each day. PMF analysis was applied to both AMS and FTIR
measurements with high agreement between the two sets of independently derived factors.
Anthropogenic SOA components formed mainly during daytime and the two largest factors were
identified as aromatic and alkane SOA. Both of these components are associated with vehicular
emission oxidation products and together they constituted 65% of the OM. Alkane SOA was
primarily formed though oxidation by ozone while the aromatic SOA was formed via OH
radical-driven reactions. Two other anthropogenic SOA components include aerosols likely
emitted from local petroleum operations and cooking activities. Petroleum and cooking SOA
accounted for 13% and 7% of the PM1 organic mass, respectively. Nightime SOA was found to
be a mixture of POA and SOA from biogenic emissions and accounted for a relatively small

66
fraction on average (10% of the OM). Overall, this project demonstrated that SOA was formed
from different precursors and oxidants with major contributions from gasoline and diesel fuel
combustion emissions and minor contributions from petroleum operations, food cooking, and
biogenic sources.
5.2 Ultra-High Resolution Mass Spectrometry
Samples collected using a miro-orifice uniform deposition impactor (MOUDI) with 6-
hour time resolution were analyzed using high resolution mass spectrometry (HR-MS) coupled
to a nanospray-desorption/electrospray ionization (nano-DESI) source. The soft ionization
enabled the measurement of the chemical formulas of over 850 unique molecular species. These
compounds ranged in mass from approximately 50-800 Daltons and showed repeating mass units
characteristic of humic like substances (HULIS). Two main groups of compounds were
identified, compounds that contained carbon, hydrogen, and oxygen only and compounds that
also contained nitrogen. More nitrogen containing organic compounds were observed in the
night/early morning samples than in the daytime samples. The CHO compounds were dominant
in the afternoon which suggests a photochemical source for these compounds. A formation
mechanism involving the transformation of carbonyls into imines via reaction with ammonia is
proposed. This mechanism could account for over 50% of the nitrogen-containing compounds.
The results from the above analysis were also compared to SOA samples generated in the
laboratory using diesel and isoprene as precursors under high NOx conditions. The elemental
composition of the samples was compared and the degree of overlap of the laboratory samples
with the ambient samples was calculated. The Bakersfield samples exhibited greater overlap

67
with the diesel SOA than with the isoprene SOA. Comparison with an additional laboratory
sample made using diesel and ammonia as precursors indicated that the addition of ammonia was
necessary to generate many of the nitrogen containing compounds observed in Bakersfield.
Combined, diesel and isoprene overlapped with 70% or less of the ambient particles indicating
that other sources, such as terpenes and gasoline emissions, are also likely important.
68
6.0 SUMMARY AND CONCLUSIONS
A TAG instrument with improved separation of gases and particles through a denuder-
based method was deployed in Bakersfield to measure organic species. As a result of this
improvement, the TAG enables investigation of gas/particle partitioning of organic species and
measurements of particle-phase organic species with minimal sampling artifacts caused by gas
adsorption to the collection cell. The measurements were made from May 31st to June 27
th, 2010
during CalNex. The acquired data set consists of more than 100 compounds including alkanes,
polycyclic aromatic hydrocarbons (PAHs), branched PAHs, acids, furanones, and other
oxygenated compounds, which provided a large set of organic species for the investigation of
SOA formation through a comparison between modeled and measured gas/particle partitioning
and source apportionment of OA through positive matrix factorization (PMF) analysis.
6.1 Gas-to-particle partitioning (SOA formation)
The gas/particle partitioning of phthalic acid, pinonaldehyde and 6, 10, 14-trimethyl-2-
pentadecanone, three known oxidation products of hydrocarbons, was examined to explore the
pathways of gas-to-particle partitioning of organic species whereby SOA is formed. Our results
indicate that absorption into particles is the dominant pathway for 6, 10, 14-trimethyl-2-
pentadecanone to contribute to SOA in the atmosphere. Absorption of gas-phase phthalic acid
into particles can also contribute to observed particle-phase concentrations, but the major
pathway to form particle-phase phthalic acid is likely through reactions with gas-phase ammonia
to form condensable salts. The presence of pinonaldehyde in the particle phase when inorganic
acids were neutralized suggests that strong acids are not required for the reactive uptake of
pinonaldehyde into particles. The observed relationship between the cation-to-anion and the
69
fraction of pinonaldehyde in the particles in our study did not display the effect of aerosol acidity
on the reactive uptake of pinonaldehyde that has been previously reported for laboratory studies.
The relationships between particle-phase pinonaldehyde and RH suggest that aerosol water
content likely plays a significant role in the formation of particle-phase pinonaldehyde, although
it is not the primary one.
6.2 Major source contributions to OA
Six OA sources were identified including a POA source, a mixture of OA sources, and
four types of SOA. The four types of SOA (1-4) displayed distinct diurnal profiles. Three of the
SOA factors (SOA1-3) displayed an enhancement in their contributions to OA at different times
of the day. SOA1 and 2 were mainly local while SOA3 was more regional. The fourth SOA
factor mainly occurred during the night and showed contributions from both anthropogenic and
biogenic SOA.
SOA was the predominant component of OA, with four distinct types of SOA
accounting for a combined 72% of the total OA, varying diurnally from 66% at night to 78%
during the day. The dominant type of OA varied throughout the day. Regional SOA (SOA3,
56%) was the largest contributor to the total OA during the afternoon, and nighttime SOA
(SOA4, 39%) was the largest contributor during the night. Local SOA (SOA2) contributed
significantly in the morning, accounting for 21% of the total OA from 8:00 am to 12:00 pm PST.
The smaller local SOA factor (SOA1) accounted for < 10% of total OA during all periods of the
day.

70
The formation of SOA in this study occurred through multiple pathways. Direct gas-to-
particle pathway is suggested to be the dominant formation pathway for SOA1 and 3. Secondary
gas-to-particle partitioning pathways played a major role in the formation of local SOA (SOA2).
Particle-phase reactions also contributed to formation of nighttime SOA (SOA4), but their
contributions are not well-constrained in this study.
6.3 Implications for control of the OA concentration
In this study, speciated measurements of organic species in both gas and particle phases
made with the TAG have not only provided particle-phase organics for PMF analysis to identify
different OA sources, but also a unique dataset to examine the gas-to-particle partitioning
pathways of SOA tracers. Our studies of OA sources and SOA formation pathways have
provided insights into possible control strategies to effectively reduce the OA concentrations.
In-situ measurements of both gas- and particle-phase organic compounds have clearly
shown that multiple gas/particle partitioning pathways occur in the atmosphere and the SOA
yields of oxygenated compounds through other gas/particle partitioning pathways are
substantially higher relative to direct gas/particle partitioning. As a result, the control of
emissions for species such as ammonia which are involved in the SOA formation should reduce
SOA concentrations. However, the efficiency of reductions of SOA concentrations by control of
ammonia needs further investigation because the reduction of ammonia would increase the
aerosol acidity and subsequently could increase the SOA formation through particle-phase
reactions. Additionally, the occurrence and roles of different partitioning pathways can vary in
different environments. Further in-situ, time-resolved measurements of gas/particle partitioning

71
covering more oxygenated organic compounds are therefore suggested to identify the occurrence
and examine the roles of SOA formation pathways in different areas with substantially different
distributions of emission sources. We have examined the roles of multiple pathways in SOA
formation in Bakersfield through inclusion of investigated SOA tracers into PMF analysis.
By performing PMF analysis on the particle-phase organic species, the contributions of
six types of OA source factors to the OA mass were determined and SOA has been identified as
the dominant OA component in Bakersfield, CA. SOA consists of four distinct SOA types,
formed on both local and regional scales through different gas-to-particle partitioning pathways
in this airshed. As a result, the best control strategy to reduce the OA concentration is to reduce
emissions leading to the SOA formation, but the strategy for each type of SOA (SOA1-4) to
enable effective reductions in the OA concentration is likely different. Control of SOA precursor
emissions on both local and regional scales is needed to reduce the SOA concentration during the
day, but control of regional precursor emissions is most effective to reduce SOA in the afternoon
when the observed concentration was highest. Control of ammonia emissions should also reduce
the concentration of local SOA (SOA2). However, as discussed above, control of ammonia
emissions could also lead to more nighttime SOA. Further studies are needed to examine effects
of the reduction of ammonia emissions on the reduction of the total OA. The contributions of
both biogenic and anthropogenic precursors to the formation of nighttime SOA (SOA4) were
evident, but neither of their contributions can be quantitatively determined in this study.
Consequently, it remains unclear if the concentration of nighttime SOA could be effectively
reduced by control of anthropogenic organic precursors.

72
7. Literature Cited
Atkinson, R., and J. Arey (2003), Atmospheric degradation of volatile organic compounds, Chem
Rev, 103(12), 4605-4638.
Chow, J.C., L.W.A. Chen, J.G. Watson, D.H. Lowenthal, K.A. Magliano, K. Turkiewicz, and
D.E. Lehrman (2006), PM2.5 chemical composition and spatiotemporal variability during the
California Regional PM10/PM2.5 Air Quality Study (CRPAQS), J Geophys Res, 111, D10S04,
doi:10.1029/2005JD006457
Chow, J.C., J.G. Watson, D.H. Lowenthal, L.W.A. Chen, B. Zielinska, L.R. Mazzoleni, and K.L.
Magliano (2007), Evaluation of organic markers for chemical mass balance source
apportionment at the Fresno Supersite, Atmos Chem Phys, 7, 1741-1754.
Engelhart, G. J., L. Hildebrandt, E. Kostenidou, N. Mihalopoulos, N. M. Donahue, and S. N.
Pandis (2011), Water content of aged aerosol, Atmos Chem Phys, 11(3), 911-920.
Esteve, W., and B. Noziere (2005), Uptake and reaction kinetics of acetone, 2-butanone, 2,4-
pentanedione, and acetaldehyde in sulfuric acid solutions, J Phys Chem A, 109(48), 10920-
10928.
Falkovich A. H. and Rudich Y. (2001) Analysis of semivolatile organic compounds in
atmospheric aerosols by direct sample introduction thermal desorption GC/MS, Environ. Sci.
Technol. 35: 2326-2333.
Fine, P. M., Cass G. R., Simoneit, B. R. T. (2001) Chemical characterization of fine particle
emissions from fireplace combustion of woods grown in the northeastern United States, Environ.
Sci. Technol. 35: 2665-2675.
Fine, P. M., B. Chakrabarti, M. Krudysz, J. J. Schauer, and C. Sioutas (2004), Diurnal variations
of individual organic compound constituents of ultrafine and accumulation mode particulate
matter in the Los Angeles basin, Environ Sci Technol, 38(5), 1296-1304.
Fraser, M. P., G. R. Cass, B. R. T. Simoneit, and R. A. Rasmussen (1997), Air quality model
evaluation data for organics. 4. C2–C36 non-aromatic hydrocarbons, Environ Sci Technol, 31(8),
2356-2367.
Gao, S., et al. (2004), Particle phase acidity and oligomer formation in secondary organic
aerosol, Environ Sci Technol, 38(24), 6582-6589.
Gentner, D., G. Isaacman, D.R. Worton, A.W.H. Chan, T.R. Dallmann, L. Davis, S. Liu, D.A.
Day, L.M. Russell, K.R. Wilson, R. Weber, A. Guha, R.A. Harley, A.H. Goldstein (2012),
Elucidating secondary organic aerosol from diesel and gasoline vehicles through detailed
characterization of organic carbon emissions, Proceedings of the National Academy of Sciences,
10.1073/pnas.1212272109, V109, N45, 18318-18323.
73
Goldstein, A. H., and I. E. Galbally (2007), Known and unexplored organic constituents in the
earth's atmosphere, Environ Sci Technol, 41(5), 1514-1521.
Goldstein, A.H., B.J. Williams, A. Miller, N.M. Kreisberg, and S.V. Hering (2008), Hourly, In-
Situ Quantitation of Organic Aerosol Marker Compounds, Final Report, California Air
Resources Board contract no. 03-324, April 25, 2008.
Goldstein, A. H., C. D. Koven, C. L. Heald, and I. Y. Fung (2009), Biogenic carbon and
anthropogenic pollutants combine to form a cooling haze over the southeastern United States, P
Natl Acad Sci USA, 106(22), 8835-8840.
Goss, K. U., and R. P. Schwarzenbach (1998), Gas/solid and gas/liquid partitioning of organic
compounds: Critical evaluation of the interpretation of equilibrium constants, Environ Sci
Technol, 32(14), 2025-2032.
Greaves, R.C., Bakley, R.M., and Sievers, R.E. (1985), Rapid sampling and analysis of volatile
constituents of airborne particulate matter, Anal. Chem., 57: 2807-2815.
Gray, H. A., G. R. Cass, J. J. Huntzicker, E. K. Heyerdahl, and J. A. Rau (1986), Characteristics
of Atmospheric Organic and Elemental Carbon Particle Concentrations in Los-Angeles, Environ
Sci Technol, 20(6), 580-589.
Hajek, M., J. Malek, and V. Bazant (1971), Kinetics of Thermal Decomposition of Ammonium
Salts of Terephthalic and Isophthalic Acids, Collect Czech Chem C, 36(1), 84-91.
Hallquist, M., Wenger, J. C., Baltensperger, U., Rudich, Y., Simpson, D., Claeys, M., Dommen,
J., Donahue, N. M., George, C., Goldstein, A. H., Hamilton, J. F., Herrmann, H., Hoffmann, T.,
Iinuma, Y., Jang, M., Jenkin, M. E., Jimenez, J. L., Kiendler-Scharr, A., Maenhaut, W.,
McFiggans, G., Mentel, T. F., Monod, A., Prevot, A. S. H., Seinfeld, J. H., Surratt, J. D.,
Szmigielski, R. and Wildt, J. (2009). The formation, properties and impact of secondary organic
aerosol: current and emerging issues. Atmos Chem Phys, 9, 5155-5236.
Heald, C. L., D. A. Ridley, S. M. Kreidenweis, and E. E. Drury (2010), Satellite observations cap
the atmospheric organic aerosol budget, Geophys Res Lett, 37.
Heald, C. L., D. J. Jacob, R. J. Park, L. M. Russell, B. J. Huebert, J. H. Seinfeld, H. Liao, and R.
J. Weber (2005), A large organic aerosol source in the free troposphere missing from current
models, Geophys Res Lett, 32(18).
Helmig, D., J. Arey, R. Atkinson, W. P. Harger, and P. A. Mcelroy (1992), Products of the OH
Radical-Initiated Gas-Phase Reaction of Fluorene in the Presence of NOx, Atmos Environ, 26(9),
1735-1745.
Helmig, D., and W. P. Harger (1994), OH Radical-Initiated Gas-Phase Reaction-Products of
Phenanthrene, Sci Total Environ, 148(1), 11-21.

74
Hopke, P. K. (2003), Recent developments in receptor modeling, J Chemometr, 17(5), 255-265.
Hoyle, C. R., G. Myhre, T. K. Berntsen, and I. S. A. Isaksen (2009), Anthropogenic influence on
SOA and the resulting radiative forcing, Atmos Chem Phys, 9(8), 2715-2728.
Iinuma, Y., O. Boge, Y. Miao, B. Sierau, T. Gnauk, and H. Herrmann (2005), Laboratory studies
on secondary organic aerosol formation from terpenes, Faraday Discuss, 130, 279-294.
Jaeckels, J. M., M. S. Bae, and J. J. Schauer (2007), Positive matrix factorization (PMF) analysis
of molecular marker measurements to quantify the sources of organic aerosols, Environ Sci
Technol, 41(16), 5763-5769.
Jang, M. S., N. M. Czoschke, S. Lee, and R. M. Kamens (2002), Heterogeneous atmospheric
aerosol production by acid-catalyzed particle-phase reactions, Science, 298(5594), 814-817.
Jimenez, J. L., et al. (2009), Evolution of Organic Aerosols in the Atmosphere, Science,
326(5959), 1525-1529.
Kanakidou, M., et al. (2005), Organic aerosol and global climate modelling: a review, Atmos
Chem Phys, 5, 1053-1123.
Khlystov, A., C. O. Stanier, S. Takahama, and S. N. Pandis (2005), Water content of ambient
aerosol during the Pittsburgh air quality study, J Geophys Res-Atmos, 110(D7).
Kleindienst, T. E., M. Jaoui, M. Lewandowski, J. H. Offenberg, C. W. Lewis, P. V. Bhave, and
E. O. Edney (2007), Estimates of the contributions of biogenic and anthropogenic hydrocarbons
to secondary organic aerosol at a southeastern US location, Atmos Environ, 41(37), 8288-8300.
Kreisberg, N. M., S. V. Hering, B. J. Williams, D. R. Worton, and A. H. Goldstein (2009),
Quantification of Hourly Speciated Organic Compounds in Atmospheric Aerosols, Measured by
an In-Situ Thermal Desorption Aerosol Gas Chromatograph (TAG), Aerosol Sci Tech, 43(1), 38-
52.
Kroll, J. H., and J. H. Seinfeld (2008), Chemistry of secondary organic aerosol: Formation and
evolution of low-volatility organics in the atmosphere, Atmos Environ, 42(16), 3593-3624.
Kroll, J. H., N. L. Ng, S. M. Murphy, V. V, R. C. Flagan, and J. H. Seinfeld (2005), Chamber
studies of secondary organic aerosol growth by reactive uptake of simple carbonyl compounds, J
Geophys Res-Atmos, 110(D23).
Lewandowski, M., M. Jaoui, J. H. Offenberg, T. E. Kleindienst, E. O. Edney, R. J. Sheesley, and
J. J. Schauer (2008), Primary and secondary contributions to ambient PM in the midwestern
United States, Environ Sci Technol, 42(9), 3303-3309.
Li, Q. F., A. Wyatt, and R. M. Kamens (2009), Oxidant generation and toxicity enhancement of
aged-diesel exhaust, Atmos Environ, 43(5), 1037-1042.
75
Liggio, J., and S. M. Li (2006), Reactive uptake of pinonaldehyde on acidic aerosols, J Geophys
Res-Atmos, 111(D24).
Liu, S., L. Ahlm, D.A. Day, L.M. Russell, Y. Zhao, D.R. Gentner, R.J. Weber, A.H. Goldstein,
M. Jaoui, J.H. Offenberg, T.E. Kleindienst, C. Rubitschun, J.D. Surratt, R.J. Sheesley, and S.
Scheller (2012), Secondary organic aerosol formation from fossil fuel sources contribute
majority of summertime organic mass at Bakersfield, J Geophys Res, 117, D24V26,
doi:10.1029/2012JD018170.
Magliano, K. L., V. M. Hughes, L. R. Chinkin, D. L. Coe, T. L. Haste, N. Kumar, and F. W.
Lurmann (1999), Spatial and temporal variations in PM10 and PM2.5 source contributions and
comparison to emissions during the 1995 Integrated Monitoring Study, Atmos Environ, 33(29),
4757-4773.
Markovic, M. Z., VandenBoer, T. C., Murphy, J. G. (2012), Characterization and optimization of
an online system for the simultaneous measurement of atmospheric water-soluble constituents in
the gas and particle phases. J Environ Monitor, 14, 1872-1884.
Na, K., C. Song, C. Switzer, and D. R. Cocker (2007), Effect of ammonia on secondary organic
aerosol formation from alpha-Pinene ozonolysis in dry and humid conditions, Environ Sci
Technol, 41(17), 6096-6102.
Neusüss, C., Pelzing, M., Plewka, A., and Herrmann, H. (2000), A new analytical approach for
size-resolved speciation of organic compounds in atmospheric aerosol particles: Methods and
first results, J. Geophysical Research 105, 4513-4527.
Nguyen, T. B., P. J. Roach, J. Laskin, A. Laskin, and S. A. Nizkorodov (2011), Effect of
humidity on the composition of isoprene photooxidation secondary organic aerosol, Atmos Chem
Phys, 11(14), 6931-6944.
Nolte C. G., Schauer J. J., Cass, G. R., and Simoneit, B. R. T. (1999), Highly polar organic
compounds present in meat smoke, Environ. Sci. Technol., 33: 3313-3316.
Odum, J. R., T. P. W. Jungkamp, R. J. Griffin, R. C. Flagan, and J. H. Seinfeld (1997), The
atmospheric aerosol-forming potential of whole gasoline vapor, Science, 276(5309), 96-99.
Paatero, P., and U. Tapper (1993), Analysis of Different Modes of Factor-Analysis as Least-
Squares Fit Problems, Chemometr Intell Lab, 18(2), 183-194.
Pankow, J. F. (1994), An Absorption-Model of Gas-Particle Partitioning of Organic-Compounds
in the Atmosphere, Atmos Environ, 28(2), 185-188.
Polissar, A.V, P. K. Hopke, P. Paatero, W. C. Malm, and J.F., Sisler (1998), Atmospheric aerosol
over Alaska 2. Elemental composition and sources, J. Geophys. Res., 103(D15), 19,045-19,057.

76
Reff, A., S. I. Eberly, and P. V. Bhave (2007), Receptor modeling of ambient particulate matter
data using positive matrix factorization: Review of existing methods, J Air Waste Manage, 57(2),
146-154.
Robinson, A. L., R. Subramanian, N. M. Donahue, A. Bernardo-Bricker, and W. F. Rogge
(2006), Source apportionment of molecular markers and organic aerosol. 3. Food cooking
emissions, Environ Sci Technol, 40(24), 7820-7827.
Robinson, A. L., N. M. Donahue, M. K. Shrivastava, E. A. Weitkamp, A. M. Sage, A. P.
Grieshop, T. E. Lane, J. R. Pierce, and S. N. Pandis (2007), Rethinking organic aerosols:
Semivolatile emissions and photochemical aging, Science, 315(5816), 1259-1262.
Rogge, W. F., , L. M. Hildemann, M. A. Mazurek, , G. R. Cass, and B. R. T. Simoneit, (1997a),
Sources of fine organic aerosol. 7. hot asphalt roofing tar pot fumes, Environ. Sci. Technol., 31,
2726-2730.
Rogge, W. F., L. M. Hildemann, M. A. Mazurek, G. R. Cass, and B. R. T. Simoneit, (1997b),
Sources of fine organic aerosol: 8. boilers burning no. 2 distillate fuel oil, Environ. Sci. Technol.,
31, 2731-2737.
Rogge, W. F., L. M. Hildemann, M. A. Mazurek, and G. R. Cass, (1998), Sources of fine organic
aerosol: 9. pine oak and synthetic log combustion in residential fireplaces, Environ Sci Techol.
32, 13-22.
Russell, L. M., R. Bahadur, L. N. Hawkins, J. Allan, D. Baumgardner, P. K. Quinn, and T. S.
Bates (2009) Organic aerosol characterization by complementary measurements of chemical
bonds and molecular fragments. Atmos Environ, 43, 6100-6105.
Schauer, J. J., W. F. Rogge, L. M. Hildemann, M. A. Mazurek, G. R. Cass, and B. R. T. Simoneit
(1996), Source apportionment of airborne particulate matter using organic compounds as tracers,
Atmos Environ, 30(22), 3837-3855.
Schauer, J. J., and G. R. Cass (2000), Source apportionment of wintertime gas-phase and
particle-phase air pollutants using organic compounds as tracers, Environ Sci Technol, 34(9),
1821-1832.
Schauer, J. J., M. J. Kleeman, G. R. Cass, and B. R. T. Simoneit (1999a), Measurement of
emissions from air pollution sources: 1. C-1 through C-29 organic compounds from meat
charbroiling, Environ Sci Technol, 33(10), 1566-1577.
Schauer, J. J., M. J. Kleeman, G. R. Cass, and B. R. T. Simoneit (1999b), Measurement of
emissions from air pollution sources: 2. C-1 through C-30 organic compounds from medium
duty diesel trucks, Environ Sci Technol, 33(10), 1578-1587.

77
Schauer, J. J., M. P. Fraser, G. R. Cass, and B. R. T. Simoneit (2002a), Source reconciliation of
atmospheric gas-phase and particle-phase pollutants during a severe photochemical smog
episode, Environ Sci Technol, 36(17), 3806-3814.
Schauer, J. J., M. J. Kleeman, G. R. Cass, and B. R. T. Simoneit (2002b), Measurement of
emissions from air pollution sources. 5. C-1-C-32 organic compounds from gasoline-powered
motor vehicles, Environ Sci Technol, 36(6), 1169-1180.
Schuster, G. L., B. Lin, and O. Dubovik (2009), Remote sensing of aerosol water uptake,
Geophys Res Lett, 36.
Seinfeld, J. H., and J. F. Pankow (2003), Organic atmospheric particulate material, Annu Rev
Phys Chem, 54, 121-140.
Shrivastava, M. K., R. Subramanian, W. F. Rogge, and A. L. Robinson (2007), Sources of
organic aerosol: Positive matrix factorization of molecular marker data and comparison of results
from different source apportionment models, Atmos Environ, 41(40), 9353-9369.
Spracklen, D. V., J. L. Jimenez, K. S. Carslaw, D. R. Worsnop, M. J. Evans, G. W. Mann, Q.
Zhang, M. R. Canagaratna, J. Allan, H. Coe, G. McFiggans, A. Rap, and P. Forster (2011),
Aerosol mass spectrometer constraint on the global secondary organic aerosol budget, Atmos
Chem Phys, 11(23), 12109-12136.
Stone, E. A., J. B. Zhou, D. C. Snyder, A. P. Rutter, M. Mieritz, and J. J. Schauer (2009), A
Comparison of Summertime Secondary Organic Aerosol Source Contributions at Contrasting
Urban Locations, Environ Sci Technol, 43(10), 3448-3454.
Strader, R., F. Lurmann, and S. N. Pandis (1999), Evaluation of secondary organic aerosol
formation in winter, Atmos Environ, 33(29), 4849-4863.
Subramanian, R., N. M. Donahue, A. Bernardo-Bricker, W. F. Rogge, and A. L. Robinson
(2007), Insights into the primary-secondary and regional-local contributions to organic aerosol
and PM2.5 mass in Pittsburgh, Pennsylvania, Atmos Environ, 41(35), 7414-7433.
Tillmann, R., M. Hallquist, A. M. Jonsson, A. Kiendler-Scharr, H. Saathoff, Y. Iinuma, and T. F.
Mentel (2010), Influence of relative humidity and temperature on the production of
pinonaldehyde and OH radicals from the ozonolysis of alpha-pinene, Atmos Chem Phys, 10(15),
7057-7072.
Tolocka, M. P., M. Jang, J. M. Ginter, F. J. Cox, R. M. Kamens, and M. V. Johnston (2004),
Formation of oligomers in secondary organic aerosol, Environ Sci Technol, 38(5), 1428-1434.
Turpin, B. J., J. J. Huntzicker, S. M. Larson, and G. R. Cass (1991), Los-Angeles Summer
Midday Particulate Carbon - Primary and Secondary Aerosol, Environ Sci Technol, 25(10),
1788-1793.
78
Turpin, B. J., P. Saxena, and E. Andrews (2000), Measuring and simulating particulate organics
in the atmosphere: problems and prospects, Atmos Environ, 34(18), 2983-3013.
Ulbrich, I. M., M. R. Canagaratna, Q. Zhang, D. R. Worsnop, and J. L. Jimenez (2009),
Interpretation of organic components from Positive Matrix Factorization of aerosol mass
spectrometric data, Atmos Chem Phys, 9(9), 2891-2918.
Volkamer, R., J. L. Jimenez, F. San Martini, K. Dzepina, Q. Zhang, D. Salcedo, L. T. Molina, D.
R. Worsnop, and M. J. Molina (2006), Secondary organic aerosol formation from anthropogenic
air pollution: Rapid and higher than expected, Geophys Res Lett, 33(17).
Waterman, D., B. Horsfield, F. Leistner, K. Hall, and S. Smith, (2000), Quantification of
Polycyclic Aromatic Hydrocarbons in the NIST Standard Reference Material (SRM1649A)
Urban Dust Using Thermal Desorption GC/MS, Analytical Chemistry, 72(15), 3563-3567.
Williams, B. J., A. H. Goldstein, N. M. Kreisberg, and S. V. Hering (2006), An in-situ
instrument for speciated organic composition of atmospheric aerosols: Thermal Desorption
Aerosol GC/MS-FID (TAG), Aerosol Sci Tech, 40(8), 627-638.
Williams, B.J., A.H. Goldstein, D.B. Millet, R. Holzinger, N.M. Kreisberg, S.V. Hering, A.B.
White, D.R., Worsnop, J.D. Allan, J.L. Jimenez, (2007), Chemical speciation of organic aerosol
during the International Consortium for Atmospheric Research on Transport and Transformation
2004: Results from in situ measurements, Journal of Geophysical Research, 112: D10,
#D10S26.
Williams, B. J., A. H. Goldstein, N. M. Kreisberg, S. V. Hering, D. R. Worsnop, I. M. Ulbrich,
K. S. Docherty, and J. L. Jimenez (2010a), Major components of atmospheric organic aerosol in
southern California as determined by hourly measurements of source marker compounds, Atmos
Chem Phys, 10(23), 11577-11603.
Williams, B. J., A. H. Goldstein, N. M. Kreisberg, and S. V. Hering (2010b), In situ
measurements of gas/particle-phase transitions for atmospheric semivolatile organic compounds,
P Natl Acad Sci USA, 107(15), 6676-6681.
Worton, D. R., A. H. Goldstein, D. K. Farmer, K.S. Docherty, J.L. Jimenez, J.B. Gilman, W.C.
Kuster, J. de Gouw, B.J. Williams, N.M. Kreisberg, S.V. Hering, G. Bench, M. McKay, K.
Kristensen, M. Glasius, J.D. Surratt, and J.H. Seinfeld (2011), Origins and composition of fine
atmospheric carbonaceous aerosol in the Sierra Nevada Mountains, California, Atmos. Chem.
Phys., 11, 10219-10241, doi:10.5194/acp-11-10219-2011.
Xue, J.; A. K. H.Lau, and J. Z. Yu (2011) A study of acidity on PM2.5 in Hong Kong using
online ionic chemical composition measurements. Atmos. Environ., 45, 7081-7088.
Yu, S., P. V. Bhave, R. L. Dennis, and R. Mathur (2007), Seasonal and regional variations of
primary and secondary organic aerosols over the Continental United States: Semi-empirical
estimates and model evaluation, Environ Sci Technol, 41, 4690-4697.

79
Zhang, Q., J. L. Jimenez, D. R. Worsnop, and M. Canagaratna (2007a), A case study of urban
particle acidity and its influence on secondary organic aerosol, Environ Sci Technol, 41(9), 3213-
3219.
Zhang, Q., J. L. Jimenez, M. R. Canagaratna, J. D. Allan, H. Coe, I. Ulbrich, M. R. Alfarra, A.
Takami, A. M. Middlebrook, Y. L. Sun, K. Dzepina, E. Dunlea, K. Docherty, P. F. DeCarlo, D.
Salcedo, T. Onasch, J. T. Jayne, T. Miyoshi, A. Shimono, S. Hatakeyama, N. Takegawa, Y.
Kondo, J. Schneider, F. Drewnick, S. Borrmann, S. Weimer, K. Demerjian, P. Williams, K.
Bower, R. Bahreini, L. Cottrell, R. J. Griffin, J. Rautiainen, J. Y. Sun, Y. M. Zhang, D. R.
Worsnop (2007b), Ubiquity and dominance of oxygenated species in organic aerosols in
anthropogenically-influenced Northern Hemisphere midlatitudes, Geophys Res Lett, 34(13).
Zhang, Q., J. L. Jimenez, M. R. Canagaratna, I. M. Ulbrich, N. L. Ng, D. R. Worsnop, and Y. L.
Sun (2011), Understanding atmospheric organic aerosols via factor analysis of aerosol mass
spectrometry: a review, Anal Bioanal Chem, 401(10), 3045-3067.
Zhang, Y., R. J. Sheesley, J. J. Schauer, M. Lewandowski, M. Jaoui, J. H. Offenberg, T. E.
Kleindienst, and E. O. Edney (2009), Source apportionment of primary and secondary organic
aerosols using positive matrix factorization (PMF) of molecular markers, Atmos Environ, 43(34),
5567-5574.
Zhao, Y., N.K. Kreisberg, D.R. Worton, G. Isaacman, R.J. Weber, S. Liu, D.A. Douglas, L.M.
Russell, M. Z. Markovic, T.C. VandenBoer, J.G. Murphy, S.V. Hering, and A.H. Goldstein,
(2013). Insights for SOA formation mechanisms from measured gas/particle partitioning of
specific organic tracer compounds. Environ. Sci. Technol., in press.
Zheng, M., G. R. Cass, J. J. Schauer, and E. S. Edgerton (2002), Source apportionment of PM2.5
in the southeastern United States using solvent-extractable organic compounds as tracers,
Environ Sci Technol, 36(11), 2361-2371.
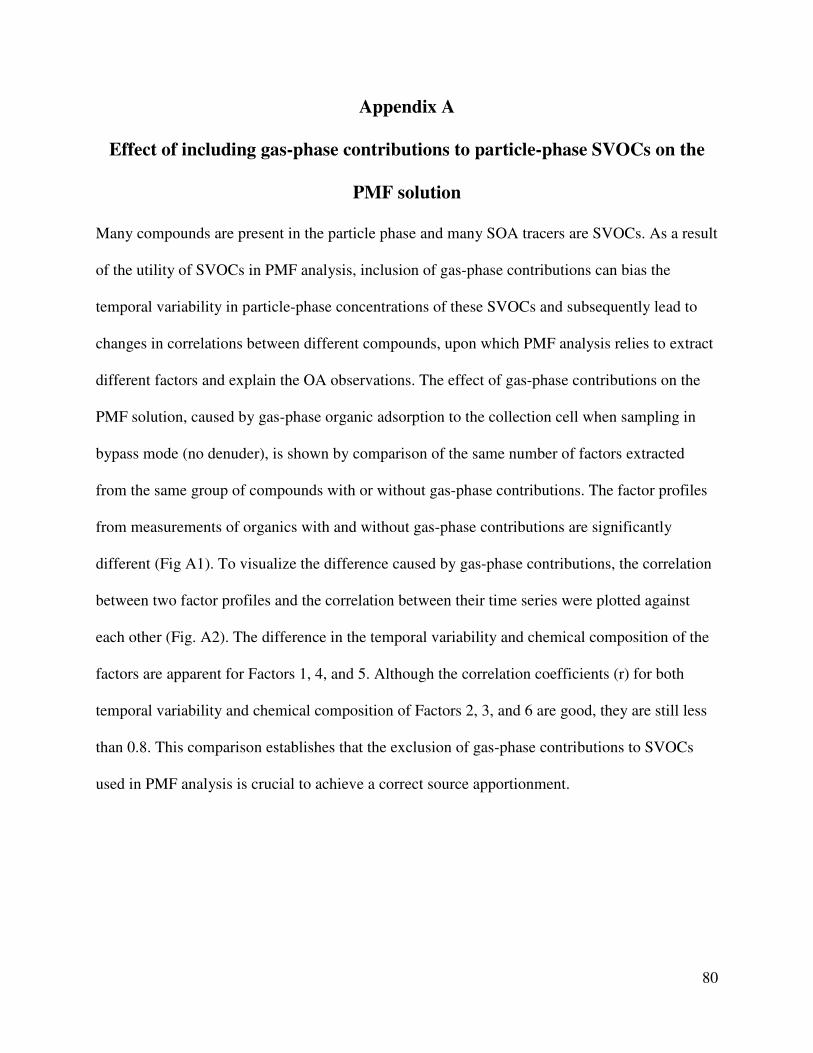
80
Appendix A
Effect of including gas-phase contributions to particle-phase SVOCs on the
PMF solution
Many compounds are present in the particle phase and many SOA tracers are SVOCs. As a result
of the utility of SVOCs in PMF analysis, inclusion of gas-phase contributions can bias the
temporal variability in particle-phase concentrations of these SVOCs and subsequently lead to
changes in correlations between different compounds, upon which PMF analysis relies to extract
different factors and explain the OA observations. The effect of gas-phase contributions on the
PMF solution, caused by gas-phase organic adsorption to the collection cell when sampling in
bypass mode (no denuder), is shown by comparison of the same number of factors extracted
from the same group of compounds with or without gas-phase contributions. The factor profiles
from measurements of organics with and without gas-phase contributions are significantly
different (Fig A1). To visualize the difference caused by gas-phase contributions, the correlation
between two factor profiles and the correlation between their time series were plotted against
each other (Fig. A2). The difference in the temporal variability and chemical composition of the
factors are apparent for Factors 1, 4, and 5. Although the correlation coefficients (r) for both
temporal variability and chemical composition of Factors 2, 3, and 6 are good, they are still less
than 0.8. This comparison establishes that the exclusion of gas-phase contributions to SVOCs
used in PMF analysis is crucial to achieve a correct source apportionment.

81
Figure A1. Factor profiles extracted by PMF analysis from the same compound list with and without inclusion of gas-phase contributions to the measured SVOCs.

82
Figure A2. Correlation of the timeline of observations and correlation of factor profile of the corresponding factor extracted by PMF analysis from the dataset with or without inclusion of gas-phase contributions. The labeled number refers to the factor number in Figure A1.
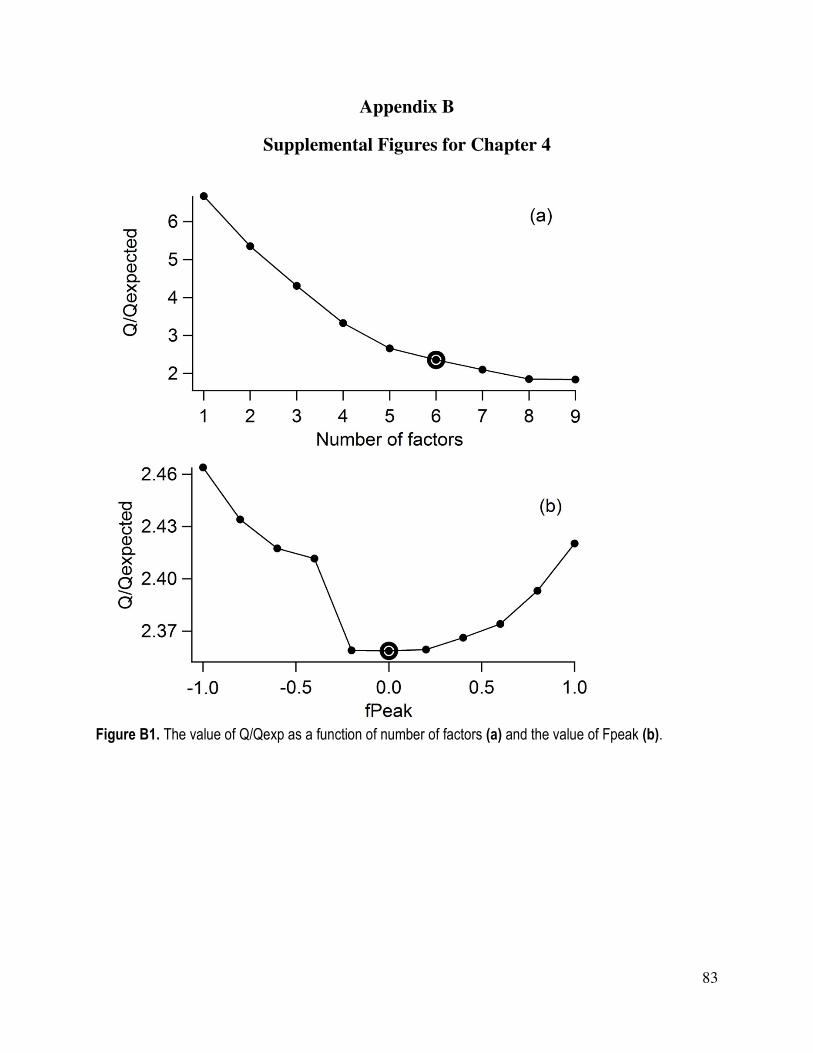
83
Appendix B
Supplemental Figures for Chapter 4
Figure B1. The value of Q/Qexp as a function of number of factors (a) and the value of Fpeak (b).
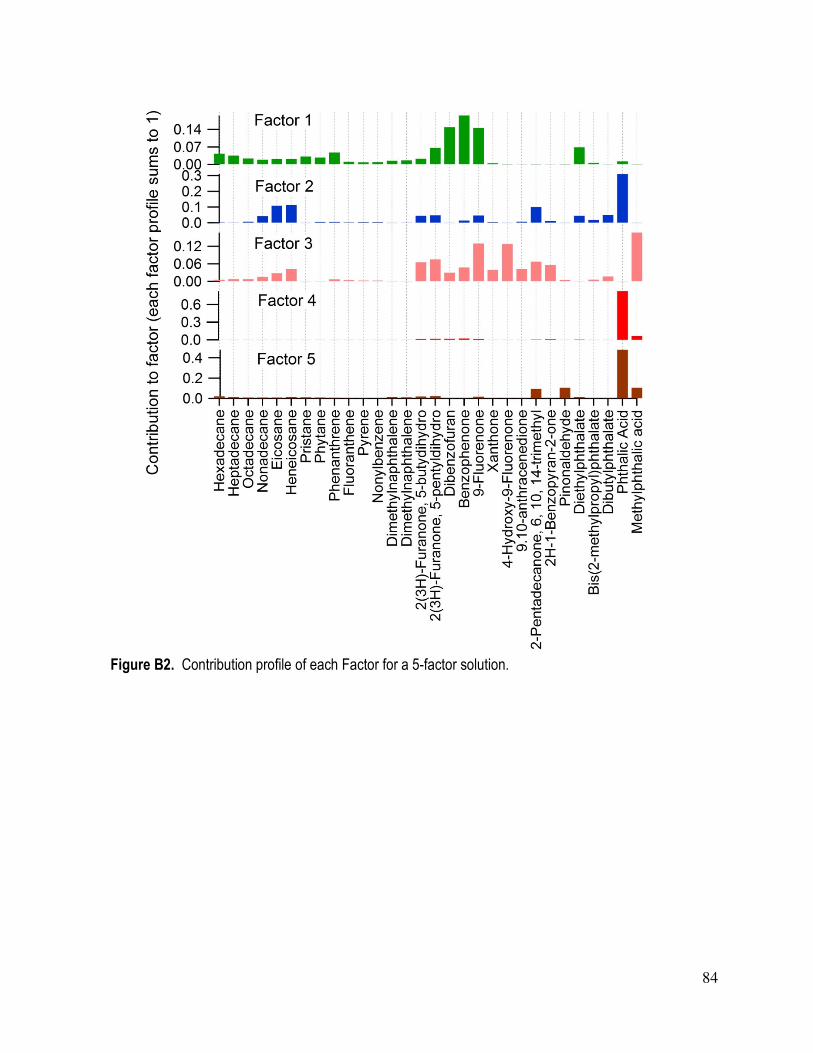
84
Figure B2. Contribution profile of each Factor for a 5-factor solution.

85
Figure B3. Contribution profile of each Factor for a 7-factor solution.
0.15
0.00C
ontr
ibu
tio
n t
o f
acto
r (e
ach
fa
cto
r p
rofile
su
ms to
1)
He
xa
de
ca
ne
He
pta
de
ca
ne
Octa
deca
ne
No
na
deca
ne
Eic
osa
ne
He
ne
ico
sa
ne
Prista
ne
Ph
yta
ne
Ph
en
an
thre
ne
Flu
ora
nth
en
eP
yre
ne
No
nylb
enze
ne
Dim
eth
yln
ap
hth
ale
ne
Dim
eth
yln
ap
hth
ale
ne
2(3
H)-
Fu
ran
one
, 5
-bu
tyd
ihyd
ro2
(3H
)-F
ura
no
ne
, 5
-pe
nty
ldih
yd
roD
ibe
nzo
fura
nB
en
zo
ph
en
on
e9
-Flu
ore
no
ne
Xa
nth
on
e4
-Hyd
roxy-9
-Flu
ore
no
ne
9.1
0-a
nth
race
ne
dio
ne
2-P
en
tad
eca
no
ne
, 6, 1
0, 1
4-t
rim
eth
yl
2H
-1-B
en
zo
pyra
n-2
-on
eP
ino
na
lde
hyd
eD
ieth
ylp
hth
ala
teB
is(2
-me
thylp
rop
yl)p
hth
ala
teD
ibu
tylp
hth
ala
teP
hth
alic
Acid
Meth
ylp
hth
alic
acid
0.25
0.00
0.10
0.00
0.2
0.0
0.10
0.00
0.40.20.0
0.80.40.0
Factor 1
Factor 2
Factor 3
Factor 4
Factor 5
Factor 6
Factor 7

86
Figure B4. Factor contributions to PM1 organic aerosol mass concentrations throughout the entire TAG measurements.
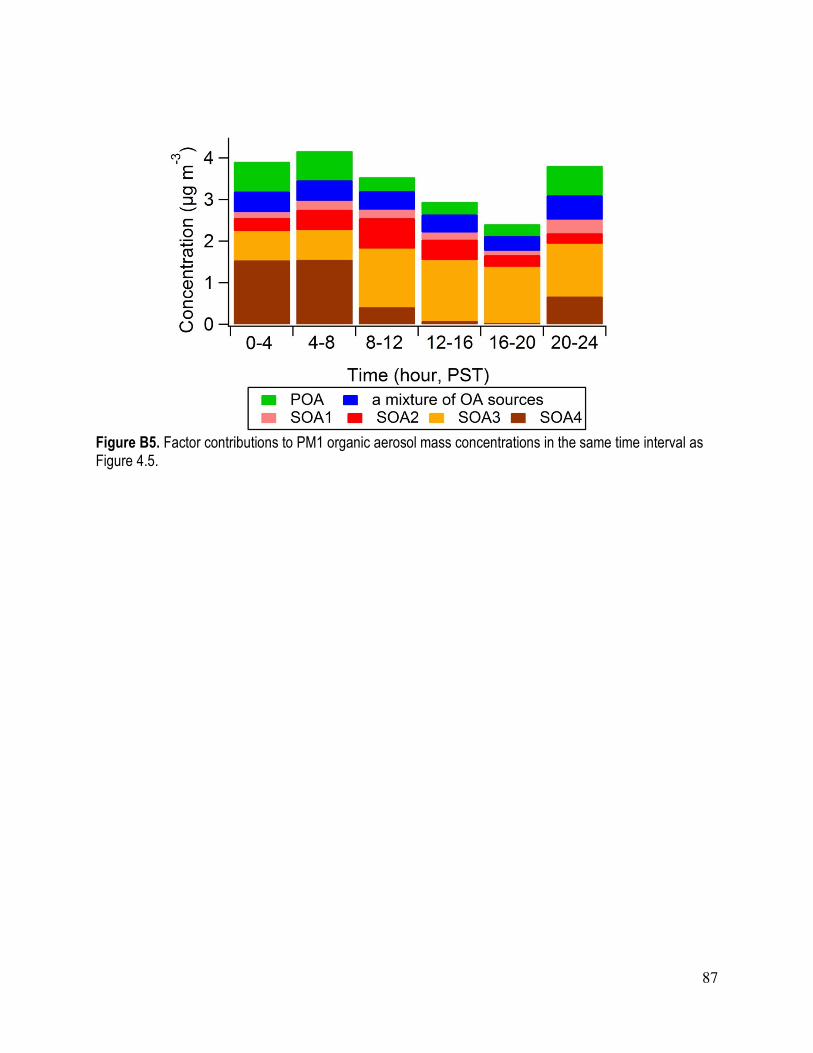
87
Figure B5. Factor contributions to PM1 organic aerosol mass concentrations in the same time interval as Figure 4.5.
88
Appendix C
Abstract of Associated Published Paper
Liu, S., L. Ahlm, D.A. Day, L.M. Russell, Y. Zhao, D.R. Gentner, R.J. Weber, A.H. Goldstein,
M. Jaoui, J.H. Offenberg, T.E. Kleindienst, C. Rubitschun, J.D. Surratt, R.J. Sheesley, and S.
Scheller, Secondary organic aerosol formation from fossil fuel sources contribute majority of
summertime organic mass at Bakersfield, J. Geophys. Res., 117, D00V26,
doi:10.1029/2012JD018170, 2012.
Abstract
Secondary organic aerosols (SOA), known to form in the atmosphere from oxidation of volatile
organic compounds (VOCs) emitted by anthropogenic and biogenic sources, are a poorly
understood but substantial component of atmospheric particles. In this study, we examined the
chemical and physical properties of SOA at Bakersfield, California, a site influenced by both
anthropogenic and terrestrial biogenic emissions. Factor analysis was applied to the infrared and
mass spectra of fine particles to identify sources and atmospheric processing that contributed to
the organic mass (OM). We found that OM accounted for 56% of submicron particle mass, with
SOA components contributing 80% to 90% of OM from 15 May to 29 June 2010. SOA formed
from alkane and aromatic compounds, the two major classes of vehicle-emitted hydrocarbons,
accounted for 65% OM(72% SOA). The alkane and aromatic SOA components were associated
with 200 nm to 500 nm accumulation mode particles, likely from condensation of daytime
photochemical products of VOCs. In contrast, biogenic SOA likely formed from condensation of
secondary organic vapors, produced from NO3 radical oxidation reactions during nighttime
hours, on 400 nm to 700 nm sized primary particles, and accounted for less than 10% OM. Local
petroleum operation emissions contributed 13% to the OM, and the moderate O/C (0.2) of this
factor suggested it was largely of secondary origin. Approximately 10% of organic aerosols in
submicron particles were identified as either vegetative detritus (10%) or cooking activities
(7%), based on Fourier transform infrared spectroscopic and aerosol mass spectrometry
measurements, respectively. While the mass spectra of several linearly independent SOA

89
components were nearly identical and external source markers were needed to separate them,
each component had a distinct infrared spectrum, likely associated with the source-specific
VOCs from which they formed.
90
Appendix D
Abstract of Associated Published Paper
O’Brien, R.E., A. Laskin, J. Laskin, S. Liu, R. Weber, L.M. Russell, A.H. Goldstein, Molecular
Characterization of Organic Aerosol Using Nanospray Desorption/Electrospray Ionization Mass
Spectrometry: CalNex 2010 field study, Atmospheric Environment, DOE:
10.1016/j.atmosenv.2012.11.056, Available online 6 December 2012.
Abstract
Aerosol samples from the CalNex 2010 field study were analyzed using high resolution mass
spectrometry (HR-MS) coupled to a nanospray-desorption/electrospray ionization (nano-DESI)
source. The samples were collected in Bakersfield, CA on June 22-23, 2010. The chemical
formulas of over 850 unique molecular species were detected in the mass range of 50-400 m/z
using positive mode ESI of aerosol samples in the 0.18-0.32 µm size range. Our analysis focused
on identification of two main groups: compounds containing only carbon, hydrogen, and oxygen
(CHO), and nitrogen-containing organic compounds (NOC). The NOC accounted for 40% (by
number) of the compounds observed in the afternoon, and for 52% in the early morning samples.
By comparing plausible reactant-product pairs, we propose that over 50% of the NOC in each
sample could have been formed through reactions transforming carbonyls into imines. The CHO
only compounds were dominant in the afternoon suggesting a photochemical source. The
average O/C ratios of all observed compounds were fairly consistent throughout the day, ranging
from 0.33 in the morning to 0.37 at night. We conclude that both photooxidation and ammonia
chemistry may play a role in forming the compounds observed in this mixed urban-rural
environment.

91
Appendix E
Abstract of Associated Published Paper
O'Brien, R., T. Nguyen, A. Laskin, J. Laskin, P. Hayes, S. Liu, J.-L. Jimenez, L. Russell, A.H.
Goldstein, Probing Molecular Associations of Field-Collected and Laboratory-Generated SOA
with Nano-DESI High-Resolution Mass Spectrometry, J. Geophys. Res., CalNex Special Issue,
In Press.
Abstract
Aerosol samples from the 2010 CalNex field study in Bakersfield (BF) and Pasadena, Los
Angeles (LA) were analyzed using positive mode nanospray-desorption electrospray ionization
mass spectrometry (nano-DESI-MS). Secondary organic aerosol (SOA) produced in a
photochemical chamber by photooxidation of diesel (DSL) fuel and isoprene (ISO) under humid,
high-NOx conditions, was analyzed for comparison. Three groups of organic compounds with
zero, one, or two nitrogen atoms in their molecular formulas (0N, 1N, 2N) were compared in
detail. The composition of ambient SOA exhibited greater overlap with DSL than with ISO.
The overlap of the chamber experiments with the BF data was relatively consistent throughout
the day while the overlap with LA data increased significantly in the noon-6pm sample,
consistent with the SOA plume arriving from downtown Los Angeles. BF samples were more
oxidized, contained more organic nitrogen, and had more overlap with the chamber data
compared to the LA samples. The addition of gaseous ammonia (NH3) to the DSL experiment
was necessary to generate many of the 2N compounds observed in BF. This analysis
demonstrates that DSL and ISO were important sources but cannot account for all of the
observed ambient compounds indicating that other sources of organics were also likely
important.
92
Appendix F
Data Set Description
Data set TAG_DATA_20100531_RA
General:
This data set contains ambient concentrations of organic compounds measured with TAG during
the CalNex 2010 campaign in Bakersfield. The concentration units are ng per cubic meter.
Data items filled with the value -9999 denote “lower than detection limit”
Column descriptions (numbering refers to column number):
0. “TAG_mid_pst” sampling midpoint in seconds since May 31st. Note that all times
are local standard time (Pacific Standard Time = PST)
1. “TAG_start_pst” sampling start point in seconds since May 31st
2. “TAG_stop_pst” sampling end point in seconds since May 31st
3. “TAG_DOY” Day of the year
4. “Runtype” Indicates which inlet was used: 1 = denuded samples (only
particle-phase organics); 2 = undenuded samples (gas and particle phase organics)
5. “CNC1” n-tridecane
6. “CNC2” n-tetradecane
7. “CNC3” n-pentadecane
8. “CNC4” n-hexadecane
9. “CNC5” n-heptadecane
10. “CNC6” n-octadecane
11. “CNC7” n-nonadecane
12. “CNC8” n-eicosane
13. “CNC9” n-heneicosane
14. “CNC10” n-docosane
15. “CNC11” n-tricosane
16. “CNC12” n-tetracosane
17. “CNC13” n-pentacosane
18. “CNC14” n-hexacosane
19. “CNC15” n-heptacosane
93
20. “CNC16” n-octacosane
21. “CNC17” n-nonacosane
22. “CNC18” n-triacontane
23. “CNC19” n-hentriacontane
24. “CNC20” Pristane
25. “CNC21” Phytane
26. “CNC22” Acenaphthylene
27. “CNC23” Fluorene
28. “CNC24” Phenanthrene
29. “CNC25” Anthracene
30. “CNC26” Fluoranthene
31. “CNC27” Pyrene
32. “CNC28” 1,2-Benzanthracene
33. “CNC29” Chrysene
34. “CNC30” Benzo(b)fluoranthene
35. “CNC31” Benzo(k)fluoranthene
36. “CNC32” Benzo(a)fluoranthene
37. “CNC33” Methylnaphthalene
38. “CNC34” Ethtylnaphthalene
39. “CNC35” Dimethylnaphthalene_1
40. “CNC36” Dimethylnaphthalene_2
41. “CNC37” Dimethylnaphthalene_3
42. “CNC38” Trimethylnaphthalene_1
43. “CNC39” Trimethylnaphthalene_2
44. “CNC40” Naphthalene, 2-phenyl
45. “CNC41” Methylphenanthracene_1
46. “CNC42” Methylphenanthracene_2
47. “CNC43” Methylanthracene_1
48. “CNC44” Methylanthracene_2
49. “CNC45” Phenanthrene, 1-methyl-7-(1-methylethyl)-
50. “CNC46” MethylPyrene
51. “CNC47” MethylPyrene
52. “CNC48” m-Terphenyl, 5-phenyl-
94
53. “CNC49” 2(3H)-Furanone, 5-butyldihydro
54. “CNC50” 2(3H)-Furanone, 5-pentyldihydro
55. “CNC51” 2(3H)-Furanone, 5-hexyldihydro
56. “CNC52” 2(3H)-Furanone, 5-heptyldihydro
57. “CNC53” 2(3H)-Furanone, 5-octyldihydro
58. “CNC54” 2(3H)-Furanone, 5-nonyldihydro
59. “CNC55” 2(3H)-Furanone, 5-decyldihydro
60. “CNC56” Dibenzofuran
61. “CNC57” Benzophenone
62. “CNC58” 9-Fluorenone
63. “CNC59” Xanthone
64. “CNC60” 4-Hydroxy-9-fluorenone
65. “CNC61” 9, 10-Anthracenedione
66. “CNC62” Nonaoic acid
67. “CNC63” Decanoic acid
68. “CNC64” Dodecanoic acid
69. “CNC65” Tetradecanoic acid
70. “CNC66” Hexadecanoic acid
71. “CNC67” αββ 20R-cholestane
72. “CNC68” αα-20R-cholestane
73. “CNC69” αββ 20R 24S-methylcholestane
74. “CNC70” ααα 20R 24R-ethylcholestane
75. “CNC71” αββ 20R 24R-ethylcholestane
76. “CNC72” 17α(H)-22,29,30-trisnorhopane
77. “CNC73” 17α(H),21β(H)-30-norhopane
78. “CNC74” 17α(H),21β(H)-hopane
79. “CNC75” 17α(H),21β(H)-22R-homohopane
80. “CNC76” 17α(H),21β(H)- 22S-homohopane
81. “CNC77” undecylcyclohexane
82. “CNC78” dodecylclohexane
83. “CNC79” Tridecyclohexane
84. “CNC80” Tetradecylclohexane
85. “CNC81” Pentadecylclohexane

95
86. “CNC82” Hexadecylclohexane
87. “CNC83” Heptadecylcyclohexane
88. “CNC84” Octadecylcyclohexane
89. “CNC85” Nonadecylcyclohexane
90. “CNC86” Eicosylcyclohexane
91. “CNC87” 1,2-Benenedicarboxylic acid, diethyl ester
92. “CNC88” 1,2-Benenedicarboxylic acid, Bis(2-methylpropyl) ester
93. “CNC89” 1,2-Benenedicarboxylic acid, dibutyl ester
94. “CNC90” 1,2-Benenedicarboxylic acid, butyl phenylmethyl ester
95. “CNC91” 1,2-Benenedicarboxylic acid, Bis(2-ethylhexyl) ester
96. “CNC92” Undecanone
97. “CNC93” Dodecanone
98. “CNC94” Tridecanone
99. “CNC95” Tetradecanone
100. “CNC96” Pentadecanone
101. “CNC97” Hexadecanone
102. “CNC98” 2-Pentadecanone, 6, 10, 14-trimethyl-
103. “CNC99” Nonylbenzene
104. “CNC100” Pinonaldehyde
105. “CNC101” Phthalic acid
106. “CNC102” 4-methyl-Phthalic acid
107. “CNC103” 1,8- Naphthalic acid
108. “CNC104” 2H-1-Benzopyran-2-one