Houlihan Lokey 8th Annual Industrials Conferences1.q4cdn.com/586229698/files/doc_events/2013/HL...
23
Houlihan Lokey 8 th Annual Industrials Conference Chaya Cooperberg, VP Investor Relations Thursday, May 8, 2013
Transcript of Houlihan Lokey 8th Annual Industrials Conferences1.q4cdn.com/586229698/files/doc_events/2013/HL...

Houlihan Lokey 8th Annual Industrials Conference Chaya Cooperberg, VP Investor Relations
Thursday, May 8, 2013
Forward-Looking Statements
2
This presentation includes "forward-looking statements" within the meaning of the safe harbor provisions of the United States Private Securities Litigation Reform Act of 1995 and applicable Canadian securities legislation. Words such as "expect," "estimate," "project," "budget," "forecast," "anticipate," "intend," "plan," "may," "will," "could," "should," "believes," "predicts," "potential," and "continue" or variations of such words, other similar words or similar expressions are intended to identify such forward-looking statements. These forward-looking statements may include, without limitation, statements relating to future financial and operating results, our financial condition and our plans, objectives, prospects, expectations and intentions. These forward-looking statements involve significant risks and uncertainties and other factors and assumptions that could cause actual results to differ materially from the forward-looking statements. Most of these factors and assumptions are outside of our control and are difficult to predict. In addition to the factors and assumptions contained in this presentation, the following factors and assumptions, among others, could cause or contribute to such material differences: downturns in the worldwide economy; our ability to realize all of the anticipated benefits of future acquisitions; our ability to obtain, renew and maintain certain permits, licenses and approvals relating to our landfill operations; and fuel cost and commodity price fluctuations. Additional factors and assumptions that could cause Progressive Waste Solutions Ltd.'s results to differ materially from those described in the forward-looking statements can be found in the most recent annual information form under the heading “Risk Factors”. Progressive Waste Solutions Ltd. cautions that the foregoing list of factors is not exclusive and that investors should not place undue reliance on such forward-looking statements. All subsequent written and oral forward-looking statements concerning Progressive Waste Solutions Ltd., or other matters attributable to Progressive Waste Solutions Ltd. or any person acting on its behalf are expressly qualified in their entirety by the cautionary statements above. Progressive Waste Solutions Ltd. does not undertake any obligation to update any forward-looking statement, whether written or oral, relating to the matters discussed in this communication, except as required by law.

Snapshot
• One of the largest solid waste management companies in N.A.
• Over 4 million Commercial, Industrial and Residential customers
• Top 3 market share position by number of collection routes in over 80% of the markets in which we operate
• Strong vertically integrated asset base in the U.S. and Canada with significant and strategic landfill internalization rates
• More than 7,000 employees
• Executive team of five with 100+ years of combined experience in the waste industry
• Listed on the NYSE & TSX : “BIN”
3

Industry Dynamics
• $60 billion+ industry in N.A. with scale concentrated in top four players • Essential service with multi-year contracts • Strong and predictable cash flow • Recession resistance with operating leverage to an economic recovery due to
high fixed cost infrastructure (typically a late-cycle performer) • Assets are underutilized, presenting margin expansion opportunity • Competitive dynamics vary by local market and success is driven by local
market customer density and asset mix • Top players represent ~36% of industry revenues with many further
consolidation opportunities remaining • Industry growth driven by price and volume improvements, with recycling and
waste diversion growth creating new revenue opportunities
4

Solid Record of Results
5
$170 $208
$257 $291 $292
$416
$535 $520
2005 2006 2007 2008 2009 2010 2011 2012
$559 $680
$854 $1,047 $1,008
$1,430
$1,840 $1,897
2005 2006 2007 2008 2009 2010 2011 2012
Revenue
US $MM
$48 $50 $64 $95
$119
$194
262.5
172.5
2005 2006 2007 2008 2009 2010 2011 2012
Adjusted EBITDA (A)
US $MM
Free Cash Flow (B) US$MM
Revenue 5-year CAGR is 17.3% Adjusted EBITDA(A) 5-year CAGR is 15.2% Free Cash Flow(B) 5-year CAGR is 22.8%
$199(1)
(A) Please refer to the definition and explanation of (A) on slide 21. (B) Please refer to the definition and explanation of (B) on slide 23. (1) Free cash flow excluding $26.5 million on discretionary infrastructure projects in 2012
2012 includes $30 MM revenue & EBITDA impact of lower recycled
commodities prices

Q1 2013 Financial Highlights
On track for the year on all measures we provided in our February outlook.
Gaining traction in our U.S. northeast segment. Canadian and U.S. south operations continue to perform as expected.
On a consolidated basis, achieved higher core price in every service line as a result of our focused efforts.
Acquisitions contributed on target and on schedule, and were the primary drivers of our growth in the first quarter.
6

Q1 2013 Financial Results
7
($ US millions) Except per share amounts Q1/12 Q1/13 Change
Canada $173.9 $179.1 3.0%
U.S. South 187.4 $211.5 12.9%
U.S. Northeast 77.0 $95.9 24.6%
Total Revenues $438.2 $486.6 11.0%
Adjusted Net Income(A)
Reported Net Income $24.1 $22.1
$27.1 $29.3
12.6% 33.0%
Adjusted EPS(A) (diluted) Reported EPS (diluted)
$0.20 $0.19
$0.24 $0.25
20.0% 31.6%
Adjusted Operating EBIT(A) $53.0 $58.4 10.1%
Adjusted EBITDA(A) $116.3 $129.1 11.0%
Adjusted EBITDA(A) Margins 26.5% 26.5% -
Adjusted EBITA(A) $65.6 $73.1 11.5%
Free Cash Flow(B) $43.7 $44.9 2.6%
Weighted Average Share Count 117.9 115.2
Total Actual Outstanding Share Count 115.2 (A) Please refer to the definition and explanation of (A) on slide 21.. (B) Please refer to the definition and explanation of (B) on slide 23.

Transfer station
Material recovery
Recycled goods
Landfill Gas-to-Energy Plant
Natural Gas Electricity
126 non-hazardous
solid waste collection operations
67 transfer stations*
strategically located near many collection routes
49 material recovery facilities*
process a variety of materials
30 landfill sites*
5 gas-to-energy systems
Integrated Assets Support Operating Strategy
Market focused strategy
Leading collection operations in dense urban markets
Strategically located landfills
in close proximity to urban markets
*Owned and / or operated
Execution Model for Continuous Improvement
9
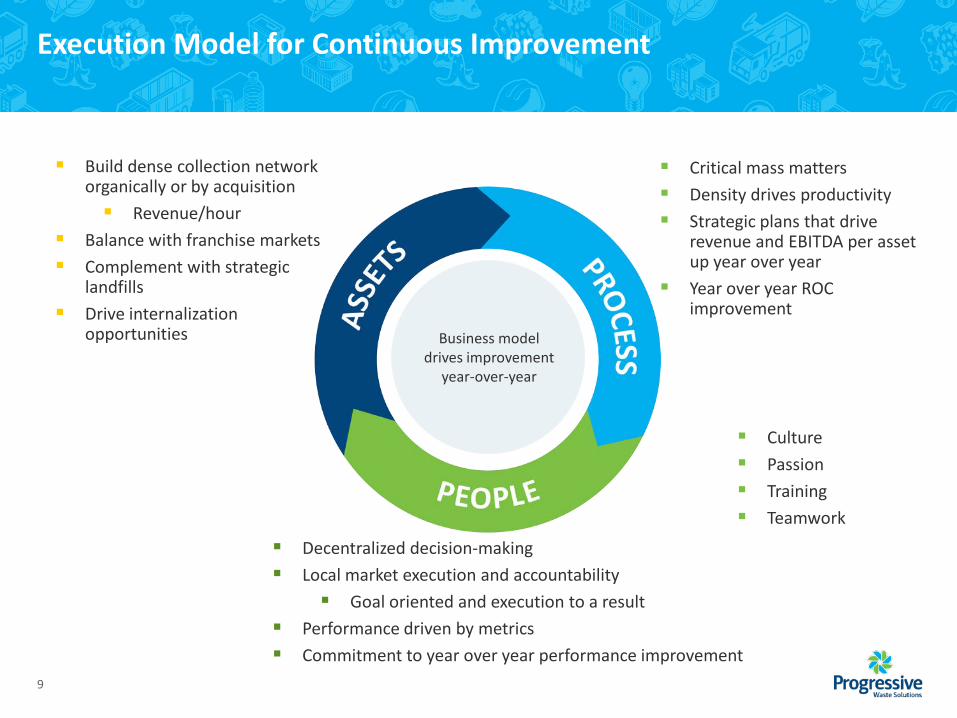
Business model drives improvement
year-over-year
Build dense collection network organically or by acquisition Revenue/hour
Balance with franchise markets Complement with strategic
landfills Drive internalization
opportunities
Decentralized decision-making Local market execution and accountability
Goal oriented and execution to a result Performance driven by metrics Commitment to year over year performance improvement
Critical mass matters Density drives productivity Strategic plans that drive
revenue and EBITDA per asset up year over year
Year over year ROC improvement
Culture Passion Training Teamwork

2012 Acquisitions Driving Growth
10
Tuck-In Acquisitions 2011 Q1/12 Q2/12 Q3/12 Q4/12 2012
U.S. South 8 2 3 - 3 8
U.S. Northeast 3 - - 2 3 5
Canada 3 1 3 1 1 6
Total 14 3 6 3 7 19
• Solid waste services industry is still consolidating • Well-positioned to be disciplined buyers of both strategic “tuck-ins” and platforms
that can deliver returns in excess of our targets • In 2012, we invested $308.3MM on strategic “tuck-in” acquisitions

Capital Allocation
11
What is the best use of our capital given the options available to us?
How can we deliver the highest shareholder return?

Capital Expenditures
12
As a % of revenue: Replacement Growth
61% 71%
74% 70% 60%-
64%
39% 29%
26%
30% 36%- 40%
0
50
100
150
200
250
2009 2010 2011 2012 2013E
Growth
Replacement
$171
$220(2)
$143
$USD (MM) 2013 Replacement CAPEX • Includes $17-18 MM for
construction at several landfills and utility relocation at Seneca Meadows.
• Also reflects sale of a few redundant properties in 2013.
2013 Growth CAPEX • Includes $10MM related
to recent municipal contract wins.
$122
2.9% 4.8% 2.4% 7.0% 7.3% 6.9%
(1) Does not include anticipated internal infrastructure investments of $40MM - $45MM. (2) Does not include internal infrastructure investments of $26.5MM.
$210 -$220(1)
3.5% 8.2%

13
Internal Infrastructure Investments
Key Areas Strategic Positioning
Internal Infrastructure Investment Opportunities Expected
More strategic and discretionary than normal growth CAPEX Projects span 12-24 months Timing dependent on factors such as permitting and equipment lead times
What we expect Capital expenditures of $80MM Roughly $26MM spent in 2012, and $40-45MM of capital outlay expected in 2013, with balance of spend in 2014.
Impact
Higher internalization, incremental organic revenue and free cash flow starting in 2013 and beyond Low-risk projects resulting in high margin, long-term free cash flow and high return on capital Expect aggregate return in the mid-to-high teens
Project Capital Allocation
Total Expected EBITDA Contribution
2012 2013 2014
2012 ~$26MM ~$1MM
2013 ~$40-45MM ~$6MM Incremental
2014 $8-14MM ~$11-13 MM Incremental, on an annualized basis
Total ~$80MM

2013 Capital Allocation
• Intend to direct excess cash to reduce our leverage and to the payment of our dividend – In Q1 2013, returned $16 million to our shareholders through the payment of
our quarterly dividend and applied approximately $12 million to debt reduction
– At March 31, 2013, total funded debt to EBITDA ratio was 3.07x, down from 3.14x at December 31, 2012
• Opportunistic on acquisitions and share repurchases
14
15
Organic Growth

Q1 2013 Revenue Growth
16
Components of Revenue Growth (Decline)
CAN Q1/13
U.S. Q1/13
Total Company Q1/13
Core Price(1) 0.9% 1.4% 1.2%
Fuel Surcharges 0.1% 0.4% 0.3%
Recycling and Other (1.0%) (0.1%) (0.5%)
Total Price Growth (Decline) - 1.7% 1.0%
Volume Growth (Decline) (3.3%) 3.6% 0.8%
Total Gross Organic Revenue Growth (Decline) (3.3%) 5.3% 1.8%
Acquisitions 7.1% 11.0% 9.5%
Total Growth Excluding FX 3.8% 16.3% 11.3%
FX (0.3%)
Total Growth Including FX 11.0%
(1) Core Price reflects organic average price change, net of rollbacks and excludes fuel surcharges, across the Company’s customer base.
Q1 2013 reported revenues increased 11.0% to $486.6MM

2013 Priorities
1. Complete the integration of ‘tuck-in’ operations acquired in 2012 to obtain full benefit of
the asset synergies. Added 19 strategic ‘tuck-in’ acquisitions in 2012, including seven in Q4/12. Plan for the U.S. Northeast operations well underway, with five acquisitions in 2012 that will
improve landfill internalization.
2. Remain focused on the disciplined deployment of capital to improve ROIC. Strict oversight of replacement and growth capital. Internal infrastructure projects are discretionary investments of growth capital to generate highly
attractive, near-term returns.
3. Leverage strength of core business to deliver organic growth and focus on operational efficiency. Local market-focused sales execution to drive expected consolidated organic growth of 1.0% to
1.5% in 2013, with higher core price offsetting flat volume. Largely recurring revenue in core business, combined with contributions from acquisitions and
infrastructure investments, provides visibility into 2013. Managing all elements of our operating cost structure to precise standards.
17

Houlihan Lokey 8th Annual Industrials Conference Q&A
Thursday, May 8, 2013

2013 Outlook
19
FY 2013E Outlook
Revenues Approximately $2.00 B to $2.02 B
Adjusted EBITDA(A) Approximately $545 MM - $555 MM
Amortization as a % of Revenue Approximately 14.4%
Capital and Landfill Expenditures(2) $250 MM - $265 MM
Cash Taxes $52 MM - $54 MM
Effective Tax Rate 40% of income before tax expense (on an adjusted basis) and net loss from equity accounted investee
Adjusted Net Income(A) per Diluted Share $1.02 - $1.06
Free Cash Flow(B)(2) $160 MM - $170 MM
Expected Annual Cash Dividend (C$) per Share Payable on a Quarterly Basis $0.56
1. Outlook assumes no change in the current economic environment and excludes the impact of any acquisitions we may complete in 2013.
2. Assumes parity between the Canadian and U.S. dollar. 3. Assumes an average recycled commodity price for the year that is equal to our average price for 2012.
(1) Included in our press release for the fourth quarter and year ended December 31, 2012, issued February 14, 2013, was our guidance for the fiscal year ending December 31, 2013, including our 2013 outlook assumptions and factors. This press release is filed on SEDAR and EDGAR. As of April 30, 2013, our guidance, including the related assumptions and factors provided on February 14, 2013 for fiscal year ending December 31, 2013 remains unchanged.
(2) Includes internal infrastructure project investments of $40-$45 million in 2013. (A) Please refer to the definition and explanation of (A) on slide 40. (B) Please refer to the definition and explanation of (B) on slide 42.

2012 Revenue Growth
20
Components of Revenue Growth (Decline)
CAN FY12**
US FY12**
Total Company FY12
Core Price* 2.1% 1.0% 1.4%
Fuel Surcharges 0.3% 0.5% 0.4%
Recycling and Other* (1.6%) (1.7%) (1.6%)
Total Price Growth (Decline) 0.8% (0.2%) 0.2%
Volume (0.9%) (1.4%) (1.2%)
Total gross organic revenue growth (Decline) (0.1%) (1.6%) (1.0%)
Acquisitions 3.7% 5.1% 4.5%
Total growth excluding FX 3.6% 3.5% 3.5%
FX (0.4%)
Total growth including FX 3.1%
(*)Prior period amounts have been adjusted to conform to the current period's presentation. (**)Component percentages for 2012 have been presented on a reportable revenue basis, while component percentages for 2011 have been presented on a gross revenue basis. In addition, component percentages for 2011 have been prepared as if Waste Services, Inc.'s results for the year ended December 31, 2010 were combined with our own for the period from January 1 to June 30, 2010.
FY12 reported revenues increased 3.1% to $1,896.7MM YoY

Non-GAAP Disclosure
21
(A) All references to “Adjusted EBITDA” in this document are to revenues less operating expense and SG&A, excluding certain non-operating or non-recurring SG&A expense, on the consolidated statement of operations and comprehensive income or loss. Adjusted EBITDA excludes some or all of the following: certain SG&A expenses, restructuring expenses, goodwill impairment, amortization, net gain or loss on sale of capital assets, interest on long-term debt, net foreign exchange gain or loss, net gain or loss on financial instruments, loss on extinguishment of debt, other expenses, income taxes and income or loss from equity accounted investee. Adjusted EBITDA is a term used by us that does not have a standardized meaning prescribed by U.S. GAAP and is therefore unlikely to be comparable to similar measures used by other companies. Adjusted EBITDA is a measure of our operating profitability, and by definition, excludes certain items as detailed above. These items are viewed by us as either non-cash (in the case of goodwill impairment, amortization, net gain or loss on financial instruments, net foreign exchange gain or loss, deferred income taxes and net income or loss from equity accounted investee) or non-operating (in the case of certain SG&A expenses, restructuring expenses, net gain or loss on sale of capital assets, interest on long-term debt, loss on extinguishment of debt, other expenses, and current income taxes). Adjusted EBITDA is a useful financial and operating metric for us, our Board of Directors, and our lenders, as it represents a starting point in the determination of free cash flow(B). The underlying reasons for the exclusion of each item are as follows: – Certain SG&A expenses – SG&A expense includes certain non-operating or non-recurring expenses. These expenses include transaction costs or recoveries related to
acquisitions, fair value adjustments attributable to stock options, restricted share expense and payments made to senior executives on their departure. These expenses are not considered an expense indicative of continuing operations. Certain SG&A costs represent a different class of expense than those included in adjusted EBITDA.
– Restructuring expenses – restructuring expenses includes costs to integrate various operating locations with our own, exiting certain property and building and office leases, employee severance and employee relocation costs incurred in connection with our acquisition of WSI. These expenses are not considered an expense indicative of continuing operations. Accordingly, restructuring expenses represent a different class of expense than those included in adjusted EBITDA. – Goodwill impairment – as a non-cash item goodwill impairment has no impact on the determination of free cash flow(B). – Amortization – as a non-cash item amortization has no impact on the determination of free cash flow(B). – Net gain or loss on sale of capital assets – proceeds from the sale of capital assets are either reinvested in additional or replacement capital assets or used to repay revolving
credit facility borrowings. – Interest on long-term debt – interest on long-term debt is a function of our debt/equity mix and interest rates; as such, it reflects our treasury/financing activities and
represents a different class of expense than those included in adjusted EBITDA. – Net foreign exchange gain or loss – as non-cash items, foreign exchange gains or losses have no impact on the determination of free cash flow(B). – Net gain or loss on financial instruments – as non-cash items, gains or losses on financial instruments have no impact on the determination of free cash flow(B). – Loss on extinguishment of debt – loss on extinguishment of debt is a function of our debt financing; as such, it reflects our treasury/financing activities and represents a
different class of expense than those included in adjusted EBITDA. – Other expenses – other expenses typically represent amounts paid to certain management of acquired companies who are retained by us post acquisition and amounts paid
to certain executives in respect of acquisitions successfully completed. These expenses are not considered an expense indicative of continuing operations. Accordingly, other expenses represent a different class of expense than those included in adjusted EBITDA.
– Income taxes – income taxes are a function of tax laws and rates and are affected by matters which are separate from our daily operations. – Net income or loss from equity accounted investee – as a non-cash item, net income or loss from our equity accounted investee has no impact on the determination of free
cash flow(B). Continued on next slide.

Non-GAAP Disclosure – continued
22
All references to “Adjusted EBITA” in this document represent Adjusted EBITDA after deducting amortization of capital and landfill assets. All references to “Adjusted operating income or adjusted operating EBIT” in this document represent Adjusted EBITDA after adjusting for net gain or loss on the sale of capital assets and all amortization expense. All references to “Adjusted net income” are to adjusted operating income after adjusting for restructuring expenses and goodwill impairment, net gain or loss on financial instruments, loss on extinguishment of debt, other expenses and net income tax expense or recovery. Adjusted EBITA, Adjusted operating income or adjusted operating EBIT, and Adjusted net income should not be construed as measures of income or of cash flows. Collectively, these terms do not have standardized meanings prescribed by U.S. GAAP and are therefore unlikely to be comparable to similar measures used by other companies. Each of these measures are important for investors and are used by management in the management of its business. Adjusted operating income or adjusted operating EBIT removes the impact of a company’s capital structure and its tax rates when comparing the results of companies within or across industry sectors. Management uses Adjusted operating EBIT as a measure of how its operations are performing and to focus attention on amortization and depreciation expense to drive higher returns on invested capital. In addition, Adjusted operating EBIT is used by management as a means to measure the performance of its operating locations and is a significant metric in the determination of compensation for certain employees. Adjusted EBITA accomplishes a similar comparative result as Adjusted operating EBIT, but further removes amortization attributable to intangible assets. Intangible assets are measured at fair value when we complete an acquisition and amortized over their estimated useful lives. We view capital and landfill asset amortization as a proxy for the amount of capital reinvestment required to continue operating our business steady state. We believe that the replacement of intangible assets is not required to continue our operations as the costs associated with continuing operations are already captured in operating or selling, general and administration expenses. Accordingly, we view Adjusted EBITA as a measure that eliminates the impact of a company’s acquisitive nature and permits a higher degree of comparability across companies within our industry or across different sectors from an operating performance perspective. Finally, Adjusted net income is a measure of our overall earnings and profits and is further used to calculate our net income per share. Adjusted net income reflects what we believe is our “operating” net income which excludes certain non-operating income or expenses. Adjusted net income is an important measure of a company’s ability to generate profit and earnings for its shareholders which is used to compare company performance both amongst and between industry sectors.
(‘000s) Three months ended March 31
2013 2012 Operating income $ 59,174 $ 50,372 Transaction and related (recoveries) costs - SG&A (565) 288 Fair value movements in stock options - SG&A (505) 1,644 Restricted share expense - SG&A 265 734 Adjusted operating income or adjusted operating EBIT(A) 58,369 53,038 Net gain on sale of capital assets (617) (384) Amortization 71,299 63,654 Adjusted EBITDA(A) 129,051 116,308 Amortization of capital and landfill assets (55,939) (50,726) Adjusted EBITA(A) $ 73,112 $ 65,582

Non-GAAP Disclosure – continued
23
(B) We have adopted a measure called “free cash flow” to supplement net income or loss as a measure of our operating performance. Free cash flow is a term which does not have a standardized meaning prescribed by U.S. GAAP, is prepared before dividends declared and shares repurchased, and may not be comparable to similar measures prepared by other companies. The purpose of presenting this non-GAAP measure is to provide disclosure similar to the disclosure provided by other U.S. publicly listed companies in our industry and to provide investors and analysts with an additional measure of our value and liquidity. We use this non-GAAP measure to assess our performance relative to other U.S. publicly listed companies and to assess the availability of funds for growth investment, debt repayment, share repurchases or dividend increases. All references to “free cash flow” in this document have the meaning set out in this note.
(‘000s) Three months ended March 31
2013 (*) 2012 (*) Change Adjusted EBITDA(A) $ 129,051 $ 116,308 $ 12,743
Purchase of restricted shares (358) - (358) Capital and landfill asset purchases (61,386) (50,091) (11,295) Proceeds from the sale of capital assets 1,121 719 402 Landfill closure and post- closure expenditures (795) (1,534) 739 Landfill closure and post- closure cost accretion expense 1,409 1,308 101 Interest on long-term debt (15,243) (14,264) (979) Non-cash interest expense 856 1,690 (834) Current income tax expense (9,799) (10,425) 626 Free cash flow(B) $ 44,856 $ 43,711 $ 1,145
Note: (*) Capital and landfill asset purchases include infrastructure expenditures of approximately $14,400 and $3,600 for the three months ended March 31, 2013 and 2012, respectively.