Hotel Feasibility Project Hilton Niagara Falls Fallsview ... · Web viewLuxury hotel and spa....
54
Elham Bolooki and Conrad Sokolnicki FINN901 Hotel Feasibility Project Hilton Niagara Falls Fallsview Hotel and Suites
Transcript of Hotel Feasibility Project Hilton Niagara Falls Fallsview ... · Web viewLuxury hotel and spa....
Elham Bolooki and Conrad Sokolnicki
FINN901
Hotel Feasibility Project Hilton Niagara Falls Fallsview Hotel and Suites
Executive Summary
The following report is a financial feasibility study on acquiring the Hilton Niagara Falls
Fallsview Hotel and Suites. Niagara Falls, Ontario, Canada is a popular tourist destination
with many entertainment and natural attractions that welcomes around 12 million visitors
annually. The Hilton Niagara Falls located in the destination is a 965 room property with 6
food and beverage outlets and meeting spaces located conveniently close to many attractions
in the city. Three competitors of the hotel include the Four Points by Sheraton Niagara Falls
Fallsview, Fallsview Casino Hotel, and the Crowne Plaza Niagara Falls Fallsview. Valuation
of the hotel was based on a three year average city wide ADR of USD 109.20 and occupancy
of 57.4%. A national debt to equity ratio of 60:40 was identified with a 4% interest rate and
17% ROE resulting in a cap rate of 10.71%. These figures valued the property at USD
103,015,000. Upon further investigation it was identified that an owner operated management
structure would produce the highest EBITDA during the stabilized year of around USD
11,139,000. Ten year cash flow, amortization, and depreciation are calculated for the
property. Using these figures NPV of the cash flow is calculated along with discounted
payback. The results showed a negative NPV and payback periods of longer than 10 years
(i.e. the holding period) under cash flow from property and cash flow to equity. As such it is
deemed that under current and forecasted market conditions, acquiring the Hilton Niagara
Falls Fallsview Hotel and Suites would not be feasible and therefore it is not recommended to
proceed with the investment. Should the investor proceed to go ahead with the project, great
efforts need to be made to increase revenues or decrease costs and in particular increase
occupancy rates to encourage the feasibility of the project.
Table of Content
i
sIntroduction................................................................................................................................1
Background – About Niagara Falls........................................................................................1Description of Chosen Property.............................................................................................3
Reason for Choosing this Location and Hotel...........................................................................6Justifications...............................................................................................................................8
Average Daily Rate................................................................................................................8Occupancy Rates....................................................................................................................8Food and Beverage Revenue..................................................................................................8Other Revenue........................................................................................................................8Departmental Expenses..........................................................................................................9Undistributed Expenses..........................................................................................................9Fixed Charges.........................................................................................................................9
Valuation..................................................................................................................................11Forecasted EBITDA at Purchase.........................................................................................11Capital Requirements...........................................................................................................12Valuation Using Income Method.........................................................................................13
Operational Structures..............................................................................................................14Descriptions of Operational Structures................................................................................14Operational Structures - Stable Year EBITDA....................................................................17Stable Year EBITDA Summary...........................................................................................21
11 Year EBITDA Forecast.......................................................................................................22Estimated Amortization...........................................................................................................23Depreciation of the Property....................................................................................................24Cash Flow of the Property........................................................................................................25Feasibility of Property..............................................................................................................26
Net Present Value (NPV) of Cash Flows.............................................................................26Average Accounting Return (ARR).....................................................................................26Payback Period.....................................................................................................................27
Discussion................................................................................................................................28References................................................................................................................................30
ii
Introduction
The chosen city for the feasibility study is Niagara Falls, Ontario, Canada.
Background – About Niagara Falls
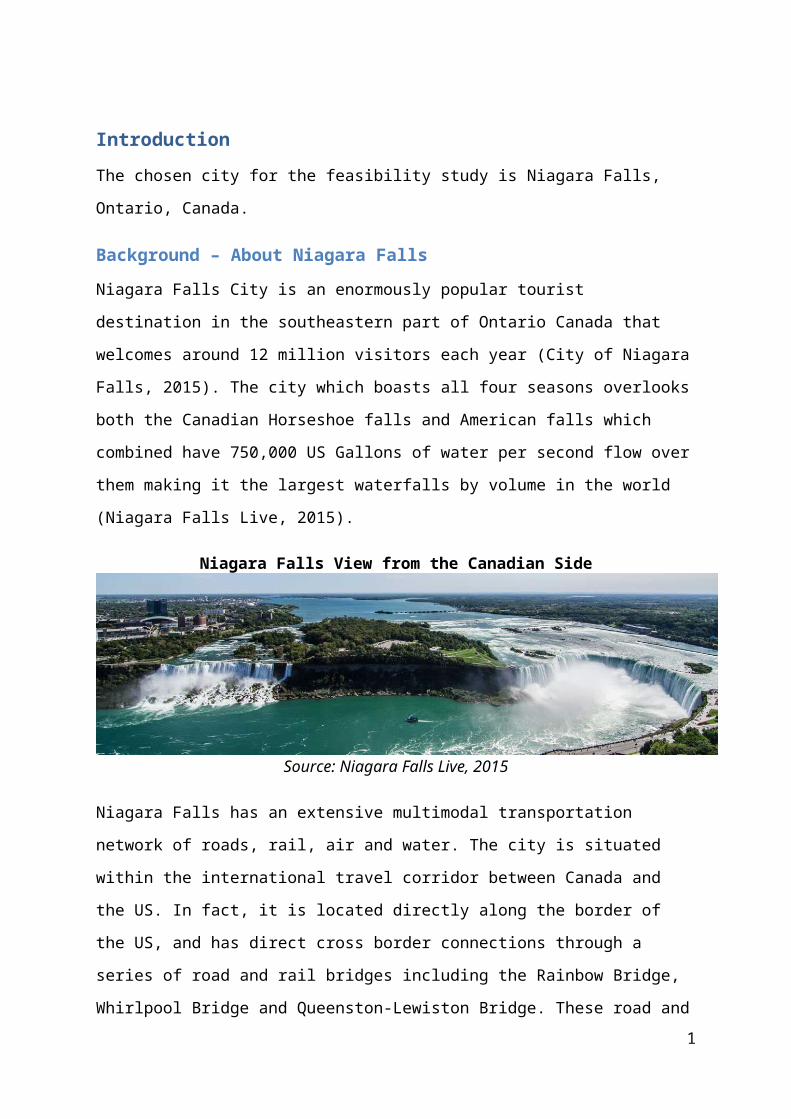
Niagara Falls City is an enormously popular tourist destination in the southeastern part of
Ontario Canada that welcomes around 12 million visitors each year (City of Niagara Falls,
2015). The city which boasts all four seasons overlooks both the Canadian Horseshoe falls
and American falls which combined have 750,000 US Gallons of water per second flow over
them making it the largest waterfalls by volume in the world (Niagara Falls Live, 2015).
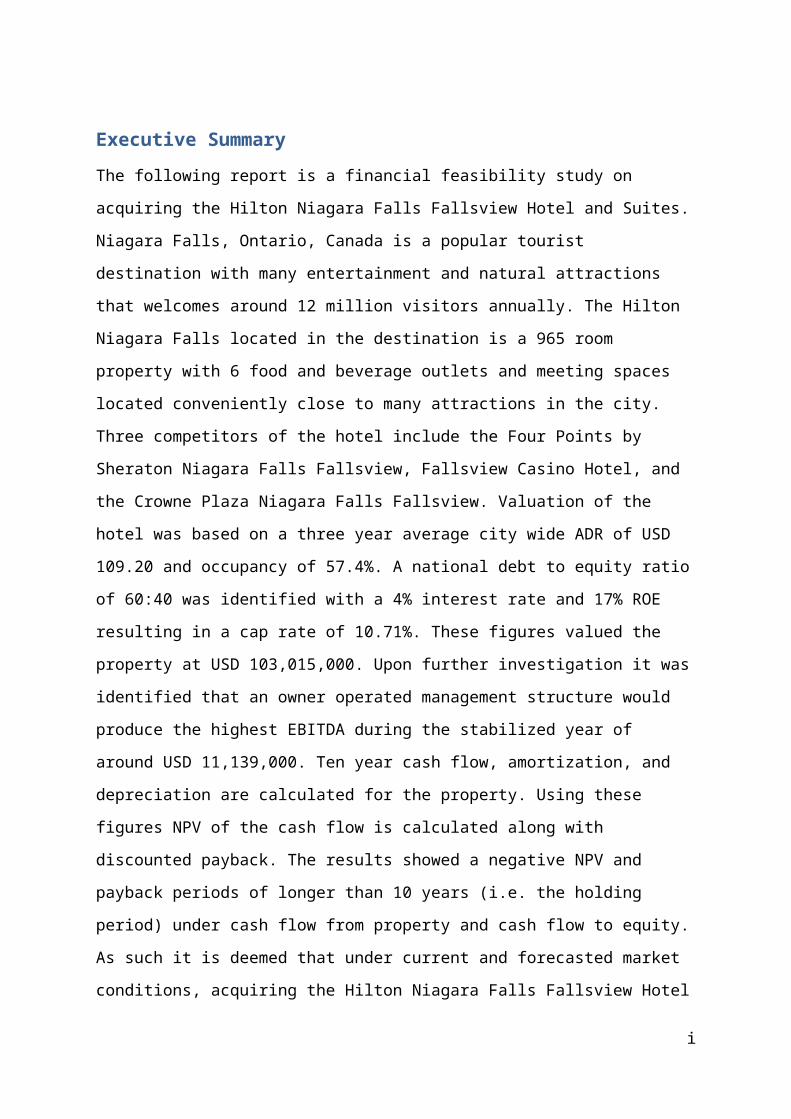
Niagara Falls View from the Canadian Side
Source: Niagara Falls Live, 2015
Niagara Falls has an extensive multimodal transportation network of roads, rail, air and
water. The city is situated within the international travel corridor between Canada and the
US. In fact, it is located directly along the border of the US, and has direct cross border
connections through a series of road and rail bridges including the Rainbow Bridge,
Whirlpool Bridge and Queenston-Lewiston Bridge. These road and rail links connect all
major 400 series national highways in Canada to the US state highway system. Niagara Falls
is also located within an hour’s drive from three international airports while private charter
flights can make it even closer to the city at the Niagara District Airport located minutes from
the downtown area (City of Niagara Falls, 2015).
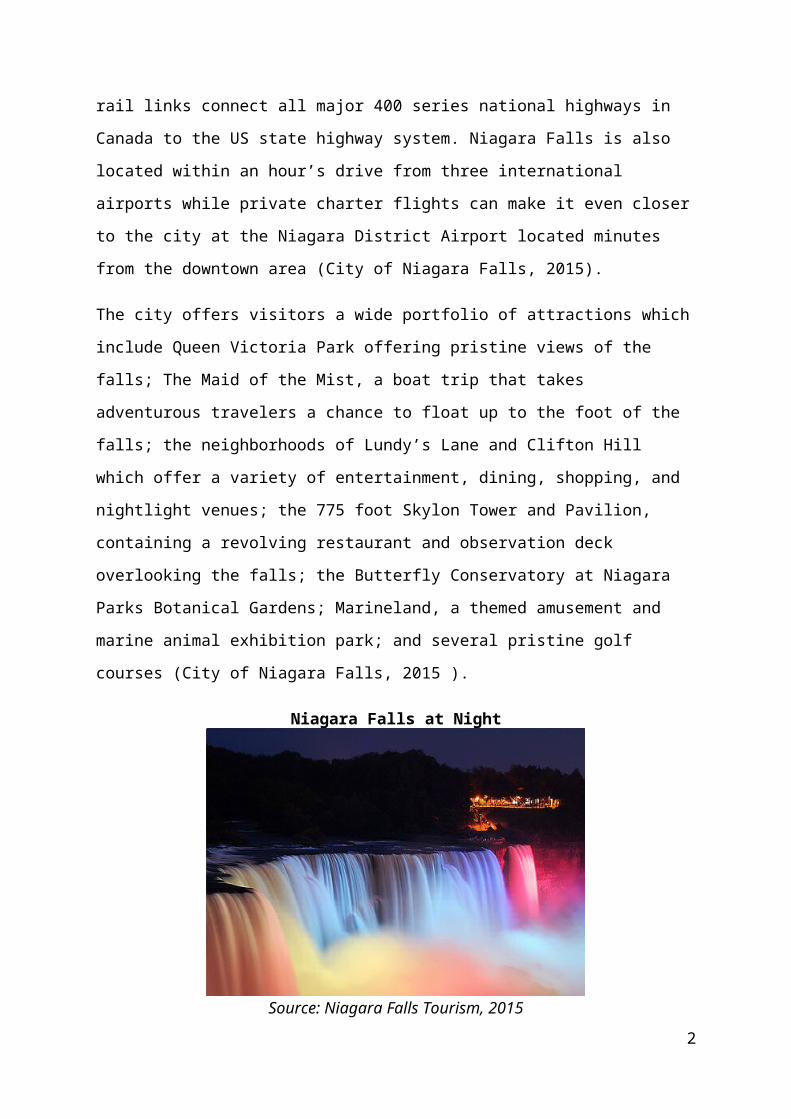
The city offers visitors a wide portfolio of attractions which include Queen Victoria Park
offering pristine views of the falls; The Maid of the Mist, a boat trip that takes adventurous
travelers a chance to float up to the foot of the falls; the neighborhoods of Lundy’s Lane and
Clifton Hill which offer a variety of entertainment, dining, shopping, and nightlight venues;
the 775 foot Skylon Tower and Pavilion, containing a revolving restaurant and observation
1

deck overlooking the falls; the Butterfly Conservatory at Niagara Parks Botanical Gardens;
Marineland, a themed amusement and marine animal exhibition park; and several pristine
golf courses (City of Niagara Falls, 2015 ).
Niagara Falls at Night
Source: Niagara Falls Tourism, 2015
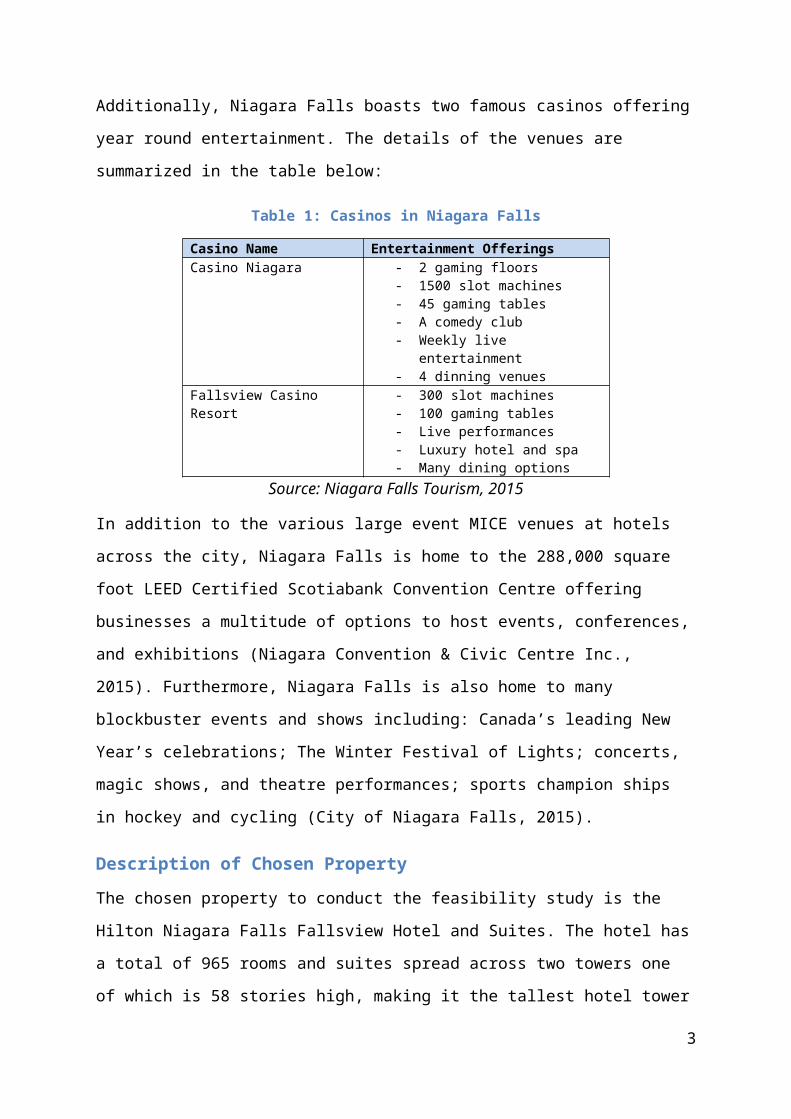
Additionally, Niagara Falls boasts two famous casinos offering year round entertainment.
The details of the venues are summarized in the table below:
Table 1: Casinos in Niagara Falls
Casino Name Entertainment OfferingsCasino Niagara - 2 gaming floors
- 1500 slot machines- 45 gaming tables- A comedy club- Weekly live entertainment- 4 dinning venues
Fallsview Casino Resort - 300 slot machines- 100 gaming tables- Live performances- Luxury hotel and spa- Many dining options
Source: Niagara Falls Tourism, 2015
In addition to the various large event MICE venues at hotels across the city, Niagara Falls is
home to the 288,000 square foot LEED Certified Scotiabank Convention Centre offering
businesses a multitude of options to host events, conferences, and exhibitions (Niagara
Convention & Civic Centre Inc., 2015). Furthermore, Niagara Falls is also home to many
blockbuster events and shows including: Canada’s leading New Year’s celebrations; The
Winter Festival of Lights; concerts, magic shows, and theatre performances; sports champion
ships in hockey and cycling (City of Niagara Falls, 2015).
2
Description of Chosen Property
The chosen property to conduct the feasibility study is the Hilton Niagara Falls Fallsview
Hotel and Suites. The hotel has a total of 965 rooms and suites spread across two towers one
of which is 58 stories high, making it the tallest hotel tower in Canada. The property is
awarded the AAA and CAA 4 Diamond Award, which roughly translates to a 4 star hotel
(Hilton Niagara Falls Fallsview, 2015).
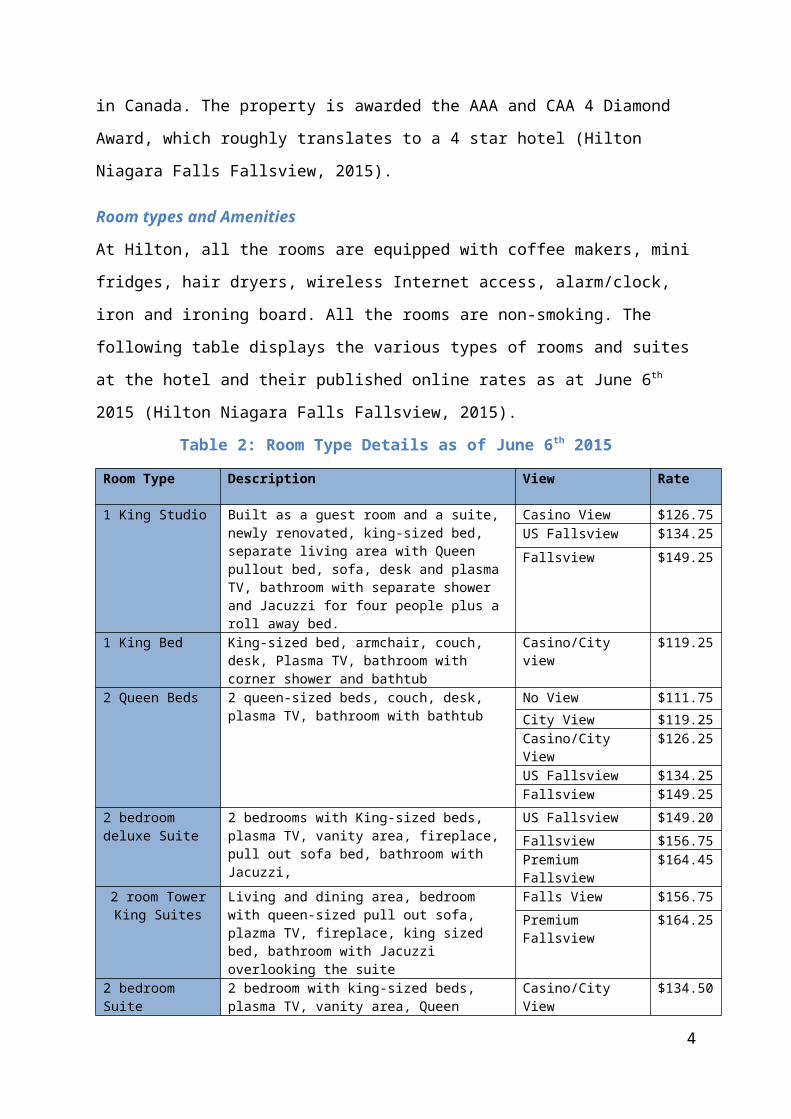
Room types and Amenities
At Hilton, all the rooms are equipped with coffee makers, mini fridges, hair dryers, wireless
Internet access, alarm/clock, iron and ironing board. All the rooms are non-smoking. The
following table displays the various types of rooms and suites at the hotel and their published
online rates as at June 6th 2015 (Hilton Niagara Falls Fallsview, 2015).
Table 2: Room Type Details as of June 6th 2015
Room Type Description View Rate
1 King Studio Built as a guest room and a suite, newly renovated, king-sized bed, separate living area with Queen pullout bed, sofa, desk and plasma TV, bathroom with separate shower and Jacuzzi for four people plus a roll away bed.
Casino View $126.75US Fallsview $134.25
Fallsview $149.25
1 King Bed King-sized bed, armchair, couch, desk, Plasma TV, bathroom with corner shower and bathtub
Casino/City view $119.25
2 Queen Beds 2 queen-sized beds, couch, desk, plasma TV, bathroom with bathtub
No View $111.75
City View $119.25Casino/City View $126.25US Fallsview $134.25Fallsview $149.25
2 bedroom deluxe Suite
2 bedrooms with King-sized beds, plasma TV, vanity area, fireplace, pull out sofa bed, bathroom with Jacuzzi,
US Fallsview $149.20
Fallsview $156.75Premium Fallsview $164.45
2 room Tower King Suites
Living and dining area, bedroom with queen-sized pull out sofa, plazma TV, fireplace, king sized bed, bathroom with Jacuzzi overlooking the suite
Falls View $156.75
Premium Fallsview $164.25
2 bedroom Suite 2 bedroom with king-sized beds, plasma TV, vanity area, Queen pullout sofa and bathroom with Jacuzzi
Casino/City View $134.50
Source: Hilton Niagara Falls Fallsview, 2015
3
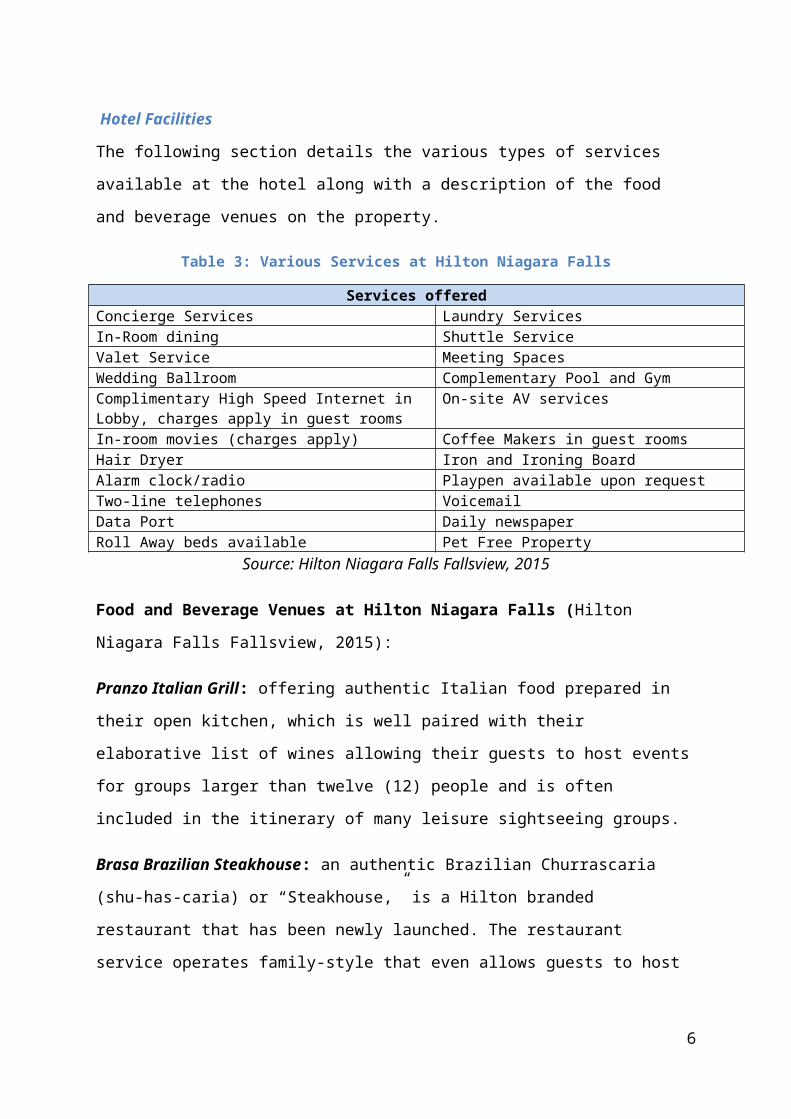
Hotel Facilities
The following section details the various types of services available at the hotel along with a
description of the food and beverage venues on the property.
Table 3: Various Services at Hilton Niagara Falls
Services offeredConcierge Services Laundry ServicesIn-Room dining Shuttle ServiceValet Service Meeting SpacesWedding Ballroom Complementary Pool and GymComplimentary High Speed Internet in Lobby, charges apply in guest rooms
On-site AV services
In-room movies (charges apply) Coffee Makers in guest roomsHair Dryer Iron and Ironing BoardAlarm clock/radio Playpen available upon requestTwo-line telephones VoicemailData Port Daily newspaperRoll Away beds available Pet Free Property
Source: Hilton Niagara Falls Fallsview, 2015
Food and Beverage Venues at Hilton Niagara Falls (Hilton Niagara Falls Fallsview,
2015):
Pranzo Italian Grill: offering authentic Italian food prepared in their open kitchen, which is
well paired with their elaborative list of wines allowing their guests to host events for groups
larger than twelve (12) people and is often included in the itinerary of many leisure
sightseeing groups.
Brasa Brazilian Steakhouse: an authentic Brazilian Churrascaria (shu-has-caria) or
“Steakhouse,” is a Hilton branded restaurant that has been newly launched. The restaurant
service operates family-style that even allows guests to host events for groups larger than
twelve (12) people and is often included in the itinerary of many leisure sightseeing groups.
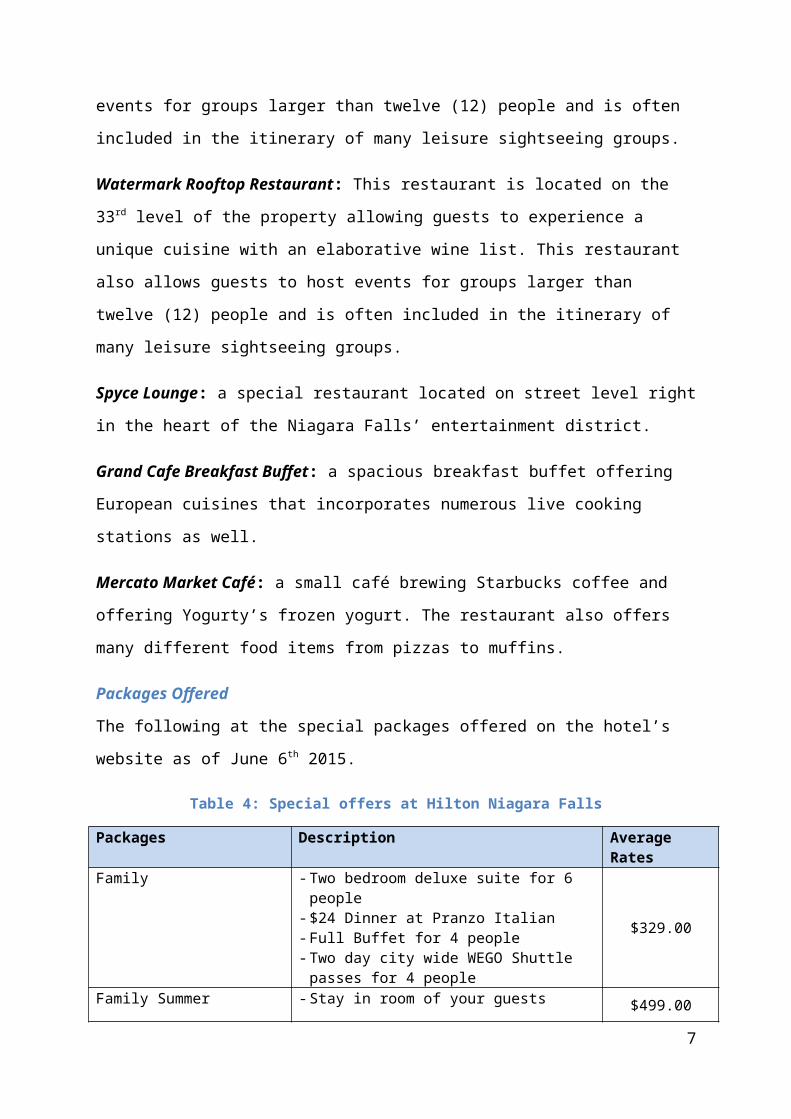
Watermark Rooftop Restaurant: This restaurant is located on the 33rd level of the property
allowing guests to experience a unique cuisine with an elaborative wine list. This restaurant
also allows guests to host events for groups larger than twelve (12) people and is often
included in the itinerary of many leisure sightseeing groups.
Spyce Lounge: a special restaurant located on street level right in the heart of the Niagara
Falls’ entertainment district.
4
Grand Cafe Breakfast Buffet: a spacious breakfast buffet offering European cuisines that
incorporates numerous live cooking stations as well.
Mercato Market Café: a small café brewing Starbucks coffee and offering Yogurty’s frozen
yogurt. The restaurant also offers many different food items from pizzas to muffins.
Packages Offered
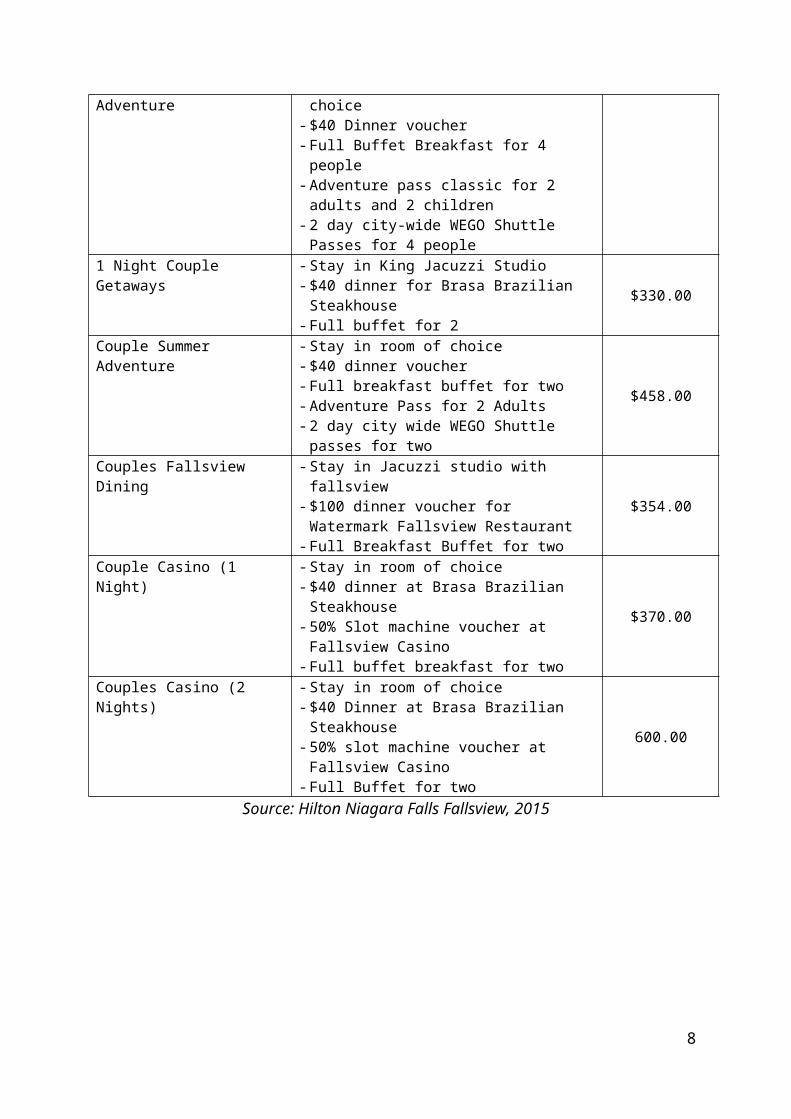
The following at the special packages offered on the hotel’s website as of June 6th 2015.
Table 4: Special offers at Hilton Niagara Falls
Packages Description Average RatesFamily - Two bedroom deluxe suite for 6 people
- $24 Dinner at Pranzo Italian- Full Buffet for 4 people- Two day city wide WEGO Shuttle passes for 4
people
$329.00
Family Summer Adventure - Stay in room of your guests choice- $40 Dinner voucher- Full Buffet Breakfast for 4 people- Adventure pass classic for 2 adults and 2
children- 2 day city-wide WEGO Shuttle Passes for 4
people
$499.00
1 Night Couple Getaways - Stay in King Jacuzzi Studio- $40 dinner for Brasa Brazilian Steakhouse- Full buffet for 2
$330.00
Couple Summer Adventure - Stay in room of choice- $40 dinner voucher- Full breakfast buffet for two- Adventure Pass for 2 Adults- 2 day city wide WEGO Shuttle passes for two
$458.00
Couples Fallsview Dining - Stay in Jacuzzi studio with fallsview- $100 dinner voucher for Watermark Fallsview
Restaurant- Full Breakfast Buffet for two
$354.00
Couple Casino (1 Night) - Stay in room of choice- $40 dinner at Brasa Brazilian Steakhouse- 50% Slot machine voucher at Fallsview Casino- Full buffet breakfast for two
$370.00
Couples Casino (2 Nights) - Stay in room of choice- $40 Dinner at Brasa Brazilian Steakhouse- 50% slot machine voucher at Fallsview Casino- Full Buffet for two
600.00
Source: Hilton Niagara Falls Fallsview, 2015
5
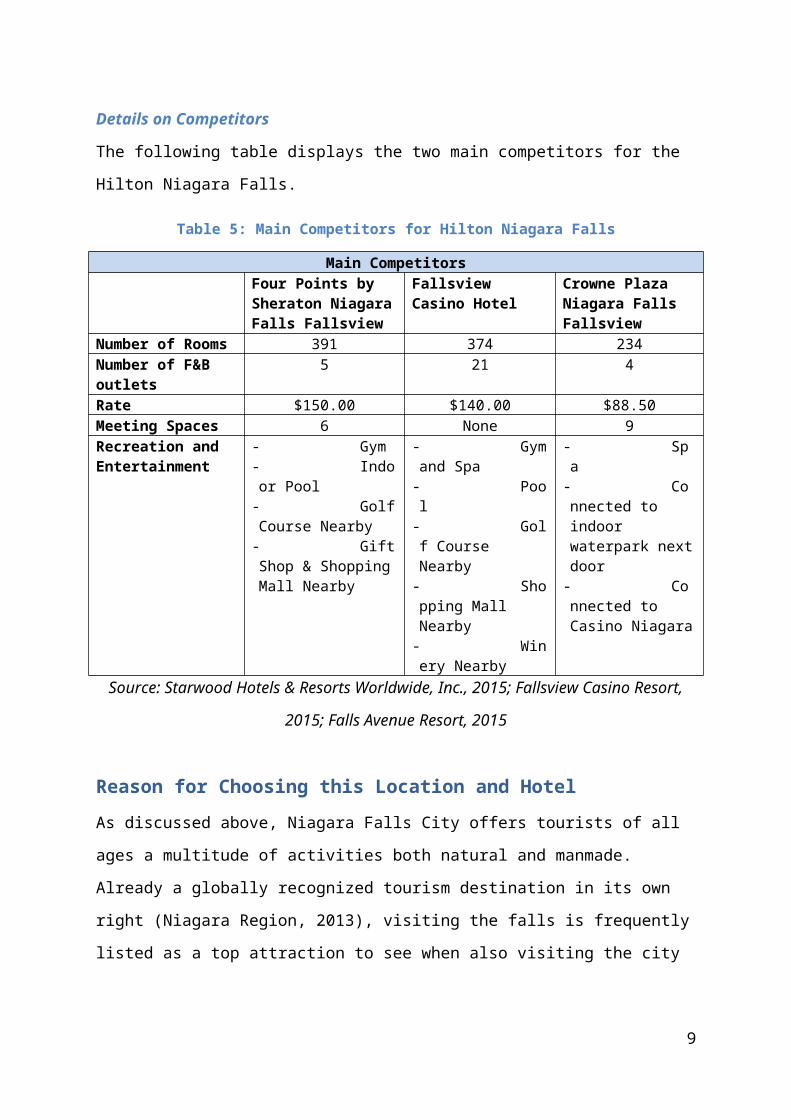
Details on Competitors
The following table displays the two main competitors for the Hilton Niagara Falls.
Table 5: Main Competitors for Hilton Niagara Falls
Main CompetitorsFour Points by Sheraton Niagara Falls Fallsview
Fallsview Casino Hotel
Crowne Plaza Niagara Falls Fallsview
Number of Rooms 391 374 234Number of F&B outlets
5 21 4
Rate $150.00 $140.00 $88.50Meeting Spaces 6 None 9Recreation and Entertainment
- Gym- Indoor Pool- Golf Course Nearby- Gift Shop & Shopping Mall Nearby
- Gym and Spa- Pool- Golf Course Nearby- Shopping Mall Nearby
- Winery Nearby
- Spa- Connected to indoor waterpark next door
- Connected to Casino Niagara
Source: Starwood Hotels & Resorts Worldwide, Inc., 2015; Fallsview Casino Resort, 2015;
Falls Avenue Resort, 2015
Reason for Choosing this Location and Hotel
As discussed above, Niagara Falls City offers tourists of all ages a multitude of activities both
natural and manmade. Already a globally recognized tourism destination in its own right
(Niagara Region, 2013), visiting the falls is frequently listed as a top attraction to see when
also visiting the city of Toronto, a major tourism destination for Canada as well, located only
a 2 hour journey away.
The city already welcomes 12 million tourists annually (Niagara Falls Tourism, 2015) 42% of
which are international visitors (Niagara Region, 2013). Visitors to the city bring in CAD 1.5
billion in annual receipts accounting for 10% of the province of Ontario’s annual tourism
receipts (Niagara Region, 2013). Over one-third of all visitors to Niagara Falls stay overnight
with 50% of overnight visitors staying in a hotel, motel or B&B (Niagara Falls Tourism,
2015). In addition to Niagara Falls already having a vibrant and diverse tourism industry,
choosing Niagara to invest in is strongly supported by the economic development plans of the
city. Tourism is listing among the 4 key areas that the Niagara Region will focus on for
continual development over the coming years (Niagara Region, 2013).
6

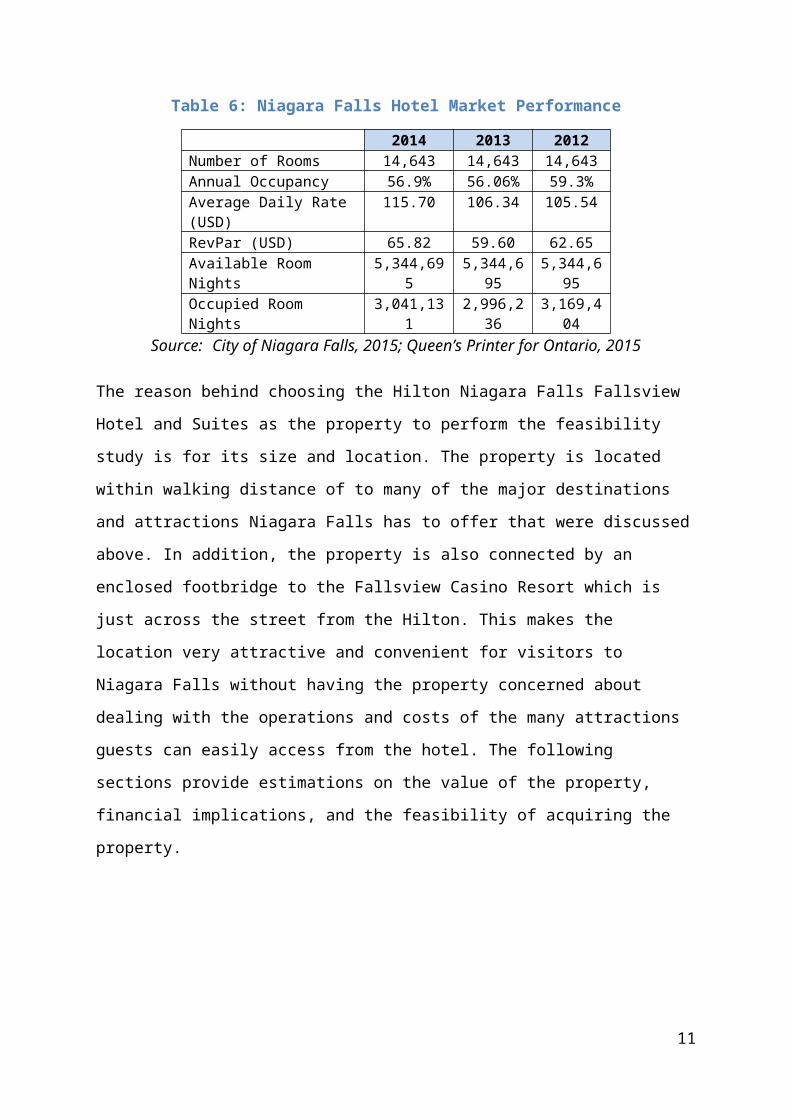
That being said however, no new construction of any hotel properties was seen in 2013 and
2014 in the Niagara Falls region (Colliers International, 2015). 2015 is also not expected to
see any new hotel opening, so the room count for the city will remain stable. Nationwide
there was a growth in RevPAR of 6.2% in 2014, which is anticipated to be a peaking point,
meaning that there will be a dampened gain in 2015. Taking this into account, average
growth in ADR in the property is expected to be around 0.5% over the coming years. The
following table gives a snapshot of the hotel market performance in Niagara Falls.
Table 6: Niagara Falls Hotel Market Performance
2014 2013 2012Number of Rooms 14,643 14,643 14,643Annual Occupancy 56.9% 56.06% 59.3%Average Daily Rate (USD) 115.70 106.34 105.54RevPar (USD) 65.82 59.60 62.65Available Room Nights 5,344,695 5,344,695 5,344,695Occupied Room Nights 3,041,131 2,996,236 3,169,404
Source: City of Niagara Falls, 2015; Queen’s Printer for Ontario, 2015
The reason behind choosing the Hilton Niagara Falls Fallsview Hotel and Suites as the
property to perform the feasibility study is for its size and location. The property is located
within walking distance of to many of the major destinations and attractions Niagara Falls has
to offer that were discussed above. In addition, the property is also connected by an enclosed
footbridge to the Fallsview Casino Resort which is just across the street from the Hilton. This
makes the location very attractive and convenient for visitors to Niagara Falls without having
the property concerned about dealing with the operations and costs of the many attractions
guests can easily access from the hotel. The following sections provide estimations on the
value of the property, financial implications, and the feasibility of acquiring the property.
7
Justifications
The following section provides justifications for the values used in conducting the feasibility
study. A table summarizing all the performance details can be found at the end of the section.
Average Daily Rate
The average daily rate in the Niagara Falls region was found to be USD 105.54 in 2012,
106.34 in 2013 and USD 115.70 in 2014 (City of Niagara Falls, 2015; Queen’s Printer for
Ontario, 2015). An average of these three rates was taken to estimate the ADR for Niagara
Falls in 2015, which calculates to USD 109.20. This will be the estimated probably ADR
used for the valuation of this property. USD 20 will be added and subtracted for the
optimistic and pessimistic scenarios respectively.
Occupancy Rates
Occupancy rates in Niagara Falls region were found to be 59.3% in 2012, 56.1% in 2013 and
56.9% in 2014 (City of Niagara Falls, 2015; Queen’s Printer for Ontario, 2015). As with the
ADR, an average of these three values was taken to estimate the occupancy for Niagara Falls
in 2015, which calculates to an occupancy percentage of 57.4%. This will be the estimated
probable occupancy percentage for the valuation of this property. 7% will be added and
subtracted for the optimistic and pessimistic scenarios respectively.
Food and Beverage Revenue
After looking at the various food and beverage outlets at the property, it was estimated that
the average check per person would be around USD 40.00 (Hilton Niagara Falls Fallsview,
2015). It is assumed that each room has an average occupancy of 2 people per room (i.e.
considering an average of single occupancy, couples, and small families). However since
there are a variety of dining options outside of the hotel it is therefore assumed that average
food and beverage revenue per room is 1.5 of the average check, i.e. around USD 60.00. USD
5.00 will be added and subtracted for the optimistic and pessimistic scenarios respectively.
Other Revenue
Apart from a small gift shop, the property does not have many facilities other than rooms and
restaurants that could generate extra revenue. Spa and retail space that is advertised on the
website is actually available next door in the Fallsview Casino Resort, connected by bridge
which does not generate revenue for the Hilton (Hilton Niagara Falls Fallsview, 2015).
8
However, there is a relatively small ballroom and several meeting rooms which total to
around 8,700 square feet in area (Hilton Niagara Falls Fallsview, 2015). The combined
revenue is rather small and so it is only estimated that around 5% of total revenue can be
classified as other revenue.
Departmental Expenses
Due to the similarities in culture, business processes, and economic ties, some calculations
and figures will be based on US or North American figures.
Rooms: according to Rushmore (2011) expenses for rooms varies across the globe. In India
they are quite low while in Europe they are quite high because of various regulations and
high labor costs. In North America and South America rooms department expenses are said
to be around 22%. For the valuation of this property, 22% rooms department expense will be
used.
Food and Beverage: as well according to Rushmore (2011) expenses for food and beverage
varies around the world. As with rooms, in India the costs are lower at around 45.5%. In the
United States the rate is around 68%. This same rate will be used for the valuation of this
property.
Other: according to an HVS report (Rushmore, 2011), other departmental expenses were at
around 29% of other revenue in the US. Therefore this same rate will be used for the
valuation of this property.
Undistributed Expenses
Undistributed operating expenses include expenses related to administrative and general
operations, sales and marketing, utilities (i.e. water and electricity), and final repairs and
maintenance. Findings from an HVS report based on a hotel in the US will be used to
calculate the percent total of the undistributed expenses as follows (Rushmore, 2011):
Administrative and General: 7% Sales and Marketing: 6%Utilities: 3% Repairs & Maintenance: 4%
Fixed Charges
According to the Niagara Falls City government, commercial tax rate for the property will be
around 3%. This will then be applied to the valuation of the property (City of Niagara Falls,
2015).
9
Insurance for full service hotels was said to grow to around 2.5% of total revenue in Canada
in 2015 (Rosszell, 2002).
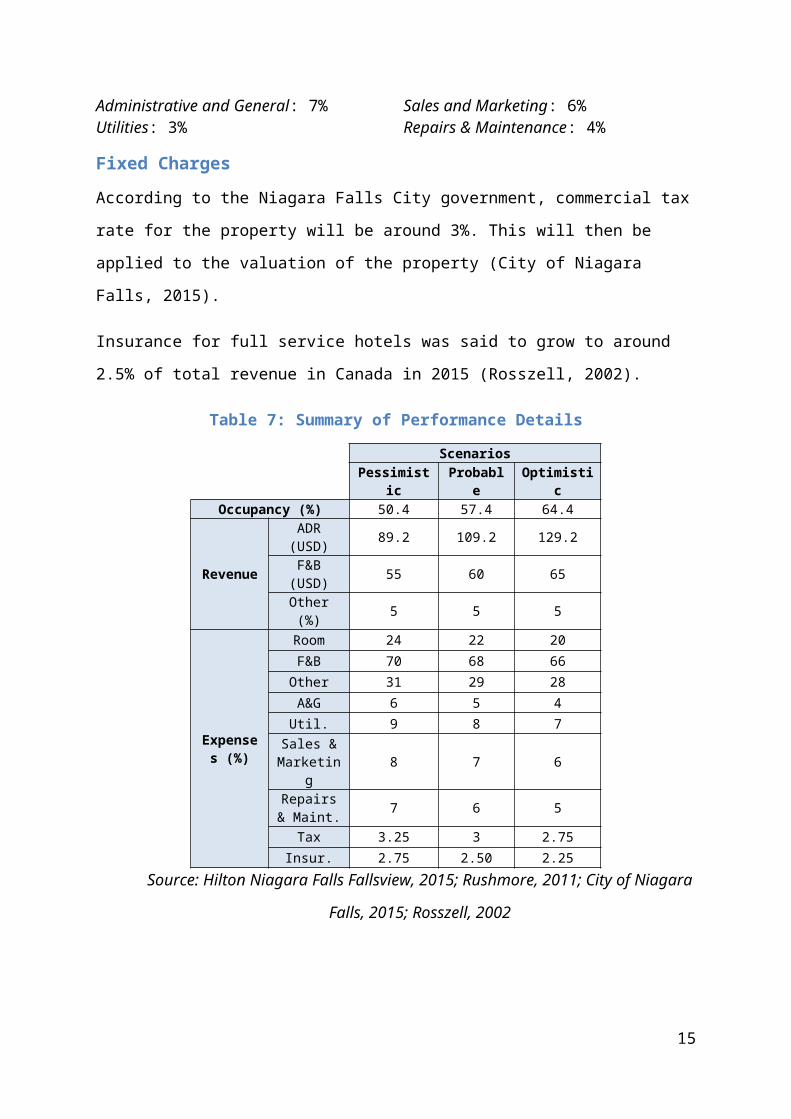
Table 7: Summary of Performance Details
ScenariosPessimistic Probable Optimistic
Occupancy (%) 50.4 57.4 64.4
Revenue
ADR (USD) 89.2 109.2 129.2
F&B (USD) 55 60 65Other (%) 5 5 5
Expenses (%)
Room 24 22 20F&B 70 68 66Other 31 29 28A&G 6 5 4Util. 9 8 7
Sales & Marketing 8 7 6
Repairs & Maint. 7 6 5
Tax 3.25 3 2.75Insur. 2.75 2.50 2.25
Source: Hilton Niagara Falls Fallsview, 2015; Rushmore, 2011; City of Niagara
Falls, 2015; Rosszell, 2002
10
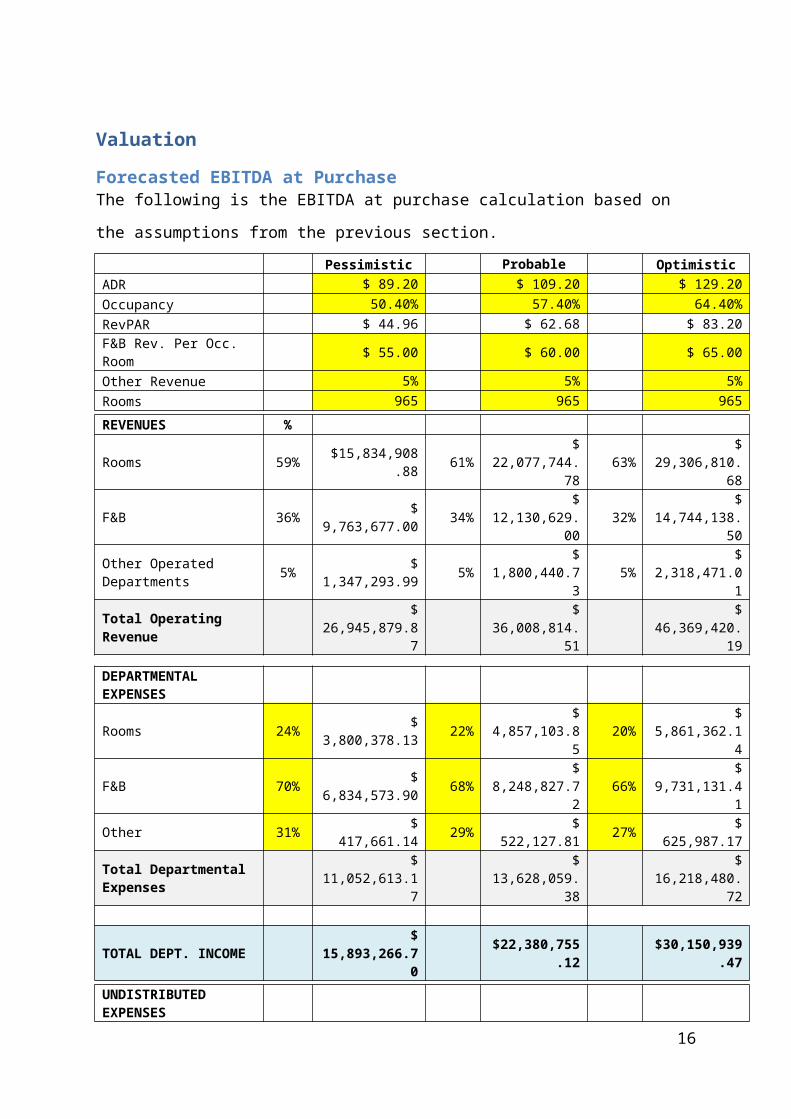
Valuation
Forecasted EBITDA at PurchaseThe following is the EBITDA at purchase calculation based on the assumptions from the
previous section.
Pessimistic Probable OptimisticADR $ 89.20 $ 109.20 $ 129.20
Occupancy 50.40% 57.40% 64.40%
RevPAR $ 44.96 $ 62.68 $ 83.20
F&B Rev. Per Occ. Room $ 55.00 $ 60.00 $ 65.00
Other Revenue 5% 5% 5%
Rooms 965 965 965
REVENUES %Rooms 59% $15,834,908.88 61% $ 22,077,744.78 63% $ 29,306,810.68F&B 36% $ 9,763,677.00 34% $ 12,130,629.00 32% $ 14,744,138.50Other Operated Departments 5% $ 1,347,293.99 5% $ 1,800,440.73 5% $ 2,318,471.01Total Operating Revenue $ 26,945,879.87 $ 36,008,814.51 $ 46,369,420.19
DEPARTMENTAL EXPENSESRooms 24% $ 3,800,378.13 22% $ 4,857,103.85 20% $ 5,861,362.14F&B 70% $ 6,834,573.90 68% $ 8,248,827.72 66% $ 9,731,131.41Other 31% $ 417,661.14 29% $ 522,127.81 27% $ 625,987.17Total Departmental Expenses $ 11,052,613.17 $ 13,628,059.38 $ 16,218,480.72
TOTAL DEPT. INCOME $ 15,893,266.70 $22,380,755.12 $30,150,939.47
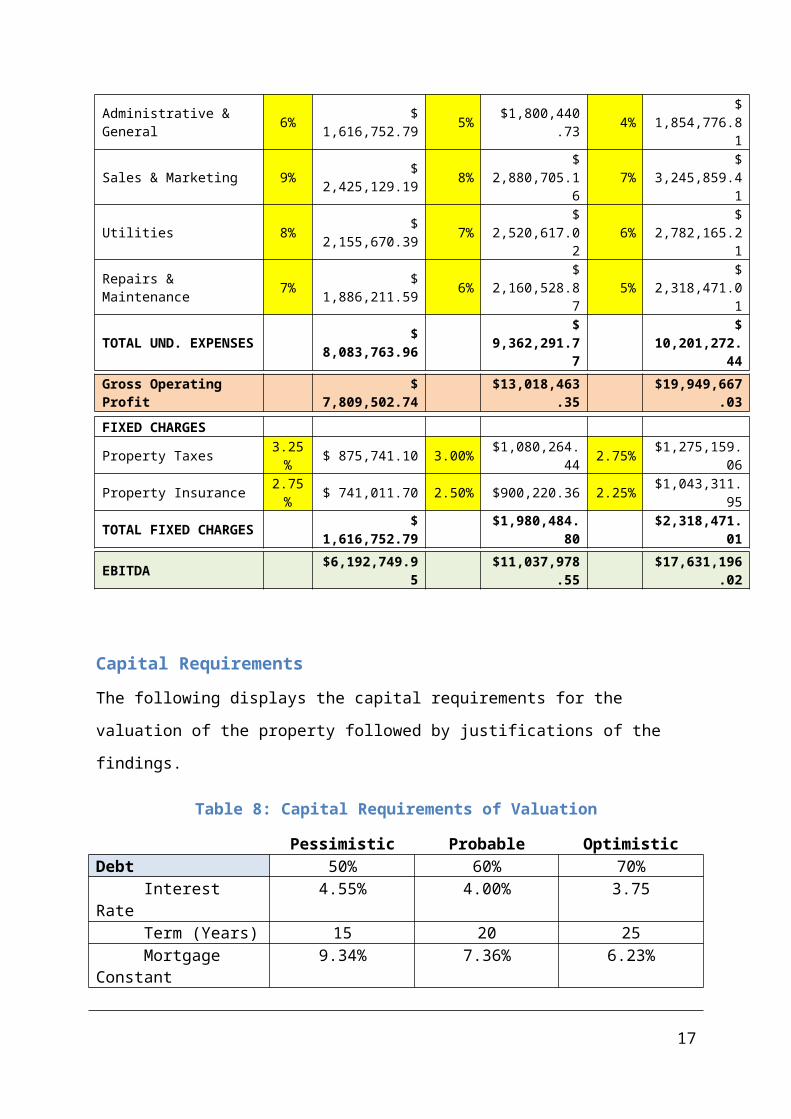
UNDISTRIBUTED EXPENSESAdministrative & General 6% $ 1,616,752.79 5% $1,800,440.73 4% $ 1,854,776.81Sales & Marketing 9% $ 2,425,129.19 8% $ 2,880,705.16 7% $ 3,245,859.41Utilities 8% $ 2,155,670.39 7% $ 2,520,617.02 6% $ 2,782,165.21Repairs & Maintenance 7% $ 1,886,211.59 6% $ 2,160,528.87 5% $ 2,318,471.01TOTAL UND. EXPENSES $ 8,083,763.96 $ 9,362,291.77 $ 10,201,272.44
Gross Operating Profit $ 7,809,502.74 $13,018,463.35 $19,949,667.03
FIXED CHARGESProperty Taxes 3.25% $ 875,741.10 3.00% $1,080,264.44 2.75% $1,275,159.06Property Insurance 2.75% $ 741,011.70 2.50% $900,220.36 2.25% $1,043,311.95TOTAL FIXED CHARGES $ 1,616,752.79 $1,980,484.80 $2,318,471.01
EBITDA $6,192,749.95 $11,037,978.55 $17,631,196.02
11
Capital Requirements
The following displays the capital requirements for the valuation of the property followed by
justifications of the findings.
Table 8: Capital Requirements of Valuation
Pessimistic Probable OptimisticDebt 50% 60% 70%
Interest Rate 4.55% 4.00% 3.75Term (Years) 15 20 25Mortgage
Constant9.34% 7.36% 6.23%
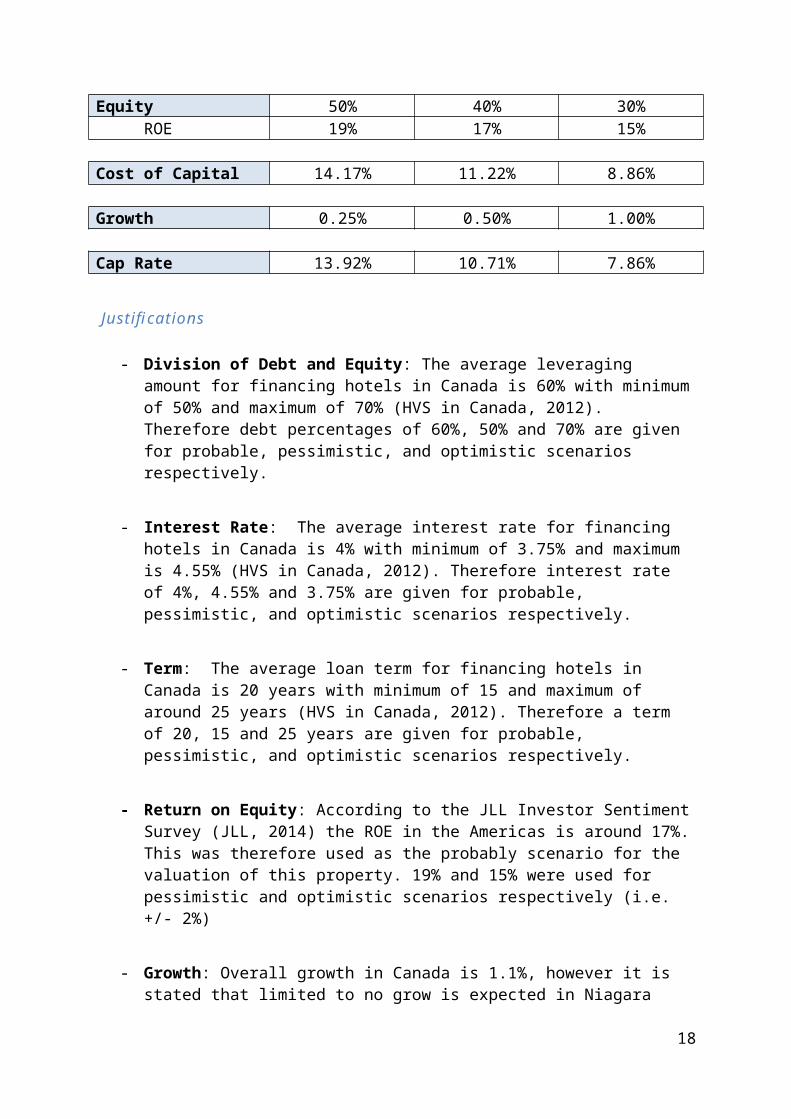
Equity 50% 40% 30%ROE 19% 17% 15%
Cost of Capital 14.17% 11.22% 8.86%
Growth 0.25% 0.50% 1.00%
Cap Rate 13.92% 10.71% 7.86%
Justifications
- Division of Debt and Equity: The average leveraging amount for financing hotels in Canada is 60% with minimum of 50% and maximum of 70% (HVS in Canada, 2012). Therefore debt percentages of 60%, 50% and 70% are given for probable, pessimistic, and optimistic scenarios respectively.
- Interest Rate: The average interest rate for financing hotels in Canada is 4% with minimum of 3.75% and maximum is 4.55% (HVS in Canada, 2012). Therefore interest rate of 4%, 4.55% and 3.75% are given for probable, pessimistic, and optimistic scenarios respectively.
- Term: The average loan term for financing hotels in Canada is 20 years with minimum of 15 and maximum of around 25 years (HVS in Canada, 2012). Therefore a term of 20, 15 and 25 years are given for probable, pessimistic, and optimistic scenarios respectively.
- Return on Equity: According to the JLL Investor Sentiment Survey (JLL, 2014) the ROE in the Americas is around 17%. This was therefore used as the probably scenario for the valuation of this property. 19% and 15% were used for pessimistic and optimistic scenarios respectively (i.e. +/- 2%)
12
- Growth: Overall growth in Canada is 1.1%, however it is stated that limited to no grow is expected in Niagara Falls so the value of growth has been estimated as 0.50%, 0.25% and 1.00% for probable, pessimistic and optimistic scenarios (Colliers International, 2014).
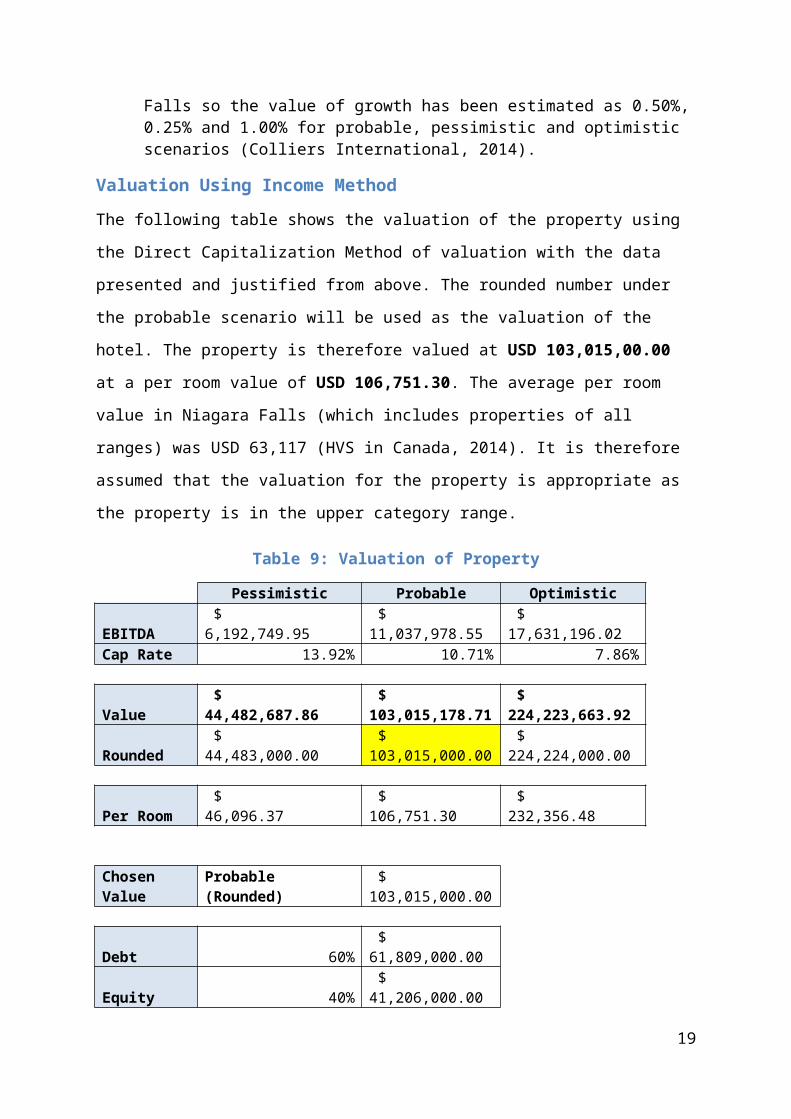
Valuation Using Income Method
The following table shows the valuation of the property using the Direct Capitalization
Method of valuation with the data presented and justified from above. The rounded number
under the probable scenario will be used as the valuation of the hotel. The property is
therefore valued at USD 103,015,00.00 at a per room value of USD 106,751.30. The average
per room value in Niagara Falls (which includes properties of all ranges) was USD 63,117
(HVS in Canada, 2014). It is therefore assumed that the valuation for the property is
appropriate as the property is in the upper category range.
Table 9: Valuation of Property
Pessimistic Probable OptimisticEBITDA $ 6,192,749.95 $ 11,037,978.55 $ 17,631,196.02Cap Rate 13.92% 10.71% 7.86%
Value $ 44,482,687.86 $ 103,015,178.71 $ 224,223,663.92Rounded $ 44,483,000.00 $ 103,015,000.00 $ 224,224,000.00
Per Room $ 46,096.37 $ 106,751.30 $ 232,356.48
Chosen Value Probable (Rounded) $ 103,015,000.00
Debt 60% $ 61,809,000.00Equity 40% $ 41,206,000.00
13
Operational Structures
The following section looks at the EBITDA at the stabilized year with probable, pessimistic,
optimistic scenarios under four different management structures: owner-operated,
management contract, franchise, and management contract with franchise. Descriptions of the
four operational structures are provided followed by the EBITDA calculations for each
structure under the three scenarios. All details on ADR, occupancy, expenses and fees for
each structure is highlighted in the table after at the end of the descriptions.
The stabilized year is predicted to be at year 3 after purchase. As already stated, the growth
in the region is assumed to be around 0.5%. This will make an ADR in the stabilized year to
be USD 110.29 under and F&B revenue per room in the stabilized year USD 60.60 in the
probable scenario. Occupancy is expected to drop slightly upon acquisition, however will
then return to at EBITDA purchase amount of 57.4% for probable.
Descriptions of Operational Structures
Owner-Operated
This is when the hotel is owned and operated by the owner themselves and having full control
over the operation and keeps all the profit. However, the owner would then have to manage
the operations, which could be more efficiently done by somebody else and one would not be
able to access the market like an already established brand would. There are no fees in this
structure; however expected ADR and occupancy levels will also not be as high as they
potentially could. In addition, expenses will be the highest out of all three structures
(Rushmore, O’Neill & Rushmore, 2012).
As such ADR and occupancy at the stabilized year will be set at area averages with the
expected growth and expenses will be kept the same as with the EBITDA at purchase.
Management Contract
A management contract is between an operator or a management company and an owner.
This is when the operator takes complete responsibility of the hotel operations and can reduce
costs and improve revenues. However, they may not take control over the policies and
procedures and is financially responsible of the property. In this situation, the income less the
management fee, goes directly to the owner (Rushmore et al., 2012).
14
Fees with this structure include a basic fee (% of total operating revenue) and an incentive fee
(% of gross operating profit). Basic fee is set at 2.9% and incentive fee is set at 10% based on
HVS statistics for upper upscale properties (Detlefsen & Glodz, 2013). ADR and occupancy
at the stabilized year will be set at area averages with the expected growth. However, since
the hotel would be run more efficiently, departmental expenses will be reduced by 2%.
Franchise
This happens when a contract is signed between a hotel company and an owner that is
looking to take the name, trademarks and some or all services offered by the hotel company.
This is a good way to go about purchasing a property because it gives the owner instant
reputation and identity in the market, dependent on the property one would also have the rates
already decided due to the classification of the hotel, one would get access to the central
reservation, advertisements, manuals, purchasing and loyalty programs. However, should, at
any point in time, the property fail, the hotel company can withdraw the franchise and the
owner assumes all liabilities (Rushmore et al., 2012).
Fees with this structure include a franchise fee (% of total operating revenue). Franchise fee
is set at 12% based on HVS report specifying the royalty, loyalty, marketing, reservation and
miscellaneous fees (Rushmore & Bagley, 2014). ADR and occupancy at the stabilized year
will be set higher than at area averages with the expected growth as the brand recognition and
reservation system will improve the figures. However expenses will be kept the same as with
the EBITDA at purchase.
Management Contract with Franchise (Manchise)
In this structure the elements of a management contract and a franchise are combined. By
matching the goals, objectives, property, location and standards. One would use the name of
the company brand as that is better for lenders and to reach the targeted market. However,
they are a financial risk to owners due to the dual fees and the franchisor would decide on the
operating standards (Rushmore et al., 2012).
Fees with this structure include a basic fee (% of total operating revenue), an incentive fee (%
of gross operating profit) and a franchise fee (% of total operating revenue). ). Basic fee is set
at 2.9% and incentive fee is set at 10% based on HVS statistics for upper upscale properties
(Detlefsen & Glodz, 20130). Franchise fee is set at 12% based on HVS report specifying the
royalty, loyalty, marketing, reservation and miscellaneous fees (Rushmore & Bagley, 2014).
ADR and occupancy at the stabilized year will be set higher than at area averages with the
15
expected growth as the brand recognition and reservation system will improve the figures.
Also since the hotel would be run more efficiently, departmental expenses will be reduced by
2%.
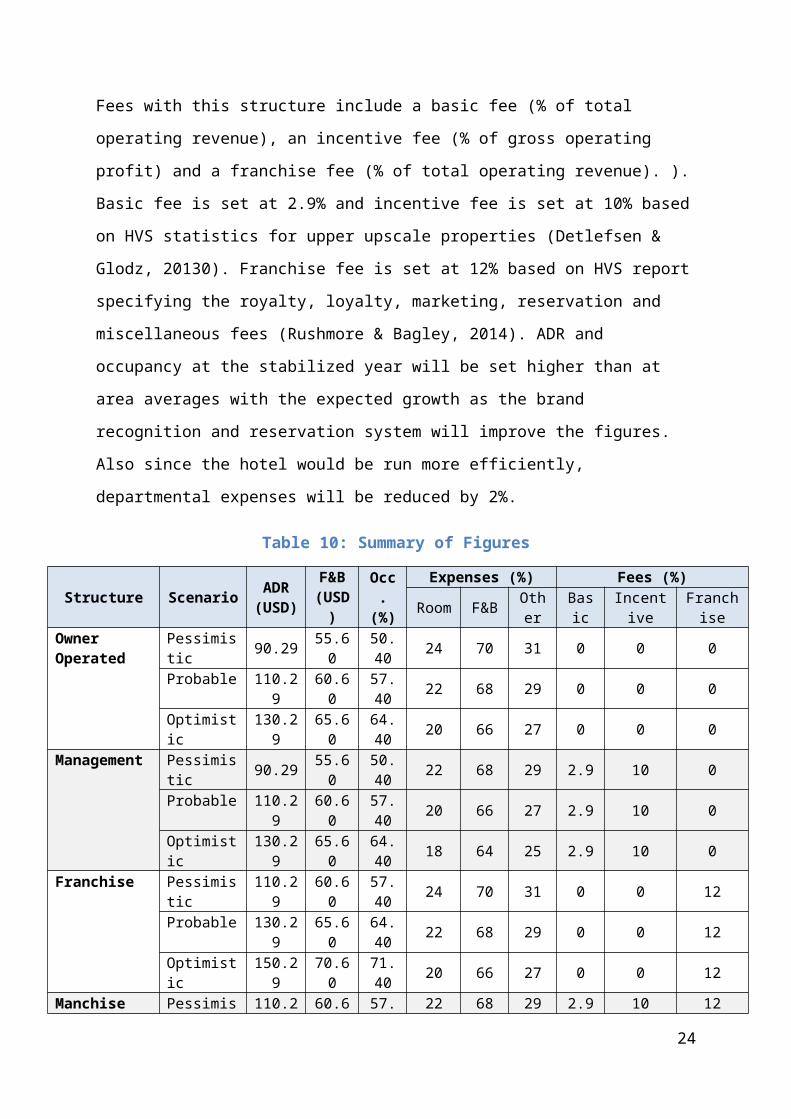
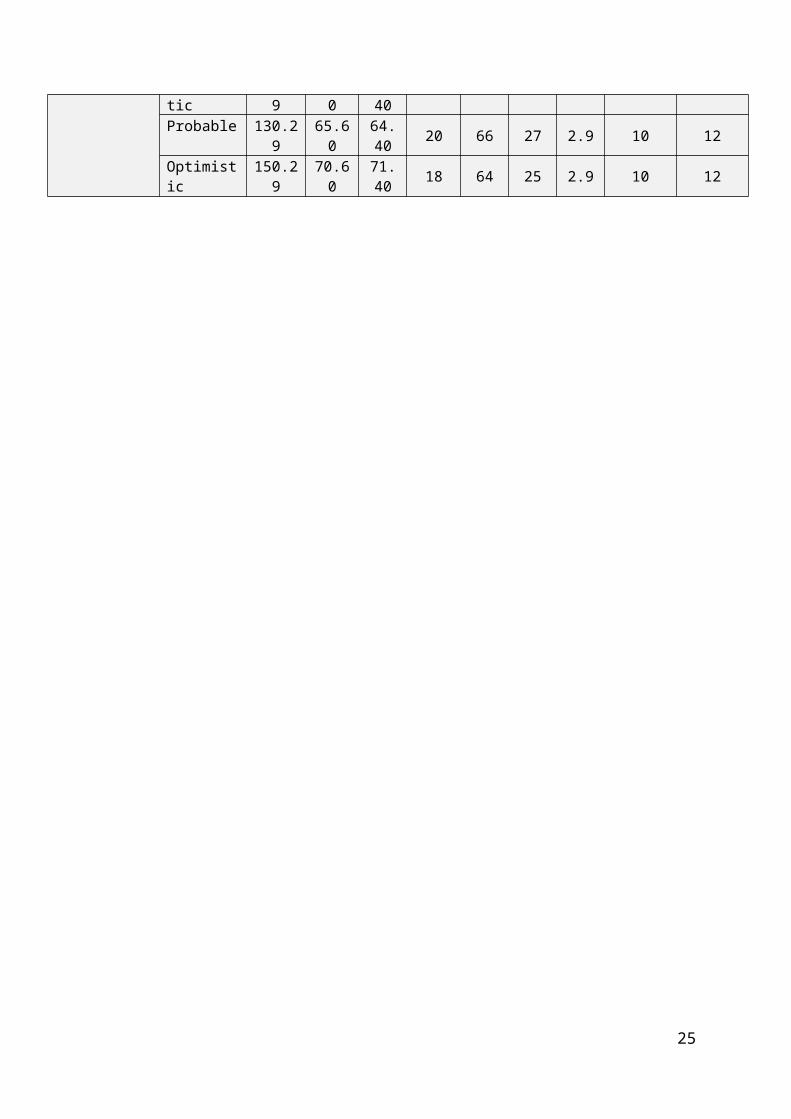
Table 10: Summary of Figures
Structure Scenario ADR (USD)
F&B (USD)
Occ. (%)
Expenses (%) Fees (%)Room F&B Other Basic Incentive Franchise
Owner Operated
Pessimistic 90.29 55.60 50.40 24 70 31 0 0 0Probable 110.29 60.60 57.40 22 68 29 0 0 0Optimistic 130.29 65.60 64.40 20 66 27 0 0 0
Management Pessimistic 90.29 55.60 50.40 22 68 29 2.9 10 0Probable 110.29 60.60 57.40 20 66 27 2.9 10 0Optimistic 130.29 65.60 64.40 18 64 25 2.9 10 0
Franchise Pessimistic 110.29 60.60 57.40 24 70 31 0 0 12Probable 130.29 65.60 64.40 22 68 29 0 0 12Optimistic 150.29 70.60 71.40 20 66 27 0 0 12
Manchise Pessimistic 110.29 60.60 57.40 22 68 29 2.9 10 12Probable 130.29 65.60 64.40 20 66 27 2.9 10 12Optimistic 150.29 70.60 71.40 18 64 25 2.9 10 12
16
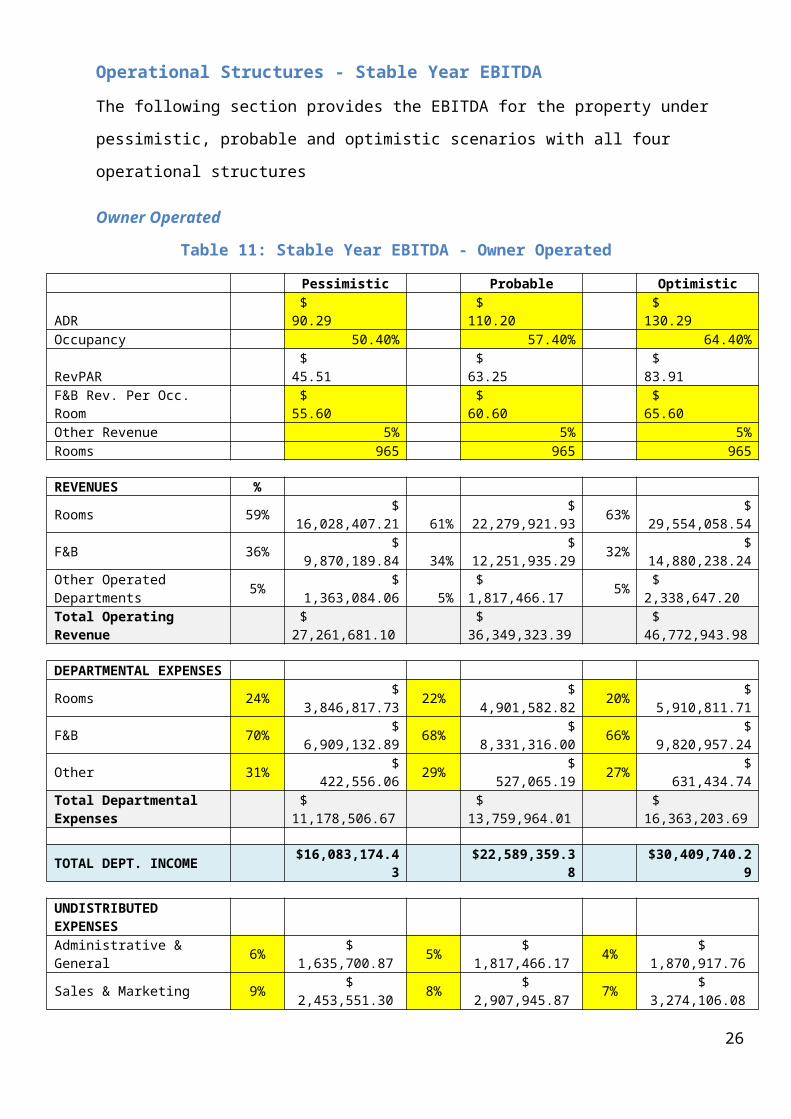
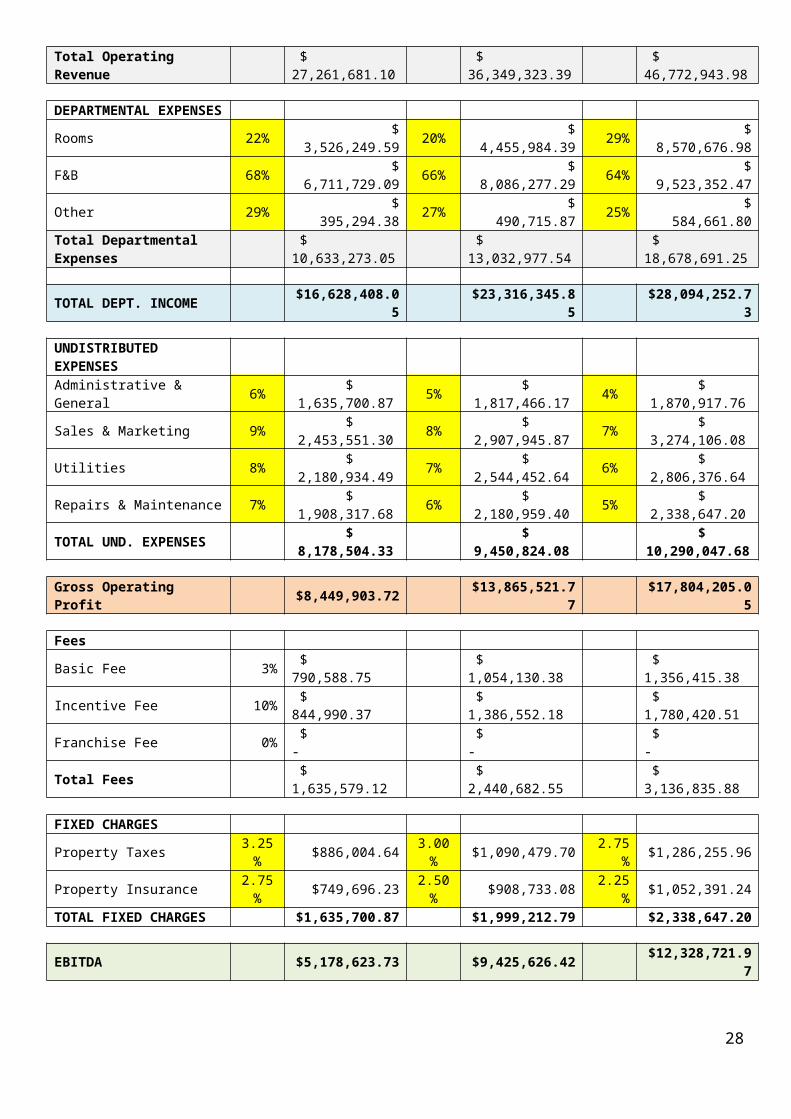
Operational Structures - Stable Year EBITDA
The following section provides the EBITDA for the property under pessimistic, probable and
optimistic scenarios with all four operational structures
Owner Operated
Table 11: Stable Year EBITDA - Owner Operated
Pessimistic Probable OptimisticADR $ 90.29 $ 110.20 $ 130.29Occupancy 50.40% 57.40% 64.40%RevPAR $ 45.51 $ 63.25 $ 83.91F&B Rev. Per Occ. Room $ 55.60 $ 60.60 $ 65.60Other Revenue 5% 5% 5%Rooms 965 965 965
REVENUES %Rooms 59% $ 16,028,407.21 61% $ 22,279,921.93 63% $ 29,554,058.54F&B 36% $ 9,870,189.84 34% $ 12,251,935.29 32% $ 14,880,238.24Other Operated Departments 5% $ 1,363,084.06 5% $ 1,817,466.17 5% $ 2,338,647.20Total Operating Revenue $ 27,261,681.10 $ 36,349,323.39 $ 46,772,943.98
DEPARTMENTAL EXPENSESRooms 24% $ 3,846,817.73 22% $ 4,901,582.82 20% $ 5,910,811.71F&B 70% $ 6,909,132.89 68% $ 8,331,316.00 66% $ 9,820,957.24Other 31% $ 422,556.06 29% $ 527,065.19 27% $ 631,434.74Total Departmental Expenses $ 11,178,506.67 $ 13,759,964.01 $ 16,363,203.69
TOTAL DEPT. INCOME $16,083,174.43 $22,589,359.38 $30,409,740.29
UNDISTRIBUTED EXPENSESAdministrative & General 6% $ 1,635,700.87 5% $ 1,817,466.17 4% $ 1,870,917.76Sales & Marketing 9% $ 2,453,551.30 8% $ 2,907,945.87 7% $ 3,274,106.08Utilities 8% $ 2,180,934.49 7% $ 2,544,452.64 6% $ 2,806,376.64Repairs & Maintenance 7% $ 1,908,317.68 6% $ 2,180,959.40 5% $ 2,338,647.20TOTAL UND. EXPENSES $ 8,178,504.33 $ 9,450,824.08 $ 10,290,047.68
Gross Operating Profit $7,904,670.10 $13,138,535.30 $20,119,692.61
FeesBasic Fee 0% $ - $ - $ -Incentive Fee 0% $ - $ - $ -Franchise Fee 0% $ - $ - $ -Total Fees $ - $ - $ -
FIXED CHARGESProperty Taxes 3.25% $886,004.64 3.00% $1,090,479.70 2.75% $1,286,255.96Property Insurance 2.75% $749,696.23 2.50% $908,733.08 2.25% $1,052,391.24TOTAL FIXED CHARGES $1,635,700.87 $1,999,212.79 $2,338,647.20
EBITDA $6,268,969.23 $11,139,322.51 $17,781,045.42
17
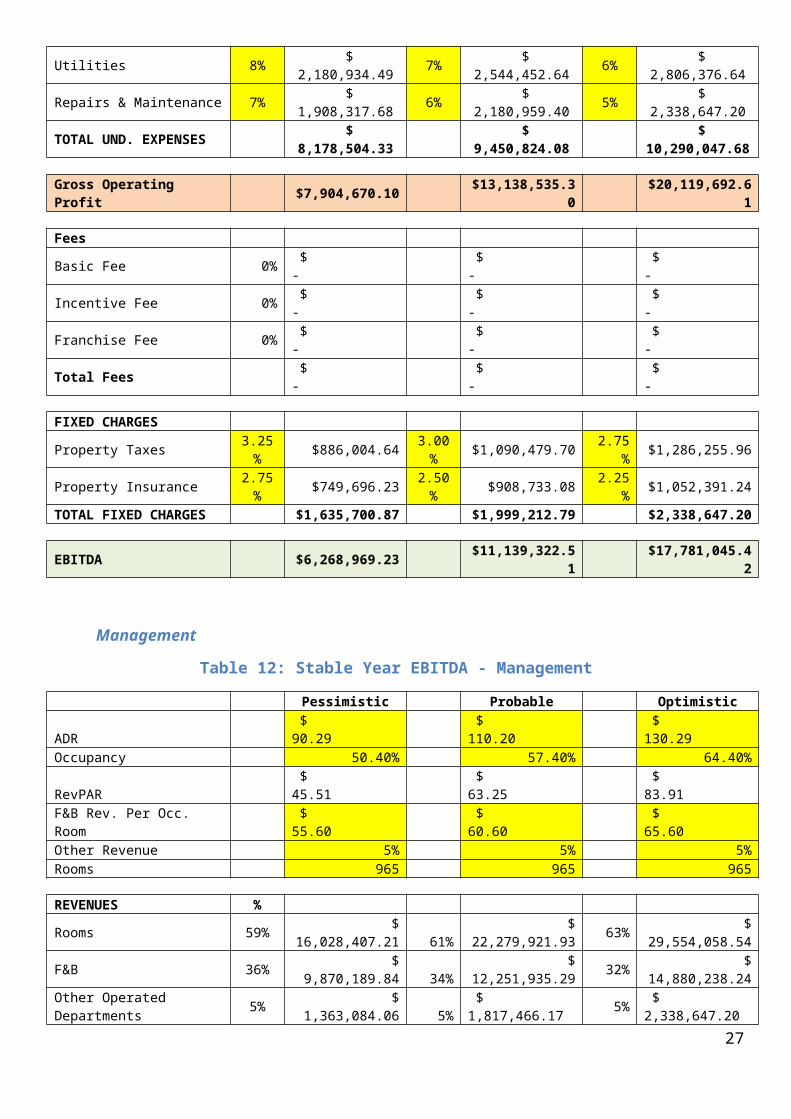
Management
Table 12: Stable Year EBITDA - Management
Pessimistic Probable OptimisticADR $ 90.29 $ 110.20 $ 130.29Occupancy 50.40% 57.40% 64.40%RevPAR $ 45.51 $ 63.25 $ 83.91F&B Rev. Per Occ. Room $ 55.60 $ 60.60 $ 65.60Other Revenue 5% 5% 5%Rooms 965 965 965
REVENUES %Rooms 59% $ 16,028,407.21 61% $ 22,279,921.93 63% $ 29,554,058.54F&B 36% $ 9,870,189.84 34% $ 12,251,935.29 32% $ 14,880,238.24Other Operated Departments 5% $ 1,363,084.06 5% $ 1,817,466.17 5% $ 2,338,647.20Total Operating Revenue $ 27,261,681.10 $ 36,349,323.39 $ 46,772,943.98
DEPARTMENTAL EXPENSESRooms 22% $ 3,526,249.59 20% $ 4,455,984.39 29% $ 8,570,676.98F&B 68% $ 6,711,729.09 66% $ 8,086,277.29 64% $ 9,523,352.47Other 29% $ 395,294.38 27% $ 490,715.87 25% $ 584,661.80Total Departmental Expenses $ 10,633,273.05 $ 13,032,977.54 $ 18,678,691.25
TOTAL DEPT. INCOME $16,628,408.05 $23,316,345.85 $28,094,252.73
UNDISTRIBUTED EXPENSESAdministrative & General 6% $ 1,635,700.87 5% $ 1,817,466.17 4% $ 1,870,917.76Sales & Marketing 9% $ 2,453,551.30 8% $ 2,907,945.87 7% $ 3,274,106.08Utilities 8% $ 2,180,934.49 7% $ 2,544,452.64 6% $ 2,806,376.64Repairs & Maintenance 7% $ 1,908,317.68 6% $ 2,180,959.40 5% $ 2,338,647.20TOTAL UND. EXPENSES $ 8,178,504.33 $ 9,450,824.08 $ 10,290,047.68
Gross Operating Profit $8,449,903.72 $13,865,521.77 $17,804,205.05
FeesBasic Fee 3% $ 790,588.75 $ 1,054,130.38 $ 1,356,415.38Incentive Fee 10% $ 844,990.37 $ 1,386,552.18 $ 1,780,420.51Franchise Fee 0% $ - $ - $ -Total Fees $ 1,635,579.12 $ 2,440,682.55 $ 3,136,835.88
FIXED CHARGESProperty Taxes 3.25% $886,004.64 3.00% $1,090,479.70 2.75% $1,286,255.96Property Insurance 2.75% $749,696.23 2.50% $908,733.08 2.25% $1,052,391.24TOTAL FIXED CHARGES $1,635,700.87 $1,999,212.79 $2,338,647.20
EBITDA $5,178,623.73 $9,425,626.42 $12,328,721.97
18
Franchise
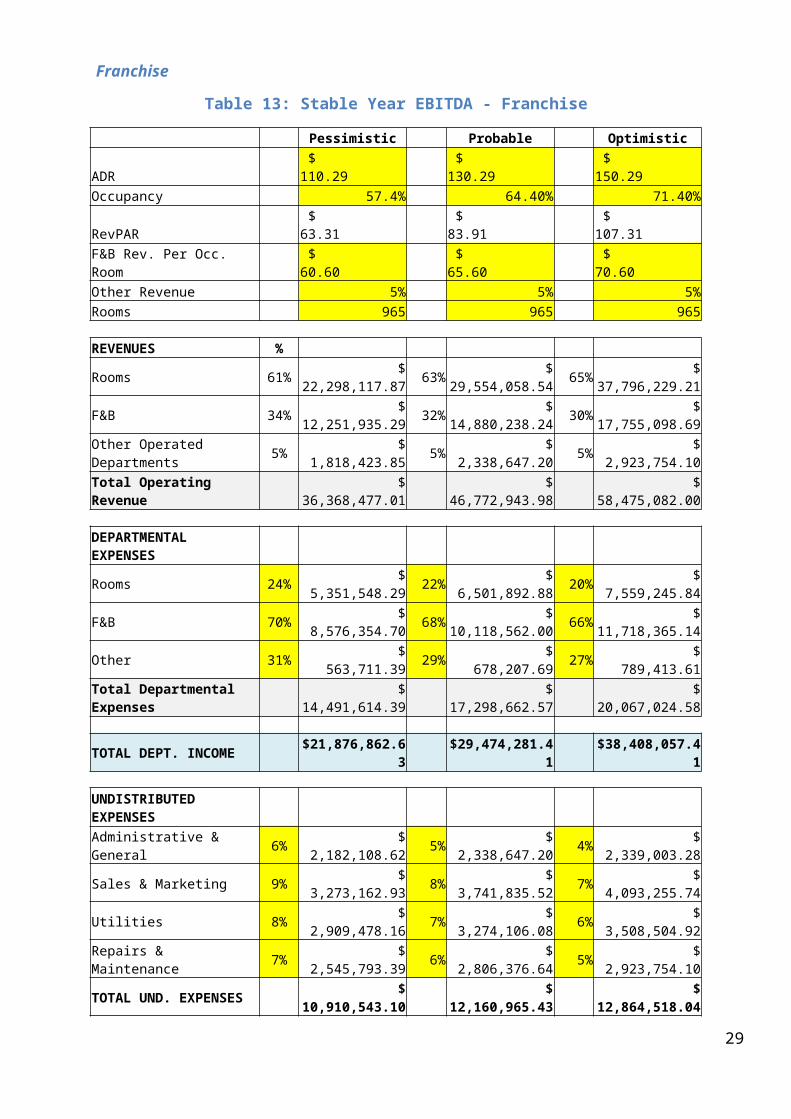
Table 13: Stable Year EBITDA - Franchise
Pessimistic Probable OptimisticADR $ 110.29 $ 130.29 $ 150.29Occupancy 57.4% 64.40% 71.40%RevPAR $ 63.31 $ 83.91 $ 107.31F&B Rev. Per Occ. Room $ 60.60 $ 65.60 $ 70.60Other Revenue 5% 5% 5%Rooms 965 965 965
REVENUES %Rooms 61% $ 22,298,117.87 63% $ 29,554,058.54 65% $ 37,796,229.21F&B 34% $ 12,251,935.29 32% $ 14,880,238.24 30% $ 17,755,098.69Other Operated Departments 5% $ 1,818,423.85 5% $ 2,338,647.20 5% $ 2,923,754.10Total Operating Revenue $ 36,368,477.01 $ 46,772,943.98 $ 58,475,082.00
DEPARTMENTAL EXPENSESRooms 24% $ 5,351,548.29 22% $ 6,501,892.88 20% $ 7,559,245.84F&B 70% $ 8,576,354.70 68% $ 10,118,562.00 66% $ 11,718,365.14Other 31% $ 563,711.39 29% $ 678,207.69 27% $ 789,413.61Total Departmental Expenses $ 14,491,614.39 $ 17,298,662.57 $ 20,067,024.58
TOTAL DEPT. INCOME $21,876,862.63 $29,474,281.41 $38,408,057.41
UNDISTRIBUTED EXPENSESAdministrative & General 6% $ 2,182,108.62 5% $ 2,338,647.20 4% $ 2,339,003.28Sales & Marketing 9% $ 3,273,162.93 8% $ 3,741,835.52 7% $ 4,093,255.74Utilities 8% $ 2,909,478.16 7% $ 3,274,106.08 6% $ 3,508,504.92Repairs & Maintenance 7% $ 2,545,793.39 6% $ 2,806,376.64 5% $ 2,923,754.10TOTAL UND. EXPENSES $ 10,910,543.10 $ 12,160,965.43 $ 12,864,518.04
Gross Operating Profit $10,966,319.52 $17,313,315.98 $25,543,539.37
FeesBasic Fee 0% $ - $ - $ -Incentive Fee 0% $ - $ - $ -Franchise Fee 12% $ 4,364,217.24 $ 5,612,753.28 $ 7,017,009.84Total Fees $ 4,364,217.24 $ 5,612,753.28 $ 7,017,009.84
FIXED CHARGESProperty Taxes 3.25% $1,181,975.50 3.00% $1,403,188.32 2.75% $1,608,064.75Property Insurance 2.75% $1,000,133.12 2.50% $1,169,323.60 2.25% $1,315,689.34TOTAL FIXED CHARGES $2,182,108.62 $2,572,511.92 $2,923,754.10
EBITDA $4,419,993.66 $9,128,050.78 $15,602,775.43
19
Manchise
Table 14: Stable Year EBITDA - Manchise
Pessimistic Probable OptimisticADR $ 110.29 $ 130.29 $ 150.29Occupancy 57.4% 64.40% 71.40%RevPAR $ 63.31 $ 83.91 $ 107.31F&B Rev. Per Occ. Room $ 60.60 $ 65.60 $ 70.60Other Revenue 5% 5% 5%Rooms 965 965 965
REVENUES %Rooms 61% $ 22,298,117.87 63% $ 29,554,058.54 65% $ 37,796,229.21F&B 34% $ 12,251,935.29 32% $ 14,880,238.24 30% $ 17,755,098.69Other Operated Departments 5% $ 1,818,423.85 5% $ 2,338,647.20 5% $ 2,923,754.10Total Operating Revenue $ 36,368,477.01 $ 46,772,943.98 $ 58,475,082.00
DEPARTMENTAL EXPENSESRooms 22% $ 4,905,585.93 20% $ 5,910,811.71 29% $ 10,960,906.47F&B 68% $ 8,331,316.00 66% $ 9,820,957.24 64% $ 11,363,263.16Other 29% $ 527,342.92 27% $ 631,434.74 25% $ 730,938.52Total Departmental Expenses $ 13,764,244.85 $ 16,363,203.69 $ 23,055,108.16
TOTAL DEPT. INCOME $22,604,232.17 $30,409,740.29 $35,419,973.84
UNDISTRIBUTED EXPENSESAdministrative & General 6% $ 2,182,108.62 5% $ 2,338,647.20 4% $ 2,339,003.28Sales & Marketing 9% $ 3,273,162.93 8% $ 3,741,835.52 7% $ 4,093,255.74Utilities 8% $ 2,909,478.16 7% $ 3,274,106.08 6% $ 3,508,504.92Repairs & Maintenance 7% $ 2,545,793.39 6% $ 2,806,376.64 5% $ 2,923,754.10TOTAL UND. EXPENSES $ 10,910,543.10 $ 12,160,965.43 $ 12,864,518.04
Gross Operating Profit $11,693,689.06 $18,248,774.85 $22,555,455.80
FeesBasic Fee 3% $ 1,054,685.83 $ 1,356,415.38 $ 1,695,777.38Incentive Fee 10% $ 1,169,368.91 $ 1,824,877.49 $ 2,255,545.58Franchise Fee 12% $ 4,364,217.24 $ 5,612,753.28 $ 7,017,009.84Total Fees $ 6,588,271.98 $ 8,794,046.14 $ 10,968,332.80
FIXED CHARGESProperty Taxes 3.25% $1,181,975.50 3.00% $1,403,188.32 2.75% $1,608,064.75Property Insurance 2.75% $1,000,133.12 2.50% $1,169,323.60 2.25% $1,315,689.34TOTAL FIXED CHARGES $2,182,108.62 $2,572,511.92 $2,923,754.10
EBITDA $2,923,308.46 $6,882,216.80 $8,663,368.90
20
Stable Year EBITDA Summary
The following table displays the EBITDA at the stable year for all four management
structures under each scenario. From the table it is evident that under the probable scenario,
the owner operated structure has produced the greatest EBIDTA. This management structure
will therefore be used for further analysis.
Table 15: Summary of EBITDA
EBITDA Pessimistic Probable OptimisticOwner Operated $ 6,268,969.23 $ 11,139,322.51 $ 17,781,045.42Management $ 5,178,623.73 $ 9,425,626.42 $ 12,328,721.97Franchise $ 4,419,993.66 $ 9,128,050.78 $ 8,663,368.90Branded $ 2,923,308.46 $ 6,882,216.80 $ 8,663,368.90
21

11 Year EBITDA Forecast
The following table displays the 11 year EBITDA calculation with an owner operated structure based on the details provided earlier in the report.
Year 1 Year 2 Year 3 Year 4 Year 5 Year 6 Year 7 Year 8 Year 9 Year 10 Year 11ADR $ 109.20 $ 109.75 $ 110.29 $ 110.85 $ 111.40 $ 111.96 $ 112.52 $ 13.08 $ 13.65 $ 114.21 $ 114.78Occupancy 55.4% 56.4% 57.4% 57.4% 57.4% 57.4% 57.4% 57.4% 57.4% 57.4% 57.4%RevPAR $ 60.50 $ 61.90 $ 63.31 $ 63.63 $ 63.94 $ 64.26 $ 64.58 $ 64.91 $ 65.23 $ 65.56 $ 65.89F&B Rev. Per Occ. Room $ 60.00 $ 60.30 $ 60.60 $ 60.90 $ 61.21 $ 61.52 $ 61.82 $ 62.13 $ 62.44 $ 62.75 $ 63.07Other Revenue 5% 5% 5% 5% 5% 5% 5% 5% 5% 5% 5%Rooms 965 965 965 965 965 965 965 965 965 965 965
Revenue Growth 0.50%
REVENUESRooms 61% $ 21,308,485.38 $ 21,801,580.66 $ 22,299,074.17 $ 22,410,569.54 $ 22,522,622.39 $ 22,635,235.50 $ 22,748,411.68 $ 22,862,153.74 $ 22,976,464.51 $ 23,091,346.83 $ 23,206,803.56F&B 34% $ 11,707,959.00 $ 11,978,890.47 $ 12,252,238.56 $ 12,313,499.75 $ 12,375,067.25 $ 12,436,942.58 $ 12,499,127.30 $ 12,561,622.93 $ 12,624,431.05 $ 12,687,553.20 12,750,990.97Other Operated Departments 5% $ 1,737,707.60 $ 1,777,919.53 $ 1,818,490.14 $ 1,827,582.59 $ 1,836,720.51 $ 1,845,904.11 $ 1,855,133.63 $ 1,864,409.30 $ 1,873,731.34 $ ,883,100.00 $ 1,892,515.50Total Operating Revenue $ 34,754,151.98 $ 5,558,390.66 $ 36,369,802.87 $ 36,551,651.89 $ 36,734,410.14 $ 36,918,082.20 $ 37,102,672.61 $ 37,288,185.97 $ 37,474,626.90 $ 7,662,000.03 $ 37,850,310.03
DEPARTMENTAL EXPENSESRooms 22% $ 4,687,866.78 $ 4,796,347.74 $ 4,905,796.32 $ 4,930,325.30 $ 4,954,976.93 $ 4,979,751.81 $ 5,004,650.57 $ 5,029,673.82 $ 5,054,822.19 $ 5,080,096.30 $ 5,105,496.78F&B 68% $ 7,961,412.12 $ 8,145,645.52 $ 8,331,522.22 $ 8,373,179.83 $ 8,415,045.73 $ 8,457,120.96 $ 8,499,406.56 $ 8,541,903.59 $ 8,584,613.11 $ 8,627,536.18 $ 8,670,673.86Other 29% $ 503,935.20 $ 515,596.66 $ 527,362.14 $ 529,998.95 $ 532,648.95 $ 535,312.19 $ 537,988.75 $ 540,678.70 $ 543,382.09 $ 546,099.00 $ 548,829.50Total Departmental Expenses $ 13,153,214.11 $ 13,457,589.93 $ 13,764,680.68 $ 13,833,504.08 $ 13,902,671.60 $ 13,972,184.96 $ 14,042,045.88 $ 14,112,256.11 $ 14,182,817.39 $ 14,253,731.48 $ 14,325,000.14
TOTAL DEPT. INCOME $21,600,937.87 $22,100,800.73 $22,605,122.19 $22,718,147.80 $22,831,738.54 $22,945,897.24 $23,060,626.72 $23,175,929.86 $23,291,809.51 $23,408,268.55 $23,525,309.90
UNDISTRIBUTED EXPENSESAdministrative & General 5% $ 1,737,707.60 $ 1,777,919.53 $ 1,818,490.14 $ 1,827,582.59 $ 1,836,720.51 $ 1,845,904.11 $ 1,855,133.63 $ 1,864,409.30 $ 1,873,731.34 $ 1,883,100.00 $ 1,892,515.50Sales & Marketing 8% $ 2,780,332.16 $ 2,844,671.25 $ 2,909,584.23 $ 2,924,132.15 $ 2,938,752.81 $ 2,953,446.58 $ 2,968,213.81 $ 2,983,054.88 $ 2,997,970.15 $ 3,012,960.00 $ 3,028,024.80Utilities 7% $ 2,432,790.64 $ 2,489,087.35 $ 2,545,886.20 $ 2,558,615.63 $ 2,571,408.71 $ 2,584,265.75 $ 2,597,187.08 $ 2,610,173.02 $ 2,623,223.88 $ 2,636,340.00 $ 2,649,521.70Repairs & Maintenance 6% $ 2,085,249.12 $ 2,133,503.44 $ 2,182,188.17 $ 2,193,099.11 $ 2,204,064.61 $ 2,215,084.93 $ 2,226,160.36 $ 2,237,291.16 $ 2,248,477.61 $ 2,259,720.00 $ 2,271,018.60TOTAL UND. EXPENSES $ 9,036,079.51 $ 9,245,181.57 $ 9,456,148.75 $ 9,503,429.49 $ 9,550,946.64 $ 9,598,701.37 $ 9,646,694.88 $ 9,694,928.35 $ 9,743,402.99 $ 9,792,120.01 $ 9,841,080.61
Gross Operating Profit $12,564,858.36 $12,855,619.16 $13,148,973.45 $13,214,718.31 $13,280,791.91 $13,347,195.87 $13,413,931.84 $13,481,001.50 $13,548,406.51 $13,616,148.54 $13,684,229.29
FIXED CHARGESProperty Taxes 3.00% $1,042,624.56 $1,066,751.72 $1,091,094.09 $1,096,549.56 $1,102,032.30 $1,107,542.47 $1,113,080.18 $1,118,645.58 $1,124,238.81 $1,129,860.00 $1,135,509.30Property Insurance 2.50% $868,853.80 $888,959.77 $909,245.07 $913,791.30 $918,360.25 $922,952.05 $927,566.82 $932,204.65 $936,865.67 $941,550.00 $946,257.75TOTAL FIXED CHARGES $1,911,478.36 $1,955,711.49 $2,000,339.16 $2,010,340.85 $2,020,392.56 $2,030,494.52 $2,040,646.99 $2,050,850.23 $2,061,104.48 $2,071,410.00 $2,081,767.05
EBITDA $10,653,380.00 $10,899,907.67 $11,148,634.29 $11,204,377.46 $11,260,399.35 $11,316,701.34 $11,373,284.85 $11,430,151.28 $11,487,302.03 $11,544,738.54 $11,602,462.23
22
Reversion Value
The reversion value for the property (i.e. the value at which you can sell it) is calculated by
taking the year 11 EBITDA after purchase and the terminal cap rate (i.e. initial cap rate + 2%
using the Rushmore method). As such, the reversion value after the 10 year holding period is
USD 91,251,000 (rounded). This means that the year 10 EBITDA would actually be USD
102,796,000 (rounded). The below table summarizes the findings.
Table 16: Reversion Value and Actual Year 10 EBITDA
Initial Cap Rate 10.71%Terminal Cap Rate 12.71%Reversion Value $91,250,876.17Year 10 EBITDA $102,795,614.71
Estimated Amortization
Based on the findings in the previous sections, the following tables display the estimated
amortization details with a 10 year holding period.
Table 17: Amortization Details
Debt Amount $ 61,809,000.00Rate 4.00%Term 20Payment $ 4,548,014Holding Period 10Mortgage Balance $ 36,888,471
Table 18: Amortization Schedule
Period Payment Interest Principal Paid Ending Balance1 $4,548,014 $ 2,472,360 $2,075,654 $ 59,733,3462 $4,548,014 $ 2,389,334 $2,158,681 $ 57,574,6653 $4,548,014 $ 2,302,987 $2,245,028 $ 55,329,6374 $4,548,014 $ 2,213,185 $2,334,829 $ 52,994,8085 $4,548,014 $ 2,119,792 $2,428,222 $ 50,566,5866 $4,548,014 $ 2,022,663 $2,525,351 $ 48,041,2357 $4,548,014 $ 1,921,649 $2,626,365 $ 45,414,8708 $4,548,014 $ 1,816,595 $2,731,420 $ 42,683,4519 $4,548,014 $ 1,707,338 $2,840,676 $ 39,842,77410 $4,548,014 $ 1,593,711 $2,954,303 $ 36,888,471
23
Depreciation of the Property
For this property the building, FF&E and land is estimated to be worth 70%, 20%, and 10%
respectively of the total value. Straight line depreciation will be completed with a useful life
of 39 years and 10 years for the building and FF&E respectively. Based on the valuation of
the property done in the previous section and the above details, the total annual depreciation
for the property is USD 3,909,287.18. The table below shows the details of the depreciation
for the property.
Table 19: Depreciation of the Property
Value $ 103,015,000.00 Useful Life Annual DepreciationBuilding 70% $ 72,110,500.00 39 $ 1,848,987.18FF&E 20% $ 20,603,000.00 10 $ 2,060,300.00Land 10%
Total $ 3,909,287.18
24
Cash Flow of the Property
The following table displays the estimated cash flow of the property within the 10 year holding period. It is followed by a table that then looks at
the total year 10 cash flow based on the remaining mortgage balance.
Table 20: 10 Year Cash Flow
Year 1 2 3 4 5 6 7 8 9 10EBITDA $ 10,653,380 $ 10,899,908 $ 11,148,634 $ 11,204,377 $ 11,260,399 $ 11,316,701 $ 11,373,285 $ 11,430,151 $ 11,487,302 $ 11,544,739Depreciation $ (3,909,287) $ (3,909,287) $ (3,909,287) $ (3,909,287) $ (3,909,287) $ (3,909,287) $ (3,909,287) $ (3,909,287) $ (3,909,287) $ (3,909,287)Interest $ (2,472,360) $ (2,389,334) $ (2,302,987) $ (2,213,185) $ (2,119,792) $ (2,022,663) $ (1,921,649) $ (1,816,595) $ (1,707,338) $ (1,593,711)EBT $ 4,271,733 $ 4,601,287 $ 4,936,361 $ 5,081,905 $ 5,231,320 $ 5,384,751 $ 5,542,348 $ 5,704,269 $ 5,870,677 $ 6,041,740Tax (30%) $ 1,281,520 $ 1,380,386 $ 1,480,908 $ 1,524,571 $ 1,569,396 $ 1,615,425 $ 1,662,704 $ 1,711,281 $ 1,761,203 $ 1,812,522NET INCOME $ 2,990,213 $ 3,220,901 $ 3,455,452 $ 3,557,333 $ 3,661,924 $ 3,769,326 $ 3,879,644 $ 3,992,989 $ 4,109,474 $ 4,229,218Depreciation $ 3,909,287 $ 3,909,287 $ 3,909,287 $ 3,909,287 $ 3,909,287 $ 3,909,287 $ 3,909,287 $ 3,909,287 $ 3,909,287 $ 3,909,287Principal Payment $ (2,075,654) $ (2,158,681) $ (2,245,028) $ (2,334,829) $ (2,428,222) $ (2,525,351) $ (2,626,365) $ (2,731,420) $ (2,840,676) $ (2,954,303)CASH FLOW $ 4,823,846 $ 4,971,507 $ 5,119,712 $ 5,131,792 $ 5,142,989 $ 5,153,262 $ 5,162,566 $ 5,170,856 $ 5,178,085 $ 5,184,202
Table 21: Actual Cash Flow Year 10
Reversion Value $ 91,250,876.17Mortgage Balance $ 36,888,470.85Proceeds to Equity $ 54,362,405.32
Year 10 Cash Flow $ 59,546,607.34
25
Feasibility of Property
Net Present Value (NPV) of Cash Flows
The following table displays the NPV of cash flow from property and cash flow to equity.
Table 22: NPV of Cash Flows
Year Cash Flow from Property Year Cash Flow to Equity0 $ (103,015,000.00) 0 $ (41,206,000.00)1 $ 10,653,380.00 1 $ 4,823,845.752 $ 10,899,907.67 2 $ 4,971,507.273 $ 11,148,634.29 3 $ 5,119,711.734 $ 11,204,377.46 4 $ 5,131,791.625 $ 11,260,399.35 5 $ 5,142,988.996 $ 11,316,701.34 6 $ 5,153,261.727 $ 11,373,284.85 7 $ 5,162,565.978 $ 11,430,151.28 8 $ 5,170,856.089 $ 11,487,302.03 9 $ 5,178,084.5810 $ 102,795,614.71 10 $ 59,546,607.34
Discount Rate 11.21% Discount Rate 17.00%NPV $ (6,385,562.28) NPV $ (6,320,411.15)IRR 10.12% IRR 13.95%
From the calculations under both conditions, we can see that NPV is negative with an IRR
lower than the discount rate.
Average Accounting Return (ARR)
The following table displays the ARR for the property
Table 23: ARR for Property
Total Net Income $ 36,866,473Average Net Income $ 3,686,647Total Investment $ 103,015,000
ARR 3.58%
26
Payback Period
The following tables display the payback period for overall property and equity cash flows as
well as at discounted cash flows. Cash flow from property is set at a discount rate of 11.21%
while cash flow to equity is set at 17%.
Table 24: Payback for Property
Year Cash Flow from Property Discounted Rates Accumulated Payback Payback Tipping Point0 $ (103,015,000.00)
1 $ 10,653,380.00 $9,579,093.73 $9,579,093.73 ($93,435,906.27)
2 $ 10,899,907.67 $8,812,453.30 $18,391,547.04 ($84,623,452.96)
3 $ 11,148,634.29 $8,104,620.50 $26,496,167.53 ($76,518,832.47)
4 $ 11,204,377.46 $7,323,787.76 $33,819,955.29 ($69,195,044.71)
5 $ 11,260,399.35 $6,618,183.68 $40,438,138.98 ($62,576,861.02)
6 $ 11,316,701.34 $5,980,560.43 $46,418,699.41 ($56,596,300.59)
7 $ 11,373,284.85 $5,404,368.44 $51,823,067.85 ($51,191,932.15)
8 $ 11,430,151.28 $4,883,689.18 $56,706,757.03 ($46,308,242.97)
9 $ 11,487,302.03 $4,413,174.32 $61,119,931.35 ($41,895,068.65)
10 $ 102,795,614.71 $35,509,506.37 $96,629,437.72 ($6,385,562.28)
Table 25: Payback from Equity
Year Cash Flow to Equity Discounted Rates Accumulated Pay Back Pay Back Tipping Point0 $ (41,206,000.00)
1 $ 4,823,845.75 $4,122,945.08 $4,122,945.08 ($37,083,054.92)
2 $ 4,971,507.27 $3,631,753.43 $7,754,698.51 ($33,451,301.49)
3 $ 5,119,711.73 $3,196,597.26 $10,951,295.77 ($30,254,704.23)
4 $ 5,131,791.62 $2,738,580.84 $13,689,876.61 ($27,516,123.39)
5 $ 5,142,988.99 $2,345,774.64 $16,035,651.25 ($25,170,348.75)
6 $ 5,153,261.72 $2,008,940.29 $18,044,591.54 ($23,161,408.46)
7 $ 5,162,565.97 $1,720,143.12 $19,764,734.66 ($21,441,265.34)
8 $ 5,170,856.08 $1,472,568.67 $21,237,303.33 ($19,968,696.67)
9 $ 5,178,084.58 $1,260,365.14 $22,497,668.47 ($18,708,331.53)
10 $ 59,546,607.34 $12,387,920.37 $34,885,588.85 ($6,320,411.15)
From the calculations it is evident that under both cash flow from property and cash flow to
equity, the payback period is longer than the 10 year holding period with discounted values.
There is a balance of over six million dollars in both cases.
27
Discussion
Niagara Falls City, Ontario, Canada is a very popular tourist destination that makes up around
10% of the province of Ontario’s annual tourism receipts. Located along the USA-Canada
border, the city has an extensive transportation network leading in and out connecting
Niagara Falls to the rest of Canada, the US and the globe. In addition, Niagara Falls has a
wide portfolio of entertainment, dining options, and natural beauty not the mention the falls
themselves. With the city focused on developing the tourism industry, one would think that
Niagara Falls would be an ideal location to invest in a property.
The chosen hotel to perform the feasibility study, Hilton Niagara Falls Fallsview Hotel and
Suites, also seems like an ideal property to invest in as it is located near the falls and near
many attractions as well as being directly connected to the Fallsview Casino by an enclosed
foot bridge. This allows the property to benefit from being a convenient location for guests to
stay at without the need to be concerned about the operational requirements of these
attractions.
Upon reviewing current market conditions of Niagara Falls, it was estimated that the property
is worth USD 103,015,000. With further investigations, it was identified that under an owner
operated management structure, the property would generate the highest EBITDA out of all
four structures. Continued analysis revealed the anticipated cash flows from the property
based on a 0.50% growth rate and a stabilized occupancy rate of 57.4%. According to the net
present value calculations, it was revealed that the cash flow from the property and the cash
flow to equity at a discounted rate of 11.21% and 17.00% respectively would result in a
negative (-) NPV. Additionally, it was found that payback periods again for both cash flow
from property and cash flow to equity would be longer than the 10 year holding period of the
property.
These two findings indicate that under the current and forecasted market conditions,
acquiring the Hilton Niagara Falls Fallsview Hotel and Suites would not be feasible and
therefore it is not recommended to proceed with the investment.
Encouraging Project Feasibility
Should the investor proceed with the acquisition, there is a possibility to make the project a
feasible investment. Efforts to improve overall ADR in the property should be made as well
28
as an attempt to improve cost percentages for example by improving operational efficiency or
leasing out all food and beverage outlets and collecting rent from each unit. Additionally, the
revenues coming from other operated departments (i.e. the meeting and ballroom space)
could be improved.
However, even at the same market and operational conditions in this report, the project can
be made feasible overall by significantly improving occupancy levels. It is estimated that by
increasing occupancy to around 66% at the stabilized year, the project could become feasible.
However further investigation and analysis would need to be performed to support this
estimation.
Improving occupancy in the city can in fact be a collective effort by all business,
organizations, and municipal entities involved with tourism. Working together would indeed
improve the overall financial performance of the city as well as benefitting the economy,
creating more jobs, and various other economic and social factors. Overnight visitors were
found to be at one-third of total visitors to the city, which could be a result of the city having
a very well connected transportation network. As such, special campaigns to encourage more
overnight stays could be implemented. As well, special deals for hotel guests with various
attractions and entertainment destinations could be launched to encourage day visitors to stay
the night. As said, the increase in overnight visitors would surely not only benefit Niagara
Falls City but indeed potentially make the acquisition of the Hilton Niagara Falls Fallsview
Hotel and Suites a feasible project.
29
References
City of Niagara Falls. (2015). Niagara Falls Canada. Retrieved from
https://www.niagarafalls.ca/
Colliers International. (2014). 2014 Canadian hotel investment report. Toronto, CA: Author.
Retrieved from http://www.colliershotels.com/2014/CHIR/Colliers-2014CHIR.pdf
Colliers International. (2015). 2015 Canadian hotel investment report. Toronto, CA: Author.
Retrieved from http://www.colliershotels.com/reports/2015-canadian-hotel-
investment-report
Detlefsen, H. & Glodz, M. (2013, January). Historical trends hotel management contracts.
Chicago, US: HVS. Retrieved from EAHM Moodle Open-source learning platform
Falls Avenue Resort. (2015). Crowne Plaza Niagara Falls – Fallsview. Retrieved from
http://www.niagarafallscrowneplazahotel.com/
Fallsview Casino Resort. (2015). Retrieved from http://www.fallsviewcasinoresort.com/
Hilton Niagara Falls Fallsview. (2015). Retrieved from
https://www.niagarafallshilton.com/index.php
HVS in Canada. (2012, November). Canadian monthly lodging outlook – November 2012.
Toronto, CA: Author. Retrieved from http://www.hvs.com/article/6152/canadian-
monthly-lodging-outlook-november-2012/
HVS in Canada. (2014, October). 2014 Canadian hotel valuation index. Toronto, CA: Author.
Retrieved from http://www.hvs.com/article/7088/2014-canadian-hotel-valuation-
index/
JLL. (2014, June). Hotel investor sentiment survey. Chicago, US: Author. Retrieved from
EAHM Moodle Open-source learning platform
Niagara Convention & Civic Centre Inc. (2015). Scotia Bank Convention Centre. Retrieved
from http://www.fallsconventions.com/facility.html
Niagara Falls Live. (2015). Facts about Niagara Falls. Retrieved from
https://www.niagarafallslive.com/facts_about_niagara_falls.htm
30
Niagara Falls Tourism. (2015). Retrieved from http://www.niagarafallstourism.com/
Niagara Region. (2013). Economic growth strategy 2013-2015: Report to the public. ON,
Canada: Author. Retrieved from http://www.niagaraknowledgeexchange.com/wp-
content/uploads/sites/2/2014/05/Economic_Growth_Strategy_2013_2015.pdf
Queen’s Printer for Ontario. (2015). Historical statistics. Retrieved from
http://www.mtc.gov.on.ca/en/research/historicalstats/historical_statistics_tables.shtml
Rosszell, M. (2002). Hotel insurance premiums on the rise?. Retrieved from
http://www.hotel-online.com/News/PR2002_2nd/May02_CanadianLodgingOutlook.h
tml
Rushmore S. Jr. & Bagley, E. (2014). 2014 United States hotel franchise fee guide. NY,
USA: HVS. Retrieved from EAHM Moodle Open-source learning platform
Rushmore, S. (2011, November 2). Comparing same hotels across five regions. HVS Lodging
Hospitality. Retrieved from http://www.hvs.com/article/5529/comparing-same-hotel-
across-five-regions/
Rushmore, S., O’Neill, J.W. & Rushmore S. Jr. (2012). Hotel market analysis and valuation.
Chicago, US: Appraisal Institute
Starwood Hotels & Resorts Worldwide, Inc. (2015). Four Points by Sheraton Niagara Falls
Fallsview. Retrieved from
http://www.starwoodhotels.com/fourpoints/property/overview/index.html?
propertyID=3315
31