Host-Microbial Interactions that Modulate Luminal IgA
179
Washington University in St. Louis Washington University Open Scholarship All eses and Dissertations (ETDs) Summer 9-1-2014 Host-Microbial Interactions that Modulate Luminal IgA Clara Moon Washington University in St. Louis Follow this and additional works at: hps://openscholarship.wustl.edu/etd is Dissertation is brought to you for free and open access by Washington University Open Scholarship. It has been accepted for inclusion in All eses and Dissertations (ETDs) by an authorized administrator of Washington University Open Scholarship. For more information, please contact [email protected]. Recommended Citation Moon, Clara, "Host-Microbial Interactions that Modulate Luminal IgA" (2014). All eses and Dissertations (ETDs). 1325. hps://openscholarship.wustl.edu/etd/1325
Transcript of Host-Microbial Interactions that Modulate Luminal IgA

Washington University in St. LouisWashington University Open Scholarship
All Theses and Dissertations (ETDs)
Summer 9-1-2014
Host-Microbial Interactions that ModulateLuminal IgAClara MoonWashington University in St. Louis
Follow this and additional works at: https://openscholarship.wustl.edu/etd
This Dissertation is brought to you for free and open access by Washington University Open Scholarship. It has been accepted for inclusion in AllTheses and Dissertations (ETDs) by an authorized administrator of Washington University Open Scholarship. For more information, please [email protected].
Recommended CitationMoon, Clara, "Host-Microbial Interactions that Modulate Luminal IgA" (2014). All Theses and Dissertations (ETDs). 1325.https://openscholarship.wustl.edu/etd/1325

WASHINGTON UNIVERSITY IN ST. LOUIS
Division of Biology & Biomedical Sciences
Immunology
Dissertation Examination Committee:
Thaddeus S. Stappenbeck, Chair
Paul M. Allen
Deepta Bhattacharya
Marco Colonna
David A. Hunstad
Herbert W. Virgin
Host-Microbial Interactions that Modulate Luminal IgA
by
Clara Moon
A dissertation presented to the
Graduate School of Arts and Sciences
of Washington University in
partial fulfillment of the
requirements for the degree
of Doctor of Philosophy
August 2014
St. Louis, Missouri

ii
TABLE OF CONTENTS
LIST OF FIGURES AND TABLES.............................................................................................. iv
LIST OF ABBREVIATIONS ....................................................................................................... vii
ACKNOWLEDGEMENTS ........................................................................................................... ix
ABSTRACT OF THE DISSERTATION ...................................................................................... xi
CHAPTER 1 ...................................................................................................................................1
INTRODUCTION
CHAPTER 2 .................................................................................................................................15
DEVELOPMENT OF A PRIMARY INTESTINAL EPITHELIAL MONOLAYER
CULTURE SYSTEM TO EVALUATE FACTORS THAT MODULATE IgA
TRANSCYTOSIS
Abstract ..............................................................................................................................16
Introduction ........................................................................................................................17
Materials and Methods .......................................................................................................20
Results ................................................................................................................................24
Discussion ..........................................................................................................................32
Figures................................................................................................................................35
CHAPTER 3 .................................................................................................................................85
HERITABLE LUMINAL IgA LEVELS DISTINGUISH EXTRA-CHROMOSOMAL
PHENOTYPIC VARIATION
Abstract ..............................................................................................................................86
Introduction ........................................................................................................................87
Materials and Methods .......................................................................................................89
Results ................................................................................................................................93

iii
Discussion ..........................................................................................................................98
Figures................................................................................................................................99
CHAPTER 4 ...............................................................................................................................149
SUMMARY AND FUTURE DIRECTIONS
Summary ..........................................................................................................................150
Future directions ..............................................................................................................152
Figures..............................................................................................................................156
REFERENCES ...........................................................................................................................160

iv
LIST OF FIGURES AND TABLES
CHAPTER 2
Figure 2.1. Timeline for primary intestinal epithelial monolayer formation ................................35
Figure 2.2. Primary IECs form a polarized monolayer that can be induced to express pIgR .......37
Figure 2.3. Primary IEC monolayers can differentiate into various cell types .............................39
Figure 2.4. Primary IEC monolayers mirror in vivo staining patterns ..........................................41
Figure 2.5. Colonic epithelial cells express pIgR in vivo ..............................................................43
Figure 2.6. Primary IEC monolayers express pIgR mRNA in vitro .............................................45
Figure 2.7. Primary IEC monolayers express Reg3g and Vil1 mRNA in vitro ............................47
Figure 2.8. Primary IEC monolayers show robust transepithelial electrical resistance ................49
Figure 2.9. Schematic for IgA transcytosis assay .........................................................................51
Figure 2.10. IgA transcytosis by primary IEC monolayers mirrors pIgR expression ..................53
Figure 2.11. IgA transcytosis time course by primary IEC monolayers .......................................55
Figure 2.12. Determining the optimal IgA concentration for IgA transcytosis ............................57
Figure 2.13. Determining the optimal LPS concentration for IgA transcytosis ...........................59
Figure 2.14. Heat-Killed E.coli can induce IgA transcytosis and pIgR expression ......................61
Figure 2.15. Cell density affects IgA transcytosis and monolayer formation ...............................63
Figure 2.16. Cell density affects pIgR protein expression ............................................................65
Figure 2.17. Cell density affects pIgR mRNA expression ............................................................67

v
Figure 2.18. Cell density affects intestinal epithelial monolayer differentiation ..........................69
Figure 2.19. IL-17 robustly induces IgA transcytosis and pIgR expression .................................71
Figure 2.20. IL-1β can induce IgA transcytosis and pIgR expression ..........................................73
Figure 2.21. TNFα can induce IgA transcytosis and pIgR expression .........................................75
Figure 2.22. IFNγ does not induce pIgR expression .....................................................................77
Figure 2.23. IFNγ-treated cells do not maintain an intact monolayer ...........................................79
Figure 2.24. Cells from Tlr4-/-
mice have an impaired IgA transcytosis response to LPS ...........81
Figure 2.25. Tlr4-/-
cells induce IgA transcytosis and pIgR expression in response to IL-17 ......83
CHAPTER 3
Figure 3.1. Wild type C57BL/6 mice have a binary fecal IgA phenotype ...................................99
Figure 3.2. The binary fecal IgA phenotype is observed in two independent facilities ..............101
Figure 3.3. Serum IgA is comparable between IgA-High and IgA-Low mice ...........................103
Figure 3.4. The binary fecal IgA phenotype is heritable ............................................................105
Figure 3.5. The IgA-Low phenotype is dominantly transferable by co-housing ........................107
Figure 3.6. The IgA-Low phenotype is transferable between two independent facilities ..........109
Figure 3.7. Schematic for passage experiment though pIgR-/-
mice ...........................................111
Figure 3.8. The binary IgA phenotype can be passaged though pIgR-/-
mice .............................113
Figure 3.9. The IgA-Low phenotype can be transferred by fecal transplantation ......................115
Figure 3.10. The IgA-Low phenotype is driven by ampicillin-susceptible bacteria ...................117

vi
Figure 3.11. The converted IgA-High phenotype is stable and heritable ...................................119
Figure 3.12. Summary model of the IgA phenotype ...................................................................121
Figure 3.13. The IgA-Low mice have greater weight loss in DSS injury...................................123
Figure 3.14. The IgA-Low mice have increased ulceration in DSS injury .................................125
Figure 3.15. IgA status of mice after VNAM and FT, before the start of DSS ..........................127
Figure 3.16. The increased DSS-induced weight loss is due to altered IgA levels ....................129
Figure 3.17. The increased DSS-induced ulceration is due to altered IgA levels .......................131
Figure 3.18. Plasma cell numbers are unchanged between IgA-High and IgA-Low mice.........133
Figure 3.19. pIgR immunostaining is not different between IgA-High and IgA-Low mice ......135
Figure 3.20. Secretory component is absent in IgA-Low fecal samples .....................................137
Figure 3.21. The IgA-Low-associated microbes are culturable ..................................................139
Figure 3.22. Schematic of intestinal epithelial:bacterial co-culture for IgA transcytosis ...........141
Figure 3.23. pIgR is expressed equally in intestinal epithelial monolayers in all conditions .....143
Figure 3.24. IgA-Low cultured microbes degrade SC in vitro ...................................................145
Figure 3.25. Summary and working model.................................................................................147
CHAPTER 4
Figure 4.1. IgA-Low cultured microbes degrade SIgA in vitro ..................................................156
Figure 4.2. Identification of IgA-Low-associated microbes by 16S sequencing ........................158

vii
LIST OF ABBREVIATIONS
AID Activation-induced (cytidine) deaminase
APRIL A proliferation-inducing ligand; Tnfsf13
Atoh1 Atonal homolog 1
BAFF B-cell activating factor; Tnfsf13B
Caco-2 human colorectal adenocarcinoma cell line, epithelial
CD Crohn’s Disease
CM Conditioned media (from L-WRN cells)
DAPT N-[(3,5-Difluorophenyl)acetyl]-L-alanyl-2-phenyl]glycine-1,1-dimethylethyl
ester (γ-secretase inhibitor)
dIgA Dimeric immunoglobulin A
dsRNA double stranded RNA
DSS Dextran sodium sulfate
EDTA Ethylenediaminetetraacetic acid
ELISA Enzyme-linked immunosorbent assay
EPEC Enteropathogenic E.coli
hBD1 Human beta defensin 1
HT-29 Human colorectal adenocarcinoma cell line, epithelial
IBD Inflammatory bowel disease
IEC-18 Rat ileal cell line
IFNγ Interferon gamma
IgA Immunoglobulin A
IgA1 Human IgA subclass 1
IgA2 Human IgA subclass 2
IGAD IgA deficiency
IgG Immunoglobulin G
IgJ Immunoglobulin J; J chain
IgM Immunoglobulin M
IL-1β Interleukin-1β
IL-2 Interleukin-2
IL-4 Interleukin-4
IL-5 Interleukin-5
IL-10 Interleukin-10
IL-17 Interleukin-17
ILF Isolated lymphoid follicle
IRF1 Interferon regulatory factor 1
LL-37 Cathelicidin antimicrobial peptide
LPS Lipopolysaccharide
LTi Lymphoid tissue inducer cells
L-WRN L-cells expressing Wnt3a, R-spondin3, and Noggin
MDCK Madin-Darby canine kidney epithelial cell line
MHC Major histocompatibility complex
Muc2 Mucin 2
Myd88 Myeloid differentiation primary response gene 88
NFκB Nuclear factor kappa B

viii
OVA ovalbumin
pIgR Polymeric immunoglobulin receptor
RAG Recombination activating gene
RegIIIγ Regenerating islet-derived 3 gamma
ROCK Rho kinase inhibitor, Y-27632
SC Secretory component (cleaved form of pIgR that is bound to dIgA)
SCID Severe combined immunodeficiency
SIgA Secretory immunoglobulin A (composed of SC bound to dIgA)
STAT6 Signal transducer and activator of transcription 6
T84 Human colorectal carcinoma cell line, epithelial
TCR T cell receptor
TER Transepithelial electrical resistance
TGFβ Transforming growth factor beta
TLR Toll like receptor
TLR4 Toll-like receptor 4
TNFα Tumor necrosis factor alpha
TRUC Tbet-/-
Rag-/-
ulcerative colitis (mouse model)
UEA-1 Ulex europaeus agglutinin 1 (lectin)
Vil1 Villin 1
ZapA Metalloprotease from Proteus mirabilis
ZO-1 Zonula occludens 1 / Tjp1 (Tight junction protein 1)

ix
ACKNOWLEDGEMENTS
First and foremost, I would like to thank my parents for always supporting me and
encouraging me in all of my endeavors. They have sacrificed so much to provide me with the
best life possible, and I cannot express in words the gratitude and love that I have for them. They
have taught me the importance of education and the value of hard work, but most importantly
they have taught me about perseverance and determination. I may still be a pessimist at heart, but
I will never truly give up on anything or anyone because of them. They have been tremendous
role models, and I wouldn't be the same person I am today without their example.
I would also like to thank Thad for being a wonderful mentor and giving me the
opportunity to train in his laboratory. Despite his busy schedule, he always made time to talk to
his students and trainees; his door was always open to us and I truly appreciate that. Though my
project had bumps, unexpected turns, and even some dead ends along the way, he was always
able to find the good in the bad, and his enthusiasm for science is contagious. Because of this,
I've learned much more than just how to think scientifically.
I would like to thank all the members of my thesis committee – Paul, Deepta, Marco,
David, and Skip – for their time, encouragement, and guidance to help me become a better
scientist. I couldn't have asked for better mentors.
I was very lucky to have the privilege of working with Megan Baldridge, who was a
wonderful collaborator, mentor, and friend. All of the work performed in chapter 3 was with her
help, and without her this story would not have been the same. She was the one that encouraged
and helped me to push this project past the striking initial observations, and I am truly grateful to
have worked with her on this story.

x
Thank you to all the members of the Stappenbeck lab, past and present. It was wonderful
to be surrounded by people from such different scientific backgrounds, who approached each
question from a different perspective. Our conversations have been invaluable in my growth as a
scientist. In addition, I've made some truly great friends who have made the lab a lively and
enjoyable place to work.
I’d also like to thank Darren Kreamalmeyer for his help with mice throughout the years.
He always has kind words of encouragement for me every time we meet.
I am very grateful to Jerri Smith, Bonnie Meltzer, Janet Casmaer, Ann Winn, and
Jennifer Schwierjohn, who have all been so generous with their help throughout the years.
Melanie Relich has been there for me since the day I applied to the program, and I'm very
appreciative for all her help and guidance.
I would like to thank my wonderful friends – I couldn't have gotten through this without
their support. They’ve been there for me through all the ups and downs of grad school, and have
reminded me to take time to breathe and enjoy life as well.
Funding for this work has been provided by NIH training grant T32-AI007172
(Infectious Diseases/Mechanisms of Microbial Pathogenesis, 2009-2010) and NIH training grant
T32-AI007163 (Immunology and Immunogenetics, 2011-2014).

xi
ABSTRACT OF THE DISSERTATION
Host-Microbial Interactions that Modulate Luminal IgA
by
Clara Moon
Doctor of Philosophy in Biology and Biomedical Sciences
Immunology
Washington University in St. Louis, 2014
Professor Thaddeus S. Stappenbeck, Chair
IgA is the most abundant immunoglobulin produced in the body, most of which can be found
at mucosal sites such as the intestine where it plays an important role at a critical intersection
between the host immune system and the microbiota. In the work detailed here, I sought to
investigate IgA delivery and stability using in vitro and in vivo methods. First, I developed a
primary intestinal epithelial monolayer system, and utilized this system to evaluate factors that
modulate IgA transcytosis. In vivo, I interrogated baseline levels of fecal IgA in WT mice and
surprisingly observed a binary phenotype in fecal IgA levels between cages. I found that the
dichotomous IgA levels were heritable, transmissible, and microbially driven. In addition, the
IgA-Low phenotype was dominant and functionally resulted in increased intestinal injury by
DSS. Utilizing the primary epithelial monolayer system and IgA transcytosis assay, I found that
anaerobically cultured microbes from IgA-Low mice had proteolytic activity capable of
degrading secretory component (SC) in vitro. These findings support the idea that degradation of
SC in vivo would make IgA more susceptible to degradation itself. These studies highlight the
ability of the microbiota to produce phenotypic effects through IgA modulation.

1
CHAPTER ONE
Introduction: IgA in the Intestine

2
The intestine
The intestinal mucosa is comprised of three main layers: the single cell epithelial layer
that lines the inner surface of the intestine, the underlying lamina propria that is populated by
many cell types from different lineages, and the muscularis mucosae that separates the mucosal
layer from the underlying submucosa and muscularis layers. In the colon, the epithelial layer
forms structures called crypts, whereas the small intestinal epithelium covers fingerlike
projections called villi as well as the crypts. There are several different cell types found in the
intestinal epithelium. Stem cells and progenitors found near the base of the crypts are important
for the high turnover of epithelial cells. Absorptive enterocytes function in nutrient and water
absorption. Secretory cell types include the hormone-secreting enteroendocrine cells, mucus
secreting goblet cells, and small intestinal Paneth cells that secrete antimicrobial peptides in
addition to mucus.
The lamina propria contains many different cell types including immune cells such as
dendritic cells, macrophages, and plasma cells. Mucosal sites are locations where the host is in
direct contact with the environment, which includes approximately 1014
commensal bacteria
present in the intestinal lumen1. The immune system must be able to respond to any breaches in
the epithelial barrier but at the same time control its responses to prevent chronic inflammation.
It is thought that diseases such as inflammatory bowel disease (IBD) may arise from the
dysregulation of the immune response to the commensal bacteria2.
Plasma cells and IgA production
Another highly secretory cell type found in the intestine is the immunoglobulin-secreting
plasma cell. 75% of the total immunoglobulin produced in the body is made in the intestine,

3
where immunoglobulin A (IgA) is the predominant isotype produced3. Humans secrete ~3g of
IgA in the intestine per day. While IgA can be found as a monomer in serum, the dimeric form
(dIgA) covalently linked by the J chain (IgJ) is the predominant form at mucosal sites.
Plasma cells develop from B cells after stimulation in either a T cell-dependent or T cell-
independent manner4. Ex vivo studies have found that transforming growth factor β (TGFβ) and
interleukin (IL)-4 could promote naïve B cells to undergo IgA class switch when non-
specifically stimulated5. Furthermore, once IgA class switch has occurred, IL-2, IL-5, and IL-10
had a synergistic effect in increasing IgA levels.
In co-culture studies, dendritic cells were shown to be able to induce IgA class switch
with or without the presence of T cells. Further studies using T cell receptor (TCR) β and δ chain
deficient mice as well as CD40 deficient mice showed a substantial decrease but not absence of
IgA. These studies suggested a T cell-independent pathway of IgA production. It is thought that
in this pathway, intestinal epithelial cells and dendritic cells can produce cytokines such as
APRIL and BAFF that can directly activate B cells to class switch to IgA without the need for
antigen presentation on class II MHC, TCR engagement, or co-stimulation by CD40-CD40L.
This is thought to mainly occur in isolated lymphoid follicles (ILFs), which require lymphoid
tissue inducer (LTi) cells for their formation6.
It has been hypothesized that the T-independent pathway may be important for protection
against commensals, whereas the T-dependent pathway (which leads to affinity maturation by
somatic hypermutation, and therefore more specific antibodies) might play a large role in defense
against pathogens and toxins such as cholera toxin7. Using an activation-induced deaminase
(AID) mutant mouse that can undergo class switch recombination but not somatic
hypermutation, Wei et al observed that in the absence of affinity-maturation, a protective IgA

4
response to cholera toxin could not be generated8. More recent studies have shown however that
the majority of IgA gene sequences in the gut are heavily mutated, arguing for the T-dependent
IgA pathway as the major and dominant pathway for IgA production9.
In the intestine, B cells can be found in the secondary lymphoid tissues such as Peyer’s
Patches (T-dependent) and ILFs (T-independent). Upon stimulation, these cells develop into
plasmablasts and eventually into mature plasma cells as they enter circulation through the
lymphatics and home back to the lamina propria5, where a large number of mature IgA-secreting
plasma cells can be normally found along the entire length of the gastrointestinal tract.
IgA transcytosis and the polymeric immunoglobulin receptor
While plasma cells produce and secrete dIgA locally in the lamina propria, most of its
hypothesized roles are thought to occur in the lumen. To get from the lamina propria into the
lumen, dIgA must bind to the polymeric immunoglobulin receptor (pIgR), which is expressed
basolaterally on epithelial cells. The J chain, a 15 kDa polypeptide, is crucial for the ability of
dIgA to bind to pIgR. In addition to dIgA, other multimeric immunoglobulins that possess the J
chain (such as pentameric IgM) can also bind to pIgR as well10,11
. The dIgA-pIgR complex is
then endocytosed in clathrin-coated vesicles and transcytosed through the cell to the apical
surface. At the cell surface, the receptor is cleaved12
, releasing the dIgA still bound to the
extracellular portion of pIgR (known as the secretory component; SC). This SC-bound dIgA
(called secretory IgA; SIgA) is thought to be more resistant to cleavage by intestinal proteases
due to the presence of the SC, J chain, and additional glycosylation residues13,14
.
The pIgR protein is a 120 kDa type I transmembrane protein expressed specifically in
epithelial cells. Its expression can be found along the entire length of the gastrointestinal tract as
5
well as at other mucosal sites15
. In rodents, there is also robust expression in the liver due to the
hepatobilliary transport of IgA in these animals16,17
. The extracellular portion of pIgR is
composed of 5 immunoglobulin domains that are important for interacting with dIgA11,18-20
. A
small region, containing putative pIgR cleavage sites, separates these immunoglobulin domains
from the transmembrane domain. The cytoplasmic C-terminal region contains a number of
intracellular sorting signals. A great deal of work has been done in vitro using MDCK and
human intestinal epithelial cell lines to dissect out the intracellular trafficking signals and
pathways21-25
. The binding of dIgA to pIgR has been shown to enhance pIgR transcytosis,
however the unoccupied receptor can traffic to the surface to some extent as well21,22,25
.
Furthermore, this unoccupied pIgR can also be cleaved and released into the lumen, where it can
play a role in host-defense independent of IgA. Free SC, which can be found in high
concentrations in human colostrum and milk19
, has been shown to bind to certain bacteria
(enteropathogenic E.coli; EPEC) and antigens (C. difficile toxin A) to prevent their interaction
with intestinal epithelial cells26-28
.
The enzyme that cleaves pIgR at the apical surface in vivo is still unknown20
. The in vitro
systems used to study pIgR have been comprised of many different cell types (intestine, liver,
kidney; from multiple species). Yet in all of these systems, cleavage of pIgR has been observed,
leading to the hypothesis that the enzyme of interest is either a widely expressed host protease, or
there are multiple different proteases able to carry out this function. Further attempts to
characterize the enzyme(s) involved have shown the protease involved to be sensitive to protease
inhibitors leupeptin, antipain, E-64, and Aprotinin12
. In addition, characterization of domain 6 of
SC from human secretions did not find a consensus cleavage site29,30
. These data suggest that

6
there are potentially multiple different enzymes that cleave pIgR in vivo, or that there is
additional processing by host/bacterial peptidases after the initial cleavage event.
Regulation of pIgR expression
The expression of pIgR in the intestinal epithelium is regulated by bacterial stimuli19,31-35
.
In vitro studies have shown that stimulation of HT-29 cells with microbial factors such as heat
killed bacteria, lipopolysaccharide (LPS), butyrate, and dsRNA can upregulate pIgR
expression32,33
. In addition, pro-inflammatory cytokines produced in response to microbial
stimuli, such as interferon-γ (IFNγ), tumor necrosis factor-α (TNFα), IL-1β, IL-4 and IL-17 have
also been shown to increase pIgR expression in vitro19,36
. In vivo studies also support this idea, as
germ-free mice monocolonized with Bacteroides thetaiotamicron have a 3-fold increase in pIgR
expression in the ileum31
.
Promoter analysis of mouse and human pIgR has revealed binding sites for multiple
transcription factors including IRF1, STAT6, and NFkB37,38
. This is in agreement with the in
vitro studies showing the ability of IFNγ (signaling through IRF1), IL-4 (signaling through
STAT6), and TNFα (signaling though NFkB) to induce pIgR expression. Furthermore, bacterial
ligands can signal through different toll like receptors (TLR) via Myd88 and NFkB to directly
induce pIgR expression38,39
. Epithelial-specific deletion of Myd88 showed a ~50% decrease in
pIgR expression, suggesting a contribution of both Myd88-dependent and -independent
pathways normally occurring in vivo.

7
Regulation of intestinal IgA induction
Germ-free animals have markedly reduced intestinal plasma cell numbers and IgA,
demonstrating the important role of microbes in the production of intestinal IgA40
. To take a
closer look at the timing and specificity of the IgA produced in the intestine, Hapfelmeier et al
performed an elegant study using a novel reversible germ-free system41
. In those experiments, an
E. coli mutant requiring nutrients not produced by mammalian hosts was used. These mutants
were able to survive in a nutrient-supplemented culture, but could not replicate and colonize the
intestinal tract. Germ-free mice gavaged with this mutant strain became germ-free within 72
hours. Despite the lack of colonization, a specific IgA response was observed, although a high
dose of live bacteria was required to induce this response. This suggested an intrinsic threshold
(between 108-10
9 bacteria) for the intestinal IgA response to occur. After exposure to this single
bacterial strain, the plasma cells persisted for >16 weeks, despite the fact that germinal center B
cells returned to baseline by 2-6 weeks in the absence of bacteria. In the presence of additional
bacterial species however, the E.coli-specific IgA is rapidly lost due to ongoing induction of IgA
by the colonized microbes. This result showed that the IgA response changed to the changing
microbial population, allowing the mucosal immune system to adapt to the bacteria that are
currently present.
Older studies have shown that the average half-life of intestinal plasma cells was 5 days,
with a maximum lifetime of 6-8 weeks in conventional mice42
. These studies demonstrate the
quicker turnover of plasma cells and most likely the changing IgA specificities in the presence of
a diverse commensal microbiota.

8
What is the role of SIgA in the intestine?
Several knockout mice lacking luminal IgA have been created to look at the role of IgA
in the intestine. Two different pIgR-/-
mice have been created by different groups, targeting
different exons of the pIgR gene43,44
. Both mice show essentially no IgA in the feces or luminal
content, indicating the essential role of pIgR in the transport of IgA into the lumen. In addition,
there is a significant increase in serum IgA levels (especially dIgA), as well as an increase in
lamina propria IgA staining in the pIgR-/-
mice compared to heterozygous and wild type
littermate controls. Further studies showed that there is an increase in IgA+ plasma cell numbers
in the lamina propria of the pIgR-/-
mice45
. The IgJ-/-
mouse also shows a similar phenotype as the
pIgR-/-
, with decreased luminal IgA and increased serum IgA46,47
. Additional mice lacking
luminal IgA (among other things) include the immunodeficient SCID and RAG-/-
mice, class-
switch deficient AID-/-
mouse as well as the IgA-/-
mouse48
. The IgA-/-
mice show an increase in
other immunoglobulin isotypes, and there is concern in the field of disregulated class switching
due to the fact that the IgA switch region was targeted in addition to several of the Cα exons.
The functional significance of this lack in luminal IgA has been tested using several
models, and there are several hypotheses in the field. Infection studies looking at intestinal and
lung pathogens in pIgR-/-
and IgJ-/-
mice show that SIgA is important in protecting against
secreted toxins at the mucosal sites47,49
and preventing colonization of bacterial pathogens49,50
.
However, systemic immune responses seem to be intact, as pIgR-/-
mice are able to survive and
clear systemic infection with Salmonella typhimurium and Streptococcus pneumoniae after
mucosal immunization just as well as wild type mice. In addition, uninfected pIgR-/-
mice show
increased translocation of gut commensal bacteria to the MLNs compared to wild type mice
along with an increase in serum IgA and IgG reactivity to the commensal bacteria51
. This

9
supports the idea that luminal IgA is important in limiting bacterial translocation across the
epithelium. Furthermore, IgA may play a role in regulating the composition of the normal
commensal bacterial population, as AID-/-
, RAG-/-
, and SCID mice all show alterations in their
intestinal microbiota compared to wildtype or littermate controls4,52
. Finally, using OVA-specific
TCR transgenic mice, it has been shown that epithelial cells can transport antigen-bound dIgA
from the lamina propria into the lumen via pIgR, thereby eliminating antigens that have crossed
the intestinal epithelial barrier53
.
Despite these many hypothesized roles and experimental systems utilized to address these
hypotheses, direct and definitive evidence for the exact function of IgA in vivo is still lacking
and there is still debate in the field as to its functional significance7.
Selective IgA deficiency in humans
In humans, IgA deficiency (IGAD) is the most common primary immunodeficiency, with
frequencies ranging between 1:223 and 1:1000 in different US populations54
. It is defined as
decreased or absent serum IgA in the presence of normal IgM and IgG. Most people with IGAD
are asymptomatic and many more are thought to go undiagnosed due to the general nature of the
symptoms. Patients with this disorder develop allergies, autoimmune manifestations, and
recurrent infections at mucosal sites. Additionally, selective IgA deficiency has been associated
with several gastrointestinal disorders including celiac disease, colon cancer, and IBD. These
manifestations suggest an important role for IgA at mucosal sites, however, IgA levels at
mucosal sites have not been thoroughly investigated in humans, as diagnosis is usually limited to
serum-based methods. As the mucosal immune compartment is thought to be distinct and
separate from the systemic immune compartment, there could be IgA deficiencies specifically at

10
mucosal sites through several different mechanisms that have not been observed or investigated
in the context of mucosal diseases such as IBD.
In 1976, a case study was published on a 15 year old patient with normal serum
immunoglobulins, but specifically lacking mucosal IgA55
. This patient was breast fed until 3.5
months of age, after which he developed persistent intermittent diarrhea. Antibiotic treatment
and dietary changes did not resolve the symptoms, and multiple stool samples were negative for
parasites. Small intestinal biopsy samples revealed increased lamina propria lymphoid cells, and
in vitro stimulation of peripheral blood lymphocytes showed normal proliferation and
immunoglobulin secretion. Unlike IGAD patients, free secretory component was not found in
saliva or jejunal fluid. At this time the role of SC and the identity of pIgR were unknown,
however the evidence presented here suggests that the patient may have a defect in IgA
transcytosis by pIgR. This case study shows the significance of maternally transferred IgA, as
well as the role of IgA in maintaining intestinal homeostasis.
A recent study looking at Crohn’s Disease (CD) patients identified a subset of patients
with reduced pIgR expression in the colon along with elevated serum IgA levels and increased
IgA staining in the lamina propria56
. This mirrors what is observed in the pIgR-/-
mice. These two
examples demonstrate potential consequences of the lack of luminal SIgA in the presence of
normal or even elevated systemic IgA, and further supports the idea that serum IgA cannot
necessarily be used as a read-out for mucosal IgA.
Commensal bacteria in the intestine
There is an estimated 1014
microbes present in the intestinal lumen representing at least
500-1000 individual species1. These commensal bacteria are acquired shortly after birth, and

11
many of these microbes are thought to be maternally transmitted57-59
. Sequencing of the gut
microbiome has revealed Bacteroidetes and Firmicutes as the two major phyla found in the
intestine60,61
. Despite the fact that these commensal bacteria greatly outnumber host cells, the
idea that microbes can modulate host phenotypes is sometimes overlooked in studies using
genetically modified mice. While there are many phenotypes that are a clear and direct
consequence of host genetics, there have been many cases where the assumed genetically-
induced phenotype may in fact be driven solely by differences in the commensal microbiota62-67
.
In some cases, opposing results using the same genetic knockout mouse in different facilities has
led to controversy and argument in the field62,68,69
. It has therefore become crucial to take into
account both host genetic and microbial factors in studies, especially those involving mucosal
sites.
Degradation of SIgA by pathogenic bacteria
Although there is still debate over the role and even significance of IgA, the fact that
there are pathogenic bacteria that can degrade IgA strongly supports the idea that IgA plays an
important role in host-microbial interactions and intestinal homeostasis. Beginning in the 1970s,
several groups have identified pathogenic bacteria producing related proteases that specifically
cleave human IgA1 at Pro-Ser and Pro-Thr residues in the IgA hinge region70-72
. The bacterial
strains, isolated from human patients, include Neisseria gonorrheae, Neisseria meningitides,
Haemophilus influenza, and Streptococcus pneumonia. Importantly, the related non-pathogenic
members/commensal species of these bacteria did not even possess the IgA1 protease genes,
suggesting that these genes could be virulence factors73,74
.

12
A recent study showed one mechanism of how this ability to degrade IgA can benefit the
bacterial pathogen75
. Janoff et al showed in vitro that exogenously and endogenously produced
IgA1 protease cleaved capsule-specific monoclonal human IgA1 antibodies that recognized the
bacterial surface of S. pneumonia. This in turn inhibited the Fc-mediated phagocytic killing of
the microbe, and furthermore left the Fab fragments still bound to the antigenic residues on the
bacterial surface, making these bacteria in effect immunologically hidden.
While human IgA1 is more abundant at non-mucosal sites, the identification of bacterial
IgA1 proteases led to the idea that there could be pathogens that cleave the mucosally-dominant
human IgA2. In fact, several examples of bacteria able to cleave human IgA2 have been
identified73,76,77
. Like the classical IgA1 proteases, these proteases have been isolated from
bacterial pathogens (Clostridial species from IBD and Proteus species from urinary tract
infections). While the some of the identified proteases may be more specific for IgA, Proteus
mirabilis has been shown to produce a metalloprotease called ZapA that is able to cleave a wide
variety of proteins, including immunoglobulins (IgA1, IgA2, IgG), SC, complement (C1q, C3),
antimicrobial peptides (hBD1, LL-37), and structural proteins (collagen, fibronectin, laminin,
actin, tubulin)78,79
.
The bacterial IgA proteases identified to date have great specificity for their host species.
For example, the bacterial IgA1 proteases from human isolates have limited reactivity and are
only specific for human IgA1, and in some cases chimpanzee and gorilla IgA180,81
. Furthermore,
multiple strains of canine Ureaplasma isolates were shown to cleave canine IgA, but did not
have proteolytic activity against human or murine IgA81
. The identification of these broad and
specific IgA proteases produced by pathogenic bacteria with host specificity highlights the

13
significant impact that IgA has played in the evolutionary conversation between the host and
microbes.
Modeling the intestine in vitro
Many advances in the last few decades have made the study of gastrointestinal tract
possible, including the development of genetically and microbially defined animal models,
animal models of injury and repair, and immortalized cell lines. Most recently, the ability to
grow and propagate primary intestinal epithelial cells in vitro has greatly advanced the field.
Sato et al developed an intestinal crypt culture system from single Lgr5+ cells isolated
from the mouse intestine that required exogenous growth factors in the media (EGF, R-spondin1,
and Noggin)82
. The single Lgr5+ cells, suspended in Matrigel, were shown to form crypt-villus
structures termed organoids, and contained multiple cell types including enterocytes, Paneth
cells, goblet cells, and enteroendocrine cells. These organoids could be dissociated and re-plated
to form new organoids every 14 days. While this was a major breakthrough in the field, the
exogenous factors required to maintain these cells are expensive and can be cost-prohibitive to
maintain for the large-scale cultures that are required for standard in vitro assays.
Miyoshi et al developed a system to culture enriched gastrointestinal stem cells using
conditioned medium from a supportive cell line (L-WRN) containing Wnt3a, R-spondin3, and
noggin83,84
. This system not only provided a cost-effective method to grow primary intestinal
stem cells, it also allowed for the use of whole tissue as starting material, eliminating the need to
sort and purify stem cells prior to the start of culture. Despite the heterogeneous cell population
in the starting material, the culture conditions here specifically allowed for the growth and
propagation of the stem cell population. Unlike the organoid system, these enriched stem cells

14
did not form budding structures and instead formed spheroids. However, these cells were able to
differentiate into multiple cell types by decreasing the amount of conditioned media and adding
the γ secretase inhibitor DAPT. Furthermore, these cells could be passaged every 3 days, as
opposed to the 14 days required by the organoid system. In addition, the L-WRN conditioned
media has allowed for establishment of epithelial spheroid cultures from human gastrointestinal
tissue and biopsy samples (VanDussen et al in press).
Prior to the ability to grow primary intestinal epithelial cells, colon cancer cell lines have
been widely used to model physiologic and cell biologic intestinal processes in vitro, and these
studies have provided great insight into epithelial cell biology. However, there are many well-
recognized limitations to these lines including prolonged time to attain mature and differentiated
monolayers (~20 days in culture for some lines), aneuploidy, and the presence of numerous
undefined DNA mutations. Additional alternatives to human cancer cell lines have been
developed and include the use of virally-transformed intestinal epithelial cells such as rat IEC-18
cells, or non-intestinal epithelial cells such as MDCK cells, but these systems have their own
limitations85,86
. One major advantage these various cell lines have over the current primary
intestinal epithelial culture method is their ability to form polarized monolayers in Transwells.
This has provided the means to study many epithelial cell processes including interactions with
other host cell types, interactions with microbes, drug absorption, and intracellular
trafficking85,87,88
. The development of a primary intestinal epithelial monolayer system would
allow for a more physiologic model to investigate these different intestinal epithelial processes in
vitro.

15
CHAPTER TWO
Development of a Primary Intestinal Epithelial Monolayer Culture System
to Evaluate Factors that Modulate IgA Transcytosis
16
ABSTRACT
There is significant interest in the use of primary intestinal epithelial cells in monolayer
culture to model intestinal biology. However, it has proven to be challenging to create functional,
differentiated monolayers using current culture methods, likely due to the difficulty in expanding
these cells. Here, we adapted our recently developed method for the culture of intestinal
epithelial spheroids to establish primary epithelial cell monolayers from the colon of multiple
genetic mouse strains. These monolayers contained differentiated epithelial cells that displayed
robust transepithelial electrical resistance. We then functionally tested them by examining IgA
transcytosis across Transwells. IgA transcytosis required induction of pIgR expression, which
could be stimulated by a combination of lipopolysaccharide and inhibition of -secretase. In
agreement with previous studies using immortalized cell lines, we found that TNFα, IL-1β, IL-
17, and heat-killed microbes also stimulated pIgR expression and IgA transcytosis. We used
wild-type and knockout cells to establish that among these cytokines, IL-17 was the most potent
inducer of pIgR expression/IgA transcytosis. IFN, however, did not induce pIgR expression,
and instead led to cell death. This new method will allow the use of primary cells for studies of
intestinal physiology.

17
INTRODUCTION
The study of intestinal epithelial biology has been made feasible through advances in the
field of gastroenterology during the last few decades. Some of these technical advances have
included the development of genetically and microbiologically defined animal models, animal
models of injury and repair, and immortalized epithelial cell lines for in vitro studies. Most
recently, the ability to propagate primary intestinal epithelial cells in vitro has greatly advanced
the field82-84
.
Prior to the ability to grow primary intestinal epithelial cells, colon cancer cell lines have
been widely used to model physiologic and cell biologic intestinal processes in vitro. Studies
using these lines have provided initial insights into epithelial biology in many areas. For
example, Caco-2, HT-29, and T84 cells can form monolayers of differentiated cells89-91
.
However, colon cancer cell lines have many well-recognized limitations including prolonged
time to attain mature monolayers (~20 days in culture for some lines), aneuploidy, and the
presence of numerous undefined DNA mutations. Additional alternatives to human cancer cell
lines have been developed and include the use of virally-transformed intestinal epithelial cells
such as rat IEC-18 cells, or non-intestinal epithelial cells such as MDCK cells, but these systems
also have limitations85,86
.
One advantage these various cell lines have over the current primary intestinal epithelial
cell culture method is their ability to form polarized monolayers in Transwells. This has provided
the means to study many epithelial cell processes including interactions with other cell types,
interactions with microbes, drug absorption, and intracellular trafficking85,87,88
. One such
intestinal epithelial cell process that has been well-dissected and characterized using these cell
lines is IgA transcytosis via pIgR11,19,38
.

18
The majority (75%) of the total immunoglobulin produced in the body is made in the
intestine, where IgA is the predominant isotype produced3. Humans secrete ~3 g of IgA in the
intestine per day. While IgA can be found as a monomer in serum, the dimeric form (dIgA)
connected by the J chain (IgJ) is the predominant form at mucosal sites20
.
Plasma cells produce and secrete dIgA locally in the lamina propria. For the IgA to enter
the intestinal lumen, dIgA must bind to its receptor pIgR92,93
, which is expressed basolaterally on
epithelial cells. The dIgA-bound pIgR is then endocytosed in clathrin-coated vesicles and
transcytosed across the cell through several distinct compartments to the apical surface11,19,94
. At
the cell surface, as of yet unidentified enzymes cleave the receptor, releasing the dIgA still bound
to the extracellular portion of pIgR (known as the secretory component, or SC). This secretory
IgA (SIgA), protected by the J chain as well as the SC, is more resistant to cleavage by intestinal
proteases13,14
.
Several studies have shown that the expression of pIgR in the intestinal epithelium is
regulated by bacterial stimuli. Germ free mice have a 3-fold increase in pIgR expression in the
ileum upon monocolonization with Bacteroides thetaiotamicron31
. In vitro studies have shown
that stimulation of HT-29 cells with microbial factors (such as LPS, butyrate, and dsRNA) or
heat-killed bacteria can upregulate pIgR expression32,33
. Pro-inflammatory cytokines produced in
response to microbial stimuli, such as IFNγ, TNFα, IL-1, and most recently IL-17 have also been
shown to increase pIgR expression in vitro19,36,38,95-98
.
Here for the first time, we establish a system to grow primary intestinal epithelial cell
monolayers. This will assist in the study of intestinal epithelial cell processes in vitro using
primary cells. We chose to focus on the process of IgA transcytosis using this system. We were
able to adapt the previously established three dimensional (3D) primary intestinal epithelial stem

19
cell culture system into a 2D monolayer in a Transwell. These cells are able to express pIgR after
stimulation with LPS, and transcytose IgA across the monolayer. TNFα, IL-1β, and IL-17 were
able to induce pIgR expression and IgA transcytosis in a dose-dependent manner. Importantly,
perhaps demonstrating a distinction with previous methodologies using immortalized cell lines,
IFN did not enhance pIgR expression. Heat-killed bacteria were also able to stimulate these
processes to differing extents. Finally, this system will be readily adaptable for the use with
available genetically modified mice to study different genes of interest: primary intestinal
epithelial cells from pIgR-/-
mice do not show IgA transcytosis into the supernatants, while cells
from Tlr4-/-
mice have reduced pIgR expression and IgA transcytosis after LPS stimulation
compared to wild-type cells.

20
MATERIAL AND METHODS
Mice. Animal protocols were approved by the Washington University Animal Studies
Committee. All mice were maintained in a specific pathogen-free barrier facility. pIgR-/-
mice
(B6.129P2-Pigrtm1Fejo
/Mmmh43
) were initially obtained from Mutant Mouse Regional Resource
Center (Columbia, MO). Tlr4-/-
mice were provided by the laboratory of Dr. William F. Stenson
(B6.B10ScN-TLR4lps-del
/JthJ from Jackson Laboratory99
). All mice used were 8-10 weeks of age.
3D spheroid cell culture. Primary colonic epithelial stem cells were isolated, grown, and
maintained as 3D spheroid cultures in Matrigel (BD Biosciences; San Jose, CA) as described in
Miyoshi et al83,84
. Cells were kept in 50% L-WRN conditioned media (CM). Media was changed
every two days, and cells were passaged every three days (1:3 split).
Formation of Transwell monolayers. To form monolayers of intestinal epithelial cells,
spheroids were taken from three-day-old 3D cultures for plating in Transwells (Corning Costar
3413; Tewksbury, MA). The Transwells were coated in 0.1% gelatin for >1 hour at 37°C.
Spheroids were recovered from Matrigel by first washing in a solution of 0.5 mM
ethylenediaminetetraacetic acid (EDTA), and then dissociated for 4 minutes at 37°C using a
solution of 0.05% Trypsin/0.5 mM EDTA. The trypsin was then inactivated using
DMEM/F12media containing 10% FBS. The spheroids were then dissociated by vigorous
pipetting (using a 1000 μl pipet). The cells were then passed through a 40 μm cell strainer (BD
Biosciences) and re-suspended in 50% L-WRN CM containing 10 μM Y-27632 (ROCK
inhibitor; Tocris Bioscience and R&D Systems; Minneapolis, MN). On average, spheroids from
three wells of a 24-well plate were plated into the upper compartment of a single Transwell in

21
100μl of media. An additional 600 μl of media was added to the lower compartment of the
Transwells.
Cell treatments. On day one (24 hours after seeding the Transwells) the 50% L-WRN CM
supplemented with Y-27632 was removed and replaced with 0% CM (Advanced DMEM/F12
containing 20% FBS, 100 units of Penicillin, 0.1 mg/ml Streptomycin and 2mM L-glutamine).
At this time, any additional treatments were also administered to the cells: LPS (Sigma L4391;
Saint Louis, MO), DAPT -secretase inhibitor (Millipore 565784; Billerica, MA), recombinant
mouse IL-1β (R&D Systems 401-ML), recombinant mouse IFN (R&D Systems 485-ML),
recombinant mouse TNFα (R&D Systems 410-MT), recombinant mouse IL-17 (R&D Systems
421-ML), and heat-killed E. coli (lab stocks, mouse adapted strain)100
. Cells were given fresh
media with the respective treatments on day two, and were treated for a total of 48 hours before
being used for IgA transcytosis, histology, or RNA extraction on day three.
Transepithelial electrical resistance (TER) measurements. TER was measured for cells in
Transwells using an epithelial volt-ohm meter (World Precision Instruments, Inc.; Sarasota, FL).
Resistance of the intestinal epithelial cell monolayer was calculated by subtracting the resistance
of the (membrane + media) from the resistance of the (membrane + media + cells). Each
Transwell was measured in triplicate and the average value was taken. This value was then
multiplied by the area of the Transwell membrane (0.33 cm2) to obtain a final value in Ωcm
2.
IgA transcytosis assay. On day three, the Transwells were removed from the various treatment
conditions and washed with 0% CM. 600 μl of 0% CM containing mouse IgA (for early studies:

22
Santa Cruz Biotechnology sc-3900; Dallas, TX; later studies: BD Pharmingen 553476) was
added to the lower compartment. Both sources of IgA contained a mixture of monomeric and
polymeric IgA, according to each company. For the lot of BD Pharmingen IgA used in these
studies, the amount of dimeric IgA was ~85% according to the manufacturer. 100 μl of 0% CM
alone was added to the upper compartment and collected at different time points to evaluate the
amount of IgA transcytosed by ELISA (Immunology Consultants Labs E-90A; Portland, OR).
Immunostaining and histologic analysis. Cells in the Transwells were washed with PBS and
fixed in either 10% formalin or Bouins fixative for 10 minutes. The cells were then washed three
times in 70% ethanol and the Transwell membranes were cut out from the Transwell inserts
using a surgical blade. The membranes were processed for paraffin embedding. 5 μm thick
transverse sections were cut for hematoxylin and eosin staining and immunostaining. For this
procedure, the sections were de-paraffinized, hydrated, boiled in Trilogy solution (Cell Marque;
Rocklin, CA) for 20 minutes, rinsed in PBS, blocked with 1% bovine serum albumin/0.1%
Tritin-X100 for 30 minutes, and incubated with primary antibody at 4°C overnight. Primary
antibodies include: rabbit anti-ZO-1 (1:100, Invitrogen/Life Technologies; Grand Island, NY),
mouse anti-chicken Villin1 (1:100, AbDSerotec; Raleigh, NC), and goat anti-pIgR (1:500, R&D
Systems). The slides were rinsed three times in PBS and then incubated with AlexaFluor594- or
AlexaFluor488-conjugaed species-specific secondary antibodies for one hour at room
temperature (1:500, Invitrogen/Life Technologies). Slides were washed three times in PBS and
stained with bis-benzimide (Hoescht 33258, Invitrogen/Life Technologies) to visualize nuclei
and mounted with a 1:1 PBS:glycerol solution. Staining was visualized with a Zeiss
(Oberkochen, Germany) Axiovert 200 microscope with an Axiocam MRM digital camera.

23
For whole mount immunostaining, cells were fixed and washed in the Transwells as
described above, then washed three times with PBS before they were cut out from the Transwell
inserts and placed in the wells of a 24-well plate. The membranes were then blocked and stained
as described above. Nuclei counts were made using ImageJ101
. For whole tissue immunostaining,
mouse colons were harvested and prepared as previously described102
.
Gene expression analysis. RNA was isolated from cells in the Transwells on day three after
seeding using the NucleoSpin RNA II isolation kit (Macherey-Nagel; Bethlehem, PA).
Complementary DNA (cDNA) synthesis was performed using 0.2 μg of RNA and the
SuperScript III reverse transcriptase (Life Technologies). Quantitative PCR reactions (qPCR)
were performed with SYBR Advantage qPCR Premix (Clontech; Mountain View, CA).
Expression levels were determined in triplicate per sample and normalized to the expression of
glyceraldehyde 3-phosphate dehydrogenase (Gapdh). Primers used include: Gapdh for 5’-AGG
TCG GTG TGA ACG GAT TTG-3’, Gapdh rev 5’- TGT AGA CCA TGT AGT TGA GGT CA-
3’, pIgR for 5’-ATG AGG CTC TAC TTG TTC ACG C-3’, pIgR rev 5’-CGC CTT CTA TAC
TAC TCA CCT CC-3’, Villin1 for 5’-ATG ACT CCA GCT GCC TTC TCT-3’, Villin1 rev 5’-
GCT CTG GGT TAG AGC TGT AAG-3’, Reg3g for 5’-CATCAACTGGGAGACGAATCC-3’,
Reg3g rev 5’-CAGAAATCCTGAGGCTCTTGACA-3’, Muc2 for 5’-ATG CCC ACC TCC
TCA AAG AC-3’, Muc2 rev 5’-GTA GTT TCC GTT GGA ACA GTG AA-3’, Atoh1 for 5’-
GAG TGG GCT GAG GTA AAA GAG T-3’, and Atoh1 rev 5’-GGT CGG TGC TAT CCA
GGA G-3’.

24
RESULTS
Developing a Transwell system for mouse primary intestinal epithelial cells
A critical roadblock to understanding intestinal physiology has been the lack of an
experimental system to model primary intestinal epithelial cells as a polarized, confluent
monolayer. The use of primary cells is of interest due to the differentiation potential of these
cells in vitro82
as well as the need to evaluate cells from genetically modified mice. It has been
challenging to adapt primary intestinal epithelial cells to Transwell culture as monolayers
because this technique requires substantial numbers of viable cells.
We have solved this problem using an in vitro experimental system that allowed for
significant expansion of intestinal epithelial stem/progenitor cells83,84
. To obtain cells for a single
Transwell, we harvested colonic spheroids from three wells (400-500 spheroids/well) of a 24-
well plate that were cultured as spheroids for three days in Matrigel using 50% L-WRN (L-cells
expressing Wnt3a, R-spondin3, and Noggin) conditioned media (CM). This produced ~5x10⁵
cells that were seeded onto a single 0.33 cm2 Transwell insert of a 24-well plate. Typically this
cell input created a monolayer of ~2.5x10⁵ cells. At the time of seeding cells in Transwells, we
used 50% L-WRN CM that also contained 10 μM of the ROCK inhibitor Y-27632 (Figure 2.1).
The media was maintained for one day post-seeding.
On day one after seeding, the 50% CM was replaced with 0% CM supplemented with or
without specific treatments that were designed to facilitate the study of IgA transcytosis. The
treatment included a combination of the -secretase inhibitor DAPT to differentiate the
cells103,104
, and LPS to induce the expression of pIgR (which is known to be regulated by
microbial and/or cytokine signaling)31
. The cells were treated for two days in this media prior to

25
evaluation for differentiation by histology and gene expression analysis, as well as functional
assays such as IgA transcytosis.
We next evaluated the effects of DAPT+LPS on differentiation and lineage allocation of
primary epithelial monolayers. Cells were fixed on the Transwell membrane, which was then cut
out of the insert and processed for paraffin embedding. Histologic sections were cut and stained
with hematoxylin and eosin. We observed that both untreated and DAPT+LPS-treated cells
showed a single layer of cells overlying the Transwell membrane (Figure 2.2a). To confirm that
differentiation of enterocytes occurred both with and without DAPT+LPS treatments, we
performed immunostaining using antisera against ZO-1 and Villin (Figure 2.2b,c). ZO-1 is a
tight junction marker105
and Villin1 marks microvilli106
. In addition, both of these proteins
showed appropriate apical localization throughout the monolayer and this pattern was present
regardless of treatment. We also found that a basolateral marker, CD138, showed appropriate
localization in Transwell cultures (Figure 2.2d). Taken together, the localization of these
markers is consistent with polarized epithelial cells. We stained for markers of additional colonic
epithelial lineages including enteroendocrine cells (chromogranin A107
) and goblet cells (lectin
UEA-1108
). Whole mount images of immunostained Transwells showed that both of these cell
types were present in DAPT+LPS-treated monolayers with lower fractional representation than
absorptive enterocytes (Figure 2.3). This lineage allocation is similar to what is observed in vivo
for the surface epithelium of the mouse colon (Figure 2.4).
To adapt this experimental system for the study of IgA transcytosis, we evaluated the
expression of pIgR both in vivo and in vitro. The colonic epithelium, including surface epithelial
cells, expressed pIgR in vivo (Figure 2.5). In vitro, pIgR could be induced in epithelial
monolayers that were treated with DAPT+LPS, as shown by immunostaining (Figure 2.2e). To

26
quantify the relative effects of DAPT and LPS on pIgR expression, we performed qRT-PCR of
mRNAs isolated from epithelial cells grown on Transwells for three days. The addition of
DAPT+LPS stimulated a robust increase in pIgR mRNA expression compared to untreated cells
(~100-fold increase) (Figure 2.6). This finding corroborated the effects of DAPT+LPS on
protein expression as determined by immunostaining (Figure 2.2e). Single treatment with either
LPS or DAPT did not stimulate pIgR mRNA expression to the extent that was achieved by the
combination of these factors. As a positive control for LPS treatment, expression of RegIII109
was increased after DAPT+LPS treatment (Figure 2.7a). As a negative control, Villin1
expression (which is not microbially regulated in vivo110
) was similar in all groups of treated and
untreated cells (Figure 2.7b). Thus, we were able to show that wild-type primary colonic
epithelial cells on Transwells were responsive to DAPT+LPS.
To perform IgA transcytosis experiments, a complete monolayer of cells is required. To
demonstrate that the seeded cells formed a functional monolayer, we measured transepithelial
electrical resistance (TER) in the Transwells on day three (Figure 2.8). For this experiment, we
used cells at a density of ~2.5x10⁵
cells/0.33 cm2. The average TER of untreated cells was
3333 Ωcm2. The TER of DAPT+LPS-treated cells was similar to the TER of untreated cells
(2877 Ωcm2).
Developing an IgA transcytosis assay using primary mouse Transwell cultures
One of the critical functions of the intestinal epithelium is the transcytosis of IgA from
the lamina propria to the lumen of the intestine. This process involves pIgR trafficking across the
intestinal epithelium which can occur at a slower rate in the absence of IgA25
. To determine if the
primary intestinal epithelial monolayers were capable of IgA transcytosis, we developed an assay

27
utilizing these cells. At day three post-plating on Transwell inserts, the cells were washed and
placed in wells containing normal mouse IgA in the lower compartment (Figure 2.9a). This
media is in contact with the basolateral surface of the epithelial monolayer. Media alone was
added to the upper compartment (apical surface). The cells were incubated at 37°C for different
periods of time to allow for receptor binding and transcytosis to occur before the media in the
upper compartment was sampled for analysis by enzyme-linked immunosorbent assay (ELISA)
(Figure 2.9b). Colonic cells isolated from pIgR-/-
mice were used as a negative control for all
transcytosis experiments.
Consistent with the pIgR mRNA expression data, cells treated with DAPT+LPS showed
measurable IgA in the apical media whereas the other three groups (untreated, DAPT alone, and
LPS alone) had levels at or below the limit of detection (Figure 2.10). Apical media from pIgR-/-
cells did not contain IgA regardless of treatment. This genetic control indicated that IgA is
actively transported through epithelial cells and does not use paracellular transport.
To determine the optimal conditions for transcytosis experiments, we performed IgA
dose curve and time course experiments using DAPT+LPS-treated cells. One hour after the
addition of IgA to the basal compartment, no IgA was detected in the apical media (Figure
2.11). Therefore, one hour was not sufficient for IgA in the basal compartment to bind pIgR and
transcytose across cells to the apical compartment. This result also showed that the monolayer
was intact and thus did not allow the IgA to freely diffuse into the apical media. Because of this
result, we utilized the one hour time point as an additional internal control in all subsequent
experiments. Additional time points were taken three hours (four hours after the addition of IgA)
and six hours later (ten hours after the addition of IgA). Both of these time points showed

28
progressively higher levels of IgA in the apical media (Figure 2.11). In subsequent experiments,
all three of these time points were evaluated.
In choosing the optimal dose of IgA, the amount of IgA in the apical compartment at
three and six hour time points needed to be in linear range of the ELISA. We initially used
normal mouse IgA from Santa Cruz Biotechnology at a dose of 40 µl/well (Figure 2.12a). In
later experiments, we used normal mouse IgA from BD Pharmingen at a comparable dose, which
allowed for a more precise measurement of IgA concentration and decreased variability between
experiments (Figure 2.12b). For this source of IgA, we were able to calculate the IgA
concentration used to 5 µg/ml, or a total of 3 µg/well.
As it was unclear how sensitive primary wild-type colonic epithelial cells were to LPS,
we performed a dose-response curve for LPS using both IgA transcytosis and pIgR expression as
readouts (Figure 2.13). Both transcytosis and pIgR mRNA expression responded in a dose-
dependent manner. In all subsequent experiments, we used 1 μg/ml LPS as this was in linear
range of the response of wild-type cells.
Although LPS has been used as a standard in the field to efficiently induce pIgR
expression in different cell types, there is growing interest in the study of the effects of specific
microbes in the intestine and how they stimulate IgA32-34,39,111
. To model an example of such
host-microbial interactions in vitro, cells were treated with heat-killed E. coli to analyze its
ability to induce IgA transcytosis and pIgR expression (Figure 2.14). A dose equivalent to 107
CFU/ml E. coli was found to induce similar levels of IgA transcytosis and pIgR expression as
that demonstrated for to 1 µg/ml LPS.

29
Cell density affects IgA transcytosis and pIgR expression in Transwell cultures
We noticed that there was occasional experiment-to-experiment variability of the amount
of IgA transcytosed. Further scrutiny of the Transwells utilized in these experiments led us to
hypothesize that the cellular density plays a role in the level of IgA transcytosis in vitro. To test
this idea, we performed two-fold serial dilutions of the cells seeded in the Transwells (Figure
2.15a). Both the undiluted (using ~5x10⁵ cells as above) and a 1:2 dilution showed similar
amounts of transcytosed IgA. However, a 1:4 dilution reproducibly showed significantly less
transcytosed IgA. Furthermore, apical media collected from a 1:8 dilution showed IgA at levels
below the limit of detection. This result suggested that there was an intact monolayer at this cell
density but no detectable IgA was transcytosed. At a 1:16 dilution, we could not reproducibly
achieve a monolayer, as in some experiments, IgA was readily detected in the apical
compartment at levels similar to the basolateral chamber. TER measurements corroborated these
findings. Higher cell densities all showed resistance values of >2500 Ωcm2 (Figure 2.15b). The
TER for the 1:8 cell dilution was more variable, with average values of ~1240 Ωcm2. The TER
for the 1:16 dilution was near baseline values.
The cell density was quantified for each dilution by nuclei counts of whole mount images
of bis-benzimide-stained Transwell membranes (Figure 2.16). A 1:2 dilution of input cells
resulted in only a small change in the number of seeded cells on the Transwell, indicating that
maximum cell numbers were seeded at these two input densities. Each successive two-fold
dilution showed a ~two-fold decrease in cell density. We next tested whether the correlation of
cell density to IgA transcytosis was due to cell number and/or pIgR expression. Co-staining of
cells with anti-pIgR antisera showed detectable staining in the majority of cells in Transwells
with higher cell densities (no dilution, 1:2 and 1:4). We observed a substantial decrease in the

30
number of cells that were positive for pIgR in 1:8 dilution samples. There was no detectable
staining for pIgR in the 1:16 dilution samples. To confirm this observation, we performed gene
expression analysis for pIgR at each dilution (Figure 2.17). The highest relative expression of
pIgR was observed at the 1:2 and 1:4 dilution samples. We observed a threshold effect whereby
pIgR expression was substantially lower in the 1:8 and 1:16 dilution samples. Our interpretation
is that the decrease in IgA transcytosis that occurred between the 1:2 and the 1:4 dilutions is
likely due to changes in cell density while the decrease in IgA trancytosis in the 1:8 dilution is
likely further driven by diminished pIgR expression. One other possibility is that global
differentiation is altered by decreased density. We found that markers of secretory lineages
(Muc2 and Atoh1) were diminished in a density-dependent manner while a general marker of
epithelial cells (Vil1) was not altered (Figure 2.18).
Cytokines induce pIgR expression and IgA transcytosis in the primary Transwell cultures
Several different cytokines were previously shown to induce pIgR expression in tumor
cell lines including IL-1β, TNFα, IFN, and most recently, IL-1719,36,38,95-98
. We wanted to test if
primary intestinal epithelial cells responded similarly to these cytokines, and if so, what was the
relative potency. To do this, we performed a dose titration using these four cytokines with IgA
transcytosis and pIgR expression as readouts (Figure 2.19-2.21). IL-17 was the most potent
cytokine tested. A dose of 0.5 ng/ml resulted in higher levels of IgA transcytosis than LPS
treatment (Figure 2.19a). IL-1β and TNFα were both significantly less potent than IL-17, as a
100 ng/ml dose of these cytokines only induced half the levels of IgA transcytosis as LPS
(Figure 2.20a, 2.21a). Apical media from pIgR-/-
cells at all doses of IL-1β, TNFα, and IL-17

31
contained no IgA (Figure 2.19-2.21). For all three of these cytokines the dose response curves
for pIgR expression mirrored the IgA transcytosis (Figure 2.19-2.21).
Of note, the results for IFN treatment were distinct from that of the other cytokines as
well as previously published literature using immortalized cell lines (Figure 2.22). At 0.1-1
ng/ml, the epithelial monolayer did not remain intact, as apical media from wild-type and pIgR-/-
cells both contained IgA levels similar to the media in the lower compartment (Figure 2.22a).
Furthermore, TER measurements of cytokine-treated cells showed no measureable resistance
after IFN treatment while treatment with IL-1β, TNFα, and IL-17 showed comparable TER
values with LPS-treated cells (Figure 2.23). At lower doses (0.001-0.01 ng/ml), less IgA was
present in the apical media, however none of these conditions led to an increase of pIgR mRNA
expression (Figure 2.22b). Our conclusion is that IgA uses a paracellular route in IFN-treated
cells that could either be due to cell death or leaky junctions.
Colonic epithelial cells generated from Tlr4-/-
mice show reduced IgA transcytosis and pIgR
expression after LPS but not IL-17 treatment
One advantage of this system is the ability to isolate cells directly from different
genetically modified mice for experiments. As a proof of principle, cells were harvested from
Tlr4-/-
mice to generate colonic spheroids. These cells lack the LPS receptor, Tlr4, and therefore
should have a reduced response to LPS stimulation. As expected, IgA transcytosis and pIgR
expression was reduced to ~50% of that of wild-type cells (Figure 2.24). The ability of these
cells to respond to other stimuli for IgA transcytosis was not affected, as IL-17 treatment of the
Tlr4-/-
cells showed no difference from wild-type cells (Figure 2.25).

32
DISCUSSION
We have established a new method to grow primary intestinal epithelial cells in a
functional monolayer. To do this, we adapted the previously established 3D primary intestinal
epithelial stem cell culture system83,84
to a 2D monolayer in a Transwell. The system we have
developed has three important components. Firstly, the use of the L-WRN CM system allowed
us to attain large cell numbers that are required to form monolayers in Transwells. Secondly,
cells only needed to be grown in Matrigel culture for three days prior to recovery and seeding
into Transwells. Lastly, seeded cells quickly formed polarized monolayers and demonstrated
high TER values within three days. In contrast, previously established intestinal epithelial
monolayer systems that utilize immortalized cell lines require as many as twenty days in culture
to form differentiated, polarized monolayers89-91
.
This system will be useful for the study of many different physiologic processes. Here,
we chose to focus on IgA transcytosis. For this process to occur, epithelial cells must express the
IgA receptor pIgR, which has been shown to be regulated by microbial products31
. LPS has been
used as a standard in the field to induce pIgR expression in vitro. Typically immortalized cell
lines have been used. Here we showed that LPS-treated primary intestinal epithelial cells were
also able to induce pIgR expression. In addition, we found that maximal pIgR expression
required DAPT treatment in addition to LPS, suggesting that the intestinal epithelial cells require
differentiation for efficient pIgR expression. To demonstrate the robustness of primary intestinal
epithelial cells for IgA transcytosis, we carefully analyzed several key factors including time,
IgA dose, and LPS dose. We titrated the assay and chose to use 10 μM DAPT, 1 μg/ml LPS, and
5 µg/ml IgA as our optimal conditions. The time course of a typical experiment is 10 hours with
multiple samples taken from each Transwell.

33
Interestingly, we found that cell density also affected IgA transcytosis. After recovery
from the Matrigel, two-fold serial dilutions were made before seeding the cells in the Transwells.
As it might be expected, we observed a cell density-dependent decrease in the amount of IgA
transcytosed. However, this decrease in IgA was not just due to the decrease in cell number.
Gene expression analysis of pIgR showed a substantial decrease at the lowest cell densities.
Immunofluorescence staining for pIgR correlated with the mRNA expression data, showing
fewer pIgR-positive cells at the lowest cell densities. We hypothesized the lower density cells
may be in a less differentiated state, which has been shown in other in vitro cell systems112-114
.
We therefore tested the expression of other cell differentiation markers, including goblet cell
marker Muc2 and a secretory cell lineage marker Atoh1, and found both to show a correlation of
expression with cell density. This suggests that cell-to-cell endogenous signaling, and not solely
exogenous chemical stimuli, regulate colonic cell differentiation in this culture system.
While LPS robustly induces pIgR expression, it is difficult to translate in vitro quantities
to the biomass of intestinal microbes that generate this molecule. To make this system more
applicable to specific bacteria, we utilized heat-killed bacteria. We therefore treated the cells
with heat-killed E. coli and found that a dose of 107 CFU/ml stimulated IgA transcytosis and
pIgR expression to a similar extent as 1μg/ml LPS. We feel that this system will be useful for
future studies looking at host-microbial interactions in vitro.
Previous studies found that several host cytokines including IL-1β, TNFα, IFN, and IL-
17 play a role in pIgR expression36,38,95-98
. Similar to what has been shown in immortalized cell
lines, IL-1β, TNFα, and IL-17 showed a dose-dependent induction of pIgR expression, with IL-
17 being the most potent inducer of IgA transcytosis and pIgR expression of these cytokines.
However, an important difference we found between our primary mouse intestinal epithelial cells

34
and human cancer cell lines is the ability of IFN to induce pIgR expression. IFN treatment did
not lead to pIgR expression or IgA transcytosis at any dose tested, and actually resulted in cell
death at higher doses. This may be a result that would otherwise be obscured by using
immortalized cell lines, which can be resistant to cytokine-induced cell death. Furthermore, this
does not appear to be species-specific phenomenon, as the mouse promoter for pIgR is highly
conserved to the human promoter and also contains the IRF1 binding site115
.
One final important advantage of this system is the ability to readily use primary
intestinal epithelial cells taken from different genetically modified mice. In this study, we
utilized cells obtained from available lines of knockout mice for the pIgR and Tlr4 genes.
Monolayers of epithelial cells derived from these mice allowed us to directly address questions
using cells with complete loss-of-function, as compared to the usual incomplete loss of function
with shRNA knockdowns.
Prospectus- In summary, we developed a new system to culture primary intestinal epithelial cells
in monolayer culture. While we have highlighted the capability of this system to be utilized for
studies of IgA transcytosis, there are many other experimental avenues where this system should
prove to be useful. These areas include barrier function, host-microbial interactions and
epithelial-immune/stromal cell interactions. We propose that not only will this system be useful
for mechanistic studies, but also for large-scale chemical biology screens in these arenas.

35
Figure 2.1. Timeline for primary intestinal epithelial monolayer formation.
Schematic of timeline for Transwell experiments. Primary intestinal epithelial stem cells
originally isolated from the colons of wild type mice were passaged and maintained in 3D
spheroid cultures in Matrigel. To seed into Transwells (day zero), three-day old spheroids were
recovered from Matrigel, trypsinized, and dissociated by vigorous pipetting. Cells were passed
through a 40 μm cell strainer and re-suspended in 50% L-WRN CM containing 10 μM Y-27632.
On day one post-seeding, cells were treated with +/- 10 μM DAPT +/- 1 μg/ml LPS and utilized
on day three post-seeding for various assays.

36
Figure 2.1. Timeline for primary intestinal epithelial monolayer formation.
37
Figure 2.2. Primary IECs form a polarized monolayer that can be induced to express pIgR.
Wild type cells were treated with +/- 10 μM DAPT +/- 1 μg/ml LPS and analyzed on day three
post-seeding. Cells were fixed and paraffin-embedded on the transwell membranes. Sections
were cut and stained with the following: (a) hematoxylin and eosin, (b) anti-ZO-1, (c) anti-villin,
(d) anti-CD138, and (e) anti-pIgR. Bars = 50 μm. Representative images are shown.

38
Figure 2.2. Primary IECs form a polarized monolayer that can be induced to express pIgR.

39
Figure 2.3. Primary IEC monolayers can differentiate into various cell types.
Wild type cells were treated with 10 μM DAPT and 1 μg/ml LPS and analyzed on day three
post-seeding. Cells were fixed on the transwell membranes and stained for (a) Chromogranin A
and (b) UEA-1 lectin (arrowheads). Representative whole mount images are shown.

40
Figure 2.3. Primary IEC monolayers can differentiate into various cell types.

41
Figure 2.4. Primary IEC monolayers mirror in vivo staining patterns of the colonic surface
epithelium.
Colons from wild type mice were harvested, bouins-fixed, and paraffin embedded. 5 μm
histologic sections were cut and stained for (a) CD138, (b) chromogranin A, (c) UEA-1, (d)
villin1, and (e) ZO-1. Bars = 200 μm. Yellow boxes denote area depicted in insets.
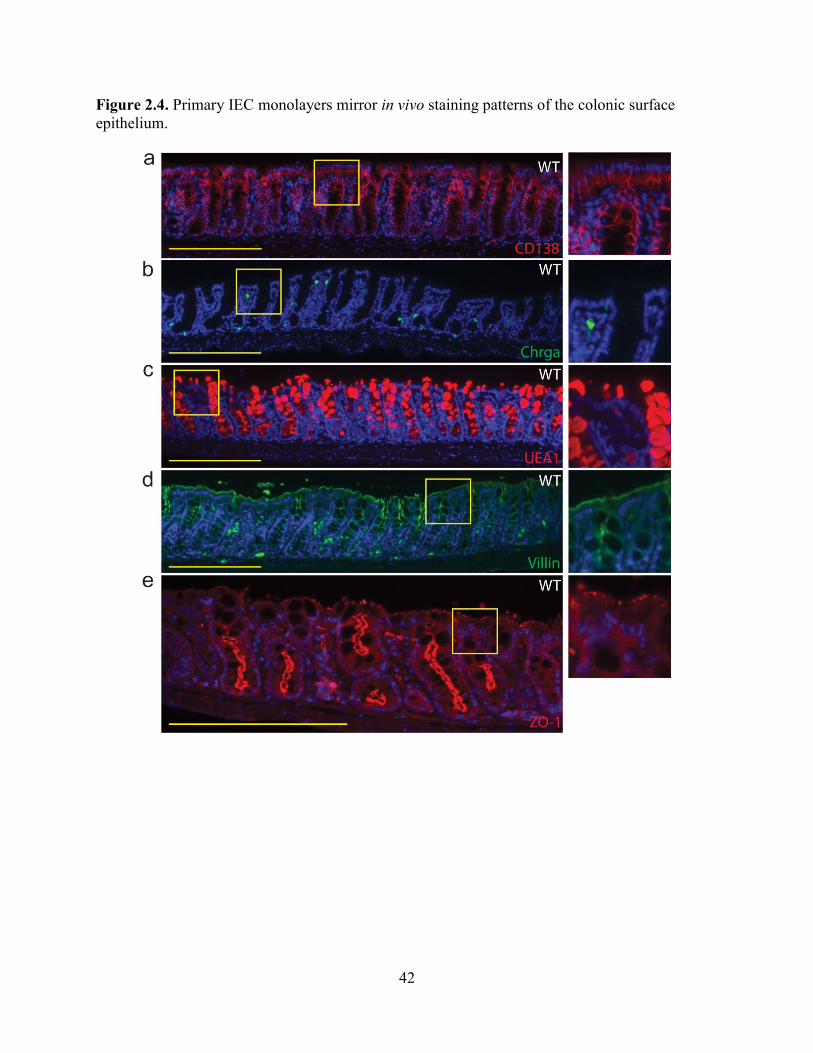
42
Figure 2.4. Primary IEC monolayers mirror in vivo staining patterns of the colonic surface
epithelium.

43
Figure 2.5. Colonic epithelial cells express pIgR in vivo.
Colons from (a) wild type mice or (b) pIgR-/-
mice were harvested, bouins-fixed, and paraffin
embedded. 5 μm histologic sections were cut and stained for pIgR. Bars = 200 μm. Yellow boxes
denote area depicted in insets.

44
Figure 2.5. Colonic epithelial cells express pIgR in vivo.

45
Figure 2.6. Primary IEC monolayers express pIgR mRNA in vitro.
Wild type cells were treated with +/- 10 μM DAPT +/- 1 μg/ml LPS and analyzed on day three
post-seeding. Gene expression analysis was performed by qRT-PCR for pIgR. All samples were
normalized to Gapdh mRNA, and data were presented as fold change relative to untreated (0%
CM) cells (mean ± s.e.m.; n ≥ 3 per condition). One-way ANOVA: F = 96.02, P < 0.0001.
Means with different letters are significantly different by Bonferroni’s multiple comparison test

46
Figure 2.6. Primary IEC monolayers express pIgR mRNA in vitro.

47
Figure 2.7. Primary IEC monolayers express Reg3g and Vil1 mRNA in vitro.
Wild type cells were treated with +/- 10 μM DAPT +/- 1 μg/ml LPS and analyzed on day three
post-seeding. Gene expression analysis was performed by qRT-PCR for (a) Reg3g, and (b) Vil1.
All samples were normalized to Gapdh mRNA, and data were presented as fold change relative
to untreated (0% CM) cells (mean ± s.e.m.; n ≥ 3 per condition). One-way ANOVA: (a) F =
3.441, P < 0.0376; (b) F = 1.085, P < 0.3762.

48
Figure 2.7. Primary IEC monolayers express Reg3g and Vil1 mRNA in vitro.

49
Figure 2.8. Primary IEC monolayers show robust transepithelial electrical resistance.
Wild type cells were treated with +/- 10 μM DAPT +/- 1 μg/ml LPS. Transepithelial electrical
resistance was measured on day three post seeding. The (resistance x area) is shown for each
condition (mean ± s.e.m., n = 6 per group). Statistical analysis by Student’s t-test showed no
significant difference between the two groups (P < 0.4362).

50
Figure 2.8. Primary IEC monolayers show robust transepithelial electrical resistance.

51
Figure 2.9. Schematic for IgA transcytosis assay.
Wild type and pIgR-/-
cells were seeded in Transwells and treated with +/- 10 μM DAPT +/-1
μg/ml LPS as indicated. On day three post-seeding, 40 μl of normal mouse IgA (Santa Cruz) was
added to the lower compartment of the Transwells (a), and supernatants from the upper
compartment were taken at six hours for the detection of IgA by ELISA (b).

52
Figure 2.9. Schematic for IgA transcytosis assay.
53
Figure 2.10. IgA transcytosis by primary IEC monolayers mirrors pIgR expression.
Wild type and pIgR-/-
cells were seeded in Transwells and treated with +/- 10 μM DAPT +/-1
μg/ml LPS as indicated. On day three post-seeding, 40 μl of normal mouse IgA (Santa Cruz) was
added to the lower compartment of the Transwells, and supernatants from the upper
compartment were taken at six hours for the detection of IgA by ELISA. The dotted lines
represent the limit of detection by the ELISA. All values are indicated as mean ± s.e.m. One-way
ANOVA: F = 573.3, P < 0.0001, n ≥ 3 per group. Means with different letters are significantly
different by Bonferroni’s multiple comparison test. N.D. = not detected.

54
Figure 2.10. IgA transcytosis by primary IEC monolayers mirrors pIgR expression.

55
Figure 2.11. IgA transcytosis time course by primary IEC monolayers.
Wild type and pIgR-/-
cells were seeded in Transwells and treated with +/- 10 μM DAPT +/-1
μg/ml LPS as indicated. On day three post-seeding, 40 μl of normal mouse IgA (Santa Cruz) was
added to the lower compartment of the Transwells, and supernatants from the upper
compartment were taken at various time points for the detection of IgA by ELISA. The dotted
lines represent the limit of detection by the ELISA. All values are indicated as mean ± s.e.m.
One-way ANOVA: F = 539.2, P < 0.0001, n ≥ 12 per group. Means with different letters are
significantly different by Bonferroni’s multiple comparison test. N.D. = not detected.

56
Figure 2.11. IgA transcytosis time course by primary IEC monolayers.

57
Figure 2.12. Determining the optimal IgA concentration for IgA transcytosis.
Wild type and pIgR-/-
cells were seeded in Transwells and treated with +/- 10 μM DAPT +/-1
μg/ml LPS as indicated. On day three post-seeding, various concentrations of normal mouse IgA
was added to the lower compartment of the Transwells, and supernatants from the upper
compartment were taken at three and/or six hours for the detection of IgA by ELISA. The dotted
lines represent the limit of detection by the ELISA. (a) Normal mouse IgA from Santa Cruz
Biotechnology was evaluated, and 40 µl/well was chosen for experiments. (b) Determining a
comparable IgA dose from BD Pharmingen.
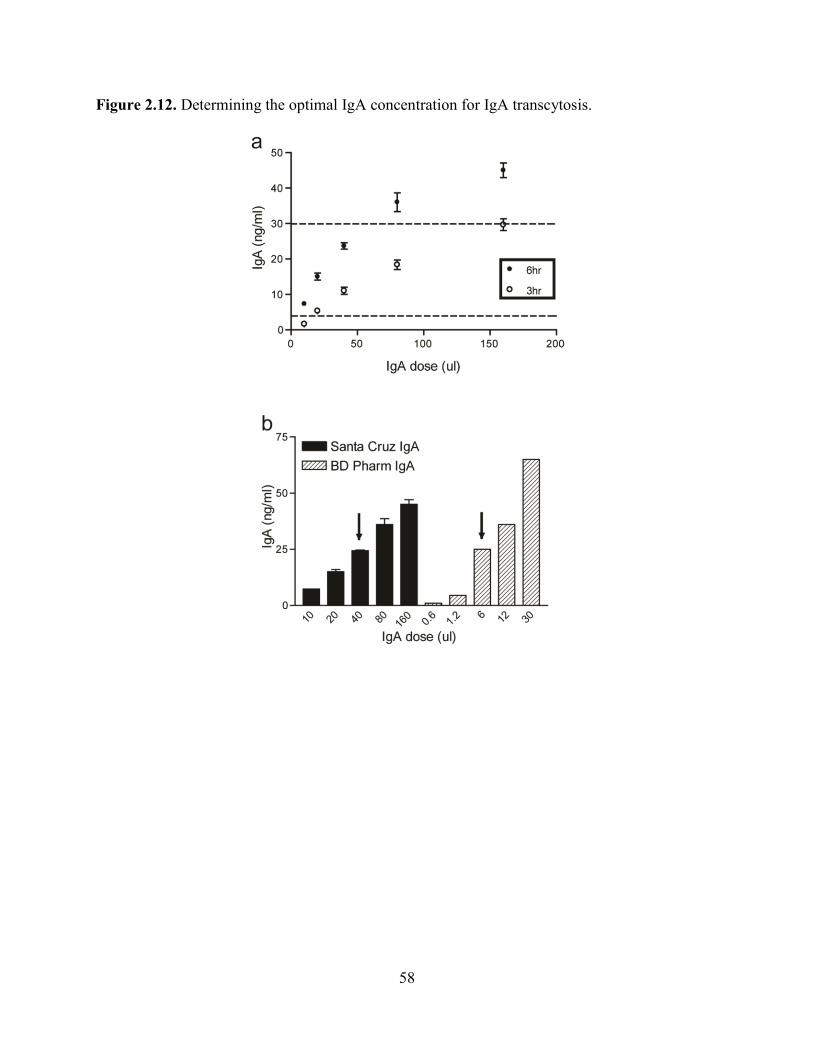
58
Figure 2.12. Determining the optimal IgA concentration for IgA transcytosis.

59
Figure 2.13. Determining the optimal LPS concentration for IgA transcytosis.
An LPS dose curve was performed on WT and pIgR-/-
cells to determine whether IgA
transcytosis (a) and pIgR expression (b) were dose dependent. All LPS-treated cells were also
treated with 10 μM DAPT. For IgA transcytosis, results from the ELISA were normalized to the
1 μg/ml LPS treatment group (= 100%). Gene expression analysis by qRT-PCR for pIgR was
performed by normalizing to Gapdh, and data are presented as fold change relative to untreated
cells. The dotted lines represent the limit of detection by the ELISA. All values are indicated as
mean ± s.e.m. One-way ANOVA: (a) F = 675.7, P < 0.0001, n ≥ 3 per group; (b) F = 46.22, P <
0.0001, n ≥ 6 per group. Means with different letters are significantly different by Bonferroni’s
multiple comparison test. N.D. = not detected.

60
Figure 2.13. Determining the optimal LPS concentration for IgA transcytosis.

61
Figure 2.14. Heat-Killed E.coli can induce IgA transcytosis and pIgR expression.
Wild type and pIgR-/-
cells were seeded in Transwells and treated with 10 μM DAPT and 1 μg/ml
LPS or 107 CFU/ml heat-killed E.coli as indicated. (a) IgA transcytosis was analyzed by ELISA,
and results were normalized to the WT+DAPT+LPS group (= 100%). (b) Gene expression
analysis by qRT-PCR of pIgR was performed and all samples were normalized to Gapdh. Data
are presented as fold change relative to untreated (0% CM) cells. All values are indicated as
mean ± s.e.m. One-way ANOVA: (a) F = 426.2, P < 0.0001, n ≥ 6 per group, means with
different letters are significantly different by Bonferroni’s multiple comparison test; (b) F =
11.47, P < 0.0008, n ≥ 5 per group. Means with different letters are significantly different by
Bonferroni’s multiple comparison test. N.D. = not detected.

62
Figure 2.14. Heat-Killed E.coli can induce IgA transcytosis and pIgR expression.

63
Figure 2.15. Cell density affects IgA transcytosis and monolayer formation.
Two-fold serial dilutions of wild type cells were seeded into Transwells and treated with 10 μM
DAPT and 1 μg/ml LPS. (a) IgA transcytosis was performed on day three post-seeding, and
measurement of IgA in the supernatants at the six hour time point is shown. The dotted lines
represent the limit of detection by the ELISA. All values are indicated as mean ± s.e.m. One-way
ANOVA: (a) F = 53.11, P < 0.0001, n ≥ 6 per group. Means with different letters are
significantly different by Bonferroni’s multiple comparison test. (b) Transepithelial electrical
resistance was measured on day three. The (resistance x area) is shown for each condition (mean
± s.e.m., n > 4 per group). N.D. = not detected.

64
Figure 2.15. Cell density affects IgA transcytosis and monolayer formation.

65
Figure 2.16. Cell density affects pIgR protein expression.
Two-fold serial dilutions of wild type cells were seeded into Transwells and treated with 10 μM
DAPT and 1 μg/ml LPS. Cells were fixed and stained on the Transwell membranes (a) with anti-
pIgR (green) and bis-benzamide dye (blue). Bars = 200 μm. (b) Quantification of cell density of
cells on Transwells was performed using ImageJ software. All values are indicated as mean ±
s.e.m. One-way ANOVA: (b) F = 183.2, P < 0.0001, n ≥ 15 per group. Means with different
letters are significantly different by Bonferroni’s multiple comparison test.

66
Figure 2.16. Cell density affects pIgR protein expression.

67
Figure 2.17. Cell density affects pIgR mRNA expression.
Two-fold serial dilutions of wild type cells were seeded into Transwells and treated with 10 μM
DAPT and 1 μg/ml LPS. Gene expression analysis was performed by qRT-PCR for pIgR. All
samples were normalized to Gapdh, and data are presented as fold change relative to untreated
(0% CM) cells. All values are indicated as mean ± s.e.m. One-way ANOVA: F = 39.02, P <
0.0001, n ≥ 3 per group. Means with different letters are significantly different by Bonferroni’s
multiple comparison test.

68
Figure 2.17. Cell density affects pIgR mRNA expression.

69
Figure 2.18. Cell density affects intestinal epithelial monolayer differentiation.
Two-fold serial dilutions of wild type cells were seeded into Transwells and treated with 10 μM
DAPT and 1 μg/ml LPS. Gene expression analysis was performed by qRT-PCR for (a) Muc2,
(b) Atoh1, and (c) Vil1. All samples were normalized to Gapdh, and data are presented as fold
change relative to untreated (0% CM) cells. All values are indicated as mean ± s.e.m. One-way
ANOVA: (a) F = 11.07, P < 0.0001, n ≥ 3 per group; (b) F = 3.436, P < 0.0183, n ≥ 3 per group;
(c) F = 2.186 , P < 0.0894, n ≥ 3 per group. Means with different letters are significantly
different by Bonferroni’s multiple comparison test.
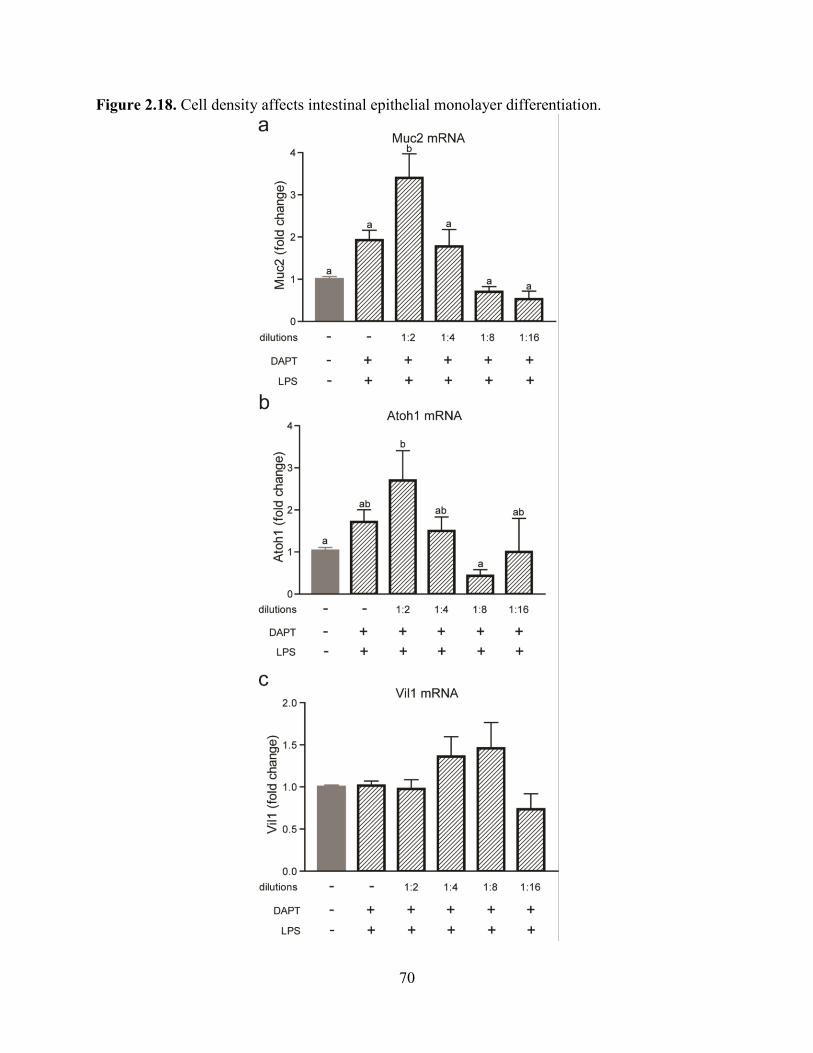
70
Figure 2.18. Cell density affects intestinal epithelial monolayer differentiation.

71
Figure 2.19. IL-17 robustly induces IgA transcytosis and pIgR expression.
Wild type and pIgR-/-
cells were treated with 10 μM DAPT and varying doses of IL-17. (a) IgA
transcytosis was analyzed by ELISA, and results were normalized to the WT+DAPT+LPS group
(= 100%). (b) Gene expression analysis of pIgR was performed and all samples were normalized
to Gapdh. Data are presented as fold change relative to untreated (0% CM) cells. All values are
indicated as mean ± s.e.m. One-way ANOVA: (a) F = 152.3, P < 0.0001, n ≥ 3 per group; (b) F
= 119.5, P < 0.0001, n ≥ 4 per group. Means with different letters are significantly different by
Bonferroni’s multiple comparison test. N.D. = not detected.

72
Figure 2.19. IL-17 robustly induces IgA transcytosis and pIgR expression.

73
Figure 2.20. IL-1β can induce IgA transcytosis and pIgR expression.
Wild type and pIgR-/-
cells were treated with 10 μM DAPT and varying doses of IL-1β. (a) IgA
transcytosis was analyzed by ELISA, and results were normalized to the WT+DAPT+LPS group
(= 100%). (b) Gene expression analysis of pIgR was performed and all samples were normalized
to Gapdh. Data are presented as fold change relative to untreated (0% CM) cells. All values are
indicated as mean ± s.e.m. One-way ANOVA: (a) F = 187.9, P < 0.0001, n ≥ 3 per group; (b) F
= 49.92, P <0.0001, n ≥ 5 per group. Means with different letters are significantly different by
Bonferroni’s multiple comparison test. N.D. = not detected.

74
Figure 2.20. IL-1β can induce IgA transcytosis and pIgR expression.

75
Figure 2.21. TNFα can induce IgA transcytosis and pIgR expression.
Wild type and pIgR-/-
cells were treated with 10 μM DAPT and varying doses of TNFα. (a) IgA
transcytosis was analyzed by ELISA, and results were normalized to the WT+DAPT+LPS group
(= 100%). (b) Gene expression analysis of pIgR was performed and all samples were normalized
to Gapdh. Data are presented as fold change relative to untreated (0% CM) cells. All values are
indicated as mean ± s.e.m. One-way ANOVA: (a) F = 376.7, P < 0.0001, n ≥ 3 per group; (b) F
= 28.29, P < 0.0001, n ≥ 4 per group. Means with different letters are significantly different by
Bonferroni’s multiple comparison test. N.D. = not detected.

76
Figure 2.21. TNFα can induce IgA transcytosis and pIgR expression.

77
Figure 2.22. IFNγ does not induce pIgR expression.
Wild type and pIgR-/-
cells were treated with 10 μM DAPT and varying doses of IFNγ. (a) IgA
transcytosis was analyzed by ELISA, and results were normalized to the WT+DAPT+LPS group
(= 100%). The no cell group indicates the amount of IgA that freely diffuses into the apical
supernatant in the absence of cells in the Transwell. (b) Gene expression analysis of pIgR was
performed and all samples were normalized to Gapdh. Data are presented as fold change relative
to untreated (0% CM) cells. All values are indicated as mean ± s.e.m. One-way ANOVA: (b) F =
35.17, P < 0.0001, n ≥ 5 per group. Means with different letters are significantly different by
Bonferroni’s multiple comparison test. N.D. = not detected.

78
Figure 2.22. IFNγ does not induce pIgR expression.

79
Figure 2.23. IFNγ-treated cells do not maintain an intact monolayer.
Transepithelial electrical resistance measurements were taken on day three after treatment with
10 μM DAPT and the highest previously used dose of various cytokines (100 ng/ml IL-1β, 100
ng/ml TNFα, 20 ng/ml IL-17, 1 ng/ml IFNγ). All values are indicated as mean ± s.e.m. One-way
ANOVA: F = 19.23, P < 0.0001, n ≥ 4 per group. Means with different letters are significantly
different by Bonferroni’s multiple comparison test. N.D. = not detected.
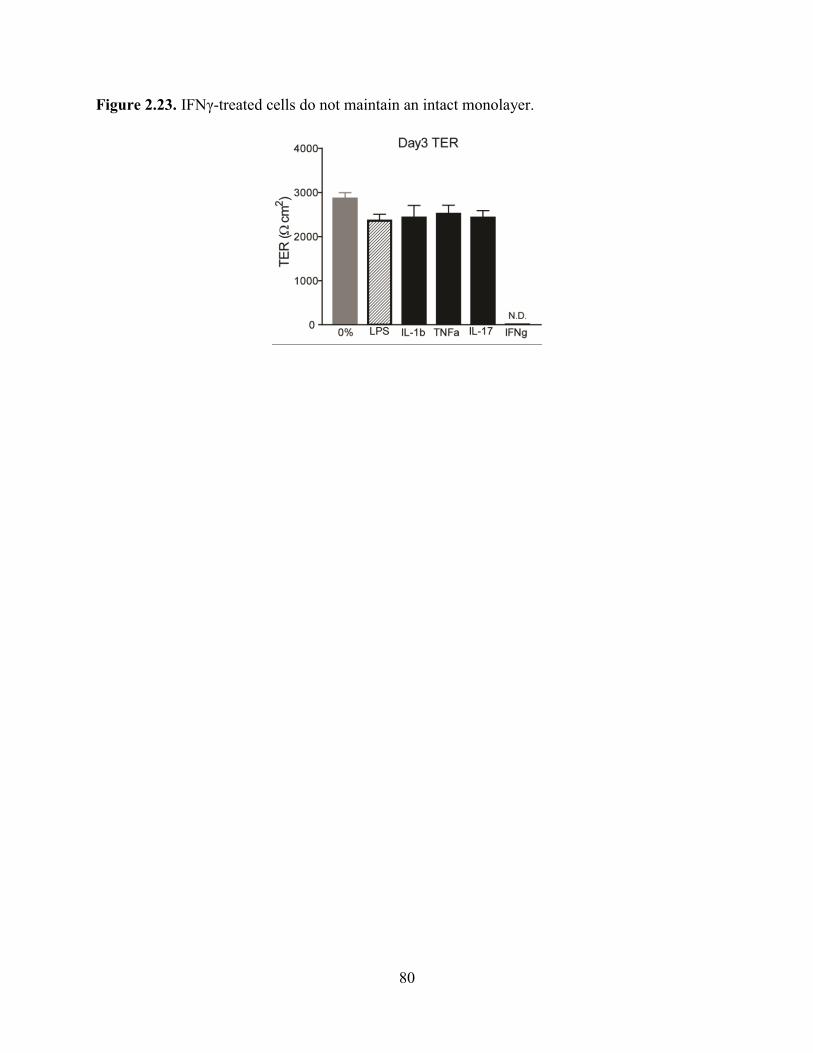
80
Figure 2.23. IFNγ-treated cells do not maintain an intact monolayer.

81
Figure 2.24. Cells from Tlr4-/-
mice have an impaired IgA transcytosis response to LPS.
Wild type Tlr4 and Tlr4-/-
were treated with 10 μM DAPT and 1 μg/ml LPS. (a) IgA transcytosis
was measured by ELISA and results were normalized to the WT group (= 100%). Values are
indicated as mean ± s.e.m.; n = 8 per group. Wilcoxon signed rank test: P = 0.0039. (b) Gene
expression analysis of pIgR was performed and all samples were normalized to Gapdh. Data are
presented as fold change relative to untreated (0% CM) cells. All values are indicated as mean ±
s.e.m. One-way ANOVA: F = 40.92, P < 0.0001, n ≥ 7 per group. Means with different letters
are significantly different by Bonferroni’s multiple comparison test.

82
Figure 2.24. Cells from Tlr4-/-
mice have an impaired IgA transcytosis response to LPS.

83
Figure 2.25. Tlr4-/-
cells induce IgA transcytosis and pIgR expression in response to IL-17.
Wild type Tlr4 and Tlr4-/-
cells were treated with 10 μM DAPT and varying doses of IL-17. (a)
IgA transcytosis was analyzed by ELISA and results were normalized to the WT+D+L group (=
100%). Gene expression analysis of pIgR was performed (b) and all samples were normalized to
Gapdh. Data are presented as fold change relative to untreated (0% CM) cells. All values are
indicated as mean ± s.e.m. One-way ANOVA: (a) F = 116.9, P < 0.0001, n ≥ 3 per group; (b) F
= 6.364, P < 0.0004, n ≥ 3 per group. Means with different letters are significantly different by
Bonferroni’s multiple comparison test. N.D. = not detected.

84
Figure 2.25. Tlr4-/-
cells induce IgA transcytosis and pIgR expression in response to IL-17.

85
CHAPTER THREE
Heritable Luminal IgA Levels Distinguish Extra-Chromosomal Phenotypic Variation

86
ABSTRACT
IgA is the most abundant immunoglobulin produced in the body. The majority of the IgA can
be found at mucosal sites such as the intestine where it plays an important role at a critical
intersection between the host immune system and the microbiota. Mice of the same genetic
background bred in the same facility were surprisingly found to have dichotomous fecal IgA
levels. This phenotype was heritable and transmissible but was not due to a genetic effect.
Furthermore, the IgA-Low phenotype was dominant and microbially driven. One functional
consequence of the IgA-Low phenotype was increased damage in response to chemically-
induced intestinal injury, which was observed to be directly dependent on the IgA status. In
addition, these results indicate that the IgA-Low mice have biologically active microbes with
proteolytic capability, leading to the degradation of SC and IgA in vitro and in vivo. Therefore,
these data show that the microbiota can modulate fecal IgA levels, leading to phenotypic
variation in mice.

87
INTRODUCTION
It is often assumed in mouse models that genotypic differences determine phenotypic
differences as long as all experimental animals are bred in the same facility or are ordered from
the same supplier. However, phenotypic variation of mice that are apparently genetically
identical in different facilities is a well-recognized problem often leading to opposing
conclusions62,68,69
. There have been many examples showing that the bacterial microbiome
(inherited from the dam in mice57-59
) has major influences on intestinal phenotypes. Garrett et al
have found that K. pneumonia and P. mirabilis correlates with the development of spontaneous
disease in the TRUC (Tbet-/-
Rag-/-
ulcerative colitis) mouse model63
. Through cross-fostering
experiments, maternal transmission of bacteria was shown to be able to induce disease in the
TRUC mice as well as the littermate controls that do not normally develop spontaneous disease
(Rag2-/-
and WT). Similarly, Elinav et al have shown that mice deficient in inflammasome
components (ASC-/-
, NLRP6-/-
, IL-18-/-
) exhibit exacerbated intestinal injury to dextran sodium
sulfate (DSS), which correlated with the presence of Prevotella species64
. Cross-fostering
experiments with these mice also revealed that the colitogenic activity of the microbiota was
transferable to WT mice. Though one conclusion was that NLRP6 directly regulated the
composition of the gut microbiota, since littermates were not used in the initial studies (or in the
16S sequencing studies), it is possible that the differences in the microbiota resulted from
differences in ancestry. Several more examples of this can be seen in the literature65,67
.
A nice study performed by Ubeda et al showed that in contrast to what had been
previously thought, deficiency in Myd88, TLR2, TLR4, TLR5, and TLR9 had minimal impact
on the microbial composition relative to WT littermates under homeostatic conditions66
.
Therefore, their conclusions were that the differences previously found between these TLR-

88
deficient strains and their non-littermate WT controls reflected long-term divergence and drift of
the microbiota that was maternally transmitted in these separate breeding schemes (despite being
in the same mouse facility).
Though it is clear that the microbiota can change intestinal phenotypes such as the
susceptibility of mice to intestinal injury, specific host-microbial mechanisms responsible have
not been defined. Here, we investigated the surprising observation that wild-type mice bred
within the same facility had dichotomous fecal IgA levels (IgA-High or IgA-Low). This
phenotype was heritable, but not due to mouse genetics. Instead bacteria in IgA-Low mice
dominantly lowered IgA levels in IgA-High mice after either co-housing or fecal transplantation.
This property of inherited bacteria was not unique to a single facility. The dominant effect of
bacteria from IgA-Low mice was stably passaged through mice lacking luminal IgA indicating
that the heritable property of the IgA phenotype was not selected by the IgA itself. In response
to DSS, IgA-Low mice showed increased colonic ulceration that was driven by fecal IgA
differences. Serum IgA levels and intestinal plasma cell numbers were not altered, indicating that
the B cell compartment did not drive the IgA-Low phenotype. Instead, bacteria from IgA-Low
mice degraded the secretory component of SIgA. These studies highlight the ability of the
microbiota to produce phenotypic effects through the modulation of IgA, and underscore the
importance of taking into account the non-chromosomal hereditary variation between different
breeders when making phenotypic comparisons between mice.

89
MATERIALS AND METHODS
Mice. Animal protocols were approved by the Washington University Animal Studies
Committee. All mice were maintained in one of two a specific pathogen-free barrier facilities,
with different procedures for maintaining food, water, and caging. In the SRF facility, complete
cages (including food, bedding, isolator top, wires, and cage) are autoclaved after assembly,
water is autoclaved and kept sterile, and a higher concentration of disinfectant is used (1:5:1
Clidox, Pharmacal Research Laboratories, Inc.). The CSRB facility also uses autoclaved cage
components however the cages are assembled after autoclaving. The food is irradiated but not
autoclaved, and a lower concentration of disinfectant is used (1:18:1 Clidox). pIgR-/-
mice
(B6.129P2-Pigrtm1Fejo
/Mmmh43
) were initially obtained from Mutant Mouse Regional Resource
Center and were backcrossed to 98% B6. All mice used were 3-6 months of age.
Mouse treatments. For fecal transplantation experiments, fecal samples were collected from
mice and resuspended in sterile PBS to a final concentration of 200 mg/ml by weight. Mice were
administered 25 μl of the fecal mixture on two consecutive days.
Antibiotics were administered in drinking water for 14 days. Treatments included 1
mg/ml vancomycin, 1mg/ml neomycin, 1mg/ml ampicillin, and 1mg/ml metronidazole.
For dextran sodium sulfate experiments, 2.5% DSS (TdB Consultancy) was administered
in drinking water for 11 days. Mice were weighed daily and sacrificed at 70% of initial body
weight if needed. Intestines were taken for histology.

90
Preparation of fecal samples for ELISA and immunoblotting. Fecal samples were collected
from mice and resuspended in sterile PBS to a final concentration of 100 mg/ml by weight.
Supernatants were collected and stored in -20°C until needed.
Preparation of fecal samples for bacterial culture. Fecal samples were collected from mice
and resuspended in sterile PBS to a final concentration of 200 mg/ml by weight. 250 μl of this
mixture was used to inoculate anaerobic chopped meat broth in Hungate tubes (Fisher Scientific)
for overnight cultures in a 37°C shaking incubator. The fecal suspensions as well as the
overnight cultures were used in epithelial co-culture experiments described below.
Primary intestinal epithelial cell culture. Primary colonic epithelial stem cells were isolated,
grown, and maintained as 3D spheroid cultures in Matrigel (BD Biosciences) as described in
Miyoshi et al83,84
. Cells were kept in 50% L-WRN conditioned media (CM). Media was changed
every two days, and cells were passaged every three days (1:3 split).
Primary intestinal epithelial cell monolayers were formed as described in Moon et al116
.
Briefly, spheroids were recovered from three-day-old 3D Matrigel cultures, trypsinized,
dissociated to single cells by vigorous pipetting, and re-suspended in 50% L-WRN CM
containing 10 μM Y-27632 (R&D Systems). These cells were plated in Transwell inserts
(Corning Costar) coated with 0.1% gelatin.
Cell treatments. On day one (24 hours after seeding the Transwells) the 50% L-WRN CM
supplemented with Y-27632 was removed and replaced with 0% CM (Advanced DMEM/F12
containing 20% FBS, 100 units of Penicillin, 0.1 mg/ml Streptomycin and 2 mM L-glutamine).

91
At this time, any additional treatments were also administered to the cells: 1 μg/ml LPS (Sigma),
and 10 μM DAPT -secretase inhibitor (Millipore). Cells were given fresh media with the
respective treatments on day two, and were treated for a total of 48 hours before being used for
IgA transcytosis on day three.
IgA transcytosis assay. On day three, the Transwells were removed from the various treatment
conditions, and switched to base media (Advanced DMEM/F12 supplemented with 2mM L-
glutamine only; no FBS, no antibiotics). 600 μl of base media containing 3 μg of mouse IgA
(BD Pharmingen) was added to the lower compartment (final concentration of IgA = 5 μg/ml).
100 μl of base media (with or without various treatments) was added to the upper compartment.
Treatments included 1:10 fecal bacterial suspensions and 1:10 overnight anaerobic chopped meat
bacterial cultures. The apical supernatant was collected at different time points to evaluate the
amount of pIgR and IgA transcytosed by immunoblotting and ELISA (Immunology Consultants
Labs).
Immunostaining and histologic analysis. For whole tissue immunostaining, mouse colons were
harvested and prepared as previously described102
. 5 μm thick transverse sections were cut for
hematoxylin and eosin staining and immunostaining. For this procedure, the sections were de-
paraffinized, hydrated, boiled in Trilogy solution (Cell Marque) for 20 minutes, rinsed in PBS,
blocked with 1% bovine serum albumin/0.1% Tritin-X100 for 30 minutes, and incubated with
primary antibody at 4°C overnight. Primary antibodies include: goat anti-mouse pIgR (1:500,
R&D Systems) and goat anti-mouse IgA-AlexaFluor 488 (1:200, Serotec). The slides were
rinsed three times in PBS and incubated with AlexaFluor594-conjugaed species-specific

92
secondary antibodies for one hour at room temperature (1:500, Invitrogen) if needed. Slides were
washed three times in PBS and stained with bis-benzimide/Hoechst (Invitrogen) to visualize
nuclei and mounted with a 1:1 PBS:glycerol solution. Staining was visualized with a Zeiss
Axiovert 200 microscope with an Axiocam MRM digital camera.
Immunoblotting. Protein was isolated from intestinal tissue segments of ~1cm in 500 μl RIPA
buffer with protease inhibitors using the Fastprep bead-beater system (MP Bio, BioSpec).
Samples were subjected to 4 rounds of lysis at a speed 6 for 20 seconds, at 4°C. Primary
intestinal epithelial cells were lysed in Transwells with 50 μl RIPA buffer with protease
inhibitors (Sigma). Total protein was quantified using Pierce BCA Protein Assay Kit (Thermo
Scientific). Supernatants from fecal samples and Transwells were taken as described above.
Samples were run on either Any kD or 7.5% Mini-Protean TGX gels (Bio‐Rad) and transferred
onto nitrocellulose membrane (Bio‐Rad). Membranes were blocked with 3% milk in 0.1%
Tween‐20 Tris‐buffered saline for 1 h at room temperature and probed with goat IgG anti-pIgR
(R&D) and rabbit IgG anti-Actin (Sigma) overnight at 4°C. Blots were incubated for 1 h with
horseradish peroxidase‐conjugated secondary antibodies (Invitrogen, BioRad) before
development using the SuperSignal West Dura chemiluminescent kit (Thermo Scientific).
Immunoblots were quantified using ImageJ software101
.
Statistical Analysis. Statistical significance between groups was determined using unpaired t‐
test, One-way analysis of variance, Two-way analysis of variance, and repeated measures Two-
way analysis of variance in Prism GraphPad Software.

93
RESULTS
Low fecal IgA levels in WT C57BL/6 mice is heritable, transferable, and dominant
While interrogating baseline levels of fecal IgA in WT C57BL/6J mice (B6) bred in our
mouse colony, we observed a binary phenotype in fecal IgA levels between cages (Fig 3.1):
those with high fecal IgA (defined as greater than 0.05 µg IgA/mg feces), and those with nearly
undetectable levels of fecal IgA (hereafter designated as IgA-High and IgA-Low mice). This
differential IgA phenotype was observed in two separate facilities at our institution in WT B6
colonies that were independently derived (Fig 3.2). While both facilities are specific pathogen-
free, the procedures, protocols, access, and personnel are unique. All experiments were
performed in both facilities unless otherwise noted. Despite the profound difference in fecal IgA
levels, serum IgA levels were similar between these two groups, suggesting an effect localized to
the gut (Fig 3.3). The binary phenotype was vertically transmissible, indicating a heritable
phenotype (Fig 3.4). Furthermore, this heritable phenotype was laterally transferable by co-
housing IgA-High and IgA-Low WT B6 mice. Remarkably, both IgA-High and IgA-Low mice
were found to be IgA-Low post-co-housing (Fig 3.5). This result also occurred by cross-transfer
experiments which involved fecal transplantation between mice in our two facilities (Fig 3.6).
Hence, the IgA-Low phenotype was dominant, indicating that IgA levels can be regulated by
suppression and not only induction.
The IgA-Low phenotype is bacterially driven
We next tested if the fecal microbiome in the absence of IgA could create this binary
phenotype. To address this experimentally, we used pIgR-/-
mice that cannot transcytose IgA (and
therefore lack luminal IgA)43
as vessels to passage microbes independently of IgA (Fig 3.7).

94
Fecal samples from pIgR-/-
mice transplanted with IgA-Low material were able to subsequently
confer the IgA-Low phenotype to IgA-High WT recipient mice (Fig 3.8). As a control, WT IgA-
High recipients maintained their phenotype when transplanted with samples from IgA-High-
transplanted pIgR-/-
mice. Thus, exposure to a novel environment lacking IgA (the pIgR-/-
intestine) does not affect the ability of the fecal microbiota to regulate the IgA-High vs -Low
phenotype.
Both commensal bacteria and viruses in the gut modulate mucosal IgA levels117,118
. To
assess whether dominant lowering of IgA levels was due to bacteria or alternatively viral or
soluble factors, we transplanted IgA-High mice with fecal material from IgA-Low mice that had
been either homogenized or filtered to remove large microbes (e.g. bacteria, fungi). IgA-High
mice transplanted with filtered fecal material remained IgA-High, while mice transplanted with
unfiltered fecal homogenate became IgA-Low (Fig 3.9). This result suggests the IgA-Low
phenotype is induced by intestinal microbes, and excludes filterable viruses.
To determine if specific microbial pools could induce the IgA-Low phenotype, we pre-
treated IgA-Low mice with a broad-spectrum antibiotic cocktail (vancomycin, neomycin,
ampicillin, and metronidazole; VNAM) chosen to target a wide range of microbes119,120
(Fig
3.10a,b), then transplanted them fecal samples from either IgA-High or IgA-Low mice.
Transplantation with IgA-High microbes led to an increase of intestinal IgA levels, indicating
that the IgA-Low-inducing microbes were eliminated by VNAM (Fig 3.10b). We then tested the
role of specific antibiotics and found that ampicillin but not metronidazole was sufficient to
reverse the IgA-Low phenotype (Fig 3.10c,d). These results show ampicillin-sensitive
microbe(s) were responsible for the IgA-Low phenotype. Unlike VNAM, ampicillin treatment
reversed the IgA-low phenotype even without transplantation with IgA-High samples. This

95
indicated that VNAM eliminated both the IgA suppressive and IgA-inductive microbes while
ampicillin alone eliminated only the IgA-suppressive microbes. We assessed whether the IgA
status of antibiotic-treated mice could be vertically transmitted, and found that VNAM-treated
IgA-Low mice transplanted with IgA-High fecal samples gave rise to IgA-High progeny (Fig
3.11). Taken together, these results support a model where the IgA-low phenotype is bacterially-
driven, dominantly transmissible, and heritable (Figure 3.12).
Functional consequences of low fecal IgA levels: increased susceptibility to colonic injury
We next determined if the IgA-Low phenotype affected intestinal injury responses as
previous studies that showed pIgR-/-
mice are more susceptible to DSS injury121
. With DSS
treatment, IgA-Low mice lost significantly more weight than their IgA-High counterparts (Fig
3.13), and exhibited increased distal colon ulceration (Fig 3.14). This DSS sensitivity could be
secondary to either diminished IgA or the altered microbial composition.
To address this we re-colonized WT and pIgR-/-
mice with IgA-High or IgA-Low fecal
material for two weeks after VNAM treatment, as shown in Figure 3.7, prior to DSS treatment
(Fig 3.15). As expected, WT IgA-Low mice showed enhanced DSS sensitivity compared to WT
IgA High mice (Fig 3.16, 3.17). Consistent with previous reports121
, we observed that pIgR-/-
mice exhibited increased weight loss and colonic ulceration compared to WT mice. Interestingly,
this sensitivity was independent of the microbial composition. This finding implied that altered
IgA levels, and not the microbes themselves, were responsible for the increased DSS damage in
WT IgA-Low mice.

96
Identifying the mechanism: IgA-Low-associated microbes degrade SIgA
To study the mechanism by which IgA-Low microbes suppress fecal IgA levels, we
assessed IgA production and IgA transport capacity by pIgR in IgA-High vs IgA-Low mice.
Intestinal IgA is made in the lamina propria by plasma cells, but we found no difference in
plasma cell numbers in small intestines or colons of these mice (Fig 3.18). Immunofluorescence
staining for pIgR in the IgA-High and IgA-Low mice also failed to show obvious differences
(Fig 3.19).
On the apical surface of intestinal epithelial cells, pIgR is cleaved and released into the
intestine bound to dimeric IgA. This cleaved form of pIgR, called the secretory component (SC),
is thought to help protect dimeric IgA from degradation by bacterial proteases13,14
. We
hypothesized that in IgA-Low mice, the absence of IgA may be secondary to degradation of SC.
We therefore assessed levels of cleaved (SC) vs. full-length (membrane-bound) pIgR by
immunoblots fecal samples and whole tissue (Fig 3.20a). While both IgA-High and -Low mice
had comparable levels of pIgR in whole tissue (Fig 3.20b,c), IgA-Low mice had significantly
reduced levels of SC in fecal samples (Fig 3.20d).
To define the mechanism for this observation, we developed an in vitro system. We first
anaerobically cultured bacteria from IgA-High and IgA-Low fecal samples (Fig 3.21a), and
administered these cultures to IgA-High recipients. While the IgA-High cultures maintained the
IgA-High phenotype, mice administered IgA-Low cultures converted to the IgA-Low phenotype,
indicating the causative IgA-Low microbes are culturable in these conditions (Fig 3.21b). We
next generated polarized, differentiated monolayers of primary epithelial cells in Transwells116
and assessed IgA transport from the basolateral to the apical compartment in the presence of the
cultured bacteria (Fig. 3.22). Treatment with the γ-secretase inhibitor DAPT and LPS robustly

97
induces pIgR in these cells (Fig. 3.23), which is necessary for IgA transport (Fig 3.24). We then
co-cultured epithelial monolayers with IgA-High or IgA-Low cultures by adding pelleted
bacteria or culture supernatants to the apical compartment of the Transwells for three or six
hours (Fig 3.24). In co-cultures with IgA-High pelleted bacteria, we detect SC in the apical
supernatants at both time points, while co-cultures with IgA-Low pelleted bacteria exhibited
substantially greater SC degradation over time. The bacterial culture supernatants did not lead to
degradation, suggesting that the presence of the bacterial cells is required in this case. Epithelial
cell lysates from all treatment conditions showed similar pIgR levels, indicating that differences
in SC levels in the supernatant are not due to differences in epithelial pIgR expression (Fig.
3.23).
Taken together, these data suggest there are bacteria present in the IgA-Low microbiota
capable of degrading SC in vitro, consistent with our observation of absent fecal SC in vivo.
These findings are consistent with a model in which SC degradation by IgA-Low microbes
makes IgA more susceptible to degradation itself (Fig 3.25). Bacteria have been shown to make
proteases that can cleave human IgA1/IgA2 as well as SC70-73,76-78
, though this has not been
addressed in murine models, and could be a potential means by which the causative IgA-Low
microbes alter the host response.

98
DISCUSSION
Here, we show one driver of phenotypic variation between genetically identical mice
bred in the same colonies. We found that fecal IgA levels show a binary phenotype in WT mice
that was heritable and transferable. In addition, the IgA-Low phenotype was found to be
dominant and microbially driven. One functional consequence of having low levels of luminal
IgA was increased intestinal injury after DSS treatment in mice. Furthermore, in vitro co-culture
experiments using primary epithelial monolayers and anaerobically cultured intestinal bacteria
showed that cultured microbes from IgA-Low mice had proteolytic activity capable of degrading
SC. Previous studies from multiple groups have shown that SC stabilizes and protects dIgA from
degradation by proteases13,14
, thus these findings support the idea that degradation of SC in vivo
would make IgA more susceptible to degradation itself, and thereby explain the IgA-Low
phenotype.
This data reveals that the microbiome can potentially mimic the effects of chromosomal
genes, such that phenotypes of mouse strains bred separately may reflect significant biological
effects of the microbiome122
. Therefore, in order to evaluate the effects of a chromosomal gene
(especially in the intestine), the effects of the microbiome must be taken into consideration as
well. In these studies, fecal IgA served as a readily measurable marker for relevant effects of the
bacterial microbiome, and it is possible that its use might clarify variation that can occur within
some mouse experiments. Furthermore, fecal transplantation and co-housing experiments could
also serve as a methodological control for the phenotypic variation dependent on heritable
factors that may be easily transmissible between hosts. Our findings may have broader
implications for many animal experiments since the microbiome has also been shown to have
systemic effects123
.
99
Figure 3.1. Wild type C57BL/6 mice have a binary fecal IgA phenotype.
Fecal IgA normalized by weight was measured by anti-mouse IgA enzyme linked
immunosorbent assay (ELISA). The IgA-High phenotype was defined as having fecal IgA values
>0.05 μg IgA/mg feces. The dotted lines represent the limit of detection by ELISA. All values
are indicated as mean±s.e.m. Statistical analysis by unpaired t-test: P<0.0001, n>34 mice per
group.

100
Figure 3.1. Wild type C57BL/6 mice have a binary fecal IgA phenotype.

101
Figure 3.2. The binary fecal IgA phenotype is observed in two independent facilities.
Fecal IgA (normalized to fecal weight) from mice housed in either Facility 1 or Facility 2 was
detected by anti-mouse IgA ELISA. The dotted lines represent the limit of detection by ELISA.
All values are indicated as mean±s.e.m. One-way analysis of variance: F=44.59, P<0.0001, n>12
mice per group. Means with different letters are significantly different by Tukey’s multiple
comparison test.

102
Figure 3.2. The binary fecal IgA phenotype is observed in two independent facilities.

103
Figure 3.3. Serum IgA is comparable between IgA-High and IgA-Low mice.
Serum IgA was measured by anti-mouse IgA ELISA. All values are indicated as mean±s.e.m.
Statistical analysis by unpaired t-test: P<0.3991, n=12 mice per group.

104
Figure 3.3. Serum IgA is comparable between IgA-High and IgA-Low mice.

105
Figure 3.4. The binary fecal IgA phenotype is heritable.
Fecal IgA was analyzed from IgA-High/IgA-Low breeders and their progeny once they reached
at least 8 weeks of age. The dotted lines represent the limit of detection by ELISA. All values are
indicated as mean±s.e.m. One-way analysis of variance: F= 45.95, P<0.0001, n>9 mice per
group. Means with different letters are significantly different by Tukey’s multiple comparison
test.

106
Figure 3.4. The binary fecal IgA phenotype is heritable.

107
Figure 3.5. The IgA-Low phenotype is dominantly transferable by co-housing.
Fecal IgA was measured in IgA-High and IgA-Low mice before and after 14 days of 1:1 co-
housing. The dotted lines represent the limit of detection by ELISA. All values are indicated as
mean±s.e.m. One-way analysis of variance: F= 15.56, P<0.0001, n>8 mice per group. Means
with different letters are significantly different by Tukey’s multiple comparison test.

108
Figure 3.5. The IgA-Low phenotype is dominantly transferable by co-housing.

109
Figure 3.6. The IgA-Low phenotype is transferable between two independent mouse
facilities.
WT IgA-High mice from one mouse facility were administered homogenized fecal material from
WT IgA-High or IgA-Low mice from the other mouse facility, and fecal IgA was measured 14
days later by anti-mouse IgA ELISA. The dotted lines represent the limit of detection by ELISA.
(a) Facility 1 mice pre- and post-fecal transplantation with Facility 2 fecal samples. (b) Facility 2
mice pre- and post-fecal transplantation with Facility 1 fecal samples. All values are indicated as
mean±s.e.m. One-way analysis of variance: (a) F=20.93, P<0.0001, n>8 mice per group; (b)
F=12.92, P<0.0004, n>4 mice per group. Means with different letters are significantly different
by Tukey’s multiple comparison test.

110
Figure 3.6. The IgA-Low phenotype is transferable between two independent mouse facilities.

111
Figure 3.7. Schematic for passage experiment though pIgR-/-
mice.
Schematic for re-population of antibiotic-treated pIgR-/-
mice with microbes from WT IgA-High
or IgA-Low mice by fecal transplantation (FT), followed by fecal transplantation of WT IgA-
High recipients with samples from the re-populated pIgR-/-
mice. VNAM = antibiotic cocktail
containing vancomycin, neomycin, ampicillin, metronidazole.

112
Figure 3.7. Schematic for passage experiment though pIgR-/-
mice.

113
Figure 3.8. The binary IgA phenotype can be passaged though pIgR-/-
mice.
Fecal IgA levels from mice on day 44 as depicted in Figure 3.7. The dotted lines represent the
limit of detection by ELISA. All values are indicated as mean±s.e.m. Statistical analysis by
unpaired t-test: P<0.0003, n=8 mice per group.

114
Figure 3.8. The binary IgA phenotype can be passaged though pIgR-/-
mice.

115
Figure 3.9. The IgA-Low phenotype can be transferred by fecal transplantation.
Fecal IgA levels from IgA-High mice pre- and post-fecal transplantation with unfiltered (Post-
FT) or 0.45µm-filtered fecal material (Post-filter FT) from IgA-Low mice. The dotted lines
represent the limit of detection by ELISA. All values are indicated as mean±s.e.m. One-way
analysis of variance: F=5.685, P<0.0076, n>5 mice per group. Means with different letters are
significantly different by Tukey’s multiple comparison test.

116
Figure 3.9. The IgA-Low phenotype can be transferred by fecal transplantation.

117
Figure 3.10. The IgA-Low phenotype is driven by ampicillin-susceptible bacteria.
(a) Schematic of antibiotic treatment + fecal transplantation experiments performed in (b-d).
Mice were treated with (b) a cocktail of antibiotics including vancomycin, neomycin, ampicillin,
and metronidazole (VNAM), (c) ampicillin, or (d) metronidazole for 14 days prior to fecal
transplantation with IgA-High or IgA-Low fecal samples. Fecal IgA levels were measured 14
days after transplantation. The dotted lines represent the limit of detection by ELISA. All values
are indicated as mean±s.e.m. One-way analysis of variance: (b) F=16.15, P<0.0001, n>9 mice
per group; (c) F=22.96, P<0.0001, n>12 mice per group; (d) F=6.525, P<0.0012, n>5 mice per
group. Means with different letters are significantly different by Tukey’s multiple comparison
test.

118
Figure 3.10. The IgA-Low phenotype is driven by ampicillin-susceptible bacteria.

119
Figure 3.11. The converted IgA-High phenotype is stable and heritable.
IgA-Low mice converted to IgA-High from (e) were used to set up a breeding pair, and fecal IgA
levels of their progeny were measured once they reached at least 8 weeks of age. The dotted lines
represent the limit of detection by ELISA. All values are indicated as mean±s.e.m. One-way
analysis of variance: F=18.29, P<0.0002, n=2 breeders and n=10 progeny from 4 litters. Means
with different letters are significantly different by Tukey’s multiple comparison test.

120
Figure 3.11. The converted IgA-High phenotype is stable and heritable.

121
Figure 3.12. Summary model of the IgA phenotype.
Cartoon summarizing the IgA phenotype observed in WT mice in our mouse colonies. (a) The
binary IgA phenotype is vertically transmitted and therefore heritable. (b) The IgA-Low
phenotype is horizontally transmitted by co-housing in a dominant manner. (c) The IgA-Low
phenotype is horizontally transmitted by fecal transplantation. Additional experiments suggest
that the IgA-Low phenotype is driven by ampicillin-susceptible bacteria.

122
Figure 3.12. Summary model of the IgA phenotype.

123
Figure 3.13. The IgA-Low mice have greater weight loss in DSS injury.
IgA-High and IgA-Low mice from both facilities were treated with 2.5% DSS in drinking water
for 11 days. Mice were weighed daily and weight loss depicted as percent initial weight. All
values are indicated as mean±s.e.m. Statistical analysis by Two-way repeated measures analysis
of variance: column factor P<0.0089, n>8 mice per group. ***P<0.001 by Sidak’s multiple
comparison test for the final time point.

124
Figure 3.13. The IgA-Low mice have greater weight loss in DSS injury.

125
Figure 3.14. The IgA-Low mice have increased ulceration in DSS injury.
IgA-High and IgA-Low mice from both facilities were treated with 2.5% DSS in drinking water
for 11 days, when colons were harvested for histology. (a) Representative hematoxylin and eosin
stained histologic sections. Bars = 1 mm; boxes indicate areas of ulceration. (b) percentage of
ulcerated distal colon. All values are indicated as mean±s.e.m. Statistical analysis by unpaired t-
test: P<0.0385, n>10 mice per group.

126
Figure 3.14. The IgA-Low mice have increased ulceration in DSS injury.

127
Figure 3.15. IgA status of mice after VNAM and FT, before the start of DSS treatment.
Fecal IgA levels were measured in mice from Figures 3.16 and 3.17 after VNAM treatment and
IgA-High/IgA-Low fecal transplantation, prior to the start of DSS treatment. The dotted lines
represent the limit of detection by ELISA. All values are indicated as mean±s.e.m. Statistical
analysis by unpaired t-test: P<0.0001, n=7 mice per group.

128
Figure 3.15. IgA status of mice after VNAM and FT, before the start of DSS treatment.
129
Figure 3.16. The increased DSS-induced weight loss of IgA-Low mice is due to altered IgA
levels.
DSS treatment of WT and pIgR-/-
mice from Facility 2 after 14 days of VNAM treatment and
IgA-High/IgA-Low fecal transplantation. Mice were treated with 2.5% DSS in drinking water for
11 days, and weighed daily. Weight loss is depicted as percent initial weight. All values are
indicated as mean±s.e.m. Statistical analysis by Two-way repeated measures analysis of
variance: column factor P<0.0001, n>15 mice per group. Means with different letters are
significantly different by Tukey’s multiple comparison test for the final time point.

130
Figure 3.16. The increased DSS-induced weight loss of IgA-Low mice is due to altered IgA
levels.

131
Figure 3.17. The increased DSS-induced ulceration of IgA-Low mice is due to altered IgA
levels.
DSS treatment of WT and pIgR-/-
mice from Facility 2 after 14 days of VNAM treatment and
IgA-High/IgA-Low fecal transplantation. Mice were treated with 2.5% DSS in drinking water for
11 days, when colons were harvested for histology. (a) Representative hematoxylin and eosin
stained histologic sections. Bars = 1 mm; boxes indicate areas of ulceration. (b) percentage of
ulcerated distal colon. All values are indicated as mean±s.e.m. Statistical analysis by One-way
analysis of variance: F=8.272, P<0.0007, n>3 mice per group. Means with different letters are
significantly different by Tukey’s multiple comparison test.
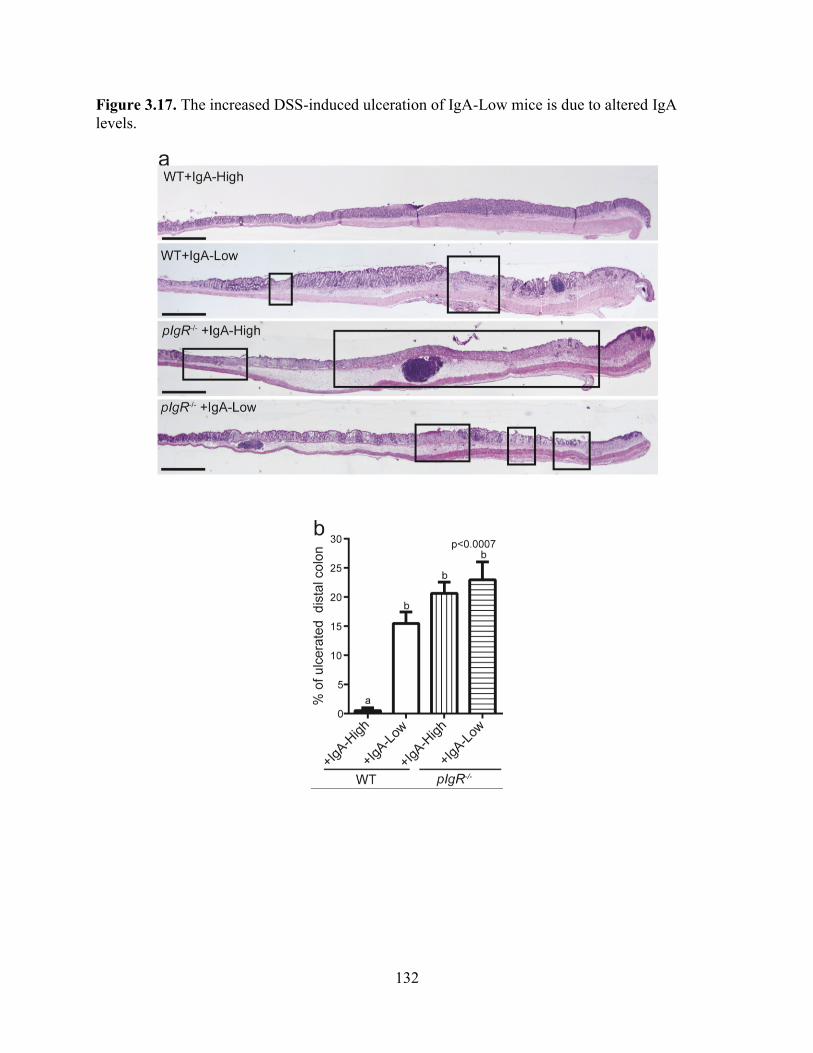
132
Figure 3.17. The increased DSS-induced ulceration of IgA-Low mice is due to altered IgA
levels.

133
Figure 3.18. Intestinal plasma cell numbers are unchanged between IgA-High and IgA-Low
mice.
Ileal (a,b) and colonic (c,d) sections from IgA-High and IgA-Low mice were stained with anti-
IgA (green) and bis-benzamide dye (blue); representative images are shown. Bars = 100 μm.
Quantification of ileal plasma cells per villus (e) and colonic plasma cells per 20X field (f) based
on IgA staining. All values are indicated as mean±s.e.m. Statistical analysis by unpaired t-test:
(e) P<0.6638, n=10 mice per group, and (f) P<0.3158, n>9 mice per group.

134
Figure 3.18. Intestinal plasma cell numbers are unchanged between IgA-High and IgA-Low
mice.

135
Figure 3.19. Intestinal pIgR immunostaining is not different between IgA-High and IgA-
Low mice.
Ileal (a,b) and colonic (c,d) sections from IgA-High and IgA-Low mice were stained with anti-
pIgR (red) and bis-benzamide dye (blue); representative images are shown (n=10 mice per
group). Bars = 100 μm.
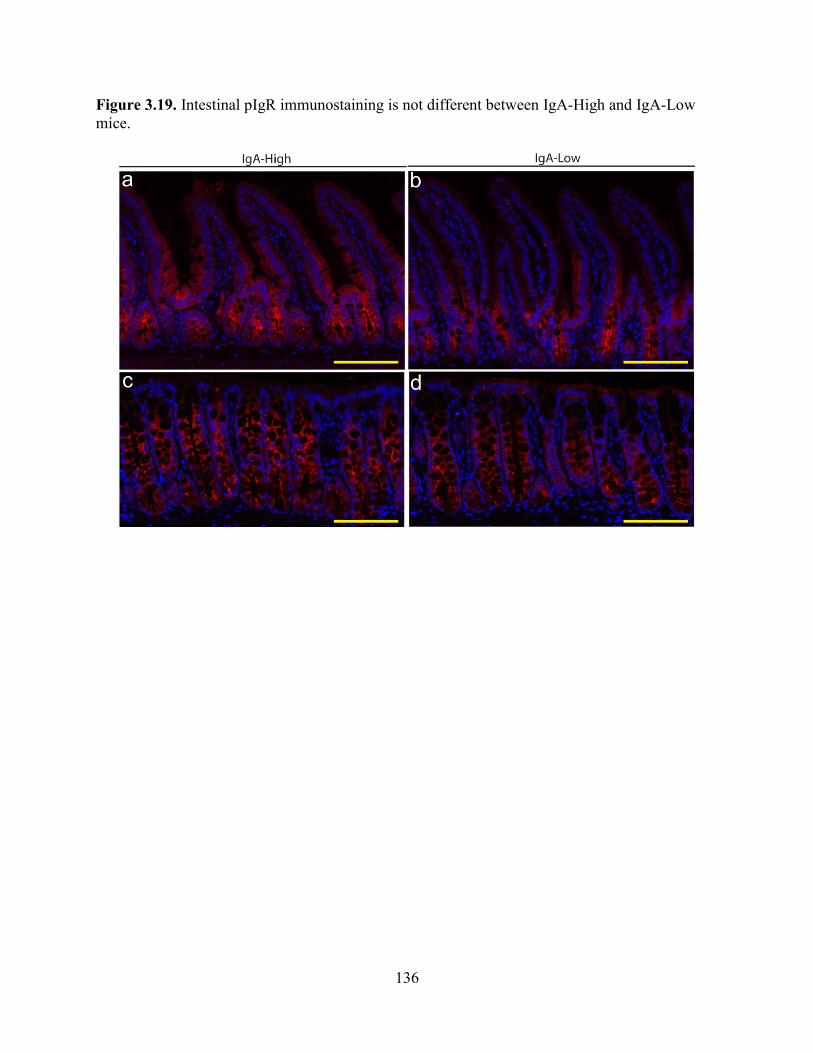
136
Figure 3.19. Intestinal pIgR immunostaining is not different between IgA-High and IgA-Low
mice.

137
Figure 3.20. Secretory component is absent in IgA-Low fecal samples.
(a) Representative anti-pIgR/SC immunoblot of intestinal tissue and fecal samples from IgA-
High (lanes 1-4) and IgA-Low (lanes 5-7) mice. Ileal and colonic pIgR was normalized to actin.
Fecal samples were normalized by fecal weight. (b-d) Quantification of immunoblots for (b)
ileal pIgR, (c) colonic pIgR, and (d) fecal SC using ImageJ. Colonic and ileal pIgR were
normalized to actin, and fecal SC was normalized to average IgA-High values=100%. All values
are indicated as mean±s.e.m. Statistical analysis by unpaired t-test: (b) P<0.6150, n>5 mice per
group; (c) P<0.0933, n>10 mice per group; (d) P<0.0001, n>5 mice per group.

138
Figure 3.20. Secretory component is absent in IgA-Low fecal samples.

139
Figure 3.21. The IgA-Low-associated microbes are culturable.
(a) Schematic of bacterial culturing experiments. (b) Fecal IgA was measured in IgA-High mice
before and after administration with cultured microbes as depicted in (a). The dotted lines
represent the limit of detection by ELISA. All values are indicated as mean±s.e.m. One-way
analysis of variance: F=18.60, P<0.0001, n>9 mice per group. Means with different letters are
significantly different by Tukey’s multiple comparison test.

140
Figure 3.21. The IgA-Low-associated microbes are culturable.

141
Figure 3.22: Schematic of intestinal epithelial:bacterial co-culture for IgA transcytosis
On day 3 post seeding primary intestinal epithelial cell monolayers, 3 μg of normal mouse IgA is
added to the lower compartment of the Transwells. At the same time, IgA-High or IgA-Low
bacterial cultures are added to the apical compartment of the Transwells. Apical Transwell
supernatants are collected at 3 and 6 hours for detection of SIgA by various methods.

142
Figure 3.22: Schematic of intestinal epithelial:bacterial co-culture for IgA transcytosis

143
Figure 3.23. pIgR is expressed equally in intestinal epithelial monolayers in all treatment
conditions.
Representative immunoblot of intestinal epithelial monolayers stained for anti-pIgR and anti-
actin (one of three experiments). Cells were pre-treated with 10 μM DAPT + 1μg ml-1
LPS on
days 1 and 2 post seeding to induce differentiation and pIgR expression. Some wells were left
untreated as negative controls. On day 3 post seeding, 3 μg of normal mouse IgA was added to
the lower compartment of the Transwells. At the same time, a subset of the DAPT+LPS-treated
Transwells was also treated with IgA-High/IgA-Low bacterial cultures (either the pelleted
bacterial or supernatant fraction) in the apical compartment.
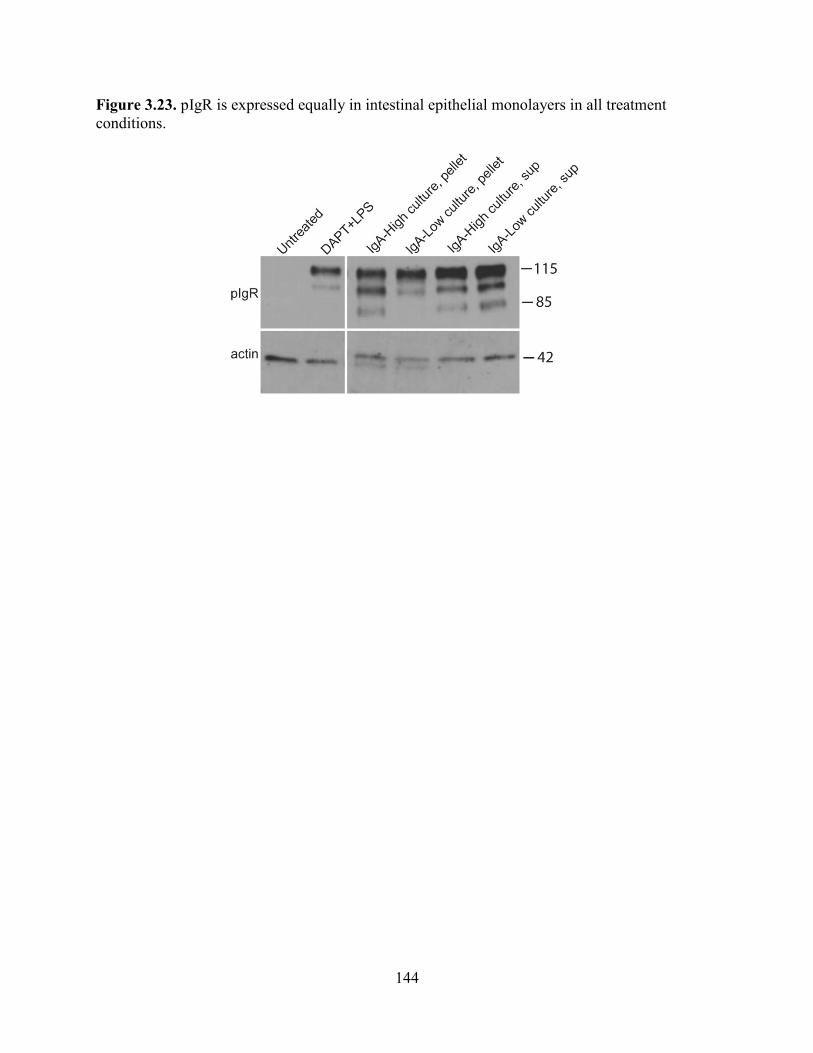
144
Figure 3.23. pIgR is expressed equally in intestinal epithelial monolayers in all treatment
conditions.

145
Figure 3.24. IgA-Low cultured microbes degrade SC in vitro.
Primary intestinal epithelial cell monolayers were pre-treated with 10 μM DAPT + 1μg ml-1
LPS
on days 1 and 2 post seeding to induce differentiation and pIgR expression. Some wells were left
untreated as negative controls. On day 3 post seeding, 3 μg of normal mouse IgA was added to
the lower compartment of the Transwells. At the same time, a subset of the DAPT+LPS-treated
Transwells was also treated with IgA-High/IgA-Low bacterial cultures (either the pelleted
bacterial or supernatant fraction) in the apical compartment. Apical Transwell supernatants were
collected at 3 and 6 hours, and the amount of SC was measured by anti-SC immunoblot. (a)
Representative anti-SC immunoblot and quantification of the full length SC normalized to the
DAPT+LPS treatment group at 3 hours (b) and 6 hours (c) over 5 independent experiments by
ImageJ. All values are indicated as mean±s.e.m. One-way analysis of variance: (b) F=13.50,
P<0.0001, n>3 per group; (c) F=62.56, P<0.0001, n=5 per group. Means with different letters are
significantly different by Tukey’s multiple comparison test.

146
Figure 3.24. IgA-Low cultured microbes degrade SC in vitro.

147
Figure 3.25. Summary and working model.
Wild-type mice bred in the same facility have a binary phenotype in fecal IgA levels (IgA-High
vs IgA-Low). This phenotype was found to be heritable and transmissible. Surprisingly, the IgA-
Low phenotype was dominant and microbially driven by ampicillin-susceptible bacteria. These
IgA-Low mice had an increased susceptibility to DSS injury that was directly dependent on the
IgA status. Mechanistically, we found the IgA-Low microbes had proteolytic activity in vitro,
leading to the degradation of SC. This is consistent with the model in which SC degradation by
IgA-Low microbes would make IgA more susceptible to degradation itself.

148
Figure 3.25. Summary and working model.

149
CHAPTER FOUR
Summary and future directions

150
SUMMARY
The overarching theme of this thesis was to investigate host-microbial interactions in the
intestine. More specifically, we were interested in investigating the role of IgA, which is at a
critical intersection between the host immune system and the microbiota. To do this, we
developed an in vitro system and utilized in vivo mouse models to examine a mechanism by
which commensal bacteria can modulate luminal IgA.
The first aim was to develop a primary intestinal epithelial monolayer system to study the
cell biology of intestinal epithelial cells in vitro. Until recent advancements allowing for the
culture and propagation of primary intestinal epithelial stem cells in vitro82-84
, various colon
cancer cells lines and non-intestinal epithelial cell lines have been utilized to model physiologic
and cell biologic processes. While studies using Caco-2, HT-29, T84, MDCK, and other cell
lines have provided invaluable insights into epithelial cell biology, there are many well-
recognized limitations to these systems85,86,89-91
. However, one of the major advantages these
various cell lines have over the current primary cell culture systems is their ability to form
polarized monolayers. We therefore adapted the primary spheroid culture system to grow
polarized primary intestinal epithelial cell monolayers, and functionally tested these monolayers
by looking at the process of IgA transcytosis116
. Our ultimate goal was to be able to use this
system to not only investigate epithelial cell biology, but also epithelial cell interactions with
other host cells as well as the commensal microbiota.
Our in vivo studies highlight the ability of the microbiota to produce significant
phenotypic effects in genetically identical mice. We found that WT mice in a single mouse
facility had dichotomous levels of fecal IgA, and this phenotype was found to be heritable in a
non-chromosomal manner. In addition, the IgA-Low phenotype was found to be dominant,

151
microbially driven, and led to increased intestinal injury by DSS. In vitro co-culture studies
utilizing the primary intestinal epithelial monolayer system and anaerobically cultured bacteria
revealed proteolytic activity present in the IgA-Low cultured microbes that led to the degradation
of SC. These findings are consistent with a model in which SC degradation by IgA-Low
microbes makes IgA more susceptible to degradation itself, leading to the low IgA levels
observed in these mice. The studies presented in this thesis have just begun to dive into the
mechanism of this microbially driven phenotypic difference, and brings up multiple avenues for
future studies that are the subject of this final chapter.

152
FUTURE DIRECTIONS
As detailed in chapter 3 and summarized in Figure 3.25, we observed that genetically
identical mice in the same facility had a dichotomous fecal IgA phenotype that was heritable and
transmissible. Furthermore, the IgA-Low phenotype was found to be dominant and microbially
driven. In vitro studies utilizing the primary intestinal epithelial monolayers along with
anaerobically cultured bacteria from the mice indicated that the IgA-Low-associated microbes
may have proteolytic activity capable of degrading SC (Fig. 3.24). This is consistent with the
model in which SC degradation by these IgA-Low microbes would make IgA more susceptible
to degradation itself, potentially explaining the diminished luminal IgA levels in the IgA-Low
mice.
Preliminary experiments using the epithelial:bacterial cell co-culture system show that in
fact IgA itself may be degraded in vitro (Figure 4.1). Treatment of the epithelial monolayers
with the IgA-Low culture supernatants showed comparable levels of IgA in the apical Transwell
compartment to the DAPT+LPS treated positive controls. However, co-culture of the monolayers
with the bacterial fraction from the IgA-Low culture showed IgA levels near the lower limit of
detection. This data suggested that the IgA-Low microbes have a biologic effect on the IgA itself
in addition to the SC in vitro. Further experiments need to be performed using cultured microbes
from IgA-High mice as a control. In addition, to show that this decrease in SC and IgA is due to
biologic effects of the microbes, these studies need to be repeated using heat-killed and
antibiotic-treated bacterial cultures. To show that the decrease in SIgA is specifically due to
proteolytic degradation, broad-spectrum bacterial protease inhibitors can be used during the co-
culture experiments. Not all bacterial proteases may be inhibited by these cocktails, however if
153
inhibition was observed, specific bacterial protease inhibitors can be used to classify and narrow
down the type of protease(s) involved in the IgA-Low phenotype.
Also at this point, we cannot determine whether the microbes affecting SC levels are the
same ones affecting IgA levels. To do this, we would first need to identify specific bacterial
isolates that are capable of degrading SC and IgA in vitro. While we have been successful in
culturing a community of microbes from IgA-Low mice that is able to confer the IgA-Low
phenotype in vivo and degrade SC and IgA in vitro, we have had some difficulty growing
specific bacterial isolates. Through 16S sequencing (Figure 4.2), we have identified Prevotella
and Sutterella as potential candidates associated with the IgA-Low phenotype. These microbes
were present in the IgA-Low mice, but absent in the IgA-High mice. We will attempt to isolate
single colonies of Prevotella and Sutterella on LKV and Brucella blood agar respectively. It is
possible that while these microbes show an association by sequencing, they may not be the
protease-producing microbes directly responsible for the degradation of the SIgA. These
microbes may be acting in concert with other bacteria to produce this effect or may need a
community of microbes to grow efficiently in culture.
Therefore a complementary approach will be used to identify the microbe(s) with IgA-
degrading activity utilizing a functional screen. To do this, different combinations of antibiotics
will be added to the IgA-Low chopped meat broth cultures to selectively eliminate pools of
bacteria while trying to retain the IgA-Low inducing microbes. In addition, dose curves of the
antibiotics could be tested. The in vitro co-culture system will allow us to systematically and
efficiently test these pools of microbes without initially worrying about potential issues of
intestinal colonization in the in vivo model.

154
Furthermore, the in vitro assay could be further simplified to a no-cell system: cultured
microbes could be added to media containing SIgA to look for direct degradation as an initial
screen prior to using the co-culture system, allowing for an even quicker screening tool. Both
mouse IgA and recombinant mouse SC are sold commercially and can be incubated in vitro to
form SIgA complexes. While some optimization will need to be performed to set up this system,
it would ultimately save time in performing the screen.
In these approaches, we can functionally test pools of microbes using our in vitro co-
culture system and potentially narrow down our IgA-Low community without the pressure of
relying on one single isolate that may or may not grow well in isolation. There is also the
possibility that one bacterial species alone may not be able to induce the phenotype, and a
community of microbes is needed. Using these approaches to gradually narrow down pools of
bacteria would address that possibility.
In addition to identifying the IgA-Low phenotype-inducing bacteria, another big question
is the identity of the putative protease. Knowing the identity of the bacteria would provide a
great advantage in addressing this question. If we can identify a specific bacterial species, the
genome sequence could provide insight into potential candidate proteases. Candidate genes could
then be cloned into E.coli to test for SIgA-degrading activity. In addition, we could also try to
isolate and purify the protease from the bacterial cultures. If the protease of interest can be
identified, it would be interesting to determine the specificity of the protease: is SIgA a specific
substrate, or is there a wider range of substrates that include additional host proteins, as observed
for ZapA produced by P. mirabilis79
? It would be interesting to determine whether our
microbe(s) of interest is(are) an opportunistic pathogen and/or a commensal microbe in the

155
mouse intestine, and whether these proteases function as virulence factors (which has typically
been the case for the IgA proteases found thus far).
Looking at the bigger picture, it would be interesting to determine whether related
microbes and/or proteases were present in the human intestine, and how this relates to luminal
IgA levels in humans. While the majority of IgA is produced at mucosal sites such as the
intestine, human IgA levels are mainly tested by serum analysis. Even in the case of IgA
deficiency, the clinical diagnosis is performed by measuring serum IgA levels. And while
alterations in IgA levels have been associated with intestinal diseases such as celiac disease and
IBD, luminal IgA levels have not really been investigated in human patients. Our work has
shown that serum IgA, lamina propria IgA+ plasma cell numbers, and epithelial pIgR expression
may not necessarily correlate with IgA levels in the intestinal lumen (where IgA is thought to
exert most of its effects). Therefore, the investigation of mucosal, and specifically luminal IgA
levels in human patients would be of great value.

156
Figure 4.1. IgA-Low cultured microbes degrade SIgA in vitro
Primary intestinal epithelial cell monolayers were pre-treated with 10 μM DAPT + 1μg ml-1
LPS
on days 1 and 2 post seeding to induce differentiation and pIgR expression. Some wells were left
untreated as negative controls. On day 3 post seeding, 3 μg of normal mouse IgA was added to
the lower compartment of the Transwells. At the same time, a subset of the DAPT+LPS-treated
Transwells was also treated with IgA-High/IgA-Low bacterial cultures (either the pelleted
bacterial or supernatant fraction) in the apical compartment. Apical Transwell supernatants were
collected at 3 and 6 hours, and the amount of IgA transcytosed to the apical compartment was
measured by ELISA. The dotted lines represent the limit of detection by ELISA. All values are
indicated as mean±s.e.m. One-way analysis of variance: F=43.15, P<0.0001, n>3 per group.
Means with different letters are significantly different by Tukey’s multiple comparison test.

157
Figure 4.1. IgA-Low cultured microbes degrade SIgA in vitro

158
Figure 4.2. Identification of IgA-Low-associated microbes by 16S sequencing
DNA was purified from IgA-High and IgA-Low fecal samples from two different mouse
facilities (Facility 1 = CSRB, Facility 2 = SRF). Each sample was amplified in triplicate,
combined, and confirmed by gel electrophoresis using Golay-barcoded primers specific for the
V4 region (F515/R806). The final pooled samples were sent to the Center for Genome Sciences
(Washington University School of Medicine) for sequencing using the 2x250bp protocol with the
Illumina MiSeq platform. 16S sequence analysis was performed using QIIME (Quantitative
Insights Into Microbial Ecology, version 1.8.0) (Caporaso et al., 2010). Relative OTU abundance
data was input into LEfSe to determine biomarkers with significant LDA effect size (Segata et. al
2010). Biomarkers were graphically annotated on phylogenetic trees using GraPhlAn (Segata et.
al 2012). Depicted below are the biomarkers specific for the IgA-Low associated microbes. This
work was performed by Dr. Megan T. Baldridge, M.D. Ph.D.

159
Figure 4.2. Identification of IgA-Low-associated microbes by 16S sequencing

160
REFERENCES
1 Artis, D. Epithelial-cell recognition of commensal bacteria and maintenance of immune
homeostasis in the gut. Nature reviews immunology 8, 411-420 (2008).
2 Cho, J. H. The genetics and immunopathogenesis of inflammatory bowel disease. Nat
Rev Immunol 8, 458-466, doi:10.1038/nri2340 (2008).
3 Hooper, L. V. Do symbiotic bacteria subvert host immunity. Nature reviews
microbiology 7, 367-374 (2009).
4 Suzuki, K., Maruya, M., Kawamoto, S. & Fagarasan, S. Roles of B-1 and B-2 cells in
innate and acquired IgA-mediated immunity. Immunological reviews 237, 180-190
(2010).
5 Macpherson, A. J., Geuking, M. B., Slack, E., Hapfelmeier, S. & McCoy, K. D. The
habit, double life, citizenship, and forgetfulness of IgA. Immunological reviews 245, 132-
146 (2012).
6 Tsuji, M. et al. Requirement for lymphoid tissue-inducer cells in isolated follicle
formation and T cell-independent immunoglobulin A generation in the gut. Immunity 29,
261-271, doi:10.1016/j.immuni.2008.05.014 (2008).
7 Macpherson, A. J., Geuking, M. B. & McCoy, K. D. Immunoglobulin A: a bridge
between innate and adaptive immunity. Curr Opin Gastroenterol 27, 529-533,
doi:10.1097/MOG.0b013e32834bb805 (2011).
8 Wei, M. et al. Mice carrying a knock-in mutation of Aicda resulting in a defect in
somatic hypermutation have impaired gut homeostasis and compromised mucosal
defense. Nat Immunol 12, 264-270, doi:10.1038/ni.1991 (2011).
9 Lycke, N. Y. & Bemark, M. The role of Peyer's patches in synchronizing gut IgA
responses. Front Immunol 3, 329, doi:10.3389/fimmu.2012.00329 (2012).
10 Brandtzaeg, P. History of Oral Tolerance and Mucosal Immunity. Annals of the New York
Academy of Sciences 778, 1-27 (1996).
11 Rojas, R. & Apodaca, G. Immunoglobulin transport across polarized epithelial cells. Nat
Rev Mol Cell Biol 3, 944-955, doi:10.1038/nrm972 (2002).
12 Musil, L. S. & Baenziger, J. U. Cleavage of membrane secretory component to soluble
secretory component occurs on the cell surface of rat hepatocyte monolayers. The journal
of cell biology 104, 1725-1733 (1987).
13 Brown, W. R., Newcomb, R. W. & Ishizaka, K. Proteolytic degradation of exocrine and
serum immunoglobulins. The journal of clinical investigation 49, 1374-1380 (1970).
14 Lindh, E. Increased resistance of immunoglobulin A dimers to proteolytic degradation
after binding of secretory component. The journal of immunology 114, 284-286 (1975).
15 Resendiz-Albor, A. A. et al. Regionalization of pIgR expression in the mucosa of mouse
small intestine. Immunol Lett 128, 59-67, doi:10.1016/j.imlet.2009.11.005 (2010).
16 Renston, R. H., Jones, A. L., Christiansen, W. D., Hradek, G. T. & Underdown, B. J.
Evidence for a vesicular transport mechanism in hepatocytes for biliary secretion of
immunoglobulin A. Science 208, 1276-1278 (1980).
17 Delacroix, D. L., Malburny, G. N. & Vaerman, J. P. Hepatobiliary transport of plasma
igA in the mouse: contribution to clearance of intravascular IgA. Eur J Immunol 15, 893-
899 (1985).
18 Mostov, K. E. Transepithelial transport of immunoglobulins. Annual review of
Immunology 12, 63-84 (1994).

161
19 Kaetzel, C. S. The polymeric immunoglobulin receptor: bridging innate and adaptive
immune responses at mucosal surfaces. Immunological reviews 206, 83-99 (2005).
20 Hamburger, A. E., Bjorkman, P. J. & Herr, A. B. Structural insights into antibody-
mediated mucosal immunology. Current topics in microbiology and immunology 308,
173-204 (2006).
21 Mostov, K. E. & Deitcher, D. L. Polymeric immunoglobulin receptor expressed in
MDCK cells transcytose IgA. Cell 46, 613-621 (1986).
22 Hirt, R. P. et al. Transcytosis of the polymeric Ig receptor requires phosphorylation of
serine 664 in the absence but not presence of dimeric IgA. Cell 74, 245-255 (1993).
23 Cardone, M. H., Smith, B. L., Song, W., Mochly-Rosen, D. & Mostov, K. E. Phorbol
myristate acetate-mediated stimulation of transcytosis and apical recycling in MDCK
cells. Journal of cell biology 124, 717-727 (1994).
24 Cardone, M. H. & Mostov, K. E. Wortmannin inhibits transcytosis of dimeric IgA by the
polymeric immunoglobulin receptor. Federation of European Biochemical Societies
letters 376, 74-76 (1995).
25 Song, W., Bomsel, M., Casanova, J., Vaerman, J. P. & Mostov, K. E. Stimulation of
transcytosis of the polymeric immunoglobulin receptor by dimeric IgA. Proc Natl Acad
Sci U S A 91, 163-166 (1994).
26 Giugliano, L. G., Ribeiro, S. T. G., Vainstein, M. H. & Ulhoa, C. J. Free secretory
component and lactoferrin of human milk inhibit the adhesion of enterotoxigenic
Escherichia coli. Journal of medical microbiology (1995).
27 de Araújo, A. N. & Giugliano, L. G. Lactoferrin and free secretory component of human
milk inhibit the adhesion of enteropathogenic Escherichia coli to HeLa cells. BMC
Microbiology 1 (2001).
28 Dallas, S. D. & Rolfe, R. D. Binding of Clostridium difficile toxin A to human milk
secretory component. Journal of medical microbiology 47, 879-888 (1998).
29 Asano, M. et al. Multiple cleavage sites for polymeric immunoglobulin receptor.
Immunology 112, 583-589, doi:10.1046/j.1365-2567.2004.01914.x (2004).
30 Asano, M. & Komiyama, K. Polymeric immunoglobulin receptor. Journal of oral science
53, 147-156 (2011).
31 Hooper, L. V. Molecular Analysis of Commensal Host-Microbial Relationships in the
Intestine. Science 291, 881-884, doi:10.1126/science.291.5505.881 (2001).
32 Bruno, M. E. C. et al. Regulation of the polymeric immunoglobulin receptor in intestinal
epithelial cells by Enterobacteriaceae: implications for mucosal homeostasis. Immunol
Invest 39, 356-382, doi:10.3109/08820131003622809 (2010).
33 Schneeman, T. A. et al. Regulation of the polymeric Ig receptor by signaling through
TLRs 3 and 4: linking innate and adaptive immune responses. The journal of immunology
175, 376-384 (2005).
34 Diebel, L. N. & Liberati, D. M. Disparate effects of bacteria and Toll-like receptor-
dependant bacterial ligand stimulation on immunoglobulin A transcytosis. J Trauma 70,
691-700, doi:10.1097/TA.0b013e31820c780e (2011).
35 Nakamura, Y. et al. Up-regulation of polymeric immunoglobulin receptor expression by
the heat-inactivated potential probiotic Bifidobacterium bifidum OLB6378 in a mouse
intestinal explant model. Scand J Immunol, doi:10.1111/j.1365-3083.2011.02645.x
(2011).

162
36 Cao, A. T., Yao, S., Gong, B., Elson, C. O. & Cong, Y. Th17 cells upregulate polymeric
Ig receptor and intestinal IgA and contribute to intestinal homeostasis. J Immunol 189,
4666-4673, doi:10.4049/jimmunol.1200955 (2012).
37 Hempen, P. M. et al. Transcriptional regulation of the human polymeric Ig receptor gene:
analysis of basal promoter elements. The journal of immunology 169, 1912-1921 (2002).
38 Johansen, F. E. & Kaetzel, C. S. Regulation of the polymeric immunoglobulin receptor
and IgA transport: new advances in environmental factors that stimulate pIgR expression
and its role in mucosal immunity. Mucosal Immunol 4, 598-602, doi:10.1038/mi.2011.37
(2011).
39 Frantz, A. L. et al. Targeted deletion of MyD88 in intestinal epithelial cells results in
compromised antibacterial immunity associated with downregulation of polymeric
immunoglobulin receptor, mucin-2, and antibacterial peptides. Mucosal Immunol 5, 501-
512, doi:10.1038/mi.2012.23 (2012).
40 Moreau, M. C., Ducluzeau, R., Guy-Grand, D. & Muller, M. C. Increase in the
population of duodenal immunoglobulin A plasmocytes in axenic mice associated with
different living of dead bacterial strains of intestinal origin. Infect Immun 21, 532-539
(1978).
41 Hapfelmeier, S. et al. Reversible Microbial Colonization of Germ-Free Mice Reveals the
Dynamics of IgA Immune Responses. Science 328, 1705-1709,
doi:10.1126/science.1188454 (2010).
42 Mattioli, C. A. & Tomasi, T. B. The life span of IgA plamsa cells from the mouse
intestine. J Exp Med 138, 452-460 (1973).
43 Johansen, F. E. et al. Absence of epithelial immunoglobulin A transport, with increased
mucosal leakiness, in polymeric immunoglobulin receptor/secretory component-deficient
mice. J Exp Med 190, 915-921 (1999).
44 Shimada, S. et al. Generation of polymeric immunoglobulin receptor-deficient mouse
with marked reduction of secretory IgA. The journal of immunology 163, 5367-5373
(1999).
45 Uren, T. K. et al. Role of the polymeric Ig receptor in mucosal B cell homeostasis. The
journal of immunology 170, 2531-2539 (2003).
46 Hendrickson, B. A. et al. Altered hepatic transport of immunoglobulin A in mice lacking
the J chain. Journal of experimenal medicine 182, 1905-1911 (1995).
47 Lycke, N., Erlandsson, L., Ekman, L., Schon, K. & Leanderson, T. Lack of J chain
inhibits the transport of gut IgA and abrogates the development of intestinal antitoxic
protection. The journal of immunology 163, 913-919 (1999).
48 Harriman, G. R. et al. Targeted deletion of the IgA constant region in mice leads to IgA
deficiency with alterations in expression of other Ig isotypes. The journal of immunology
162, 2521-2529 (1999).
49 Uren, T. K. et al. Vaccine-induced protection against gastrointestinal bacterial infections
in the absence of secretory antibodies. Eur J Immunol 35, 180-188,
doi:10.1002/eji.200425492 (2005).
50 Sun, K., Johansen, F. E., Eckmann, L. & Metzger, D. W. An important role for polymeric
Ig receptor-mediated transport of IgA in protection against Streptococcus pneumoniae
nasopharyngeal carriage. the journal of immunology 173, 4576-4581 (2004).

163
51 Sait, L. C. et al. Secretory antibodies reduce systemic antibody responses against the
gastrointestinal commensal flora. Int Immunol 19, 257-265, doi:10.1093/intimm/dxl142
(2007).
52 Suzuki, K. et al. Aberrant expansion of segmented filamentous bacteria in IgA-deficient
gut. Proc Natl Acad Sci U S A 101, 1981-1986, doi:10.1073/pnas.0307317101 (2004).
53 Robinson, J. K., Blanchard, T. G., Levine, A. D., Emancipator, S. N. & Lamm, M. E. A
mucosal IgA-mediated excretory immune system in vivo. The journal of immunology
166, 3688-3692 (2001).
54 Yel, L. Selective IgA deficiency. J Clin Immunol 30, 10-16, doi:10.1007/s10875-009-
9357-x (2010).
55 Strober, W., Krakauer, R., Klaeveman, H. L., Reynolds, H. Y. & Nelson, D. L. Secretory
Component Deficiency - A Disorder of the IgA Immune System. The New England
Journal of Medicine 294, 351-356 (1976).
56 Arsenescu, R. et al. Signature biomarkers in Crohn's disease: toward a molecular
classification. Mucosal Immunol 1, 399-411, doi:10.1038/mi.2008.32 (2008).
57 Savage, D. C., Dubos, R. & Schaedler, R. W. The gastrointestinal epithelium and its
autochthonous bacterial flora. Journal of experimenal medicine 127, 67-76 (1968).
58 Funkhouser, L. J. & Bordenstein, S. R. Mom knows best: the universality of maternal
microbial transmission. PLoS Biol 11, e1001631, doi:10.1371/journal.pbio.1001631
(2013).
59 Friswell, M. K. et al. Site and strain-specific variation in gut microbiota profiles and
metabolism in experimental mice. PLoS One 5, e8584, doi:10.1371/journal.pone.0008584
(2010).
60 Peterson, D. A., Frank, D. N., Pace, N. R. & Gordon, J. I. Metagenomic Approaches for
Defining the Pathogenesis of Inflammatory Bowel Diseases. Cell Host Microbe 3, 417-
427 (2008).
61 Nava, G. M., Friedrichsen, H. J. & Stappenbeck, T. S. Spatial organization of intestinal
microbiota in the mouse ascending colon. Isme J 5, 627-638, doi:10.1038/ismej.2010.161
(2011).
62 Hao, L. Y., Liu, X. & Franchi, L. Inflammasomes in inflammatory bowel disease
pathogenesis. Curr Opin Gastroenterol 29, 363-369,
doi:10.1097/MOG.0b013e32836157a4 (2013).
63 Garrett, W. S. et al. Enterobacteriaceae act in concert with the gut microbiota to induce
spontaneous and maternally transmitted colitis. Cell Host Microbe 8, 292-300,
doi:10.1016/j.chom.2010.08.004 (2010).
64 Elinav, E. et al. NLRP6 inflammasome regulates colonic microbial ecology and risk for
colitis. Cell 145, 745-757, doi:10.1016/j.cell.2011.04.022 (2011).
65 Zenewicz, L. A. et al. IL-22 deficiency alters colonic microbiota to be transmissible and
colitogenic. J Immunol 190, 5306-5312, doi:10.4049/jimmunol.1300016 (2013).
66 Ubeda, C. et al. Familial transmission rather than defective innate immunity shapes the
distinct intestinal microbiota of TLR-deficient mice. J Exp Med 209, 1445-1456,
doi:10.1084/jem.20120504 (2012).
67 Brinkman, B. M. et al. Gut microbiota affects sensitivity to acute DSS-induced colitis
independently of host genotype. Inflamm Bowel Dis 19, 2560-2567,
doi:10.1097/MIB.0b013e3182a8759a (2013).

164
68 Robertson, S. J. et al. Nod1 and Nod2 signaling does not alter the composition of
intestinal bacterial communities at homeostasis. Gut Microbes 4, 222-231,
doi:10.4161/gmic.24373 (2013).
69 Letran, S. E. et al. TLR5-deficient mice lack basal inflammatory and metabolic defects
but exhibit impaired CD4 T cell responses to a flagellated pathogen. J Immunol 186,
5406-5412 (2011).
70 Plaut, A. G., Gilbert, J. V., Artenstein, M. S. & Capra, J. D. Neisseria gonorrhoeae and
Neisseria meningitidis: extracellular enzyme cleaves human immunoglobulin A. Science
190, 1103-1105 (1975).
71 Kilian, M., Mestecky, J. & Schrohenloher, R. E. Pathogenic species of the genus
haemophilus and Streptococcus pneumoniae produce Immunoglobulin A1 protease.
Infect Immun 26, 143-149 (1979).
72 Male, C. J. Immunoglobulin A1 protease production by Haemophilus influenzae and
Streptococcus pneumoniae. Infect Immun 26, 254-261 (1979).
73 Senior, B. W., Albrechtsen, M. & Kerr, M. A. Proteus mirabilis strains of diverse type
have IgA protease activity. Journal of medical microbiology 24, 175-180 (1987).
74 Mulks, M. H. & Plaut, A. G. IgA protease production as a characteristic distinguishing
pathogenic from harmless neisseriaceae. The New England Journal of Medicine 299,
973-976 (1978).
75 Janoff, E. N. et al. Pneumococcal IgA1 protease subverts specific protection by human
IgA1. Mucosal Immunol 7, 249-256, doi:10.1038/mi.2013.41 (2014).
76 Fujiyama, Y. et al. A novel IgA protease from Clostridium sp. capable of cleaving IgA1
and IgA2 A2m(1) allotype but not IgA2 A2m(2) allotype paraproteins. The journal of
immunology 134, 573-576 (1985).
77 Loomes, L. M., Senior, B. W. & Kerr, M. A. A proteolytic enzyme secreted by Proteus
mirabilis degrades immunoglobulins of the immunoglobulin A1 (IgA1), IgA2, and IgG
isotypes. Infect Immun 58, 1979-1985 (1990).
78 Wassif, C., Cheek, D. & Belas, R. Molecular Analysis of a Metalloprotease from Proteus
mirabilis. Journal of bacteriology 177, 5790-5798 (1995).
79 Belas, R., Manos, J. & Suvanasuthi, R. Proteus mirabilis ZapA metalloprotease degrades
a broad spectrum of substrates, including antimicrobial peptides. Infect Immun 72, 5159-
5167, doi:10.1128/IAI.72.9.5159-5167.2004 (2004).
80 Spahich, N. A. & St. Geme, J. W. Structure and function of the Haemophilus influenzae
autotransporters. Frontiers in cellular and infection microbiology 1, 1-9 (2011).
81 Kapatais-Zoumbos, K., Chandler, D. K. F. & Barile, M. F. Survey of Immunoglobulin A
Protease Activity Among Selected Species of Ureaplasma and Mycoplasma: Specificity
for Host Immunoglobulin A. Infect Immun 47, 704-709 (1985).
82 Sato, T. et al. Single Lgr5 stem cells build crypt-villus structures in vitro without a
mesenchymal niche. Nature 459, 262-265, doi:10.1038/nature07935 (2009).
83 Miyoshi, H., Ajima, R., Luo, C. T., Yamaguchi, T. P. & Stappenbeck, T. S. Wnt5a
potentiates TGF-beta signaling to promote colonic crypt regeneration after tissue injury.
Science 338, 108-113, doi:10.1126/science.1223821 (2012).
84 Miyoshi, H. & Stappenbeck, T. S. In vitro expansion and genetic modification of
gastrointestinal stem cells in spheroid culture. Nat Protoc 8, 2471-2482,
doi:10.1038/nprot.2013.153 (2013).
165
85 Duizer, E., Penninks, A. H., Stenhuis, W. H. & Groten, J. P. Comparison of permeability
characteristics of the human colonic Caco-2 and rat small intestinal IEC-18 cell lines.
Journal of controlled release 49, 39-49 (1997).
86 Irvine, J. D. et al. MDCK (Madin-Darby canine kidney) cells: A tool for membrane
permeability screening. Journal of pharmaceutical sciences 88, 28-33 (1999).
87 Kuratnik, A. & Giardina, C. Intestinal organoids as tissue surrogates for toxicological and
pharmacological studies. Biochem Pharmacol 85, 1721-1726,
doi:10.1016/j.bcp.2013.04.016 (2013).
88 Sun, H., Chow, E. C. Y., Liu, S., Du, Y. & Pang, K. S. The Caco-2 cell monolayer:
usefulness and limitations. Expert opinion on drug metabolism and toxicology 4, 395-411
(2008).
89 Sambuy, Y. et al. The Caco-2 cell line as a model of the intestinal barrier: influence of
cell and culture-related factors on Caco-2 cell functional characteristics. Cell biology and
toxicology 21, 1-26 (2005).
90 Meunier, V., Bourrié, M., Berger, Y. & Fabre, G. The human intestinal epithelial cell line
Caco-2; pharmacological and pharmacokinetic applications. Cell biology and toxicology
11, 187-194 (1995).
91 Rousset, M. The human colon carcinoma cell lines HT-29 and Caco-2: two in vitro
models for the study of intestinal differentiation. Biochimie 68, 1035-1040 (1986).
92 Brandtzaeg, P. & Prydz, H. Direct evidence for an integrated function of J chain and
secretory component in epithelial transport of immunoglobulins. Nature 311, 71-73
(1984).
93 Mostov, K. E., Kraehenbuhl, J. P. & Blobel, G. Receptor-mediated transcellular transport
of immunoglobulin: synthesis of secretory component as multiple and large
transmembrane forms. Proc Natl Acad Sci U S A 77, 7257-7261 (1980).
94 Mostov, K. E., Verges, M. & Altschuler, Y. Membrane traffick in polarized epithelial
cells. Current opinion in cell biology 12, 483-490 (2000).
95 Blanch, V. J., Piskurich, J. F. & Kaetzel, C. S. Cutting Edge: Coordinate regulation of
IFN regulatory factor-1 and the polymeric Ig receptor by proinflammatory cytokines. The
journal of immunology 162, 1232-1235 (1999).
96 Piskurich, J. F. et al. Transcriptional regulation of the human polymeric immunoglobulin
receptor gene by interferon-y. Molecular immunology 34, 75-91 (1997).
97 Schjerven, H., Brandtzaeg, P. & Johansen, F. E. A Novel NFkB/Rel Site in Intron 1
Cooperates with Proximal Promoter Elements to Mediate TNFa-Induced Transcription
of the Human Polymeric Ig Receptor. The journal of immunology 167, 6412-6420 (2001).
98 Hayashi, M. et al. The polymeric immunoglobulin receptor (secretory component) in a
human intestinal epithelial cell line is up-regulated by interleukin-1. Immunology 92,
220-225 (1997).
99 Poltorak, A. et al. Defective LPS signaling in C3H/HeJ and C57BL/10ScCr mice:
mutations in Tlr4 gene. Science 282, 2085-2088 (1998).
100 Bloom, S. M. et al. Commensal Bacteroides species induce colitis in host-genotype-
specific fashion in a mouse model of inflammatory bowel disease. Cell Host Microbe 9,
390-403 (2011).
101 Schneider, C. A., Rasband, W. S. & Eliceiri, K. W. NIH Image to ImageJ: 25 years of
image analysis. Nature methods 9, 671-675 (2012).

166
102 Kang, S. S. et al. An antibiotic-responsive mouse model of fulminant ulcerative colitis.
Plos medicine 5, e41 (2008).
103 VanDussen, K. L. et al. Notch signaling modulates proliferation and differentiation of
intestinal crypt base columnar stem cells. Development 139, 488-497 (2012).
104 van Es, J. H. et al. Notch/gamma-secretase inhibition turns proliferative cells in intestinal
crypts and adenomas into goblet cells. Nature 435, 959-963 (2005).
105 Stevenson, B. R., Siliciano, J. D., Mooseker, M. S. & Goodenough, D. A. Identification
of ZO-1: a high molecular weight polypeptide associated with the tight junction (zonula
occludens) in a variety of epithelia. Journal of cell biology 103, 755-766 (1986).
106 Bretscher, A. & Weber, K. Villin: the major microfilament-associated protein of the
intestinal microvillus. Proc Natl Acad Sci U S A 76, 2321-2325 (1979).
107 O'Connor, D. T., Burton, D. & Deftos, L. J. Chromogranin A: immunohistology reveals
its universal occurrence in normal polypeptide hormone producing endocrine glands. Life
Sciences 33, 1657-1663 (1983).
108 Falk, P., Roth, K. A. & Gordon, J. I. Lectins are sensitive tools for defining
differentiation programs of mouse gut epithelial cell lineages. Am J Physiol Gastrointest
Liver Physiol G987-1003., G987-1003. (1994).
109 Cash, H. L., Whitham, C. V., Behrendt, C. L. & Hooper, L. V. Symbiotic bacteria direct
expression of an intestinal bactericidal lectin. Science 313, 1126-1130,
doi:10.1126/science.1127119 (2006).
110 Maunoury, R. et al. Villin expression in the visceral endoderm and in the gut anlage
during early mouse embryogenesis. EMBO Journal 11, 3321-3329 (1988).
111 Nakamura, Y. et al. Upregulation of Polymeric Immunoglobulin Receptor Expression by
the Heat-Inactivated Potential Probiotic Bifidobacterium bifidum OLB6378 in a Mouse
Intestinal Explant Model. Scand J Immunol 75, 176-183, doi:10.1111/j.1365-
3083.2011.02645.x (2012).
112 Ezeonu, I., Wang, M., Kumar, R. & Dutt, K. Density-dependent differentiation in
nontransformed human retinal progenitor cells in response to basic fibroblast growth
factor- and transforming growth factor-alpha. DNA and cell biology 22, 607-620 (2003).
113 Lee, Y. S., Yuspa, S. H. & Dlugosz, A. A. Differentiation of cultured human epidermal
keratinocytes at high cell densities is mediated by endogenous activation of the protein
kinase C signaling pathway. Journal of investigative dermatology 111, 762-766 (1998).
114 McBeath, R., Pirone, D. M., Nelson, C. M., Bhadriraju, K. & Chen, C. S. Cell shape,
cytoskeletal tension, and RhoA regulate stem cell lineage commitment. Developmental
Cell 6, 483-495 (2004).
115 Mestecky, J. e. a. Mucosal Immunology. (Academic Press, 2005).
116 Moon, C., VanDussen, K. L., Miyoshi, H. & Stappenbeck, T. S. Development of a
primary mouse intestinal epithelial cell monolayer culture system to evaluate factors that
modulate IgA transcytosis. Mucosal Immunol 7, 818-828, doi:10.1038/mi.2013.98
(2014).
117 Tsuji, M., Suzuki, K., Kinoshita, K. & Fagarasan, S. Dynamic interactions between
bacteria and immune cells leading to intestinal IgA synthesis. Semin Immunol 20, 59-66,
doi:10.1016/j.smim.2007.12.003 (2008).
118 Blutt, S. E. & Conner, M. E. The Gastrointestinal Frontier: IgA and Viruses. Front
Immunol 4, 402, doi:10.3389/fimmu.2013.00402 (2013).

167
119 Rakoff-Nahoum, S., Paglino, J., Eslami-Varzaneh, F., Edberg, S. & Medzhitov, R.
Recognition of commensal microflora by toll-like receptors is required for intestinal
homeostasis. Cell 118, 229-241, doi:10.1016/j.cell.2004.07.002 (2004).
120 Fagarasan, S. et al. Critical roles of activation-induced cytidine deaminase in the
homeostasis of gut flora. Science 298, 1424-1427 (2002).
121 Murthy, A. K., Dubose, C. N., Banas, J. A., Coalson, J. J. & Arulanandam, B. P.
Contribution of polymeric immunoglobulin receptor to regulation of intestinal
inflammation in dextran sulfate sodium-induced colitis. J Gastroenterol Hepatol 21,
1372-1380, doi:10.1111/j.1440-1746.2006.04312.x (2006).
122 Virgin, H. W. & Todd, J. A. Metagenomics and Personalized Medicine. Cell 147, 44-56
(2011).
123 Ichinohe, T. et al. Microbiota regulates immune defense against respiratory tract
influenza A virus infection. Proc Natl Acad Sci U S A 108, 5354-5359 (2011).