Host Hotels & ResoRts - AnnualReports.com · Host Hotels & ResoRts 2015 ANNUAl RePoRt. ... thereby...
17
HOST HOTELS & RESORTS 2015 ANNUAL REPORT
Transcript of Host Hotels & ResoRts - AnnualReports.com · Host Hotels & ResoRts 2015 ANNUAl RePoRt. ... thereby...

Host Hotels & ResoRts
2015 ANNUAl RePoRt

Financial HigHligHts(unaudited, in millions, except per share and hotel statistics) 2015 2014 2013
Operating Data
Revenues $ 5,387 $ 5,354 $ 5,166
Operating profit 650 710 512
Net income 571 747 325
Diluted Earnings per Common Share
Earnings from continuing operations $ 0.74 $ 0.96 $ 0.27
Diluted earnings $ 0.74 $ 0.96 $ 0.42
Diluted weighted average shares outstanding 752.9 786.8 747.9
Balance Sheet Data
Total assets $ 11,784 $ 12,172 $ 12,772
Total debt 4,017 3,957 4,717
Total equity 7,082 7,368 7,262
Other Data
Adjusted EBITDA(1) $ 1,409 $ 1,402 $ 1,306
NAREIT funds from operations per diluted share (1) 1.49 1.57 1.26
Adjusted funds from operations per diluted share (1) 1.54 1.50 1.31
Stock price on December 31st 15.34 23.77 19.44
Comparable Hotel Data(2)
Number of properties 96 96
Number of rooms 52,944 52,944
Average room rate (3) $ 220.11 $ 213.10
Average occupancy percentage 77.4% 77.0%
RevPAR (3) $ 170.34 $ 164.15
(1) NAREIT Funds From Operations (FFO) and Adjusted FFO per diluted share and Adjusted Earnings before Interest Expense, Income Taxes, Depreciation, Amortization and other items (Adjusted EBITDA) are non generally accepted accounting principles (GAAP) financial measures within the meaning of the rules of the Securities & Exchange Commission. These measures have been reconciled to comparable GAAP measures. See page 24 of this report.
(2) We define our comparable hotels as properties that are owned or leased by us and the operations of which are included in our consolidated results for the entirety of the reporting periods being compared, and that have not sustained substantial property damage or business interruption or undergone large-scale capital projects during the reporting periods being compared.
(3) Room revenue per available room (“RevPAR”) represents the combination of average daily room rate charged and the average daily occupancy achieved, and is a commonly used indicator of hotel performance. RevPAR does not include food and beverage or other ancillary revenues generated by the property. Average room rate and RevPAR are presented on a constant US$ basis, which presents 2014 results using the same exchange rates that were effective for the comparable periods in 2015, thereby eliminating the effect of currency fluctuation for the year-over-year comparisons.
Our Annual Report on Form 10-K filed with the Securities and Exchange Commission is included in our mailing to stockholders and together with this 2015 Annual Report forms our annual report to stockholders within the meaning of SEC rules.
O n t h e C O v e r : Acquired in June 2015, the PhOeniCian, a 643-room AAA-Five Diamond Luxury Collection Resort, ideally located in one of the premier resort markets in the Southwest. This iconic resort boasts a scenic 300-acre setting at the base of Camelback Mountain with outstanding views of the local natural landmark.

IconIc
ResoRts
sIgnatuRe
cIt y-centeR
Hotels
PRIme subuRban &
advantaged
aIRPoRt Hotels
F a i r m o n t K e a L a n i , m a u i
G r a n d H ya t t a t L a n t a i n B u c K H e a d
H ya t t r e G e n c y S a n F r a n c i S c o a i r p o r t
t H e r i t z - c a r L t o n , n a p L e S
G r a n d H ya t t W a S H i n G t o n
H ya t t r e G e n c y r e S t o n
H o t e L a r t S B a r c e L o n a( J o i n t V e n t u r e H o t e L )
S H e r a t o n B o S t o n H o t e L
n e W p o r t B e a c H m a r r i o t t H o t e L & S p a
t H e W e S t i n n e W y o r K G r a n d c e n t r a L
t H e W e S t i n W a L t H a m B o S t o n
B o S t o n m a r r i o t t c o p L e y p L a c e
t H e W e S t i n c H i c a G o r i V e r n o r t H
tHe WeStin SoutH coaSt pLaza, coSta meSa
IRRePl aceable
conventIon
destInatIon
PRoPeRtIes
Fort LauderdaLe marriott HarBor BeacH reSortt H e W e S t i n K i e r L a n d r e S o r t & S p a
S a n F r a n c i S c o m a r r i o t t m a r q u i Sm a r r i o t t m a r q u i S S a n d i e G o m a r i n a
J W m a r r i o t t r i o d e J a n e i r or e n a i S S a n c e p a r i S V e n d o m e H o t e L( J o i n t V e n t u r e H o t e L )
Premium brands & OPeratOrsPrime LOcatiOns & markets
With investments in 122 PrOPerties thrOughOut the united states and in 15 cOuntries
across the globe, we have an unmatched portfolio of quality assets. We have assembled a well-balanced portfolio within select major markets that benefit from strong demand generators that appeal to multiple customer segments, achieve premium rates, and have relatively higher barriers to entry. While we will continually evaluate and refine the portfolio, our primary focus is on the following property types:
3 icOnic resOrts 3 irrePLaceabLe cOnventiOn destinatiOn PrOPerties
3 signature city-center hOteLs 3 Prime suburban and advantaged airPOrt hOteLs
We strive for diversified exposure within multiple brands, focused asset classes, and favorable location types. Our hotels primarily are operated under brand names that are among the most respected and widely recognized in the lodging industry. Within these diversified brands, we focus predominately on the upper-upscale and luxury segments, as we believe they have a broad appeal for both the individual and group leisure and business customer. We believe the combination of a superior portfolio, disciplined capital allocation, strong asset management and powerful and flexible capital structure put us in a position to achieve our goals and to drive stockholder value.
the brands and logos listed above are the trademarks of our managers or their affiliates. the trademarked names and their logos are the property of their respective owners and are being used with the express permission of their owners. none of the owners of these trademarks has any responsi-bility or liability for any information contained in this annual report.

| h
Ost
hO
teLs
& r
esO
rts
20
15
3
| h
Ost
hO
teLs
& r
esO
rts
20
15
2
3 We repaid or refinanced more than $1.4 billion in debt, reducing our weighted average interest rate by 110 basis points and extending our average debt maturity to six years, all of which further bolstered our industry-leading balance sheet.
We delivered solid improvements in operating performance in 2015 as RevPAR at our comparable hotels increased 3.8% (on a constant US Dollar basis). Despite being impacted by significant renovation activity during the first half of the year and adverse economic headwinds in the fourth quarter, we recorded the highest comparable RevPAR in our his-tory, $170.34, driven by occupancy levels of 77.4% and average rates of over $220, far exceeding the industry average, and helping to deliver Adjusted EBITDA of over $1.4 billion and net income of $571 million. Adjusted FFO, which directly reflects our balance sheet initiatives, including our efforts to reduce our annual interest payments and return capital to stockholders, improved to $1.54 per share for the year, while diluted earnings per share was $0.74.
For 2016, we expect to continue to execute on our strategic initiatives to drive stockholder value. We expect to complete our exit from our Asia/Pacific markets, thereby simplifying our portfolio and streamlining our focus on North American and European gateway markets. We will continue to focus on creating and mining value from our existing portfolio through capital investments and value enhancement initiatives. We will continue to leverage our experience as the owner of one of the largest and most diverse lodging portfolios to seek to differentiate our assets within their competitive markets, driving improvements in operating performance and enhancing the value of the real estate. While we recognize the volatility of the lodging industry, particularly during the uncertain global macro-economic atmosphere, we intend to continue to deliver value to our stockholders through earnings growth, a meaningful dividend and the continued execution of our stock repurchase program. We are confident that our combination of superior assets, financial strength, and management expertise will continue to create an attractive opportunity for investors. We appreciate your support and will continue to work to provide superior returns to our stockholders.
W. edWard WaLterPresident and Chief Executive Officer
richard e. marriOttChairman of the Board
march 17, 2016
Host Hotels & Resorts is the premier lodging real estate investment company with a com-mitment to a long-term strategic focus. We have thoughtfully assembled and refined a geographically-diverse portfolio of high-quality assets. We have created stockholder value through disciplined allocation of capital and intelligent asset management oversight. We have built on the bedrock of a powerful and flexible capital structure to enable us to be opportunistic at any point throughout the lodging cycle. We are confident in the future of our business and from the boardroom to the back office we are focused on delivering real value to our stockholders.
Reflecting on our performance in 2015, we had a very active year and executed on a number of initiatives to capitalize on value enhancing opportunities to better position Host for continued growth and success.
3 We invested over $1 billion in 2015, including the acquisition of the iconic, AAA-Five Diamond luxury resort, the Phoenician Hotel. We also completed four comprehensive redevelopment and rebranding projects at The Camby in Phoenix, The Logan in Philadelphia, The Axiom in San Francisco and the Houston Airport Marriott at George Bush Intercontinental, while also completing the renovations of 8,000 guestrooms across the portfolio.
3 We sold over $1 billion in hotels, including properties owned in our European and Asia/Pacific joint ventures, further sharpening the portfolio’s focus on major markets.
3 We returned over $1.3 billion of capital to our stockholders through $650 million of dividends and $675 million of stock repurchases that were completed at a significant discount to the estimated net asset value of our assets.
W. edWard WaLterPresident and Chief Executive Office
richard e. marriOttChairman of the Board
To our
STockholderS
| $1.3+ |billion
Returned to stockholders
| 38% |Increase in cash dividends paid
in 2015 compared to 2014
| 77.4% |Highest comparable hotel
occupancy since 2000
| $170 |Record level comparable
hotel RevPaR
t o t a l R e t u R n t o s t o c k H o l d e R s
(in millions)
$0
$300
$600
$900
$1,200
$1,500
201520142013
H o t e l s b y P R o P e R t y t y P e
(as a percent of 2015 revenues)
3 icOnic resOrts 15%
3 irrePLaceabLe cOnventiOn destinatiOn hOteLs 38%
3 signature city-center hOteLs 27%
3 Prime suburban & advantaged airPOrt hOteLs 11%
3 Other 9%
3 stOck buyback
3 dividends Paid

Luxury resorts rooMs Meeting space (Sq Ft)
the phoenician, a Luxury collection resort 643 165,000
Hotel arts Barcelona* 483 9,800
Fairmont Kea Lani, Maui 450 36,000
the ritz-carlton, naples 450 42,000
the ritz-carlton, amelia island 446 48,000
the ritz-carlton golf resort, naples 295 16,500
upper-upscaLe resorts
Hyatt regency Maui resort and spa 806 100,000
the Westin Kierland resort & spa 732 200,000
Fort Lauderdale Marriott Harbor Beach resort & spa 650 67,000
coronado island Marriott resort & spa 300 27,000
*Hotel owned through joint venture.
| 10 |signature HoteLs
| 5,255 |rooMs
| 108 |HoLes oF goLF
| 711,300 | sF oF Meeting space
Our icOnic resOrt prOperties are lOcated in prime lOcatiOns
and feature timeless architecture with high-end amenities.
curated by premier OperatOrs, these prOperties are in markets
with strOng airlift and limited supply grOwth.
icOnic resOrts
r i g H t : t H e p H o e n i c i a n , a L u x u r y c o L L e c t i o n r e s o r t
t H e r i t z - c a r L t o n , a M e L i a i s L a n d c o r o n a d o i s L a n d M a r r i o t t r e s o r t & s pa
L e F t : a x i o M H o t e L
| h
Ost
hO
tels
& r
esO
rts
20
15
7
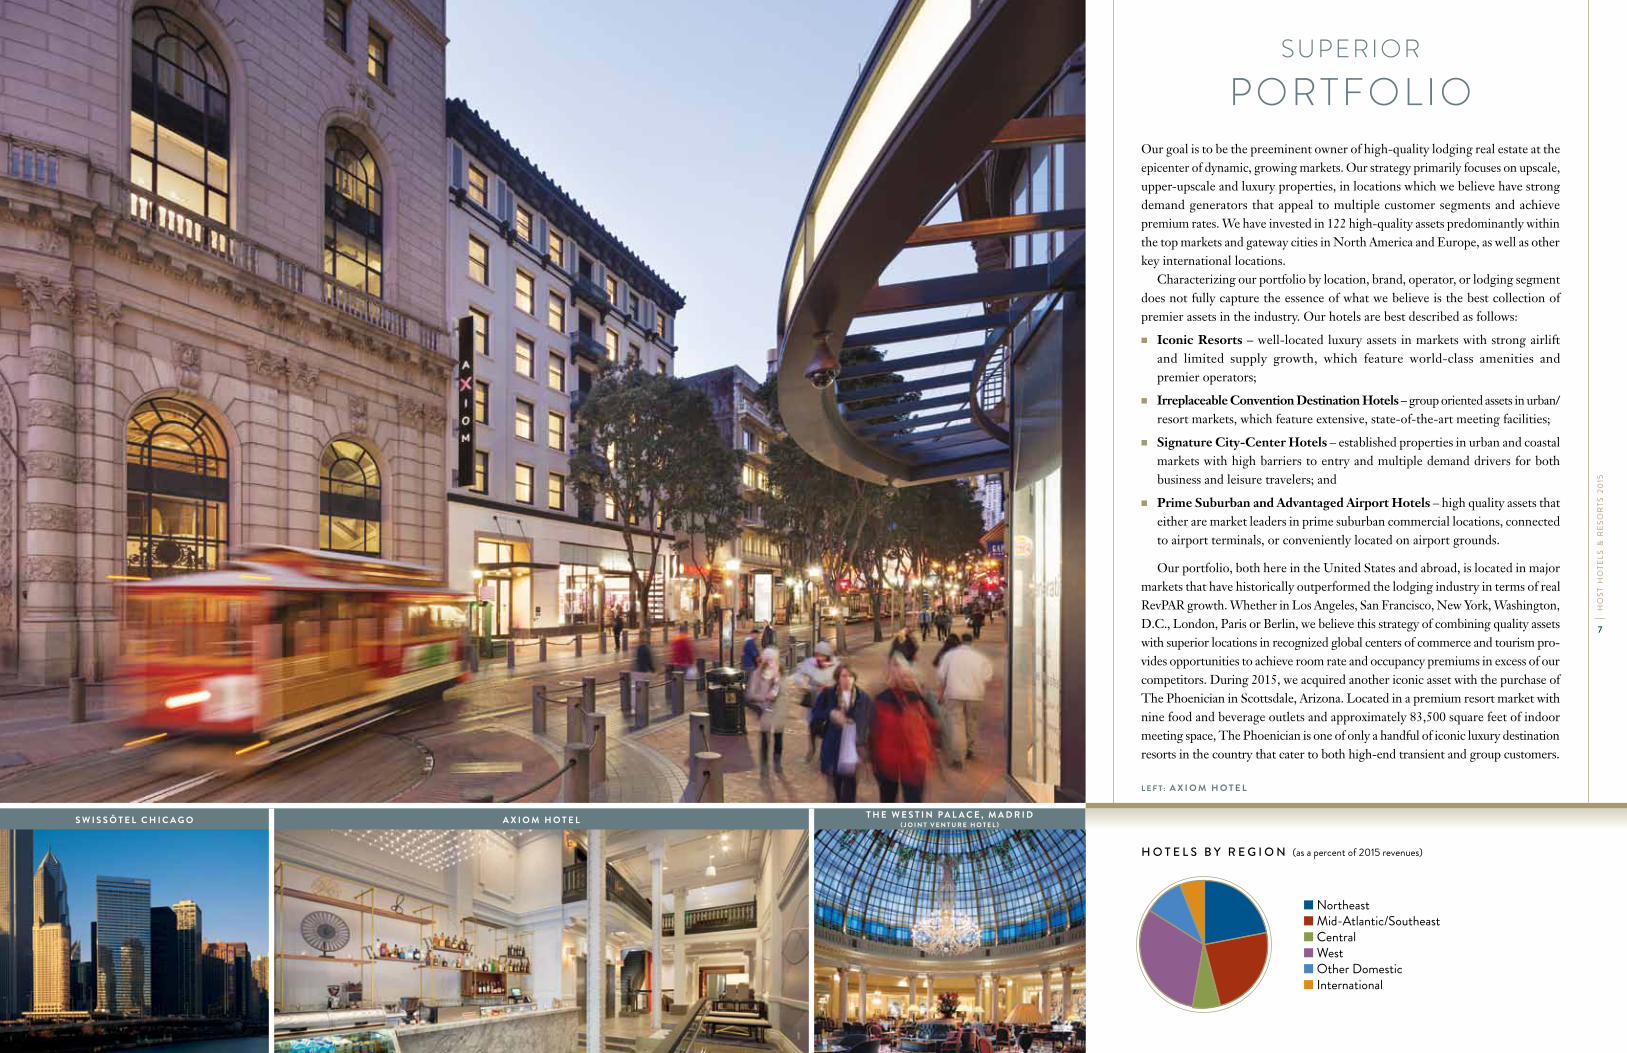
Our goal is to be the preeminent owner of high-quality lodging real estate at the epicenter of dynamic, growing markets. Our strategy primarily focuses on upscale, upper-upscale and luxury properties, in locations which we believe have strong demand generators that appeal to multiple customer segments and achieve premium rates. We have invested in 122 high-quality assets predominantly within the top markets and gateway cities in North America and Europe, as well as other key international locations.
Characterizing our portfolio by location, brand, operator, or lodging segment does not fully capture the essence of what we believe is the best collection of premier assets in the industry. Our hotels are best described as follows:
3 Iconic Resorts – well-located luxury assets in markets with strong airlift and limited supply growth, which feature world-class amenities and premier operators;
3 Irreplaceable Convention Destination Hotels – group oriented assets in urban/resort markets, which feature extensive, state-of-the-art meeting facilities;
3 Signature City-Center Hotels – established properties in urban and coastal markets with high barriers to entry and multiple demand drivers for both business and leisure travelers; and
3 Prime Suburban and Advantaged Airport Hotels – high quality assets that either are market leaders in prime suburban commercial locations, connected to airport terminals, or conveniently located on airport grounds.
Our portfolio, both here in the United States and abroad, is located in major markets that have historically outperformed the lodging industry in terms of real RevPAR growth. Whether in Los Angeles, San Francisco, New York, Washington, D.C., London, Paris or Berlin, we believe this strategy of combining quality assets with superior locations in recognized global centers of commerce and tourism pro-vides opportunities to achieve room rate and occupancy premiums in excess of our competitors. During 2015, we acquired another iconic asset with the purchase of The Phoenician in Scottsdale, Arizona. Located in a premium resort market with nine food and beverage outlets and approximately 83,500 square feet of indoor meeting space, The Phoenician is one of only a handful of iconic luxury destination resorts in the country that cater to both high-end transient and group customers.
Superior
portfolio
s W i s s Ô t e L c H i c a g o a x i o M H o t e L t H e W e s t i n p a L a c e , M a d r i d( J o i n t V e n t u r e H o t e L )
H o t e l s b y R e g i o n (as a percent of 2015 revenues)
3 northeast3 mid-atlantic/southeast3 central3 west3 Other domestic3 international
3
3
3
3
3
3
3
3
3
3
Other Domestic Central International Sheraton Northeast Hilton / Embassy Suites West Novotel, ibis, Pullman Other/Independent Mid-Atlantic / Southeast

L e F t : o r L a n d o W o r L d c e n t e r M a r r i o t t
| 15 | signature assets
| 49% | group Mix
| 19,499 |rooMs
| 1.7mIllIon | sF oF Meeting space
Hyatt regency WasHington on capitoL HiLL t H e W e s t i n s e a t t L e
irrepl aceable cOnventiOn destinatiOns
Our irreplaceable, grOup-Oriented destinatiOn hOtels are
situated in urban and resOrt markets and feature extensive and
high-caliber meeting facilities, many cOnnected tO prOminent
cOnventiOn centers.
urBan core group Focused HoteLs rooMs Meeting space (Sq Ft)
new york Marriott Marquis 1,966 130,300
sheraton new york times square Hotel 1,780 60,000
Manchester grand Hyatt san diego 1,628 125,000
san Francisco Marriott Marquis 1,500 117,000
Marriott Marquis san diego Marina 1,360 80,000
new orleans Marriott 1,333 80,000
sheraton Boston Hotel 1,220 70,000
Boston Marriott copley place 1,144 70,000
sheraton san diego Hotel & Marina 1,053 120,000
san antonio Marriott rivercenter 1,001 100,000
grand Hyatt Washington 897 42,000
the Westin seattle 891 55,000
Hyatt regency Washington on capitol Hill 838 38,000
destination group Focused HoteLs
orlando World center Marriott 2,004 399,200
JW Marriott desert springs resort & spa 884 232,700

| h
Ost
hO
tels
& r
esO
rts
20
15
10
Guided by a strategic long-term view, our goal is to allocate and recycle capital to earn
returns that exceed our risk-adjusted cost of capital in locations that we expect to
outperform in the long term, creating the greatest value and strong returns on invest-
ments for our stockholders. We seek to earn these returns by creating and mining value
from our existing portfolio through capital investments and value enhancement initia-
tives and appropriately matching each hotel within its specific market with the best
operator and brand to optimize operating performance. In line with this approach, we
invested more than $1 billion in new assets and capital improvements in 2015. We
acquired The Phoenician in Scottsdale, Arizona for $400 million. We invested
$275 million in redevelopment, return on investment, and acquisition capital expen-
ditures to increase cash flow and improve profitability by capitalizing on changing
market conditions and the favorable locations of our properties. During 2015, these
projects included our strategic asset repositioning initiatives for four properties: The
Logan, The Camby Hotel, The Axiom Hotel and the Houston Airport Marriott at
George Bush Intercontinental. Each of these hotels has been completely repositioned
and three will be operated by a new management company. Additionally, we invested
$388 million in renewal and replacement capital expenditures to maintain the quality
and competitiveness of our hotel properties and enhance customer satisfaction. We
also negotiated new franchise or management agreements at a total of six properties
during the year.
Additionally, we look to refine our portfolio through the sale of non-core assets
where we believe the potential for growth is constrained or properties with significant
capital expenditure requirements that we do not believe would generate a return on
the investment. During the last 14 months, we successfully completed the sale of 20
assets, including assets held in joint ventures, for a total of $1 billion of asset sales.
Proceeds from the sales have been utilized as a source of funds for our stock repurchase
program, capital expenditure programs and other corporate objectives.
DiSciplineD
capital allocation| $1+billion |
invested in new assets or capital improvements
in 2015
| $1+billion |Hotels sold, including joint venture hotels
| $1+billion |over $1b value enhancement /
redevelopment and Roi projects since 2010
H o u s t o n a i r p o r t M a r r i o t t a t g e o r g e B u s H i n t e r c o n t i n e n t a L t H e W e s t i n i n d i a n a p o L i s
r i g H t : t H e L o g a n
Rede v e lopme n t / Roi a n d va lue
enHance me n t p Rojects(in millions)
201520142013
$175 $165
$275

atLantathe Westin Buckhead atlantagrand Hyatt atlanta in Buckheadthe ritz-carlton, BuckheadJW Marriott atlanta Buckheadatlanta Marriott suites Midtown
BostonHyatt regency cambridge, overlooking Boston
cHicagothe Westin chicago river northswissôtel chicagoembassy suites by Hilton chicago downtown
Magnificent Milecourtyard chicago downtown/river north
denVerthe Westin denver downtown
HaWaiiHyatt place Waikiki Beach
Houstonthe st. regis HoustonJW Marriott Houston
MiaMiMiami Marriott Biscayne Bay
neW yorK W new york - union squareW new yorkthe Westin new york grand centralnew york Marriott downtown
pHiLadeLpHiathe Logan
pHoenixthe camby Hotel
san Franciscoaxiom Hotelsan Francisco Marriott Fisherman’s Wharf
seattLeW seattle
WasHington, d.c.JW Marriott Washington dcthe Westin georgetown, Washington d.c.Washington Marriott at Metro centerthe ritz-carlton, tysons cornerresidence inn arlington pentagon city Key Bridge Marriott
otHer u.s. citiesthe Westin cincinnatithe Westin indianapolisMinneapolis Marriott city centersan antonio Marriott riverwalkHyatt place nashville downtown*sheraton Memphis downtown
internationaLJW Marriott Hotel rio de JaneiroJW Marriott Hotel Mexico citycalgary Marriott downtowntoronto Marriott downtown eaton
centre HotelHilton Melbourne south Wharfsheraton Berlin grand Hotel esplanade*Le Méridien piccadilly*renaissance paris Vendôme Hotel*the Westin palace, Madrid*renaissance amsterdam Hotel*Brussels Marriott Hotel grand place*sheraton stockholm Hotel*
*Hotels owned through joint ventures
| 48 | signature assets
| 20,117 | rooMs
| 896,028 | sF oF Meeting space
$/| $219 |
aVerage daiLy rate ForconsoLidated HoteLs
Our signature assets in cities with high barriers tO entry, these
hOtels are lOcated in prime urban and cOastal lOcatiOns and
bOast features that are extremely desirable fOr bOth business
and leisure travelers.
s ignature cit y-center hOtels
L e F t : L e M é r i d i e n p i c c a d i L L y ( J o i n t V e n t u r e H o t e L )
t H e W e s t i n d e n V e r d o W n t o W nM i a M i M a r r i o t t B i s c a y n e B a y

L e F t : t H e c a M B y H o t e L
| h
Ost
hO
tels
& r
esO
rts
20
15
15
We believe our experienced team creates value through careful application of
intelligent asset management and capital investment decision making. We are in
a unique position to work with our managers to drive operating performance and
implement value-added real estate decisions. Our asset managers are supported
by a feasibility team that provides independent underwriting of ROI and value-
enhancement projects, as well as dedicated resources around business intelligence,
revenue management and restaurant and bar operations. We also carefully evaluate
and monitor our property agreements, including our management and franchise
agreements, in an effort to obtain flexibility and drive overall value.
At the brand and manager levels, our industry leading proprietary business
intelligence system drives better results through brand benchmarking, allowing
executive focus on underperforming assets and the ability to ensure brand-level
programs, technology investment and resource deployment are beneficial to Host.
Our frequent evaluations of brands and operators ensure optimum allocation of
sales resources and allow us to guide digital and e-commerce strategies that improve
RevPAR performance and reduce costs. Our concentrated market ownership
provides greater insights and an intuitive feel for local demand generators that
focus our operators on increasing market share of group business, driving stronger
group revenues, higher transient rates, and incremental banquet revenue.
At the individual asset-level, our asset managers establish and monitor key
performance indicators annually, while conducting deep dives on operations to
identify and implement cost savings. We leverage external consultants, skilled in
refining and evaluating operating procedures to find new ways to reduce cost and
drive profitability, including reviewing hotel and market pricing, segment mix,
distribution, and merchandising. We look to improve overall banquet and catering
revenue at the individual asset level through improved function space management,
better group contribution, and advanced analytics. As a result of these efforts, food
and beverage profit at our comparable hotels increased over 10% during the year.
Ultimately, our goal is to differentiate our assets within their competitive
market, drive operating performance and enhance the value of the real estate.
Strong
aSSet ManageMent
s a n F r a n c i s c o M a r r i o t t F i s H e r M a n ’ s W H a r F M a r r i o t t M a r q u i s s a n d i e g o M a r i n a a n d M a n c H e s t e r g r a n d H ya t t s a n d i e g o H ya t t p L a c e n a s H V i L L e d o W n t o W n
( J o i n t V e n t u r e H o t e L )
3
3
3
3
3
3
3
3
3
3
Ritz Carlton W, St. Regis, Luxury Collection The Westin, Le Meridien Sheraton Hyatt Hilton / Embassy Suites Fairmont Novotel, ibis, Pullman Other/Independent Marriott
H o t e l s b y b R a n d (as a percent of 2015 revenues)
3 marriott, Jw marriott, autograph collection, residence inn
3 ritz-carlton3 w, the luxury collection,
st. regis3 the westin, le meridien3 sheraton
3 grand hyatt, hyatt place, hyatt regency
3 hilton, curio, embassy suites
3 fairmont, swissôtel3 novotel, ibis, pullman3 Other/independent

| 19 | signature assets
| 8,087 | rooMs
| 417,700 | sF oF Meeting space
%/| 5.2% |
increase in reVpar ForconsoLidated HoteLs
s c o t t s d a L e M a r r i o t t a t M c d o W e L L M o u n t a i n s
H o u s t o n a i r p o r t M a r r i o t t a t g e o r g e B u s H i n t e r c o n t i n e n t a L
r i g H t : t H e r i t z - c a r L t o n , M a r i n a d e L r e y
priMe suBurBan rooMs Meeting space (Sq Ft)
santa clara Marriott 759 27,000
newport Beach Marriott Hotel & spa 532 25,000
Hyatt regency reston 518 32,000
Houston Marriott at the texas Medical center 394 8,500
the Westin south coast plaza, costa Mesa 390 35,000
Marina del rey Marriott 370 18,000
san ramon Marriott 368 16,500
the Westin Waltham Boston 351 20,500
atlanta Marriott perimeter center 341 16,800
renaissance paris La defense Hotel* 327 7,500
the ritz-carlton, Marina del rey 304 30,000
scottsdale Marriott at Mcdowell Mountains 266 14,000
newport Beach Marriott Bayview 254 3,800
scottsdale Marriott suites old town 243 8,700
adVantaged airport
Hyatt regency san Francisco airport 789 54,000
newark Liberty international airport Marriott 591 27,400
Houston airport Marriott at george Bush intercontinental 573 30,000
philadelphia airport Marriott 419 17,700
tampa airport Marriott 298 25,300
*Hotel owned through joint venture.
prime suburban & advantaged airpOrt hOtels
when city dwellers and travelers lOOk fOr cOnvenience and relaxatiOn, they visit One Of these hOtels.
these prOperties are prOven tO be market leaders in prime suburban lOcatiOns Or are strategically lOcated at advantaged airpOrt terminals Or near airpOrt grOunds.

| h
Ost
hO
tels
& r
esO
rts
20
15
19
We have remained focused on maintaining a flexible capital structure that allows us to
execute our strategy throughout the lodging cycle. We believe that a strong balance
sheet is a key competitive advantage that affords us a lower cost of capital and positions
us for external growth. As such, we remain committed to maintaining an investment
grade rating and have structured our debt profile to maintain financial flexibility and
a balanced maturity schedule.
During the year, we leveraged favorable market conditions and our investment
grade rating to repay or refinance $1.4 billion of debt. We decreased our weighted
average interest rate by 110 basis points, to 3.7%, and extended our weighted average
debt maturity by 0.8 years, to 6.0 years, with no more than 21% of our outstanding
debt due in any given year, further strengthening one of the best balance sheets in
the entire REIT space.
We have strategically maximized the flexibility of our balance sheet by minimizing
the number of properties with secured debt, as only 6 of our hotels are encumbered
by mortgages, and more than 90% of our debt consists of senior notes and borrow-
ings under our credit facility. At year end, we had a debt balance of $4 billion and
approximately $702 million of available capacity under the revolver portion of our
credit facility.
Our balance sheet continues to be one of the strongest in the industry, and achieves
our overall balance sheet goal of a 2.5x to 3.0x leverage ratio. Since 2010, we have
increased our fixed charge coverage ratio, as defined in our credit facility, by 3.5 times,
making it the strongest in our history. Our strong financial credit statistics reduce
our overall cost of capital and earnings volatility and increase access to capital, thereby
allowing us to take advantage of investment opportunities so we can continue to focus
on providing stockholder value.
powerful anD flexible
capital Structure| 3.7% |
Weighted average interest rate at 12/31/15. a 250 bps
decrease since 2010
| $24 |million
decrease in annualized interest expense due to debt repayments
and refinancing in 2015
| $1.4 |billiondebt repaid or
refinanced in 2015
W n e W y o r K – u n i o n s q u a r es H e r at o n s a n d i e g o H o t e L & M a r i n a
L e F t : H ya t t p L a c e W a i K i K i B e a c H
d e b t b a l a n c e s(in millions)
$0
$1,000
$2,000
$3,000
$4,000
$5,000
201520142013
3 secured debt
3 unsecured debt

| h
Ost
hO
tels
& r
esO
rts
20
15
20
Corporate Responsibility is our strategic approach to managing the environmental,
social and governance (ESG) impacts for our business. We are committed to
enhancing the value and profitability of our hotels and driving investor returns
through sustainable business practices.
stRategy and commitmentsOur strategy focuses on three themes:
3 Responsible Investment: We invest in proven sustainability practices that
we believe enhance the profitability and valuation of our assets.
3 Environmental Stewardship: We establish measurable goals and actively
monitor progress toward reducing the environmental footprint of our proper-
ties, including a reduction of energy consumption, greenhouse gas emissions
and water usage.
3 Corporate Citizenship: We strengthen our local communities through direct
financial support, community engagement and volunteer service.
We have developed policies and procedures for corporate responsibility that
cover a wide array of ESG issues. They help guide our development and value
enhancement projects, including how we engage with our suppliers, employees,
third-party management companies, contractors and communities. Our execu-
tion of this strategy is carefully monitored at the highest levels of our company,
including our President and Chief Executive Officer, the Nominating and
Corporate Governance Committee of our Board of Directors and members of
senior management.
reSponSible
corporate citizen
Harnessing tHe poWer oF tHe sunin 2015, we brought 1.2 megawatts of clean, renewable power on-line at two properties and had another project under construction, totaling 1.7 megawatts. this represents sufficient energy to power over 350 average-sized u.s. homes. the Hyatt regency Maui resort and spa boasts one of the largest rooftop solar photovoltaic arrays on maui. the solar panels at the recently acquired tHe pHoenician, a Luxury coLLection resort were also designed to shade vehicles from the harsh desert sun by being installed atop parking structures. When complete in 2016, the FairMont Kea Lani’s system will generate over 10% of the property’s total annual electrical usage. the solar thermal panels at the Hyatt Ka’anapaLi BeacH, a Hyatt residence cLuB supplement an estimated 15% of the property’s domestic hot water.
H ya t t K a ’ a n a p a L i B e a c H , a H ya t t r e s i d e n c e c L u BH ya t t r e g e n c y M a u i r e s o r t a n d s p aH ya t t K a ’ a n a p a L i B e a c H ,
a H ya t t r e s i d e n c e c L u B
r i g H t : F a i r M o n t K e a L a n i , M a u i

| h
Ost
hO
teLs
& r
esO
rts
20
15
23
| h
Ost
hO
teLs
& r
esO
rts
20
15
22
aWaRds, RecognItIons and ceRtIFIcatIons
3 CDP: Recognized as an S&P 500 climate change leader, achieving a position on the 2015 Climate
Disclosure Leadership Index and among the 5% of respondents included on CDP’s 2015 Global
“A” List.
3 Global Real Estate Sustainability Benchmark: Named 2015 Global and North American
Regional Sector Leader for top performance within the hotels sector and designated as a “Green
Star” for outstanding management and implementation of key sustainability issues.
3 National Association of Real Estate Investment Trusts (NAREIT): Received NAREIT’s
2015 Lodging/Resorts Leader in the Light award, as one of the REIT industry’s leading com-
panies in the area of sustainability.
3 TripAdvisor®: 96 of Host’s eligible properties have been recognized with a TripAdvisor
GreenLeaders Badge.
outlookOur 2015 achievements were made possible through the dedication of our employees and in close
collaboration with the third-party management companies responsible for the daily operations at
our hotels. In 2016, we will continue to identify, validate and execute on viable projects and track
our progress against our three themes, while developing new goals for future years that build on
our past success.
Through engagement with key stakeholders, we continue to monitor critical issues and oppor-
tunities related to climate change, water and sustainable development that impact the lodging and
real estate industry.
Visit the Corporate Responsibility section on our website for more information.
mIlestones and PeRFoRmance HIgHlIgHts
Responsible Investment
3 Invested in over 150 sustainability projects to improve the environmental and financial perfor-
mance of our properties, including our first renewable energy projects.
3 Established long-term capital investment plans to improve efficiency and conserve
natural resources through the implementation of energy-efficient, water-efficient and low
carbon technologies.
Environmental Stewardship
3 Reduced greenhouse gas emissions by 18.2%, surpassing our 2017 goal of a 12% reduction.
3 Achieved 14.7% reduction in water use per occupied room, nearly reaching our 2017 goal of a
15% reduction from 2008 levels.
3 Diverted more than 560 tons of waste from landfill as part of our construction and
renovation projects.
Corporate Citizenship
3 Volunteered more than 440 hours of community service (across six company-organized
service events).
3 Contributed to over 160 charities and programs to support local communities and address
targeted issues, including public health and youth empowerment.
2015 RecognItIon
SourcinG SuStainaBLyWe actively engage with our network of over 300 design, construction and renovation suppliers and develop strategic relationships that foster innovative and environmentally responsible business practices, which include the use of recycled, local, low volatile organic compound and third-party certified materials for our construction and renovation projects. We also partner with project managers and designers to support our sustainable sourcing objectives. the axiom HoteLtm, designed to achieve leed silver certification, offers sustainable features such as a high efficiency Hvac system with integrated energy management, led lighting, and is conveniently located near public transportation. at tHe camBy HoteL, there are filtered ice and water stations at the club lounge, spa and kitchen for banquets.
unitinG to Support our communityour employees ignited their collective passion and character through our 2015 fundraising activities and community service projects. We were recognized in 2015 as a top fundraising team in Washington, d.c. for the St. Jude WaLK to end cHiLdHood cancer, raising over $114,000 for St. Jude cHiLdren’S reSearcH HoSpitaL®. our employees volunteered over 240 hours to teach financial literacy to local students in collaboration with junior achievement. they also assembled dog toys and privacy curtains at the WaSHinGton Humane Society to supplement a donation of over 250 pet-related items collected for the shelter animals.
| 150+ |number of sustainability projects
we invested in to improve the environmental and financial
performance of our properties
| 84% |Percentage of our u.s. hotels
that have a green building certification including leed®, eneRgy staR, tripadvisor®
greenleaders, green key eco-Rating Program or
green seal Hotels and lodging
| $114+ |Thousand
Raised for st. jude children’s Research Hospital
a x i o m H o t e L t H e c a m B y H o t e L J u n i o r a c H i e V e m e n t Wa S H i n G t o n H u m a n e S o c i e t y
CLIMATE
2015
Sustainable Real Estate Pract ices

| H
OST
HO
TELS
& R
ESO
RTS
20
15
24
Selected Financial dataReconciliation of Net income to NAREIT and Adjusted Funds From Operations per Diluted Share (a)
Year ended december 31,
(UnaUdITed, In mILLIOns, eXcePT Per sHare amOUnTs) 2015 2014 2013
neT IncOme $ 571 $ 747 $ 325 Less: net income attributable to non-controlling interests (13) (15) (8)
neT IncOme avaILabLe TO cOmmOn sTOckHOLders 558 732 317adjustments: Gain on dispositions, net of taxes (93) (232) (97) Gain on property insurance settlement (2) (1) — depreciation and amortization 712 692 703 non-cash impairment loss — 6 1 equity in (earnings) losses of affiliates (70) (26) 17 Pro rata FFO of equity investments 45 51 26 FFO adjustment for non-controlling partnerships (9) (9) (8) FFO adjustments for non-controlling interests of Host LP (7) (6) (8)
nareIT funds from operations 1,134 1,207 951adjustments to nareIT FFO: Loss on debt extinguishment 45 4 40 acquisition costs 1 3 1 recognition of deferred gain on land condemnation — — (11) Litigation (gain) loss — (61) 8
adjusted FFO $1,180 $1,153 $ 989
adjustments for dilutive securities (b): assuming conversion of exchangeable senior debentures $ 22 $ 27 $ 26
diluted nareIT FFO (a) $1,156 $1,234 $ 977
diluted adjusted FFO (a) $1,202 $1,180 $1,015
diluted weighted average shares outstanding – ePs 752.9 786.8 747.9diluted weighted average shares outstanding – nareIT FFO and adjusted FFO 778.3 786.8 777.4nareIT FFO Per dILUTed sHare (a) $ 1.49 $ 1.57 $ 1.26adjUsTed FFO Per dILUTed sHare (a) $ 1.54 $ 1.50 $ 1.31
Reconciliation of Net income to EBITDA and Adjusted EBITDA(a)
Year ended december 31,
(UnaUdITed, In mILLIOns) 2015 2014 2013
neT IncOme $ 571 $ 747 $ 325 Interest expense 234 214 304 depreciation and amortization 716 695 696 Income taxes 9 14 21 discontinued operations — — 15
ebITda 1,530 1,670 1,361 Gain on dispositions (93) (233) (98) Gain on property insurance settlement (2) (1) — acquisition costs 1 2 1 recognition of deferred gain on land condemnation — — (11) Litigation (gain) loss — (61) 8 non-cash impairment loss — 6 1 equity investment adjustments:
equity in (earnings) losses of affiliates (70) (26) 17 Pro rata adjusted ebITda of equity investments 68 68 48 consolidated partnership adjustments: Pro rata adjusted ebITda attributable to non-controlling partners in other
consolidated partnerships (25) (23) (21)
adjUsTed ebITda(a) $1,409 $1,402 $1,306
(a) For further discussion of why we believe nareIT FFO and adjusted FFO per diluted share and adjusted ebITda are useful supplemental measures of our performance and the limitations on their use, see our annual report on Form 10-k included in our mailing to stockholders.
(b) nareIT FFO and adjusted FFO per diluted share are adjusted for the effects of dilutive securities. dilutive securities may include shares granted under comprehensive stock plans, preferred OP Units held by non-controlling partners, exchangeable debt securities and other non-controlling interests that have the option to convert their limited partnership interest to common OP Units. no effect is shown for securities if they are anti-dilutive.

CORPORATE INFORMATION
Corporate HeadquartersHost Hotels & resorts, Inc. 6903 rockledge drive, suite 1500 bethesda, md 20817 240/744-1000
Websitevisit the company’s website at: www.hosthotels.com
Stock Exchange Listingnew York stock exchange Ticker symbol: HsT
Stockholders of Record20,162 at February 19, 2016
Independent Registered Public AccountantskPmG LLP, mcLean, va
Annual MeetingThe 2016 annual meeting of stockholders will be held at 11 a.m., may 12, 2016, at The ritz carlton, Tysons corner, 1700 Tysons boulevard, mcLean, va 22102.
Registrar and Transfer AgentIf you have any questions concerning transfer pro ce dures or other stock account matters, please contact the transfer agent at the following address: computershare Trust company, n.a. shareholder relations P.O. bOX 30170 college station, TX 77842-3170 866/367-6351
Common Stock
sTOck dIvIdends PrIce decLared
HIGH LOw Per sHare
20141st Quarter $20.47 $18.00 $0.142nd Quarter 22.77 20.05 0.153rd Quarter 23.09 21.20 0.204th Quarter 24.33 20.23 0.26
20151st Quarter $24.14 $20.04 $0.202nd Quarter 20.73 19.40 0.203rd Quarter 21.29 15.39 0.204th Quarter 17.85 15.20 0.20
MANAgEMENT TEAM
W. Edward WalterPresident, Chief Executive Officer and Director
Joanne G. HamiltonExecutive Vice President, Human Resources
Nathan S. TyrrellManaging Director, East Coast
Sukhvinder SinghSenior Vice President, Information Technology
Gregory J. LarsonExecutive Vice President, Chief Financial Officer
Minaz B. AbjiExecutive Vice President, Asset Management
Jeffrey S. ClarkSenior Vice President, Global Tax and Foreign JV Accounting
Elizabeth A. AbdooExecutive Vice President, General Counsel and Secretary
Michael E. LentzManaging Director, Global Development, Design & Construction
Jay L. JohnsonSenior Vice President,Treasurer
James F. RisoleoExecutive Vice President & Managing Director, Europe & West Coast
Peter T. MeyerManaging Director, Asia
Brian G. MacnamaraSenior Vice President, Corporate Controller
Richard E. MarriottChairman of the Board
W. Edward WalterPresident, Chief Executive Officer and Director
Mary L. Baglivo 2Vice President for Global Marketing and Chief Marketing Officer, Northwestern University
Sheila C. Bair 1President of Washington College
Terence C. Golden Chairman, Bailey Capital Corporation
Ann McLaughlin Korologos 2, 3
John B. Morse, Jr. 1, 3
Walter C. Rakowich 1, 3
Gordon H. Smith 2President, Chief Executive Officer, National Association of Broadcasters
1 Audit Committee2 Compensation Policy Committee3 Nominating and Corporate Governance Committee
DIRECTORS
deSign: vivo deSign inc., printing: weStland printerS, inc.
6903 R o c k l e d g e d R i v e , S u i t e 1500B e t h e S d a , M a R y l a n d 20817