Evolutionary analysis of host proteins CD4, CXCR4 and CCR5, and ...

Host Cell Proteins – beyond ELISA with label-free interaction and imaging technologies
Gunnar Malmquist, Robert Karlsson, Anneli Jorsback, Åsa Hagner McWhirter, Maria Winkvist, Susanne Grimsby, Tomas Björkman, and Lennart Björkesten Correspondence should be addressed to: [email protected]
GE Healthcare Bio-Sciences AB, Björkgatan 30, SE-751 84 Uppsala, Sweden
Poster presented at BioProcess International, Nice, France, April 6–7, 2011
2 / Host Cell Proteins – beyond ELISA
Introduction
Traditional Host Cell Protein (HCP) ELISA assays depend on the quality of the assay antibodies and provide overall HCP population data only. However, the levels of individual HCP may be independently affected by adjustments in cell culture and purification conditions during process development, suggesting that there is a need consider additional technologies.
Biacore™ systems use a label free technology with immobilized antibodies for direct detection of HCPs that allows fast assay turnaround with good precision and accuracy. Two-dimensional Fluorescence Difference Gel Electrophoresis does not depend on antibody recognition but relies on pre-labeling of samples and multiplexed fluorescence detection of proteins in a 2-D electrophoresis gel. This technology was used to characterize the effect of different culture conditions on MAb expressing CHO cells in terms of almost 1700 individual host cell protein profiles and overall patterns in harvest material as well as MabSelect SuRe™ flowthrough and eluate fractions.

3 / Host Cell Proteins – beyond ELISA
1. Biacore™ HCP assay for vaccine process development
Figure 1. Sensorgrams of injected HCP standards MDCK cell lysate used for production of the HCP antibodies were used to create a standard curve in the range of 0.25–32 µg/mL. Report points (marked as X) were taken immediately before and after injection and the difference in level between each pair was measured (arrow). After each injection, the surface was regenerated with 50 mM NaOH to strip off bound HCP. The samples were diluted in HBS-EP+ with 1% BSA and injected over the surface for 300 s.
Figure 2. Calibration curves The precision of the HCP assay was increased by running repeated calibration curves at three different parts of the measurement series. The sample concentrations were subsequently determined from an interpolated calibration curve calculated automatically by the software.
The replicate CV in the standard curves was in all cases below 4% and the recovery was between 96% and 108% (data not shown).
In a cell-based influenza vaccine process it is important to have access to a reliable HCP assay with fast assay turnaround time. Traditional ELISA assays are typically performed at a core lab and associated with long waiting times for analytical data. Instead of developing an ELISA, we investigated a bench-top assay system based on Biacore T200 by immobilizing affinity-purified rabbit antibodies against MDCK cell lysate on Sensor Chip CM5 using standard amine coupling to a response of 7 000 RU.

4 / Host Cell Proteins – beyond ELISA
Biacore HCP assay is more specific and gives lower values than the Bradford total protein assay. The much higher sensitivity and excellent precision using Biacore T200 (LOQ of 0.3 μg/ml vs 60 μg/ml for Bradford) allows quantitation of a much wider range of samples in process development, with an assay turnaround time of a few hours for multiple samples.
Comparison between Biacore™ and Bradford

2. Experimental design and 2-D DIGE workflow
Cell removal Centrifugation
Concentration Buffer exchange
Vivaspin™ MWCO 5 kDa
Affinity purification MabSelect SuRe™
Concentration Buffer exchange
Vivaspin
Harvest 2-D DIGE analysis
Flowthrough 2-D DIGE analysis
Eluate 2-D DIGE analysis
2-D DIGE workflow
2nd dimension separation SDS-PAGE
Image analysis
Image acquisition
Protein labeling
Internal standard preparation Spike protein addition
Hydrolysates (C2) Hydrolysates + Butyrate (C3) Lipumin (C4) Control (C1)
1 2 3 1 2 3 1 2 3 1 2 3
1st dimension separation IEF
Concentration Buffer exchange
Vivaspin
Cell culture biological replicates
Figure 3. Design and workflow of experiments CHO cells expressing a monoclonal antibody were grown in PowerCHO-2 media with 6 mM glutamine supplemented with different additives. The MAb was affinity purified and HCP in all different fractions were analyzed by 2-D DIGE and ELISA. The harvest proteome has been fractionated where the majority of the HCP are contained in the flowthrough fraction, while the eluate fraction contains mainly MAb but any remaining HCP can be separated and individually detected.
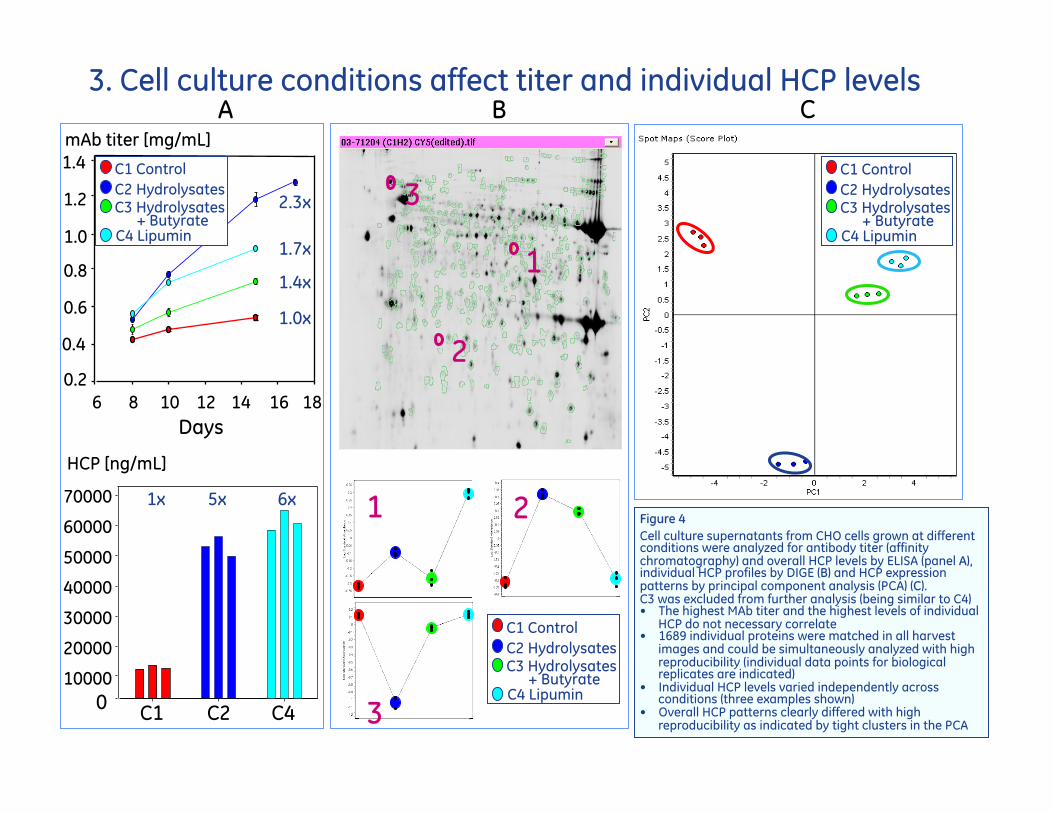
3. Cell culture conditions affect titer and individual HCP levels A B C
Days
C1 C2 C4 0 10000
20000
30000
40000
50000
60000
70000
HCP [ng/mL]
1x 5x 6x
C1 Control C2 Hydrolysates C3 Hydrolysates + Butyrate C4 Lipumin
1 2
3
1
3
2
mAb titer [mg/mL]
2.3x
1.7x
1.4x
1.0x
6 8 10 12 14 16 18 0.2 0.4 0.6 0.8 1.0 1.2 1.4
C1 Control C2 Hydrolysates C3 Hydrolysates + Butyrate C4 Lipumin
Figure 4 Cell culture supernatants from CHO cells grown at different conditions were analyzed for antibody titer (affinity chromatography) and overall HCP levels by ELISA (panel A), individual HCP profiles by DIGE (B) and HCP expression patterns by principal component analysis (PCA) (C). C3 was excluded from further analysis (being similar to C4) • The highest MAb titer and the highest levels of individual
HCP do not necessary correlate • 1689 individual proteins were matched in all harvest
images and could be simultaneously analyzed with high reproducibility (individual data points for biological replicates are indicated)
• Individual HCP levels varied independently across conditions (three examples shown)
• Overall HCP patterns clearly differed with high reproducibility as indicated by tight clusters in the PCA
C1 Control C2 Hydrolysates C3 Hydrolysates + Butyrate C4 Lipumin
7 / Host Cell Proteins – beyond ELISA
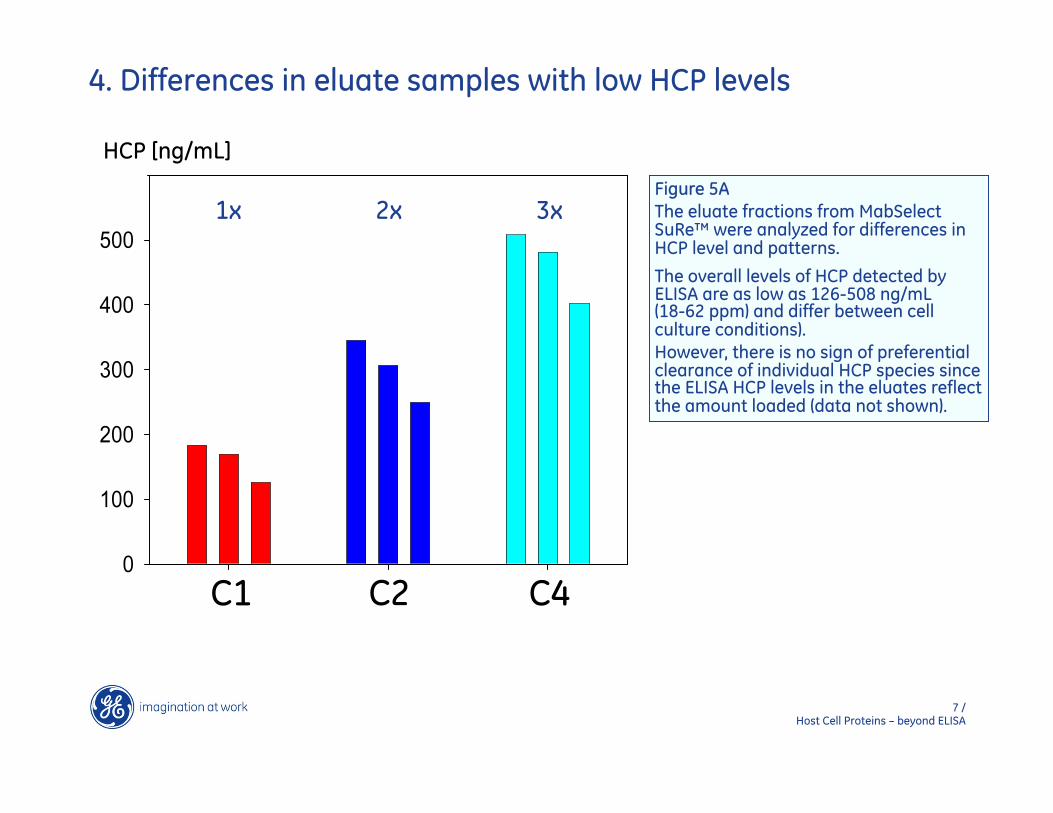
4. Differences in eluate samples with low HCP levels
1x 2x 3x
C1 C2 C4
HCP [ng/mL]
Figure 5A The eluate fractions from MabSelect SuRe™ were analyzed for differences in HCP level and patterns.
The overall levels of HCP detected by ELISA are as low as 126-508 ng/mL (18-62 ppm) and differ between cell culture conditions). However, there is no sign of preferential clearance of individual HCP species since the ELISA HCP levels in the eluates reflect the amount loaded (data not shown).

8 / Host Cell Proteins – beyond ELISA
Differential expression of HCP detected in eluate fractions
C1 Control C2 Hydrolysates C4 Lipumin
Figure 5B PCA reveals that differences in HCP patterns caused by variations in the cell culture conditions are detected even after affinity purification.

9 / Host Cell Proteins – beyond ELISA
HCP related spot MAb related spot
Figure 5C Several MAb variants are resolved with 2-D DIGE. In addition, more than sixty differentially expressed host cell proteins were detected in the eluates
mAb variants resolved with 2-D DIGE
10 / Host Cell Proteins – beyond ELISA
Summary
Biacore™ HCP assay facilitates vaccine process development • Allows reliable analysis of HCP levels in a wide variety of process development samples with fast assay turnaround time 2-D DIGE facilitates thorough process characterization and QbD • Allows analysis of HCP patterns and individual HCP profiles independently of antibody recognition • 2-D DIGE has outstanding separation resolution and is a sensitive method for analysis of differences in samples with low HCP levels • Differences in the HCP pattern caused by cell culture conditions are shown to be preserved even after affinity purification
Acknowledgements We would like to thank Anita Vitina and Janne Simola for cell culture support and discussions, Erik Sloge for data analysis support and Elin Andersson for the Biacore assay setup (all at GE Healthcare).
11 / Host Cell Proteins – beyond ELISA
GE Healthcare Bio-Sciences AB, a General Electric Company. GE, imagination at work and GE monogram are trademarks of General Electric Company.
Cy, CyDye, MabSelect SuRe and Biacore are trademarks of GE Healthcare companies. Vivaspin is a trademark of Sartorius Stedim Biotech GmbH and covered by US pat No 5 647 990, second patent pending, and their equivalents in other countries.
2-D Fluorescence Difference Gel Electrophoresis (2-D DIGE) technology is covered by US patent numbers 6,043,025, 6,127,134 and 6,426,190 and equivalent patents and patent applications in other countries and exclusively licensed from Carnegie Mellon University. CyDye: this product or portions thereof is manufactured under an exclusive license from Carnegie Mellon University under US patent numbers 5,569,587, 5,627,027 and equivalent patents in other countries. The purchase of CyDye DIGE Fluors includes a limited license to use the CyDye DIGE Fluors for internal research and development, but not for any commercial purposes. A license to use the CyDye DIGE Fluors for commercial purposes is subject to a separate license agreement with GE Healthcare.
All goods and services are sold subject to the terms and conditions of sale of the company within GE Healthcare which supplies them. A copy of these terms and conditions is available on request. Contact your local GE Healthcare representative for the most current information.
© 2011 General Electric Company – All rights reserved. First published in April 2011
GE Healthcare Bio-Sciences AB, Björkgatan 30, SE-751 84 Uppsala, Sweden
www.gelifesciences.com