HospitalsDecember 04, 2019 - ICICI Direct
65
ICICI Securities – Retail Equity Research Sector Report Hospitals December 10, 2019 Opportunities beckon in hospitals space… In the last three to four years, with many frontline large cap pharma companies being hampered by structural US related & other issues, we have seen growing investors’ preference for healthcare services providers. At the same time, as many as four hospitals and three diagnostic companies got listed on the bourses, thus providing a much larger basket for investors. Some peculiar factors responsible for growing interest in the hospitals space are: 1) waning high capex episodes of private hospitals after the 2008-18 capex cycle, 2) shifting focus towards assets light model for most hospital players, 3) improving financial matrix, 4) government’s endeavour to bring private players on board in the wake holistic view of universal and affordable healthcare (themes like NHP 2017 and Ayushman Bharat), 5) India’s emergence as the destination for medical tourism and 6) the underserved situation of Indian hospitals compared to the growing needs and demographic changes well documented by new and existing players. Taking into account all the headwinds and tailwinds, we believe the sector is yet to witness the fullest realisation of its potential as scepticism about the capital intensiveness is yet to wane. Apollo Hospitals Enterprise Ltd. (Apollo), the sector leader by far, remains a preferred bet from the sector with a calibrated improvement in margins and return ratios on the back of effective utilisation of both existing and new hospitals. In the Indian multispecialty category, we like Apollo due to 1) one of the best integrated business models in the healthcare space with strong management pedigree, 2) ability to balance between expansion and profitability, 3) near completion of the long capex cycle and a determined focus on improvement in margins and return ratios. Similarly, we also prefer Narayana Hrudayalaya Ltd. (Narayana) on account of 1) asset-right model and affordability philosophy, 2) ability to adapt to the requirement where affordability does not work, 3) moderation of capex and focus on return ratios and 4) traction from HCCI Cayman. Among others, we have a BUY rating on Aster DM healthcare (Aster), which is the only hospital chain having higher outside India presence, on the back of 1) significant presence in the Gulf Cooperation Council (GCC) (Middle East) region with a strong pedigree and return ratios, 2) calibrated approach in India growth, 3) unique ecosystem banking on GCC presence and India expansion besides labour arbitrage. We have a HOLD rating on Healthcare Global Enterprises (HCG) as we believe the positives 1) comprehensive cancer treatment network with strong pedigree, 2) overall potential of cancer as a treatment category, 3) established presence in IVF treatment are getting mitigated by concerns on account of weak leverage and return ratios. Similarly, we have a HOLD rating on Shalby Ltd (Shalby) as positive aspects 1) brand loyalty in joint replacement, 2) calibrated expansion in other procedures and geographies to de-risk and 3) leverage free balance sheet are slightly undone by asset concentration risk. Lastly, we keep Fortis Healthcare (Fortis) Under Review due to the pending litigation in some aspects. Key Financial Summary Company CMP TP Rating M Cap (|) (|) (| cr) FY19 FY20E FY21E FY22E FY19 FY20E FY21E FY22E FY19 FY20E FY21E FY22E FY19 FY20E FY21E FY22E Apollo Hospitals 1466 1,800 Buy 20401 17.0 25.3 43.7 68.1 22.2 14.0 11.4 9.5 8.8 11.4 14.8 17.5 1.1 0.9 0.7 0.4 Narayana Hrudalaya 304 360 Buy 6213 2.9 7.2 9.8 13.3 24.1 15.7 13.5 11.1 7.7 12.0 13.9 16.5 0.8 0.7 0.5 0.3 Aster DM Healthcare 154 210 Buy 7786 6.6 5.0 8.9 13.5 11.9 8.7 7.2 5.8 8.3 8.4 10.3 12.3 0.9 0.9 0.7 0.5 Healthcare Global 101 110 Hold 898 -2.8 -11.0 -7.9 -4.0 13.8 15.5 12.5 9.6 3.0 1.2 2.5 4.3 1.4 3.6 4.2 4.5 Shalby Limited 103 110 Hold 1109 2.9 4.4 5.4 6.8 13.5 10.8 9.0 7.6 6.8 7.9 9.1 10.5 0.1 0.1 0.1 0.1 EPS (|) EV/EBITDA(x) RoCE (%) Debt/Equity (x) Source: ICICI Direct Research; Company Apollo Hospitals -- Maintain BUY TP -- | 1800 (existing hospitals at 13x FY22E EV/EBITDA, new hospitals and pharmacies at 1.5x FY22E EV/sales) Narayana – Maintain BUY –TP | 360 (mature hospitals and Cayman Islands at 8x FY22E EV/EBITDA, new hospitals at 1.5x FY22E EV/sales and other business at 1.5x FY22E EV/sales) Aster DM – Initiate with BUY -- TP | 210 (Mature hospitals (GCC & India) at 8x FY22E EV/EBITDA, new hospitals(GCC & India), clinics and pharmacies at 1x FY22E EV/sales) HCG– Initiate with HOLD -- TP | 110 (hospitals and Milan at 10x FY22E EV/EBITDA) Shalby Ltd – Initiate with HOLD -- TP | 110 (more than six years hospitals 8x of FY22E EV/EBITDA, less than six years hospitals at 1x FY22E EV/sales) Maintain Under review on Fortis Research Analyst Siddhant Khandekar [email protected] Mitesh Shah, CFA [email protected] Sudarshan Agarwal [email protected]
Transcript of HospitalsDecember 04, 2019 - ICICI Direct

ICIC
I S
ecurit
ies –
Retail E
quit
y R
esearch
Sector R
eport
Hospitals
December 10, 2019
Opportunities beckon in hospitals space…
In the last three to four years, with many frontline large cap pharma
companies being hampered by structural US related & other issues, we have
seen growing investors’ preference for healthcare services providers. At the
same time, as many as four hospitals and three diagnostic companies got
listed on the bourses, thus providing a much larger basket for investors.
Some peculiar factors responsible for growing interest in the hospitals space
are: 1) waning high capex episodes of private hospitals after the 2008-18
capex cycle, 2) shifting focus towards assets light model for most hospital
players, 3) improving financial matrix, 4) government’s endeavour to bring
private players on board in the wake holistic view of universal and affordable
healthcare (themes like NHP 2017 and Ayushman Bharat), 5) India’s
emergence as the destination for medical tourism and 6) the underserved
situation of Indian hospitals compared to the growing needs and
demographic changes well documented by new and existing players.
Taking into account all the headwinds and tailwinds, we believe the sector
is yet to witness the fullest realisation of its potential as scepticism about the
capital intensiveness is yet to wane. Apollo Hospitals Enterprise Ltd.
(Apollo), the sector leader by far, remains a preferred bet from the sector
with a calibrated improvement in margins and return ratios on the back of
effective utilisation of both existing and new hospitals. In the Indian
multispecialty category, we like Apollo due to 1) one of the best integrated
business models in the healthcare space with strong management pedigree,
2) ability to balance between expansion and profitability, 3) near completion
of the long capex cycle and a determined focus on improvement in margins
and return ratios. Similarly, we also prefer Narayana Hrudayalaya Ltd.
(Narayana) on account of 1) asset-right model and affordability philosophy,
2) ability to adapt to the requirement where affordability does not work, 3)
moderation of capex and focus on return ratios and 4) traction from HCCI
Cayman.
Among others, we have a BUY rating on Aster DM healthcare (Aster), which
is the only hospital chain having higher outside India presence, on the back
of 1) significant presence in the Gulf Cooperation Council (GCC) (Middle
East) region with a strong pedigree and return ratios, 2) calibrated approach
in India growth, 3) unique ecosystem banking on GCC presence and India
expansion besides labour arbitrage. We have a HOLD rating on Healthcare
Global Enterprises (HCG) as we believe the positives 1) comprehensive
cancer treatment network with strong pedigree, 2) overall potential of cancer
as a treatment category, 3) established presence in IVF treatment are getting
mitigated by concerns on account of weak leverage and return ratios.
Similarly, we have a HOLD rating on Shalby Ltd (Shalby) as positive aspects
1) brand loyalty in joint replacement, 2) calibrated expansion in other
procedures and geographies to de-risk and 3) leverage free balance sheet
are slightly undone by asset concentration risk. Lastly, we keep Fortis
Healthcare (Fortis) Under Review due to the pending litigation in some
aspects.
Key Financial Summary
Company CMP TP Rating M Cap
(|) (|) (| cr) FY19 FY20E FY21E FY22E FY19 FY20E FY21E FY22E FY19 FY20E FY21E FY22E FY19 FY20E FY21E FY22E
Apollo Hospitals 1466 1,800 Buy 20401 17.0 25.3 43.7 68.1 22.2 14.0 11.4 9.5 8.8 11.4 14.8 17.5 1.1 0.9 0.7 0.4
Narayana Hrudalaya 304 360 Buy 6213 2.9 7.2 9.8 13.3 24.1 15.7 13.5 11.1 7.7 12.0 13.9 16.5 0.8 0.7 0.5 0.3
Aster DM Healthcare 154 210 Buy 7786 6.6 5.0 8.9 13.5 11.9 8.7 7.2 5.8 8.3 8.4 10.3 12.3 0.9 0.9 0.7 0.5
Healthcare Global 101 110 Hold 898 -2.8 -11.0 -7.9 -4.0 13.8 15.5 12.5 9.6 3.0 1.2 2.5 4.3 1.4 3.6 4.2 4.5
Shalby Limited 103 110 Hold 1109 2.9 4.4 5.4 6.8 13.5 10.8 9.0 7.6 6.8 7.9 9.1 10.5 0.1 0.1 0.1 0.1
EPS (|) EV/EBITDA(x) RoCE (%) Debt/Equity (x)
Source: ICICI Direct Research; Company
Apollo Hospitals -- Maintain
BUY TP -- | 1800 (existing
hospitals at 13x FY22E
EV/EBITDA, new hospitals and
pharmacies at 1.5x FY22E
EV/sales)
Narayana – Maintain BUY –TP
| 360 (mature hospitals and
Cayman Islands at 8x FY22E
EV/EBITDA, new hospitals at
1.5x FY22E EV/sales and other
business at 1.5x FY22E
EV/sales)
Aster DM – Initiate with BUY --
TP | 210 (Mature hospitals
(GCC & India) at 8x FY22E
EV/EBITDA, new
hospitals(GCC & India), clinics
and pharmacies at 1x FY22E
EV/sales)
HCG– Initiate with HOLD -- TP
| 110 (hospitals and Milan at
10x FY22E EV/EBITDA)
Shalby Ltd – Initiate with HOLD
-- TP | 110 (more than six
years hospitals 8x of FY22E
EV/EBITDA, less than six years
hospitals at 1x FY22E EV/sales)
Maintain Under review on
Fortis
Research Analyst
Siddhant Khandekar
Mitesh Shah, CFA
Sudarshan Agarwal
ICICI Securities | Retail Research 2
ICICI Direct Research Sector Report | Hospitals
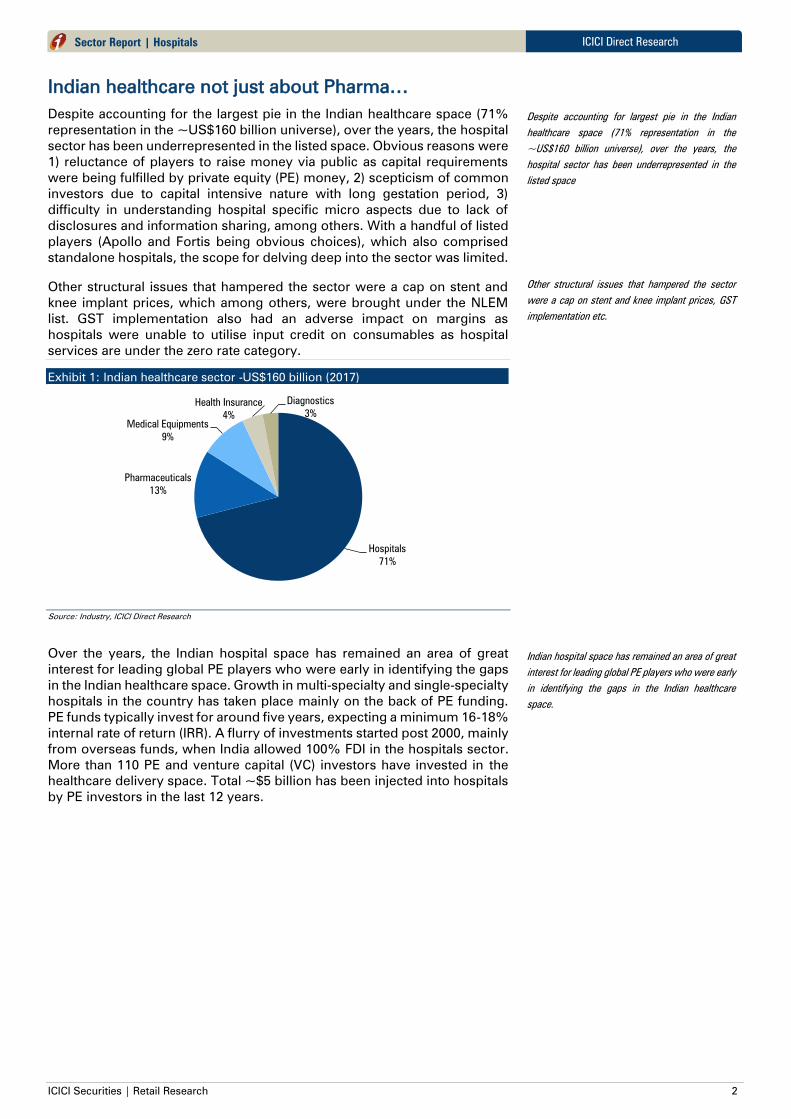
Indian healthcare not just about Pharma…
Despite accounting for the largest pie in the Indian healthcare space (71%
representation in the ~US$160 billion universe), over the years, the hospital
sector has been underrepresented in the listed space. Obvious reasons were
1) reluctance of players to raise money via public as capital requirements
were being fulfilled by private equity (PE) money, 2) scepticism of common
investors due to capital intensive nature with long gestation period, 3)
difficulty in understanding hospital specific micro aspects due to lack of
disclosures and information sharing, among others. With a handful of listed
players (Apollo and Fortis being obvious choices), which also comprised
standalone hospitals, the scope for delving deep into the sector was limited.
Other structural issues that hampered the sector were a cap on stent and
knee implant prices, which among others, were brought under the NLEM
list. GST implementation also had an adverse impact on margins as
hospitals were unable to utilise input credit on consumables as hospital
services are under the zero rate category.
Exhibit 1: Indian healthcare sector -US$160 billion (2017)
Source: Industry, ICICI Direct Research
Over the years, the Indian hospital space has remained an area of great
interest for leading global PE players who were early in identifying the gaps
in the Indian healthcare space. Growth in multi-specialty and single-specialty
hospitals in the country has taken place mainly on the back of PE funding.
PE funds typically invest for around five years, expecting a minimum 16-18%
internal rate of return (IRR). A flurry of investments started post 2000, mainly
from overseas funds, when India allowed 100% FDI in the hospitals sector.
More than 110 PE and venture capital (VC) investors have invested in the
healthcare delivery space. Total ~$5 billion has been injected into hospitals
by PE investors in the last 12 years.
Hospitals
71%
Pharmaceuticals
13%
Medical Equipments
9%
Health Insurance
4%
Diagnostics
3%
Despite accounting for largest pie in the Indian
healthcare space (71% representation in the
~US$160 billion universe), over the years, the
hospital sector has been underrepresented in the
listed space
Other structural issues that hampered the sector
were a cap on stent and knee implant prices, GST
implementation etc.
Indian hospital space has remained an area of great
interest for leading global PE players who were early
in identifying the gaps in the Indian healthcare
space.

ICICI Securities | Retail Research 3
ICICI Direct Research
Sector Report | Hospitals
Exhibit 2: Key PE deals in healthcare segment (above US$50 million)
Company US$ mn Key investors Date
Radiant Life Care 200 KKR July ’17
Condis Healthcare 200 India Value Fund Mar ’17
Manipal Health Enterprises 171 Temasek Mar ’17
Max Healthcare Institute 75 IFC May ’17
Vijaya Diagnostic Centre 63.5 Kedaara Capital Dec ’16
Apollo Health & Lifestyle 68 IFC May ’16
Care Hospitals 221 Abraaj Group Jan ’16
Cloud Nine 60.5 India Value Fund Dec ’15
Metropolis Healthcare 127.5 Carlyle Sep ’15
Metropolis Healthcare* 90 KKR Apr ’15
Sutures India 60 TPG Growth Feb ’15
Manipal Health Enterprises 150 TPG Capital Jan ’15
Medanta Medicity 113.5 Temasek Jan ’15
Aster DM Healthcare 60 India Value Fund, Olympus Capital May ’14
Source: Bloomberg, ICICI Direct Research
Perception is changing, courtesy availability of options
with stock specific peculiarities and improving (albeit
slowly) industry dynamics…
Cut to 2017-19, with many frontline large cap pharma companies being
hampered by structural US related and other issues, we have seen growing
investors’ preference for hospitals. During the same time, as many as four
hospitals got listed on the bourses, thus providing a much larger basket for
investors.
Some crucial factors supplementing the growing interest in the hospitals
space are 1) waning high-capex episodes of private hospitals after the 2008-
18 capex cycle, 2) shift towards assets light model, 3) government’s
endeavour to bring private players on board in the wake of the holistic view
of universal and affordable healthcare (themes such as NHP 2017 and
Ayushman Bharat), 4) India’s emergence as the destination for medical
tourism and lastly, 5) the legacy argument of the underserved situation of
Indian hospitals compared to other developed and developing economies
well documented by new and existing players.
Waning capex and focus on assets light model
Multi-specialty healthcare is a highly capital intensive business on account
of the real estate involved in setting up facilities as well as the money
required for medical equipment and hiring of skilled staff. It takes at least
one and a half to three years for green-field projects to reach operational
break-even.
What is also driving investors’ interest is the shift (albeit slowly) from capital
intensive to asset-light model with minimal locking of the capital. Preference
is also shifting towards hospital chains from standalone hospitals as the
former provides a better return profile on the back of a portfolio of hospitals.
With many frontline large cap pharma companies
being hampered by structural US related and other
issues, we have seen growing investors’ preference
for hospitals and diagnostic players
Crucial factors supplementing the growing interest
in the hospitals space are: 1) waning high-capex
episodes, 2) shift towards asset light model, 3)
government’s endeavour to bring private players on
board (themes such as NHP 2017 and Ayushman
Bharat), 4) medical tourism and 5) the underserved
situation of Indian hospitals
Multi-specialty healthcare is a highly capital
intensive business
Shift (albeit slowly) from capital intensive to asset-
light model with minimal locking of the capital is also
driving interest.

ICICI Securities | Retail Research 4
ICICI Direct Research Sector Report | Hospitals
Exhibit 3: Industry dynamics (select pack)
(| crore) FY16 FY17 FY18 FY19 FY20E FY21E FY22E
Revenue 13,953.0 16,088.2 18,452.8 21,878.1 25,269.8 28,302.8 31,562.5
EBITDA 1,447.4 1,465.8 1,810.7 2,409.1 3,511.6 4,132.4 4,790.8
Depreciation 638.4 789.9 851.0 957.6 1,490.4 1,572.1 1,651.5
Other income 68.6 93.0 121.4 102.4 127.8 168.1 201.8
Capex 1,885.3 2,254.5 2,007.7 1,984.9 3,833.4 1,055.0 960.0
Gross FA 9,953.7 11,653.6 13,839.4 15,601.7 19,575.1 20,855.1 22,015.1
Capital employed 13,857.2 15,564.7 17,683.7 19,272.8 22,827.3 22,874.3 23,394.6
Asset Turnover(x) 1.4 1.4 1.3 1.4 1.3 1.4 1.4
ROCE (%) 6.3% 4.9% 6.1% 8.1% 9.4% 11.9% 14.3%
Source: Company, ICICI Direct Research
Besides National Health Protection (NHP) and Pradhan Mantri Jan Arogya
Yojana (PMJAY), the government’s decision to accord industry status has
paved the way for private players to expand in Tier II and Tier III cities as the
government has proposed to provide viability gap funding (VGF) of up to
40% of total cost and will also provide gap funding of up to 50% of tax on
capital cost.
Government initiatives
We see serious government endeavour to narrow down the healthcare gaps
with concentrated efforts. Although it is early days (NHP – 2017; Ayushman
Bharat 2018) with lots of unconnected dots, we believe private hospitals can
look at increasing volumes to improve financials. Although most of the
managements remain sceptical about the scheme (main bone of contention
is the low procedural rates quoted in the scheme), the government has
indicated its intention to consider these issues. Note that these kinds of
nationwide health schemes take years to become feasible for all
stakeholders [a case in point is National Health Service (NHS) of UK].
Exhibit 4: Total healthcare expenditure (as % of GDP) (India includes private sector)
Source: *CY15 data, Crisil; WHO database; ICICI Direct Research
NHP 2017- Government recognition for private sector capability
National Health Policy (NHP) 2017 has effectively charted out three clear
objectives - progressively achieve universal health coverage, reinforce trust
in public healthcare system and complement the growth of the private
healthcare sector with public health goal. The roadmap to involve the private
sector to address the shortcomings of government driven health deliveries
is by far the most important outcome of the new policy. It does acknowledge
the extremely poor spending by the state and inability to cover the entire
spectrum of healthcare needs through increased public investment, which
6
9
5
4
3
4 4
10
17
6
0
2
4
6
8
10
12
14
16
18
Russia Brazil China India Indonesia Malaysia Thailand UK US Vietnam
Besides NHP and PMJAY, the government’s
decision to accord industry status has paved the
way for private players to expand in Tier II and Tier
III cities
We see serious government endeavour to narrow
down the healthcare gaps with concentrated efforts,
although it is early days (NHP – 2017; Ayushman
Bharat 2018)
NHP 2017 has effectively charted out three clear
objectives - progressively achieve universal health
coverage, reinforce trust in public healthcare system
and complement the growth of the private
healthcare sector with public health goal
Guided reduction in capex by
almost all listed players

ICICI Securities | Retail Research 5
ICICI Direct Research Sector Report | Hospitals
has led to a rise in the out-of-pocket expenditure and consequent
impoverishment. It advocates a shift from a primary focus on garnering
additional financial resources from the private sector or subsidising it, to an
approach in which there is a well-defined service delivery partnership
between the government, as purchaser, and private sector, as a provider.
Exhibit 5: Out of pocket healthcare spend as percentage of total healthcare
expenditure
Source: Crisil; WHO Database; ICICI Direct Research
The policy explains the need for coordination with private sector enterprises
by giving statistical instances. The private sector accounts for 90% of all
hospitals (up from 8% in 1947), 60% of all beds, and 80-85% of all doctors.
Over 70% of an ailing population in rural areas and almost 80% in urban
areas utilise private facilities. As much as 75% of outpatient (OPD) care is
exclusively private while more than 55% of inpatient (IPD) care is sought
from private hospitals in India.
Exhibit 6: Share in total health market
Source: Company; ICICI Direct Research
Ayushman Bharat
Under the National Health Policy 2017, Ayushman Bharat - Pradhan Mantri
Jan Arogya Yojana (AB-PMJAY) was launched on September 23, 2018 as
the secondary/tertiary care arm of Ayushman Bharat. The programme,
devised to prevent impoverishment due to catastrophic health expenses,
aims to provide annual health insurance of | 5 lakh/family to over 10.74 crore
families (~50 crore individuals) listed as per “deprivation” in the socio-
economic caste census.
28
1115
65
3236
50
43
12
0
20
40
60
80
Brazil US UK India China Malaysia Indonesia Vietnam Thailand
Private Hospitals
80%
Public Hospitals
20%
Ayushman Bharat scheme aims to provide annual
health insurance of | 5 lakh per family to over 10.74
crore families (~50 crore individuals) listed as per
“deprivation” in the socio-economic caste census

ICICI Securities | Retail Research 6
ICICI Direct Research Sector Report | Hospitals
Exhibit 7: Average cost of treatment (|) in large hospitals & insurance schemes
Source: Crisil; IRDAI, Ayushman Bharat; ICICI Direct Research
The scheme has been implemented in 32 states and UTs. Two states that
are yet to adopt the PMJAY are Odisha and Telangana. West Bengal enrolled
in the scheme but opted out later. PM-JAY has also provided flexibility to
states/UTs to choose their own Ayushman implementation model.
• 17 states/UT are implementing via trust mode,
• nine states/UTs via insurance mode and
• six states/UTs using the mixed mode
Exhibit 8: PMJAY progress
Sep-18 Oct-18 Nov-18 Dec-18 Jun-19 Sep-19
Hospitals empanelled (nos) 13741 14778 15104 16134 15839 18236
Beneficiaries admitted (nos) 25407 144924 386924 685807 3152505 4640000
eCards issued (nos) 42352 339613 1116154 4038450 40185659 103000000
Hospitalisation benefits availed (| Cr) 41.6 225.2 531.3 912.1 3078 7500
Progress of Ayushman Bharat (cumulative)
Source: Ayushman Bharat website, ICICI Direct research
Recently, the government has also increased allocation to AB to | 6,400
crore under the healthcare budget for FY20. As per the PMJAY website (till
September 22, 19) 18,000+ hospitals have already been empanelled, more
than ~4.6 million beneficiaries have availed treatment and more than 10.3
crore e-cards have been issued under AB-PMJAY. The procedure charges
(some private players allege that the quoted procedure charges are even
lower than CGHS, GIPSA rates and lower than marginal costs) and
implementation of the scheme still entail unresolved issues. However,
officials of the scheme are looking at these aspects with continuous
discussion involving hospitals, industry groups & service providers and are
open to revising rates. The officials expect | 8000 crore allocation towards
PMJAY in the forthcoming Union Budget to shore up the financials further.
155,142
140,244
136,562
96,164
84,335
70,702
44,281
28,453
16,108
8,885
4,825
- 20,000 40,000 60,000 80,000 100,000 120,000 140,000 160,000 180,000
Max Healthcare
Fortis Healthcare
Apollo Hospitals
Narayana Health
Shalby
HCG
Individual schemes
Corporate schemes
Ayushman Bharat
State schemes
RSBY
Ayushman Bharat scheme has been implemented in
32 states & UTs
Total 18,000+ hospitals have already been
empanelled under PMJAY Yojana. More than ~4.6
million beneficiaries have availed treatment while
more than 10.3 crore e-cards have been issued
under AB-PMJAY

ICICI Securities | Retail Research 7
ICICI Direct Research Sector Report | Hospitals
Exhibit 9: Management quotes on Ayushman Bharat
Source: ICICI Direct Research, Company
Medical tourism- Another key focus area
Another important factor is the growing medical tourism concept, which can
be the X-factor for assets in metros and Tier 1 cities as companies keep on
adding tertiary and quaternary care hospitals. The government’s steps such
as visa on arrival and medical visa have made the modalities of admitting
foreign patients a lot easier.
Over the years, India has grown to become a top notch destination for
medical value travel because it scores high over a range of factors that
determine the overall quality of care. From quality of therapy, range of
procedural and treatment options, infrastructure and skilled manpower to
perform any medical procedure with zero waiting time and lastly availability
of generic drugs, the list of benefits of travelling for medical treatment in
India are many. This is especially for costly and delicate surgeries like
bypass, kidney and liver transplant, hip replacement, dental services,
cosmetic surgery and bariatric surgery. Indian hospitals are offering
standard services at comparatively low costs. Statistics reveal that treatment
of major surgeries in India costs ~20% of that in developed countries.
Accredited hospitals with huge capacity and gamut of specialty offerings –
Over the years, Indian hospitals have realised the importance of facility
accreditation and accordingly worked towards achieving the benchmark.
Globally, the Joint Commission International (JCI) is considered a major
benchmark by medical tourists. Currently, India has 39 JCI accredited
hospitals. However, the number is still less compared to other countries
(UAE 215; China 102; Thailand 69). Still, with growing awareness and quest
to move into specialty and super specialty, the accreditation number is set
to increase. Similarly, most accredited hospitals have huge capacity (bed
count 200+) while average capacity utilisation is still low at ~50%. Similarly,
most of these hospitals are tertiary/quaternary care multispecialty or single-
super specialty hospitals.
Venugopalan Kesavan (Narayana
Hrudayalaya Q2FY20 earnings call)
Ayushman Bharat is not really a game changer. However, it is good for covering the bottom 10-15% of general ward
beds and on a marginal cost basis, you can justify doing certain procedures. However, by and large, Ayushman
procedures are margin depletive while the government does not pay you anywhere close to what the true cost is nor
do you get paid on time. Game changer is a strong word but it is an indication of the way things are moving forward.
Depending on their budget allocation, the government will start to become more of a payer for large segments of the
population
Suneeta Reddy (Apollo Hospitals
Q2FY20 earnings call)
Of the 256 procedures with a revised base, some are really good to work with. We are having a dialogue with the
government to allow the private sector to do that. I think the pricing there is quite beneficial on a marginal costing
basis. It should work and we are only doing it in Tier 3 hospitals and some of our Tier 2 ones. Going forward, we
hope the government gives out more of the tertiary care work
Nishita Shukla (Shalby Hospitals
Q2FY20 earnings call)
Ayushman payment cycle is supposed to be around 45 days. However, the usual trend is to receive the money in 80-
90 days
Shanay Shah (Shalby Hospitals
Q2FY20 earnings call)
From a marginal costing perspective, sometimes it makes sense to take up schemes. Hence, to that extent, we take
up schemes. Compared to our schedule of charges, Ayushman Bharat rates are very low and the payment is very
much delayed. However, from a new hospital/doctor perspective with comparatively less work, they get to perform a
lot of procedures because of some of these state & central schemes
Growing medical tourism concept that can be the X-
factor for assets located in metros and Tier 1 cities
Over the years, India has grown to become a top
notch destination for medical value travel because it
scores high over a range of factors that determines
the overall quality of care
Currently, India has 39 JCI accredited hospitals.
However, the number is still less compared to other
countries (UAE 215; China 102; Thailand 69)

ICICI Securities | Retail Research 8
ICICI Direct Research Sector Report | Hospitals
Exhibit 10: Joint Commission International (JCI) accredited hospitals
Source: JCI website; ICICI Direct Research
Fast track action – negligible waiting period - Quick and immediate attention
to surgeries and all interventions is another advantage in India. Getting an
appointment for bypass surgery or a planned angioplasty in certain
countries takes almost one to three months. There is almost zero waiting
time in India for any procedure, be it heart surgery, kidney care, cancer
treatment, knee/hip/joint replacements, dental, cosmetic surgeries, weight
loss surgery, etc.
Use of state-of-the art technologies and procedures - Most recognised
hospitals have invested heavily in supportive technology and operative
techniques. Recent advancements in robotic surgeries, radiation surgery or
radio therapies with cyber knife options, intensity modulated radiation
therapy IMRT/image guided radiation therapy (IGRT), transplant support
systems, advanced neuro and spinal options are all available in India.
Quality services at reasonable prices - Healthcare costs in India are
extremely competitive compared to those in developed countries and other
Asian countries. Procedures such as hip and knee replacement, face lift and
gastric bypass are far more affordable in India, including the cost of travel
and accommodation, compared to the US. Moreover, these cosmetic
procedures are not covered by most insurance providers in Western
countries. India has many hospitals for open-heart surgery and paediatric
heart surgeries, which are equipped with the latest equipment that are at par
with these western countries. With healthcare costs soaring in these
countries, the relatively low cost of surgery and critical care in India make it
an attractive destination for medical tourism. India also attracts medical
tourists from other developing nations due to the lack of advanced medical
facilities in many of these countries.
Exhibit 11: Country wise cost of aliments (US$ ‘000s)
Source: Company, ICICI Direct Research
215
102
69
39
20
0
50
100
150
200
250
UAE China Thailand India Singapore
UAE China Thailand India Singapore
Treatment US Korea Singapore Thailand India
Hip Replacement 50.0 14.1 12.0 7.9 7.0
Knee Replacement 50.0 19.8 13.0 12.3 6.2
Heart Bypass 144.0 28.9 18.5 15.1 5.2
Angiopiasty 57.0 15.2 13.0 3.8 3.3
Heart Valve Replacement 170.0 43.5 12.5 21.2 5.5
Dental Implant 2.8 4.2 1.5 3.6 1.0
Quick and immediate attention to surgeries and all
interventions another advantage in India
Most recognised hospitals In India have invested
heavily in supportive technology and operative
techniques
Healthcare costs in India are extremely competitive
compared to those in developed countries as well as
other Asian countries

ICICI Securities | Retail Research 9
ICICI Direct Research Sector Report | Hospitals
Exhibit 12: Number of medical tourists (in lakh)
Source: Crisil, Ministry of Tourism
Facilitation for medical visa - The government has introduced e-visas for
patients seeking prolonged treatment in recognised healthcare centres.
Applicants from nearly 160 countries are eligible for e-tourist visas and can
send online applications for medical visas with scanned copies of medical
prescriptions from a government-accredited hospital of his/her country. The
biometric details of applicants are taken on arrival. The short-term medical
visa is valid for 30 days from the date of arrival, after which the home
department of individual states can extend it by up to a year, provided the
application is based on a medical certificate backed by documented advice
from a hospital in India. The government has also introduced medical visa
and medical attendant visa as separate categories of visa to facilitate entry
of medical tourists in India. The visa relaxation follows the Tourism
Ministry’s efforts to bring India at par with competing nations like Thailand,
Malaysia and Singapore, which offer visa on arrival.
Exhibit 13: Indian medical tourism originating countries
Source: *CY17 data, Crisil; Ministry of tourism; ICICI Direct Research
Favourable macroeconomic factors
Ever since the government opened up healthcare to the private sector in the
1980s, India has seen exponential growth in corporate hospitals. Several
family-owned and doctors managed private hospitals, with a portfolio
approach emerged between 1980 and 2015. Intense competition and
reverse drain of expatriate and highly trained doctors enabled these chains
to venture into specialties & super-specialties. These hospitals also received
government support in the nature of tax and other breaks. Conducive
policies for encouraging FDI, tax benefits, favourable government policies
coupled with promising growth prospects have helped the industry fulfil the
capital requirements via scores of private equity and venture capital deals.
The Government of India has introduced e-visas for
patients seeking prolonged treatment in recognised
healthcare centres
Significant infrastructural gaps persist in the Indian
hospital industry. The bed availability in India in
terms of estimated beds was at 12 per 10,000,
significantly lower than the WHO guideline of 30
beds per 10,000 population

ICICI Securities | Retail Research 10
ICICI Direct Research Sector Report | Hospitals
Significant infrastructural gaps persist in the Indian hospital industry. The
bed availability in India in terms of estimated beds was at 12 per 10,000,
which was significantly lower than the WHO guideline of 30 beds per 10,000
population. Demand-supply mismatch with a combination of
macroeconomic factors, including changing demographics, increasing
affluence of the Indian population, greater health awareness, rising incomes,
changes in the disease profile (towards lifestyle-related ailments) and rising
penetration of health insurance are likely to lead to an increase in demand
for quality healthcare services. Apart from this, increasing trend of medical
tourism for low cost of surgery and critical care in India are expected to be
a key growth driver for healthcare delivery in India.
Exhibit 14: Hospital bed density (per ‘0000 population)
Source: Crisil Research; World Bank; ICICI Direct Research (~2 million more beds are required to be at par with global median)
Exhibit 15: Density of medical professionals in India
Source: Crisil, WHO World Health Statistics 2018, ICICI Direct Research
Exhibit 16: Insurance penetration in India
Source: Crisil, IRDAI
82
42
28 29
22 21
26
19
12
0
10
20
30
40
50
60
70
80
90
Russia China UK US Brazil Thailand Vietnam Malaysia India
(Estimated)
40
28 26
19 1815
8 85
8784
98
74
23
41
21
14
23
0
20
40
60
80
100
120
Russia UK US Brazil China Malaysia India Vietnam Thailand
Doctors (per '0000 population) Nurses (per '0000 population)
Significant infrastructural gaps persist in the Indian
hospital industry. The bed availability in India in
terms of estimated beds was at 12 per 10,000,
which was significantly lower than the WHO
guideline of 30 beds per 10,000 population.

ICICI Securities | Retail Research 11
ICICI Direct Research Sector Report | Hospitals
Positive structural changes notwithstanding, we
follow stock specific approach…
Taking into account all the headwinds and tailwinds, we believe the sector
is yet to witness the realisation of its fullest potential as scepticism about the
capital intensiveness is yet to wane. Apollo, the sector leader by far, remains
a preferred bet from the sector with a calibrated improvement in margins
and return ratios on the back of effective utilisation of both existing and new
hospitals. In the Indian multispecialty category, we like Apollo due to 1) one
of the best integrated business models in the healthcare space with strong
management pedigree, 2) ability to balance between expansion and
profitability, 3) near completion of the long capex cycle and a determined
focus on improvement in margins and return ratios.
Similarly, we also prefer Narayana on account of 1) asset-right model and
affordability philosophy, 2) ability to adapt to the requirement where
affordability does not work, 3) moderation on capex and focus on return
ratios and 4) traction from HCCI Cayman. Among others, we have a BUY
rating on Aster, which is the only hospital chain with a higher outside India
presence, on the back of 1) a significant presence in the GCC (Middle-East)
region with strong pedigree and return ratios, 2) calibrated approach in India
growth, 3) unique ecosystem banking on GCC presence and India expansion
besides labour advantage. We have a HOLD rating on HCG as we believe
the positives 1) comprehensive cancer treatment network with strong
pedigree, 2) overall potential for cancer as a treatment category, 3)
established presence in IVF treatment are getting mitigated by concerns on
in the form of subdued leverage and return ratios. Similarly, we have a HOLD
rating on Shalby as positive aspects 1) brand loyalty in joint replacement, 2)
calibrated expansion in other procedures and geographies to de-risk and 3)
leverage free balance sheet are slightly undone by asset concentration risk.
We keep Fortis Healthcare Under Review due to pending litigation in some
aspects.
We like Apollo Hospitals due to 1) one of the best
integrated business models with strong
management pedigree, 2) ability to balance between
expansion and profitability, 3) near completion of the
long capex cycle
We also like Narayana on account of 1) asset-right
model and affordability philosophy, 2) ability to
adapt to the requirement where affordability does
not work, 3) moderation of capex and focus on return
ratios and 4) traction from HCCI Cayman
We have a BUY rating on Aster DM on the back of
1) significant presence in GCC (Middle-East) region
with strong pedigree and return ratios, 2) calibrated
approach to India growth and 3) unique ecosystem
banking on GCC presence and India
We have a HOLD rating on Healthcare Global (HCG)
as we believe the positives 1) comprehensive
cancer treatment network with strong pedigree, 2)
overall potential for cancer as a treatment category,
3) established presence in IVF treatment are getting
mitigated by concerns on the fronts of subdued
leverage and return ratios
Similarly, we have a HOLD rating on Shalby as
positive aspects 1) brand loyalty in joint
replacement, 2) calibrated expansion in other
procedures and geographies to de-risk and 3)
leverage free balance sheet are slightly undone by
asset concentration risk.
We keep Fortis Healthcare Under Review due to the
pending litigations on some aspects

ICICI Securities | Retail Research 12
ICICI Direct Research
Sector Report | Hospitals
Exhibit 17: Operating matrix compendium
Operational Highlights
(Q2FY19)
Apollo
Hospitals
(Healthcare
delivery)
Narayana HCG Aster DM Shalby
Fortis
(Hospital
segment)
Max India
(Hospital
segment)
No. of healthcare facilities 70 50 24 25 11 24 14
Beds capacity (no.) 9373 7162 2031 4794 2012 NA NA
Operational Beds (no.) 7450 6323 ~1870 3515 1200 3663 2385
Bed occupancy Rate (%) 68% ~59% 43% 63% 48% 72% 75%
ARPOB (| per day) 36,982 26,301 32,769 56,400 29,399 42,192 49,607
ARPOB (| crore p.a) 1.3 1.0 1.2 2.1 1.1 1.5 1.8
ALOS (days) 3.9 3.5 2.0 3.0 4.3 3.2 3.5
Countries IndiaIndia
Cayman Islands
India
Kenya
GCC
India
India
Africa
India India
Presence
Madurai, Karur,
Karaikudi,
Trichy, Nellore,
Hyderabad,
Karimnagar,
Vizag, Kakinada,
Bangalore,
Mysore,
Jayanagar,
Malleswaram,
Bhubaneswar,
Bilaspur, Nashik
& Navi Mumbai
Jammu, Delhi
NCR, Jaipur,
Ahmedabad,
Mumbai,
Shimoga, Bellary,
Bengaluru,
Mysore, Rajpur,
Jamshedpur,
Durgapur, Kolkata,
Guwahati
Bhavnagar,
Rajkot,
Ahmedabad,
Chennai, Jaipur,
Kolkata, Ranchi,
Cuttack,
Vishakapatnam,
Ongole,
Vijaywada,
Nagpur, Borivali,
Nasik, Delhi
NCR,
Ahmedabad,
Baroda,
Gulbarga,
Bangalore, Hubli,
Shimoga
India - Guntur,
Vijaywada,
Ongole,
Bengaluru,
Kozhikode,
Kottakkal,
Kochi,
Wayanad,
Kannur,
Kolhapur,
Hyderabad
GCC - Riyadh,
Muscat,
Sohar, Ibri,
Doha, Dubai,
Sharjah
India - Vapi,
Jabalpur,
Indore,
Mumbai,
Jaipur,
Ahmedabad,
Surat &
Mohali
Africa - Kenya,
Tanzania,
Ethiopia,
Sudan,
Rwanda
Amritsar,
Ludhiana,
Mohali,
Chandigarh,
Delhi NCR,
Dehradun,
Jaipur,
Bangalore,
Chennai,
Kolkata,
Mumbai, Navi
Mumbai
Kangra
Saket,
Patparganj,
Vaishali,
Shalimar Bagh,
Mohali,
Bathinda,
Dehradun, Delhi
NCR, Gurugram,
Noida,Greater
Noida,
Pitampura
Financial highlights (FY19
Consolidated)
Apollo
Hospitals
Narayana HCG Aster DM Shalby Fortis Max India*
Revenues (| crore) 9617.44 2860.92 976.03 7962.71 460.95 4578.04 2921.00
EBITDA (| crore) 1064.64 287.881 111.57 862.8 82.17 -0.48 242.00
EBITDA margin (%) 11.07 10.06 11.43 10.84 17.83 -0.01 8.28
Total Assets(| crore) 7948.62 2214.85 1247.23 7091.54 873.98 11951.27 NA
CMP (as on 9th December'19) 1466.35 304.00 101.35 154.10 102.70 138.50 76.85
Market Cap (| crore) 20400.62 6212.57 898.37 7785.55 1109.26 10456.17 2064.69
Total Debt (| crore) 3673.06 813.47 657.90 2788.44 70.82 2010.27 NA
Cash (| crore) 346.96 100.72 20.87 341.14 74.61 855.85 NA
EV (| crore) 23726.72 6925.31 1535.40 10232.85 1105.47 11610.59 NA
EV/Sales (x) 2.47 2.42 1.57 1.29 2.40 2.54 NA
EV/EBITDA (x) 22.29 24.06 13.76 11.86 13.45 NA NA
Asset Turnover (x) 1.54 1.20 0.90 1.57 0.60 0.50 1.32
Equity (| crore) 69.56 202.80 87.92 505.23 108.01 754.95 53.72
ROE (%) 7.08 5.49 -5.20 10.37 4.06 -4.53 -3.07
ROCE (%) 8.83 7.72 2.99 8.33 6.80 2.49 NA
Source: ICICI Direct Research, Company; Narayana Bed Occupancy - FY19, Apollo’s operational data is for owned hospitals, * Max India Financials are relating to the Healthcare segment.

ICIC
I S
ecurit
ies –
Retail E
quit
y R
esearch
Com
pany U
pdate
CMP: | 1466 Target: | 1800 (23%) Target Period: 12 months
Apollo Hospitals (APOHOS)
BUY
December 10, 2019
Best integrated model in healthcare space…
Apollo Hospitals has one of the best integrated business models in the
healthcare space with a strong management pedigree. It has a presence
across the value chain of hospitals, pharmacies and recently entered retail
healthcare business like Apollo Clinics, Apollo Sugar, White Dental, Apollo
Day Surgery centres, Apollo Cradle and Diagnostic segment through its
subsidiary Apollo Health & Lifestyle Ltd. In hospital segment, the company
owns 70 hospitals with total bed capacity of 10262 beds. In case of
pharmacies, which are basically drug stores chain selling prescription, OTC
and private label products, the company owns 3607 stores as on H1FY20.
Healthcare expansion moderate; focus on asset sweating
Rapid expansion and maturity of older hospitals has kept the overall growth
tempo at 12-14% per annum. However, constant addition is likely to put
some pressure on EBITDA margins and return ratios in the short to medium
term. Similarly, existing hospital margins are being compressed due to 1)
regulation on stent/implants pricing, 2) negative GST impact and 3) higher
guarantee fees to the doctors. However, in the past, the company has
demonstrated its ability to balance between expansion and profitability. We
expect healthcare sales to grow at a CAGR of 12.5% in FY19-22E to | 7324.6
crore mainly due to strong growth at new hospitals and AHLL.
Pharmacy business EBITDA continues to improve
The pharmacy business (40% of FY19 revenues) has grown at ~22% CAGR
in the last five years on the back of consistent addition of new pharmacies
and timely closure of non-performing pharmacies. FY19 margins were at
5.2%. We expect the pharmacy business to grow at ~15% CAGR in FY19-
22E to | 5129 crore mainly on the back of new addition and improvement in
realisation owing to ramp up in private label contribution.
Valuation & Outlook
The company continues to deliver a healthy set of numbers on the revenues
and cost fronts. The overall narrative is panning out on expected lines with
sustained margin expansion and improvement in RoCE, as guided by the
management at the beginning of the last fiscal. The management has
reiterated a similar strategy, going ahead, with more focus on consolidation
of the existing hospitals and making new hospitals profitable. The company
has one of the best integrated business models in the healthcare space with
a strong management pedigree. The management has reiterated plans for
phased promoters pledge reduction. We value the stock on an SOTP basis
by valuing the healthcare business (existing hospitals & JV) at 13x FY22E
EV/EBITDA, healthcare business (new hospitals and JVs) and pharmacy
business at 1.5x FY22E EV/sales. We have a target price of | 1800.
Key Financial Summary
FY19 FY20E FY21E FY22E CAGR (FY19-22E) %
Net Sales 9617.4 11175.6 12625.2 14232.4 14.0
EBITDA 1064.6 1640.5 1968.5 2285.2 29.0
EBITDA margins (%) 11.1 14.7 15.6 16.1
PAT 236.0 351.4 608.4 948.1 59.0
EPS (|) 17.0 25.3 43.7 68.1
PE (x) 86.4 58.1 33.5 21.5
P/BV (x) 6.1 5.6 5.0 4.2
RoE (%) 7.1 9.7 14.9 19.6
RoCE (%) 8.8 11.4 14.8 17.5
Source: ICICI Direct Research; Company
Particulars
Particular Amount
Market Capitalisation | 20401 crore
Debt (FY19) | 3673 crore
Cash (FY19) | 347 crore
EV | 23727 crore
52 week H/L (|) 1580/1083
Equity capital | 69.6 crore
Face value | 5
Price Performance Graph
Research Analyst
Siddhant Khandekar
Mitesh Shah, CFA
Sudarshan Agarwal
0
2000
4000
6000
8000
10000
12000
0
200
400
600
800
1000
1200
1400
1600
1800
Dec-16
Jun-17
Dec-17
Jun-18
Dec-18
Jun-19
Dec-19
Apollo(L.H.S) NSE500(R.H.S)

ICICI Securities | Retail Research 14
ICICI Direct Research Company Update | Apollo Hospitals
Company Background
Established in 1983, the company is one of the few listed players in the
healthcare space. It derives revenues from two broader segments in the
standalone accounts - 1) healthcare services i.e. hospitals and 2) standalone
pharmacies. In the consolidated accounts, other reporting segments are – 1)
hospital revenues from JVs/subsidiaries and associates, 2) Apollo-Munich
Health insurance JV, 3) Apollo Health & Lifestyle Ltd, which is the retail
healthcare business of Apollo Hospitals.
Apollo owns 70 hospitals with a total bed capacity of 10167 beds. Of these
70 hospitals, 44 are owned by the company (including JVs, subsidiaries and
associates) while five are managed by the company with 934 beds while 11
are day care/short surgical stay centres with 267 beds and 11 cradles with
283 beds.
In case of managed hospitals, the company charges 5-6% management fees
for third party hospitals for project management and consultancy covering
all facets of development and operation of a hospital, including market
research, technical design, arranging finance, hiring manpower and running
the facility.
The healthcare segment has been divided into four clusters- 1) Tamil Nadu
Region (Chennai and others), 2) Andhra Pradesh, Telangana region
(Hyderabad, others) 3) Karnataka Region (Bangalore, others) and 3) others
that include hospitals in Bhubaneswar, Bilaspur, Nashik and Navi Mumbai.
In June 2015, the company acquired a 51% stake in Assam Hospitals Ltd,
which runs a 220 bed hospital in Guwahati.
Apollo Healthcare and Lifestyle Ltd (AHLL) subsidiary covers the retail
healthcare business of the Apollo group, comprising Apollo Clinics, Apollo
Sugar, White Dental, Apollo Day Surgery centres and Apollo Cradle. AHLL
reported | 459 crore of sales in FY18.
Apollo Sugar Clinics is a one stop shop for diabetics and offer packages to
better manage diabetes through a combination of prescriptions, dietary,
exercise regimens and other lifestyle changes apart from management of
diabetes related complications. Sanofi has 20% stake in Apollo Sugar Clinics
business. The company has 30 Apollo Sugar Clinics.
Apollo Day Surgery centres focus on planned surgeries done in a day/short
stay basis. The company has 12 centres as of FY18.
Apollo Cradle denotes lifestyle birthing centres. It launched the first Apollo
Cradle in Delhi a decade ago and currently has three centres in the network,
and plans to add five more centres - two in Hyderabad, two in Delhi and one
in Bengaluru.
In FY15, AHLL acquired 11 day and short stay surgery centres (over 350
beds) from Nova Specialty Hospitals with a presence in eight cities across
India. This acquisition provides APL an opportunity to provide quality
healthcare delivery closer to home and also entry in new markets such as
Mumbai, Jaipur and Kanpur.
In case of standalone pharmacies, which are basically drug stores chain
selling prescription, OTC and private label FMCG products, the company
owns 2742 stores in FY17. In FY15, the company acquired Hyderabad-based
Hetero Med Solutions Ltd (HMSL). HMSL has ~320 stores across Telangana,
Andhra Pradesh and Tamil Nadu.
The Apollo board has decided to segregate the front-end retail pharmacy
business carried out in the standalone pharmacy segment into a separate
company Apollo Pharmacies (APL) as part of the proposed reorganisation.
APL to focus on- 1) Building a growth platform for the standalone
pharmacies business to get to a medium-term target of over 5000 pharmacy
outlets over five years with a goal of over | 10,000 crore sales and 30% RoCE
for the stand-alone pharmacy business in five years, 2) enabling foray into
digital commerce as part of Apollo’s omni-channel strategy to provide
consumers increased convenience and ability to choose between online and

ICICI Securities | Retail Research 15
ICICI Direct Research
Company Update | Apollo Hospitals
physical stores, 3) Enhancing the private label business further from the
current 6 + % levels to over 12% in five years through a combination of both
broadening and deepening the product portfolio.
APL will become a wholly owned subsidiary of Apollo Medicals Pvt Ltd
(AMPL). The entire shareholding of AMPL will be held by Apollo and certain
identified investors. Apollo will hold 25.5% of the total share capital of AMPL
with other investors collectively holding the remaining share capital of
AMPL. Specifically, Jhelum Investment Fund 1 will hold 19.9%, Hemendra
Kothari will hold 9.9 % while Enam Securities Pvt Ltd will hold 44.7% of the
total share capital of AMPL.
Apollo shall have the right to acquire the shares of AMPL from investors in
compliance with the regulatory framework. Apollo will be the exclusive
supplier for APL under a long-term supplier agreement while Apollo will
enter into a brand licencing agreement with APL to licence the “Apollo
Pharmacy” brand to the frontend stores and online pharmacy operations.
The proposed reorganisation is not expected to have a material impact on
the financials of Apollo as the backend business related to the standalone
pharmacies, which represents ~85% of the business economics, will
continue to be held by Apollo. The structure is likely to take Apollo one step
closer to a potential unlocking of value in the standalone pharmacy segment.
For the purposes of effectuating the restructuring, Apollo will transfer the
business of the front-end retail pharmacy business carried out in the
standalone pharmacy segment to APL by way of slump sale under a scheme
of arrangement with such transfer being effective from April 1, 2019. The
slump sale has been decided at | 527.8 crore.

ICICI Securities | Retail Research 16
ICICI Direct Research Company Update | Apollo Hospitals
Exhibit 1: Revenues to grow at CAGR of 14% over FY19-22E
Source: ICICI Direct Research, Company
Exhibit 2: Hospitals to grow at CAGR of 12% over FY19-22E
Source: ICICI Direct Research, Company
Exhibit 3: Pharmacy to grow at CAGR of 15% over FY19-22E
Source: ICICI Direct Research, Company
Exhibit 4: AHLL to grow at CAGR of 21% over FY19-22E
Source: ICICI Direct Research, Company
Exhibit 5: EBITDA & margins trend
Source: ICICI Direct Research, Company
Exhibit 6: RoE & RoCE trend
Source: ICICI Direct Research, Company
5178.5
6214.7
7254.9
8243.5
9617.4
11175.6
12625.2
14232.4
0.0
2000.0
4000.0
6000.0
8000.0
10000.0
12000.0
14000.0
16000.0
FY15 FY16 FY17 FY18 FY19 FY20E FY21E FY22E
(|
crore)
Revenues
CAGR 16.7%
CAGR 14.0%
3221.4
3703.34085.1
4515.6
5142.1
5837.1
6543.1
7324.6
0.0
2000.0
4000.0
6000.0
8000.0
FY15 FY16 FY17 FY18 FY19 FY20E FY21E FY22E
(|
crore)
Healthcare Services
CAGR 12.4%
CAGR 12.5%
1772.6
2322.0
2785.2
3268.9
3886.0
4592.2
5206.5
5857.0
0.0
1000.0
2000.0
3000.0
4000.0
5000.0
6000.0
7000.0
FY15 FY16 FY17 FY18 FY19 FY20E FY21E FY22E
(|
crore)
Pharmacy
CAGR 21.7%
CAGR 14.7%
111.0
189.4
385.4458.9
588.8
729.7
875.6
1050.8
0.0
200.0
400.0
600.0
800.0
1000.0
1200.0
FY15 FY16 FY17 FY18 FY19 FY20E FY21E FY22E
(|
crore)
AHLL
CAGR 51.8%
CAGR 21.3%
734.7 687.8 728.6793.2
1064.6
1640.5
1968.5
2285.2
14.2
11.110.0
9.6
11.1
14.715.6
16.1
0.0
4.0
8.0
12.0
16.0
20.0
0.0
500.0
1000.0
1500.0
2000.0
2500.0
FY15 FY16 FY17 FY18 FY19 FY20E FY21E FY22E
(%
)
(|
crore)
EBITDA EBITDA Margins (%)
9.9
6.6 6.1 6.2
8.8
11.4
14.8
17.5
10.4
5.36.0 3.6
7.1
9.7 14.9
19.6
0.0
5.0
10.0
15.0
20.0
25.0
FY15 FY16 FY17 FY18 FY19 FY20E FY21E FY22E
(%
)
RoCE (%) RoNW (%)

ICICI Securities | Retail Research 17
ICICI Direct Research
Company Update | Apollo Hospitals
Exhibit 7: One-year forward EV/EBITDA
Source: ICICI Direct Research, Bloomberg
Exhibit 8: Valuation
Particulers Valuation Matrix Multiple (x) EV (| cr)
Healthcare (Existing Hospitals & JV) EV/EBITDA 13.0 16,329
Healthcare (New Hospitals) EV/Sales 1.5 3,039
Pharmacy EV/Sales 1.5 7,468
Others EV/Sales 1.0 1,428
Net Debt FY21E (| cr) 3,269.7
Targeted MCap (| cr) 24,995
No of shares (cr) 13.9
Per Share Value (|) 1,800
Source: ICICI Direct Research, Bloomberg
Exhibit 9: Summary
Revenues Growth EPS Growth P/E EV/EBITDA RoNW RoCE
(| crore) (%) (|) (%) (x) (X) (%) (%)
FY19 9617 16.7 17.0 100.6 22.2 2.5 8.8 10.1
FY20E 11176 16.2 25.3 48.8 14.0 2.1 11.4 12.5
FY21E 12625 13.0 43.7 73.2 11.4 1.8 14.8 15.5
FY22E 14232 12.7 68.1 55.8 9.5 1.5 17.5 18.2
Source: ICICI Direct Research, Bloomberg
0
5000
10000
15000
20000
25000
30000
35000
40000D
ec-16
Jun-17
Dec-17
Jun-18
Dec-18
Jun-19
Dec-19
(|
crore)
EV 20.9x 16.2x 13.8x 10.2x 7.8x

ICICI Securities | Retail Research 18
ICICI Direct Research
Company Update | Apollo Hospitals
Financial Summary
Exhibit 10: Profit & Loss (| crore)
(Year-end March) FY19 FY20E FY21E FY22E
Revenues 9,617.4 11,175.6 12,625.2 14,232.4
Growth (%) 16.7 16.2 13.0 12.7
Raw Material Expenses 4,660.9 5,395.8 6,095.6 6,871.6
Employee Expenses 1,598.2 1,852.8 2,093.1 2,359.6
Other expenditure 2,293.7 2,286.5 2,467.9 2,716.0
Total Operating Expenditure 8,552.8 9,535.1 10,656.6 11,947.2
EBITDA 1,064.6 1,640.5 1,968.5 2,285.2
Growth (%) 34.2 54.1 20.0 16.1
Depreciation 395.5 593.4 625.8 658.2
Interest 327.0 528.8 418.9 355.9
Other Income 31.4 59.5 101.0 113.9
PBT 373.5 577.7 1,024.8 1,384.9
Total Tax 173.4 218.2 358.7 346.2
MI & Profit from Associates 35.9 -8.2 -57.7 -90.7
Adjusted PAT 236.0 351.4 608.4 948.1
Growth (%) 100.6 48.8 73.2 55.8
EPS (Adjusted) 17.0 25.3 43.7 68.1
Source: ICICI Direct Research
Exhibit 11: Cash Flow Statement (| crore)
(Year-end March) FY19 FY20E FY21E FY22E
Profit/(Loss) after taxation 200.2 351.4 608.4 948.1
Add: Depreciation & Amortization 395.5 593.4 625.8 658.2
Working Capital Changes -45.8 -139.7 -129.5 -144.1
CF from operating activities 549.9 805.1 1,104.7 1,462.2
Change in Capex -672.0 -1,973.4 -260.0 -260.0
(Inc)/dec in Investments -103.6 0.0 -300.0 -300.0
Others -177.5 12.0 62.9 96.1
CF from investing activities -953.2 -1,961.4 -497.1 -463.9
Issue of Equity 0.0 0.0 0.0 0.0
Inc/(dec) in loan funds 234.7 1,481.2 -500.0 -700.0
Dividend paid & dividend tax -83.7 -72.4 -125.4 -195.4
Others -365.5 0.0 0.0 0.0
CF from financing activities -214.5 1,408.8 -625.4 -895.4
Net Cash flow -617.8 252.5 -17.8 102.9
Opening Cash 417.2 347.0 599.5 581.7
Closing Cash -200.5 599.5 581.7 684.6
Free Cash Flow -122.1 -1,168.3 844.7 1,202.2
Source: ICICI Direct Research
Exhibit 12: Balance Sheet (| crore)
(Year-end March) FY19 FY20E FY21E FY22E
Equity Capital 69.6 69.6 69.6 69.6
Reserve and Surplus 3,263.9 3,542.8 4,025.8 4,778.5
Total Shareholders funds 3,333.5 3,612.4 4,095.4 4,848.0
Total Debt 3,673.1 3,250.3 2,750.3 2,050.3
Lease Liabilities 0 1904 1904 1904
Deferred Tax Liability 314.9 321.2 327.6 334.1
Minority Interest 135.5 146.8 209.2 304.9
Long term provisions 11.4 11.7 11.9 12.1
Other Non Current Liabilities 480.3 489.9 499.7 509.7
Total Liabilities 7,948.6 9,736.3 9,798.1 9,963.2
Gross Block - Fixed Assets 6,252.9 8,426.3 8,886.3 9,346.3
Accumulated Depreciation 1,624.0 2,217.5 2,843.3 3,501.5
Net Block 4,628.9 6,208.8 6,043.0 5,844.8
Capital WIP 821.8 621.8 421.8 221.8
Goodwill on Consolidation 346.2 346.2 346.2 346.2
Total Fixed Assets 5,796.8 7,176.8 6,811.0 6,412.7
Investments 468.2 468.2 768.2 1,068.2
Inventory 584.8 679.5 767.7 865.4
Debtors 1,023.2 1,189.0 1,343.2 1,514.2
Loans & Advances, & other CA 456.4 645.6 332.1 294.9
Cash 347.0 599.5 581.7 684.6
Total Current Assets 2,212.9 2,731.1 2,960.9 3,337.9
Creditors 713.1 828.7 936.1 1,055.3
Provisions & Other CL 393.0 410.6 426.2 474.9
Total Current Liabilities 1,234.5 1,360.4 1,478.5 1,608.6
Net Current Assets 978.4 1,370.7 1,482.4 1,729.3
Long term loans & advances 687.8 701.5 715.6 729.9
Deferred Tax Assets 17.4 19.1 21.0 23.1
Application of Funds 7,948.6 9,736.3 9,798.1 9,963.2
Source: ICICI Direct Research
Exhibit 13: Key Ratios (| crore)
(Year-end March) FY19 FY20E FY21E FY22E
Per share data (|)
Adjusted EPS 17.0 25.3 43.7 68.1
BV per share 239.6 259.7 294.4 348.5
Dividend per share 6.9 5.2 9.0 14.0
Cash Per Share 24.9 43.1 41.8 49.2
Operating Ratios (%)
Gross Profit Margins 51.5 51.7 51.7 51.7
EBITDA margins 11.1 14.7 15.6 16.1
Net Profit margins 2.5 3.1 4.8 6.7
Inventory days 22.2 22.2 22.2 22.2
Debtor days 38.8 38.8 38.8 38.8
Creditor days 27.1 27.1 27.1 27.1
Asset Turnover 1.5 1.3 1.4 1.5
EBITDA Conversion Rate 51.7 49.1 56.1 64.0
Return Ratios (%)
RoE 7.1 9.7 14.9 19.6
RoCE 8.8 11.4 14.8 17.5
RoIC 10.1 12.5 15.5 18.2
Valuation Ratios (x)
P/E 86.4 58.1 33.5 21.5
EV / EBITDA 22.2 14.0 11.4 9.5
EV / Net Sales 2.5 2.1 1.8 1.5
Market Cap / Sales 2.1 1.8 1.6 1.4
Price to Book Value 6.1 5.6 5.0 4.2
Solvency Ratios
Debt / EBITDA 3.5 2.0 1.4 0.9
Debt / Equity 1.1 0.9 0.7 0.4
Net Debt / Equity 1.1 0.9 0.6 0.4
Current Ratio 1.5 1.6 1.6 1.6
Source: ICICI Direct Research

ICIC
I S
ecurit
ies –
Retail E
quit
y R
esearch
Com
pany U
pdate
CMP: | 304 Target: | 360 (18%) Target Period: 12 months
Narayana Hrudayalaya (NARHRU)
BUY
December 10, 2019
Stellar numbers; vital parameters continue to improve
Incorporated by renowned cardiac surgeon Dr Devi Prasad Shetty in 2000,
Narayana Hrudayalaya (Narayana) operates as a chain of multispecialty
hospitals. Started predominantly in Karnataka and Eastern India, the
company is growing its footsteps in western and northern India as well. We
reiterate our BUY recommendation on the stock as we believe it is well
poised to thrive in the domestic healthcare delivery (hospitals) space on the
back of its asset right business model with focus on quality and affordability.
Blended model of affordable + high-quality services
The company has a legacy model based on affordability over the years. Due
to strict control over costs and capital, the company was making reasonable
profits. However, as it looks to scale up in other regions, where the
consideration for quality has more weight than affordability, the model is
likely to be modified from ‘’affordable’’ to a mix of affordable + quality at
premium. Cases in point are the recent acquisition of Gurugram Hospital and
buying out of partner in the Cayman Islands hospital internationally where
acquisition costs were optically higher.
‘’Asset right model’’ to improve return ratios
Under this model, the company engages with partners who invest in land
and building while it takes care of medical equipment and hospital
management on a revenue share basis. However, the management has
maintained a flexible approach in this regard. Thus, it also owns some
hospitals where the opportunity is right. Due to this focus on balance sheet
and likely improvement in average realisation per operating bed (ARPOB) by
optimising the case mix, we expect an improvement in RoCE from 7.7% to
16.5% in FY19-22E.
Valuations & Outlook
A persistent improvement in occupancy rate across all segments coupled
with substantial seasonality impact propelled both revenue growth, margins
in H1. The new hospitals (SRCC, Gurugram, Dharamshila) continue to see a
reduction in losses as the ramp-up in these assets is slowly but surely
improving. The management reiterated a significant moderation in capex.
On the M&A front, this should improve return ratios gradually. The
improvement, sustainability of these vital prints hold key as the focus now
shifts to improvement in operating leverage. This was clearly visible in H1
performance. The improvement in numbers over the last few quarters is also
on the back of a judicious case mix identification (more focus on transplants
as well as non-invasive procedures). We continue to believe in the long term
prospects of the company on the back of asset-right model and affordability
philosophy. We arrive at an SOTP target price of | 360 by valuing the
matured hospitals and Cayman Islands at 8x of FY22E EV/EBITDA, new
hospitals at 1.5x FY22E EV/sales and other business at 1x FY22E EV/sales.
Key Financial Summary
(| Crore) FY19 FY20E FY21E FY22E CAGR FY19-22E %
Revenues 2860.9 3226.2 3488.7 3808.0 10.0
EBITDA 287.9 444.8 503.3 585.0 26.7
EBITDA Margins (%) 10.1 13.8 14.4 15.4
Adjusted PAT 59.3 146.3 199.8 272.3 66.2
EPS (|) 2.9 7.2 9.8 13.3
PE (x) 104.7 42.5 31.1 22.8
EV to EBITDA (x) 24.1 15.7 13.5 11.1
Price to book (x) 5.7 5.2 4.5 3.8
RoE (%) 5.5 12.2 14.5 16.7
RoCE (%) 7.7 12.0 13.9 16.5
Source: ICICI Direct Research; Company
Particulars
Particular Amount
Market Capitalisation | 6213 crore
Debt (FY19) | 813 crore
Cash (FY19) | 101 crore
EV | 6925 crore
52 week H/L (|) 319/181
Equity capital | 204.4 crore
Face value | 10
Price Performance Graph
Research Analyst
Siddhant Khandekar
Mitesh Shah, CFA
Sudarshan Agarwal
0
2000
4000
6000
8000
10000
12000
0
100
200
300
400
Dec-16
Jun-17
Dec-17
Jun-18
Dec-18
Jun-19
Dec-19
Narayana(L.H.S) NSE500(R.H.S)

ICICI Securities | Retail Research 20
ICICI Direct Research Company Update | Narayana Hrudayalaya
Company Background
Narayana was incorporated by renowned cardiac surgeon Dr Devi Prasad
Shetty in 2000. It was started as a predominant cardiac care hospitals group
initially. Gradually, it also diversified into other specialties although cardiac
still remains a mainstream specialty followed by renal (kidney care).
Narayana network comprises 24 hospitals (including three managed
hospitals), seven heart centres, 19 primary care facilities (including clinics
and information centres) a multi-speciality hospital in Cayman Islands by
entering into agreement with the Government of Cayman Islands. The
company has 6283 operational beds and the potential to reach a capacity of
up to 7155 beds. Region wise, southern (mainly Karnataka) and eastern
(mainly Kolkata) regions together account for 81% of the operating revenues
(FY18).
Cluster wise bifurcation
Karnataka cluster – Comprises seven hospitals including four in Bengaluru
and a hospital each in Mysore, Bellary and Shimoga totalling 2213
operational beds. The company also manages six heart centres totalling 322
operating beds.
Eastern cluster - Comprises nine hospitals including hospitals in the greater
Kolkata area encompassing Howrah, Barasat and the Eastern Metropolitan
Bypass, a multispecialty hospital in Jamshedpur, Jharkhand, a
superspeciality hospital in Guwahati, Assam and a hospital in Durgapur,
West Bengal totalling 2105 operational beds. The company also manages a
heart centre in Durgapur, West Bengal, totalling 49 operational beds.
Western and northern clusters - Comprises five hospitals - Jaipur
(Rajasthan), Palanpur (Gujarat), Ahmedabad (Gujarat), paediatric hospital in
Mumbai (Maharashtra), Raipur (Chhattisgarh), Jammu and Delhi totalling
1474 current operational beds. The company acquired a multispecialty
hospital has commissioned in Q4FY18.
Health City Cayman Islands (HCCI) - Narayana had set up a multi-speciality
hospital in Cayman Islands by entering into an agreement with the
Government of Cayman Islands on April 7, 2010. Health City Cayman Islands
(HCCI) is a joint venture between Narayana and Ascension Health Ventures
LLC, a US based trust. This 106 bedded hospital was commissioned in April
2014 and earned JCI, US accreditation in May, 2015 (JCI is the international
arm of The Joint Commission, the leading health care accreditor in the US).
Narayana had initially entered into the JV with 28.6% stake in the hospital
and then bought back the rest of the 71.4% stake from Ascension Health for
a cash consideration of US$32 million in 2017 (implied EV of US$70 million
for 105 beds). Now, it is the step down subsidiary of Narayana Health. HCCI
primarily targets North American patients (Cayman Islands is 430 miles
south of Miami, near Caribbean islands) and provides high-quality,
affordable health care. For FY19, HCCI revenues was at US$54.5 million with
EBITDA at US$9.5 million (EBITDA margin of 17.4%). For FY19, the hospital
was running at ~32% occupancy rate.
As of FY19, it has 16690 employees, which included 3644 doctors.

ICICI Securities | Retail Research 21
ICICI Direct Research Company Update | Narayana Hrudayalaya
Exhibit 1: Revenues to grow at CAGR of 10% over FY19-22E
Source: ICICI Direct Research, Company
Exhibit 2: EBITDA & EBITDA margins trend
Source: ICICI Direct Research, Company
Exhibit 3: Net profit to grow at 66% CAGR over FY19-22E
Source: ICICI Direct Research, Company
Exhibit 4: RoE & RoCE trend
Source: ICICI Direct Research, Company
1363.9
1613.9
1878.2
2281.4
2862.8
3226.2
3488.7
3808.0
0
500
1000
1500
2000
2500
3000
3500
4000
FY15 FY16 FY17 FY18 FY19 FY20E FY21E FY22E
(|
crore)
Revenues
CAGR 20.4%
CAGR 10.0%
123.7
174.6
228.9212.6
287.9
444.8
503.3
585.0
9.1
10.8
12.2
9.310.1
13.814.4
15.4
0
2
4
6
8
10
12
14
16
18
0
100
200
300
400
500
600
700
FY15 FY16 FY17 FY18 FY19 FY20E FY21E FY22E
(%
)
(|
crore)
EBITDA EBITDA Margins (%)
-5.8
32.2
84.4
51.2 59.3
146.3
199.8
272.3
-50
0
50
100
150
200
250
300
FY15 FY16 FY17 FY18 FY19 FY20E FY21E FY22E
(|
crore)
Net Profit
5.9
8.8
12.5
6.3
7.7
12.0
13.9
16.5
-0.8
3.7
8.8
4.9
5.5
12.2
14.5
16.7
-2
0
2
4
6
8
10
12
14
16
18
FY15 FY16 FY17 FY18 FY19 FY20E FY21E FY22E
(%
)
RoCE (%) RoE (%)

ICICI Securities | Retail Research 22
ICICI Direct Research Company Update | Narayana Hrudayalaya
Exhibit 5: Valuation
Particulers Valuation Matrix Multiple (x) Enterprise value (| cr)
Hospital (Matured) EV/EBITDA 8.0 5749.8
Cayman EV/EBITDA 8.0 1102.6
Hospital (New) EV/Sales 1.5 563.5
Other Business EV/Sales 1.0 187.2
Net Debt FY22E (| cr) 285.0
EV (| cr) 7318.1
No of shares (cr) 20.4
Per Share Value (|) 360.0
Source: Company
Exhibit 6: One-year forward EV/EBITDA
Source: Bloomberg, ICICI Direct Research
Exhibit 7: Valuation
Revenues Growth Adj. EPS Growth P/E EV/EBITDA RoE RoCE
(| crore) (%) (|) (%) (x) (X) (%) (%)
FY19 2860.9 77.3% 2.9 0.8 104.7 24.1 5.5 7.7
FY20E 3226.2 12.8% 7.2 146.6% 42.5 15.7 12.2 12.0
FY21E 3488.7 8.1% 9.8 36.6% 31.1 13.5 14.5 13.9
FY22E 3808.0 9.2% 13.3 36.3% 22.8 11.1 16.7 16.5
Source: ICICI Direct Research, Company
-2000
0
2000
4000
6000
8000
10000
12000
14000
16000
Dec-16
Mar-17
Jun-17
Sep-17
Dec-17
Mar-18
Jun-18
Sep-18
Dec-18
Mar-19
Jun-19
Sep-19
Dec-19
(|
crore)
Narayana 29.4x 27.4x 23.3x 11.1x 2.9x

ICICI Securities | Retail Research 23
ICICI Direct Research Company Update | Narayana Hrudayalaya
Financial Summary
Exhibit 8: Profit & Loss (| crore)
(Year-end March) FY19 FY20E FY21E FY22E
Revenues 2,860.9 3,226.2 3,488.7 3,808.0
Growth (%) 25.4 12.8 8.1 9.2
Raw Material Expenses 687.5 774.5 837.5 914.2
Employee Expenses 624.1 696.6 753.2 822.2
Other Manufacturing Expenses 1,261.5 1,310.3 1,394.6 1,486.6
Total Operating Expenditure 2,573.0 2,781.3 2,985.4 3,223.0
EBITDA 287.9 444.8 503.3 585.0
Growth (%) 35.4 54.5 13.2 16.2
Interest 71.4 87.3 68.0 48.6
Depreciation 137.4 170.2 179.1 188.1
Other Income 16.7 14.5 10.5 15.2
PBT before Exceptional Items 95.8 201.8 266.8 363.6
Less: Forex & Exceptional Items 0.0 0.0 0.0 0.0
PBT 95.8 201.8 266.8 363.6
Total Tax 34.1 53.5 67.0 91.3
PAT before MI 61.7 148.3 199.8 272.3
Minority Interest 0.0 0.0 0.0 0.0
PAT 59.3 146.3 199.8 272.3
Adjusted PAT 59.3 146.3 199.8 272.3
Growth (%) 16.0 146.6 36.6 36.3
EPS 2.9 7.2 9.8 13.3
EPS (Adjusted) 2.9 7.2 9.8 13.3
Source: ICICI Direct Research
Exhibit 9: Cash Flow Statement (| crore)
(Year-end March) FY19 FY20E FY21E FY22E
Profit/(Loss) after taxation 39.4 146.3 199.8 272.3
Add: Depreciation & Amortization 137.4 170.2 179.1 188.1
Net Increase in Current Assets -7.8 -52.1 -40.5 -48.3
Net Increase in Current Liabilities 16.1 51.2 40.3 47.9
Others 93.5 87.3 68.0 48.6
CF from operating activities 278.6 402.9 446.6 508.6
(Inc)/dec in Fixed Assets -149.5 -345.7 -200.0 -150.0
(Inc)/dec in Investments -10.0 0.0 0.0 0.0
Others -26.4 12.2 13.4 14.8
CF from investing activities -185.9 -333.4 -186.6 -135.2
Inc / (Dec) in Equity Capital 0.4 0.0 0.0 0.0
Inc / (Dec) in Debt 27.6 87.3 -200.0 -200.0
Dividend & Dividend Tax 0.0 -23.8 -23.8 -23.8
Others -55.3 -87.3 -68.0 -48.6
CF from financing activities -27.3 -23.8 -291.7 -272.3
Net Cash flow 65.5 45.7 -31.6 101.1
Opening Cash 35.3 100.7 146.4 114.8
Closing Cash 100.7 146.4 114.8 215.8
Free Cash Flow 129.1 57.2 246.6 358.6
Source: ICICI Direct Research
Exhibit 10: Balance Sheet (| crore)
(Year-end March) FY19 FY20E FY21E FY22E
Equity Capital 204.4 204.4 204.4 204.4
Reserve and Surplus 876.8 999.3 1,175.4 1,423.9
Total Shareholders funds 1,081.1 1,203.7 1,379.7 1,628.3
Total Debt 813.5 900.8 700.8 500.8
Deferred Tax Liability 47.9 52.7 57.9 63.7
Minority Interest 0.4 0.4 0.5 0.5
Other liabilities 272.0 299.2 329.1 362.0
Source of Funds 2,214.8 2,456.7 2,468.0 2,555.3
Gross Block - Fixed Assets 2,438.6 2,784.3 2,984.3 3,134.3
Accumulated Depreciation 666.5 836.6 1,015.7 1,203.8
Net Block 1,772.1 1,947.7 1,968.6 1,930.5
Capital WIP 56.1 56.1 56.1 56.1
Net Fixed Assets 1,828.2 2,003.7 2,024.7 1,986.6
Goodwill on Consolidation 66.0 66.0 66.0 66.0
Investments 17.4 17.4 17.4 17.4
Inventory 83.2 93.7 101.4 110.7
Cash 100.7 146.4 114.8 215.8
Debtors 266.4 300.3 324.7 354.4
Loans & Advances & Other CA 77.0 84.7 93.2 102.5
Total Current Assets 527.4 625.1 634.0 783.4
Creditors 333.5 375.9 406.5 443.6
Provisions & Other CL 88.7 97.5 107.3 118.0
Total Current Liabilities 422.2 473.4 513.7 561.7
Net Current Assets 105.2 151.7 120.3 221.7
LT L& A, Other Assets 193.9 213.3 234.7 258.1
Deferred Tax Assets 4.1 4.5 4.9 5.4
Application of Funds 2,214.8 2,456.7 2,468.0 2,555.3
Source: ICICI Direct Research
Exhibit 11: Key Ratios (| crore)
(Year-end March) FY19 FY20E FY21E FY22E
Per share data (|)
EPS 2.9 7.2 9.8 13.3
Cash EPS 1.7 6.0 8.6 12.2
BV 52.9 58.9 67.5 79.7
DPS 1.2 1.2 1.2 1.2
Cash Per Share 32.6 40.9 49.7 58.9
Operating Ratios (%)
EBITDA margins 10.1 13.8 14.4 15.4
Net Profit margins 2.1 4.5 5.7 7.2
Cash Conversion cycle 2.1 2.1 2.1 2.1
Asset Turnover 1.2 1.2 1.2 1.2
Return Ratios (%)
RoE 5.5 12.2 14.5 16.7
RoCE 7.7 12.0 13.9 16.5
RoIC 8.4 14.0 16.4 20.4
Valuation Ratios (x)
P/E 104.7 42.5 31.1 22.8
EV / EBITDA 24.1 15.7 13.5 11.1
EV / Revenues 2.4 2.2 1.9 1.7
Market Cap / Revenues 2.2 1.9 1.8 1.6
Price to Book Value 5.7 5.2 4.5 3.8
Solvency Ratios
Net Debt / Equity 0.8 0.7 0.5 0.3
Net Debt / EBITDA 2.5 1.7 1.2 0.5
Current Ratio 1.0 1.0 1.0 1.0
Source: ICICI Direct Research

ICIC
I S
ecurit
ies –
Retail E
quit
y R
esearch
Stock T
ale
s
CMP: | 154 Target: | 210 (36%) Target Period: 12 months
Aster DM Healthcare (ASTDM)
BUY
December 10, 2019
Blended model focusing on Gulf, India...
Established in 1987 by Dr Azad Moopen as a single clinic, Aster DM
Healthcare (Aster) comprises one of the largest healthcare networks. It
includes 25 hospitals (bed capacity 4794), 231 pharmacies and 115 clinics
across Gulf Cooperation Council (GCC) countries and India. GCC contributes
~81% to revenues while India accounts for the rest. Aster has a presence in
nine GCC countries with a strong network of clinics (107), pharmacies (231)
and hospitals (12). In the hospitals segment, it covers across-the-class
income population in the GCC region under Medcare (high income), Aster
(mid income) and Access (lower income) brands. In India, it has a network
of ~13 hospitals and eight clinics mainly in south India.
Strong RoCE in GCC despite aggressive expansion
Aster derives ~81% of revenues from GCC countries. In the last six years,
the company has expanded its hospitals, clinics and pharmacy count by
almost 2x. However, despite aggressive expansion, the RoCE has remained
healthy (hospitals- 13% (established hospitals - 27%), clinics - 25% and
pharmacies - 45%) due to 1) asset light model, 2) integrated business model,
3) faster occupancy owing to strong brand equity, 4) healthy ARPOB and 5)
targeted strategy. We believe RoCE will improve further due to continuing
improvement in occupancy and operational leverage at new assets.
Expanding presence in India
Being a late entrant notwithstanding, Aster has a network of ~13 hospitals
and eight clinics, mainly in Tier II and Tier III cities in India. The company is
now looking to expand its network in metros and Tier I cities, which is likely
to improve its overall ARPOB. However, due to continuous expansion and
few specific issues (floods in Kerala) the company’s RoCE in India is just 2%.
This is dragging the company’s overall RoCE. To improve the return ratios,
the company is focusing on an asset light model for future expansion.
Valuation & Outlook
Aster has a unique business model among Indian healthcare service
providers with a strong established presence in GCC and India. While the
India expansion remains on an investment curve, a firm footing and FCF
generation from the GCC set-up is keeping the entire scheme of things under
control, especially when the company is pursuing aggressive expansion in
both GCC and India albeit via an asset light model. We are positive on Aster’s
integrated business model and expect a gradual improvement in margins
and RoCE on the back of higher occupancy and capacity optimisation in new
assets from FY20E onwards. At the current level, we envisage a favourable
risk-reward matrix. Hence, we initiate coverage on the company with a BUY
recommendation and target price of | 210 (SOTP basis).
Key Financial Summary (| crore)
| Crore FY19 FY20E FY21E FY22E CAGR FY19-22 (%)
Revenues 7962.7 9190.5 10279.3 11340.5 12.5
EBITDA 862.8 1190.4 1371.5 1569.8 22.1
EBITDA margins (%) 10.8 13.0 13.3 13.8
Net Profit 333.1 253.7 449.6 680.9 26.9
EPS (|) 6.6 5.0 8.9 13.5
PE (x) 23.4 30.7 17.3 11.5
M.Cap/ Revenues (x) 1.0 0.8 0.8 0.7
EV to EBITDA (x) 11.9 8.7 7.2 5.8
RoCE (%) 8.3 8.4 10.3 12.3
ROE 10.4 7.3 11.5 14.8
Source: ICICI Direct Research; Company
Particulars
Particular
Market Capitalisation
Debt (FY19)
Cash (FY19)
EV
52 week H/L (|) 169/110
Equity capital
Face value | 10
MF Holding (%) 3.7%
FII Holding (%) 12.3%
Amount
| 7786 crore
| 2788 crore
| 22 crore
| 10552 crore
| 505.2 crore
Price Performance Graph
Research Analyst
Siddhant Khandekar
Mitesh Shah, CFA
Sudarshan Agarwal
0
2000
4000
6000
8000
10000
12000
0
50
100
150
200
250
Feb-18
May-18
Aug-18
Nov-18
Feb-19
May-19
Aug-19
Nov-19
Aster DM(L.H.S) NSE500(R.H.S)

ICICI Securities | Retail Research 25
ICICI Direct Research
Stock Tales | Aster DM Healthcare
Company Background
Aster DM Healthcare (Aster) commenced operations in 1987 as a single
doctor clinic in Dubai established by Dr Azad Moopen. The company was
incorporated in 2008 in a reorganisation to facilitate the growth of
operations, subsequent to which operations in GCC states and India were
consolidated. Aster is one of the largest private healthcare service providers,
which operates in multiple GCC states based on number of hospitals and
clinics besides an emerging presence in India.
The company currently operates in all the GCC states, which comprise the
United Arab Emirates (UAE), Oman, Saudi Arabia, Qatar, Kuwait, Bahrain
and Jordan (that is classified as a GCC state as part of the company’s GCC
operations), India and the Philippines. Its GCC operations are headquartered
in Dubai (UAE) and Indian operations are headquartered in Kochi, Kerala.
Aster operates in multiple segments of the healthcare industry, including
hospitals, clinics, retail pharmacies and provides healthcare services to
patients across economic segments in several GCC states through various
brands like Aster, Medcare and Access. Aster and other brands are widely
recognised in GCC states both by healthcare professionals and patients.
The company has a diversified portfolio of healthcare facilities, consisting of
12 hospitals, 107 clinics (five in Philippines) and 231 retail pharmacies in the
GCC states, 13 multi-specialty hospitals and eight clinics in India as of
Q2FY20. According to the Frost & Sullivan Report, the company operates
the largest chain of retail pharmacies in the UAE based on number of centres
as of FY19. The company’s hospitals in India are located in-
Kerala (four hospitals)
Aster Medcity, Kochi
Aster MIMS, Calicut
Aster MIMS, Kottakkal
DM WIMS, Wayanad
Aster MIMS, Kannur
Andhra Pradesh (four hospitals and four clinics)
Ramesh Hospitals, Guntur
Ramesh Hospitals, MG Road
Ramesh Hospitals, Vijayawada
Ramesh Hospitals: Ongole
Clinics (four)
Karnataka (two hospitals and four clinics)
Aster CMI, Bangalore
Aster RV Hospital
Clinics (four)
Maharashtra (one hospital)
Aster Aadhar, Kolhapur
Telangana (one hospital)
Aster Prime, Ameerpet
It has an employee base of 20565 employees as of Q2FY20, including 2971
doctors, 6531 nurses and 11063 other employees (including pharmacists).
In addition, it has 1250 “fee for service” doctors working across various
specialities in hospitals in India. A majority of the company’s hospitals and
clinics provide secondary and tertiary healthcare services to patients. In
addition to providing core medical, surgical and emergency services, some
of the company’s hospitals provide complex and advanced quaternary
healthcare in various specialties, including cardiology, oncology, radiology,
ophthalmology, neurosciences, paediatrics, gastroenterology, orthopaedics
and critical care services. In all, five of the company’s hospitals, one clinic
and one diagnostic centre have obtained Joint Commission International
(JCI) accreditation.
Aster is one of the largest private healthcare service
providers, which operates in multiple GCC states
based on number of hospitals and clinics besides an
emerging presence in India
The company currently operates in all the GCC
states, India and the Philippines
Aster provides healthcare services to patients
across economic segments in several GCC states
through various brands like Aster, Medcare and
Access
The company has a diversified portfolio of healthcare
facilities, consisting of 12 hospitals, 107 clinics (five
in Philippines) and 231 retail pharmacies in the GCC
states, 13 multi-specialty hospitals and eight clinics
in India as of Q2FY20
It has an employee base of 20565 employees as of
Q2FY20, including 2971 doctors, 6531 nurses and
11063 other employees (including pharmacists)

ICICI Securities | Retail Research 26
ICICI Direct Research
Stock Tales | Aster DM Healthcare
Of the total revenues from operations for H1FY20, the hospital segment
accounted for 52%, clinic segment accounted for 22% while the retail
pharmacy segment accounted for 26%. The company’s operations in India,
which primarily consists of hospitals, accounted for 19% of total revenues
from operations for H1FY20.
Exhibit 1: Segment break-up (H1FY20)
Source: Company, ICICI Direct Research
Exhibit 2: Revenue break-up across geographies & segments (FY19)
Source: *| 66 crore revenue is unallocated, ICICI Direct Research, Company
Hospitals
52%Pharmacies
26%
Clinics
22%
Aster DM (| 6721cr)
GCC (| 5620 cr)
Hospitals (| 2074
cr)Clinics (| 1748 cr)
Pharmacies (|
1798 cr)
India (| 1167 cr)
hospitals & clinics
Of the total revenues from operations for H1FY20,
hospital segment accounted for 52%, clinic segment
accounted for 22% and retail pharmacy segment
accounted for 26%
Payee Mix (Q1FY20)
Source: Company
Walk-ins
63%
Corporate
4%
TPA/Insurance
18%
Govt. schemes
9%
MVT
6%

ICICI Securities | Retail Research 27
ICICI Direct Research Stock Tales | Aster DM Healthcare
Exhibit 3: UAE - Geographies, segments and brands
Source: ICICI Direct Research, Company
It owns 12 hospitals in the GCC states (seven in UAE, three in Oman, one
each in Qatar and Saudi Arabia), with a total of 1101 installed beds, and 12
hospitals in India, totalling 3693 installed beds as of H1FY20.
Exhibit 4: Existing list of hospitals
Region Hospital City State/Country Year Total Beds Operational Beds Owned/Leased
India Dr. Ramesh Guntur Guntur Andhra Pradesh 2016 350 175 Leased
India Dr. Ramesh Main Centre Vijaywada Andhra Pradesh 2016 184 160 Leased
India Dr. Ramesh- Labbipet Vijaywada Andhra Pradesh 2016 54 50 Leased
India Dr. Ramesh Sanghamitra-Ongole Ongole Andhra Pradesh 2018 150 150 Owned
India Aster CMI Bengaluru Karnataka 2014 509 326 O&M
India MIMS Kozhikode Kozhikode Kerala 2013 678 527 Owned
India MIMS Kottakkal Kottakkal Kerala 2013 229 171 Owned
India Aster Medcity Kochi Kerala 2014 670 455 Owned
India DM WIMS Wayanad Wayanad Kerala 2016 NA NA O&M
India MIMS Kannur Kannur Kerala 2019 302 237 Owned
India Aster Aadhar Hospital Kolhapur Maharashtra 2008 176 151 Owned
India Prime Hospitals Ameerpet Hyderabad Telangana 2014 158 112 Leased
India Aster RV Hospital Bengaluru Karnataka 2019 233 92 O&M
GCC Sanad Hospital Riyadh KSA 2011 218 218 Owned
GCC Al Raffa Hospital Muscat Oman 2009 85 72 Leased
GCC Al Raffa Hospital Sohar Oman 2010 74 64 Leased
GCC Ibri Hospital Ibri Oman 2019 31 24 Leased
GCC Aster Hospital Doha Qatar 2017 61 28 Leased
GCC Medcare Hospital Dubai UAE 2007 64 55 Leased
GCC Medcare Orthopaedics and Spine Hospital Dubai UAE 2012 33 27 Leased
GCC Aster Hospital Mankhool Dubai UAE 2015 126 108 Leased
GCC Medcare Women and Child Hospital Dubai UAE 2016 108 91 Leased
GCC Medcare Hospital Sharjah UAE 2017 130 113 Leased
GCC Aster Hospital Qusais Dubai UAE 2018 154 99 Leased
GCC Cedars Hospital Dubai UAE 2019 17 10 Leased
Source: ICICI Direct Research, Company
It owns 12 hospitals in the GCC states with a total of
1101 installed beds, and 12 hospitals in India

ICICI Securities | Retail Research 28
ICICI Direct Research Stock Tales | Aster DM Healthcare
GCC healthcare market - Some unique aspects on which Aster
is banking…
Stable growth rate and bed addition expectation
According to a 2018 GCC Healthcare Industry Report by Alpen Capital, the
current healthcare expenditure (CHE) in the GCC is projected to grow ~7%
to US$104.6 billion in 2022 from an estimated US$76.1 billion in 2017. The
expanding and ageing population, high prevalence of non-communicable
diseases (NCDs), rising cost of treatment and increasing penetration of
health insurance are some key factors spurring the growth of the healthcare
market in the region.
The UAE and Oman are likely to witness growth rates of above 9%, in
anticipation of a fast-growing population, implementation of mandatory
health insurance and above-average medical inflation rates.
In view of the anticipated rise in the number of patients, GCC may require a
collective bed capacity of 118,300 by 2022, indicating demand for 12,350
new beds. Saudi Arabia is likely to witness the largest requirement at over
7,500 new beds, followed by the UAE at more than 2,000 new beds.
Owing to volatile oil prices, diversification of the economy has remained a
priority for governments across the GCC. Also, despite troubled economic
times and fiscal instability, spending on healthcare has continued to grow.
Hence, the private sector has increasingly been considered as a key partner
in the long-term development of the healthcare industry.
The private sector is playing an important part in the development of the
healthcare industry, encouraged by mandatory health insurance and other
reforms. Private players are also incentivised through public-private
partnerships (PPP) to invest and manage operations while the public sector
becomes the regulator.
GCC countries embrace structural changes; to benefit hospitals
in long run
In 2014, a mandatory health insurance law for Dubai was enacted and rolled-
out in three main phases, to insure every employee (including foreign
employees who constitute ~80% of the entire working population) and
dependent residing in Dubai by 2017. As a result, close to 100% of Dubai’s
population is now covered by medical insurance. Similarly, in 2016, the
Health Authority of Abu Dhabi (HAAD) made certain amendments in its
health insurance programme, with people getting health benefits at private
healthcare facilities to receive about 80% of the coverage whereas those
who get government health assistance would receive 100% coverage. The
introduction of mandatory health insurance in Abu Dhabi has resulted in an
immediate rise in healthcare services of over 40%.
Approval of 100% foreign ownership by UAE cabinet in healthcare
In a recent development, the UAE Cabinet approved 100% foreign
ownership in specified sectors including healthcare. The decision abolished
a decades-old law that limits foreign ownership to just 49%. This bodes well
for foreign companies listed elsewhere to ward off ownership related
concerns raised by minority shareholders.
Long-term residence visas in UAE
In 2019, the UAE implemented a new system for long-term residence visas.
The new system enables foreigners to live, work and study in the UAE
without requiring a national sponsor and with 100% ownership of their
business on the UAE’s mainland. These visas will be issued for five or 10
years and be renewed automatically.
According to a 2018 GCC Healthcare Industry Report
by Alpen Capital, the current healthcare expenditure
(CHE) in the GCC is projected to grow ~7% to
US$104.6 billion in 2022. The expanding and ageing
population, high prevalence of non-communicable
diseases (NCDs), rising cost of treatment and
increasing penetration of health insurance are some
key factors spurring the growth of the healthcare
market in the region
In view of the anticipated rise in the number of
patients, GCC may require a collective bed capacity
of 118,300 by 2022, indicating demand for 12,350
new beds
The private sector is playing an important part in the
development of the healthcare industry, encouraged
by mandatory health insurance and other reforms
UAE’s healthcare funding strategy to support
expansion of private sector -- 100% of Dubai’s
population is covered by medical insurance. In Abu
Dhabi, getting health benefits at private healthcare
facilities would receive about 80% of coverage
whereas those who get government health
assistance would receive 100% coverage
In a recent development, the UAE Cabinet approved
100% foreign ownership in specified sectors
including healthcare
In 2019, the UAE implemented a new system for
long-term residence visas. These visas will be
issued for five or 10 years and will be renewed
automatically

ICICI Securities | Retail Research 29
ICICI Direct Research Stock Tales | Aster DM Healthcare
Medical tourism opportunities in GCC region
Inbound medical tourism is expected to be a key growth driver for the GCC
region, especially the UAE. The UAE has been at the forefront of the medical
tourism industry in the Middle East with Dubai being promoted as a major
hub for medical tourism in the country. With as many as 214 Joint
Commission Accredited (JCI) healthcare establishments (hospitals, nursing,
clinics), UAE is well equipped to cater to the growing demand for in-bound
medical tourism by leveraging its position as one of the leading tourists
destination in the world. The announcement of the 10-year visa for highly
specialised professionals, such as doctors is likely to encourage the best
talent to come to the UAE, thus having a significant impact on medical
tourism.
Aster GCC
Exhibit 5: Total 81% of Aster GCC revenues from UAE
Source: ICICI Direct Research, Company
Exhibit 6: Aster GCC geography and clinic mix
Source: ICICI Direct Research, Company
Aster’s established presence in GCC with strong brand equity
Aster has a renowned brand in GCC across the healthcare value chain from
clinics, pharmacies to hospitals. The company commenced operations in
GCC in 1987 as a single doctor clinic in Dubai established by its founder Dr
Azad Moopen.
The company has a diversified portfolio of healthcare facilities, consisting of
12 hospitals, 103 clinics and 238 retail pharmacies in GCC states as of
H1FY20. Aster is well placed to capitalise on steady growth in the healthcare
sector in GCC states due to its early mover advantage, brand stickiness
across the healthcare space and strategy of offering different brands to cater
to a diverse group of customers and existing track record. The company’s
Medcare and Aster brands address the needs of the upper and middle
income segments in GCC states, respectively, while the Access brand offers
affordable healthcare services to blue collar expatriate workers and lower
income segment in GCC states.
Similarly, the presence of pharmacies at multiple locations across various
GCC states also enhances the visibility of Aster’s brands. The company’s
long-standing presence in GCC states has helped it to gain an understanding
of the respective markets, regulatory environments and has contributed
towards the success of GCC operations.
Recent legislative developments such as mandatory health insurance in a
couple of countries and extended visas to expats is likely to provide a further
boost to tertiary and quaternary care treatments in GCC countries.
Aster’s GCC revenues (81% of total revenues in H1FY20) grew 18.6% on the
back of aggressive expansion across segments driven by to higher demand,
greater capacity optimisation, improved mix and growing in insurance
penetration.
UAE
81%
Oman
6%
Qatar
5%
Saudi Arabia
6%
Nos. Hospitals Clinics Pharmacies
UAE 7 85 198
Oman 3 7 7
Qatar 1 8 6
Saudi Arabia 1 NA NA
With as many as 214 Joint Commission Accredited
(JCI) healthcare establishments (hospitals, nursing,
clinics), UAE is well equipped to cater to the growing
demand for in-bound medical tourism by leveraging
its position as one of the leading tourists
destinations in the world
Aster has a renowned brand in GCC across the
healthcare value chain from clinic, pharmacy to
hospitals
The company has a diversified portfolio of healthcare
facilities, consisting of 12 hospitals, 103 clinics and
238 retail pharmacies in GCC states as of H1FY20
The company’s long-standing presence in GCC
states has helped it to gain an understanding of the
respective markets and regulatory environments
Recent legislative developments such as mandatory
health insurance in a couple of countries and
extended visas to expats is likely to provide a further
boost to tertiary and quaternary care treatments in
GCC countries

ICICI Securities | Retail Research 30
ICICI Direct Research Stock Tales | Aster DM Healthcare
Strong RoCE in GCC despite aggressive expansion
In the last six years, the company has increased its hospital, clinic and
pharmacy counts significantly (see exhibit 5). Despite aggressive expansion,
Aster’s RoCE has remained strong (hospitals – 13%, clinics – 25%
(established hospitals 29%) and pharmacies – 45%) due to 1) asset-light
model, 2) integrated business model, 3) faster occupancy space owing to
strong brand equity and 4) healthy AROPB and margins. We believe the
RoCE would improve further due to persistent occupancy and capacity
optimisation in the new assets.
Exhibit 7: Aggressive expansion across segments in GCC
No of units FY14 FY15 FY16 FY17 FY18 FY19 1HFY20
Hospitals 10 14 13 18 19 24 25
GCC 5 6 6 7 9 12 12
Clinics 45 69 87 96 101 114 116
Pharmacies 107 166 180 202 207 219 238
Source: ICICI Direct Research, Company;
Note: Clinics Includes GCC India (8 clinics), Philippine (5 clinics) and GCC clinics (103 clinics) as of 1HFY20
Superior margins, RoCE in pharmacy vis-à-vis domestic peers
Aster’s pharmacy business has almost double margins and RoCE compared
to Apollo Pharmacy (Aster margins -- 10% vs. Apollo margins -- 5.2%, &
Aster RoCE -- 45% vs. Apollo -- RoCE 18.7% in FY19). Aster has strategically
chosen the location of pharmacies with ~50% of retail pharmacies in the
UAE attached to clinics. This set-up enables higher footfalls in adjacent
pharmacies, which contribute 65-70% to the overall pharmacy EBITDA.
Expanding presence in India
Aster’s India revenues grew at 32.4% CAGR over FY15-19 mainly due to
lower base and aggressive expansion. In a shorter time span, [started
operation in 2008 by acquiring hospital in Kolhapur (Maharashtra)], Aster
has established a network of ~13 hospitals and eight clinics mainly in Tier
II, Tier III cities of south India. The company is now looking to expand its
network in metros and Tier I cities, which is likely to improve its overall
average revenue per operating bed (ARPOB). However, due to continuous
aggressive expansion and few specific issues (Kerala floods), the profitability
was significantly hampered leading overall India RoCE to just 2%, which is
also dragging the company’s overall RoCE. To improve this matrix, the
company is now looking at only asset-light model for its future expansion.
We expect the India business to grow at 13.6% CAGR in FY19-22E mainly
on the back of commission of new hospitals, ramp up in existing hospitals.
Exhibit 8: India hospitals expected to grow at 14% CAGR in FY19-22E
Source: ICICI Direct Research, Company
428.0
622.7
957.0
1,178.0
1,314.0
1,527.1
1,733.8
1,926.5
0.0
500.0
1,000.0
1,500.0
2,000.0
2,500.0
FY15 FY16 FY17 FY18 FY19 FY20 FY21 FY22
CAGR 32.4%
CAGR 13.6%
Strong RoCE in across GCC Segments
ROCE Existing Established
Hospitals 13% 27%
Clinics 25% 29%
Pharmacies 45% 45%
Source: ICICI Direct Research, Company
Peer Comparison in pharmacy
FY19 Aster Apollo
EBITDA margins 10.0% 5.2%
ROCE 45.0% 18.7%
Source: ICICI Direct Research, Company
Aster’s India revenues grew at 32.4% CAGR over
FY15-19 mainly due to a lower base and aggressive
expansion.
We expect India business to grow at 13.6% CAGR
over FY19-22E mainly on the back of commission of
new hospitals and ramp up in existing hospitals

ICICI Securities | Retail Research 31
ICICI Direct Research
Stock Tales | Aster DM Healthcare
Aster Healthcare ecosystem
Aster’s integrated healthcare framework is based on primary and tertiary
healthcare across GCC and India. In GCC, being an established player, the
company’s primary care clinics are the initial touch-points in the patient’s
journey while the hospitals and pharmacies continue the care beyond that
point. For complex tertiary care, the company transfers its patients to India.
Its Indian operations also act as a source of talent for the company’s GCC
operations. In a way, the company does enjoy the benefits of cost arbitrage.
Exhibit 9: Aster Healthcare ecosystem
Source: ICICI Direct Research, Company
Aster’s integrated healthcare framework is based on
primary and tertiary healthcare across GCC and India

ICICI Securities | Retail Research 32
ICICI Direct Research Stock Tales | Aster DM Healthcare
Financials
Revenues expected to grow at 12.5% CAGR over FY19-22E
We expect the consolidated revenues to grow at 12.5% CAGR in FY19-22E.
Aster is expected to grow at 13% CAGR in FY19-22E mainly due to capacity
optimisation, continuous expansion and favourable macroeconomic factors.
Exhibit 10: Revenues expected to grow at 13% CAGR in FY19-22E
Source: ICICI Direct Research, Company
GCC revenues expected to grow at 11% CAGR in FY19-22E
We expect GCC revenues of the company to grow at 11.3% CAGR in FY19-
22E. GCC hospitals are expected to grow at 11% CAGR in FY19-22E mainly
due to continuous expansion.
Exhibit 11: GCC to grow at 11% CAGR in FY19-22E
Source: ICICI Direct Research, Company
Exhibit 12: Hospitals to grow at 13% CAGR over FY19-22E
Source: ICICI Direct Research, Company
3875.8
5249.9
5931.3
6721.2
7962.7
9190.5
10279.3
11340.5
0.0
2000.0
4000.0
6000.0
8000.0
10000.0
12000.0
FY15 FY16 FY17 FY18 FY19 FY20E FY21E FY22E
CAGR 19.7%
CAGR 12.5%
3,447.8
4,352.6
5,260.0
5,923.0
6,823.0
7,663.4
8,545.5
9,414.0
0.0
1,000.0
2,000.0
3,000.0
4,000.0
5,000.0
6,000.0
7,000.0
8,000.0
9,000.0
10,000.0
FY15 FY16 FY17 FY18 FY19 FY20 FY21 FY22
CAGR 18.6%
CAGR 11.3%
1,474.6
1,829.6 1,824.0
2,091.0
2,655.0
3,042.2
3,437.5
3,783.6
0.0
500.0
1,000.0
1,500.0
2,000.0
2,500.0
3,000.0
3,500.0
4,000.0
FY15 FY16 FY17 FY18 FY19 FY20 FY21 FY22
CAGR 15.8%
CAGR 12.5%
GCC hospitals expected to grow at 13% CAGR over
FY19-22E mainly due to capacity optimisation,
continuous expansion and favourable
macroeconomic factors

ICICI Securities | Retail Research 33
ICICI Direct Research Stock Tales | Aster DM Healthcare
Exhibit 13: Clinics to grow at 10% CAGR over FY19-22E
Source: ICICI Direct Research, Company
Exhibit 14: Pharmacies to grow at 11% CAGR over FY19-22E
Source: ICICI Direct Research, Company
India revenues expected to grow at 14% CAGR over FY19-22E
Aster’s India revenues grew at 32.4% CAGR over FY15-19E mainly due to
lower base and aggressive expansion. We expect the India business to grow
at 13.6% CAGR over FY19-22E mainly due to continuous expansion and
ramp up in new hospitals.
Exhibit 15: Aggressive expansion in India
Source: ICICI Direct Research, Company
Exhibit 16: India hospitals expected to grow at 14% CAGR over FY19-22E
Source: ICICI Direct Research, Company
908.6
1273.1
1644.0
1863.01990.0
2188.1
2401.0
2629.7
0.0
500.0
1000.0
1500.0
2000.0
2500.0
3000.0
FY15 FY16 FY17 FY18 FY19 FY20 FY21 FY22
CAGR 21.7%
CAGR 9.7%
1,064.6
1,249.9
1,792.0
1,969.0
2,178.0
2,433.1
2,707.0
3,000.8
0.0
500.0
1,000.0
1,500.0
2,000.0
2,500.0
3,000.0
3,500.0
FY15 FY16 FY17 FY18 FY19 FY20 FY21 FY22
CAGR 19.6%
CAGR 11.3%
5
13
15
18
2122
25
0
5
10
15
20
25
30
FY14 FY15 FY16 FY17 FY18 FY19 1HFY20
No of Hospitals commissioned in India
428.0
622.7
957.0
1,178.0
1,314.0
1,527.1
1,733.8
1,926.5
0.0
500.0
1,000.0
1,500.0
2,000.0
2,500.0
FY15 FY16 FY17 FY18 FY19 FY20 FY21 FY22
CAGR 32.4%
CAGR 13.6%

ICICI Securities | Retail Research 34
ICICI Direct Research Stock Tales | Aster DM Healthcare
Exhibit 17: EBITDA expected to grow at 22% CAGR over FY19-22E
Source: ICICI Direct Research, Company
Exhibit 18: Net profit expected to grow at 27% CAGR over FY19-22E
Source: ICICI Direct Research, Company
Exhibit 19: Expects improvement in profitability despite aggressive expansion
Source: ICICI Direct Research, Company
Exhibit 20: Expects improvement in Return ratios despite aggressive expansion
Source: ICICI Direct Research, Company
506.1444.8
331.9
610.5
862.8
1190.4
1371.5
1569.8
0.0
200.0
400.0
600.0
800.0
1000.0
1200.0
1400.0
1600.0
1800.0
FY15 FY16 FY17 FY18 FY19 FY20E FY21E FY22E
CAGR 14.3%
CAGR 22.1%
132.7
-59.0
101.8
264.3
333.1
253.7
449.6
680.9
-100.0
0.0
100.0
200.0
300.0
400.0
500.0
600.0
700.0
800.0
FY15 FY16 FY17 FY18 FY19 FY20E FY21E FY22E
CAGR 25.9%
CAGR 26.9%
13.1%
8.5%
5.6%
9.1%
10.8%
13.0%13.3%
13.8%
3.4%
-1.1%
1.7%
3.9% 4.2%
2.8%
4.4%
6.0%
-2.0%
0.0%
2.0%
4.0%
6.0%
8.0%
10.0%
12.0%
14.0%
16.0%
FY15 FY16 FY17 FY18 FY19 FY20E FY21E FY22E
EBITDA margins (%) EBITDA margins (%)
10.6
5.0
0.8
5.9
8.3 8.4
10.3
12.3
8.9
-14.1
5.4
9.310.4
7.3
11.5
14.8
-20.0
-15.0
-10.0
-5.0
0.0
5.0
10.0
15.0
20.0
FY15 FY16 FY17 FY18 FY19 FY20E FY21E FY22E
ROCE (%) ROE (%)

ICICI Securities | Retail Research 35
ICICI Direct Research Stock Tales | Aster DM Healthcare
Valuation & Outlook
The company has one of the most unique business models among Indian
healthcare services providers where the edifice of the Indian venture is
taking shape on a strong GCC base. We expect revenues, EBITDA and PAT
to grow at a CAGR of 13%, 13% and 21% in FY19-22E, respectively.
Revenues are expected to be driven by steady expansion and growth in new
hospitals, clinics and pharmacies. Margins are expected to be driven by an
improvement in occupancy ratios and operational efficiency in new
hospitals, especially in India.
The company is pursuing future expansion in both GCC and India via an
asset light model. It plans to spend | 400 crore every year to establish one
hospital each in GCC, India and on expansion of network of clinics and
pharmacies in GCC. We are positive on the company’s integrated business
model. We expect a gradual improvement in the company’s return ratios
and margins on the back of an improvement in occupancy and capacity
optimisation in new assets. We believe the apprehensions of the past capex
are more or less in the price. At the CMP, the risk-reward matrix looks
favourable from a long term perspective.
We value the stock on an SOTP basis by valuing the 1) GCC and India –
matured hospitals at 8x FY22E EV/EBITDA and new hospitals, pharmacy and
clinics at 1x FY22E EV/sales. We ascribe a target price of | 210.
Exhibit 21: Valuation
Particulers Valuation Matrix Multiple (x) EV (| cr)
GCC Mature Hospitals EV/EBITDA 8.0 3,933
India Mature Hospitals EV/EBITDA 8.0 1,608
GCC New Hospitals EV/Sales 1.0 711
India New Hospitals EV/Sales 1.0 540
Clinics EV/Sales 1.0 2,630
Pharmacies EV/Sales 1.0 3,001
Net Debt FY22E (| cr) 1,280.3
Minority Interest 620.3
Targeted MCap (| cr) 10,522
No of shares (cr) 50.5
Per Share Value (|) 210
Source: ICICI Direct Research, Company
Exhibit 22: One-year forward EBITDA
Source: ICICI Direct Research, Bloomberg
0
2000
4000
6000
8000
10000
12000
14000
16000
18000
Feb-18
May-18
Aug-18
Nov-18
Feb-19
May-19
Aug-19
Nov-19
(|
crore)
Aster DM 15.6x 14.8x 13.3x 8.7x 5.6x
We expect revenues, EBITDA and PAT to grow at a
CAGR of 13%, 13% and 21% in FY19-22E,
respectively
We believe the apprehensions of the past capex are
more or less in the price. At the CMP, the risk-reward
matrix looks favourable from a long term perspective

ICICI Securities | Retail Research 36
ICICI Direct Research
Stock Tales | Aster DM Healthcare
Risk & Concerns
Further improvement in hospitals financials hinges on India performance
With a firm footing in the GCC region, the performance of Indian assets will
be crucial for an overall improvement in important financial matrices.
However, Indian market dynamics are far more complex than GCC with a
longer gestation period, stiff competition and frequent regulatory
interventions by government agencies. We have observed that most of the
successful Indian corporate hospitals have flourished in at least two
specified regions before growing pan-India. Being a late entrant in India, the
task is already cut out for Aster.
Growth depends on new facilities
The company has added 15 hospitals, 71 clinics and 131 pharmacies
between FY14 and H1FY20. Aster is also planning to commission one new
hospital every year in India and GCC. Also, it is looking at continuous
addition in clinic and pharmacy segments in GCC. Any delay in
commissioning or expansion (reaching breakeven) of new facilities may
impact overall growth, thus impacting overall financials.

ICICI Securities | Retail Research 37
ICICI Direct Research Stock Tales | Aster DM Healthcare
Financial Summary
Exhibit 23: Profit and loss statement | crore
(Year-end March) FY19 FY20E FY21E FY22E
Revenues 7,962.7 9,190.5 10,279.3 11,340.5
Growth (%) 15.4 11.8 10.3
Raw Material Expenses 2,419.8 2,793.0 3,104.3 3,402.2
Employee Expenses 2,688.2 3,124.8 3,474.4 3,799.1
Other Manufacturing Expenses 1,991.9 2,082.4 2,329.1 2,569.5
Total Operating Expenditure 7,099.9 8,000.1 8,907.8 9,770.8
EBITDA 862.8 1,190.4 1,371.5 1,569.8
Growth (%) 38.0 15.2 14.5
Interest 179.2 331.3 268.6 195.0
Depreciation 306.5 568.7 594.2 618.9
Other Income 34.6 36.8 41.1 56.7
PBT before Exceptional Items 411.8 327.1 549.8 812.6
Less: Forex & Exceptional Items 1.5 0.0 0.0 0.0
PBT 410.3 327.1 549.8 812.6
Total Tax 42.9 39.3 66.0 97.5
PAT before MI 367.3 287.9 483.8 715.1
Minority Interest 34.2 34.2 34.2 34.2
PAT 333.1 253.7 449.6 680.9
Adjusted PAT 333.1 253.7 449.6 680.9
Growth (%) 26.0 -23.8 77.2 51.4
EPS 6.6 5.0 8.9 13.5
EPS (Adjusted) 6.6 5.0 8.9 13.5
Source: ICICI Direct Research
Exhibit 24: Cash Flow Statement | crore
(Year-end March) FY19 FY20E FY21E FY22E
Profit/(Loss) after taxation 333.1 253.7 449.6 680.9
Add: Depreciation & Amortization 306.5 568.7 594.2 618.9
Net Increase in Current Assets -728.7 -474.7 -431.4 -427.2
Net Increase in Current Liabilities 395.1 239.4 230.0 235.7
Others 179.2 331.3 268.6 195.0
Net cash flow from operating activities485.1 918.5 1,111.1 1,303.2
(Inc)/dec in Fixed Assets -917.6 -778.7 -400.0 -400.0
(Inc)/dec in Investments 15.6 0.0 0.0 0.0
Others 107.7 62.8 69.1 76.0
CF from investing activities -794.3 -715.9 -330.9 -324.0
Inc / (Dec) in Equity Capital 0.0 0.0 0.0 0.0
Proceeds/(Repayment) Loan 436.9 419.5 -522.0 -519.8
Dividend & Dividend Tax 0.0 0.0 0.0 0.0
Others -179.2 -331.3 -268.6 -195.0
CF from financing activities 257.7 88.2 -790.6 -714.7
Net Cash flow -51.4 290.7 -10.4 264.5
Opening Cash 299.8 341.1 631.9 621.5
Closing Cash 248.3 631.9 621.5 886.0
FCF -432.5 139.7 711.1 903.2
Source: ICICI Direct Research
Exhibit 25: Balance Sheet | crore
(Year-end March) FY19 FY20E FY21E FY22E
Equity Capital 505.2 505.2 505.2 505.2
Reserve and Surplus 2,708.5 2,962.2 3,411.8 4,092.7
Total Shareholders fund 3,213.8 3,467.4 3,917.1 4,598.0
Total Debt 2,788.4 3,208.0 2,686.0 2,166.2
Deferred Tax Liability 149.1 164.0 180.4 198.4
Minority Interest 466.1 512.7 563.9 620.3
Long term Provisions 266.7 293.3 322.6 354.9
Other Non Current Liabilities 207.6 228.3 251.1 276.2
Source of Funds 7,091.5 7,873.7 7,921.2 8,214.1
Gross Block - Fixed Assets 5,056.0 5,854.7 6,254.7 6,654.7
Accumulated Depreciation 1,612.4 2,181.1 2,775.3 3,394.2
Net Block 3,443.6 3,673.6 3,479.4 3,260.5
Capital WIP 550.0 530.0 530.0 530.0
Net Fixed Assets 3,993.6 4,203.6 4,009.4 3,790.5
Goodwill on Consolidation 845.0 845.0 845.0 845.0
Investments 22.1 22.1 22.1 22.1
Inventory 732.2 845.1 945.2 1,042.7
Cash 341.1 631.9 621.5 886.0
Debtors 2,028.7 2,341.5 2,618.9 2,889.3
Loans & Advances & Other CA 512.4 561.3 615.2 674.4
Total Current Assets 3,614.4 4,379.7 4,800.7 5,492.4
Creditors 1,014.1 1,170.4 1,309.1 1,444.2
Provisions & Other CL 830.8 913.9 1,005.3 1,105.8
Total Current Liabilities 1,844.9 2,084.3 2,314.4 2,550.0
Net Current Assets 1,769.5 2,295.4 2,486.4 2,942.4
LT L& A, Other Assets 453.1 498.4 548.2 603.1
Deferred Tax Assets 8.3 9.1 10.0 11.0
Application of Funds 7,091.5 7,873.7 7,921.2 8,214.1
Source: ICICI Direct Research
Exhibit 26: Ratio Analysis | crore
(Year-end March) FY19 FY20E FY21E FY22E
Per share data (|)
EPS 6.6 5.0 8.9 13.5
Cash EPS 6.6 5.0 8.9 13.5
BV 63.6 68.6 77.5 91.0
DPS 0.0 0.0 0.0 0.0
Cash Per Share 31.9 43.2 54.9 67.2
Operating Ratios (%)
Gross Profit 69.6 69.6 69.8 70.0
EBITDA margins 10.8 13.0 13.3 13.8
Net Profit margins 4.2 2.8 4.4 6.0
Inventory days 33.6 33.6 33.6 33.6
Debtor days 93.0 93.0 93.0 93.0
Creditor days 46.5 46.5 46.5 46.5
Assets Turnover 1.6 1.6 1.6 1.7
Return Ratios (%)
RoE 10.4 7.3 11.5 14.8
RoCE 8.3 8.4 10.3 12.3
RoIC 9.0 9.3 11.5 14.0
Valuation Ratios (x)
P/E 23.4 30.7 17.3 11.5
EV / EBITDA 11.9 8.7 7.2 5.8
EV / Revenues 1.3 1.1 1.0 0.8
Market Cap / Revenues 1.0 0.8 0.8 0.7
Price to Book Value 2.4 2.2 2.0 1.7
Solvency Ratios
Debt / Equity 0.9 0.9 0.7 0.5
Debt/EBITDA 3.2 2.7 2.0 1.4
Current Ratio 1.8 1.8 1.8 1.8
Source: ICICI Direct Research

ICIC
I S
ecurit
ies –
Retail E
quit
y R
esearch
Stock T
ale
s
CMP: | 102 Target: | 110 (8%) Target Period: 12 months
HealthCare Global Enterprises (HEAGLO)
HOLD
December 10, 2019
Oncology to the fore; balance sheet improvement key
HealthCare Global Enterprises (HCG) is a focused player in cancer & fertility
treatment. Under the HCG brand, the company operates the largest private
cancer care network with a pan-India presence. Established by oncologist
Dr Ajai Kumar in 1989, the HCG network consists of 25 pan-India cancer
centres, including 21 comprehensive cancer centres, three freestanding
diagnostic centres and one day care chemotherapy centre. The company’s
fertility centres under the Milann brand are one of the leading brands in IVF
in India, running eight centres across India. The company also operates four
multi-specialty hospitals in Ahmedabad, Bhavnagar, Rajkot and Hubli.
Comprehensive cancer treatment network with strong pedigree
HCG operates one of the largest private cancer care networks in India with
end-to-end solutions available under single corporate entity. This consisted
of 21 comprehensive cancer centres that provide a single point destination
for complete cancer care. Most centres are on lease or rental basis with
some in partnership with local doctors or hospitals. Owing to exclusive
agreement with vendors, HCG procures equipment on a deferred payment
basis. We expect revenues from the HCG centres to grow at 16.2% CAGR to
| 1436 crore mainly on the back of a ramp up of new hospitals.
Cancer – Rapidly growing, under reported segment in India
Cancer is one of the fastest growing lifestyle diseases in India. High
incidences of cancer in India can be attributed to rapid industrialisation,
ageing population, lifestyle and food habits, poor immune conditions,
genetic predisposition, hormonal imbalances, etc. As per Indian Council of
Medical Research (ICMR), in 2018, total number of new cancer cases in India
are estimated to be 15.7 lakh, which is likely to reach over 17.3 lakh by 2020.
However, the real incidence of cancer in India could be 1.5-2x higher than
the reported numbers (Ernst & Young report).
Valuation & Outlook
Cancer as a therapeutic category remains largely underpenetrated in India
despite a conducive business environment with growing awareness and
better diagnosis. HCG, with its integrated, one-stop-solution and focused
model, is well poised to capture the growing potential with a pan-India focus.
With an army of oncologists at its disposal who are well-versed with modern
technological advancements besides cutting-edged latest machines, the
ecosystem is well set for future growth. However, due to aggressive
expansion (seven centres in past 18 months), the company’s balance sheet
has been leveraged significantly (D/E 1.4x and debt/EBITDA 5.9x in FY19).
This, besides weaker return ratios has been a major overhang on the stock.
We initiate coverage on HCG with a HOLD recommendation and a target
price of | 110 (10x FY22E EV/EBITDA). Moderation of capex and
improvement in return ratios are key triggers to re-rate the stock.
Key Financial Summary (| crore)
| Crore FY19 FY20E FY21E FY22E CAGR FY19-22E (%)
Revenues 976.0 1159.1 1336.2 1545.3 16.6
EBITDA 111.6 137.1 174.1 216.8 24.8
EBITDA margins (%) 11.4 11.8 13.0 14.0
Net Profit -30.9 -94.1 -68.1 -34.3 NA
EPS (|) -2.8 -11.0 -7.9 -4.0
PE (x) NA NA NA NA
M.Cap/ Revenues (x) 0.9 0.8 0.7 0.6
EV to EBITDA (x) 13.8 15.5 12.5 9.7
RoCE (%) 3.0 1.2 2.5 4.3
ROE NA NA NA NA
Source: ICICI Direct Research; Company
Particulars
Particular
Market Capitalisation
Debt (FY19)
Cash (FY19)
EV
52 week H/L 249/94
Equity capital
Face value | 10
MF Holding (%) 16.43%
FII Holding (%) 30.12%
| 87.9 crore
| 1535 crore
Amount
| 898 crore
| 658 crore
| 21 crore
Price Performance
Research Analyst
Siddhant Khandekar
Mitesh Shah, CFA
Sudarshan Agarwal
0
2000
4000
6000
8000
10000
12000
0
50
100
150
200
250
300
350
400
Dec-16
Jun-17
Dec-17
Jun-18
Dec-18
Jun-19
Dec-19
HCG(L.H.S) NSE500(R.H.S)

ICICI Securities | Retail Research 39
ICICI Direct Research Stock Tales | HealthCare Global Enterprises
Company Background
The company is a provider of specialty healthcare in India focused on cancer
and fertility. Under the HCG brand, it operates the largest cancer care
network in India in terms of the total number of private cancer treatment
centres while under the Milann brand, it operates fertility centres.
Exhibit 1: HCG timeline
o
Source: ICICI Direct Research, Company
As of FY19, HCG’s network consisted of 21 comprehensive cancer centres
(including the company’s centre of excellence in Bengaluru), three
freestanding diagnostic centres and one day care chemotherapy centre
across India. Each of its comprehensive cancer centres offer, at a single
location, comprehensive cancer diagnosis and treatment services (including
radiation, medical oncology and surgical treatments). The company’s
freestanding diagnostic centres and day care chemotherapy centre offer
diagnosis and medical oncology services, respectively.
The company provides fertility treatment under its Milann brand. It acquired
50.10% equity interest in BACC Healthcare Pvt Ltd in 2013, which was
operating fertility centres under the Milann brand. During FY19, right to
shares for balance 49.9% has been acquired. The company operates eight
Milann fertility centres across Bengaluru, Delhi, Chandigarh and Ahmedabad
as on March 31, 2019. It consists of a team of 38 in-vitro fertilisation (IVF)
specialists and nine embryologists. Through this business, the company
provide comprehensive reproductive medicine services such as assisted
reproduction, gynaecological endoscopy and fertility preservation. It is
recognised as a premier training and academics institution offering
programmes for fertility specialists and embryologists. Cumulatively, till
March 2019, the company has treated 10000+ couples.
Revenue Break Up
Source: ICICI Direct Research; Company
Oncology
79%
Multi-
Specialty
14%
Fertility
7%

ICICI Securities | Retail Research 40
ICICI Direct Research
Stock Tales | HealthCare Global Enterprises
Under the Triesta brand, the company provides clinical reference laboratory
services in India with a specialisation in oncology, including molecular
diagnostic services and genomic testing. The company’s Triesta central
reference laboratory is located in its centre of excellence in Bengaluru.
Triesta offers research and development (R&D) services to pharmaceutical
and biotechnology companies in the areas of clinical trial management and
biomarker discovery and validation. Triesta is led by a team of specialist
oncopathologists, molecular biologists and clinical researchers.
The company operates four multi-specialty hospitals in Ahmedabad,
Bhavnagar, Rajkot and Hubli. The company provides comprehensive patient
care in key specialties including cardiology, neurology, orthopaedics,
gastroenterology, urology, internal medicine and pulmonary and critical
care.
Cluster wise revenue break-up
Source: ICICI Direct Research; Company
Payee Mix (FY19)
Source: Company
Karnata
ka
39%
Gujarat
29%
Maharashtra
14%
Andhra
Prades…
East
India
7%
Tamil
Nadu
4%
Cash
54%
Govt Schemes
15%
CGHS/ECHS
6%
TPA/Insurance
13%
Corporates
12%

ICICI Securities | Retail Research 41
ICICI Direct Research
Stock Tales | HealthCare Global Enterprises
Investment Rationale
Cancer - Fast growing but under reported segment in India
The cancer segment continues to be dynamic, especially in India, due to
rising incidence of cancer driven by increased awareness, diagnosis, genetic
and lifestyle factors.
In India, the incidence of lifestyle diseases is expected to increase faster than
any other segment. Within the lifestyle space, cancer is one of the fastest
growing segments. High incidence of cancer in India can be attributed to
factors like poor immune conditions, genetic predisposition and hormonal
conditions, industrialisation, ageing population, lifestyle and food habits.
According to an Ernst & Young report, the prevalence of cancer in India is
expected to increase from an estimated 39 lakh in 2015 to an estimated 71
lakh people by 2020. However, the biggest problem in India is enormous
under reporting of cancer cases. As per the Ernst & Young report, the real
incidence of cancer in India could be 1.5-2x higher than the reported
incidence. Also, as per Indian Council of Medical Research (ICMR), the total
number of new cancer cases in India are likely to reach over ~17 lakh in
2020 from ~15.7 lakh in 2018.
Exhibit 2: Number of new cancer cases in 2018
Source: ICICI Direct Research, Company
With incidences rising at a rapid pace, cancer is ranked as the sixth leading
cause of death in India. Of the new cases of cancer projected to have been
diagnosed in India each year, breast cancer in women and oral cancer for
men are among the top two cancers in terms of both incidence and
mortality. The cancer mortality rate in India is high, at 68% of the annual
incidence. This ratio indicates that fewer than 30% of Indian patients with
cancer survive five years or longer after diagnosis.
The reported incidence of cancer in India is based on data collected from
the cancer registries, which cover less than 10% of the population, resulting
in a significant margin of error in estimation. The gap between reported and
real cancer incidence can primarily be attributed to under-diagnosis of
cancer in India. The under diagnosis of cancer is represented in the relatively
late stage of presentation of cancer cases.
As per ICMR, only 12.5% of patients come for treatment in the early stages
of the disease. A case in point is breast screening with less than 1% of
women in India aged between 40 and 69 years participating in
recommended breast screening mammograms once in 24 months
compared to 32% in China and 67% in the US in 2015. As per the survey,
between 2009 and 2011, only 43% breast cancer cases were diagnosed at
early stages (i.e. stage I or stage II) of the disease in India. The corresponding
number was 62% in the US, 81% in the UK and 72% in China.
Breast
14%
Lip, oral cavity
10%
Cervix Uteri
8%
Lung
6%Stomach
5%
Other Cancers
57%
High incidence of cancer in India can be attributed to
factors such as poor immune conditions, genetic
predisposition and hormonal conditions,
industrialisation, ageing population, lifestyle and
food habits
According to an Ernst & Young report, the prevalence
of cancer in India is expected to increase from an
estimated 39 lakh in 2015 to an estimated 71 lakh
people by 2020
With incidences rising at a rapid pace, cancer is
ranked as the sixth leading cause of death in India
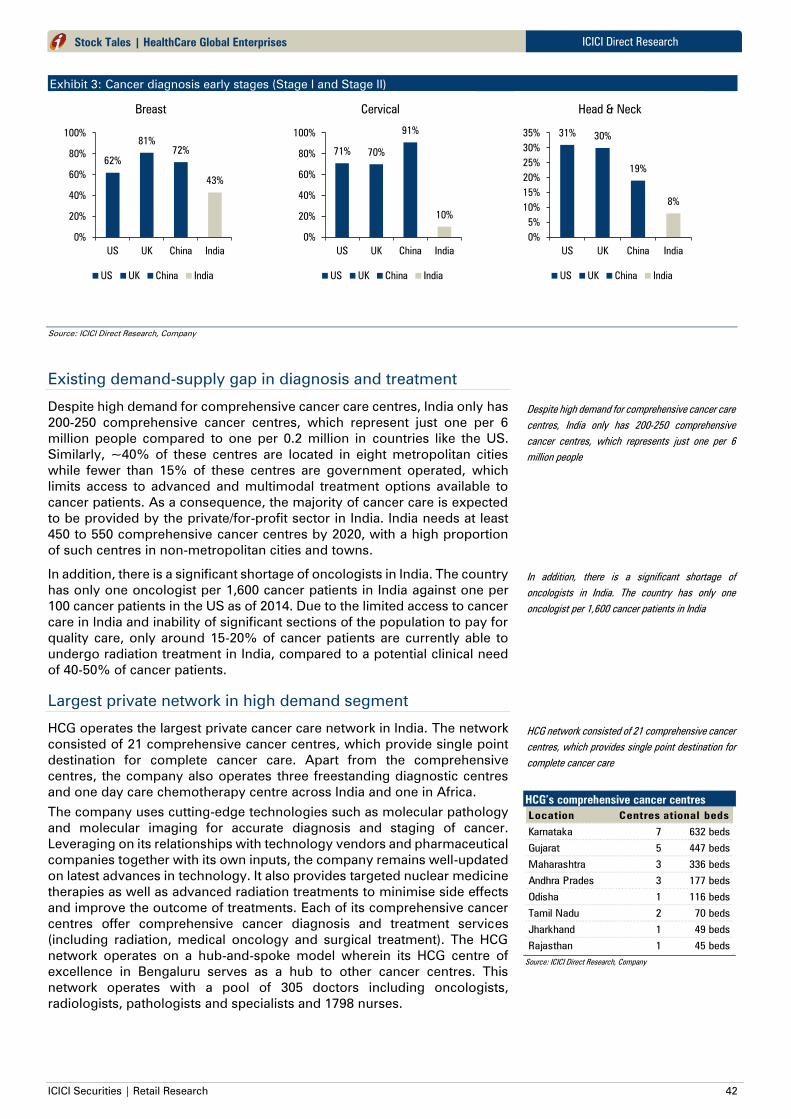
ICICI Securities | Retail Research 42
ICICI Direct Research
Stock Tales | HealthCare Global Enterprises
Exhibit 3: Cancer diagnosis early stages (Stage I and Stage II)
Source: ICICI Direct Research, Company
Existing demand-supply gap in diagnosis and treatment
Despite high demand for comprehensive cancer care centres, India only has
200-250 comprehensive cancer centres, which represent just one per 6
million people compared to one per 0.2 million in countries like the US.
Similarly, ~40% of these centres are located in eight metropolitan cities
while fewer than 15% of these centres are government operated, which
limits access to advanced and multimodal treatment options available to
cancer patients. As a consequence, the majority of cancer care is expected
to be provided by the private/for-profit sector in India. India needs at least
450 to 550 comprehensive cancer centres by 2020, with a high proportion
of such centres in non-metropolitan cities and towns.
In addition, there is a significant shortage of oncologists in India. The country
has only one oncologist per 1,600 cancer patients in India against one per
100 cancer patients in the US as of 2014. Due to the limited access to cancer
care in India and inability of significant sections of the population to pay for
quality care, only around 15-20% of cancer patients are currently able to
undergo radiation treatment in India, compared to a potential clinical need
of 40-50% of cancer patients.
Largest private network in high demand segment
HCG operates the largest private cancer care network in India. The network
consisted of 21 comprehensive cancer centres, which provide single point
destination for complete cancer care. Apart from the comprehensive
centres, the company also operates three freestanding diagnostic centres
and one day care chemotherapy centre across India and one in Africa.
The company uses cutting-edge technologies such as molecular pathology
and molecular imaging for accurate diagnosis and staging of cancer.
Leveraging on its relationships with technology vendors and pharmaceutical
companies together with its own inputs, the company remains well-updated
on latest advances in technology. It also provides targeted nuclear medicine
therapies as well as advanced radiation treatments to minimise side effects
and improve the outcome of treatments. Each of its comprehensive cancer
centres offer comprehensive cancer diagnosis and treatment services
(including radiation, medical oncology and surgical treatment). The HCG
network operates on a hub-and-spoke model wherein its HCG centre of
excellence in Bengaluru serves as a hub to other cancer centres. This
network operates with a pool of 305 doctors including oncologists,
radiologists, pathologists and specialists and 1798 nurses.
62%
81%
72%
43%
0%
20%
40%
60%
80%
100%
US UK China India
Breast
US UK China India
71% 70%
91%
10%
0%
20%
40%
60%
80%
100%
US UK China India
Cervical
US UK China India
31%30%
19%
8%
0%
5%
10%
15%
20%
25%
30%
35%
US UK China India
Head & Neck
US UK China India
Despite high demand for comprehensive cancer care
centres, India only has 200-250 comprehensive
cancer centres, which represents just one per 6
million people
In addition, there is a significant shortage of
oncologists in India. The country has only one
oncologist per 1,600 cancer patients in India
HCG’s comprehensive cancer centres
Location Centres Operational beds
Karnataka 7 632 beds
Gujarat 5 447 beds
Maharashtra 3 336 beds
Andhra Pradesh 3 177 beds
Odisha 1 116 beds
Tamil Nadu 2 70 beds
Jharkhand 1 49 beds
Rajasthan 1 45 beds
Source: ICICI Direct Research, Company
HCG network consisted of 21 comprehensive cancer
centres, which provides single point destination for
complete cancer care

ICICI Securities | Retail Research 43
ICICI Direct Research
Stock Tales | HealthCare Global Enterprises
Exhibit 4: HCG’s comprehensive cancer centres
Location Year No of Beds RT- LINACsOperation
Theatres
PET- CT Laboratory
Karnataka Cluster
Bengaluru - Double Road 1989 51 1 4 - Yes
Shimoga 2003 60 1 3 - Yes
Bengaluru - COE 2006 225 3 7 2 Yes
Bengaluru - MS Ramaiah Nagar 2007 22 1 1 1 Yes
Hubli 2008 70 1 2 1 Yes
Gulbarga 2016 85 1 3 - Yes
Gujarat Cluster
Ahmedabad 2012 78 2 4 - Yes
Baroda 2016 60 1 3 1 Yes
East India Cluster
Ranchi 2008 56 1 2 - Yes
Cuttack 2008 116 2 2 1 Yes
Maharashtra Cluster
Nasik 2007 77 1 3 1 Yes
Borivali 2017 69 1 5 1 Yes
Nagpur 2017 115 1 2 1 Yes
Others
Vijaywada 2009 30 2 4 - Yes
Chennai 2012 35 1 - - Yes
Ongole 2012 19 1 2 - Yes
Tiruchirappalli 2014 - - - - Yes
Vishakapatnam 2016 88 1 - 1 Yes
Jaipur 2018 45 1 3 1 Yes
Bhavnagar Oncology 2018 - 1 3 - Yes
Nashik Phase II 2018 75 1 5 - Yes
Kolkata 2019 80 1 3 - Yes
Source: ICICI Direct Research, Company; COE-Centre of Excellence
Unique vendor arrangement
Owing to an exclusive agreement with vendors, HCG procures equipment
on a three years deferred payment basis. As per the management, a new
HCG centre requires | 50-60 crore of capex of which 45-60% account for
equipment costs, which are leased by the vendor and paid by the centre
after three years of equipment purchase. Hence, upfront outgo is only | 15-
20 crore to put up a HCG centre. Most centres in Tier I and II generally take
a year or two to reach breakeven. Thus, due to deferred agreement, the
particular centre is capable of managing its equipment cost.
Follows local tie-up to set up new centre
Cancer treatment requires multiple patient visits to centres. Its treatment
tenure is generally longer than other major therapies. Over the years, the
company has followed a strategy of tapping local oncologists to set up a
cancer centre. Each cancer centre offers comprehensive cancer diagnosis
and treatment services including radiation, medical oncology & surgical
treatment. In some cases it follows a partnership model (with HCG having a
majority stake). This also helps it to achieve faster ramp up in newer centres.
Each centre typically has eight to nine doctors and two to three physicians.
To expand Milann network of fertility centres across India
An estimated 22 crore women in India are of reproductive age (between 20
and 44 years) while about 2.75 crore couples in this group are estimated to
be suffering from infertility. The number of infertile couples in India is
expected to increase from 2.75 crore in 2015 to 3.25 crore by 2020.
The prevalence of infertility in India has been rising owing to 1) demographic
changes with an increase in the number of women of reproductive age, 2)
Owing to exclusive agreement with vendors, HCG
procures equipment on three years deferred
payment basis
Over the years, the company has followed a strategy
of tapping local oncologists to set up a cancer centre

ICICI Securities | Retail Research 44
ICICI Direct Research
Stock Tales | HealthCare Global Enterprises
lifestyle changes, 3) prevalence of several known clinical factors and 4)
ethnicity. Awareness of infertility and fertility treatment options in India are
among the lowest in the world.
The IVF market in India is under-penetrated relative to its potential demand.
Potential demand for IVF cycles could be 9-12x higher than the current actual
number of patients availing treatment in Delhi, Mumbai and Bengaluru. In
order to address the growing demand for fertility treatment in India, the
company plans to expand its Milann network by setting up greenfield
centres and also by entering into partnership arrangements and undertaking
selective acquisitions. This strategy is similar to HCG’s expansion.
The company intends to invest in building the Milann brand through
targeted media campaigns focusing on building patient awareness on
fertility treatment primarily through patient testimonials and socially relevant
messages. Besides this, it plans to undertake various direct consumer
marketing activities, including advertising in print, television, outdoor and
digital media.
Exhibit 5: Milann centres
Source: ICICI Direct Research, Company
Location Year
No of
BedsIVF
Endoscopy
Operation
Theatre
Embryology
Laboratory
Neonatal
ICU
Shivananda Circle, Bengaluru 1989 38 √ √ √ √
Jayanagar, Bengaluru 2010 26 √ √ √ √
Indiranagar, Bengaluru 2012 6 √ √ √ -
MSR Nagar, Bengaluru 2015 6 √ √ √ -
Delhi 2016 4 √ √ √ -
Chandigarh 2016 3 √ √ √ -
Ahmedabad 2018 6 √ √ √ -
Whitefield, Bengaluru 2018 6 √ - √ -
The prevalence of infertility in India has been rising
owing to 1) demographic changes with an increase
in the number of women of reproductive age, 2)
lifestyle changes, 3) prevalence of several known
clinical factors, and 4) ethnicity

ICICI Securities | Retail Research 45
ICICI Direct Research
Stock Tales | HealthCare Global Enterprises
Key financials
Exhibit 6: Revenues expected to grow at 17% CAGR over FY19-22E
Source: ICICI Direct Research, Company
Exhibit 7: Adds seven hospitals in past 18 months
Source: ICICI Direct Research, Company
Exhibit 8: EBITDA expected to grow at 25% CAGR in FY19-22E
Source: ICICI Direct Research, Company
519.4584.2
700.1
828.8
976.0
1159.1
1336.2
1545.3
0.0
200.0
400.0
600.0
800.0
1000.0
1200.0
1400.0
1600.0
1800.0
FY15 FY16 FY17 FY18 FY19 FY20E FY21E FY22E
Revenues (| crore)
CAGR 17.1%
CAGR 16.6%
993
1146
1364
1569
1872
0
500
1000
1500
2000
FY15 FY16 FY17 FY18 FY19
beds (Nos.)
CAGR 17.2%
76.384.8
105.0115.5 111.6
137.1
174.1
216.8
0.0
50.0
100.0
150.0
200.0
250.0
FY15 FY16 FY17 FY18 FY19 FY20E FY21E FY22E
EBITDA (| crore)
CAGR 10.0%
CAGR 24.8%

ICICI Securities | Retail Research 46
ICICI Direct Research
Stock Tales | HealthCare Global Enterprises
Exhibit 9: Aggressive capex on account of new centre additions
Source: ICICI Direct Research, Company
Exhibit 10: Aggressive capex and IndAs 116 to impact profitability
Source: ICICI Direct Research, Company
Exhibit 11: Elevated leverage ratio due to aggressive capex
Source: ICICI Direct Research, Company
Exhibit 12: Aggressive expansion and IndAs 116 to impacts return ratios
Source: ICICI Direct Research, Company
3.7
209.8
192.3
259.9
214.4
0.0
50.0
100.0
150.0
200.0
250.0
300.0
FY15 FY16 FY17 FY18 FY19
Capex (| crore)
5.4 4.6
22.2
9.8
-24.8
-97.2
-69.6
-35.1
-120.0
-100.0
-80.0
-60.0
-40.0
-20.0
0.0
20.0
40.0
FY15 FY16 FY17 FY18 FY19 FY20E FY21E FY22E
Net Profit (| crore)
1.2
0.61.0 0.9
1.4
1.8 1.8 1.7
4.6
3.84.0 4.0
5.95.7
4.6
3.7
0.0
1.0
2.0
3.0
4.0
5.0
6.0
7.0
FY15 FY16 FY17 FY18 FY19 FY20E FY21E FY22E
D/E (x) Debt/EBITDA (x)
6.4
5.3
5.9
5.1
3.0
1.2
2.5
4.3
-1.0
1.0
3.0
5.0
7.0
FY15 FY16 FY17 FY18 FY19 FY20E FY21E FY22E
ROCE (%)
ROCE (%)

ICICI Securities | Retail Research 47
ICICI Direct Research
Stock Tales | HealthCare Global Enterprises
Valuation & Outlook
We expect revenues and EBITDA to grow at a CAGR of 16% and 20%,
respectively, during FY19-22E. This is expected to be driven by a ramp up
in new hospitals commissioned in past two years and commissioning of
three new hospitals (Mumbai, Delhi and Kochi) in the next two years. We
expect near term margins to remain under pressure mainly due to
continuous addition of new hospitals.
Cancer as a therapeutic category remains largely underpenetrated in India
despite a conducive business environment with growing awareness and
better diagnosis. HCG, with its integrated, one-stop-solution and focused
model, is well poised to capture the growing potential with a pan-India focus.
With an army of oncologists at its disposal who are well-versed with modern
technological advancements besides cutting-edged latest machines, the
ecosystem is well set for future growth.
We are optimistic on the company’s growth prospects amid strong business
model and unmet needs in both cancer and fertility treatment in India.
However, due to aggressive expansion (seven centres in the past 18
months), the company’s balance sheet has been leveraged significantly
(D/E: 1.4x and debt/EBITDA: 5.9x). This, besides weaker return ratios has
been a major overhang on the stock. We initiate coverage on HCG with a
HOLD recommendation and a target price of | 110 (10x FY22E EV/EBITDA).
Moderation of capex and improvement in return ratios are key triggers that
may lead to a re-rating of the stock.
Exhibit 13: One-year forward EV/EBITDA
Source: ICICI Direct Research, Bloomberg
0
2000
4000
6000
Dec-16
Mar-17
Jun-17
Sep-17
Dec-17
Mar-18
Jun-18
Sep-18
Dec-18
Mar-19
Jun-19
Sep-19
Dec-19
(|
crore)
HCG 30.4x 29.1x 26.3x 18.0x 12.4x
We expect revenues and EBITDA to grow at a CAGR
of 16% and 20%, respectively, during FY19-22E
HCG, with its integrated, one-stop-solution and
focused model, is well poised to capture the growing
potential of cancer care treatment with a pan-India
focus
We are optimistic on the company’s growth
prospects amid strong business model and unmet
needs in both cancer and fertility treatment in India
We initiate coverage on HCG with a HOLD
recommendation and a target price of | 110 (10x
FY22E EV/EBITDA).

ICICI Securities | Retail Research 48
ICICI Direct Research
Stock Tales | HealthCare Global Enterprises
Risk & Concerns
High leverage
Due to aggressive capex, the company’s leverage ratios remained stretched
(D/E: 1.4x and debt/EBITDA: 5.9x in FY19). Further addition of new hospitals
(South Mumbai, Delhi and Kochi) in the next two years and repurchase of
remaining share of Milann are likely to stretch leverage further with a
significant likely impact on free cash flows. Any delay in ramp up of new
hospitals can lead to a further deterioration in the cash flow situation with a
potential negative impact on the company’s multiple.
Government regulations
In February 2019, the National Pharmaceutical Pricing Authority (NPPA) has
brought 42 non-scheduled anti-cancer drugs under price control, capping
the trade margin at 30%. HCG generates 20-25% of revenues from the
pharmacy business located in the hospital premises. However, as per the
management, the regulation impact on pharmacy business was minimal.
However, the overhang remains, especially if the government decides to
bring most procedures, including cancer treatment, under a cap. This can
be detrimental to HCG where a small negative swing in margins may cause
a significant impact on the overall financials.

ICICI Securities | Retail Research 49
ICICI Direct Research
Stock Tales | HealthCare Global Enterprises
Financial Summary
Exhibit 14: Profit and loss statement | crore
Year-end March FY19 FY20E FY21E FY22E
Total Operating Income 976.0 1,159.1 1,336.2 1,545.3
Growth (%) 17.8 18.8 15.3 15.6
Raw Material Expenses 218.6 259.7 299.3 346.2
Gross Profit 757.4 899.5 1,036.9 1,199.1
Gross Profit Margins (%) 77.6 77.6 77.6 77.6
Employee Expenses 184.5 216.8 236.6 265.9
Other Expenditure 461.3 545.5 626.2 716.4
Total Operating Expenditure 864.5 1,022.0 1,162.1 1,328.5
EBITDA 111.6 137.1 174.1 216.8
Growth (%) -3.4 22.9 27.0 24.5
Interest 69.9 122.7 117.1 111.5
Depreciation 85.1 122.8 136.8 149.1
Other Income 10.1 9.3 8.0 7.7
PBT before Exceptional Items -33.4 -99.1 -71.7 -36.1
Less: Exceptional Items 0.0 0.0 0.0 0.0
PBT after Exceptional Items -33.4 -99.1 -71.7 -36.1
Total Tax -2.5 -5.0 -3.6 -1.8
PAT before MI -30.9 -94.1 -68.1 -34.3
PAT -30.9 -94.1 -68.1 -34.3
Growth (%) -282.2 205.0 -27.7 -49.6
EPS (Adjusted) -2.8 -11.0 -7.9 -4.0
Source: ICICI Direct Research
Exhibit 15: Cash Flow Statement | crore
Year-end March FY19 FY20E FY21E FY22E
Profit/(Loss) after taxation -70.4 -97.2 -69.6 -35.1
Add: Depreciation & Amortization 85.1 122.8 136.8 149.1
Net Increase in Current Assets -44.1 -41.3 -33.1 -33.7
Net Increase in Current Liabilities 46.2 56.5 57.7 66.1
Others 81.7 122.7 117.1 111.5
CF from Operating activities 98.5 163.6 208.7 258.0
Investments -5.2 0.0 0.0 0.0
(Purchase)/Sale of Fixed Assets -214.4 -715.6 -150.0 -80.0
Others 29.6 87.6 10.5 12.1
CF from Investing activities -189.9 -628.0 -139.5 -67.9
(inc)/Dec in Loan 0.0 706.0 -63.3 -61.6
Other 83.5 -122.7 -117.1 -111.5
CF from Financing activities 83.5 583.2 -180.4 -173.1
Net Cash Flow -7.9 118.8 -111.1 17.0
Cash and Cash Equivalent 28.8 20.9 139.6 28.5
Cash 20.9 139.6 28.5 45.5
Free Cash Flow -115.9 -552.0 58.7 178.0
Source: ICICI Direct Research
Exhibit 16: Balance Sheet | crore
Year-end March FY19 FY20E FY21E FY22E
Equity Capital 87.9 87.9 87.9 87.9
Reserve and Surplus 388.7 291.6 221.9 186.9
Total Shareholders funds 476.7 379.5 309.9 274.8
Total Debt 657.9 1,363.9 1,300.6 1,238.9
Deferred Tax Liability 4.0 4.4 4.8 5.3
Minority Interest 45.6 50.1 55.1 60.6
Long-Term Provisions 5.6 6.2 6.8 7.5
Other Non Current Liabilities 57.5 157.9 173.6 191.0
Source of Funds 1,247.2 1,961.9 1,850.8 1,778.2
Gross Block - Fixed Assets 1,088.1 1,723.7 1,923.7 2,053.7
Accumulated Depreciation 227.2 349.9 486.7 635.9
Net Block 860.9 1,373.7 1,437.0 1,417.8
Capital WIP 152.6 232.6 182.6 132.6
Fixed Assets 1,013.5 1,606.4 1,619.6 1,550.4
Goodwill on Consolidation 109.3 109.3 109.3 109.3
Investments 49.1 49.1 49.1 49.1
Deferred Tax Assets 26.9 29.5 31.0 32.6
Long Term Loans and Advances 130.1 143.2 150.3 157.8
Other non-Current Assets 51.7 54.3 57.0 59.8
Inventory 26.8 31.8 36.6 42.4
Debtors 156.9 186.3 207.1 226.8
Loans and Advances 46.4 51.1 56.2 61.8
Other Current Assets 22.0 24.2 26.6 29.3
Cash 20.9 139.6 28.5 45.5
Total Current Assets 273.0 433.0 355.1 405.7
Creditors 181.7 215.7 248.7 287.6
Provisions 7.3 8.0 8.8 9.7
Other Current Liabilities 217.3 239.1 263.0 289.3
Total Current Liabilities 406.3 462.9 520.5 586.6
Net Current Assets -133.4 -29.8 -165.5 -180.9
Application of Funds 1,247.2 1,961.9 1,850.8 1,778.1
Source: ICICI Direct Research
Exhibit 17: Ratio Analysis | crore
Year-end March FY19 FY20E FY21E FY22E
Per share data (|)
Reported EPS -2.8 -11.0 -7.9 -4.0
Cash EPS -2.8 -11.0 -7.9 -4.0
BV per share 53.8 42.8 35.0 31.0
Cash per Share 2.4 15.8 3.2 5.1
Dividend per share 0.0 0.0 0.0 0.0
Operating Ratios (%)
Gross Profit Margins 77.6 77.6 77.6 77.6
EBITDA margins 11.4 11.8 13.0 14.0
PAT Margins -2.5 -8.4 -5.2 -2.3
Cash Conversion Cycle 0.7 0.7 -1.4 -4.4
Asset Turnover 0.9 0.7 0.7 0.8
EBITDA conversion Rate 88.3 119.3 119.9 119.0
Return Ratios (%)
RoE NA NA NA NA
RoCE 3.0 1.2 2.5 4.3
RoIC 2.5 0.9 2.3 4.3
Valuation Ratios (x)
P/E NA NA NA NA
EV / EBITDA 13.8 15.5 12.5 9.7
EV / Net Sales 1.6 1.8 1.6 1.4
Market Cap / Sales 0.9 0.8 0.7 0.6
Price to Book Value 1.9 2.4 2.9 3.3
Solvency Ratios
Debt / EBITDA 5.9 9.9 7.5 5.7
Debt / Equity 1.4 3.6 4.2 4.5
Current Ratio 0.6 0.6 0.6 0.6
Quick Ratio 0.6 0.6 0.6 0.5
Source: ICICI Direct Research

ICIC
I S
ecurit
ies –
Retail E
quit
y R
esearch
Stock T
ale
s
CMP: | 103 Target: | 110 (7%) Target Period: 12 months
Shalby Ltd (SHALIM)
HOLD
December 10, 2019
Banking on joint replacement expertise for expansion
Established in 1994 by renowned orthopaedic surgeon Dr Vikram Shah,
Shalby Ltd. (Shalby) is a leading multi-specialty chain of hospitals with
specific expertise in joint replacement. The initial focus was mainly on
arthroplasty (orthopaedic surgical procedure) driven by growing incidences
of joint related disorders such as osteoarthritis aggravated by rapid ageing
and lack of exercise besides altered lifestyles. Arthroplasty now accounts for
~44% of revenues as the company is tapping other therapies and
procedures. The company has a pan–India presence with a network of 11
multi-specialty hospitals with an aggregate bed capacity of 2012 beds across
India, especially in Tier I and Tier II cities. The company also runs outpatient
clinics in India and abroad.
Market leader in fast growing joint replacement surgeries
Rapid ageing, greater life expectancy, lack of exercise as well as altered
lifestyles are driving the incidence of osteoarthritis among Indians. Knee
replacement surgery in India has been growing in double digits over the
years. It is expected to emerge as the fourth most common cause of physical
disability in India in the next decade. Shalby is a market leader in the
procedure of joint replacement surgeries (source: F&S Report). The
company has ~15% market share of all joint replacement surgeries
conducted by organised private corporate hospitals in India. It has
performed more than one lakh joint replacements till date. Led by renowned
orthopaedic surgeon Dr Shah, the company has achieved strong brand
recall in joint replacement surgeries, especially in Gujarat.
Leverage free balance sheet despite continuous expansion
Shalby owns a debt free balance sheet, a unique feature among hospital
chains, which are on expansion mode. Despite continuous expansion in the
past decade, the company has remained debt free owing to its asset light
model approach and persistent free cash flow generation from legacy
hospitals in Ahmedabad owing to brand stickiness.
Valuation & Outlook
The company has a strong brand equity mainly in Gujarat. Shalby has
witnessed significant growth in volumes across its hospital network.
Arthroplasty continues to dominate its revenue pie although it has been
witnessing greater traction in other specialities as well. Leverage free
balance sheet, strong margins and continuous generation of free cash flows
also provide additional cushion in a capex heavy industry. However,
margins are still skewed towered the top two hospitals. We initiate Shalby
with HOLD recommendation mainly due to high concentration risk. We value
the company on an SOTP basis by valuing hospitals (above six years) at 8x
FY22E EV/EBITDA and hospitals (below six years) at 1x FY22E EV/sales.
Hence, we arrive at our SOTP target price of | 110. Ramp up in below six
years hospitals will be key to watch for re-rating of stock.
Key Financial Summary (| crore)
| Crore FY19 FY20E FY21E FY22E CAGR FY19-22 (%)
Revenues 461.0 518.3 573.3 636.3 11.3
EBITDA 82.2 98.7 114.9 134.0 17.7
EBITDA margins (%) 17.8 19.0 20.0 21.1
Net Profit 31.7 47.5 58.8 73.0 32.1
EPS (|) 2.9 4.4 5.4 6.8
PE (x) 35.0 23.3 18.9 15.2
M.Cap/ Revenues (x) 2.4 2.1 1.9 1.7
EV to EBITDA (x) 13.5 10.8 9.0 7.6
RoCE (%) 6.8 7.9 9.1 10.5
ROE 4.1 5.8 6.8 7.9
Source: ICICI Direct Research; Company
Particulars
Particular
Market Capitalisation
Debt (FY19)
Cash (FY19)
EV
52 week H/L 155/75
Equity capital
Face value | 10
MF Holding (%) 0.00%
FII Holding (%) 5.41%
| 108.0 crore
| 1105 crore
Amount
| 1109 crore
| 71 crore
| 75 crore
Price Performance Graph
Research Analyst
Siddhant Khandekar
Mitesh Shah, CFA
Sudarshan Agarwal
0
2000
4000
6000
8000
10000
12000
0
50
100
150
200
250
300
Dec-17
Mar-18
Jun-18
Sep-18
Dec-18
Mar-19
Jun-19
Sep-19
Dec-19
Shalby Ltd(L.H.S) NSE500(R.H.S)

ICICI Securities | Retail Research 51
ICICI Direct Research
Stock Tales | Shalby Ltd
Company Background
Healthcare services under the brand ‘Shalby’ commenced in 1994 while
actual incorporation happened in 2004. Led by Dr Vikram Shah, an
orthopaedic surgeon with more than 25 years of professional experience,
the company has grown from a single hospital to a chain of multi-specialty
hospitals. Its first hospital, Vijay Shalby was established by Shalby
Orthopaedic Hospital and Research Centre, one of the group entities, in
1994. Subsequently, SG Shalby and Vrundavan Shalby commenced
operations in 2007 and 2011, respectively. From four hospitals in April 2012,
the company has grown to 11 hospitals.
The company also has a network of 37 outpatient clinics across 11 states in
India and abroad, which act as a separate medium to tap new patients.
Internationally also, it has established a strong presence in Africa,
Bangladesh and Cambodia with multiple out-patient clinics extending expert
healthcare and wellness services to these countries.
The existing revenue mix between Arthroplasty and other specialties is at
~44:56 (FY19). The total bed capacity was at 2012 with operational beds at
1200. The company employs over 3000 employees including more than 500
doctors. Shalby registered a blended ARPOB of | 31235 and ALOS of 2.69
days (with day care procedures) in FY19.
Exhibit 1: Revenue mix (FY19)
Source: Company, ICICI Direct Research
Shalby (Rev
| 461 cr)
Arthroplasty
(44%)
>4yrs (31%) 2-4yrs (4%) <2yrs (10%)
Non-
Arthroplasty
(56%)
>4yrs (20%) 2-4yrs (18%) <2yrs (18%)
Arthroplasty - ~44% of revenues
Source: ICICI Direct Research; Company
Arthroplasty
44%
Others
56%

ICICI Securities | Retail Research 52
ICICI Direct Research
Stock Tales | Shalby Ltd
Exhibit 2: Network of hospitals in India with bed capacity
Source: ICICI Direct Research, Company
Shalby’s revenue models
Operate and manage (revenue sharing model) - Under this arrangement, the
company operates and manages third-party hospitals on a revenue sharing
basis without any minimum guarantee/fixed rental, by adopting an asset-
light model. While the land is owned by the third-party, the option is
available for investment in building, medical equipment, furniture, fixtures,
and other fittings in the hospital. The company meets the staffing
requirements through its own employee base.
Hospital management contracts - Under this arrangement, Shalby enters
into hospital management contracts with third-party hospitals where it is
paid a management fee by the concerned hospital. It provides all the
expertise and technical know-how for operating the hospital.
Outpatient clinics - Besides operating hospitals, the company offers services
to patients through outpatient clinics.
Payee profile
Source: ICICI Direct Research, Company
Self Pay
46%
Corpora
te
Govern
ment
26%
TPA
22%
Corpora
te
Private
6%
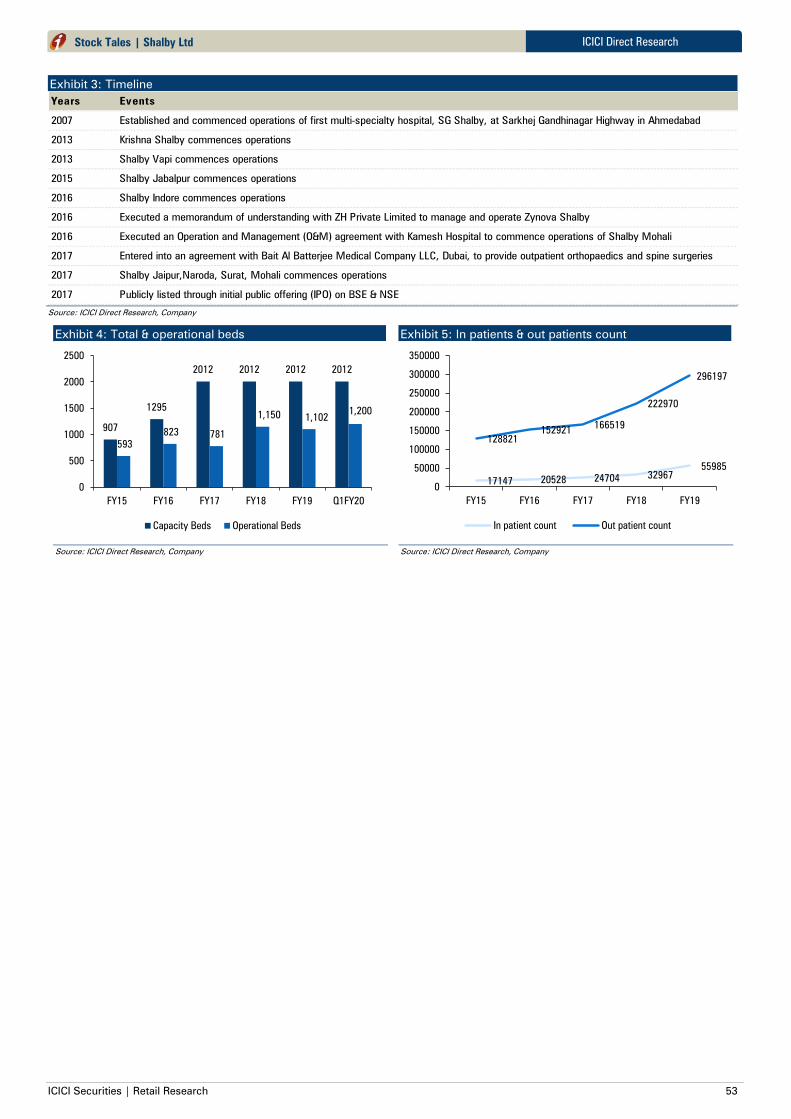
ICICI Securities | Retail Research 53
ICICI Direct Research
Stock Tales | Shalby Ltd
Exhibit 3: Timeline
Years Events
2007 Established and commenced operations of first multi-specialty hospital, SG Shalby, at Sarkhej Gandhinagar Highway in Ahmedabad
2013 Krishna Shalby commences operations
2013 Shalby Vapi commences operations
2015 Shalby Jabalpur commences operations
2016 Shalby Indore commences operations
2016 Executed a memorandum of understanding with ZH Private Limited to manage and operate Zynova Shalby
2016 Executed an Operation and Management (O&M) agreement with Kamesh Hospital to commence operations of Shalby Mohali
2017 Entered into an agreement with Bait Al Batterjee Medical Company LLC, Dubai, to provide outpatient orthopaedics and spine surgeries
2017 Shalby Jaipur,Naroda, Surat, Mohali commences operations
2017 Publicly listed through initial public offering (IPO) on BSE & NSE
Source: ICICI Direct Research, Company
Exhibit 4: Total & operational beds
Source: ICICI Direct Research, Company
Exhibit 5: In patients & out patients count
Source: ICICI Direct Research, Company
907
1295
2012 2012 2012 2012
593
823 781
1,150 1,102 1,200
0
500
1000
1500
2000
2500
FY15 FY16 FY17 FY18 FY19 Q1FY20
Capacity Beds Operational Beds
17147 20528 2470432967
55985
128821
152921166519
222970
296197
0
50000
100000
150000
200000
250000
300000
350000
FY15 FY16 FY17 FY18 FY19
In patient count Out patient count

ICICI Securities | Retail Research 54
ICICI Direct Research
Stock Tales | Shalby Ltd
Investment Rationale
Market leader in fast growing joint replacement surgeries
Rapid ageing, greater life expectancy, lack of exercise as well as altered
lifestyles are driving the incidence of osteoarthritis among Indians.
Osteoarthritis is the most frequent joint disease with a prevalence of ~30%
in India. Knee replacement surgeries in India grew at ~30% CAGR since
inception of the company till 2017. They are expected to emerge as the
fourth most common cause of physical disability in India in the next decade.
Having performed 100,000+ joint replacements since 2007, the company
has been a market leader in the area of joint replacement surgeries with
~15% market share among organised private corporate hospitals in India.
Led by renowned orthopaedic surgeon Dr Shah, the company has achieved
strong brand recall in Gujarat, especially in joint replacement surgeries.
Among other unique aspects associated with the company, the most
prominent could be the ‘0 technique’ procedure, which reduced surgical
time from 150 minutes to 25 minutes and a patient’s hospital stay from 15
to three days. Through 48 outpatient clinics, it offers orthopaedic
consultation services to patients.
Exhibit 6: Knee replacement surgeries grow at ~30% CAGR over past three decades
Source: ICICI Direct Research, Company Annual Report FY19
Exhibit 7: Persistent growth in Shalby’s arthroplasty segment despite high base
Source: ICICI Direct Research, Company
0
50000
100000
150000
200000
1994 2000 2010 2017
Surgeries (~Nos.)
149
163 165
181
207
-
50
100
150
200
250
FY15 FY16 FY17 FY18 FY19
Arthroplasty
8.7% CAGR
Rapid ageing, greater life expectancy, lack of
exercise as well as altered lifestyles are driving the
incidence of osteoarthritis among Indians
Led by renowned orthopaedic surgeon Dr Shah, the
company has achieved strong brand recall in
Gujarat, especially in joint replacement surgeries

ICICI Securities | Retail Research 55
ICICI Direct Research
Stock Tales | Shalby Ltd
Expanding in other specialities to de-risk
After achieving critical mass in arthroplasty, the company has been rapidly
expanding in other specialties, especially in new hospitals. In the last few
years, Shalby has forayed into tertiary and quaternary specialties like
cardiology, neurology, oncology, bariatric, liver & renal transplants, etc. A
case in point is Jabalpur hospital, which commenced operations in 2014
with a primary focus on cardiology. Similarly, Shalby Indore provides
advanced radiation therapy for cancer treatment. The company has engaged
the services of 75 doctors with specialisation in the area of orthopaedics and
244 doctors with specialisations in other specialties. Further, in line with its
strategy to further strengthen its capabilities in non-orthopaedic specialties,
it offers advance post-graduate diplomas in a range of disciplines including
non-invasive cardiology, dialysis management, oncology and sports
medicine through Shalby Academy. Share of arthroplasty has come down
from 97% in FY08 to 44% in FY19.
The shift is visible, especially in <6 years hospitals where the non-
arthroplasty pie is higher than the arthroplasty pie. Thus, hospitals in Indore,
Jabalpur, Jaipur, Naroda, Surat and Mohali are running on a multi-specialty
model.
While arthroplasty will continue to remain the cash cow for the company, it
can utilise the significant cash flows for expansion in other specialties
without additional leverage on the balance sheet.
Exhibit 8: Arthroplasty vs. non-arthroplasty
Source: ICICI Direct Research, Company
Exhibit 9: Arthroplasty vs. non-arthroplasty (6+ years)
Source: ICICI Direct Research, Company
Exhibit 10: Arthroplasty vs. non arthroplasty (<6 years)
Source: ICICI Direct Research, Company
3%6%
9%
31%34%
39%45% 46% 44%
49%52%
55%
97%94%
91%
69%66%
61%55% 54% 56%
51%
48%
45%
0%
20%
40%
60%
80%
100%
120%
FY8 FY9 FY10 FY11 FY12 FY13 FY14 FY15 FY16 FY17 FY18 FY19
Non Arthroplasty Arthroplasty
Arthoplasty
59%
Non-
Arthoplasty
41%
Arthoplasty
28%
Non-
Arthoplasty
72%
In the last few years, the company has forayed into
tertiary and quaternary specialties like cardiology,
neurology, oncology, bariatric, liver and renal
transplants, etc
Share of arthroplasty has come down from 97% in
FY08 to 44% in FY19

ICICI Securities | Retail Research 56
ICICI Direct Research
Stock Tales | Shalby Ltd
Leverage free balance sheet despite continuous expansion
Shalby is one of the rare hospital chains, which has a debt free balance
sheet. Despite aggressive expansion in the past decade, the company
remained debt free owing to its assets light model approach and continuous
strong free cash flow generation from legacy hospitals in Ahmedabad owing
to its strong brand recall. As per the management, the company’s per bed
cost is | 40-50 lakh against capex of | 75+ lakh at other corporate hospitals
while operational cost is 10-15% lower than industry standard. The company
has utilised | 388 crore (out of | 480 crore) from IPO proceed for repayment
of loans and purchase of equipment. As a matter of policy, the company has
confined itself to mid-tier hospitals (~200 beds), which are relatively easy to
manage.
Another peculiar aspect is the design and arrangement of the hospital
structure that accommodates 30%+ higher beds on every floor. Similarly,
against the industry average of four operation theatres (OTs) for 200 beds,
the company’s hospital design accommodates eight OTs for 200 beds,
which allows Shalby to perform more surgeries per day.
Exhibit 11: Shalby adds seven hospitals in past decade
Source: ICICI Direct Research, Company
Exhibit 12: Shalby’s debt free balance sheet
Source: ICICI Direct Research, Company
6 27
228
594
1070
2012 2012
0
500
1000
1500
2000
2500
1994 2004 2007 2011 2015 2017 2019
Bed capacity (Nos)
-0.5
0.0
0.2
0.4
1.0
1.2
0.0 0.0 -0.1 -0.1
-1.0
-0.5
0.0
0.5
1.0
1.5
FY12 FY13 FY14 FY15 FY16 FY17 FY18 FY19 FY20E FY21E
Net D/E
Shalby is one of the rare hospital chains, which has
a debt free balance sheet despite aggressive
expansion in the past decade

ICICI Securities | Retail Research 57
ICICI Direct Research
Stock Tales | Shalby Ltd
Key financials
Exhibit 13: Revenues expected to grow at 11% CAGR over FY19-22E
Source: ICICI Direct Research, Company
Exhibit 14: Strong growth in non arthroplasty segments (19.5% CAGR over 2015-19)
Source: ICICI Direct Research, Company
Exhibit 15: Decline in ARPOB due to change in case mix
Source: ICICI Direct Research, Company
275.4290.4
323.8
378.0
461.0
518.3
573.3
636.3
0.0
100.0
200.0
300.0
400.0
500.0
600.0
700.0
FY15 FY16 FY17 FY18 FY19 FY20E FY21E FY22E
Revenues (| crore)
CAGR 13.7%
CAGR 11.3%
127 128
159
197
258
-
50
100
150
200
250
300
FY15 FY16 FY17 FY18 FY19
Segments (ex Arthroplasty) (| crore)
39,904
34,173 32,761
31,564 31,235
-
5,000
10,000
15,000
20,000
25,000
30,000
35,000
40,000
45,000
FY15 FY16 FY17 FY18 FY19
ARPOB (|)

ICICI Securities | Retail Research 58
ICICI Direct Research
Stock Tales | Shalby Ltd
Exhibit 16: ALOS (days)
Source: ICICI Direct Research; Company; *included day-care procedures
Exhibit 17: EBITDA likely to grow at 18% CAGR over FY19-22E
Source: ICICI Direct Research, Company
Exhibit 18: Net profit expected to grow at 32% CAGR over FY19-22E
Source: ICICI Direct Research, Company
4.034.14
3.99
2.69 2.69
0
0.5
1
1.5
2
2.5
3
3.5
4
4.5
FY15 FY16 FY17 FY18* FY19*
ALOS (Days)
25%
19%
22%21%
18%19%
20%21%
0%
5%
10%
15%
20%
25%
30%
FY15 FY16 FY17 FY18 FY19 FY20E FY21E FY22E
EBITDA margins (%)
CAGR 5.0%
CAGR 17.7%
9%
13%
9%
10%
7%
9%
10%
11%
0%
2%
4%
6%
8%
10%
12%
14%
FY15 FY16 FY17 FY18 FY19 FY20E FY21E FY22E
Net Profit Margins (%)
CAGR 6.5%CAGR 31.9%

ICICI Securities | Retail Research 59
ICICI Direct Research
Stock Tales | Shalby Ltd
Exhibit 19: Return Ratios
Source: ICICI Direct Research, Company
Exhibit 20: Expects strong free cash flow generation
Source: ICICI Direct Research, Company
17.0
10.7 10.5
7.66.8
7.9
9.1
10.5
14.6
17.7
11.4
5.2
4.1
5.86.8
7.9
0.0
5.0
10.0
15.0
20.0
FY15 FY16 FY17 FY18 FY19 FY20E FY21E FY22E
ROCE (%) ROE (%)
59.8
-94.6 -97.7
-124.4
3.0
65.7
27.9
42.4
-150.0
-100.0
-50.0
0.0
50.0
100.0
FY15 FY16 FY17 FY18 FY19 FY20E FY21E FY22E
Free Cash flow

ICICI Securities | Retail Research 60
ICICI Direct Research
Stock Tales | Shalby Ltd
Valuation & Outlook
We expect revenues, EBITDA and PAT to grow at a CAGR of 11%, 17% and
24% in FY19-22E, respectively. Revenues are expected to be driven by an
increase in occupancy ratio in less than six years of hospitals and strong
growth in the non arthroplasty segment. Margins are expected to be driven
by improvement in occupancy ratios and operational efficiency in new
hospitals.
The company has a strong brand equity mainly in Gujarat. Shalby has
witnessed significant growth in volumes across its hospital network.
Arthroplasty continues to dominate its revenue pie although it has been
witnessing greater traction in other specialities as well. Leverage free
balance sheet, strong margins and continuous generation of free cash flows
also provide additional cushion in a capex heavy industry. However,
margins are still skewed towered the top two hospitals. We initiate Shalby
with HOLD recommendation mainly due to high concentration risk. We value
the company on an SOTP basis by valuing hospitals (above six years) at 8x
FY22E EV/EBITDA and hospitals (below six years) at 1x FY22E EV/sales.
Hence, we arrive at our SOTP target price of | 110. Ramp up in below six
years hospitals will be key to watch for re-rating of stock.
Exh ib i t 21 : Valuation Table
Particulers Valuation Matrix Multiple (x) EV (| cr)
Above 6 years EV/EBITDA 8.0 751
below 6 years EV/Sales 1.0 364
EV 1,115
Net Debt FY22E (| cr) -89.4
Minority Interest 0.1
Targeted MCap (| cr) 1,205
No of shares (cr) 10.8
Per Share Value (|) 110
Source: ICICI Direct Research
Exh ib i t 22 : One-year forward EV/EBITDA
Source: ICICI Direct Research, Bloomberg
0
2000
4000
Dec-17
Mar-18
Jun-18
Sep-18
Dec-18
Mar-19
Jun-19
Sep-19
Dec-19
(|
crore)
Shalby 27.5x 25.6x 21.9x 10.7x 3.3x
We expect revenues, EBITDA and PAT to grow at a
CAGR of 11%, 17% and 24% in FY19-22E,
respectively
We value the company on an SOTP basis by valuing
hospitals (above six years) at 8x FY22E EV/EBITDA
and hospitals (below six years) at 1x FY22E
EV/sales. Hence, we arrive at our SOTP target price
of | 110.

ICICI Securities | Retail Research 61
ICICI Direct Research
Stock Tales | Shalby Ltd
Key concerns
Changing healthcare regulations in India
According to the order dated August 16, 2017, by the National
Pharmaceuticals Pricing Authority (NPPA) a cap has been introduced in the
pricing of orthopaedic surgical procedures using knee implants performed
by hospitals and clinics, among others. As a result, the charges in relation to
knee replacement surgeries may have to be reduced in line with the
requirements set out in the abovementioned order. This may, in turn,
adversely impact the company’s margins and profitability. Furthermore, any
such passing of a regulation could have an adverse impact on the
company’s business and financial performance.
High operational profit concentration from four hospitals
Four hospitals, with a presence above six years, contributed 86% to FY19
EBITDA. This includes flagship hospitals SG Shalby and Krishna Shalby.
Thus, the company is still exposed to concentration risk. Any adverse impact
in any of these legacy hospitals, especially the two flagship assets, could
drag down the overall company performance.
Exhibit 23: EBITDA contribution from four Hospitals
Source: Company, ICICI Direct Research
Significant dependence on key man to run business
Dr Vikram Shah’s reputation has been the single most driving force in the
company’s success. Apart from his dexterity in the field of arthroplasty
surgeries, the company is also significantly dependent on him for strategic
directions and managing business affairs. Hence, there remains a key man
focus risk.
76%
70%
88% 89%86%
0%
10%
20%
30%
40%
50%
60%
70%
80%
90%
100%
FY15 FY16 FY17 FY18 FY19
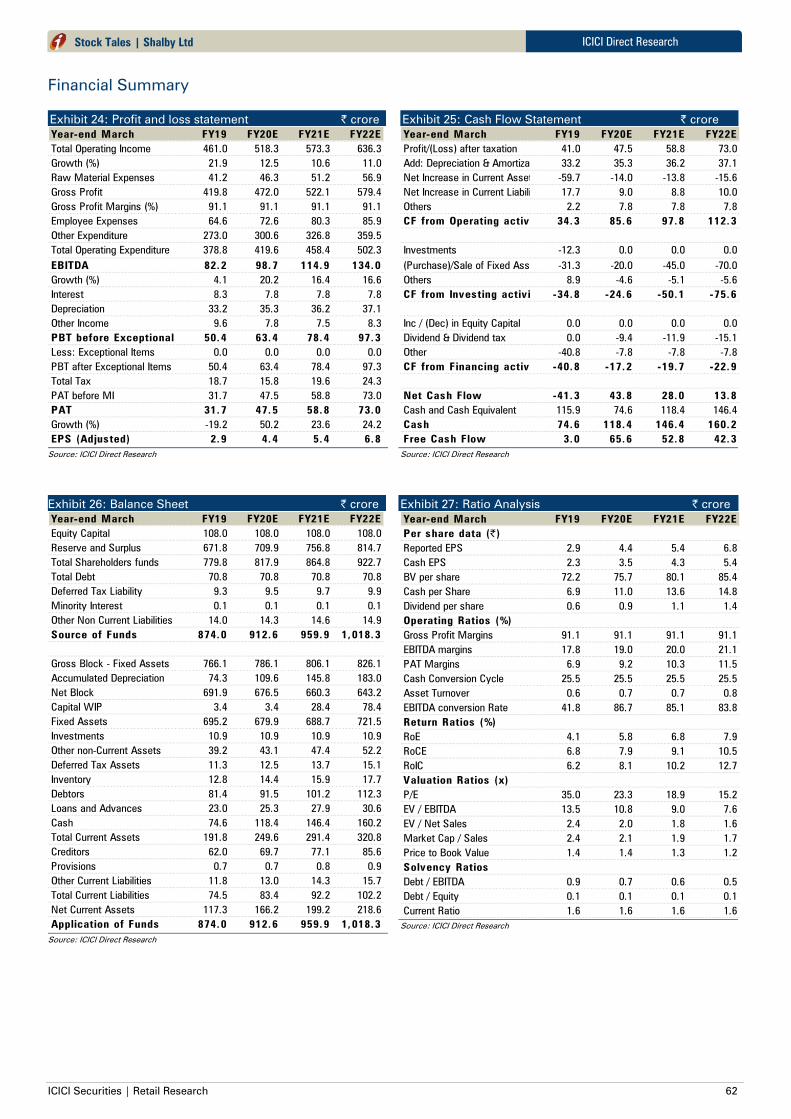
ICICI Securities | Retail Research 62
ICICI Direct Research
Stock Tales | Shalby Ltd
Financial Summary
Exhibit 24: Profit and loss statement | crore
Year-end March FY19 FY20E FY21E FY22E
Total Operating Income 461.0 518.3 573.3 636.3
Growth (%) 21.9 12.5 10.6 11.0
Raw Material Expenses 41.2 46.3 51.2 56.9
Gross Profit 419.8 472.0 522.1 579.4
Gross Profit Margins (%) 91.1 91.1 91.1 91.1
Employee Expenses 64.6 72.6 80.3 85.9
Other Expenditure 273.0 300.6 326.8 359.5
Total Operating Expenditure 378.8 419.6 458.4 502.3
EBITDA 82.2 98.7 114.9 134.0
Growth (%) 4.1 20.2 16.4 16.6
Interest 8.3 7.8 7.8 7.8
Depreciation 33.2 35.3 36.2 37.1
Other Income 9.6 7.8 7.5 8.3
PBT before Exceptional Items50.4 63.4 78.4 97.3
Less: Exceptional Items 0.0 0.0 0.0 0.0
PBT after Exceptional Items 50.4 63.4 78.4 97.3
Total Tax 18.7 15.8 19.6 24.3
PAT before MI 31.7 47.5 58.8 73.0
PAT 31.7 47.5 58.8 73.0
Growth (%) -19.2 50.2 23.6 24.2
EPS (Adjusted) 2.9 4.4 5.4 6.8
Source: ICICI Direct Research
Exhibit 25: Cash Flow Statement | crore
Year-end March FY19 FY20E FY21E FY22E
Profit/(Loss) after taxation 41.0 47.5 58.8 73.0
Add: Depreciation & Amortization 33.2 35.3 36.2 37.1
Net Increase in Current Assets -59.7 -14.0 -13.8 -15.6
Net Increase in Current Liabilities 17.7 9.0 8.8 10.0
Others 2.2 7.8 7.8 7.8
CF from Operating activities 34.3 85.6 97.8 112.3
Investments -12.3 0.0 0.0 0.0
(Purchase)/Sale of Fixed Assets -31.3 -20.0 -45.0 -70.0
Others 8.9 -4.6 -5.1 -5.6
CF from Investing activities -34.8 -24.6 -50.1 -75.6
Inc / (Dec) in Equity Capital 0.0 0.0 0.0 0.0
Dividend & Dividend tax 0.0 -9.4 -11.9 -15.1
Other -40.8 -7.8 -7.8 -7.8
CF from Financing activities -40.8 -17.2 -19.7 -22.9
Net Cash Flow -41.3 43.8 28.0 13.8
Cash and Cash Equivalent 115.9 74.6 118.4 146.4
Cash 74.6 118.4 146.4 160.2
Free Cash Flow 3.0 65.6 52.8 42.3
Source: ICICI Direct Research
Exhibit 26: Balance Sheet | crore
Year-end March FY19 FY20E FY21E FY22E
Equity Capital 108.0 108.0 108.0 108.0
Reserve and Surplus 671.8 709.9 756.8 814.7
Total Shareholders funds 779.8 817.9 864.8 922.7
Total Debt 70.8 70.8 70.8 70.8
Deferred Tax Liability 9.3 9.5 9.7 9.9
Minority Interest 0.1 0.1 0.1 0.1
Other Non Current Liabilities 14.0 14.3 14.6 14.9
Source of Funds 874.0 912.6 959.9 1,018.3
Gross Block - Fixed Assets 766.1 786.1 806.1 826.1
Accumulated Depreciation 74.3 109.6 145.8 183.0
Net Block 691.9 676.5 660.3 643.2
Capital WIP 3.4 3.4 28.4 78.4
Fixed Assets 695.2 679.9 688.7 721.5
Investments 10.9 10.9 10.9 10.9
Other non-Current Assets 39.2 43.1 47.4 52.2
Deferred Tax Assets 11.3 12.5 13.7 15.1
Inventory 12.8 14.4 15.9 17.7
Debtors 81.4 91.5 101.2 112.3
Loans and Advances 23.0 25.3 27.9 30.6
Cash 74.6 118.4 146.4 160.2
Total Current Assets 191.8 249.6 291.4 320.8
Creditors 62.0 69.7 77.1 85.6
Provisions 0.7 0.7 0.8 0.9
Other Current Liabilities 11.8 13.0 14.3 15.7
Total Current Liabilities 74.5 83.4 92.2 102.2
Net Current Assets 117.3 166.2 199.2 218.6
Application of Funds 874.0 912.6 959.9 1,018.3
Source: ICICI Direct Research
Exhibit 27: Ratio Analysis | crore
Year-end March FY19 FY20E FY21E FY22E
Per share data (|)
Reported EPS 2.9 4.4 5.4 6.8
Cash EPS 2.3 3.5 4.3 5.4
BV per share 72.2 75.7 80.1 85.4
Cash per Share 6.9 11.0 13.6 14.8
Dividend per share 0.6 0.9 1.1 1.4
Operating Ratios (%)
Gross Profit Margins 91.1 91.1 91.1 91.1
EBITDA margins 17.8 19.0 20.0 21.1
PAT Margins 6.9 9.2 10.3 11.5
Cash Conversion Cycle 25.5 25.5 25.5 25.5
Asset Turnover 0.6 0.7 0.7 0.8
EBITDA conversion Rate 41.8 86.7 85.1 83.8
Return Ratios (%)
RoE 4.1 5.8 6.8 7.9
RoCE 6.8 7.9 9.1 10.5
RoIC 6.2 8.1 10.2 12.7
Valuation Ratios (x)
P/E 35.0 23.3 18.9 15.2
EV / EBITDA 13.5 10.8 9.0 7.6
EV / Net Sales 2.4 2.0 1.8 1.6
Market Cap / Sales 2.4 2.1 1.9 1.7
Price to Book Value 1.4 1.4 1.3 1.2
Solvency Ratios
Debt / EBITDA 0.9 0.7 0.6 0.5
Debt / Equity 0.1 0.1 0.1 0.1
Current Ratio 1.6 1.6 1.6 1.6
Source: ICICI Direct Research

U
ICIC
I S
ecurit
ies –
Retail E
quit
y R
esearch
Com
pany U
pdate
CMP: | 138 Target: NA Target Period: NA
Fortis Healthcare (FORHEA)
UNDER REVIEW
December 10, 2019
Regulatory overhangs key concern despite recovering
financials…
Fortis Healthcare (Fortis) is an integrated healthcare service provider
operating a network of hospitals, diagnostics and daycare facilities across
India, Dubai and Sri Lanka. The company has 3663 operational beds
(Q2FY20) and houses 410 diagnostic centers under its SRL brand. In
November 2018, Malaysia-based IHH Healthcare Berhad (IHH) acquired a
31.1% stake in Fortis through infusion of ~| 4000 crore.
However, the Supreme Court (SC) has delayed the mandatory open offer by
IHH to acquire up to 26% stake in Fortis (~| 3300 crore) till the next hearing
in February 2020. A major concern for SC has been the IHH buyback of
Fortis’ assets from Singapore based Religare Health Trust (RHT) for | 4600
crore. The court termed the transaction as being done in a ‘hurried &
clandestine manner’ despite earlier stay imposed by the court on the deal in
December 2018.
Recently, the SC also held Fortis Healthcare and its ex-promoters in
contempt for not repaying the Japanese drugmaker, Daiichi Sankyo, over
| 3500 crore as per an earlier commitment.
On the financials front, the company’s H1FY20 revenues grew 7.7% YoY to
| 2350.5 crore mainly due to 8.9% YoY growth in the healthcare segment
(|1885.5 crore in Q2FY20). EBITDA margins improved 1020 bps YoY to
14.2% mainly due to operational leverage and positive impact of Ind-AS 116.
EBITDA grew 286% YoY to | 332.8 crore. Net profit grew 203.7% YoY to
| 202.05 crore (loss of | 194.8 crore in H1FY19).
While the financials of the company seem to be improving, the uncertainty
of the IHH open offer will remain a major overhang for the company in the
short to medium term. In this backdrop, we await further clarity on the
regulatory issues and keep the stock Under Review.
FY16 FY17 FY18 FY19 CAGR (FY16-19) %
Net Sales 4301.96 4657.10 4648.64 4578.04 2.1
EBITDA 78.11 349.29 -615.27 -0.48 -118.3
EBITDA margins (%) 1.8% 7.5% -13.2% 0.0%
PAT 18.42 421.66 -1009.22 -298.94 -353.2
EPS (|) 0.40 8.14 -19.46 -3.96
PE (x) 586.3 25.6 -10.7 -36.1
P/BV (x) 2.4 2.1 2.7 1.6
RoE (%) 0.41 8.20 -24.85 -4.53
RoCE (%) 2.62 9.16 -8.98 2.49
Key Financial Summary
Source: ICICI Direct Research; Company
Particulars
Particular Amount
Market Capitalisation | 10381 crore
Debt (FY19) | 2010 crore
Cash (FY19) | 856 crore
EV | 11535 crore
52 week H/L (|) 161/111
Equity capital | 755.0 crore
Face value | 10
Price Performance Graph
Research Analyst
Siddhant Khandekar
Mitesh Shah, CFA
Sudarshan Agarwal
0
2000
4000
6000
8000
10000
12000
0
50
100
150
200
250
Dec-16
Jun-17
Dec-17
Jun-18
Dec-18
Jun-19
Dec-19
Fortis HC(L.H.S) NSE500(R.H.S)

ICICI Securities | Retail Research
ICICI Direct Research Sector Report | Hospitals
RATING RATIONALE
ICICI Direct endeavours to provide objective opinions and recommendations. ICICI Direct assigns ratings to its
stocks according to their notional target price vs. current market price and then categorises them as Buy, Hold,
Reduce and Sell. The performance horizon is two years unless specified and the notional target price is defined as
the analysts' valuation for a stock
Buy: >15%;
Hold: -5% to 15%;
Reduce: -5% to -15%;
Sell: <-15%
Pankaj Pandey Head – Research [email protected]
ICICI Direct Research Desk,
ICICI Securities Limited,
1st Floor, Akruti Trade Centre,
Road No 7, MIDC,
Andheri (East)
Mumbai – 400 093

ICICI Securities | Retail Research
ICICI Direct Research Sector Report | Hospitals
ANALYST CERTIFICATION
We /I, Siddhant Khandekar, Inter CA, Mitesh Shah, CFA, Sudarshan Agarwal, PGDM(Finance) Research Analysts, authors and the names subscribed to this report, hereby certify that all of the views expressed in
this research report accurately reflect our views about the subject issuer(s) or securities. We also certify that no part of our compensation was, is, or will be directly or indirectly related to the
specific recommendation(s) or view(s) in this report. It is also confirmed that above mentioned Analysts of this report have not received any compensation from the companies mentioned in
the report in the preceding twelve months and do not serve as an officer, director or employee of the companies mentioned in the report.
Terms & conditions and other disclosures:
ICICI Securities Limited (ICICI Securities) is a full-service, integrated investment banking and is, inter alia, engaged in the business of stock brokering and distribution of financial products. ICICI
Securities Limited is a SEBI registered Research Analyst with SEBI Registration Number – INH000000990. ICICI Securities Limited SEBI Registration is INZ000183631 for stock broker. ICICI
Securities is a subsidiary of ICICI Bank which is India’s largest private sector bank and has its various subsidiaries engaged in businesses of housing finance, asset management, life insurance,
general insurance, venture capital fund management, etc. (“associates”), the details in respect of which are available on www.icicibank.com
ICICI Securities is one of the leading merchant bankers/ underwriters of securities and participate in virtually all securities trading markets in India. We and our associates might have investment
banking and other business relationship with a significant percentage of companies covered by our Investment Research Department. ICICI Securities generally prohibits its analysts, persons
reporting to analysts and their relatives from maintaining a financial interest in the securities or derivatives of any companies that the analysts cover.
Recommendation in reports based on technical and derivative analysis centre on studying charts of a stock's price movement, outstanding positions, trading volume etc as opposed to focusing
on a company's fundamentals and, as such, may not match with the recommendation in fundamental reports. Investors may visit icicidirect.com to view the Fundamental and Technical
Research Reports.
Our proprietary trading and investment businesses may make investment decisions that are inconsistent with the recommendations expressed herein.
ICICI Securities Limited has two independent equity research groups: Institutional Research and Retail Research. This report has been prepared by the Retail Research. The views and opinions
expressed in this document may or may not match or may be contrary with the views, estimates, rating, target price of the Institutional Research.
The information and opinions in this report have been prepared by ICICI Securities and are subject to change without any notice. The report and information contained herein is strictly
confidential and meant solely for the selected recipient and may not be altered in any way, transmitted to, copied or distributed, in part or in whole, to any other person or to the media or
reproduced in any form, without prior written consent of ICICI Securities. While we would endeavour to update the information herein on a reasonable basis, ICICI Securities is under no
obligation to update or keep the information current. Also, there may be regulatory, compliance or other reasons that may prevent ICICI Securities from doing so. Non-rated securities indicate
that rating on a particular security has been suspended temporarily and such suspension is in compliance with applicable regulations and/or ICICI Securities policies, in circumstances where
ICICI Securities might be acting in an advisory capacity to this company, or in certain other circumstances.
This report is based on information obtained from public sources and sources believed to be reliable, but no independent verification has been made nor is its accuracy or completeness
guaranteed. This report and information herein is solely for informational purpose and shall not be used or considered as an offer document or solicitation of offer to buy or sell or subscribe
for securities or other financial instruments. Though disseminated to all the customers simultaneously, not all customers may receive this report at the same time. ICICI Securities will not treat
recipients as customers by virtue of their receiving this report. Nothing in this report constitutes investment, legal, accounting and tax advice or a representation that any investment or strategy
is suitable or appropriate to your specific circumstances. The securities discussed and opinions expressed in this report may not be suitable for all investors, who must make their own
investment decisions, based on their own investment objectives, financial positions and needs of specific recipient. This may not be taken in substitution for the exercise of independent
judgment by any recipient. The recipient should independently evaluate the investment risks. The value and return on investment may vary because of changes in interest rates, foreign
exchange rates or any other reason. ICICI Securities accepts no liabilities whatsoever for any loss or damage of any kind arising out of the use of this report. Past performance is not necessarily
a guide to future performance. Investors are advised to see Risk Disclosure Document to understand the risks associated before investing in the securities markets. Actual results may differ
materially from those set forth in projections. Forward-looking statements are not predictions and may be subject to change without notice.
ICICI Securities or its associates might have managed or co-managed public offering of securities for the subject company or might have been mandated by the subject company for any other
assignment in the past twelve months.
ICICI Securities or its associates might have received any compensation from the companies mentioned in the report during the period preceding twelve months from the date of this report
for services in respect of managing or co-managing public offerings, corporate finance, investment banking or merchant banking, brokerage services or other advisory service in a merger or
specific transaction.
ICICI Securities encourages independence in research report preparation and strives to minimize conflict in preparation of research report. ICICI Securities or its associates or its analysts did
not receive any compensation or other benefits from the companies mentioned in the report or third party in connection with preparation of the research report. Accordingly, neither ICICI
Securities nor Research Analysts and their relatives have any material conflict of interest at the time of publication of this report.
Compensation of our Research Analysts is not based on any specific merchant banking, investment banking or brokerage service transactions.
ICICI Securities or its subsidiaries collectively or Research Analysts or their relatives do not own 1% or more of the equity securities of the Company mentioned in the report as of the last day
of the month preceding the publication of the research report.
Since associates of ICICI Securities are engaged in various financial service businesses, they might have financial interests or beneficial ownership in various companies including the subject
company/companies mentioned in this report.
ICICI Securities may have issued other reports that are inconsistent with and reach different conclusion from the information presented in this report.
Neither the Research Analysts nor ICICI Securities have been engaged in market making activity for the companies mentioned in the report.
We submit that no material disciplinary action has been taken on ICICI Securities by any Regulatory Authority impacting Equity Research Analysis activities.
This report is not directed or intended for distribution to, or use by, any person or entity who is a citizen or resident of or located in any locality, state, country or other jurisdiction, where such
distribution, publication, availability or use would be contrary to law, regulation or which would subject ICICI Securities and affiliates to any registration or licensing requirement within such
jurisdiction. The securities described herein may or may not be eligible for sale in all jurisdictions or to certain category of investors. Persons in whose possession this document may come
are required to inform themselves of and to observe such restriction.