Hospital Vozandes del Oriente Wastewater Treatment … Report... · Hospital Vozandes del Oriente...
117
Hospital Vozandes del Oriente Wastewater Treatment System Design Shell, Ecuador Team: Pure Pastaza: Calvin College Team Members: James Dykstra Rachel Koopman Ben Vander Plas Sungmin Youn Date: May 17, 2011
Transcript of Hospital Vozandes del Oriente Wastewater Treatment … Report... · Hospital Vozandes del Oriente...

Hospital Vozandes del Oriente
Wastewater Treatment System Design
Shell, Ecuador
Team: Pure Pastaza: Calvin College
Team Members: James Dykstra
Rachel Koopman
Ben Vander Plas
Sungmin Youn
Date: May 17, 2011

© 2011, Calvin College and James Dykstra, Rachel Koopman, Benjamin Vander Plas, Sungmin Youn

i
Executive Summary Shell is a town located in the Eastern foothills of the Ecuadorian Andes approximately 94 miles Southeast of Quito. Hospital Vozandes del Oriente (HVO) is a hospital located in Shell owned and operated by Hoy Cristo Jesús Bendice (HCJB) Global. HCJB is a non-profit mission organization committed to Biblical values and community development principles.
Pure Pastaza, a senior design team from Calvin College, in conjunction with HCJB, has designed a wastewater treatment system for HVO. The design promotes the protection of human and environmental health by providing a sustainable solution to wastewater treatment and sets an example of stewardship to the surrounding community.
The existing wastewater treatment system for the hospital property includes a pipe network and collection system leading to an undersized septic tank. As no drainfield or secondary treatment exist, effluent from the septic tank passes directly into the Motolo River south of the hospital without receiving additional treatment. There is also no appropriate method or suitable location established for septage disposal, which has consequently been disposed of directly in the river.
The hospital has therefore requested the design of an alternative method of wastewater treatment and disposal of the sludge produced.
Various treatment alternatives have been analyzed and compared from a standpoint of stewardship and cultural appropriateness. Pure Pastaza is recommending significant modifications to the existing septic system. The design utilizes an additional septic tank in series with the original, a dosing tank and a drainfield. This design has been chosen due to its simplicity and relatively low maintenance. The sludge will be disposed of through on site burial techniques.
Figure 1: Total System Site Plan
The total project cost has been estimated at $37,566. This includes construction materials and labor with a 20% contingency.

ii
Table of Contents List of Figures .............................................................................................................................................. vi
List of Tables .............................................................................................................................................. vii
1 Introduction ...................................................................................................................................... 1
1.1 The Team ............................................................................................................................ 1
1.2 The Project .......................................................................................................................... 2
1.2.1 Context ................................................................................................................... 2
1.2.2 Problem Statement ................................................................................................. 2
1.3 Background ......................................................................................................................... 3
1.3.1 HCJB ...................................................................................................................... 3
1.3.2 Shell, Ecuador ........................................................................................................ 4
1.3.3 The Hospital ........................................................................................................... 4
1.4 Design Norms ..................................................................................................................... 4
1.4.1 Stewardship ............................................................................................................ 5
1.4.2 Cultural Appropriateness ....................................................................................... 5
1.4.3 Transparency .......................................................................................................... 6
1.5 Objectives ........................................................................................................................... 6
1.5.1 Design Constraints ................................................................................................. 6
1.5.2 Effluent Quality Standards ..................................................................................... 7
1.5.3 Future Hospital Growth ......................................................................................... 7
2 Site Visit .......................................................................................................................................... 7
2.1 Wastewater Source Identification ....................................................................................... 7
2.2 Laboratory Chemicals ......................................................................................................... 7
2.3 Assessment of Existing System Conditions ........................................................................ 8
2.3.1 Damaged System Components .............................................................................. 8
2.3.2 Septic Tank ............................................................................................................ 9
2.3.3 Hospital Water Filtration ..................................................................................... 10
2.4 Field Work ........................................................................................................................ 10
2.4.1 Percolation Test ................................................................................................... 10
2.4.2 Sampling .............................................................................................................. 12
2.4.3 Surveying ............................................................................................................. 13
2.4.4 Septic Tank Measurements .................................................................................. 14
2.4.5 Dip Test ............................................................................................................... 15

iii
2.5 Chemical Testing .............................................................................................................. 16
2.5.1 Introduction .......................................................................................................... 16
2.5.2 Dissolved Oxygen ................................................................................................ 17
2.5.3 Orthophosphate, Chlorine, Ammonia Nitrogen and Nitrate Test ........................ 18
2.5.4 Pathoscreen Test .................................................................................................. 19
2.5.5 Data Limitations .................................................................................................. 20
2.5.6 Conclusions .......................................................................................................... 20
3 Wastewater Characterization ......................................................................................................... 21
3.1 Introduction ....................................................................................................................... 21
3.2 Assumptions...................................................................................................................... 21
3.2.1 Nationality ........................................................................................................... 21
3.2.2 Water Usage Activities ........................................................................................ 21
3.2.3 Hospital Growth ................................................................................................... 22
3.2.4 Miscellaneous Water Usage ................................................................................. 22
3.3 Identification of Waste Contributors ................................................................................ 22
3.3.1 Hospital Contributors ........................................................................................... 22
3.3.2 Non-hospital Contributors ................................................................................... 23
3.4 Daily Water Variation ....................................................................................................... 24
3.5 Conclusions ....................................................................................................................... 25
4 Considered Design Alternatives .................................................................................................... 25
4.1 Preliminary Treatment Alternatives .................................................................................. 25
4.1.1 Bar Screen ............................................................................................................ 25
4.1.2 Grit Chamber ....................................................................................................... 26
4.2 Primary Treatment Alternatives ........................................................................................ 27
4.2.1 Waste Stabilization Ponds ................................................................................... 27
4.3 Secondary Treatment Alternatives .................................................................................... 28
4.3.1 Maturation Ponds ................................................................................................. 28
4.3.2 Constructed Wetlands .......................................................................................... 29
5 Design Summary ............................................................................................................................ 29
5.1 Construction and Emergency Bypass ............................................................................... 29
5.2 Additional Septic Tank ..................................................................................................... 29
5.2.1 Maintenance ......................................................................................................... 31
5.3 Dosing Tanks .................................................................................................................... 31

iv
5.3.1 Introduction .......................................................................................................... 31
5.3.2 Consideration for Onsite Treatment..................................................................... 32
5.3.3 Background .......................................................................................................... 32
5.3.4 Effluent Distribution in Absorption Fields .......................................................... 32
5.3.5 Comparative Studies ............................................................................................ 33
5.3.6 Conclusions .......................................................................................................... 33
5.4 Drainfield Design .............................................................................................................. 34
5.4.1 Function of Drainfield ......................................................................................... 34
5.4.2 Soil Characterization and Application Rate ......................................................... 35
5.4.3 Infiltration Area ................................................................................................... 36
5.4.4 System Layout ..................................................................................................... 36
5.4.5 Distribution Boxes ............................................................................................... 37
5.4.6 Excavation ........................................................................................................... 38
5.4.7 Distribution Piping and Media ............................................................................. 38
5.4.8 Backfilling ........................................................................................................... 39
5.4.9 Inspection Pipes ................................................................................................... 39
5.4.10 Operation and Maintenance ................................................................................. 39
6 Hydraulic Modeling ....................................................................................................................... 40
6.1 EPA SWMM Model ......................................................................................................... 40
7 Sludge Disposal Plan ..................................................................................................................... 43
7.1 Background ....................................................................................................................... 43
7.2 Sludge Handling Alternatives ........................................................................................... 43
7.2.1 Land Application ................................................................................................. 43
7.3 Municipal Pump Truck vs. HCJB Owned Pump .............................................................. 43
7.4 Removal procedure ........................................................................................................... 43
7.5 Disposal procedure ........................................................................................................... 44
7.5.1 Location ............................................................................................................... 44
8 Additional Considerations ............................................................................................................. 44
8.1 Water Filtration Alternatives ............................................................................................ 44
8.2 Water Re-use ..................................................................................................................... 44
8.3 High Chlorine Concentrations .......................................................................................... 44
9 Project Cost .................................................................................................................................... 45
10 Recommendations .......................................................................................................................... 48

v
10.1 Items to Keep out of the Treatment System ...................................................................... 48
10.2 Installation of Flow Meters ............................................................................................... 48
10.3 Installation of Grease Traps .............................................................................................. 48
10.4 Repairing Damaged System Components ........................................................................ 48
10.5 Hazardous Laboratory Chemicals ..................................................................................... 49
10.6 Laundry Detergent Considerations ................................................................................... 49
10.6.1 Liquid Detergent .................................................................................................. 49
10.6.2 Drywell ................................................................................................................ 49
11 Conclusion ..................................................................................................................................... 49
Acknowledgements ..................................................................................................................................... 51
Bibliography ............................................................................................................................................... 52
APPENDICES ............................................................................................................................................ 53
Appendix A: Gantt Chart ............................................................................................................... 54
Appendix B: Hospital Laboratory Chemicals ................................................................................ 56
Appendix C: Water Usage and Wastewater Production Calculations ........................................... 60
Appendix D: HACH Chemical Test Results.................................................................................. 64
Appendix E: BOD Test Calculations ............................................................................................. 66
Appendix F: Sludge Accumulation Calculations ........................................................................... 68
Appendix G: Septic Tank Design Calculations ............................................................................. 70
Appendix H: Scum Baffle Specifications ...................................................................................... 73
Appendix I: Dosing Tank Calculations .......................................................................................... 75
Appendix J: Drainfield Design Calculations ................................................................................. 78
Appendix K: Sludge Pump Options ............................................................................................... 82
Appendix L: Sludge Disposal Calculations ................................................................................... 85
Appendix M: Overall System Piping Network Elevations ............................................................ 87
Appendix N: Drawing Set .............................................................................................................. 90

vi
List of Figures
Figure 1: Total System Site Plan .................................................................................................................... iFigure 2: Map of Ecuador ............................................................................................................................. 4Figure 3: MH3: Broken Pipe ......................................................................................................................... 8Figure 4: MH5: Broken Pipe and Destroyed Manhole ................................................................................. 9Figure 5: Excavation of Existing Septic Tank .............................................................................................. 9Figure 6: Clogged Filters ............................................................................................................................ 10Figure 7: Maintenance Staff Cleaning Filters ............................................................................................. 10Figure 8: Shallow Percolation Test Setup ................................................................................................... 11Figure 9: Deep Percolation Test Setup ....................................................................................................... 11Figure 10: Method Used for Sampling ....................................................................................................... 13Figure 11: Funnel Used to Transfer Water ................................................................................................. 13Figure 12: Total Station .............................................................................................................................. 14Figure 13: Surveying Rod ........................................................................................................................... 14Figure 14: Schematic of Current Septic Tank ............................................................................................. 15Figure 15: Excavation of Influent Pipe and Current Septic Tank Wall ...................................................... 15Figure 16: Dipping into center MH ............................................................................................................. 16Figure 17: Dip Test Results ........................................................................................................................ 16Figure 18: Flocculent Settling ..................................................................................................................... 17Figure 19: Color Before Titration ............................................................................................................... 17Figure 20: Closed Color Wheel Device ...................................................................................................... 19Figure 21: Open Color Wheel Device ......................................................................................................... 19Figure 22: Pathoscreen Test at Start of Test (Left – Tap Water, Right – River Water) .............................. 20Figure 23: Pathoscreen Test After 48 Hours (Left – Tap Water, Right – River Water) ............................. 20Figure 24: Hourly variation in water usage by HCJB 2009 water projects team ........................................ 25Figure 25: Bar Screen ................................................................................................................................. 26Figure 26: Grit Chamber Design ................................................................................................................. 26Figure 27: Anaerobic Pond Cross Section .................................................................................................. 27Figure 28: Facultative Pond Process Components ...................................................................................... 28Figure 29: Facultative Pond Biological Process ......................................................................................... 28Figure 30: Constructed Wetland Cross Section .......................................................................................... 29Figure 31: Proposed Septic Tank ................................................................................................................ 30Figure 32: Site of Proposed Septic Tank .................................................................................................... 31Figure 33: Effluent distribution performance for three different systems and the ideal condition. ............ 33Figure 34: The effect of different dosing intervals on absorption efficiency (relative wetted area). .......... 34Figure 35: Drainfield Plan View ................................................................................................................. 35Figure 36: Distribution Box Details ............................................................................................................ 38Figure 37: SWMM Model of Existing and Proposed Systems ................................................................... 41Figure 38: Profile view of SWMM Model of Proposed Design ................................................................. 42Figure 39: System Process Schematic ........................................................................................................ 50Figure 40: Site Layout ................................................................................................................................ 50

vii
List of Tables
Table 1: Percolation Test Results ................................................................................................................ 12Table 2: Sludge Loading Rate Calculations ................................................................................................ 16Table 3: Measured DO and BOD4 at Various Locations ............................................................................ 18Table 4: HACH Test Kit Reagents ............................................................................................................. 18Table 5: Selected Water Use Activities for Waste Contributor Categories ................................................ 22Table 6: Recommended Rates of Wastewater Application for Trench and Bed Bottom Areas ................. 36Table 7: Drainfield Design .......................................................................................................................... 36Table 8: Trench Dimensions ....................................................................................................................... 36Table 9: Required Setbacks for Trench Systems ........................................................................................ 37Table 10: Emergency Bypass Costs ............................................................................................................ 45Table 11: Proposed Septic Tank Costs ....................................................................................................... 46Table 12: Dosing Tank Costs ...................................................................................................................... 46Table 13: Drainfield Costs .......................................................................................................................... 47Table 14: Septage Disposal Site Costs ........................................................................................................ 47Table 15: Total Project Cost ....................................................................................................................... 48Table 16: Laboratory Chemicals ................................................................................................................. 57Table 17: Medical and Emergency Chemicals ............................................................................................ 58Table 18: Surgery Chemicals ...................................................................................................................... 58Table 19: Laundry and Cleaning Chemicals ............................................................................................... 59Table 20: Highest Chemical Concentrations .............................................................................................. 59Table 21: Estimation of Water Use by Activity and Nationality ................................................................ 61Table 22: Water Usage Calculations: Non-hospital .................................................................................... 62Table 23: Water Usage Calculations: Hospital ........................................................................................... 62Table 24: Summary of Water Usage and Wastewater Production for HVO Treatment System ................ 63

1
1 Introduction
1.1 The Team
Pure Pastaza is comprised of four senior students at Calvin College, each of whom will graduate in the spring of 2011 with a Bachelor of Science in Engineering Degree with a civil and environmental concentration. The team is committed to utilizing engineering within a Biblical framework to promote social justice and environmental sustainability both locally and abroad. This commitment is manifested in a project to design a wastewater treatment system for a hospital in Shell, Ecuador.
Ben Vander Plas Rachel Koopman Sungmin Youn James Dykstra
Ben Vander Plas Ben’s hometown is Richland, Michigan and he currently resides in Grand Rapids, Michigan. He has gained practical home construction experience working with Habitat for Humanity in Battle Creek, MI for the past two summers. His goal is to utilize his engineering education to provide for the needs of others. Following graduation he plans to serve with the HCJB Global Technology Center during the summer in Elkhart, Indiana. Following this he will participate in an internship with Engineering Ministries International, a mission organization based in Colorado Springs, Colorado. He is excited to gain experience working in developing countries through these opportunities and to continue to follow God’s leading in the future.
Rachel Koopman Rachel is most recently from Rochester, MI but she grew up in Shanghai, China. Last summer Rachel worked for NTH Consultants in their Environmental Compliance group where she developed a passion

2
for environmental consulting. After graduation she is getting married and pursuing a career in environmental engineering at NTH Consultants.
Sungmin Youn Sungmin grew up in Seoul, South Korea and currently resides in Grand Rapids, Michigan. He has enjoyed working on this project as he sees its potential to significantly improve the quality of human life and the surrounding environment. Through working on this design project, he has became more certain about pursuing in-depth studies of biological and physical treatment processes at the graduate level. He would like to pursue a graduate degree in environmental engineering to become better prepared for a lifetime of engineering service that addresses interesting, dynamic and life-changing problems.
James Dykstra James is originally from Kalamazoo, Michigan and currently resides in Grand Rapids, Michigan. He has three summers of experience working in the environmental engineering field with Kieser & Associates in Kalamazoo, Michigan. There he was involved with stormwater treatment, watershed management, and water quality monitoring. After graduation, he will be returning to Kieser as a project engineer. He will also be working on projects in Latin America, contributing his Spanish-speaking ability. He is passionate about the environmental, social justice, and third-world development.
1.2 The Project
1.2.1 Context
Pure Pastaza has partnered with Hoy Cristo Jesús Bendice (HCJB), a non-profit mission organization committed to Biblical values and community development principles, to design a wastewater treatment system for a hospital in Shell, Ecuador. This project is part of Engineering Senior Design (ENGR 339/340) at Calvin College. Engineering 339 is the first course in the senior design project sequence. Emphasis is placed on design team formation, project identification, and production of a feasibility study. Students focus on the development of task specifications in light of the norms for design and preliminary validation of the design by means of basic analysis and appropriate prototyping. Lectures focus on integration of the design process with a Christian worldview, team building, and state-of-the-art technical aspects of design. Engineering 340 is the second course in the senior design project sequence. Emphasis is placed on the completion of the design project initiated in Engineering 339.
1.2.2 Problem Statement
Hospital Vozandes del Oriente (HVO) is a hospital located in Shell, Ecuador owned and operated by HCJB Global. Currently, the wastewater treatment system for the hospital property consists of a pipe network and collection system leading to a septic tank. The existing septic tank is undersized and therefore does not provide adequate residence time for the wastewater. Furthermore, there is no leaching field or other secondary treatment. This results in septic tank effluent discharging directly into the Motolo River south of the hospital without receiving additional treatment. The condition of the existing tank is unknown and it may not be sealed properly and therefore leaking contaminants into the ground.

3
There is also no appropriate method or suitable location established for septage removal and disposal, which has consequently been disposed of directly in the river. Historically, the accumulated sludge has not been removed with sufficient regularity.
The hospital has therefore requested the design of an alternative method for wastewater treatment and disposal of the sludge produced. In an effort to uphold the values and mission of HCJB, the hospital desires to promote environmental and human health through additional wastewater treatment and the establishment of a suitable sludge disposal method.
1.3 Background
1.3.1 HCJB
HCJB's water engineers and health professionals are dedicated to improving the health of rural communities through clean water and preventive health care. In each project, they depend on voluntary support to carry out their work and the benefiting communities bear significant responsibility for the resources to obtain clean water. The mission of HCJB is, “…to enable communities to help themselves through the facilitation of Christ centered sustainable community development. Through the provision of water, sanitation and hygiene education projects we seek to realize permanent health improvements in the communities with whom we work at both a physical and spiritual level.” They work with communities and international, national and local organizations to set up projects that are sustainable, low cost, use appropriate technology and are easily operated and maintained by the community without outside dependency.

4
1.3.2 Shell, Ecuador
Shell Mera is a town located in the Eastern foothills of the Ecuadorian Andes approximately 94 miles Southeast of Quito (Figure 2). Today, Shell is a large town of 5,000 people, with a church, hospital, schools, hotels and a missionary guest house making it a worthwhile destination. The economy is based in small businesses and agriculture. Part of the beauty of Shell, along with the rest of Ecuador, is found in its wide variety of plants, insects, and landforms. The town is at an elevation of 3,500 feet (1000 m) and is located between the Andes Mountains and the jungle. The climate is very rainy, with cool nights (50-60°F) and hot days (70-80°F). Specific climate data was not available for the area.
1.3.3 The Hospital
HCJB global built the 28 bed mission hospital in May of 1958 and has since upgraded the facility. Most of the physicians at HVO are board-certified Americans, but they also host a family medicine residency for Ecuadorian nationals. HVO offers a full range of family medical services including obstetrics, general surgery, and orthopedics to the people of Shell and the surrounding area. Classical “tropical diseases” are frequently diagnosed and treated including tuberculosis, malaria, dengue, intestinal parasites, and bacterial dysentery. The hospital also offers a health program that promotes healthy hygiene and lifestyle practices to the surrounding jungle villages. Specifically the health program teaches these communities how to find, prevent and treat falciparum malaria.
1.4 Design Norms
It is very important to not limit the scope of the project to technical and logistical aspects of the design. There are ethical issues that must be addressed to consider the broader impact of the design on the society in which it will be implemented. Design norms are viewed as moral guidelines that guide the design process leading to an ethically acceptable result.
1 http://www.worldmapnow.com/images/2011/03/Ecuador-map-1.jpg
Figure 2: Map of Ecuador1

5
1.4.1 Stewardship
With God’s gift of creation to humanity comes the responsibility to care for the earth and its resources. This responsibility entails a respect for human and environmental health today as well as in the future. The HVO wastewater treatment system is designed to protect the health and wellbeing of the surrounding environment, residents, and downstream communities while promoting the conservation of natural and economic resources.
HVO is devoted to protecting the health of the residents of Shell and the surrounding area through medical care. Developing a solution for wastewater treatment is a fundamental step towards improving the overall health of the local population and environment. The design upholds the mission of the hospital by promoting preventative healthcare through a healthy environment and by setting an example to the rest of the country of uncompromised commitment to public and environmental health.
It is essential to understand the needs of the hospital in order to avoid overdesigning the system and the resulting unnecessary costs. As with any mission organization, HVO must carefully and wisely allocate appropriate funds to each area of its ministry, wastewater treatment being no exception. Therefore, in order to conserve the economic resources of the hospital, the most cost effective solution has been selected.
Natural resources available to the hospital must also be used wisely. The system has been designed to optimize land use efficiency of HVO’s property without compromising performance. Careful consideration has been given to selecting an alternative with the smallest footprint possible. Locations of system components have been carefully selected so as to maintain the maximum amount of usable land. Water conservation is another important consideration. By eliminating wasteful water usage practices, the hospital and surrounding residences promote better stewardship of resources.
1.4.2 Cultural Appropriateness
In general, wastewater treatment in Ecuador is not a high priority. For example, the city of Shell discharges the city’s untreated sewage into surface water. This is an important consideration as public perception of the design has a great impact on its sustainability. Part of the goal of the design is to educate and promote awareness of the importance of wastewater treatment. Municipal officials have considered developing a treatment facility for the city’s wastewater. The implementation of a system that can treat wastewater simply, effectively, and with clear benefits to HVO, will likely improve public perception and increase the priority of sewage treatment.
Careful consideration has been given to the cultural context in which the system will be implemented. While many more modern wastewater treatment systems exist, it is important not to think in terms of what is acceptable and functional in a modern and highly technical society. Thought processes must be modified in order to produce a design that will be effective and successful in a different cultural setting. This idea has heavily influenced the design of the HVO wastewater treatment system.
Although the city of Shell is relatively urban, much of the modern water treatment technology used in developed countries would be inappropriate. The technical training and skilled labor required to operate advanced water treatment plants are not available locally. The hospital also does not have the economic

6
means to construct and operate large scale and sophisticated systems. There have been many cases in which systems requiring complex maintenance have been implemented in developing countries only to be neglected and put out of commission (Mara 2004). Therefore, in order for the design to be sustainable, sophisticated technology requiring intensive maintenance must be avoided. While more advanced technologies may have higher treatment capabilities, the HVO system will require simple construction and very little maintenance, thereby ensuring continued successful operation for the life of the design.
1.4.3 Transparency
A comprehensive understanding of a design is important for the designers as well as the users and other affected parties. The ability of users to maintain and operate the design depends on their knowledge of the technology involved. Pertinent information must be communicated to those maintaining the system. Efforts must be made to educate users and local residents about the process to ensure the long-term sustainability of the system.
As wastewater treatment is very uncommon in Ecuador, there is likely limited knowledge regarding its purpose and methods. The purpose of the system must be clear to those using the hospital and to surrounding residences. It is important that system operators understand the treatment process and that they know essential maintenance practices and how to monitor the system performance regularly. This will avoid problems of overloading or discontinued use of the treatment system.
Educating hospital patients about the design will help spread knowledge of wastewater treatment in the surrounding area. This can be done through public displays within the hospital describing the purpose and technology of the process. This will aid the transformation of the cultural attitude toward wastewater treatment.
1.5 Objectives
The goal of the project is to present HCJB with a design for a wastewater treatment system that serves the hospital and surrounding compound. The design also seeks to solve the problem of sludge disposal with an acceptable alternative to current practices. By meeting detailed objectives and standards the system is determined as a feasible design.
1.5.1 Design Constraints
The following criteria have been established as the design constraints:
• Low capital, operation, and maintenance costs • Locally available parts and materials • System operation without electricity • No use of chemicals or substances potentially hazardous to the environment • Minimize design footprint • Acceptable effluent water quality • Culturally acceptable design • Safe operation for system operators and surrounding population

7
1.5.2 Effluent Quality Standards
The EPA Onsite Wastewater Treatment and Disposal Systems design manual gives effluent quality standards for primary and secondary treatment of septic systems. As the waste stream is not being treated for reuse or directly discharged to surface water, effluent quality standards for these purposes are not applicable. The quality of the septic tank effluent is constrained by the required retention time of 24 hours for proper settling of suspended solids and scum removal. The standards for secondary treatment by subsurface disposal require percolation through a minimum of 1 meter of soil before discharge to groundwater. Conforming to these standards provides an acceptable level of treatment for wastewater.
1.5.3 Future Hospital Growth
To allow for potential hospital expansion, the system design and sludge handling method must be able to accommodate projected flows and loads for a 20 year design life. From hospital patient data from the last twenty years, the growth rate is estimated to be one percent per year. Therefore, all calculations are based on 20 percent total growth rate over the project life.
2 Site Visit
Pure Pastaza was able to visit the project site after receiving a grant from Innotec. During the visit the site was analyzed and wastewater sources were identified. Through surveying, field tests, water sampling and discussion with hospital and maintenance staff, the team established a comprehensive understanding of the current system and site conditions.
2.1 Wastewater Source Identification
All contributing sources to the hospital’s wastewater collection system were identified in an effort to fully understand the nature of the wastewater, which is a combination of medical, restaurant and household waste. This information has been used to estimate wastewater characteristics and contributions. Detailed wastewater characterization calculations can be seen in Section 2.5 and Appendix C. Several recommendations have been made for modifications to certain waste contributors to ensure full functionality of the system for the life of the design. These recommendations can be seen in Section 10.
2.2 Laboratory Chemicals
After discussions with the hospital laboratory technicians, it was found that there are numerous hazardous chemicals entering the waste stream that could possibly compromise the effectiveness of biological treatment. It is also possible that some of these chemicals would not be fully removed by the proposed treatment system. A complete list of chemicals and their quantities that are introduced into the waste stream can be found in Appendix B. Recommendations for further research and alternate disposal methods of certain hazardous chemicals can be seen in Section 10.5.

8
2.3 Assessment of Existing System Conditions
2.3.1 Damaged System Components
Upon inspection of manholes, it was found that many manhole covers were showing significant signs of wear and cracking. Furthermore, in MH3 directly upstream from the septic tank, the pipe traveling through the manhole was cracked and spraying water into the manhole (Figure 3). An additional problem was encountered in MH5, the manhole farthest downstream from the septic tank just before the outfall into the Motolo River. The manhole structure has been destroyed and the surrounding sediment is entering the pipe and waste stream (Figure 4). Recommendations for remediation of deteriorating manholes and other issues can be seen in Section 10.4.
Figure 3: MH3: Broken Pipe
Attempted connection to municipality sewer feeding directly to river
Water leaking into manhole from the broken pipe

9
Figure 4: MH5: Broken Pipe and Destroyed Manhole
Sediment entering effluent stream
2.3.2 Septic Tank
The septic tank appeared to be in fair condition from examination of visible concrete (Figure 5). However, to ensure that the current septic tank is not leaking, it is recommended that a complete structural survey be carried out on the existing septic tank. While it is still unknown whether or not the existing septic tank has scum baffles on the influent or effluent pipes or if the tank is compartmentalized, assumptions have been made about the structure. These assumptions can be seen in Figure 14.
Figure 5: Excavation of Existing Septic Tank

10
2.3.3 Hospital Water Filtration
Problems with the current water filtration system of the hospital were expressed, including frequent clogging of filters (Figure 6) and regular required maintenance (Figure 7). The hospital therefore desires a more efficient filtration system with filters that are available in-country. Recommendations for improvement of the current filtration system are provided in Section 8.1.
Figure 6: Clogged Filters
Figure 7: Maintenance Staff Cleaning Filters
2.4 Field Work
2.4.1 Percolation Test
2.4.1.1 Introduction
In order to assess the ability of the soil to absorb treated sewage, it was necessary to perform soil percolation tests at multiple depths. The following is a description of the procedure followed for the soil percolation test which was adapted from a guide acquired from HCJB engineers while in Ecuador. Two percolation tests were performed within the proposed absorption area with the bottom of the test holes at 24 and 39 inches below grade. Figure 8 and Figure 9 display the experimental setup for the shallow and deep percolation tests, respectively.

11
Figure 8: Shallow Percolation Test Setup
Figure 9: Deep Percolation Test Setup
2.4.1.2 Procedure
First, a square hole was dug with vertical sides approximately 12 inches wide on all four sides. Since a trench system is being considered, one test hole was placed at 24 inches below grade and another at the projected bottom of the trenches (1 m or ~39 in below grade). Clean gravel was then placed in the bottom two inches of each percolation test hole to reduce scouring and silting action when pouring water into the holes. The sides of the holes were also scraped to avoid smearing.
The holes were then pre-soaked by periodically filling them with water and allowing the water to seep away. This procedure was begun one day before the test and was continued for a period of four hours. After the water from the final pre-soaking had seeped away, any loose soil that had fallen from the sides of the hole was removed.
Clean water was then slowly and carefully poured into each hole to a depth of six inches above the gravel. The time required for the water to drop 1 inch from the six inch depth to the five inch depth was observed and recorded. The test was repeated until the time for the water to drop 1 inch for two successive tests was approximately equal (i.e., ≤ 1 min. for 1-30 min./inch, ≤ 2 min. for 31-60 min./inch).
2.4.1.3 Analysis
When digging the test holes, it was noted that the top soil layer (~25in) was comprised of a very densely compacted organic soil. Therefore, when the percolation test was performed at a depth of 24 inches, the

12
water infiltrated very slowly and it took longer than 60 minutes for the water level to drop an inch. Therefore, the top soil layer (~2ft) has been characterized as impermeable. However, below the top layer of clayey, compacted soil, the soil became sandier, and was therefore much more permeable. Table 1 shows the results of the three trials performed in each of the two test holes.
Table 1: Percolation Test Results
Deep (39 in) Shallow (24 in) Trial Time [min] Time [min]
1 11:00 >60 2 12:38 >60 3 12:30 >60
The longest time interval to drop one inch has been taken as the stabilized rate of percolation and has served as the basis of design for the absorption system. Based on the longest time interval, the percolation rate is approximately 12.63 min/in.
2.4.1.4 Discussion & Conclusions
Discussions with hospital maintenance staff have revealed that the proposed drainfield location has been historically used for cattle grazing. This helps explain why the upper layer of soil has been so significantly compacted. It is critically important that the drainfield be constructed at a depth well below the upper compacted layer and fully within the sandier, more permeable layer.
The percolation test holes were also visited in the middle of a very heavy and extended rain event. The shallow hole was nearly filled with water; whereas the deep hole only had a small amount of standing water at the bottom of the hole. This further confirms that at depths of ~1 m and greater, the permeability of the soil is quite high.
2.4.2 Sampling
2.4.2.1 Locations & Procedure
Water samples were taken at three locations throughout the current septic system: before the septic tank, after the septic tank and at the effluent discharge into the Motolo River. A plastic bottle was used to collect the water, which was then transferred using a funnel into another sealed plastic bottle for transport. Rubber gloves and masks were used both as a safety precaution and to ensure the quality of the samples. Figure 10 and Figure 11 show the sampling method and sampling containers.

13
Figure 10: Method Used for Sampling
Figure 11: Funnel Used to Transfer Water
2.4.3 Surveying
A survey of the sewer pipe from MH1 to MH6 was performed using a total station and survey rod, shown in Figure 12 and Figure 13, respectively. Due to unfamiliarity with total stations, horizontal distances were measured manually using a measuring tape instead of the prism. Pipe invert, manhole and ground elevations were measured and recorded. This data has been plotted to produce a profile plot of the site topography along with a plot of the sewer slopes. Using the elevation data, hydraulic analyses of the current and proposed systems have been performed to ensure proper hydraulic function. Detailed procedures and conclusions of the hydraulic analysis and modeling are provided in Section 6.

14
Figure 12: Total Station
Figure 13: Surveying Rod
2.4.4 Septic Tank Measurements
2.4.4.1 Excavation
Excavation of the influent pipe of the septic tank was performed in order to determine its exact location and elevation. As no drawings of the current septic tank existed prior to the site visit, the tank itself was exposed by excavation to get an accurate understanding of the tank size and locations of the influent and effluent pipes. Figure 14 and Figure 15 show a schematic of the current septic tank and a photograph of the influent pipe excavation, respectively.

15
Figure 14: Schematic of Current Septic Tank
Figure 15: Excavation of Influent Pipe and Current Septic Tank Wall
2.4.5 Dip Test
2.4.5.1 Procedure
A dip test was performed to obtain an estimate of the sludge accumulation rate in the septic tank. The test was performed using a long wooden stick wrapped with a white cloth. The white cloth was then secured
Influent Pipe
Septic Tank Wall

16
to the stick with small nails. The stick was then placed straight down into the tank and pressed through the sludge to get a reading of the sludge depth. Figure 16 and Figure 17 are two photographs of the dip test process.
Figure 16: Dipping into center MH
Figure 17: Dip Test Results
2.4.5.2 Dip Test Results
Beginning upstream, the first, second and third compartments where found to have a sludge depth of approximately 2.5cm, 7.6cm and 2.0cm, respectively.
2.4.5.3 Sludge Accumulation Rate Estimation
Using the measured sludge depths, the volume of sludge in each compartment was calculated. This was then combined to find the total volume of sludge currently in the tank. According to hospital maintenance staff, the tank had been emptied two years earlier. Therefore, the sludge volume was divided by the two year accumulation period to obtain a sludge accumulation rate of 0.27m3/yr. Detailed calculations can be seen in Table 2 and in Appendix F.
Table 2: Sludge Loading Rate Calculations
Accumulation Time 2 years Total Sludge Volume V1+V2+V3= 0.530 m3 Accumulation Rate (V1+V2+V3) / time= 0.27 m3/yr
2.5 Chemical Testing
2.5.1 Introduction
Using HACH test kits, chemical testing of the samples was performed. These tests provide a more complete understanding of the waste stream characteristics, as well as providing insight into the quality of

17
the water entering the hospital and of the waste stream receiving water. The tests provide estimates of water quality and chemical concentrations that have been used in several design considerations.
2.5.2 Dissolved Oxygen
The dissolved oxygen content of each sample was analyzed. These results were then used to determine the BOD4 of each sample. DO and BOD4 results can be seen in Table 3below.
2.5.2.1 Procedure
Two reagent powder pillows were combined with the sample in a dissolved oxygen bottle and the resulting flocculent was allowed to settle. The bottle was then shaken and allowed to settle again, as can be seen in Figure 18. Another reagent powder pillow was combined with the solution, resulting in the color seen in Figure 19. Finally the solution was titrated using sodium thiosulfate standard solution.
Figure 18: Flocculent Settling
Figure 19: Color Before Titration
2.5.2.2 BOD Test
Due to time constraints, results were obtained for BOD4 instead of BOD5. Initial DO contents of the samples were measured. The samples were then set aside for four days in a dark, room-temperature environment. The test was performed with two dilution factors of 30 and 40. However, it was found that the dilution factor of 40 was too large as there was no measurable reduction in the dissolved oxygen concentration during the four day test period. Therefore, BOD4 results have been drawn solely from the sample with the dilution factor of 30.
BOD4 was measured at both the inlet and outlet of the septic tank and at the river. As shown in Table 3, the measured BOD4 before the septic tank, after the septic tank and at the river were 52.8mg/L, 27.4mg/L and 13.7mg/L, respectively. Detailed BOD calculations can be seen in Appendix E.

18
Table 3: Measured DO and BOD4 at Various Locations
Sample Location DOi [mg/L]
DOf [mg/L]
Vsample [mL]
Vtotal [mL]
y4 [mg O2/L]
Pre-Septic Tank 9 7 12.5 330.0 52.8 Post-Septic Tank 8 7 12.5 342.5 27.4 River Water 8 7.5 12.5 342.5 13.7
2.5.2.3 Conclusions
It has been shown that the existing septic tank reduces the BOD4 level by approximately 50% and that the BOD4 level of the septic tank effluent, 27.4mg/L, was higher than that of the river, 13.7mg/L.
2.5.3 Orthophosphate, Chlorine, Ammonia Nitrogen and Nitrate Test
The procedures for the orthophosphate, chlorine, ammonia nitrogen, and nitrate tests are very similar. Each test requires specific powder reagents, color wheels and blank samples unique to each test. The reagent used for each test can be seen in Table 4.
Table 4: HACH Test Kit Reagents
Test Reagent Orthophosphate PhosVer Phosphate Reagent Powder Pillow Chlorine DPD Free Chlorine (or) DPD Total Chlorine Reagent Powder Pillow Ammonia nitrogen Ammonia salicylate powder pillow Nitrate NitraVer 5 Nitrate Reagent Powder Pillow
2.5.3.1 General Procedure
A sample blank was placed in the color wheel device. The test-specific reagent was then combined with additional sample in a second vial. The two vials were placed in the color wheel holder and held up to the light. The wheel was then rotated until the colors in the viewing window of the sample blank and sample solution vials matched. The result was then read from the viewing window. The vials and color wheel device are pictured in Figure 20 and Figure 21below.

19
Figure 20: Closed Color Wheel Device
Figure 21: Open Color Wheel Device
2.5.3.2 Conclusions
It was determined that none of these chemicals were prevalent in any of the water tested (pre-septic tank, post-septic tank or river water). Detailed results of chemical tests can be seen in Appendix D.
2.5.4 Pathoscreen Test
The tap water and river water were tested for pathogens. Sample bottles were first cleaned with bleach and then allowed to dry. The sample water was then put into a bottle and mixed with a PathoScreen Medium powder pillow and incubated for 48 hours. The samples were examined to see if any change in color had occurred as a black precipitate reveals the presence of pathogens. It was found that both the tap water and the river water were pathogenic. Figure 22 and Figure 23 show the results of the tests. The left and right vials are tap water and river water, respectively.

20
Figure 22: Pathoscreen Test at Start of Test (Left – Tap
Water, Right – River Water)
Figure 23: Pathoscreen Test After 48 Hours (Left – Tap
Water, Right – River Water)
2.5.5 Data Limitations
While these tests provide estimates of the water quality at various locations, there are several sources of error that significantly limit the usefulness and reliability of the data. These data limitations largely stem from time and financial constraints.
First, as only one data point was acquired at each location, there is not sufficient data to draw definitive conclusions about the quality of the water at various points throughout the system.
Second, the test sample was collected during very dry weather conditions. As this is not typical weather for the region, more testing is required during both dry and wet weather conditions to gain a more complete understanding of the characteristics of the wastewater and receiving water during more typical conditions.
Third, the Hach test equipment only provides results with limited precision. It is recommended that further laboratory testing be performed in order to gain a more precise understanding of the characteristics of the wastewater and to determine the effectiveness of the current system.
2.5.6 Conclusions
Even with these data limitations, installation of a second septic tank and drainfield in addition to the current system is recommended. As the current septic tank is overloaded, addition of a second tank in series with the existing tank would provide the required hydraulic retention time to adequately treat the waste. Installation of a drainfield would provide further treatment, further lowering the BOD level before

21
reaching the river. Addition of these items to the system would produce a higher quality effluent, meeting current widely accepted standards and providing capacity for future expansion of the hospital.
3 Wastewater Characterization
3.1 Introduction
The effective management of any wastewater flow requires a reasonably accurate knowledge of its characteristics. This is particularly true for wastewater flows from rural residential dwellings, commercial establishments and other facilities where individual water-using activities create an intermittent flow of wastewater that can vary widely in volume and degree of pollution. Detailed characterization data regarding these flows are necessary not only to facilitate the effective design of wastewater treatment and disposal systems, but also to enable the development and application of water conservation and waste load reduction strategies. (9)
3.2 Assumptions
3.2.1 Nationality
HVO is a unique and highly diverse mix of North Americans, Europeans and both mestizo and indigenous Ecuadorians. This diversity represents a wide variety of water use habits. In general, North Americans use more water than Europeans. Less is used by the Ecuadorian mestizo population and even less by the indigenous visitors to the hospital. Therefore, nationality has been an important consideration in accurately predicting water usage.
However, research into differences in water usage based on nationality yielded very limited and, at times, contradictory results. Therefore, all estimates have been based on water usage figures of Americans in small communities given in the EPA manual Wastewater Treatment/Disposal for Small Communities (1992). The manual provides figures for minimum, average and maximum usage, which have been applied to indigenous Ecuadorians, Europeans/mestizo Ecuadorians and North Americans, respectively.
Nationality is only likely to make a difference in those who are doing personal bathing, laundry, cooking, dish washing and other household activities. Furthermore, as HVO is a modern medical facility, it has been assumed that all employees follow similar procedures and that all patients receive similar treatment, thereby making nationality irrelevant for wastewater estimates of hospital patients and employees.
3.2.2 Water Usage Activities
As there are no flow meters installed on the hospital water supply, water usage has been predicted. This prediction was then used to estimate wastewater flows. Activities considered for these estimates come from the EPA manual and include toilet flushing, bathing, clothes washing, dishwashing, garbage grinding and allowance for other miscellaneous activities.
For all waste contributors to the hospital system made outside of the actual hospital (missionary/visitor residences, duplexes and visiting staff quarters), estimates have been made based on expected water use activities. Selected activities for various contributors can be seen in Table 5. A complete estimation of

22
water use by activity, including values used for North Americans, Europeans/mestizo Ecuadorians and indigenous Ecuadorians, can be seen in Table 21 in Appendix C.
Table 5: Selected Water Use Activities for Waste Contributor Categories
Activity Work & Live Work Live Visit School Age Below School Age Toilet flushing √ √ √ √ √ √ Bathing √ √ √ √ Clothes washing √ √ √ √ Dishwashing √ √ √ √ Garbage grinding √ √ √ √ Miscellaneous √ √ √ √ √ √
It has been assumed that those who work and live on the hospital property use only water from the hospital distribution system and discharge all wastewater into the hospital system. The same assumption has been made for those who only live on the hospital property, as well as school age and below school age children. To differentiate children from adults, scaling factors of 0.75 and 0.5 have been applied to “school age” and “below school age” children, respectively.
These assumptions are appropriately conservative for a number of reasons. First, those who only live on the hospital property may work elsewhere, thereby leaving a portion of their waste contribution outside of the hospital system. The same is true of school age children who are in school for 8 hours, returning home during the day only for lunch.
3.2.3 Hospital Growth
To determine the design flow rate, it was necessary to include potential growth of the hospital patient population. A mean growth rate of 1% per year has been assumed based on patient statistics provided by HCJB.
3.2.4 Miscellaneous Water Usage
Due to Shell’s rainy climate, it has been assumed that no water will be used for lawn watering, watering gardens, car washing or any other optional water uses.
3.3 Identification of Waste Contributors
Wastewater contributors have been divided into two categories: 1) Hospital: waste stream contributions made within the hospital and 2) Non-hospital: waste stream contributions made to the hospital system outside of the actual hospital.
3.3.1 Hospital Contributors
3.3.1.1 Hospital Patients
Using the minimum value for wastewater flow from a medical hospital bed, it has been assumed that all hospital patients produce 132 gal/day. (EPA, Pg. 43, Table 4-7)

23
3.3.1.1.1 Outpatients
The number of outpatients per day is based on a monthly average. It has been assumed that outpatient appointments last for 3 hours and that half of them are accompanied by one person.
3.3.1.1.2 Emergencies
The number of emergency patients is based on an average of several years of data provided by hospital staff. It has been assumed that each patient remains at the hospital for 24 hours and that they are accompanied by one person for the duration of their stay.
3.3.1.1.3 Inpatients
The number of inpatients is based on an average value of inpatients per day for several months. It has been assumed that they remain at the hospital for 24 hours and that each inpatient has one visitor for 3 hours.
3.3.1.2 Hospital Employees
Using the value for minimum wastewater flow from a medical hospital employee, it has been assumed that all hospital employees produce 5.3 gal/day. (10, Pg. 43, Table 4-7)
3.3.1.2.1 National Staff
There are 63 staff members who work a variety of hours as some do shift work and some work a standard 8-5 shift. Over a month all work 160 hours except 5 nurses who each work 120 hours per month.
3.3.1.2.2 Non-resident Missionaries
There are currently five missionaries who work in the hospital but live outside of the hospital water system. It has been assumed that they work for 8 hours per day.
3.3.2 Non-hospital Contributors
3.3.2.1 Missionary and Visitor Residences
There are currently seven family homes occupied by missionary families that are contributing to the hospital waste system. Of the adults, only one works outside of the hospital compound. Details of occupancy numbers, including numbers of both school age and non-school age children, can be seen in Table 22 in Appendix C.
3.3.2.2 Duplexes
There are four duplexes connected to the hospital waste system. Each duplex has two sides with 3 bedrooms per side. Since at any time, each duplex could be full with 8 people or completely vacant, it has been assumed that each duplex is occupied at half-capacity with 4 people living in each. It has also been assumed that in each duplex, two people both live and work within the hospital water system and that the other two people live in the duplex but work outside of the hospital water system.

24
3.3.2.3 Visiting Staff Quarters
This is the accommodation for visiting interns and residents. There are 6 quarters and they are always full. All people work in the hospital.
3.3.2.4 Casitas
The casitas are accommodations for the families of in-patients from the jungle. There are 8 casitas capable of holding two people in each. It has been assumed that at all times, 25% of the casitas are occupied with two people. Water used in the casitas comes from the hospital system but wastewater from the casitas discharges into the town sewer system. Therefore, water used in the casitas is not included in the waste stream estimate.
3.3.2.5 Laundry
The hospital uses two laundry machines and runs eight loads of laundry in each machine per day. Although the water usage figure for hospital patients likely already includes laundry, these laundry water usage estimates have been included to be conservative. In addition, an extremely important consideration is the high amount of powdered detergents being used. Powdered detergents are known for causing failure conditions in septic tank drainfields. Explanation of the importance of the drainfield and proper drainfield maintenance can be seen in Section 5.4.10. Recommendations for solutions to this problem are laid out in Section 10.6.
3.3.2.6 The Bar Restaurant
As with the casitas, water used in The Bar restaurant comes from the hospital system but discharges into the town sewer system. Therefore it has not been included in wastewater characterization estimates. As no information was provided by the hospital, it has also been excluded from water usage estimates.
3.3.2.7 Hospital Restaurant
The hospital serves 40 lunches per day Monday through Friday. It was found that the restaurant does not use a grease trap on its waste water outlet. This could lead to build up on pipes and clogging of system components. Recommendations for solving this issue can be seen in Section 10.3.
3.4 Daily Water Variation
While flow meters would give more accurate information regarding daily variation in water usage at HVO, data obtained by the HCJB 2009 water projects team gives a general idea of peak flows throughout the day. Figure 24 shows the data collected from measuring changes in hospital cistern levels over time. These approximations are used for peak factors in hydraulic modeling of the system, which is explained in more detail in Section 6. The average flow rate from this data is similar to the result of wastewater characterization calculations for water usage.

25
Figure 24: Hourly variation in water usage by HCJB 2009 water projects team
3.5 Conclusions
Assuming that using figures based on North American water usage is sufficiently conservative and including a growth rate of ~1% per year, the design flow rate for the hospital system is 45m3/day.
4 Considered Design Alternatives
Many treatment alternatives have been considered for the HVO system. It is important to consider all possibilities to determine the most appropriate solution. Listed below are some of the most reasonable alternatives that were analyzed for feasibility and determined unsuitable for various reasons.
4.1 Preliminary Treatment Alternatives
4.1.1 Bar Screen
Preliminary treatment of wastewater commonly begins with removal of coarse solids with bar screens. A basic schematic of a bar screen is shown in Figure 25. The purpose of screening is to prevent blockages and damage to downstream components. A manually raked bar screen is the simplest method to consider. This adheres to the design criteria of little to no power usage (Mara 2004). The added maintenance required for cleaning and disposal of removed solids makes the bar screen component undesirable for the HVO system. Removal of course solids is simply an addition to the operation and maintenance of the septic tanks.
0
10
20
30
40
50
60
70
12:00 AM 8:00 AM 12:00 AM 2:30 PM 4:30 PM 6:30 PM
Flow
Rat
e (m
3/da
y)
Time of Day
HVO Daily Water Usage

26
Fine screening is also commonly used in the preliminary treatment of wastewater. This requires complex mechanical screens and is not a necessary component of treatment. Therefore fine screening has been determined to be infeasible for the HVO treatment system.
Figure 25: Bar Screen2
4.1.2 Grit Chamber
The second component of preliminary treatment is grit removal. The objective is to prevent grit and other inorganic solids from entering downstream processes and causing abrasion damage. A grit chamber is used to slow the flow and allow larger particles to settle out (Mara 2004). A basic design of this apparatus is shown in Figure 26. There is a centrifugal push toward the wall (A) followed by gravity pull (B) and sweep toward the center (C). Heavy particles fall to the bottom (D) while light material stays in suspension (E). The removed grit particles can be buried without the risk of contamination due to the lack of organic material. The HVO system would likely use a gravity fed vortex design. However due to lack of information regarding waste stream grit content and unnecessary system costs, this alternative is excluded from the design.
Figure 26: Grit Chamber Design3
2 Mara 2004
3 www.aerresearch.com/html/GritSystemDesignGuide.pdf

27
4.2 Primary Treatment Alternatives
4.2.1 Waste Stabilization Ponds
4.2.1.1 Background
Following the removal of coarse solids and inorganic material in the preliminary treatment, on primary treatment alternative involves waste stabilization ponds. These are large shallow basins which treat wastewater by natural biological processes involving bacteria and algae. There are three main types of stabilization ponds which use different processes for treatment. These types can be used in series or separately (Mara 2004).
4.2.1.2 Anaerobic Ponds
An anaerobic pond is generally the first of a series of ponds and is relatively deep (2-5m). The primary purpose of anaerobic ponds is BOD removal. Due to the high organic loading there is no dissolved oxygen or algae in the pond. Retention times are generally short (~1 day) depending on the initial BOD loading of the influent wastewater and the surrounding temperature (Mara 2004). Issues of odor are understood to be a significant problem, especially if careful maintenance is not observed. Safety is also a concern with the inherent drowning hazard of a deep body of water. Figure 27 shows a cross section of a typical anaerobic pond.
Figure 27: Anaerobic Pond Cross Section4
4.2.1.3 Facultative Ponds
Facultative ponds can be used as primary or secondary treatment. Like anaerobic ponds they are designed for BOD removal. Unlike anaerobic ponds they are relatively shallow (1.0-1.8m) to allow for the growth of algae near the surface (top ~300 mm). The algal photosynthetic activities generate oxygen for the BOD removal. This process is dependent on temperature, mixing, and pond inlet design. Wind provides a portion of necessary mixing to allow algae to move into the zone of effective light penetration. Any fence surrounding the pond must allow air to move through freely (Mara 2004). The process components of a facultative pond are shown in Figure 28. The biological process involved is shown in Figure 29.
4 www.thewatertreatments.com

28
Although a system of waste stabilization ponds would offer a reasonable solution for wastewater treatment at HVO, public perception of the treatment method does not allow for its implementation. Resistance would be encountered from residential areas near the hospital property lines due to negative connotations associated with open water treatment of waste. Concerns with odors and vectors make ponds an unsuitable treatment method. As the system design is based on cultural appropriateness, this alternative is determined infeasible.
Figure 28: Facultative Pond Process Components5
Figure 29: Facultative Pond Biological Process
4.3 Secondary Treatment Alternatives
4.3.1 Maturation Ponds
The objective of maturation ponds is to remove fecal bacteria and viruses. The process is mostly aerobic although some algal growth takes place. This can provide a level of quality suitable for water re-use in 5 www.thewatertreatments.com

29
agriculture or aquaculture (Mara 2004). Since HVO has no plans of reusing water, effluent wastewater will be discharged into the Motolo River. Therefore a maturation pond provides an unnecessary level of treatment.
4.3.2 Constructed Wetlands
The processes of natural wetlands are applied to constructed wetlands for the treatment of wastewater. Rooted aquatic plants called ‘macrophytes’ are grown in gravel beds and usually receive wastewater after some form of primary treatment. A cross section of a constructed wetland design can be seen in Figure 30. The advantage of this secondary treatment is the removal of suspended solids and nutrients. Wetlands are also occasionally preferred based on aesthetic reasons. This alternative is not implemented on the basis of unnecessary treatment for this specific case as well as the high cost and land use.
Figure 30: Constructed Wetland Cross Section6
5 Design Summary
5.1 Construction and Emergency Bypass
Prior to starting construction of the system, a bypass must be implemented that conveys wastewater around proposed components. The sewer must be shut down upstream of manhole 2 during a period of low flow to install the emergency bypass pipe as shown in Drawing SP-2. The construction of the new manhole immediately downstream of the existing septic tank allows for a connection to the existing sewer pipeline. After installation of the shut off valve at the start of the new pipe downstream of manhole 2, the sewer is allowed to come back on line. Flow is directed through the emergency bypass to the existing sewer downstream of the existing septic tank for the duration of construction of the system. Upon completion of construction the shut off valve is opened and the bypass is reserved for emergencies.
5.2 Additional Septic Tank
The septic tank currently in use at HVO in Shell Ecuador is 37% too small to satisfy a 24 hour retention time. In order to correct the undersized tank, an additional septic tank of equal size must be added in series with the first tank. According to the EPA Onsite Wastewater Treatment and Disposal Systems section 6.2.5.1, a 24 hour retention time is the standard requirement for sizing a septic tank. By placing
6 www.netl.doe.gov

30
two tanks of 28.4 cubic meters in series with each other they act as a single tank of 56.8 cubic meters. Using a volumetric flow rate of 45,000 L/day and a hydraulic retention time of 24 hours, the total tank size must be at least 45 cubic meters. A combined tank volume of 56.8 cubic meters will provide a retention time of about 30 hours, exceeding the 24 hour minimum. All specific septic tank design calculations can be found in Appendix G.
To achieve the optimum rate of settlement the tank must be divided into two separate compartments, the first one will be 2/3 of the total volume and the second one 1/3 of the total volume of the tank (EPA 6.2.5.4). It is also important to include a scum baffle on the influent and effluent pipes of the tank to ensure no floating scum leaves the tank. The scum baffle is made of one Grainger made PVC TEE 8X8X8; see part specifications in Appendix H, or an alternative in country option, along with one 8” diameter PVC pipe of length 30 cm. These two pieces need to be sealed together with a water tight seal using EPOXY glue. In total there are four scum baffles in the septic tank, one on the influent pipe, one on the effluent pipe and one on either side of the dividing wall. Details of the locations of the scum baffles can be found on Drawing ST-2.
Figure 31: Proposed Septic Tank
Septic tanks are typically made from precast 4,400 psi concrete with #12 rebar reinforcement placed at 30 cm on center, in all four walls. Details of this design can be found on Drawing ST-3. The outside wall must have a thickness of 30 cm and the internal wall dividing the tank into two compartments must be 15 cm thick. It is important that HCJB do research into the options in country for the structural aspect of this tank.

31
The site of the proposed septic tank is upstream of the existing tank and manhole 3 on the north side of the road (Figure 32). The location of the influent and effluent pipes can be found on Drawing ST-2.
Figure 32: Site of Proposed Septic Tank
5.2.1 Maintenance
Once a concrete septic tank is installed, it will last for approximately 50 years without having to replace any major components if the following maintenance plan is followed. Over the course of the first 4 years of installation, inspections need to be made on a yearly basis to monitor the sludge and scum accumulation rate. Once an accumulation rate has been found the tank must be pumped when the sludge depth is 80 cm from the bottom of the tank or the scum depth is 39 cm from the top of the water; typically this is a 3 to 5 year period. Every time the tank is pumped out an inspection of the inlet, outlet and mid structures must be preformed to check overall structural integrity (EPA 6.2.7). In the case of finding significant cracking or damaged pipes, repairs must be preformed immediately
5.3 Dosing Tanks
5.3.1 Introduction
Onsite systems have gained recognition as a viable wastewater treatment alternative that can provide excellent and reliable service at a reasonable cost, while still preserving the environment. The high costs associated with conventional wastewater treatment facilities along with the necessity for minimal power consumption, appropriate technology and low, simple maintenance have pointed to a septic tank and drainfield as the only feasible on-site option capable of appropriately handling wastewater treatment and disposal at HVO.

32
5.3.2 Consideration for Onsite Treatment
Groundwater and surface water pollution are major environmental considerations when designing onsite systems. All wastewater treatment and disposal systems must be designed, constructed, operated and maintained to prevent degradation of both groundwater and surface water quality.
5.3.3 Background
Using siphons to periodically dose septic tank effluent into a drainfield eliminates many of the problems associated with conventional gravity flow systems. According to Fluid Dynamic Siphons, Inc. (FDS), “Historically many septic tank-soil absorption systems have been unreliable. Failures occur because of poor siting, design and construction. Because of this engineers are often reluctant to use this method. Recent research in site evaluation and design and construction techniques has helped to identify the major problem areas and has led to improved performance of septic tank-soil absorption systems.” One of the major design problems is how the effluent is distributed in absorption fields. Three distribution methods have been considered.
5.3.4 Effluent Distribution in Absorption Fields
Three common methods of distribution have been considered. According to FDS, “The simplest and most common method is gravity or trickle flow. With this method, wastewater is allowed to flow by gravity into the absorption field as it is discharged from the septic tank. Each incremental inflow to the septic tank requires an equal outflow into the absorption field. Distribution is usually localized to a few areas within the absorption field resulting in an overloading of the infiltrative surface in these areas. This can lead to groundwater contamination in coarse granular soils due to insufficient treatment, or rapid clogging in fine textured soild. Many gravity flow systems also experience a crusting phenomenon at the interface of the gravel-filled seepage bed and the underlying soil. The effect of the crust is to greatly reduce the infiltration rate into the soil. This may result in surface seepage of unpurified septic tank effluent.”
According to FDS, “The second and third methods of effluent distribution alleviate many of the problems associated with the gravity flow system. They use the septic tank [or separate dosing tank] to store effluent for periodic discharge into the soil absorption field by a siphon or pump. This process is called dosing and can be achieved by using either a pressurized or a nonpressurized system. The dosing interval is controlled by the liquid level within the tank. Nonpressurized dosing (commonly referred to simply as dosing) has been evaluated by many investigators and results indicated that:
1. Effluent is distributed over a larger portion of the absorption area.
2. The rest period between doses allows the infiltrative surface to drain.
3. The exposure of the soil-seepage bed interface to air between doses, results in a reduction of crust resistance and build-up.
4. Soil clogging is not as severe as with the gravity flow method.
5. Localized overloading still occurs.

33
The third method, provides uniform application of sewage effluent by using pressurized dosing, and has, the advantages of (1) through (4) and yet is solves the overloading problem of (5) by applying effluent uniformly over the entire absorption area at a rate below the saturated hydraulic conductivity of the soil. This insures adequate treatment by the soil at all times and seems to reduce clogging. However achieving uniform application is difficult and can be costly and therefore is recommended only where the other methods are not acceptable.”
Figure 33: Effluent distribution performance for three different systems and the ideal condition.7
5.3.5 Comparative Studies
According to FDS, “these distribution systems have been experimentally compared in the laboratory to determine their operating characteristics, and hence advantages and disadvantages. Converse tested the gravity flow, dosing and pressurized dosing systems under similar operating conditions. He found that the dosing and pressurized dosing methods greatly improved the performance of a conventional trickle flow system and would result in dramatic increase in the life of the system. Figure 33 shows the comparative performance of the three systems. The ideal performance is represented by a straight line, uniform distribution of sewage effluent along the entire length of the absorption field.
In a similar study Popkin and Bendixen experimentally compared the gravity flow and dosing methods of distribution. They found that a vastly improved design and operation of soil absorption systems could be obtained through the use of periodic dosing. In their experiments "relative wetted area" is inversely proportional to absorption efficiency and the effluent loading rate is expressed as "hydraulic load". In Figure 34 the 35 doses/week line represents gravity flow or a near continual flow loading rate. The lower wetted area - higher absorption efficiency is attained with a once a week dosing interval.”
5.3.6 Conclusions
According to FDS, “periodic dosing of sewage effluent from a septic tank into a soil absorption field by siphon or pump results in improved effluent distribution throughout the field. This eliminates many of 7 http://siphons.com/why.html

34
the problems associated with the conventional gravity flow systems such as, localized overloading and soil clogging. Implementation of these design principals along with improved site evaluation and construction techniques will make the septic tank-absorption field system an efficient and cost effective solution to many sewage disposal problems.”
Figure 34: The effect of different dosing intervals on absorption efficiency (relative wetted area).8
5.4 Drainfield Design
5.4.1 Function of Drainfield
After initial treatment by the septic tanks, the wastewater effluent remains contaminated with dissolved solids, organic compounds, and disease transmitting pathogenic microorganisms. The biochemical oxygen demand caused by the organic material must be decreased to avoid harmful impacts to surrounding surface water. The most common method of final treatment and disposal for a septic system is by subsurface soil absorption. While the septic tanks provide anaerobic digestion and settling of waste, the most important part of the treatment process occurs in the subsurface after discharge to the soil. This is where aerobic bacteria found naturally in soil consume the organic components of the waste. Pathogenic microorganisms generally cannot survive long after travel through the soil. Any remaining dissolved solids are naturally filtered out as well. Travel through 2 to 4 ft (0.6 to 1.2 m) of unsaturated soil results in sufficient removal of pathogens and other contaminants before discharge to the groundwater. While the exact groundwater elevation at the site of the proposed drainfield is unknown, there is likely enough depth between the point of discharge of wastewater and the water table below.
A drainfield trench system is the most suitable type of subsurface soil absorption process for wastewater disposal given the site characteristics of HVO. Partially treated wastewater from the septic tanks is discharged below the ground surface to allow natural treatment by percolation through the soil. Distribution piping networks in the trench system utilize the infiltrative surface of the soil for absorption and final treatment.
8 http://siphons.com/why.html

35
Figure 35: Drainfield Plan View
5.4.2 Soil Characterization and Application Rate
Design of the drainfield requires determination of characteristics of the onsite soil in which partially treated wastewater enters in the subsurface. The infiltration rate of wastewater through the soil is based on the expected hydraulic conductivity of the clogging biomat that forms over continued application. Previous experience with soil absorption systems gives a correlation between allowable application rates and percolation rates. Table 7-2 from EPA Design Manual: Onsite Wastewater Treatment and Disposal Systems gives application rates determined by the percolation rate of the soil that makes up the infiltrative surface, assuming a biomat has formed on the surface of the soil. This is an approximate recommendation since every site has different characteristics such as soil structure and clay mineral content. The percolation rate obtained from soil testing on the proposed site is used to determine the application rate of 0.8 gpd/ft2 (32.6 Lpd/m2). See section 2.4.1 for percolation test results. Percolation tests, as well as local knowledge, have suggested that there is a nearly impermeable soil layer between 0.5 m and 1 m below the ground surface at the site of the proposed drainfield. As a result the discharge depth of subsurface wastewater disposal must be at a depth of at least 1 m to apply the application rate obtained to the drainfield design.

36
Table 6: Recommended Rates of Wastewater Application for Trench and Bed Bottom Areas9 10
Soil Texture
Percolation Rate [min/in.]
Application Rate11
[gpd/ft2]
Gravel, coarse sand <1 Not suitable Coarse to medium sand 1 – 5 1.2 Fine sand, loamy sand 6 – 15 0.8 Sandy loam, loam 16 – 30 0.6 Loam, porous silt loam 31 – 60 0.45 Silty clay loam, clay loam 61 – 120 0.2
5.4.3 Infiltration Area
Both the bottom area and vertical sidewalls of each trench act as infiltrative surfaces. After a period of wastewater application the bottom surface begins to partially clog with a biomat and allow ponding in the trench. This allows the sidewalls to act as infiltrative surfaces. The bottom and sidewall surface below the distribution pipe invert make up the total infiltration area of each trench.
Table 7: Drainfield Design
Design Flow Rate (m3/day)
Application Rate (L/day-m2)
Infiltration Area Required (m2)
45 32.6 1,381
Table 8: Trench Dimensions
Width (m)
Total Depth (m)
Infiltrative Sidewall Height
(m)
Infiltration Area Per Length (m2/m)
Total Trench Length
(m)
Individual Trench Length
(m)
Number of
Trenches
0.91 1.45 0.45 1.81 761 29.3 26
5.4.4 System Layout
The sizing and layout of the drainfield are based on EPA regulations for subsurface soil absorption systems. The plan view system layout is shown in Drawing SP-2 of Appendix N. A more detailed plan view is shown in Drawing DF-1 of Appendix N. The design flow rate and application rate obtained determine the total area required for the system, as shown in Table 7. The width and height dimensions of the trench determine the required total trench length. Calculations of drainfield sizing are shown in Appendix J. Table 8 shows results of calculations for the drainfield layout. Detailed cross sectional views of the trenches are shown in Drawing DF-2 of Appendix N. The EPA gives suggested separation
9 Table 7-2 from EPA Manual: Onsite Wastewater Treatment & Disposal Systems 10 May be suitable estimates for sidewall infiltration rates. 11 Rates based on septic tank effluent from a domestic waste source. A factor of safety may be desirable for wastes of significantly different character.

37
distances for trench systems. Abiding by these setbacks, shown in Table 9, ensures a safe and operable system.
Table 9: Required Setbacks for Trench Systems12
Surface Water
(m) Property Boundary
(m) Building Foundation
(m) 30 3 6
It is very important that each trench bottom is constructed at a near constant elevation throughout its length. The maximum slope of a distribution lateral is a drop of 2 in. (5 cm) per 100 ft (30 m) of length (a slope of 0.2%). Failing to meet this constraint could result in overloading and ponding at the end of the distribution lateral and eventually drainfield failure. The average slope of the ground surface of the proposed site is about 2%. Therefore, to avoid unnecessary excavation, the trenches have an orientation perpendicular to the natural slope, following the contours as closely as possible. The maximum allowable length of a distribution pipe is 100 ft (30 m) due to concerns of pipe breakage and flow disruption. The trench system design uses 26 trenches, each with a length of 29.3 m. The spacing between each trench is set at 2 meters. This allows adequate space for excavation equipment and provides the location for a replacement drainfield. At the end of the project life or upon failure of the drainfield, a replacement trench system can be constructed in the gaps between the proposed trenches. Essentially the same area of land would be reused in this case.
Although it requires more piping, the proposed system layout of the drainfield is a preferred method to connecting every trench in series. Serial drainfields always fail over time since the first trench at the highest elevation must overflow before redistributing the waste stream to the next trench. Eventually each successive trench would fail down the line. Connecting the distribution laterals by a single branching pipe also would cause problems. The large elevation drop between the first and last trench of the drainfield would not allow for even pressure distribution to all lateral pipes. To avoid these problems distribution boxes are used to provide even flow throughout the system.
The entire drainfield is divided into two separate fields of 13 distribution laterals each. This allows for alternating dosing of the system. Dosing is essential to maintaining the life of the system. The drainfield has an upper and lower section each with identical components. Each field is also divided into three groups of four or five trenches. These groups have trenches at a constant elevation with loop connections, avoiding localized overloading in certain areas. The purpose of connecting the ends of each distribution lateral in a trench group is to promote complete circulation of flow throughout each pipe as the dosing volume is applied. The drainfield elevation profile of the ground level, piping, trenches, and distribution boxes is shown in Drawing PN-3 of Appendix N.
5.4.5 Distribution Boxes
Distribution of wastewater flow throughout the drainfield is accomplished using distribution boxes. The upper and lower drainfield sections each utilize a separate distribution box. The two distribution boxes both contain one inlet from the dosing tank and three outlets to the three groups of distribution laterals.
12 Table 7-1 from EPA Design Manual: Onsite Wastewater Treatment and Disposal Systems, p. 212.

38
The outlets are placed at the same elevation to evenly distribute flow. When constructing the distribution boxes it is essential that all outlet pipes are on a level plane. If any tilting occurs the waste stream will be redirected to one side and distribute more flow to one group of trenches. Detailed plan and profile views of the distribution boxes are shown in Drawing DF-3 of Appendix N.
Figure 36: Distribution Box Details
5.4.6 Excavation
The effectiveness of the soil as an infiltrative surface is dependent on the pore spaces of undisturbed material. It is important to prevent sealing of these pores during excavation and construction of the trenches, especially the sidewalls. Compaction, smearing, and puddling of the soil should be avoided to ensure the system will operate properly. The sidewalls should be raked and compacted surfaces removed. Care should be taken to avoid leaving open trenches susceptible to the elements, such as rain events. Infiltrative surfaces should be covered after excavation until piping construction and backfilling is complete. The site of the trench system should be disturbed as little as possible initially, especially avoiding compaction of the native soil by heavy machinery. The layout of the drainfield is designed to allow excavating machinery such as a backhoe to have room to straddle each trench and avoid any machinery driving over top of the system. Excess weight should not be applied at the surface over the distribution pipes after construction.
5.4.7 Distribution Piping and Media
The distribution laterals installed in the trenches are 6 inch (152 mm) schedule 40 perforated PVC pipes. If standard perforated PVC piping is not available, perforations must be added to solid pipes. Holes with 12 mm diameter are drilled at about 45 degrees down from horizontal on both sides with a spacing of about 10 cm along the length of the pipe. The perforations allow for even flow distribution of wastewater into the porous media. This geometry of drainage holes prevents buildup of scum directly beneath the bottom of the pipe which could result in clogging. Pipe segments are connected with joints and the ends of each distribution lateral are connected with elbows and T-connectors between non-perforated pipe. It is important that piping be laid with as close to zero slope as possible. Distribution laterals must also avoid trees which may cause root damage.

39
The gravel fill acts as a porous media to provide flow paths to the soil surface, dissipate flow energy to prevent erosion, and provide storage at peak flows. The media also supports the distribution pipe and the sidewalls to prevent collapse of the excavation. The size of gravel should be ¾ in. to 1 ½ in. (1.8 cm to 3.8 cm) in diameter and washed to remove fines that could cause clogging. A covering material is used on top of the gravel to prevent backfilled soil from entering and clogging the void spaces. A semi-permeable geotextile fabric placed between the gravel fill and the backfill accomplishes this while allowing moisture to pass through and be removed from the trench by evapotranspiration. A layer of straw 10 to 15 cm thick may be used as a substitute for the geotextile fabric long as the soil is able to stabilize before decay of the straw.
5.4.8 Backfilling
After excavating and preparing the infiltrative surface, backfilling must be done carefully without damaging the soil. Gravel is carefully laid into the trench without over compaction of the surrounding soil. Once distribution pipes are in place, gravel should cover the pipes by at least 2 in. (5 cm) for stabilization and prevention of root growth. As previously discussed, a semi-permeable layer covers the gravel before backfilling the rest of the trench. The backfill material should be similar to the original soil and slightly mounded above ground level to allow for settling. It is important that the trenches are not in areas likely to collect rainwater runoff as this will cause soil saturation. If backfilling of a trench cannot be completed in the event of rainfall during construction, the trench should be covered to protect from ponding and damage to the infiltrative surface.
5.4.9 Inspection Pipes
Inspection pipes are used to evaluate the performance of the drainfield while in operation as well as to determine its location after construction. A 4 in. (102 mm) diameter PVC pipe is installed vertically at the end of each distribution lateral reaching from the bottom of the trench to the ground surface for accessibility. Perforations in the section of pipe below the gravel fill allow water to flow in freely so that the depth of ponding can be observed from the ground surface. The inspection pipes allow operators to determine the location of a failure in the drainfield.
5.4.10 Operation and Maintenance
The drainfield requires very minimal maintenance as long as the septic tanks are effectively removing solids upstream. Water usage of the hospital and buildings on the complex should be monitored for leaks and excessive use to avoid overloading the system. If there is evidence of failure, checks should be conducted on the system using the inspection pipes to determine the source. For the occasional failure measures can be taken to rehabilitate the system. This can include drainage solutions for surface grading in the case of ponding in the drainfield. Flow reduction can be a simple fix for failure as well. Because of problems with clogging, the disposal of grease, fats, and oil in the drains of the restaurant or houses must be prohibited. Concentrated laundry powder used in the hospital also has the potential to clog the distribution laterals of the drainfield. It is recommended that HVO switch to liquid detergent for laundry to avoid this problem. If clogging is suspected to be causing failure, the condition of the septic tanks should first be checked to determine if they are functioning properly or in need of sludge or scum removal. The dosing component of the septic system along with the distribution boxes should also be

40
monitored to be sure that each section of the drainfield has equal distribution of wastewater, as this is essential to the operation of the drainfield. At the end of the design life, construction of a replacement drainfield must be evaluated.
6 Hydraulic Modeling
Hydraulic analysis is an important preliminary design procedure that must be done before site planning. To predict the impacts of new structures, such as an additional septic tank, a dosing tank and a drainfield on HVO’s wastewater system, the hydraulics of the site must be carefully studied. Hydraulic analysis of the site is challenging because the system is at non-steady state flow due to variations in hourly water usage. Along with the water variation, each pipe in the system requires a certain minimum slope to avoid clogging from the presence of solid particles in the wastewater.
Hydraulic modeling and analysis was performed using EPA Storm Water Management Model (SWMM). Analysis was performed starting at the downstream end of the system and working upstream. The design flow rate is 11,900gal/day (45m3/day). The hourly water usage variation factors that were implemented in the SWMM model were derived by the HCJB 2009 project team.
From the SWMM model, it was confirmed that the drainfield would be able to handle the design flow without flooding the downstream end of the system. In addition, all pipe networks provide the minimum slope required to avoid clogging. Although the slope of the pipe from the dosing tank to the first distribution box is less than the minimum slope required for wastewater, it would not cause any problem because the water would act like clean water which requires a minimum slope of 0.01%.
6.1 EPA SWMM Model
Using EPA SWMM, a hydraulic model of the existing site was developed using the survey data obtained while in Ecuador along with data from a previous survey. These models provide further insight into the hydraulics of the site. A model has also been developed for the proposed system. Analysis reveals that the new septic system will not overload the dosing tanks and drainfield at the downstream end of the system. This ensures that the wastewater will receive appropriate treatment before it reaches the environment.

41
Figure 37: SWMM Model of Existing and Proposed Systems

42
The computer model of the existing septic system is shown in Error! Reference source not found.. The current septic system consists of five manholes and one septic tank. The septic tank is located between the third and fourth manholes. The last manhole is located 1,010ft (309m) south of manhole one. From the first manhole to the last manhole, there was an elevation difference of 21.2ft (6.47m). Due to this elevation difference, sewer pipes have been designed with slopes greater than 1%. The standard slope requirement for sewer pipes with a diameter of 8in is 0.4%.
The computer model of the upgraded septic system is shown in Error! Reference source not found.. The upgraded septic system includes an additional septic tank that is located between the second and the third manhole. This new septic tank is equivalent in size to the existing septic tank. A dosing tank is included 13ft (3m) south of the existing septic tank. The dosing tank pressurizes the septic tank effluent downstream. Along with additional septic tank and dosing tank, a drainfield is installed at the downstream end of the system. This drainfield is separated into two equally sized compartments. The infiltration rate of the drainfield was based on percolation test results obtained in Ecuador. The computer simulation showed that the proposed drainfield can handle wastewater from the hospital without flooding. To be conservative, this simulation was performed under the assumption of 100% soil saturation. A profile view of the upgraded system is shown in Figure 38.
Figure 38: Profile view of SWMM Model of Proposed Design

43
7 Sludge Disposal Plan
7.1 Background
In the past, HVO has experienced resistance from the municipality about land filling the sludge. This resistance led to the dumping of the sludge directly into the Motolo River, effectively defeating the purpose of the septic tank.
7.2 Sludge Handling Alternatives
7.2.1 Land Application
One potential use of septage is land application. This requires dewatering and stabilization of the sludge. As HVO does not have agricultural land and there is little demand for land application elsewhere, this alternative has been rejected.
7.3 Municipal Pump Truck vs. HCJB Owned Pump
A septic tank must be pumped out routinely every three to five years as outlined in the maintenance section of the septic tank design. The local municipality can be hired to pump out the septic tank at no cost or a septic tank pump truck could be purchased for $8,000 to $80,000 (See Appendix K).
The municipality has a pump truck specifically for this purpose; they are responsible for the maintenance costs, capital costs and operational costs. Routine maintenance can be scheduled with the municipality in order to ensure the emptying of the tank over a reasonable time frame. By going with the municipalities pump truck HVO will not have to worry about what the truck does during the time it is not in use, which will end up being all but one or two days every three to five years. By deciding to purchase a personal pump/vacuum truck HVO will be spending $8,000 to $80,000 for a truck that will not be used very often. These pump trucks are very sensitive pieces of equipment that need to be oiled and kept up on a weekly basis and cannot be left to sit for long periods of time.
Using the municipality pump truck on a routine schedule will be less expensive and more reliable then purchasing a new or used pump truck and training someone to use it and maintain it.
7.4 Removal procedure
Given that the municipalities pump services are used, every 3 to 5 years the septic tank will be emptied. The pump truck will arrive onsite at a time agreed upon by HVO employees and the municipality. An HVO employee will observe the removal of the sludge by the municipality to ensure nothing is damaged during removal and to check the structural integrity of the piping, scum baffles and manhole covers. Sludge removal from the new septic tank will be from the manholes on the outer most edges of the tank, but not from the center one. Sludge removal from the current septic tank will be from the square manhole near the center of the tank. The tank operator will be required to remove as much sludge and liquid as possible.

44
7.5 Disposal procedure
Before the municipality comes to empty out the septic tank the area marked on Drawing SP-1 must be excavated. The area is 6 by 6 m square and 3 m deep, the bottom of the excavated area then must be filled with 1.5 m thick of granular material, volume of 54 m3 and 0.5 m thick of sand material, volume of 18 m3. Specific calculations of volume needed can be found in Appendix L. The excavation must be prepared a least one day before the municipality comes to empty the septic tank. Once the septic tank is completely emptied the pump truck must go to the site where the excavated area is. They will empty the truck into the hole. The majority of the tank substance will be liquids and the rest will be sludge, excess water maybe needed to clean out the tank fully, this would be acceptable. Once the tank has been emptied into the hole and has left the site, the hole must be backfilled with the soil removed to create the hole.
7.5.1 Location
The specific location for sludge disposal can be found on Drawing SP-1. This location was chosen due to the easy access for the excavators and pump truck already built into the road. The area was also already cleared and is currently a grassy area.
8 Additional Considerations
8.1 Water Filtration Alternatives
Regardless of improved filtration, this problem is inevitable due to insufficient treatment of the water by the municipality before distribution. If the hospital wishes to pursue improved filtration alternatives, further research should be performed.
8.2 Water Re-use
Due to the high amount of rainfall in Shell, there is little demand for water re-use for agriculture or aquaculture. The additional cost of necessary treatment and storage components for re-use of treated water cannot be justified as a feasible option. Wastewater would also be required to have higher levels of treatment to accommodate more stringent quality standards.
8.3 High Chlorine Concentrations
HVO is currently using chlorine in large quantities for disinfection in the current septic tank. Members of the HCJB staff have expressed concerns about the effects of high levels of chlorine on the wastewater treatment process with respect to the oxidation of organic matter, as well as impacts on concrete material. Chlorine is commonly used as an inexpensive form of disinfection in wastewater treatment systems and will have no adverse effects on the oxidation of the organic matter. The presence of chlorine in the wastewater before treatment by the facultative ponds will allow for disinfection before the oxidation process occurs. The impact of chlorine on concrete should not be an issue; most pools throughout the world are made of concrete and contain high levels of chlorinated water. There is no known research to support that there are any adverse effects on concrete due to high levels of chlorine.

45
9 Project Cost
The final construction cost estimation for the septic system is $37,566. Table 10 shows estimation of costs for the emergency bypass which is also used as a construction bypass. The material and labor costs of the proposed septic tank are shown in Table 11. Costs for the dosing tank and drainfield are shown in Table 12 and Table 13 respectively. The estimated cost of the disposal site for septic tank sludge is outlined in Table 14. Table 15 gives the overall project cost including construction contingency.
Table 10: Emergency Bypass Costs
Item Quantity Unit Unit Cost Total Cost 203 mm Diameter Schedule 40 PVC Pipe1
11 6 m $78.00 $858
203 mm PVC 90° Elbow 2 - $25.00 $50
Shut Off Gate Valve2 2 - $400.00 $800
Manhole 1 - $300.00 $300
Excavation 33 m3 $1.00 $33
Installation Labor 3 person-day $15.00 $45
TOTAL $2,086 1Includes 10% wastage allowance 2http://flexpvc.com/indexValves.shtml
Calculations by: BJV
Checked by: RLK

46
Table 11: Proposed Septic Tank Costs
Item Quantity Unit Unit Cost Total Cost Cement1 613 bag $7.10 $4,352 Sand1 36.6 m3 $10.00 $366 Aggregate1 73.4 m3 $12.00 $880 #12 Rebar 17 12 m $13.00 $221 MH Covers 3 - $80.00 $240 203 mm Diameter Schedule 40 PVC Pipe1 5 6 m $78.00 $390
PVC Sanitary Tee 4 - $38.00 $152 Epoxy Glue for PVC 1 gal $44.00 $44 Excavation 50 m3 $1.00 $50
Installation Labor2 44 person-day $15.00 $660
TOTAL $7,356 1Includes 10% wastage allowance 2Handbook of Gravity Flow Water Systems: Reference Table VII
Table 12: Dosing Tank Costs
Item Quantity Unit Unit Cost Total Cost Cement1 165 bag $7.10 $1,172
Sand1 9.9 m3 $10.00 $99
Aggregate1 19.8 m3 $12.00 $238
203 mm Diameter Schedule 40 PVC Pipe1 1 6 m $78.00 $78
203 mm PVC 90° Elbow 1 - $25.00 $25 Epoxy Glue for PVC 1 gal $44.00 $44
Fluid Dynamic Dosing Siphon: Model 316, 3" Diam, 76 GPM2
2 - $582.00 $1,164
Excavation 33 m3 $1.00 $33
Installation Labor3 12 person-day $15.00 $178
TOTAL $3,030 1Includes 10% wastage allowance
2www.promagenviro.ca/products/dosing-siphon-fluid-dynamics-430; includes shipping 3Handbook of Gravity Flow Water Systems: Reference Table VII
Calculations by: BJV
Checked by: RLK

47
Table 13: Drainfield Costs
Item Quantity Unit Unit Cost Total Cost Cement1 6 bag $7.10 $43
Sand1 0.31 m3 $10.00 $3.08
Aggregate1 0.62 m3 $12.00 $7.39
102 mm Diameter Schedule 40 PVC Pipe1 39 6 m $15.00 $585
152 mm Diameter Schedule 40 PVC Pipe1 176 6 m $47.00 $8,272
152 mm PVC T-connector 34 - $15.00 $510
152 mm PVC 90° Elbow 28 - $15.00 $420
Epoxy Glue for PVC 5 gal $44.00 $220 Excavation2 1243 m3 $1.00 $1,243
Gravel1 348 m3 $10.00 $3,480
Geotextile Fabric 50 150 ft2 $15.00 $750
Installation Labor3 157 person-day $15.00 $2,349
TOTAL $17,882 1Includes 10% wastage allowance 2Includes excavation for trenches and piping 3Handbook of Gravity Flow Water Systems: Reference Table VII
Table 14: Septage Disposal Site Costs
Item Quantity Unit Unit Cost Total Cost Excavation 100 m3 $1.00 $100
Gravel1 60 m3 $10.00 $600
Sand1 25 m3 $10.00 $250
TOTAL $950 1Includes 10% wastage allowance
Calculations by: BJV
Checked by: RLK

48
Table 15: Total Project Cost
System Component Cost Emergency Bypass $2,086 Septic Tank $7,356 Dosing Tank $3,030 Drainfield $17,882 Septage Disposal Site $950
SUBTOTAL $31,305
20% Contingency $6,261
TOTAL $37,566
Calculations by: BJV
Checked by: RLK
10 Recommendations
10.1 Items to Keep out of the Treatment System
The life span and effectiveness of a septic tank are highly impacted by proper maintenance of the tank and control of what enters the tank. During the site visit, it was evident that latex gloves, sanitary napkins and other items were being flushed down the toilets, potentially compromising the integrity and effectiveness of the system. It is recommended that with a septic tank and drainage field only septic tank appropriate toilet paper is flushed down the toilet. To prevent people from inadvertently flushing inappropriate materials down the toilet it is recommended that wastebaskets be placed next to the toilets and signs be placed in all bathroom stalls.
10.2 Installation of Flow Meters
It is recommended that the hospital install flow meters on their water inlet. Although this is a controversial issue for the hospital, it would greatly aid in the accurate determination of water usage, waste water production and therefore an appropriately sized design as extra safety factors would not be necessary. It would also increase the stewardship of the hospital as metered water consumption is typically much lower than that of unmetered water consumption.
10.3 Installation of Grease Traps
It is recommended that a grease trap be installed on the restaurant’s waste water outlet. As the effluent from the hospital restaurant enters the septic tank, there could be problems with grease clogging the system. Currently, there is no evidence of grease in the sewers and there doesn’t seem to be any in the septic tank. However, it is still recommended that this be implemented as excessive grease buildup could compromise the effectiveness of the septic tank and drain field.
10.4 Repairing Damaged System Components
It is suggested that all the manhole covers from manhole 1 to 6 as noted on Drawing be replaced.

49
It is also recommended that damaged pipe in MH3, as well as the damaged pipe and manhole structure of MH5 be repaired.
10.5 Hazardous Laboratory Chemicals
It is recommended that research be performed on alternative disposal methods for the hazardous chemicals used in the laboratory. Some of the chemicals used pose a risk of diminishing the effectiveness of the biological treatment in the septic system. A full list of chemicals used in the hospital can be seen in Appendix B.
10.6 Laundry Detergent Considerations
The use of powder laundry detergent has been found to reduce the effectiveness and eventually lead to the failure of drainfields. Two possible solutions are being recommended. The first option is preferred, with the second option being offered as a secondary alternative. Failure to implement one of these options may result in total failure of the drainfield, rendering the treatment system useless.
10.6.1 Liquid Detergent
It is strongly recommended that HVO switch from powder detergents to liquid detergents for laundry. Switching to a liquid detergent would avoid the clogging potential inherent in powder detergent. This is essential for ensuring full effectiveness of the treatment system for the full life of the design.
10.6.2 Drywell
If liquid detergent is unavailable or not a feasible alternative, a secondary alternative is that HVO install a drywell for their gray water. This is of paramount importance as excess powder detergent could compromise the effectiveness of the treatment system.
11 Conclusion
In conclusion, Pure Pastaza is designing a wastewater treatment system for HCJB global’s Hospital Vozandes del Oriente in Shell, Ecuador. The current capacity of the septic tank is inadequate and results in essentially untreated wastewater being discharged into the Motolo River. Pure Pastaza is proposing the addition of a second tank in parallel with the existing tank to provide the required hydraulic retention time to adequately treat the waste. Installation of dosing tanks and a drainfield will provide further treatment, sufficiently lowering contaminant levels of the wastewater before reaching the river. The addition of these items to the system will produce a high quality effluent, meeting current widely accepted standards and providing capacity for future expansion of the hospital.
Due to the lack of agricultural land in the area there is little demand for land application of the sludge. Alternative methods for disposal are currently being researched.
A schematic displaying system process is described in Figure 39. The preliminary site plan is shown in Figure 40.

50
Figure 39: System Process Schematic
Figure 40: Site Layout
One of the greatest advantages of the design is the use of simple technology and the minimal maintenance required for the system to function properly. The total project cost has been estimated at $37,566. This includes construction materials and labor with a 20% contingency.
Establishing an effective wastewater treatment system will reduce the risk of water born diseases to downstream communities and will allow the hospital to set an example of environmental stewardship to the surrounding region. It is the hope of Pure Pastaza that this wastewater treatment system will improve the quality of life of the residents of Shell and will uphold the values held by the hospital.

51
Acknowledgements
We would like to thank the following people for their invaluable assistance during the design process:
Professor David Wunder, Senior Design Advisor
Professor Wunder has guided and mentored us throughout the semester, drawing upon his expertise in the environmental engineering field.
Stephanie Smithers, HCJB Global
Stephanie has been our contact in Ecuador and has provided us with data, information and helped to answer many of our questions about the site. She also served as our guide during our site visit to Ecuador.
Alfredo and Alex Leon
Along with Stephanie, Alfredo and Alex assisted the team while in Ecuador and continued to provide advice after the trip.
Tom Newhof, Prein & Newhof
Tom is our team’s industrial consultant and has provided us with valuable information from his first-hand experience with septic systems in professional practice.
Innotec
Innotec provided the team with a grant which made travel to Ecuador possible.

52
Bibliography
1. Cotruvo, Joseph A., Gunther F. Craun, and Nancy Hearne. Providing Safe Drinking Water in Small Systems: Technology, Operations, and Economics. Boca Raton: Lewis, 1999. Print.
2. Grainger. Plastic Supply: Tee, PVC, 8x8x8. Grainger. Grainger Industrial Supply. Web. 8 Mar. 2011. <http://www.grainger.com/Grainger/PLASTIC-SUPPLY-Tee-6UXU5?Pid=search>.
3. Mara, Duncan D. Sewage Treatment in Hot Climates. London: Wiley, 1976. Print.
4. Mara, Duncan D. Domestic Wastewater Treatment in Developing Countries. London: Earthscan, 2004. Print.
5. Mehtar, Shaheen. Hospital Infection Control: Setting up with Minimal Resources. Oxford: Oxford UP, 1992. Print.
6. Niewoehner, John, Ron Larson, Elfadil Azrag, Tsegaye Hailu, and Jim Horner, Peter VanArsdale. "Opportunities for renewable energy technologies in water supply in Developing country villages." NREL Technical Monitor (1997). Print.
7. Shilton, Andy. Pond Treatment Technology. London: IWA Pub., 2005. Print.
8. "Sludge Treatment Reuse and Disposal." United Nations Environmental Program. Web. 10 Nov. 2010. <http://www.unep.or.jp/ietc/publications/freshwater/sb_summary/10.asp>.
9. United States. United States Environmental Protection Agency. Office of Water Program Operations. Onsite Wastewater Treatment and Disposal Systems: Design Manual. By Ernest V. Clements, Richard J. Otis, David H. Bauer, Robert L. Siegrist, and David E. Stewart. Washington, D.C.: U.S. Environmental Protection Agency, Office of Water Program Operations, 1980. Print.
10. United States. Environmental Protection Agency. Office of Research and Development and Office of Water. Manual: Wastewater Treatment/Disposal for Small Communities. By Robert P.G. Bowker, George Frigon, James F. Kreissl, and Richard J. Otis. Washington: United States Environmental Protection Agency, Technology Transfer, 1992. Print.

53
APPENDICES

54
Appendix A: Gantt Chart

ID Task Name Duration Start Finish
1 First Semester 50 days Mon 10/4/10 Fri 12/10/102 PPFS Outline--Table of Contents (email to team Advisor) 2 days Mon 10/4/10 Tue 10/5/103 Work Breakdown Structure (WBS) (email to team Advisor) 5 days Mon 10/4/10 Fri 10/8/104 Innotec Grant Proposal 10 days Mon 10/4/10 Fri 10/15/105 Scheduled WBS (email to team Advisor) 0 days Mon 10/18/10 Mon 10/18/106 Research - High Concentration Chlorine 14 days Mon 10/18/10 Thu 11/4/107 Estimating waste load 14 days Mon 10/18/10 Thu 11/4/108 Elevator Presentation 3 days Mon 10/18/10 Wed 10/20/109 Research low cost low energy wastewater treatment options 26 days Mon 11/1/10 Mon 12/6/10
10 Project Brief to Industrial Consultant (with cc to team Advisor) 3 days Mon 10/18/10 Wed 10/20/1011 Project web-site (posted) 4 days Wed 10/20/10 Mon 10/25/1012 Preliminary Cost Estimate (email to team Advisor) 5 days Mon 11/8/10 Fri 11/12/1013 Draft PPFS to Team Advisor 11 days Mon 11/1/10 Mon 11/15/1014 Revised/updated project web-site (and new poster if major changes) 6 days Wed 11/17/10 Wed 11/24/1015 PPFS submit to Team Advisor and post on Web Page as PDF 6 days Mon 11/22/10 Mon 11/29/1016 Preliminary Design Memo submit to Team Advisor (as required) 5 days Mon 12/6/10 Fri 12/10/1017 Interim 15 days Wed 1/5/11 Tue 1/25/1118 Second Semester 74 days Mon 1/31/11 Wed 5/11/1119 Pond Layout Design 6 days Mon 1/31/11 Mon 2/7/1120 Hydraulic Analysis of Pipe and Pond System 5 days Mon 2/7/11 Fri 2/11/1121 Hydraulic Design Based on the Analysis 5 days Mon 2/14/11 Fri 2/18/1122 Bar Screen Calculations and Design 5 days Mon 2/14/11 Fri 2/18/1123 Website Update 5 days Mon 2/14/11 Fri 2/18/1124 Oral Presentations 8 days Wed 2/23/11 Fri 3/4/1125 Model Build 35 days Mon 3/7/11 Fri 4/22/1126 Updated Posters and Demos 6 days Wed 3/2/11 Wed 3/9/1127 Meet with Industrial Consultant 10 days Mon 3/7/11 Fri 3/18/1128 Individual Notebook Check 3 days Mon 3/14/11 Wed 3/16/1129 Team Description for Banquet Program 3 days Wed 3/16/11 Fri 3/18/1130 Website Update 5 days Mon 4/4/11 Fri 4/8/1131 Draft Design Report for CEAC Review 6 days Mon 4/4/11 Mon 4/11/1132 Scheduling Reviews (Individual Team) 5 days Mon 4/18/11 Fri 4/22/1133 Draft Design Report for Faculty Review 6 days Wed 4/20/11 Wed 4/27/1134 Project Night Poster 5 days Mon 4/25/11 Fri 4/29/1135 Oral Presentations 10 days Mon 4/25/11 Fri 5/6/1136 Senior Banquet and Projects Night 1 day Sat 5/7/11 Sat 5/7/1137 Website Upgraded to Final, Notebooks Turned In, Course Evaluation 1 day Mon 5/9/11 Mon 5/9/1138 Final Design Report Due 1 day Wed 5/11/11 Wed 5/11/11
10/18
26 3 10 17 24 31 7 14Oct '10 Nov '10
Task
Split
Progress
Milestone
Summary
Project Summary
External Tasks
External Milestone
Deadline
Page 1
Project: Gantt Chart.mppDate: Tue 5/17/11

21 28 5 12 19 26 2 9 16 23 30 6 13 20 27 6 13 20 27 3 10 17 24 1 8 15 22Dec '10 Jan '11 Feb '11 Mar '11 Apr '11 May '11
Task
Split
Progress
Milestone
Summary
Project Summary
External Tasks
External Milestone
Deadline
Page 2
Project: Gantt Chart.mppDate: Tue 5/17/11

56
Appendix B: Hospital Laboratory Chemicals

Chemical Name Dilution Total Dilution Volume Dilution Volume Used Dilution Volume Used Chemical Volume Density Mass Flow Denser Than Water
Units [L] [mL/month] [L/month] [L/month] [g/mL] [g/month]Chlorine 10% 40000 40 4 1.467 5,868 YesPhenol 5% 50 0.05 0.0025 1.06 2.65 YesAuramine powder 5% 0.0025Ethanol 95% 0.0475 0.789 37.48 NoMorphine 100% 20 0.02 0.02 1.31 26.20 YesFetanyl 100% 20 0.02 0.02Crystal Violet 33% 0.0165 1 16.50 YesMethanol 33% 0.0165 0.791 13.05 NoFushina 5% 0.0025Ethanol 95% 0.0475 0.789 37.48 NoHCl 5% 0.0025 1.18 2.95 YesEthanol 95% 0.0475 0.789 37.48 NoMethylene blue 0.700 50 0.05 0.21Iodine crystals 0.15Potassium iodide 0.30Ethanol 50% 0.025 0.789 19.73 NoAcetone 50% 0.025 0.791 19.78 NoSafranin 1.447 0.13 YesEthanol 10% 0.005 0.789 3.95 No"Polvo de Wright" 0.08Methanol 100% 0.05 0.791 39.55 No
Table 16: Laboratory Chemicals
0.05
50
50 0.051.000
1.000
0.600 50
0.05
0.05
50 0.05
50
50
50
0.05
0.05

Chemical Name Dilution Total Dilution Volume Dilution Volume Used Dilution Volume Used Chemical Volume Density Mass Flow Denser Than Water
Units [L] [mL/month] [L/month] [L/month] [g/mL] [g/month]Chlorine 100% 3.79 3.79 1.467 5,560 YesCidex Opa 55% 3.79 2.08Savlon 1% 3.79 0.04Antiseptic alcohol 100% 30.32 30.32 0.913 27,682 NoFormol 10% 1.00 0.10 1.09 109 YesAlcohol 50% 1.90 0.913 1,730 NoIodine 50% 1.90 4.94 9,361 YesIodine 100% 3.79 3.79 4.94 18,723 Yes
Chemical Name Dilution Total Dilution Volume Dilution Volume Used Dilution Volume Used Chemical Volume Density Mass Flow Denser Than Water
Units [L] [mL/month] [L/month] [L/month] [g/mL] [g/month]Savlon 1% 4.00 0.04Cidezyme 10% 3.00 0.30Iodine 0.1 22.74 4.94 113.7 YesDetergent 100% 18.00 18.00 0.93 16,740 NoAlcohol 100% 22.74 22.74 0.913 20,762 NoChlorine 2% 11.37 18.95 0.33 1.467 489 YesSoap UnknownEndure 100% 15.16 15.16
Table 17: Medical and Emergency Chemicals
Table 18: Surgery Chemicals
3.79

Chemical Name Dilution Total Dilution Volume Dilution Volume Used Dilution Volume Used Chemical Volume Density Mass Flow Denser Than Water
Units [L] [mL/month] [L/month] [L/month] [g/mL] [g/month]Chlorine (laundry) 15.16 1.467 22,240 YesSuper concentrated laundry powder 20,000Soap (cleaning) 15,000Chlorine (cleaning) 37.90 1.467 55,599 YesDisinfectant 15.16
Chemical Category Volume Used Mass Flow Wastewater Flow Concentrationa
Units (L/month) (kg/month) (m3/day) (mg/L)Chlorine 61.18 90 42 70.25Alcohol 54.96 50 42 39.27Iodine 5.69 28 42 22.07Laundry powder 20 42 15.65Soap 15 42 11.74Ethanol/methanol 0.24 0.19 42 0.15Formol 0.10 0.11 42 0.09Acetone 0.025 0.019775 42 0.02Morphine 0.020 0.0262 42 0.02aAssuming all chemicals enter waste stream at a constant rate. Conversions: 1000 g = 1 kg, 30.42 days = 1 month, 1000 L = 1 m3
Table 20: Highest Chemical Concentrations
Table 19: Laundry and Cleaning Chemicals

60
Appendix C: Water Usage and Wastewater Production Calculations

Table 21: Estimation of Water Use by Activity and Nationality Calculated By: JD
Checked By: BV
Ecuadorean-IndigenousActivity Live & Work Live School Age1 Below School Age2 Live & Work Visit Visit
4.0 − 5.0 2.3 − 4.1 9.2 − 20.0
21.4 − 27.2 0.32 − 0.5 6.3 − 12.5
33.5 − 40.0 0.25 − 0.31 7.4 − 11.6
7.0 − 12.5 0.15 − 0.5 1.1 − 4.9
2.0 − 2.1 0.4 − 0.75 0.8 − 1.5
5.7 − 8.0
41.4 − 52.010.75 scaling-factor 20.5 scaling-factor
NA = not applicable
cgpcd may not equal gal/use multiplied by uses/cap/d due to difference in the number of study averages used to compute the mean and ranges shown.
√ √
√
√
√
√
√
bMean and ranges of results reported in Cohen and Wallman, 1974; Laak, 1975; Bennett and Linstedt, 1975; Siegrist et al., 1976; and Ligman et al., 1974.
√
3.2
100.29
0.58
0.35
9.2
√
√
√
aTable 4.2 from Wastewater Treatment/Disposal for Small Communities . EPA, September 1992. Pg. 40.
√
√NA NA
2
6.6
1.2
NA NA
√ √
√
gpcdc
16.2
24.5 0.43
4.3Gal/use
3.5Uses/cap/d
√
√
√
√ √
√
√
√
√ √
29
Toilet flushing
Bathing
Clothes washing
Dishwashing
Garbage grinding
Miscellaneous
Total 59 59 4445.6
37.4
8.8
√
√
√
North American European (or) Ecuadorean-MestizoTypical Residential Water Use by Activitya,b
15
√
√
46 23
√ √
√

Table 22: Water Usage Calculations: Non-hospitalCalculated By: JD Checked By: BV
Live & Work1 Live2 School Age3 Below School Age4
2 93 2.0 European/other western11 1 10 6 1,316 19.7 North American
Duplexes 8 8 936 13.3 North AmericanVisiting Staff Quarters 6 278 6.0 Ecuadorian - MestizoNotes
1 Those who both live and work on the hospital property. Assume 24 hours on hospital property.2 Those who live but don't work on the hospital property. Assume 16 hours on hospital property.3 Assume 8 hours in school and 16 hours on hospital property.4 Assume 24 hours on the hospital property.5 References per capita water usage figures based on activity and nationality from Table 21.6 Based on actual number of hours spent on hospital property. Scale factors of 0.75 and 0.5 added to School Age and Below School Age , respectively.
Table 23: Water Usage Calculations: HospitalCalculated By: JD Checked By: BV
Category Source Unit Number Equivalent Number
Water Usage / Unit (gpd/unit) Nationality
Outpatient5 57 10.7 Ecuadorian - Mestizo / IndigenousEmergency6 23 23 Ecuadorian - Mestizo / IndigenousInpatient7 10 10 Ecuadorian - MestizoOutpatient8 28 3.6 23 Ecuadorian - MestizoEmergency9 23 23 19 Ecuadorian - Mestizo / IndigenousInpatient10 10 1.9 23 Ecuadorian - MestizoCasitas11 4 4 15 Ecuadorian - Indigenous8-hr Shift12 58 58 Ecuadorian - Mestizo6-hr Shift13 5 3.8 Ecuadorian - MestizoNon-resident Missionary14 5 5 North AmericanHospital Restuarant15 Plate 40 40 10Laundry16 Load 16 16 50.1Notes
1 Although nationality does influence water usage, it has been assumed that water usage is the same for all hospital patients and employees.2 Minimum wastewater flow from medical hospital bed. Wastewater Treatment/Disposal for Small Communities . Pg. 43, Table 4-7.3 Water usage based on number of visitors and per capita water usage figures from Table 21 (i.e. not calculated using equivalent number).4 Minimum wastewater flow from medical hospital employee. Wastewater Treatment/Disposal for Small Communities . Pg. 43, Table 4-7.5 1250 outpatients/month, 57/weekday (assuming 22 weekdays/month), assume 3 hours/patient (3/16 scaling factor).6 700 emergency patients per month (23/day), assume 24 hours/patient.7 Based on an average value for the number of inpatients per day, assume 24 hours/patient.8 Assume that half of outpatients have one visitor for 3 hours.9 Assume that each emergency patient is accompanied by one person for the duration of their stay (24 hours).
10 Assume that each inpatient has one visitor for 3 hours (3/16 scaling factor).11 Water used in the casitas comes from the hospital system but wastewater discharges into the town sewer system.12 There are 58 staff who work 160 hours/month.13 There are 5 nurses who each work 120 hours/month (6/8 scaling factor).14 These work in the hospital for 8 hours per day but live outside of the hospital water system.15 Assume restaurant serves 40 meals per day Monday through Friday. Typical wastewater flow associated with one meal. Wastewater Treatment/Disposal for Small Communities . Pg. 42, Table 4-6.16 Two washing machines each running 8 loads/day. Typical wastewater flow from one load of laundry. Wastewater Treatment/Disposal for Small Communities . Pg. 42, Table 4-6.
Category
20307
Source
Missionary / Visitor Residences
ChildrenAdults
228
27
NationalityWater Usage5
(gal/day)
1,406
1,3203,080
648440
Person·days6
Other802
Hospital Property Residences
5.3
Bed
Person
Employee
60
Water Usage (gal/day)
132
400
Patient1,2
Visitor3
Staff1,4
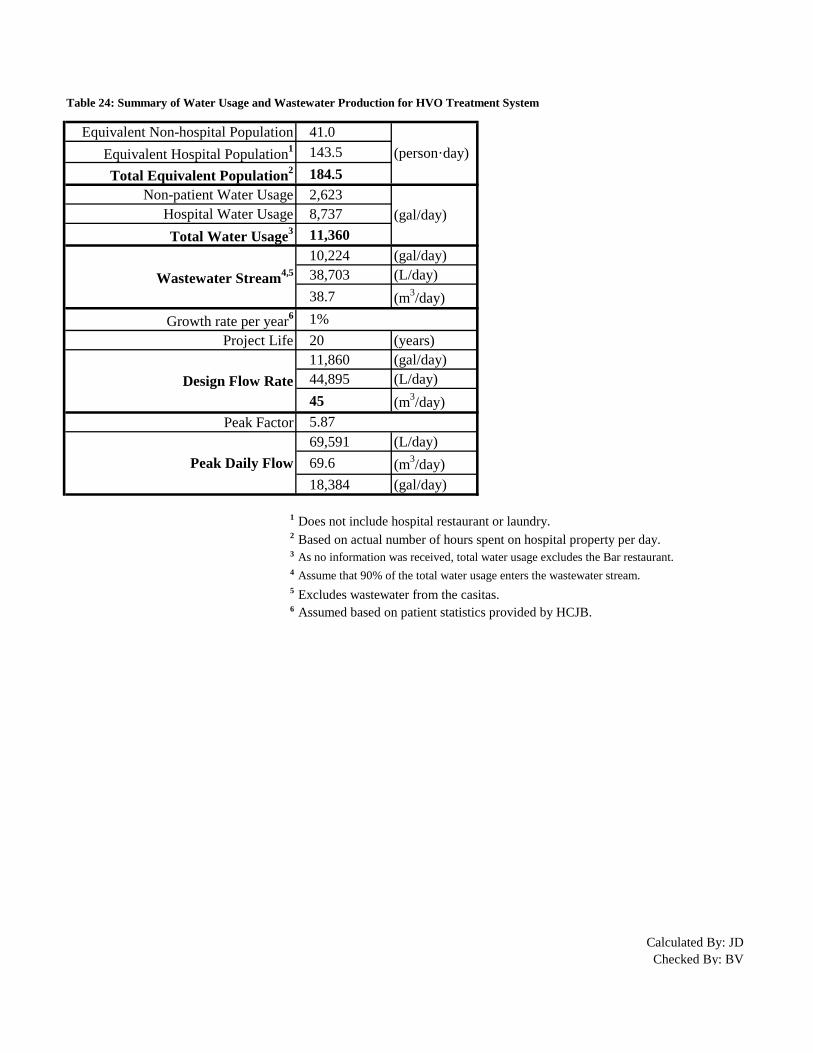
Table 24: Summary of Water Usage and Wastewater Production for HVO Treatment System
Equivalent Non-hospital Population 41.0Equivalent Hospital Population1 143.5Total Equivalent Population2 184.5
Non-patient Water Usage 2,623Hospital Water Usage 8,737Total Water Usage3 11,360
10,224 (gal/day)38,703 (L/day)38.7 (m3/day)
Growth rate per year6
Project Life 20 (years)11,860 (gal/day)44,895 (L/day)45 (m3/day)
Peak Factor69,591 (L/day)69.6 (m3/day)18,384 (gal/day)
1 Does not include hospital restaurant or laundry.2 Based on actual number of hours spent on hospital property per day.3 As no information was received, total water usage excludes the Bar restaurant.4 Assume that 90% of the total water usage enters the wastewater stream.5 Excludes wastewater from the casitas.6 Assumed based on patient statistics provided by HCJB.
Calculated By: JD Checked By: BV
(person·day)
(gal/day)
Wastewater Stream4,5
Design Flow Rate
Peak Daily Flow
5.87
1%

64
Appendix D: HACH Chemical Test Results

65
River Water Results
Iron Test: 3.4 mg/L present
Hardness Test: Low Range 18 mg/L of CaCl3 present Orthophosphate Test: 0.16 mg/L of Phosphate Present DO Test: 7 mg/L Oxygen present Nitrate Test: 0 mg/L Ammonia Nitrogen: Temperature: 21ᵒC 0.7 mg/L Ammonia Nitrogen present
Post Septic Tank Water Test Results (sample taken 1/26/2011 at 3:30 pm)
Patho-screen Test: positive for pathogens Iron: 0 mg/L Hardness: 256.5 mg/L Orthophosphate: 12 mg/L Nitrate: 0 mg/L Ammonia-nitrogen: Off scale (at least 2.5 mg/L ± 16%)
Tap Water Test Results (sample taken 1/26/2011 at 4:00 pm)
Patho-screen Test: positive for pathogens Iron: 0 mg/L Hardness: 153.9 mg/L

66
Appendix E: BOD Test Calculations

67
BOD Calculation with dilution factor of 30
Initial DO at pre-septic tank with DF30
Final DO at pre-septic tank with DF30
Sample volume
Total volume
BOD4 at pre-septic tank
Initial DO at post-septic tank with DF30
Final DO at post-septic tank with DF30
Sample volume
Total volume
BOD4 at post-septic tank
Initial DO at river with DF30
Final DO at river tank with DF30
Sample volume
Total volume
BOD4 at river tank
DOIpre30 9mgL
:=
DOFpre30 7mgL
:=
SVpre30 12.5mL:=
TVpre30 330mL:=
BOD4pre30DOIpre30 DOFpre30−
SVpre30
TVpre30
52.8mgL
⋅=:=
DOIpost30 8mgL
:=
DOFpost30 7mgL
:=
SVpost30 12.5mL:=
TVpost30 342.5mL:=
BOD4post30DOIpost30 DOFpost30−
SVpost30
TVpost30
27.4mgL
⋅=:=
DOIrw30 8mgL
:=
DOFrw30 7.5mgL
:=
SVrw30 12.5mL:=
TVrw30 342.5mL:=
BOD4rw30DOIrw30 DOFrw30−
SVrw30
TVrw30
13.7mgL
⋅=:=
Calculations By: SY Checked: JD

68
Appendix F: Sludge Accumulation Calculations

69
Sludge Accumulation Calculations
Internal Dimensions of Current Septic Tank Base 9.76 m Height 1.64 m Depth 1.83 m
Sludge Depth In Compartments
Compartment # Depth (m) 1 0.0254 2 0.0762 3 0.02
Compartment #1
Dimensions (m) Volume (m3) Base Area (m2) Sludge Volume (m3) Base 3.6
10.8 6.6 0.167 Depth 1.64 Width 1.83
Compartment #2
Dimensions (m) Volume (m3) Base Area (m2) Sludge Volume (m3) Base 2
6.0 3.66 0.279 Depth 1.64 Width 1.83
Compartment #3 Dimensions (m) Volume (m3) Base Area (m2) Sludge Volume (m3) Base 2.3
6.90 4.21 0.084 Depth 1.64 Width 1.83 Total Sludge Volume Accumulated over Time
Time 2 years Total Volume Accumulated 0.530 m3 Accumulation Rate 0.27 m3/yr
Calculations By: RK Checked: BV

70
Appendix G: Septic Tank Design Calculations

71
Current Septic Tank Calculations and Specifications
Current Septic Tank Volume
Base Length of the Tank including wall thickness
Height of the Tank including wall thickness
Outside Wall Thickness
Internal Wall Thickness
Width of the Tank including wall thickness
Total Volume of the Tank:
Septic Tank Volume Needed to Accomplish Adequate Hydraulic Retention Time:
Hydraulic Retention Time (EPA 6.2.5.1)
Calculated from information provided by HCJB See Appendix C
Two Septic Tanks in Series Using the Current Tank
New Tank Volume Necessary to Satisfy 24 hr. Hydraulic Retention Time:
Size Up the Additional Septic Tank by 1/3 for room for Sludge Accumulation over time
Size up Additional Septic Tank again to match the size of the original tank of 28 m^3 for future expansion as well as to ensure equal distribution of flow to each tank. This volume satisfies a Hydraulic Retention time of 24 hours and will still be a good size after sludge has accumulated. The dimensions of this tank will be an outside wall thickness of 30 cm, inside dividing wall thickness of 15 cm, outside base length of 10.36 meters, outside height of 2.24 meters, and an outside width of 2.43 meters.
b 10.36m:=
h 2.24m:=
tw 0.30m:=
tiw 0.15m:=
w 2.43m:=
Vct b 2 tw⋅− 2tiw−( ) h 2 tw⋅−( )⋅ w 2 tw⋅−( )⋅ 28.391 m3⋅=:=
HRT24 24hr:=
Q 45000L
day:=
VHRT HRT24 Q⋅ 45 m3⋅=:=
Vnew VHRT Vct− 16.609 m3⋅=:=
Vnew43⋅ 22.145 m3
⋅=
Calculations By: RK Checked: JD

72
New Septic Tank Compartments:
2 Compartment Tank (EPA 6.2.5.4)
First Compartment must be 2/3 of the total volume of the tank
Volume of 1st Compartment
Dimensions:
Second Compartment must be 1/3 of the total volume of the tank
Volume of 2nd Compartment
Dimensions:
Pipe Locations on the tank:
NOTE: All Pipes are 20cm in diameter
Inlet Pipe:
Criteria: 1. Optimum water depth 2. Connection Tee (minimize turbulence) 3. Connection Tee below scum layer
Distance of Pipe from Bottom of Tank = 1.39 m Distance of Pipe from Top of Tank = 5 cm = 0.05 m Distance of Pipe from Outside of the Outside Wall = 1.115 m (Centered)
Outlet Pipe:
Criteria: 1. Below Inlet Pipe 2. Connection Tee with filter 3. Connection Tee below scum layer
Distance of Pipe from Bottom of Tank = 1.39 m Distance of Pipe from Top of Tank = 5 cm = 0.05 m Distance of Pipe from Outside of the Outside Wall = 1.115 m (Centered)
V1c23
Vct⋅ 18.928 m3⋅=:=
Length1 6.4m:=
Depth1 1.64m:=
Width1 1.83m:=
V2c13
Vct⋅ 9.464 m3⋅=:=
Length2 3.2m:=
Depth2 1.64m:=
Width2 1.83m:=

73
Appendix H: Scum Baffle Specifications

74
Baffle
1 Tee PVC 8X8X8 1 PVC Pipe 8 inch Diameter 25 cm length Sealed with an EPOXY Glue

75
Appendix I: Dosing Tank Calculations

76
Dosing Calculation
Volume of piping
Dosing volume = Piping volume
Siphons(w/ Siphon Model 430)
Draw-down depth
Low-water to bottom
Hieght of dosing tank
Width
Length
Dosing Tank Volume
Average Discharge
Dosing Time Duration
Siphon Diameter
Vpipe 8.67m3:=
Vdose Vpipe 8.67 m3⋅=:=
B 30in:=
D 24.4in:=
h B D+ 1.382m=:=
wx 2.5m:=
ly 2.5m:=
Vtank wx ly⋅ h⋅ 8.636 m3⋅=:=
Qavg 170galmin
:=
tVdoseQavg
13.473 min⋅=:=
a 4in:=
vQavg
a2π
4
4.34fts⋅=:=
Calculations By: SY Checked: JD

77
Siphons(w/ Siphon Model 316)
Draw-down depth
Low-water to bottom
Hieght of dosing tank
Width
Length
Dosing Tank Volume
Average Discharge
Dosing Time Duration
Siphon Diameter
B1 16in 0.406m=:=
D1 22in 0.559m=:=
h1 B1 D1+ 0.965m=:=
wx1 3m:=
ly1 3m:=
Vtank1 wx1 ly1⋅ h1⋅ 8.687 m3⋅=:=
Qavg1 76galmin
0.00479m3
s⋅=:=
t1VdoseQavg1
30.136 min⋅=:=
a1 3in:=
v1Qavg1
a12π
4
1.051ms⋅=:=
Calculations By: SY Checked: JD

78
Appendix J: Drainfield Design Calculations

79
Drainfield Design Calculations
Waste stream design flow rate with future expansion
Soil percolation rate (from test at 1 meter depth)
Allowable application rate for trenches (Table 7-2 of EPA Design Manual: Onsite Wastewater Treatment and Disposal Systems)
Total infiltration area required for drainfield
Trench height below drain pipe included in infiltration area (Michigan Criteria for Subsurface Sewage Disposal)
Maximum width of trench (Table 7-3 of EPA Design Manual for Onsite Wastewater Treatment and Disposal Systems)
Minimum spacing between trench sidewalls (Michigan Criteria for Subsurface Sewage Disposal)
Qdesign 45m3
day:=
Rperc 12.68minin
:=
Rapp 0.8gal
day ft2⋅
32.597L
day m2⋅
⋅=:=
AreareqQdesign
Rapp1381m2
=:=
h 45cm:=
wt 36in 0.91m=:=
smin 4ft 1.219 m⋅=:=
Calculations By: BV Checked: SY

80
Suggested spacing between trench sidewalls for ease of construction (EPA Design Manual: Onsite Wastewater Treatment and Disposal Systems)
Suggested maximum trench length (EPA Design Manual: Onsite Wastewater Treatment and Disposal Systems)
Infiltration area per unit length
Total trench length required
Minimum number of trenches required
Even number of trenches (for alternating halves)
Length of each trench
ssuggested 6ft 2m=:=
Lmax 100ft 30.5m=:=
Apul 2 h⋅ wt+ 1.814m=:=
LtotAreareq
Apul761m=:=
Nt ceilLtotLmax
25=:=
Nte Nt 1+ 26=:=
LtrenchLtotNte
29.3m=:=

81
Drainfield Dosing
Distribution pipe diameter
Distribution pipe cross sectional area
Total length of perforated distribution pipe
Total length of transfer pipe from distribution boxes
Pipe capacity of each field
Dosing volume per field section
Number of total doses per day
Number of doses per day per field
Ddist 6in 0.152m=:=
Adist πDdist
2
4⋅ 0.018 m2
⋅=:=
Ltot 761m=
Ltrans 190m:=
VoldistLtot Ltrans+
2Adist⋅ 8.67 m3
⋅=:=
Voldose Voldist 8.67 m3⋅=:=
DosesperdayQdesignVoldose
5.21
day⋅=:=
Dosesfield12
Dosesperday 2.61
day⋅=:=

82
Appendix K: Sludge Pump Options

83
Option 1
2011 Slide-In Units
Great Lakes Equipment Sales, Inc. 100 N. Center Street, Suite LL 120
Mishawaka, IN 46544-1201 888-432-9070
www.usedvacuumtrucks.com
"New" Slide-In Vacuum Units 450 Gallon Slide-In Units, 300 waste / 150 fresh - electric start 5.5 HP Honda - Conde Super 6 pump (70 CFM) with 4-way valve, 12-volt wash down system pump with 50 ft. hose and nozzle - 30' x 2" Tiger Tail inlet hose with stinger - work light - battery box - 3" discharge (Can Also Custom Build Any Size Tank And Up-Grade to Larger Vacuum Pumping System) Call for Pricing and Specifications (FOB Shipping Point Wisconsin)
Price GENERAL INFORMATION
$8,000 Color Unpainted/Unpainted Stock Number GL167 In-Stock ENGINE
Displacement 0 cc OPERATIONAL
Vacuum System Displacement 0 cc

84
Option 2
2003 Sterling Liquid Vacuum Trucks
Great Lakes Equipment Sales, Inc. 100 N. Center Street, Suite LL 120
Mishawaka, IN 46544-1201 888-432-9070
www.usedvacuumtrucks.com
"Used" 80 Barrel Liquid Vacuum Truck 2003 STERLING LT9500, 110,227 MILES, CAT C-10, ALLISON AUTOMATIC TRANSMISSION, 20,000 FRONT, 46,000 REAR AXLES, PUSHER AXLE, 80-BARREL STEEL VACUUM TANK, JUROP 260 D 363 CFM VACUUM PUMP. PRICE $80,000 (FOB Shipping Point Little Rock, Arkansas) SOLD AS IS - NO WARRANTY
Price GENERAL INFORMATION
$80,000.00 Color White/White Stock Number GL117 Miles/Hours 110227

85
Appendix L: Sludge Disposal Calculations

86
Sludge Disposal Calculations
Total Volume of waste to be pumped out of the tanks combined
Use a SF of 65% to account for added water for pumping
Depth of the square hole is 3 meters and the area is 6m by 6m giving a total volume of approximately 100 m3.
Granular Depth Needed: Granular Material Must make up 50% of the total depth of the hole
Total volume needed of Granular Material
Sand Depth Needed:
Sand Material Must make up 17% of the total depth of the hole
Total volume needed of Granular Material
The location and foot print can be found on drawing SP-1
Vwaste 60m3:=
VWDT Vwaste 1.65⋅ 99m3=:=
Gd 0.5 3⋅ m 1.5m=:=
VG 6m 6⋅ m Gd⋅ 54m3=:=
Sd .17 3⋅ m 0.51m=:=
VS 6m 6⋅ m Sd⋅ 18.36m3=:=
Calculations By: RK Checked: SY

87
Appendix M: Overall System Piping Network Elevations
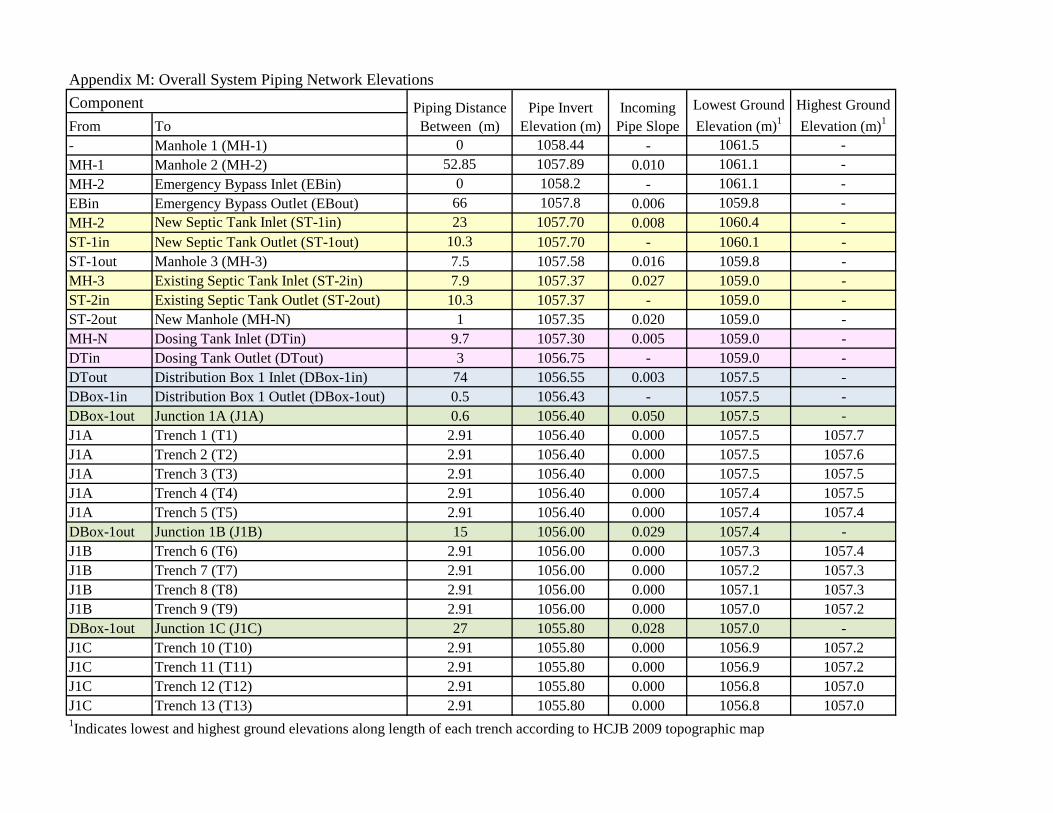
Appendix M: Overall System Piping Network Elevations
From To- Manhole 1 (MH-1) 0 1058.44 - 1061.5 -MH-1 Manhole 2 (MH-2) 52.85 1057.89 0.010 1061.1 -MH-2 Emergency Bypass Inlet (EBin) 0 1058.2 - 1061.1 -EBin Emergency Bypass Outlet (EBout) 66 1057.8 0.006 1059.8 -MH-2 New Septic Tank Inlet (ST-1in) 23 1057.70 0.008 1060.4 -ST-1in New Septic Tank Outlet (ST-1out) 10.3 1057.70 - 1060.1 -ST-1out Manhole 3 (MH-3) 7.5 1057.58 0.016 1059.8 -MH-3 Existing Septic Tank Inlet (ST-2in) 7.9 1057.37 0.027 1059.0 -ST-2in Existing Septic Tank Outlet (ST-2out) 10.3 1057.37 - 1059.0 -ST-2out New Manhole (MH-N) 1 1057.35 0.020 1059.0 -MH-N Dosing Tank Inlet (DTin) 9.7 1057.30 0.005 1059.0 -DTin Dosing Tank Outlet (DTout) 3 1056.75 - 1059.0 -DTout Distribution Box 1 Inlet (DBox-1in) 74 1056.55 0.003 1057.5 -DBox-1in Distribution Box 1 Outlet (DBox-1out) 0.5 1056.43 - 1057.5 -DBox-1out Junction 1A (J1A) 0.6 1056.40 0.050 1057.5 -J1A Trench 1 (T1) 2.91 1056.40 0.000 1057.5 1057.7J1A Trench 2 (T2) 2.91 1056.40 0.000 1057.5 1057.6J1A Trench 3 (T3) 2.91 1056.40 0.000 1057.5 1057.5J1A Trench 4 (T4) 2.91 1056.40 0.000 1057.4 1057.5J1A Trench 5 (T5) 2.91 1056.40 0.000 1057.4 1057.4DBox-1out Junction 1B (J1B) 15 1056.00 0.029 1057.4 -J1B Trench 6 (T6) 2.91 1056.00 0.000 1057.3 1057.4J1B Trench 7 (T7) 2.91 1056.00 0.000 1057.2 1057.3J1B Trench 8 (T8) 2.91 1056.00 0.000 1057.1 1057.3J1B Trench 9 (T9) 2.91 1056.00 0.000 1057.0 1057.2DBox-1out Junction 1C (J1C) 27 1055.80 0.028 1057.0 -J1C Trench 10 (T10) 2.91 1055.80 0.000 1056.9 1057.2J1C Trench 11 (T11) 2.91 1055.80 0.000 1056.9 1057.2J1C Trench 12 (T12) 2.91 1055.80 0.000 1056.8 1057.0J1C Trench 13 (T13) 2.91 1055.80 0.000 1056.8 1057.0
Piping Distance Between (m)
Pipe Invert Elevation (m)
Incoming Pipe Slope
Lowest Ground Elevation (m)1
Highest Ground Elevation (m)1
Component
1Indicates lowest and highest ground elevations along length of each trench according to HCJB 2009 topographic map
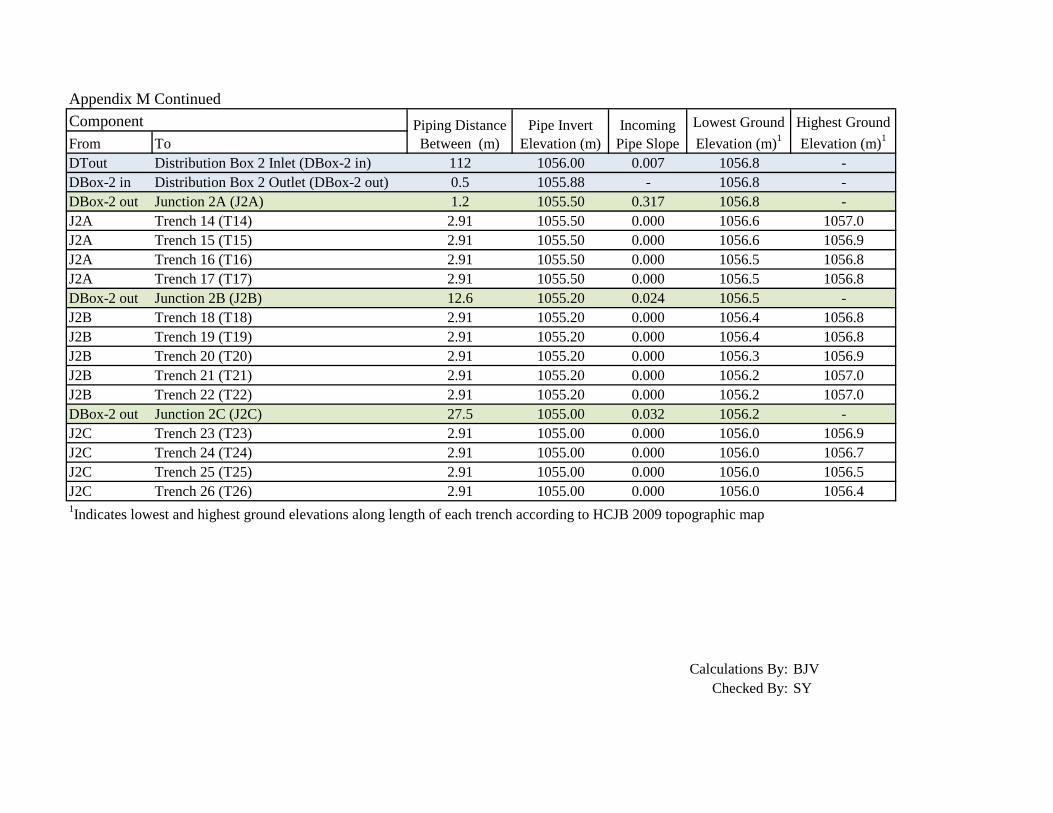
Appendix M Continued
From ToDTout Distribution Box 2 Inlet (DBox-2 in) 112 1056.00 0.007 1056.8 -DBox-2 in Distribution Box 2 Outlet (DBox-2 out) 0.5 1055.88 - 1056.8 -DBox-2 out Junction 2A (J2A) 1.2 1055.50 0.317 1056.8 -J2A Trench 14 (T14) 2.91 1055.50 0.000 1056.6 1057.0J2A Trench 15 (T15) 2.91 1055.50 0.000 1056.6 1056.9J2A Trench 16 (T16) 2.91 1055.50 0.000 1056.5 1056.8J2A Trench 17 (T17) 2.91 1055.50 0.000 1056.5 1056.8DBox-2 out Junction 2B (J2B) 12.6 1055.20 0.024 1056.5 -J2B Trench 18 (T18) 2.91 1055.20 0.000 1056.4 1056.8J2B Trench 19 (T19) 2.91 1055.20 0.000 1056.4 1056.8J2B Trench 20 (T20) 2.91 1055.20 0.000 1056.3 1056.9J2B Trench 21 (T21) 2.91 1055.20 0.000 1056.2 1057.0J2B Trench 22 (T22) 2.91 1055.20 0.000 1056.2 1057.0DBox-2 out Junction 2C (J2C) 27.5 1055.00 0.032 1056.2 -J2C Trench 23 (T23) 2.91 1055.00 0.000 1056.0 1056.9J2C Trench 24 (T24) 2.91 1055.00 0.000 1056.0 1056.7J2C Trench 25 (T25) 2.91 1055.00 0.000 1056.0 1056.5J2C Trench 26 (T26) 2.91 1055.00 0.000 1056.0 1056.4
Calculations By: BJVChecked By: SY
1Indicates lowest and highest ground elevations along length of each trench according to HCJB 2009 topographic map
Component Piping Distance Between (m)
Pipe Invert Elevation (m)
Incoming Pipe Slope
Lowest Ground Elevation (m)1
Highest Ground Elevation (m)1

90
Appendix N: Drawing Set