Hospital acquired infections: Biofilm assembly and ...€¦ · Hospital acquired infections:...
90
Hospital acquired infections: Biofilm assembly and increased antibiotic resistance of microorganisms Maria Miguel Fachadas Bandeira Thesis to obtain the Master of Science Degree in Biomedical Technologies Supervisor: Doutora Maria Luísa Forte Marques Jordão Co-supervisor: Professor Patrícia Maria Cristovam Cipriano Almeida de Carvalho Examination Committee Chairperson: Professor Raúl Daniel Carneiro Lavado Martins Supervisor: Doutora Maria Luísa Forte Marques Jordão Members of the Committee: Professor Célio Gabriel Figueiredo Pina Professor Maria Aida da Costa e Silva da Conceição Duarte April 2014
Transcript of Hospital acquired infections: Biofilm assembly and ...€¦ · Hospital acquired infections:...

Hospital acquired infections: Biofilm assembly and
increased antibiotic resistance of microorganisms
Maria Miguel Fachadas Bandeira
Thesis to obtain the Master of Science Degree in
Biomedical Technologies
Supervisor: Doutora Maria Luísa Forte Marques Jordão
Co-supervisor: Professor Patrícia Maria Cristovam Cipriano Almeida de Carvalho
Examination Committee
Chairperson: Professor Raúl Daniel Carneiro Lavado Martins
Supervisor: Doutora Maria Luísa Forte Marques Jordão
Members of the Committee: Professor Célio Gabriel Figueiredo Pina
Professor Maria Aida da Costa e Silva da Conceição Duarte
April 2014

ii
Acknowledgements
Throughout this work, I would like to thank the people who directly or indirectly took part in it.
I would like to give my thanks to Doutora Luísa Jordão, Professor Patrícia Almeida Carvalho
and Professor Aida Duarte for monitoring, support, availability and encouragement during this work.
Without this help, it wouldn’t be possible the production of this dissertation. Thank you also for your
endless patience and friendship.
For their monitoring during this work, I also want to thank to Professor Raúl Carneiro Martins
and Professor Mamede de Carvalho. For their availability and helping on operating the scanning
electron microscope, I want to thank to Engenheira Isabel Nogueira and Pedro Nolasco.
I also want to thank to Doutora Lídia Gonçalves, for her availability and help on performing the
zeta potential assay. From Instituto Nacional de Saúde Doutor Ricardo Jorge (INSA), I want to thank
Irene Matos, for the availability of culture medium and important reagents and to Lúcia Reis and João
Rodrigues, for their help in the bacteria growth process.
I must also thank to people that in an indirect way for this work, have shown me their support.
To my parents Antónia and Fernando, my sister Rita and the rest of my family for having given me all
the necessary stability, love and supporting me always, whatever I do. To my boyfriend, João Belo, for
his encouragement, patience and availability on helping me. Thank you for your love, caring and for
the reminders when I needed. I also want to thank to all my friends who have given me an
encouragement word during this work, especially to my friends Dulce Gadelha and Inês Bernardo, for
their friendship and caring.

iii
Abstract
Healthcare-associated infections (HAIs) are a public health threat. The etiological agents
responsible for these infections are diverse and often resistant to antibiotics. Bacteria are able to
assemble biofilms persisting in healthcare units, becoming more resistant to antibiotic and being
responsible for HAIs onset and spread.
Bacteria isolated from samples, collected in hospitals fulfilling the criteria of HAI, were used.
The selected bacteria comprise classical (Klebsiella pneumoniae) and emergent agents of HAI
(Nontuberculous mycobacteria: NTM). Bacterial ability to assemble biofilms on cell culture plates was
evaluated by the microtiter plate test. The structural features of bacteria (planktonic and biofilms) were
accessed using scanning electron microscopy (SEM). Biofilms assembled on the model surface (cell
culture plate) and on abiotic surfaces present in healthcare units (e.g. silicon) were characterized. For
K. pneumoniae strains the ability to assemble biofilms on biotic surfaces (HeLa cells) was also
evaluated.
The SEM analysis allowed the identification of differences between planktonic and sessile
bacteria, which were linked to increased virulence. The results showed that biofilm assembly depends
on bacteria and abiotic surface. On biotic surfaces, the biofilm assembly is dependent on tropism
relations between bacteria and the host. For NTM biofilm was possible to identify factors involved in
biofilm assembly: sliding and membrane charges. In the case of K.pneumoniae this relation was not
establish. Nevertheless, it was possible to establish a link between the ability to assemble biofilm and
increased antibiotic resistance. Altogether these data revealed a relation between biofilm assembly,
antibiotic resistance and spread of HAIs.
Keywords
Antibiotic resistance, bacteria, biofilm assembly, healthcare-associated infection, SEM

iv
Resumo
As infeções nosocomiais (HAIs) são um problema de saúde pública. Os seus agentes
etiológicos são diversos e resistentes a antibióticos. As bactérias formam biofilmes, permanecendo
em unidades hospitalares, contribuindo para a propagação das HAIs e aumentando a sua resistência
aos antibióticos.
As estirpes estudadas, recolhidas em ambiente hospitalar, são agentes etiológicos clássicos
(Klebsiella pneumoniae) e emergentes de HAIs (Micobactérias não tuberculosas: NTM). A formação
de biofilmes foi avaliada em caixas de cultura celular (modelo), por microtitulação. As características
estruturais das bactérias (planctónica/biofilmes) foram avaliadas utilizando microscopia eletrónica de
varrimento (SEM). Os biofilmes formados no modelo e em superfícies abióticas presentes em
unidades hospitalares (ex. silicone) foram caracterizados. Para as estirpes de K. pneumoniae a
formação de biofilme foi também avaliada em superfícies bióticas (células HeLa).
A análise por SEM possibilitou a identificação de diferenças entre a forma planctónica e
organizada em biofilme, contribuindo para a virulência. A formação de biofilme depende da bactéria e
da superfície, nas superfícies abióticas. Relativamente às superfícies bióticas, esta parece estar
relacionada com o tropismo entre a bactéria e o hospedeiro. Para as NTM foi possível relacionar a
carga membranar e deslizamento com a formação de biofilmes. Tal não foi possível para as estirpes
de K. pneumoniae. Contudo, estabeleceu-se uma ligação entre a capacidade de formação de biofilme
e o aumento da resistência aos antibióticos. De um modo geral, os dados obtidos revelaram uma
relação entre a capacidade de formação de biofilme, a resistência aos antibióticos e a propagação
das HAIs.
Palavras-chave
Bactérias, formação de biofilme, infecções nosocomiais, resistência a antibióticos, SEM

v
Table of contents
Acknowledgements .................................................................................. ii
Abstract ................................................................................................... iii
Resumo .................................................................................................. iv
Table of contents ..................................................................................... v
List of figures .......................................................................................... viii
List of tables ..................................................................................................................................... x
List of acronyms ...................................................................................... xi
Chapter 1 - Introduction ........................................................................... 1
1.1 State of Art ......................................................................................................... 2
1.1.1 Healthcare-associated infections and etiological agents ........................................................2
1.1.2 Biofilm assembly......................................................................................................................6
1.1.3 Biofilms and healthcare-associated infections ........................................................................8
1.1.4 Antibiotics – A retrospective ....................................................................................................9
1.1.5 Bacterial resistance to antibiotics ......................................................................................... 10
1.2 Electron microscopy techniques applied to biofilm study ................................. 12
1.3 Thesis main goal ............................................................................................ 13
Chapter 2 – Materials and methods ....................................................... 14
2.1 Biological samples ............................................................................................ 15

vi
2.1.1 Bacterial strains .................................................................................................................... 15
2.1.2 HeLa cells ............................................................................................................................. 15
2.2 Bacteria susceptibility to antibiotics .................................................................. 15
2.3 Bacteria generation time ................................................................................... 15
2.4 Quantification of biofilm formation .................................................................... 18
2.5 Biofilm assembly on abiotic surfaces ................................................................ 18
2.5.1 Cell culture plate .................................................................................................................... 18
2.5.2 Silicon .................................................................................................................................... 19
2.5.3 Stainless steel ....................................................................................................................... 20
2.6 Adherence assay on biotic surface ................................................................... 21
2.7 Zeta potential assay ......................................................................................... 22
2.8 Sliding motility assay ........................................................................................ 23
2.9 Scanning electron microscopy analysis ............................................................ 23
2.9.1 Sample preparation ............................................................................................................... 23
2.9.2 Data analysis ......................................................................................................................... 25
2.10 Statistical test ................................................................................................. 26
Chapter 3 – Results and discussion ....................................................... 27
3.1 Gram-negative bacteria – Klebsiella pneumoniae ............................................ 28
3.1.1 Planktonic bacteria and generation time .............................................................................. 28
3.1.2 Evaluation of K. pneumoniae susceptibility to antibiotics ..................................................... 31
3.1.3 Biofilm assembly on cell culture plate .................................................................................. 32
3.1.4 Biofilm assembly on silicon and stainless steel surfaces ..................................................... 41
a) Silicon ................................................................................................................................ 41
b) Stainless steel .................................................................................................................. 46
3.1.5 Adhesion to biotic surface .................................................................................................... 47
3.2 Gram-positive bacteria – Nontuberculous mycobacteria .................................. 50
3.2.1 Planktonic bacteria and generation time .............................................................................. 50
3.2.2 Biofilm assembly on cell culture plate .................................................................................. 52

vii
3.2.3 Biofilm assembly on air-liquid interface ................................................................................ 58
3.2.4 Biofilm assembly on silicon .................................................................................................. 62
3.3 Exploring factors involved in biofilm assembly ................................................. 64
3.3.1 Zeta potential and electrophoretic mobility ........................................................................... 64
3.3.2 Sliding motility ....................................................................................................................... 65
Chapter 4 – Conclusions and future work ............................................... 67
4.1 Conclusions ................................................................................................................................ 68
4.2 Future work ................................................................................................................................. 69
References............................................................................................. 70

viii
List of figures
Figure 1 - Etiological agents of healthcare-associated infections. ..........................................................3
Figure 2 – Gram-negative bacteria membrane structure. .......................................................................4
Figure 3 – Mycobacteria membrane structure. .......................................................................................4
Figure 4 – Scanning electron microscopy micrograph of planktonic K. pneumoniae 45. .......................5
Figure 5 – Temporal evolution of biofilm. ................................................................................................8
Figure 6 – Antibiotic consumption daily dose. .........................................................................................9
Figure 7 – Biofilm resistance to antibiotics: proposed mechanisms. ................................................... 12
Figure 8 - Optical density measurement in a 96-well cell culture plate, for evaluated strains. ............ 16
Figure 9 – Outline of cell culture plate assembly for one K. pneumoniae strain. ................................. 19
Figure 10 – Silicon discs used in biofilm assembly on silicon. .............................................................. 19
Figure 11 – Outline of silicon assembly, for one K. pneumoniae strain. .............................................. 20
Figure 12 – Schematic representation of stainless steel plate and flexiPERM. ................................... 20
Figure 13 – Outline of stainless steel biofilm assembly. ...................................................................... 21
Figure 14 – Outline of adhesion assay for K. pneumoniae strains. ..................................................... 22
Figure 15 – Zetasizer Nano disposable capillary cell (DTS1070). ....................................................... 22
Figure 16 – Sample preparation for SEM visualization in secondary electron mode............................ 23
Figure 17 – Sample preparation for SEM visualization in backscattered electron mode. .................... 24
Figure 18 – Image J software display. .................................................................................................. 25
Figure 19 – Bacterial dimensions determination. ................................................................................. 26
Figure 20 – Biofilm constituents. .......................................................................................................... 26
Figure 21 – Bacterial growth curve. ...................................................................................................... 29
Figure 22 – Klebsiella pneumoniae strains growth curves. ................................................................... 30
Figure 23 – Kinetic of biofilm assembly for K. pneumoniae strains. ................................................... 33
Figure 24 – Biofilm assembly phases. .................................................................................................. 34
Figure 25 – Biofilms of K. pneumoniae assembled on cell culture plate. .............................................. 36
Figure 26 – Comparison of planktonic and biofilm organized bacteria. ............................................... 37
Figure 27 – Schematic representation of a biofilm. .............................................................................. 38

ix
Figure 28 – Characterization of K. pneumoniae biofilms assembled on cell culture plates. ................ 39
Figure 29 – Comparison between K. pneumoniae biofilms on cell culture plate. ................................ 40
Figure 30 – Biofilms of K. pneumoniae assembled on silicon. ............................................................. 42
Figure 31 – Characterization of K. pneumoniae biofilms assembled on silicon. ................................... 44
Figure 32 – Comparison between K. pneumoniae cell culture plate and silicon biofilms. .................... 45
Figure 33 – Comparison between K. pneumoniae biofilms assembled on silicon. .............................. 45
Figure 34 – Klebsiella pneumoniae biofilms on a metalic surface. ...................................................... 47
Figure 35 – Adhesion assay. ................................................................................................................ 48
Figure 36 – Evaluation of K. pneumoniae 45 adhesion assay. ............................................................. 49
Figure 37 – Growth curve for NTM. ...................................................................................................... 51
Figure 38 – Kinetic of biofilm assembly for NTM. ................................................................................. 53
Figure 39 – Mycobacterium smegmatis biofilm assembled on cell culture plate with different ages. ... 54
Figure 40 – Mycobacterium chelonae biofilm assembled on cell culture plate with different ages. ..... 54
Figure 41 – Characterization of NTM biofilms assembled on cell culture plates. ................................ 56
Figure 42 – Differences between NTM biofilms assembled on cell culture plates. .............................. 57
Figure 43 – Outline of air-liquid assembly, for one NTM strain. ........................................................... 58
Figure 44 – Evaluation of NTM cell culture plate and air-liquid interface biofilms. ............................... 59
Figure 45 – Characterization of NTM biofilms assembled on air-liquid interface. ................................ 60
Figure 46 – Comparison between NTM cell culture plate and air-liquid interface biofilms ................... 61
Figure 47 – Mycobacterium chelonae biofilms assembled on silicon. ................................................. 62
Figure 48 – Characterization of NTM biofilms assembled on silicon. .................................................. 63
Figure 49 – Comparison between NTM biofilms assembled on cell culture plate and silicon .............. 64
Figure 50 – Evaluation of NTM sliding mobility. ................................................................................... 66

x
List of tables
Table 1 – NTM: Phenotypic characteristics and HAIs.. ............................................................................6
Table 2 – Groups of antibiotics and their target of action. ..................................................................... 10
Table 3 – Klebsiella pneumoniae cell dimensions. .............................................................................. 28
Table 4 – Planktonic K. pneumoniae generation time. ......................................................................... 30
Table 5 – Minimal inhibitory concentrations for planktonic and biofilm K. pneumoniae. ....................... 32
Table 6 – NTM cell dimensions.. .......................................................................................................... 51
Table 7 – Planktonic NTM generation time.. ........................................................................................ 52
Table 8 – Zeta potential and EM obtained values. ................................................................................ 65
xi
List of acronyms
BS Backscattered
ºC Celsius degrees
CFU Colony forming unit
cm Centimeters
d Days
DMEM Dulbecco's Modified Eagle Medium
DNA Deoxyribonucleic acid
EM Electrophoretic mobility
EPS Extracellular polymeric substance
h Hours
IU International units
kV Kilovolt
LPS Lipopolysaccharide
M Molar
mM Milimolar
mV Milivolts
MAPc Mycolyl-arabinogalactan-peptidoglycan complex
MIC Minimum inhibitory concentration
MH Mueller-Hinton
mL Milliliters
mm Milimeters
nm Nanometers
m/v Mass per volume
MurA urauyl-diphosphate-N-acetylglucosamine emolpyruvyl transferase
NTM Nontuberculous mycobacteria
OD Optical density

xii
PBS Phosphate buffered saline
QS Quorum sensing
QSIs Quorum sensing inhibitors
RNA Ribonucleic acid
rpm Revolutions per minute
SD Standard deviation
SEM Scanning electron microscopy
TEM Transmission electron microscopy
µg Microgram
µL Microliter

1
Chapter 1
Introduction
1 Introduction

2
1.1 State of art
1.1.1 Healthcare-associated infections and etiological agents
Healthcare-associated infections (HAIs) are a significant consequence of hospitalization [1, 2].
These infections are one of the leading causes of death and morbidity on patients that are hospitalized
and occur generally after 48 hours of hospitalization [1, 2, 3, 4]. Studies showed that from 3% to 5% of
patients leave the hospital having this type of infection [1, 5].
Nosocomial infections may be also considered either endemic or epidemic. Endemic infections
are most common. Epidemic infections occur during outbreaks, defined as a usual increase above the
baseline of a specific infection or infecting organism [3]. Some factors, such as environmental, patient-
related and iatrogenic factors can contribute to the development of HAIs [6]. However, etiologic agents
are responsible for HAIs incidence. These etiological agents are diverse, as bacteria, viruses, fungi
and parasites (Figure 1). Viruses are important etiological agents of HAIs, being responsible for 5% of
the cases. They can be transmitted by blood transfusions, dialysis or injection, among others. Viruses
divide into adenovirus, retrovirus and herpes virus. Adenovirus can cause respiratory diseases and
retrovirus, human immunodeficiency virus, is responsible for AIDS. Herpes virus can be transmitted by
direct contact either with lesions or saliva [3, 7]. Other types of etiological agents are parasites that are
transmitted by patient’s exposition to an extended antibiotic treatment or severe immunosuppression
[3]. Fungi are the last type of HAIs etiological agents and have been gaining importance during the last
decades. Advances in medicine have been the main reason for fungal infections. Candida and
Aspergillus are the most opportunistic pathogens being responsible for the majority of HAI reported for
fungi [3, 8].
Even though all these agents can contribute to HAIs occurrence, bacteria are the most
frequently. Bacteria can be Gram-negative and Gram-positive and they are differentiated according to
their cell wall. The Gram-negative cell wall (Figure 2) is thinner but structured, consisting in layers of
lipopolysaccharide (LPS) and phospholipids with proteins inserted. Below the proteins there is a layer
of peptidoglycans. The Gram-negative cell structure suggests hydrophilic bacteria [9, 10, 11] while
Gram-positive are hydrophobic bacteria, having thicker cell wall consisting mostly of peptidoglycan,
neutral and acidic polysaccharides and lipids [9, 11, 12, 13]. However, mycobacteria are Gram-
positive microorganisms with unique cell wall architecture [14], composed by two different segments
(Figure 3). An inner membrane surrounds cytoplasm and above this membrane, there are
peptidoglycan, arabinogalactan and mycolic acids, forming the mycolyl-arabinogalactan-peptidoglycan
complex (MAPc) [15]. The second segment is composed by glycolipids and proteins (porins) [14].
When bacterial cells are disrupted, glycolipids and proteins are solubilized while MAPc remains as
insoluble residue. Glycolipds and proteins are the signaling and MAPc is essential to the cell viability,
in disease process [15].

3
Gram-negative bacteria considered in this study are Klebsiella pneumoniae strains. Klebsiella
pneumoniae is an opportunistic bacterium from the Enterobacteriaceae family [17, 18]. The Klebsiella
genus members have increased their resistance to antibiotics, being considered multirresistant
bacteria and became a public health issue [17]. In figure 4 is shown a strain of K. pneumoniae on its
planktonic form.
Figure 1 – Etiological agents of healthcare-associated infections. From O’Brian, 1995 [16].

4
Most K. pneumoniae isolates are capsulated which is probably involved in bacterial adhesion
and adherence to host cells [19]. However, there are also K. pneumoniae strains without capsule.
Figure 2 – Gram-negative bacteria membrane structure. Inner membrane surrounds cytoplasm, and it is separated from peptidoglycan by perplasmic space, that contains water and proteins. From Abedon, 1998 [20].
Figure 3 – Mycobacteria membrane structure. Above inner membrane are MAPc, glycolipids and porins. From Röse, 1974 [21].
5
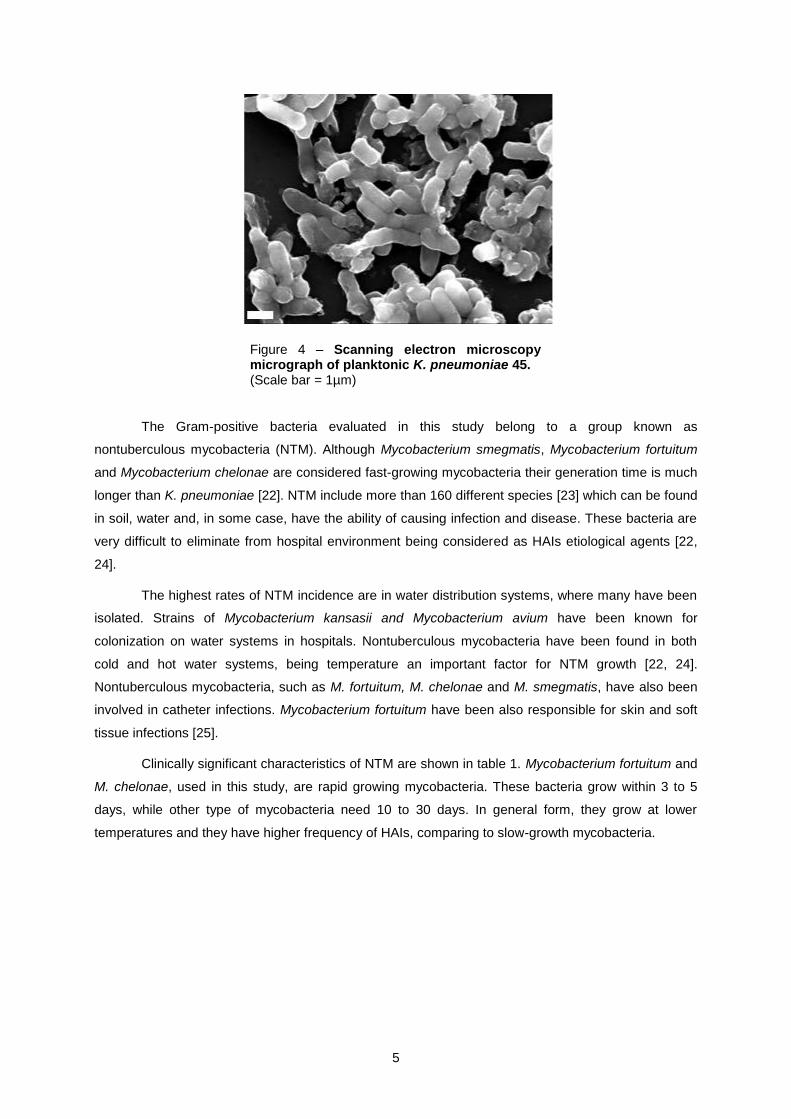
The Gram-positive bacteria evaluated in this study belong to a group known as
nontuberculous mycobacteria (NTM). Although Mycobacterium smegmatis, Mycobacterium fortuitum
and Mycobacterium chelonae are considered fast-growing mycobacteria their generation time is much
longer than K. pneumoniae [22]. NTM include more than 160 different species [23] which can be found
in soil, water and, in some case, have the ability of causing infection and disease. These bacteria are
very difficult to eliminate from hospital environment being considered as HAIs etiological agents [22,
24].
The highest rates of NTM incidence are in water distribution systems, where many have been
isolated. Strains of Mycobacterium kansasii and Mycobacterium avium have been known for
colonization on water systems in hospitals. Nontuberculous mycobacteria have been found in both
cold and hot water systems, being temperature an important factor for NTM growth [22, 24].
Nontuberculous mycobacteria, such as M. fortuitum, M. chelonae and M. smegmatis, have also been
involved in catheter infections. Mycobacterium fortuitum have been also responsible for skin and soft
tissue infections [25].
Clinically significant characteristics of NTM are shown in table 1. Mycobacterium fortuitum and
M. chelonae, used in this study, are rapid growing mycobacteria. These bacteria grow within 3 to 5
days, while other type of mycobacteria need 10 to 30 days. In general form, they grow at lower
temperatures and they have higher frequency of HAIs, comparing to slow-growth mycobacteria.
Figure 4 – Scanning electron microscopy micrograph of planktonic K. pneumoniae 45. (Scale bar = 1µm)

6
Table 1 – NTM: Phenotypic characteristics and HAIs
Species
Ideal growth
temperature
Duplication
time (days)
Colony morphology
Frequency
of HAIs
Slow growers(a)
Photochromogens (b)
M. kansasii
37ºC
10-20
Yellow (with light)
++
Scotchromogens (c)
M. xenopi
42ºC
15-30
Yellow and rough
++
Nonphotochromatogens (d)
M. avium
37ºC
10-20
Smooth-opaque
raised, or smooth-
transparent flat or
rough
+++
Rapid growers (e)
M. fortuitum
M. chelonae
37ºC
28ºC
3-5
3-5
Transparent to cream-
colored smooth with
branching, filamentous
extensions
Transparent to cream-
colored smooth
+++
+++
NOTE: ++, occasional; +++, frequent (a) Exhibit growth between 10 to 30 days; (b) Pigmented colonies requires light; (c) Pigmented colonies don’t
rrequire light; (d) Nonpigmented colonies; (e) Exhibit growth in less than 7 days.
(Adapted from Portaels, 1995 [25])
1.1.2 Biofilm assembly
The majority of bacterial infections (80%) are caused by bacteria organized in biofilm.
Organized bacteria are very persistent, highly antibiotic resistant and have the ability to interfere with
the host immune system [26]. Most biofilms are thick enough to be seen at naked eye, being a public
health problem due to infections related with re-use of medical devices leading to infections during or
after patient’s hospitalization [27, 28].
Biofilms are described as colonies of microorganisms that are attached to each other and to a
7
surface, in an irreversible mode [29, 30]. Bacterial adhesion is a complex process that can be affected
by bacteria physic-chemical characteristics, material surface properties and environmental factors
[31]. Microorganisms form biofilm to survive to adverse environmental conditions, and they suffer
several changes during their transition from planktonic form to cells that are part of a community [32].
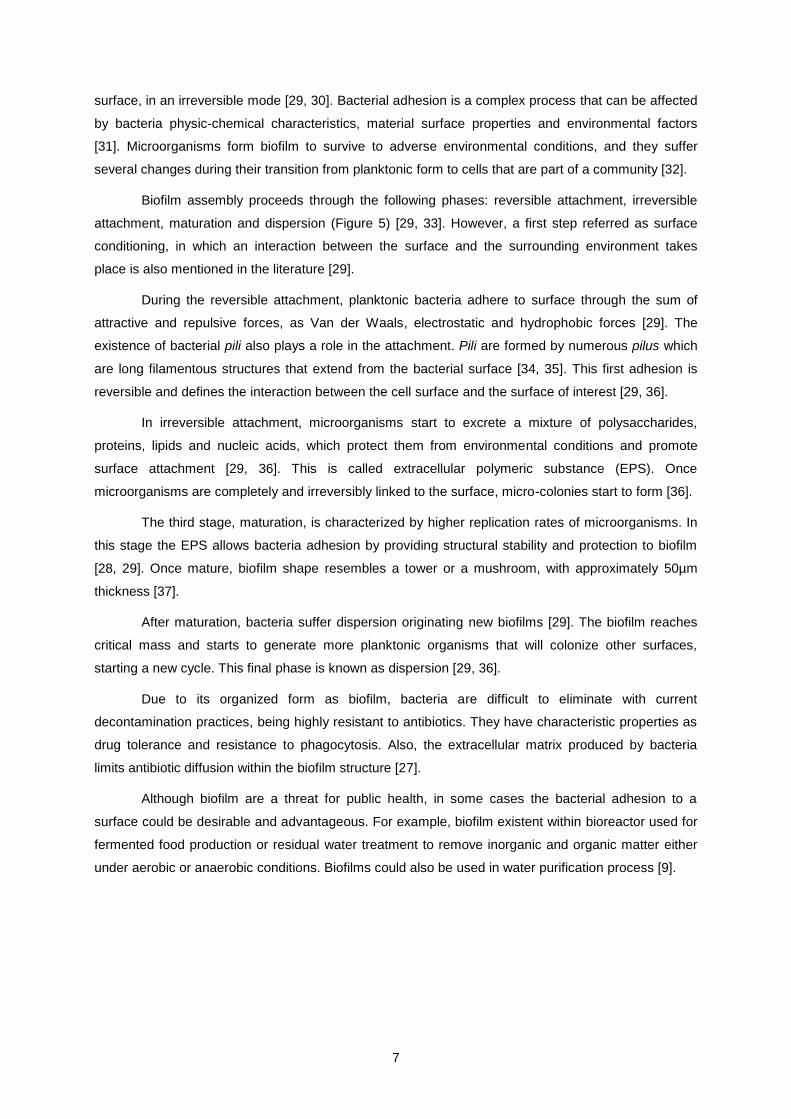
Biofilm assembly proceeds through the following phases: reversible attachment, irreversible
attachment, maturation and dispersion (Figure 5) [29, 33]. However, a first step referred as surface
conditioning, in which an interaction between the surface and the surrounding environment takes
place is also mentioned in the literature [29].
During the reversible attachment, planktonic bacteria adhere to surface through the sum of
attractive and repulsive forces, as Van der Waals, electrostatic and hydrophobic forces [29]. The
existence of bacterial pili also plays a role in the attachment. Pili are formed by numerous pilus which
are long filamentous structures that extend from the bacterial surface [34, 35]. This first adhesion is
reversible and defines the interaction between the cell surface and the surface of interest [29, 36].
In irreversible attachment, microorganisms start to excrete a mixture of polysaccharides,
proteins, lipids and nucleic acids, which protect them from environmental conditions and promote
surface attachment [29, 36]. This is called extracellular polymeric substance (EPS). Once
microorganisms are completely and irreversibly linked to the surface, micro-colonies start to form [36].
The third stage, maturation, is characterized by higher replication rates of microorganisms. In
this stage the EPS allows bacteria adhesion by providing structural stability and protection to biofilm
[28, 29]. Once mature, biofilm shape resembles a tower or a mushroom, with approximately 50µm
thickness [37].
After maturation, bacteria suffer dispersion originating new biofilms [29]. The biofilm reaches
critical mass and starts to generate more planktonic organisms that will colonize other surfaces,
starting a new cycle. This final phase is known as dispersion [29, 36].
Due to its organized form as biofilm, bacteria are difficult to eliminate with current
decontamination practices, being highly resistant to antibiotics. They have characteristic properties as
drug tolerance and resistance to phagocytosis. Also, the extracellular matrix produced by bacteria
limits antibiotic diffusion within the biofilm structure [27].
Although biofilm are a threat for public health, in some cases the bacterial adhesion to a
surface could be desirable and advantageous. For example, biofilm existent within bioreactor used for
fermented food production or residual water treatment to remove inorganic and organic matter either
under aerobic or anaerobic conditions. Biofilms could also be used in water purification process [9].

8
1.1.3 Biofilms and healthcare-associated infections
Biofilms are the major cause of HAIs. Among these infections are urinary tract infections,
pneumonia, bloodstream infection or endocarditis due, for example, to biofilm grown on medical
devices [37].
Urinary tract infections are the most frequent HAIs (25-40% of cases) being caused by
bacterial invasion on genitourinary tract [38, 39]. These infections increase with use of catheters or
urethral devices, where bacteria are able to form biofilm. Catheters and urethral devices are usually
made of silicon or latex, frequently colonized by Gram-negative bacteria, e.g, K. pneumoniae [39, 40].
Bacteria can also colonize ventilator tubes, being the main cause of nosocomial pneumonia
which occurs in 10 to 20% of ventilated patients [41]. Pneumonia and respiratory infections, occurs
due to bacteria colonization on lower respiratory tract [42, 43, 44].
Vascular catheter related bloodstream infection and endocarditis are the other two most
prevalent HAI. Bloodstream infection is most related to K. pneumoniae, E.Coli and P.aeruginosa
colonization of intravenous catheters, while endocarditis is due to mechanical heart valves
colonization, surrounding heart tissues [4, 40, 41, 45].
As discussed, HAIs are caused by the colonization of medical devices. These infections result
from interaction of bacteria, devices and host factors. Bacteria are the most important factor due to the
variety of existent bacteria strains with different adherence properties. Device factors contribute to
increase susceptibility of a medical device to biofilm formation, and the most important device factor is
the material. Studies have shown that different bacteria adhere differently to different materials and
the same bacteria adhere differently to different materials. This suggests that device material can alter
bacteria adhesion, but cannot inhibit it. Host factors can be important for the duration of medical
device use inside the patient, since longer duration of use can enhance bacteria adhesion [40, 45].
Figure 5 – Temporal evolution of biofilm. The different phases of biofilm assembly: (1) reversible attachment, (2) irreversible attachment, (3,4) mature biofilm assembly and (5) dispersion are represented. Adapted from Monroe, 2007 [33].
9
10 10 10 13 13 14
15 16 15 16 18 18 19 19 19 20
21 21 22 23 22 24 25
28 28 30 30
34
39
0
5
10
15
20
25
30
35
40
45
2000 2010 Defined daily dose, per 1000 people per day
Biofilms can also be related to other diseases that are not acquired as a result of patient’s
hospitalization. Gingivitis, caries, periodontitis, otitis or infection on chronic wounds are examples of
these infections [37, 39, 46, 47, 48]. Infections of prosthetic joints can also occur, by colonization of
stainless steel or titanium orthopedic screws [49].
1.1.4 Antibiotics – A retrospective
For many years the relation between microorganisms and disease was known. High rates of
mortality reached during twentieth century, lead scientists to study and discover antimicrobial agents
[50].
In 1928 penicillin has been described as the first antibiotic. Alexander Fleming discovered that
a fungus producer of penicillin could inhibit Staphylococcus aureus growth, and in 1941, penicillin was
isolated from cultures of Penicilliun notatum [11, 16, 50, 51]. The Second World War brought a great
need of healing. By this time penicillin was produced in the United States of America, and Penicillinum
chrysogemum mutants began to be used for this purpose [50, 51].
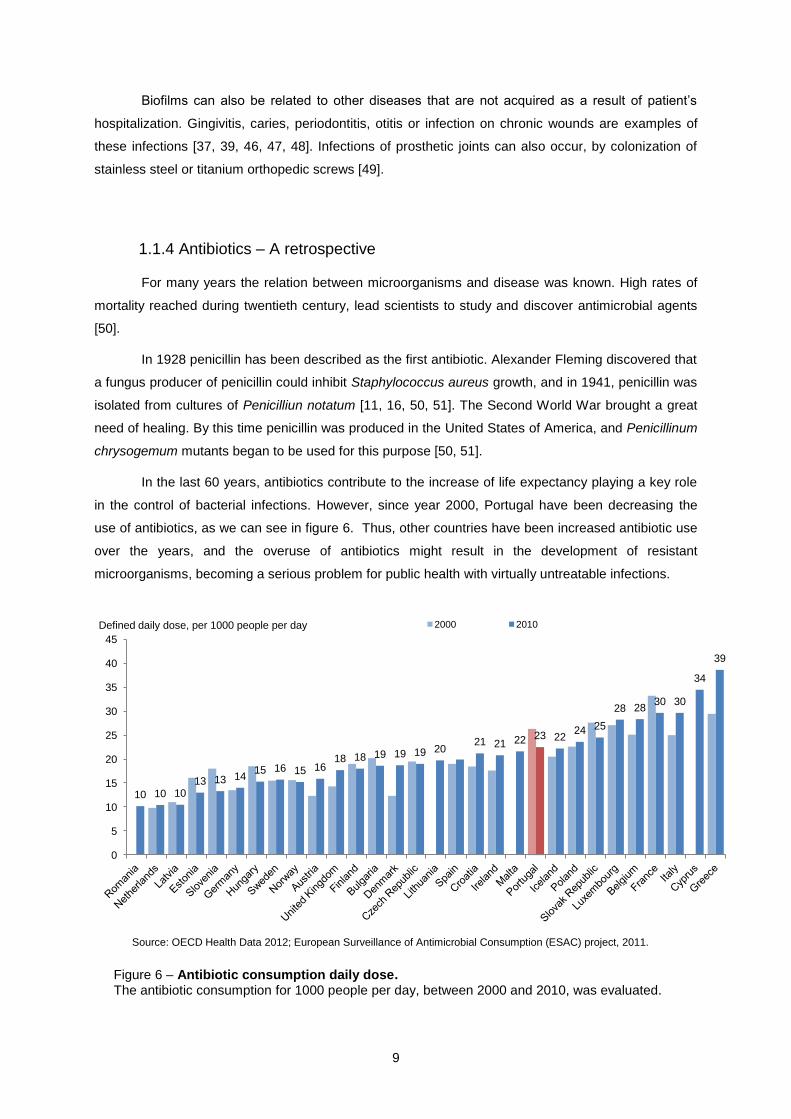
In the last 60 years, antibiotics contribute to the increase of life expectancy playing a key role
in the control of bacterial infections. However, since year 2000, Portugal have been decreasing the
use of antibiotics, as we can see in figure 6. Thus, other countries have been increased antibiotic use
over the years, and the overuse of antibiotics might result in the development of resistant
microorganisms, becoming a serious problem for public health with virtually untreatable infections.
Source: OECD Health Data 2012; European Surveillance of Antimicrobial Consumption (ESAC) project, 2011.
There are many types of antibiotics, from different families with different mechanisms and
Figure 6 – Antibiotic consumption daily dose. The antibiotic consumption for 1000 people per day, between 2000 and 2010, was evaluated.
10
There are many types of antibiotics, from different families with different mechanisms and
targets of action (Table 2). Antibiotics are natural products or chemical compounds that can inhibit
bacterial growth. Natural antibiotics are bacteria or fungi self-produced and block cell processes, in
other bacterial, that are essential to bacterial growth, e.g penincillin. Chemical antibiotics are targeted
to bacteria cells, blocking vital cell mechanisms as cell replication, inhibiting bacterial growth [52].
In this study, four antibiotics belonging to different groups were used. The first antibiotic used
was amoxicillin, that is a beta-lactam antibiotic of penicillin family. Beta-lactam antibiotics have
bacterial cell specificity, inhibiting cell wall synthesis [53]. However, the continuous use of this type of
antibiotics triggered to the development of evasion strategies by bacteria. Many bacteria strains
produce beta-lactamase enzymes that can inhibit antibiotic action [50].
The second antibiotic used was fosfomycin, a broad-spectrum bactericidal antibiotic which
inhibits both Gram-negative and Gram-positive cell wall synthesis. Fosfomycin mechanism of action is
related to inhibition of peptidoglycan synthesis, blocking MurA enzyme being used mostly for urinary
tract infections [54].
Gentamicin and vancomycin are members of aminoglycosides and glycopeptides family,
respectively. Gentamicin is used against Gram-negative bacteria. This antibiotic inhibits protein
synthesis by binding to bacterial ribosomal subunit leading to inhibition of RNA production.
Vancomycin is active against Gram-positive bacteria and inhibits cell wall synthesis [55, 56].
Table 2 – Groups of antibiotics and their target of action.
Adapted from Levy et al, 2004 [53].
1.1.5 Bacterial resistance to antibiotics
Infections can be difficult to treat due to bacterial resistance to antibiotics, and antibiotic use
can promote spread of resistant bacteria [16].
Antibiotic may fail to penetrate trough biofilm, due to the extracelluar matrix that limit the
transport of antimicrobial agents [57, 58]. However, it has been shown that biofilm matrix is not the

11
only reason of bacterial resistance, and there are other factors involved in bacterial survival [59].
Some bacteria could be intrinsically resistant to specific antibiotics and the majority acquired
resistance, being able to inactivate or exclude antibiotics [16].
Bacteria within biofilm have created mechanisms for antimicrobial action by mutations.
Mutation frequency of bacteria organized in biofilm is higher than planktonic bacteria, occurring
horizontal gene transmission [35]. Mutation can modify antibiotic target, promote efflux pumps and
produce enzymes, contributing to biofilm-growing bacteria resistant to antibiotics [11, 37, 52, 60, 61].
Enzymatic inhibition is a mechanism that inactivates various antibiotics, as β-lactam
antibiotics, for example [52]. Bacteria self-produce enzymes recognize antibiotics and change their
functional characteristics so that they cannot establish relation with bacterial targets [11, 60]. For
example, resistance to β-lactam antibiotics occurs by mutation of β-lactamase genes [37].
Antibiotic target modification occurs by mutation of targets or through enzymes that can modify
those targets. Efflux pumps activity, due to mutations, allows antibiotic excretion from the cell by
membrane proteins, being one major resistance mechanism against fluoroquinolones, for example
[11, 60].
Bacteria can communicate by quorum-sensing (QS) molecules that activate genes producers
of enzymes when bacteria sense that they are in a limited space at maximum concentration. Quorum-
sensing molecules can regulate the production of virulence factors, protecting bacteria against
phagocytes and influencing the development of biofilm. To inhibit QS action, quorum-sensing
inhibitors (QSIs) have been synthesized and their structure has been modified. The QSIs resistance
occurs due to mutations that are responsible for decreasing number of QS molecules in bacteria,
preventing production of virulence factors by bacteria [37].
Mature biofilm developed different resistance mechanisms schematically presented in figure 7.
Antibiotic may penetrate slowly through biofilm or may not penetrate at all. The antibiotic may be
deactivated in the first layers of biofilm quicker than it diffuses. Another mechanism is the alteration of
microenvironment within biofilm due to oxygen or pH levels. Studies have revealed that at biofim
surface the oxygen level is higher than in the centre. This creates anaerobic condition at biofilm
centre, which leads to slow growth and consequent reduced susceptibility to antibiotics [37]. The third
mechanism is related to differentiation of subpopulations into a phenotypic state, obtaining resistance
without genetic modification of the cell. Phenotypic switching between phenotypic states promotes
variation in colony morphology which can change virulence and enhance antimicrobial resistance [62,
63, 64].
To avoid increase resistance of bacteria, there should be a prudent use of antibiotics avoiding
overuse and inappropriate use. The use of vaccines against bacteria should be increased in order to
prevent both infections and need for antibiotics. Infection control pass through a simple hand-wash to
use of biomedical devices that inhibit bacteria growth or coating devices, e.g., catheters, with
antibacterial agents. Antibiotic delivery system allows a direct application on infected area could be
enough to kill resistance bacteria [16].

12
1.2 Electron microscopy techniques applied to biofilm study
Electron microscopy is a scientific area that uses a beam of electrons to examine samples
with high resolution. The electron microscopes and associated techniques provide information about
topography, morphology, chemical composition and/or crystallography of the samples. In electron
microscopy a beam of electrons interacts with the samples and the resulting signal is used to form an
image. These techniques offer optimal resolution into the biofilm ultrastructure [29, 65].
Scanning Electron Microscopy (SEM) allows visualization of the morphology of bacteria
attached to a surface, in a three-dimensional appearance [29, 36]. This technique has also been used
on cross-sections to analyze biofilm internal structure, and SEM studies proved that bacteria
organized in biofilm are inside a dense extracellular matrix [36].
During the 1980s, SEM has been used to show bacteria inside biofilm and the relation
between the formed biofilm and the surface were it is attached [36].
Figure 7 – Biofilm resistance to antibiotics: proposed mechanisms. From Stewart, et al, 2001 [62].

13
SEM requires a careful preparation of samples as operates in vacuum conditions and
demands conductive properties. Sample preparation steps as fixation, dehydration, drying and coating
are necessary for visualization of biological samples. Fixation is the stabilization of biological material
and it is a chemical fixation. Dehydration is the substitution of water present in the sample with a
graded solvent (ethanol or acetone) to prevent water to interfere with the vacuum required by SEM.
Drying allows removal of humidity from the sample. Coating is the covering of sample with a
conductive layer to prevent charging effects during the image formation [29, 66].
The advantages of SEM are higher resolution of visualization of biofilm than other techniques,
and ability to measure in a three-dimensional [36, 67]. However there are few disadvantages too, as
the use of graded solvents (ethanol) to dehydrate the specimen, which can alter biofilm structure and
the time-consuming sample preparation [36].
1.3 Thesis main goal
The occurrence of healthcare-associated infections has been demonstrated, over the years,
as significant cause of morbidity and death among hospitalized patients. Healthcare-associated
infections are caused by etiological agents, and bacteria are the most common. Bacteria organized in
biofilm have the ability to become resistant to antibiotic action.
The thesis main goal is to evaluate the influence of biofilm assembly on microorganism’s
virulence, in order to reduce incidence of HAIs. In addition, the ability of microorganisms to form
biofilm in hospitalar surfaces will be evaluated aiming to establish a link between bacterial virulence,
antibiotic resistance and biofilm assembly.

14
Chapter 2
Materials and methods

15
2.1 Biological samples
2.1.1 Bacterial strains
Three reference bacteria strains and four clinical strains were evaluated in this study.
Reference strains are M. smegmatis mc2155, M. fortuitum ATCC 6841 and M. chelonae ATCC 35752.
Clinical strains are M. fortuitum 747/08, isolated from sputum, K. pneumoniae 2948 and K.
pneumoniae 703;O:1, both isolated from urine and K. pneumoniae 45 isolated from colonization
studies (neck swab).
All strains were grown either using Mueller-Hinton broth or Mueller-Hinton agar. Klebsiella
pneumoniae were incubated overnight and mycobacteria were incubated for 72 hours at 37ºC.
2.1.2 HeLa cells
Adhesion analysis of bacteria to human cells (biotic surface) was performed using HeLa cells.
Cells were culture in DMEM (Lonza) supplemented with 10% heat inactivated fetal calf serum (Difco),
1% glutamine (Difco), 1% non essential aminoacids (Difco), 10,000 IU of penicillin (Difco), 10 g
streptomycin (Difco) and incubated for 2 days at 37ºC with 5% CO2.
2.2 Bacteria susceptibility to antibiotics
The antimicrobial activity of amoxicillin (BioRad), fosfomycin (BioRad), gentamicin (Gibco) and
vancomycin (BioRad) was evaluated by the microdilution method. Briefly, antibiotics were diluted in
Mueller-Hinton broth to produce a two-fold dilution in the concentrations range of 10000 – 0.0048
µg/mL for amoxicillin, 500 – 0.244 µg/mL for fosfomycin, 12500 – 0.191 µg/mL for gentamicin and
1000 – 0.244 µg/mL for vancomycin. A positive control containing a suspension of bacteria in Mueller-
Hinton broth without antibiotics was performed in parallel. The MIC was defined as the lowest
concentration of antibiotic resulting in the absence of turbidity after over-night incubation at 37ºC.
The minimum inhibitory concentration for biofilm was performed using the same antibiotics
and concentrations range. After removing the non-adherent bacteria the antibiotic solutions were
added, the attached bacteria were sonicated in a water table sonicator for 5 minutes and incubated
over-night at 37ºC.
2.3 Bacteria generation time
All bacteria were grown in Mueller-Hinton broth being harvested after different incubation
times. Klebsiella pneumoniae strains were harvested after 2, 4, 6, 10, 24 and 48 hours.
Nontuberculous mycobacteria were harvested after 4, 8, 24, 48, 72 and 120 hours. At each
16
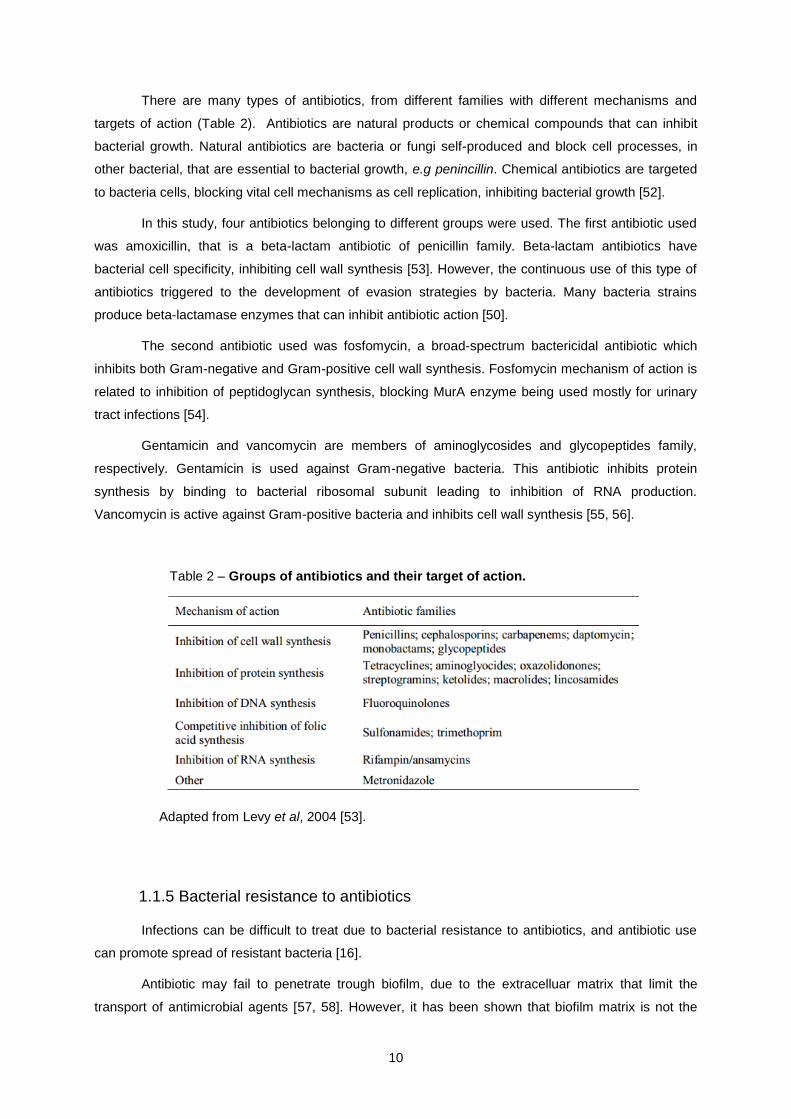
harvesting time bacterial optical density (OD) at 600 nm was determined in a spectrophotometer
(SpectraMax 340PC). A schematic drawing of the assay is shown in figure 8.
The OD values obtained were converted into bacteria concentration using the following conversion factor [68]:
Example:
For K. pneumoniae 45, at 24 hours of incubation, OD = 1.0612.
Figure 8– Optical density measurement in a 96-well cell culture plate, for evaluated strains. 200 µL of MH broth was deposited, in first well, for reference. 200 µL of K. pneumoniae 45 suspension was deposited in second and third well, each. 200 µL of K. pneumoniae 703;O:1 suspension was deposited in fourth and fifth well, each. 200 µL of K. pneumoniae 2948 suspension was deposited in sixth and seventh well, each (A). 200µL of MH broth was deposited, in first well, for reference. 200 µL of M. smegmatis suspension was deposited in second and third well, each. 200 µL of M. fortuitum suspension was deposited in fourth and fifth well, each. 200 µL of M. chelonae suspension was deposited in sixth and seventh well, each (B).

17
For K. pneumoniae 45, at 12 hours incubation, the total number of bacteria was 5 305 875.000.
Deduction of the generation time (G) formula is as follows [69]:
Mathematical growth expression (Equation 1):
Logarithmic transformation (Equation 2):
Solving for n (Equation 3):
Generation time (G) is equal to time (t) dividing for number of generations (n),
Replacing n in Equation 3:
, initial number of bacteria;
, number of bacteria after n generations:
, number of generations;
, time in minutes.
Bacteria generation time were calculated trough Equation 4 being expressed in hours.
(1)
(2)
(3)
(4)

18
2.4 Quantification of biofilm formation
The assay was performed in triplicate using 96-well flat-bottomed cell culture plates (Nunc)
as described previously with small modifications [70]. Briefly, microorganism suspensions with a final
concentration of 107 bacteria per milliliter were prepared in 0.9% sodium chloride and tenfold diluted in
Mueller-Hinton broth (Difco). Two-hundred microliters of the bacterial suspension were distributed by
each well being Mueller-Hinton broth used as negative control. The plates were incubated at 37ºC to
allow biofilm formation for different time periods. Then, the content of each well was aspirated, and
each well was vigorously washed three times with sterile distilled water to remove non-adherent
bacteria. The attached bacteria were then stained for 15 minutes with 100 l violet crystal at room
temperature, washed with distilled water three times to remove dye in excess and allowed to dry at
room temperature. The violet crystal was dissolved in 100 l of 95% ethanol (Merck) and the optical
density at 570 nm was read using a (SpectraMax 340PC).
2.5 Biofilm assembly on abiotic surfaces
Bacteria were allowed to assemble biofilm for different time periods on different surfaces. In all
cases the incubation was performed at 37ºC in Mueller-Hinton broth.
Biofilm forming ability on abiotic surfaces was evaluated by microtiter-plate test [71]. Assembly
was firstly performed on a chosen model, a 6-well flat-bottomed sterile cell culture plate (Nunc), and
then on surfaces that mimic those present in healthcare units (silicon and stainless steel).
2.5.1 Cell culture plate
Assembly on cell culture plate was performed (Figure 9) for all K. pneumoniae strains for 4, 12
and 24 hours of biofilm maturation. For NTM was performed for 1, 3 and 5 days of maturation. Culture
area was 9.6 cm2.

19
2.5.2 Silicon
Assembly on silicon was performed for all K. pneumoniae strains for 4, 12 and 24 hours of
biofilm maturation. For NTM was performed for 1, 3 and 5 days of maturation.
Silicon discs (Sigma) were used (Figure 10) and placed in to wells. Silicon had dimensions of
0.75 mm in diameter and 20 mm in thickness.
Biofilm assembly on silicon is shown in figure 11.
Figure 9 – Outline of cell culture plate assembly for one K. pneumoniae strain. Assembly was assessed for all K. pneumoniae strains for 4, 12 and 24 hours, and bacteria attached to the bottom of cell culture plate.
Figure 10 – Silicon discs used in biofilm assembly on silicon.

20
2.5.3 Stainless steel
Assembly on stainless steel was performed for all K. pneumoniae strains for 12 hours of
biofilm maturation.
Stainless steel plates were placed below a silicone made insert (Sarstedt flexiPERM), in order
to subdivide the plate into 8 cultivation units (Figure 12) of 0.4 cm2.
Biofilm assembly in stainless steel is shown in figure 13.
Figure 11 – Outline of silicon assembly, for one K. pneumoniae strain. Assembly was performed for all K. pneumoniae strains for 4, 12 and 24 hours. Bacteria attached both plate and silicon disc.
Figure 12 – Schematic representation of stainless steel plate and flexiPERM. Stainless stain plate was subdivided in 8 cultivation units of 0.4 cm
2 each.

21
2.6 Adherence assay on biotic surface
Adhesion assay was performed in a 24-well culture plate, being seeded 104 cells per well,
prior to K. pneumoniae infection.
Bacteria were prepared from frozen stocks, incubating them for 18 hours at 37ºC. Then
bacteria were diluted (1:100) and incubated at 37ºC for 24 hours. Cultures density was determined by
OD measurement, at 600 nm (SpectraMax 340 PC) and viable bacteria were quantified by CFU –
colony forming unit.
Layers of HeLa cells were rinsed twice with 1mL of DMEM. Bacteria were harvested and
rinsed twice with PBS and resuspended in DMEM with 2% D-mannose (Difco) without antibiotics.
Then 0.1 mL of this suspension was added per well and bacteria were allowed to adhere at 37ºC and
in 5% CO2 atmosphere for 4, 8 or 24 hours. Wells without cells were prepared in the same manner to
control bacterial adhesion to plastic.
After the specified incubation times the wells were rinsed three times with 1mL of PBS.
Adherent bacteria were released by adding 0.2 mL of 0.5% Triton X-100 (Sigma) for 5 to 10minutes.
Saline solution was added to each sample which was further diluted and plated in LB media. Adherent
bacteria were quantified by CFU enumeration. Bacterial adhesion to cells was determined by total
CFU number minus CFU number of bacteria adherent to well without cells. In figure 14 is shown the
outline of the bacterial adhesion to cells assay.
For optical microscopy analysis, assay was performed as described above, except that HeLa
cells were seeded on glass coverslips. Cells were fixed with iced cooled methanol for 10 minutes and
stained with 20% Giemsa. Then samples were mounted and examined under an optical microscope
(Zeiss) with 100x objective and 10x ocular lenses.
Figure 13 – Outline of stainless steel biofilm assembly. In first two cultivation units K. pneumoniae 45 was seeded, and K. pneumoniae 703;O:1 and K. pneumoniae 2948, on the other cultivation units, respectively.
22
2.7 Zeta potential assay
Klebsiella pneumoniae and all NTM were evaluated in this assay. A homogenous suspension
of each bacteria were prepared in 0.9% sodium chloride solution and centrifuged at 2000 rpm for 10
minutes (Megafuge 1.0 Heraeus Instruments). The supernatant was discarded and the bacterial
pellets were fixed with 4% PFA for 15 minutes at room temperature. Bacteria were washed with PBS
and harvested by centrifugation at 2000 rpm for 10 minutes. The pellets were resuspended in PBS
being the OD600nm determined as described in figure 8. Bacterial suspensions were then further
processed in order to obtain a final OD600nm of 0.4.
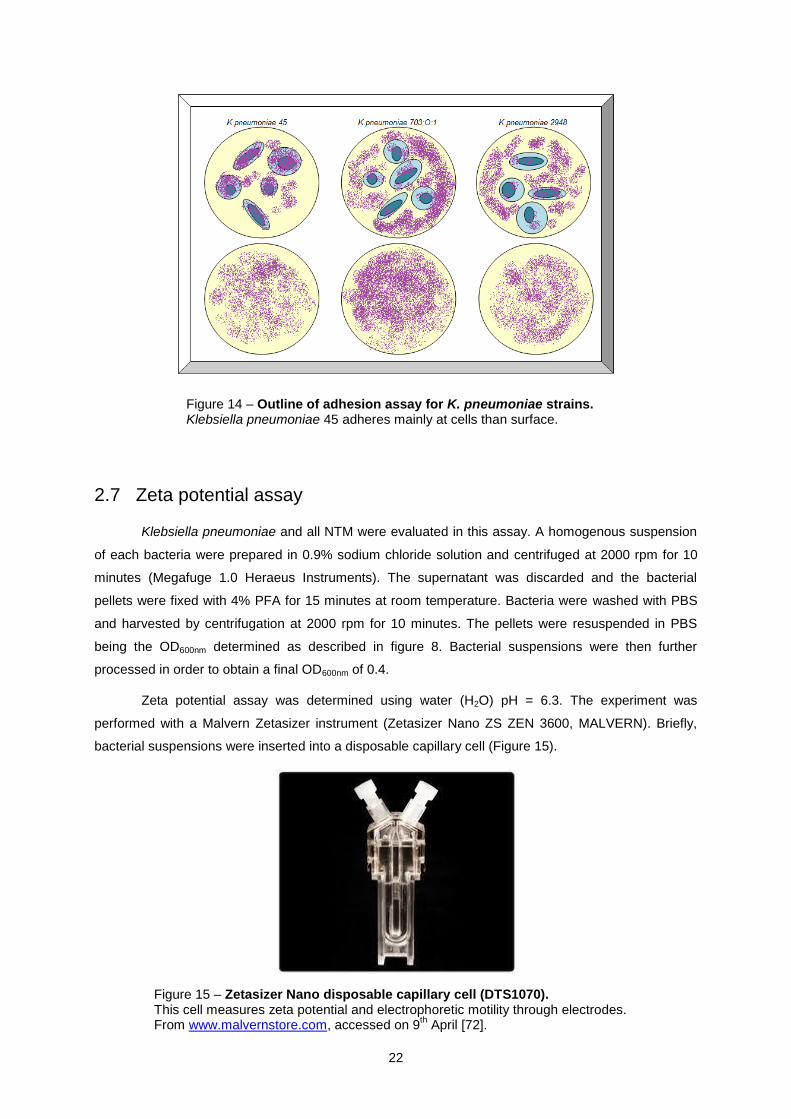
Zeta potential assay was determined using water (H2O) pH = 6.3. The experiment was
performed with a Malvern Zetasizer instrument (Zetasizer Nano ZS ZEN 3600, MALVERN). Briefly,
bacterial suspensions were inserted into a disposable capillary cell (Figure 15).
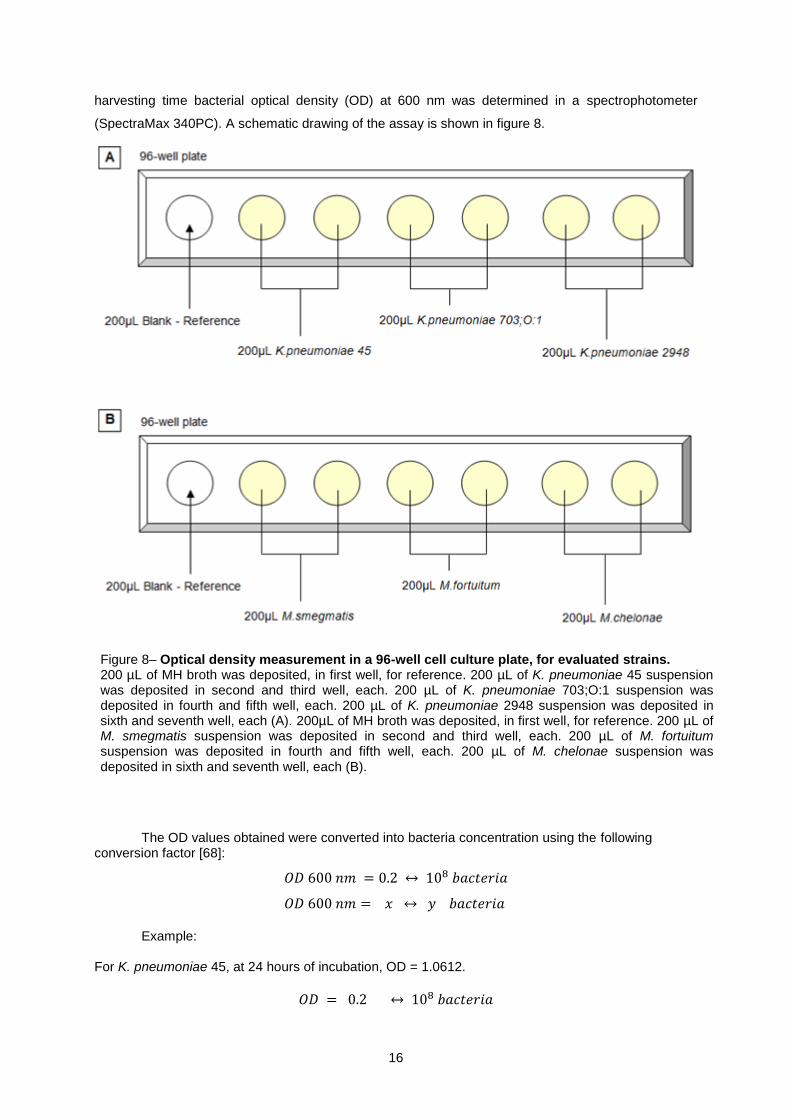
Figure 14 – Outline of adhesion assay for K. pneumoniae strains. Klebsiella pneumoniae 45 adheres mainly at cells than surface.
Figure 15 – Zetasizer Nano disposable capillary cell (DTS1070). This cell measures zeta potential and electrophoretic motility through electrodes. From www.malvernstore.com, accessed on 9
th April [72].
23
2.8 Sliding motility assay
Nontuberculous mycobacteria strains were grown in M63 salts medium supplemented with
1mM magnesium chloride, 0.2% glucose, 0.5% casamino acids, ferrous chloride (10µM) and a
micronutrient solution. M63 medium was solidified with either 0.17% or 0.3% agar (Difco). Twenty-five
millilitres of sterile medium (65ºC) was dispensed per plate. Plates were allowed to remain at room
temperature overnight and then were inoculated from colonies by poking with toothpick. The plates
were sealed with parafilm and incubated at 37ºC, for 3 days. Bacterial spreading was then evaluated.
2.9 Scanning electron microscopy analysis
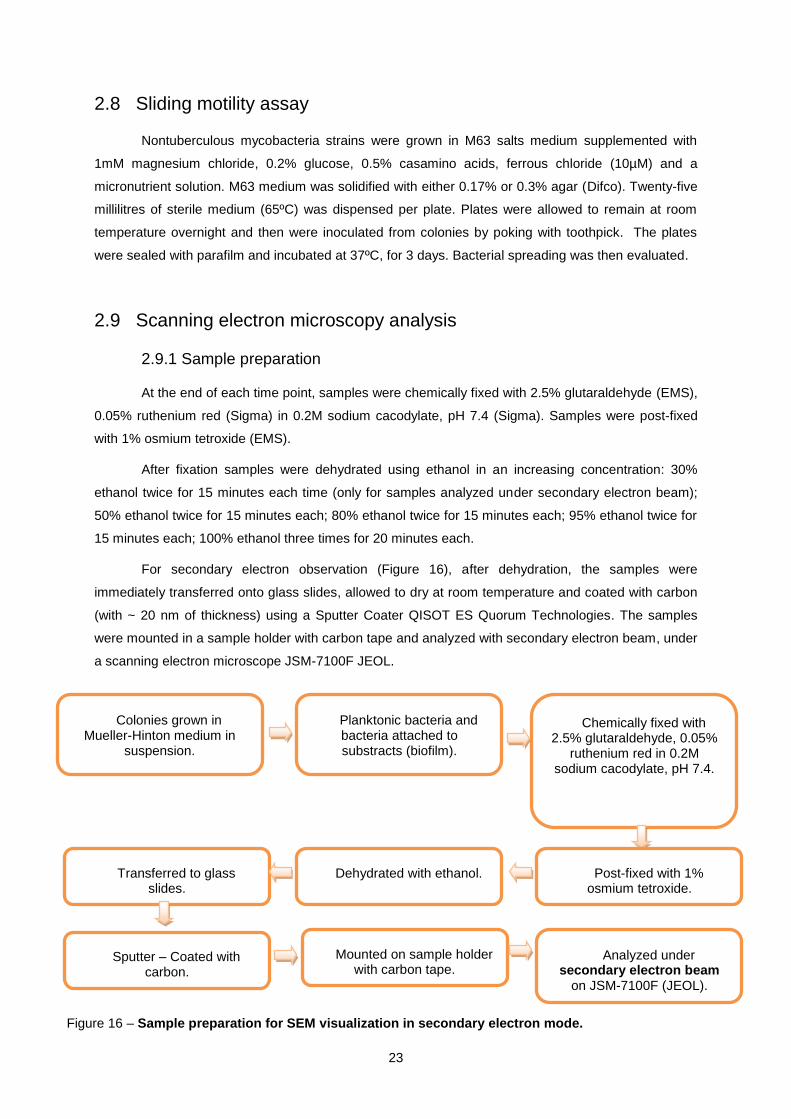
2.9.1 Sample preparation
At the end of each time point, samples were chemically fixed with 2.5% glutaraldehyde (EMS),
0.05% ruthenium red (Sigma) in 0.2M sodium cacodylate, pH 7.4 (Sigma). Samples were post-fixed
with 1% osmium tetroxide (EMS).
After fixation samples were dehydrated using ethanol in an increasing concentration: 30%
ethanol twice for 15 minutes each time (only for samples analyzed under secondary electron beam);
50% ethanol twice for 15 minutes each; 80% ethanol twice for 15 minutes each; 95% ethanol twice for
15 minutes each; 100% ethanol three times for 20 minutes each.
For secondary electron observation (Figure 16), after dehydration, the samples were
immediately transferred onto glass slides, allowed to dry at room temperature and coated with carbon
(with ~ 20 nm of thickness) using a Sputter Coater QISOT ES Quorum Technologies. The samples
were mounted in a sample holder with carbon tape and analyzed with secondary electron beam, under
a scanning electron microscope JSM-7100F JEOL.
Colonies grown in Mueller-Hinton medium in
suspension.
Planktonic bacteria and bacteria attached to substracts (biofilm).
Chemically fixed with 2.5% glutaraldehyde, 0.05%
ruthenium red in 0.2M sodium cacodylate, pH 7.4.
Dehydrated with ethanol. Transferred to glass slides.
Mounted on sample holder with carbon tape.
Sputter – Coated with carbon.
Analyzed under secondary electron beam
on JSM-7100F (JEOL).
Post-fixed with 1% osmium tetroxide.
Figure 16 – Sample preparation for SEM visualization in secondary electron mode.

24
For backscattered electron (BS) analysis (Figure 17) samples were further embedded in
Epon812 epoxy resin (EMS), i.e, incubated in propylenoxide (Merck) twice for 15 minutes,
propyleneoxide : epon resin (2:1) for 30 minutes, propyleneoxide : epon resin (1:1) for 30 minutes and
left over night in 100% epon resin. Two additional incubations in 100% epon resin for 2 hours were
performed before samples were allowed to polymerize at 65º for 3 days.
Once polymerized the blocks were trimmed and sectioned using an ultramicrotone (Leica).
Thin sections were transferred to coverslips coated with 0.5% (m/v) gelatin and 0.05% (m/v) chromium
potassium sulfate dodecahydrate (Panreac) and allowed to dry at room temperature. The sections
were contrasted with saturated uranyl acetate in water, for 30 minutes, followed by Reynolds lead
citrate for 3 minutes. Then the coverslips were transferred to glass slides and samples were coated
and mounted as described above for secondary electron beam samples. Samples were analyzed with
backscattered electron beam under a scanning electron microscope JSM-7100F JEOL.
An alternative procedure was adopted for biofilms assembled on silicon disks. These samples
instead of being sectioned as described above were prepared as metallographic samples, by grinding
and polishing. Grinding was performed using a 600, 800, 1200 and 2400 grit SiC paper. Polishing was
performed with diamond particles 6, 3 and 1 microns in diameter. Samples were cleaned with 70%
ethanol and dried with hot air. Both grinding and polishing were performed on a polisher at 150 rpm.
Post-fixed with 1% osmium tetroxide.
Colonies grown in Mueller-Hinton broth.
Planktonic bacteria and bacteria attached to substracts (biofilm).
Chemically fixed with 2.5% glutaraldehyde, 0.05%
ruthenium red in 0.2M sodium cacodylate, pH 7.4.
Dehydrated with ethanol. Embedded in Epon812 epoxy resin (EMS).
Thin sections were cut and transferred to coated
cover slips.
Mounted in sample holder with carbon tape.
Sputter – Coated with carbon.
Analyzed under backscattered electron
beam on JSM-7100F (JEOL).
Figure 17 – Sample preparation for SEM visualization in backscattered electron mode.
25
Samples were coated with carbon (20 nm) and mounted in a sample holder with carbon tape,
and analyzed under backscattered electron beam under an electron microscope JSM-7100F JEOL.
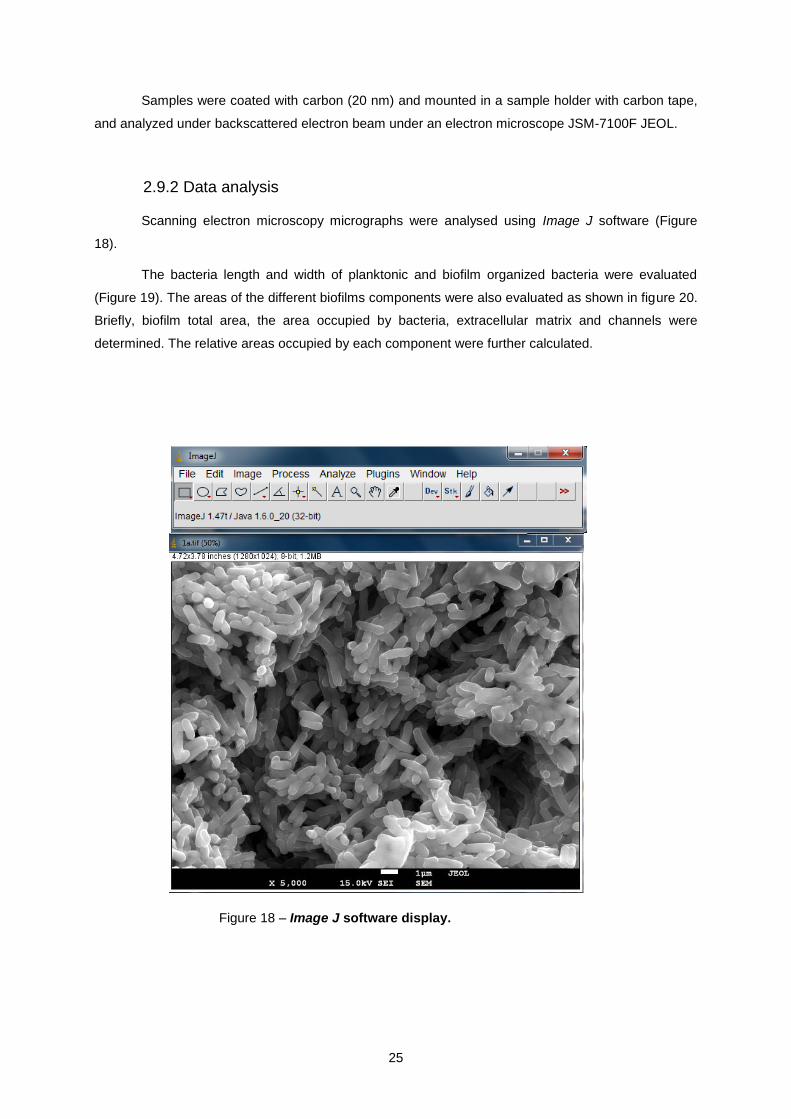
2.9.2 Data analysis
Scanning electron microscopy micrographs were analysed using Image J software (Figure
18).
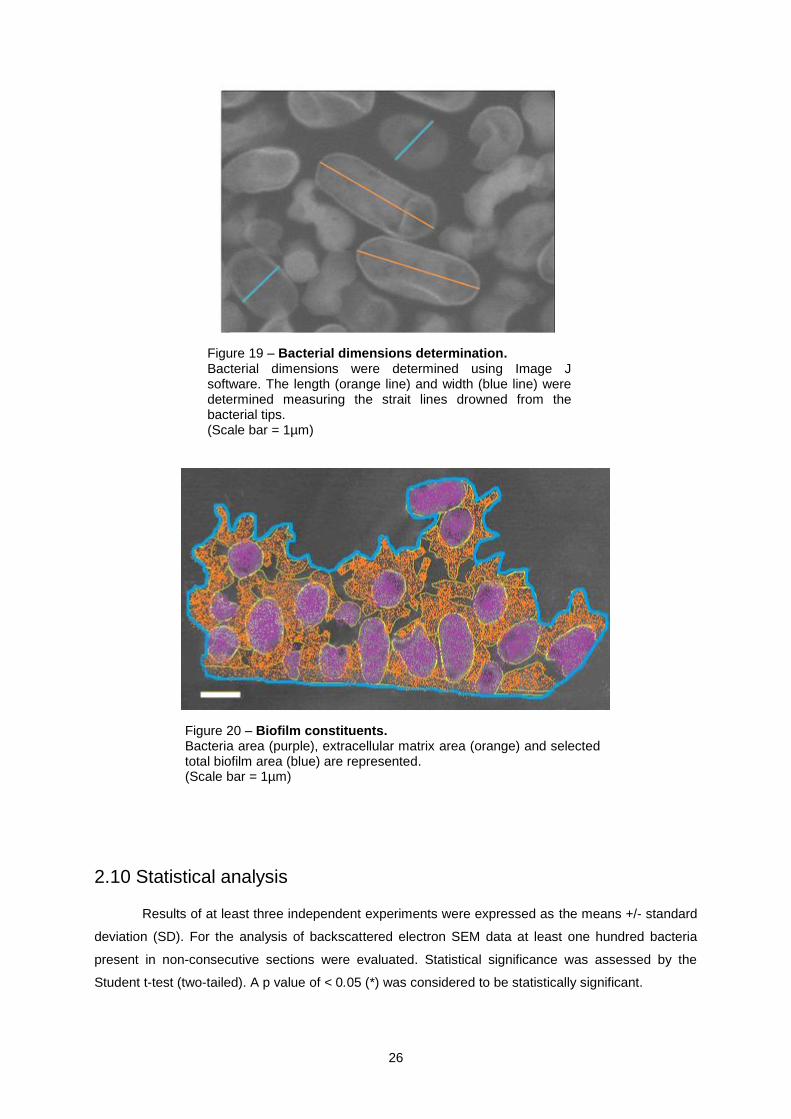
The bacteria length and width of planktonic and biofilm organized bacteria were evaluated
(Figure 19). The areas of the different biofilms components were also evaluated as shown in figure 20.
Briefly, biofilm total area, the area occupied by bacteria, extracellular matrix and channels were
determined. The relative areas occupied by each component were further calculated.
Figure 18 – Image J software display.
26
2.10 Statistical analysis
Results of at least three independent experiments were expressed as the means +/- standard
deviation (SD). For the analysis of backscattered electron SEM data at least one hundred bacteria
present in non-consecutive sections were evaluated. Statistical significance was assessed by the
Student t-test (two-tailed). A p value of < 0.05 (*) was considered to be statistically significant.
Figure 20 – Biofilm constituents. Bacteria area (purple), extracellular matrix area (orange) and selected total biofilm area (blue) are represented. (Scale bar = 1µm)
Figure 19 – Bacterial dimensions determination. Bacterial dimensions were determined using Image J software. The length (orange line) and width (blue line) were determined measuring the strait lines drowned from the bacterial tips. (Scale bar = 1µm)

27
Chapter 3
Results and discussion

28
3.1 Gram-negative bacteria - Klebsiella pneumoniae
3.1.1 Planktonic bacteria and generation time
In this work three strains of K. pneumoniae were studied. Two of them are capsulated (K.
pneumoniae 45 and K. pneumoniae 2948) and the other one is uncapsulated (K. pneumoniae
703;O:1). First structural features of bacteria were evaluated by SEM. Micrographs of planktonic
bacteria were obtained by backscattered electron beam, and a significant number of bacteria were
measured in length and width. The dimensions reported for K. pneumoniae strains in the literature are
approximately 2 µm in length and 0.5 µm in width [73]. The cell dimensions obtained for the three K.
pneumoniae are shown in table 3, being the data obtained in good agreement with the literature. This
fact shows that SEM in backscattered electron is a suitable technique to evaluate microorganisms
dimensions leading to results concordant to TEM analysis.
Table 3 – Klebsiella pneumoniae cell dimensions.
Bacteria
Cell Length (µm) Cell Width (µm)
Average SD Average SD
K. pneumoniae 45 1.88 0.186 0.713 0.050
K. pneumoniae 703;O:1 1.87 0.371 0.604 0.090
K. pneumoniae 2948 1.94 0.221 0.596 0.080
Klebsiella pneumoniae strains have similar lengths and widths, where K. pneumoniae 2948
has a more elongated shape with longest length and shortest width. Klebsiella pneumoniae 45 is more
round-shaped, having the biggest width. Standard deviation values are relative low, in a significant
number of measures, indicating low variance.
Next the growth profile and generation time of bacteria were evaluated. Generation time
depends on specimen and the time between two cell division is defined as a generation. As the
generation time decreases, the number of bacteria increases as well as its ability to colonize the host
[74].
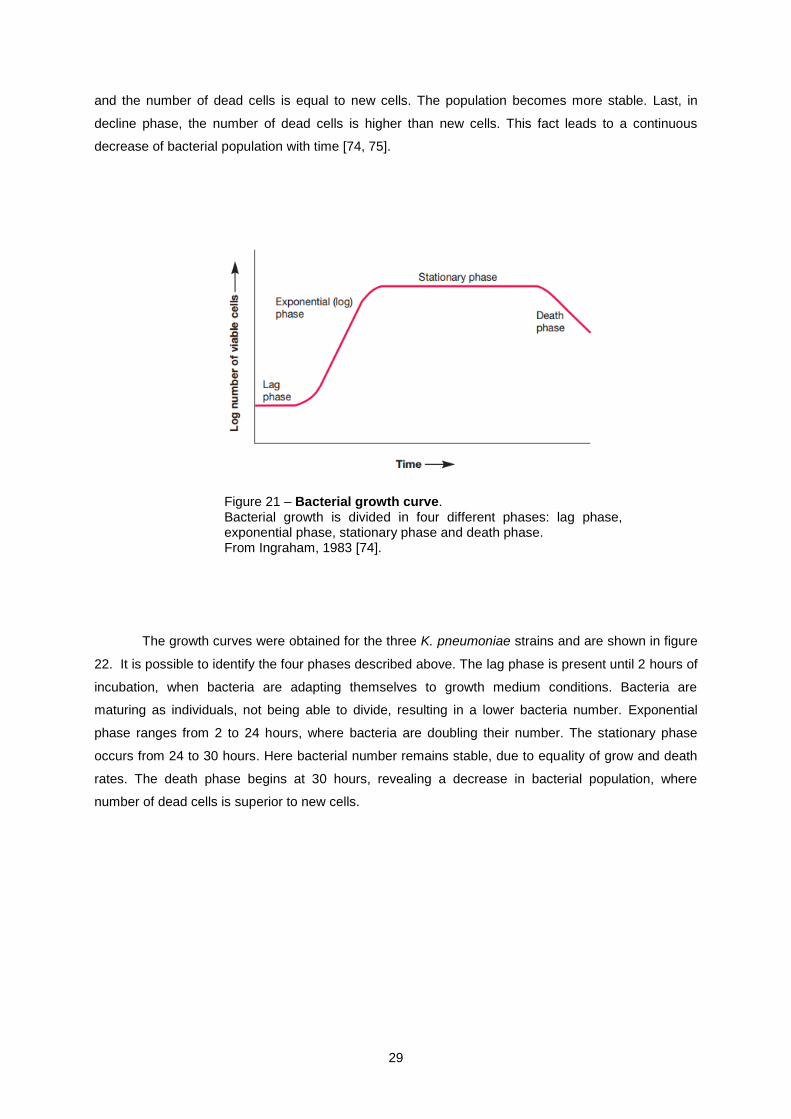
Bacterial population growth can be studied through growth curve of a bacteria culture (Figure
21). In a growth curve the four main phases can be identified: lag, exponential, stationary and death
phase. Lag phase occurs initially were few or no cells divide. The cells start dividing when DNA
replication starts. In exponential phase cells divide faster and this division can be influenced by cell
specimen and medium. The population doubles their number in certain intervals of time. At this stage
the bacterial population is more uniform and consistent. In stationary phase, growth rate decreases
29
and the number of dead cells is equal to new cells. The population becomes more stable. Last, in
decline phase, the number of dead cells is higher than new cells. This fact leads to a continuous
decrease of bacterial population with time [74, 75].
The growth curves were obtained for the three K. pneumoniae strains and are shown in figure
22. It is possible to identify the four phases described above. The lag phase is present until 2 hours of
incubation, when bacteria are adapting themselves to growth medium conditions. Bacteria are
maturing as individuals, not being able to divide, resulting in a lower bacteria number. Exponential
phase ranges from 2 to 24 hours, where bacteria are doubling their number. The stationary phase
occurs from 24 to 30 hours. Here bacterial number remains stable, due to equality of grow and death
rates. The death phase begins at 30 hours, revealing a decrease in bacterial population, where
number of dead cells is superior to new cells.
Figure 21 – Bacterial growth curve. Bacterial growth is divided in four different phases: lag phase, exponential phase, stationary phase and death phase. From Ingraham, 1983 [74].

30
The generation time was determined for planktonic K. pneumoniae strains for the different
phases of the growth curve. The results are shown in table 4.
Table 4 – Planktonic K. pneumoniae generation time.
Bacteria
Generation Time (h)
Lag phase Exponential phase Death phase
4 h 6h 10 h 24 h 48 h
K. pneumoniae 45 0.781 0.800 1.62 3.64 18.5
K. pneumoniae 703;O:1 2.48 1.00 1.60 3.52 7.20
K. pneumoniae 2948 1.32 0.900 1.70 3.54 7.40
Figure 22 – Klebsiella pneumoniae strains growth curves.
The four phases of bacterial growth: lag phase (orange), exponential phase (blue), stationary phase (green) and death phase (pink) were identified.

31
As the incubation time increases, bacteria generation time also increases, resulting in a slower
bacterial division. The data obtained support this statement if the early time of 2 hours is not taken into
account. At this point, there is a decrease in generation time between 2 and 4 hours, for K.
pneumoniae 703;O:1 and K. pneumoniae 2948. This can be explained by the fact that during lag
phase bacteria need to adapt to new growth conditions e.g. environment conditions [76].
Data analysis showed that bacteria had different adaptation profiles. Although K. pneumoniae
703;O:1 is the bacterium with highest generation time at early hours, it revealed to have shorter
generation time at 10, 24 and 48 hours. The adaptation of this bacterium is slower (smallest number of
bacteria); however, at a later stage it will overcome, revealing higher number of bacteria. Klebsiella
pneumoniae 45 is the bacterium with shortest generation time at early hours. As we already
discussed, as generation time become shorter, the number of bacteria increases. However, at later
hours (48 hours) this is the bacterium with longer generation time. This means that across time points,
this bacterium become less suitable to increase bacterial mass. However, as in the adaptation phase
was the bacterium that most increased their number, it will overcome the lower number of bacteria in
later hours. Klebsiella pneumoniae 2948 is standing between other two strains, being more stable
across time points.
3.1.2 Evaluation of K. pneumoniae susceptibility to antibiotics
Antibiotic efficacy against bacteria was evaluated by the minimum inhibitory concentration –
MIC. The MIC could be defined as the minimum concentration of a chemotherapeutical agent able to
inhibit bacterial growth [77]. This assay was performed for both planktonic and biofilm organized
bacteria since we want to evaluate the role played by biofilms in increased antibiotic resistance by K.
pneumoniae. It is known that bacteria organized in biofilm exhibit higher antibiotic tolerance than in
planktonic form. As consequence, MIC value for bacterial biofilm can be up to 1000 higher than for
their relative planktonic bacteria [46]. The data obtained in this assay is shown in table 5.
All antibiotics successfully inhibit bacterial growth, with bacteria organized in biofilm being
generically more resistant [77]. The changes in MIC values observed for planktonic and biofilm
organized varied with the antibiotic and the bacteria. The highest MIC within biofilm was registered for
amoxicillin independently of the K. pneumoniae strain. For gentamicin, K. pneumoniae 703;O:1 was
the bacterium with higher increase of MIC within biofilm. Studies have shown that K. pneumoniae
strains are usually resistant to amoxicillin and gentamicin, presenting reduced susceptibility [78, 79,
80]. Klebsiella pneumoniae 703;O:1 has the highest MIC increase relative to fosfomycin, being 1000-
fold increase compared to planktonic form. Vancomycin is used to treat infections caused by Gram
positive bacteria, and in this study it was used as negative control being the MICs determined only for
planktonic bacteria.
Altogether these data shows that biofilm assembly plays a role in the increasing resistance of
K. pneumoniae strains to antibiotics.

32
Table 5 – Minimal inhibitory concentrations for planktonic and biofilm K. pneumoniae.
MIC (planktonic K. pneumoniae)
Antibiotic
Bacteria
Amoxicillin
(g/ml)
Fosfomycin
(g/ml)
Gentamicin
(g/ml)
Vancomycin
(g/ml)
K. pneumoniae 45 250 0.781 3.05 500
K. pneumoniae 703;O:1 250 <0.488 0.760 500
K. pneumoniae 2948 >500 0.781 1.52 1000
MIC (K. pneumoniae biofilm)
Antibiotic
Bacteria
Amoxicillin
(g/ml)
Fosfomycin
(g/ml)
Gentamicin
(g/ml)
Vancomycin
(g/ml)
K. pneumoniae 45 >2500 0.781 24.4 ND
K. pneumoniae 703;O:1 >2500 500 195 ND
K. pneumoniae 2948 2500 0.781 3.05 ND
3.1.3 Biofilm assembly on cell culture plate
In order to establish a link between increased bacterial antibiotic resistance and biofilms,
bacteria ability to assemble biofilms was evaluated. Biofilm assembly ability was first evaluated on a
model surface. Cell culture plates were chosen as a model because plastic surfaces are suitable for
bacterial attachment, due to its hydrophobic nature with little or no surface charge [71].
The results of biofilm assembly assay are shown in figure 23. The three K. pneumoniae strains
exhibited the ability to assemble biofilms although following different kinetics. All K. pneumoniae
strains revealed a significant increase of their biofilm mass across time points (Figure 23). Two
bacterial strains (K. pneumoniae 703;O:1 and K. pneumoniae 45) exhibited similar biomass growth
profiles although the biomass increase was more significant for K. pneumoniae 703;O:1. The third
bacterium (K. pneumoniae 2948) had the smallest amount of biomass. Based on these data, bacteria
could be ranked concerning their biofilm assembly ability. The best biofilm assembler was K.
pneumoniae 703;O:1 and the worse K. pneumoniae 2948, being K. pneumoniae 45 in an intermediate
position.
After conclude which bacteria is the most suitable to biofilm assembly, it is possible to relate
this conclusions to bacteria generation time, discussed above. Klebsiella pneumoniae 703;O:1, is the

33
bacterium with longer generation time at early hours and the shorter at later hours. This reveals that
number of bacteria will increase faster at later hours. Klebsiella pneumoniae 45 is the bacterium with
shortest generation time at early hours and longer at late hours. As a result bacteria biomass will
increase faster initially than at later time points. Growth rate influence surfaces colonization and are
linked to biofilm assembly ability [81]. The differences observed for growth rate between the bacteria
used in this study are small. Nevertheless, these values suggest that K. pneumoniae 703;O:1 is the
bacterium more prone to assembled biofilm, whereas K. pneumoniae 2948 is the less.
Biofilm mass increase develops through three main phases – attachment, maturation and
dispersion [27, 31]. It is important to establish a link between biofilm biomass evolution shown in figure
23 and biofilm phases described in the literature (Figure 24). Attachment stage is first identified, when
biofilm mass is starting to increase. Initially, bacteria attach to the surface through pili. Then bacteria
start to excrete a mixture of polysaccharides, lipids and nucleic acids (EPS), promoting attachment to
surface. At the end of attachment stage, bacteria are irreversibly linked to the surface. Once attached,
the EPS provides structure and protection to the biofilm community. At this stage, maturation, biofilm
0
1
2
3
4
5
6
7
0 10 20 30 40 50
Op
tica
l D
en
sity (
57
0n
m)
Arb
itra
ry u
nits
Time (h)
K.pneumoniae 45 K.pneumoniae 2948 K.pneumoniae 703;O:1
Figure 23 – Kinetic of biofilm assembly for K. pneumoniae strains. OD values were measured at 570nm from 0 hours to 48 hours.
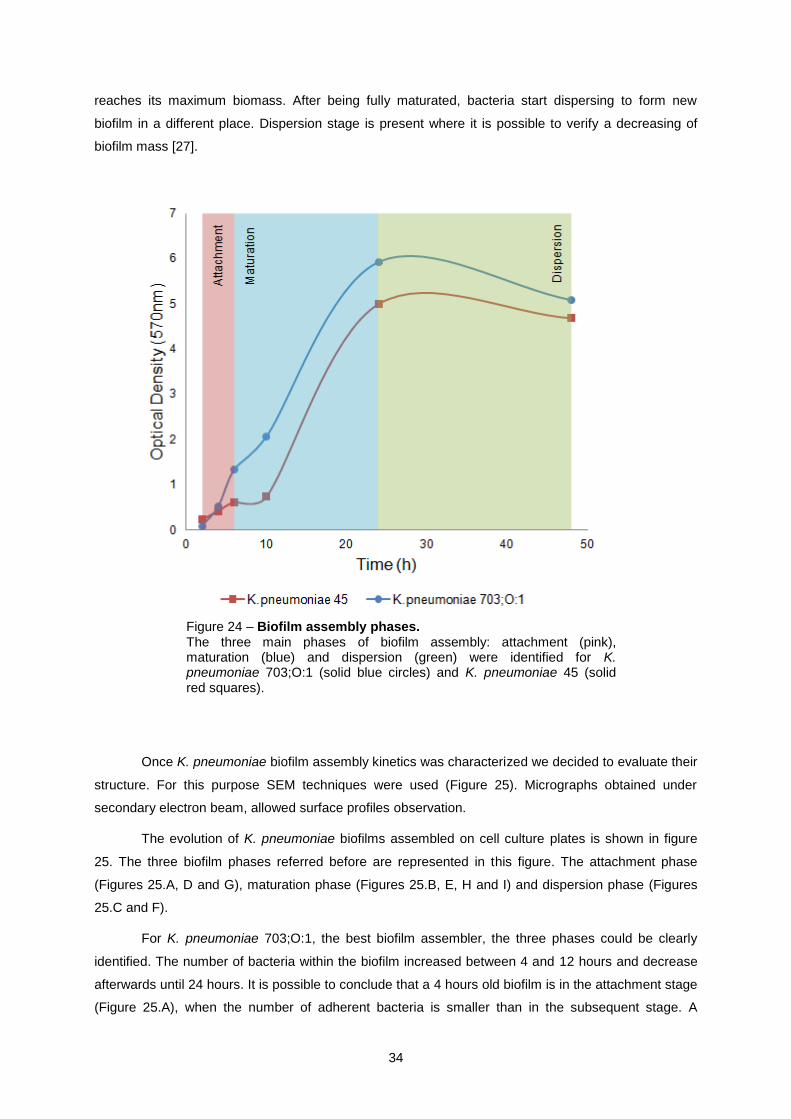
34
reaches its maximum biomass. After being fully maturated, bacteria start dispersing to form new
biofilm in a different place. Dispersion stage is present where it is possible to verify a decreasing of
biofilm mass [27].
Once K. pneumoniae biofilm assembly kinetics was characterized we decided to evaluate their
structure. For this purpose SEM techniques were used (Figure 25). Micrographs obtained under
secondary electron beam, allowed surface profiles observation.
The evolution of K. pneumoniae biofilms assembled on cell culture plates is shown in figure
25. The three biofilm phases referred before are represented in this figure. The attachment phase
(Figures 25.A, D and G), maturation phase (Figures 25.B, E, H and I) and dispersion phase (Figures
25.C and F).
For K. pneumoniae 703;O:1, the best biofilm assembler, the three phases could be clearly
identified. The number of bacteria within the biofilm increased between 4 and 12 hours and decrease
afterwards until 24 hours. It is possible to conclude that a 4 hours old biofilm is in the attachment stage
(Figure 25.A), when the number of adherent bacteria is smaller than in the subsequent stage. A
Figure 24 – Biofilm assembly phases. The three main phases of biofilm assembly: attachment (pink), maturation (blue) and dispersion (green) were identified for K. pneumoniae 703;O:1 (solid blue circles) and K. pneumoniae 45 (solid red squares).

35
mature biofilm is shown in figure 25.B. The number of adherent bacteria increased and defined
structures could be identified (red asterisks on figure 25B), forming a denser biofilm. The last stage of
biofilm assembly, dispersion, is shown in figure 25.C. Here not only the number of bacteria decreased
but also the number of organized bacterial structures. It is possible to confirm that K. pneumoniae
703;O:1 is the best biofilm assembler, comparing figures 25.B, E and H. Clearly, K. pneumoniae
703;O:1 correspondent figure reveals more amount of biofilm mass.
Klebsiella pneumoniae 45 followed a biofilm kinetic assembly similar to K. pneumoniae
703;O:1. Nevertheless, K. pneumoniae 45 had less biomass. It is possible to identify phases of biofilm
formation, as described for K. pneumoniae 703;O:1. Attachment phase is shown in figure 25.D,
maturation phase is shown in figure 25.E and dispersion phase in figure 25.F. It is possible to verify
that, at attachment phase, K. pneumoniae 45 is the bacterium with less amount of biomass. Through
observation of figure 25.D we can notice less bacteria amount than for other strains. Bacteria appear
to be more individualized. Since K. pneumoniae 45 is the bacterium with smaller duplication times
during both lag phase and early exponential phase (Table 4) the smaller biomass should not be due to
difficulty in adaptation to the growth conditions. For this reason we hypothesize that for this bacterium
is more difficult to attach. During attachment, bacteria approach to a surface searching for nutrients
[82]. Depletion of nutrients, as oxygen, can lead to migration of bacteria to other locations, in search
for nutrients [82, 83]. Alterations on growth medium, as pH, temperature, ionic force or nutrient levels,
can affect bacterial attachment. All this conditions were similar for all bacteria so this fact has to be
explained with a bacteria intrinsic factor. A slower bacterial adhesion can be triggered by the cell-to-
cell communication [84] and the presence of extracellular DNA. The latest factor affects initial
attachment, rather than maturation or dispersion [85].
The kinetic of biofilm assembly for K. pneumoniae 2948 is different from the others strains
(Figure 23). This fact explains the increase of bacteria organized in structures between figures 25.H
(12 hours) and 25.I (24 hours). While at 24 hours both K. pneumoniae 45 and K. pneumoniae 703;O:1
are in the dispersion phase, K. pneumoniae 2948 are still in the previous biofilm phase (maturation).
These results could be explained by differences in the bacteria generation times and their ability to
adapt to the biofilm environment.
Data from SEM micrographs are in good agreement with figure 23, where K. pneumoniae
703;O:1 had more biofilm assembly ability, K. pneumoniae 2948 had less ability, and K. pneumoniae
45 is between these strains.
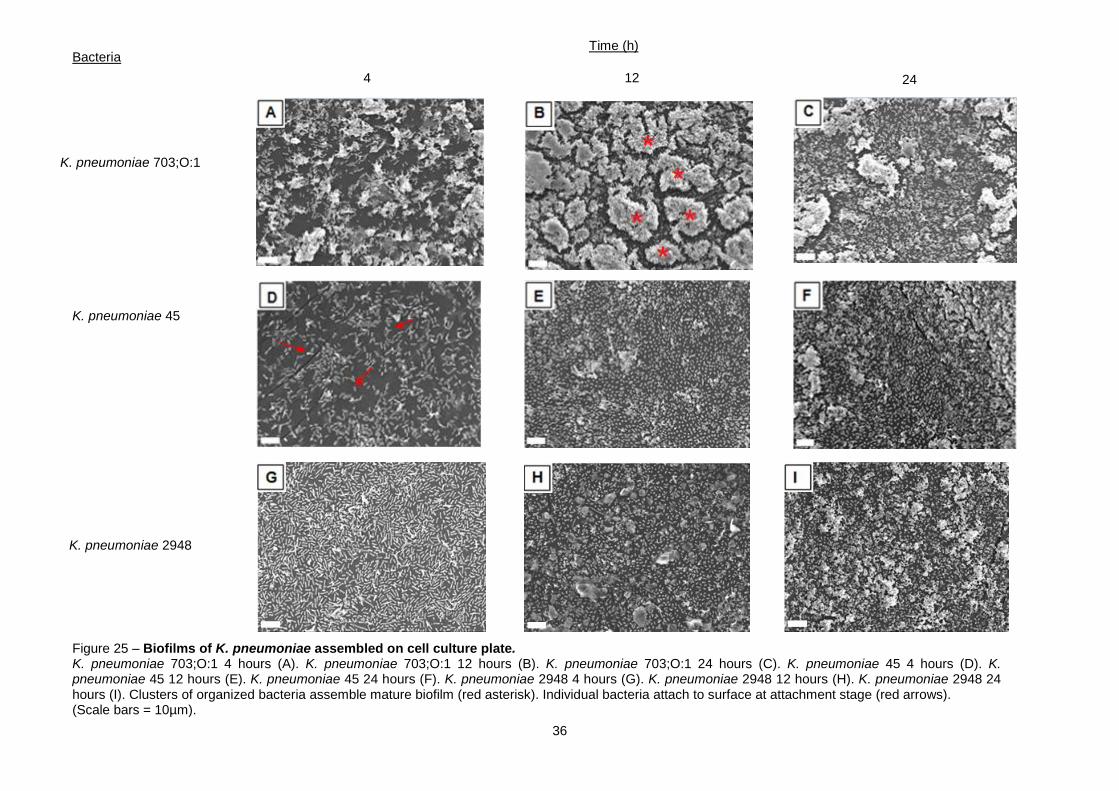
36
Bacteria Time (h)
4 12 24
K. pneumoniae 45
K. pneumoniae 703;O:1
K. pneumoniae 2948
Figure 25 – Biofilms of K. pneumoniae assembled on cell culture plate. K. pneumoniae 703;O:1 4 hours (A). K. pneumoniae 703;O:1 12 hours (B). K. pneumoniae 703;O:1 24 hours (C). K. pneumoniae 45 4 hours (D). K. pneumoniae 45 12 hours (E). K. pneumoniae 45 24 hours (F). K. pneumoniae 2948 4 hours (G). K. pneumoniae 2948 12 hours (H). K. pneumoniae 2948 24 hours (I). Clusters of organized bacteria assemble mature biofilm (red asterisk). Individual bacteria attach to surface at attachment stage (red arrows). (Scale bars = 10µm).
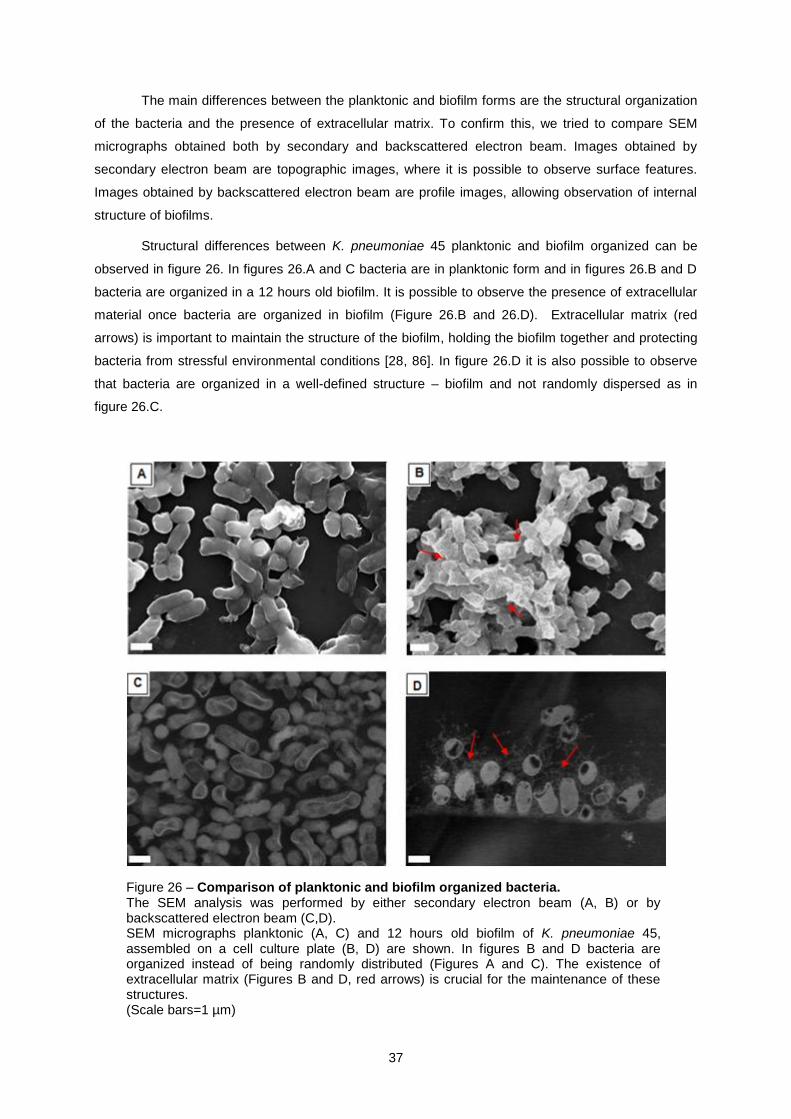
37
The main differences between the planktonic and biofilm forms are the structural organization
of the bacteria and the presence of extracellular matrix. To confirm this, we tried to compare SEM
micrographs obtained both by secondary and backscattered electron beam. Images obtained by
secondary electron beam are topographic images, where it is possible to observe surface features.
Images obtained by backscattered electron beam are profile images, allowing observation of internal
structure of biofilms.
Structural differences between K. pneumoniae 45 planktonic and biofilm organized can be
observed in figure 26. In figures 26.A and C bacteria are in planktonic form and in figures 26.B and D
bacteria are organized in a 12 hours old biofilm. It is possible to observe the presence of extracellular
material once bacteria are organized in biofilm (Figure 26.B and 26.D). Extracellular matrix (red
arrows) is important to maintain the structure of the biofilm, holding the biofilm together and protecting
bacteria from stressful environmental conditions [28, 86]. In figure 26.D it is also possible to observe
that bacteria are organized in a well-defined structure – biofilm and not randomly dispersed as in
figure 26.C.
Figure 26 – Comparison of planktonic and biofilm organized bacteria. The SEM analysis was performed by either secondary electron beam (A, B) or by backscattered electron beam (C,D). SEM micrographs planktonic (A, C) and 12 hours old biofilm of K. pneumoniae 45, assembled on a cell culture plate (B, D) are shown. In figures B and D bacteria are organized instead of being randomly distributed (Figures A and C). The existence of extracellular matrix (Figures B and D, red arrows) is crucial for the maintenance of these structures. (Scale bars=1 µm)
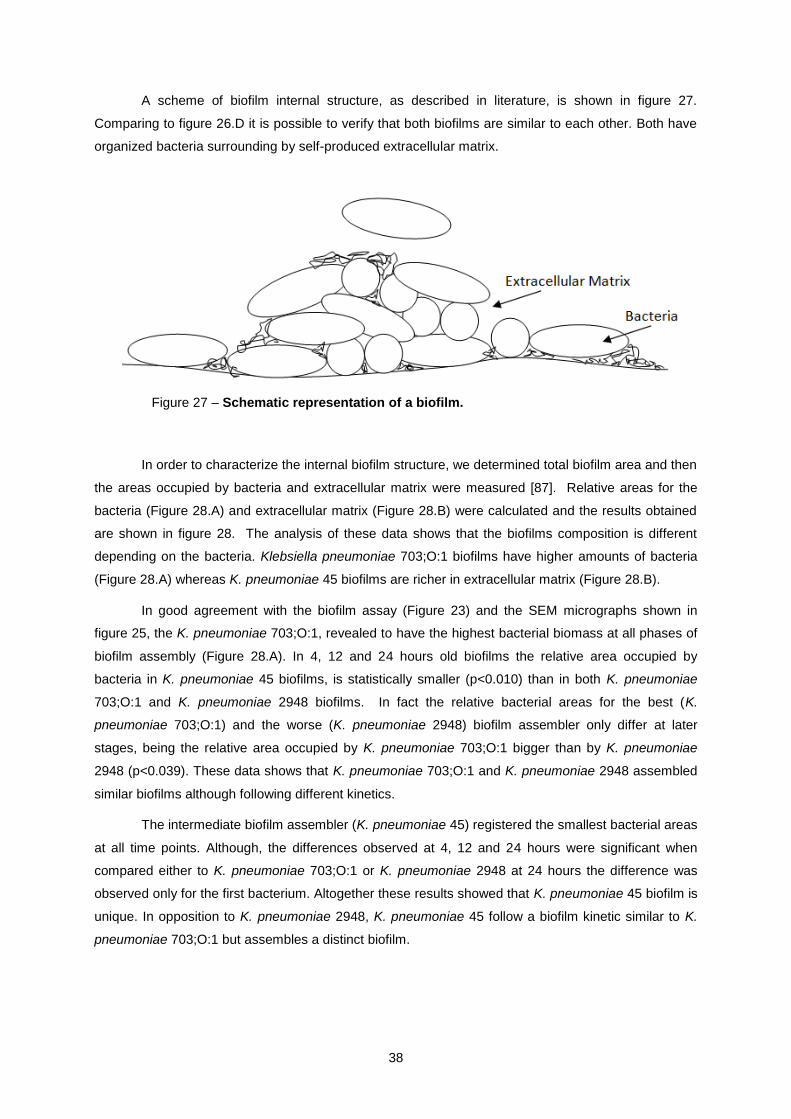
38
A scheme of biofilm internal structure, as described in literature, is shown in figure 27.
Comparing to figure 26.D it is possible to verify that both biofilms are similar to each other. Both have
organized bacteria surrounding by self-produced extracellular matrix.
In order to characterize the internal biofilm structure, we determined total biofilm area and then
the areas occupied by bacteria and extracellular matrix were measured [87]. Relative areas for the
bacteria (Figure 28.A) and extracellular matrix (Figure 28.B) were calculated and the results obtained
are shown in figure 28. The analysis of these data shows that the biofilms composition is different
depending on the bacteria. Klebsiella pneumoniae 703;O:1 biofilms have higher amounts of bacteria
(Figure 28.A) whereas K. pneumoniae 45 biofilms are richer in extracellular matrix (Figure 28.B).
In good agreement with the biofilm assay (Figure 23) and the SEM micrographs shown in
figure 25, the K. pneumoniae 703;O:1, revealed to have the highest bacterial biomass at all phases of
biofilm assembly (Figure 28.A). In 4, 12 and 24 hours old biofilms the relative area occupied by
bacteria in K. pneumoniae 45 biofilms, is statistically smaller (p<0.010) than in both K. pneumoniae
703;O:1 and K. pneumoniae 2948 biofilms. In fact the relative bacterial areas for the best (K.
pneumoniae 703;O:1) and the worse (K. pneumoniae 2948) biofilm assembler only differ at later
stages, being the relative area occupied by K. pneumoniae 703;O:1 bigger than by K. pneumoniae
2948 (p<0.039). These data shows that K. pneumoniae 703;O:1 and K. pneumoniae 2948 assembled
similar biofilms although following different kinetics.
The intermediate biofilm assembler (K. pneumoniae 45) registered the smallest bacterial areas
at all time points. Although, the differences observed at 4, 12 and 24 hours were significant when
compared either to K. pneumoniae 703;O:1 or K. pneumoniae 2948 at 24 hours the difference was
observed only for the first bacterium. Altogether these results showed that K. pneumoniae 45 biofilm is
unique. In opposition to K. pneumoniae 2948, K. pneumoniae 45 follow a biofilm kinetic similar to K.
pneumoniae 703;O:1 but assembles a distinct biofilm.
Figure 27 – Schematic representation of a biofilm.

39
Next we analyzed the area occupied by extracellular matrix (Figure 28.B), a key player in
biofilm assemble and persistence. Klebsiella pneumoniae 45 is the bacterium that excretes more
extracellular matrix. The difference between the relative areas for EPS secreted by K. pneumoniae 45
and K. pneumoniae 2948 were significantly different at all time points (p<0.048). Although the relative
areas occupied by EPS in K. pneumoniae 703;O:1 where, at all time points, are smaller than in K.
pneumoniae 45 biofilms, the difference was significant only at 12 and 24 hours. No differences
Figure 28 – Characterization of K. pneumoniae biofilms assembled on
cell culture plates.
The relative amounts of biofilm main constituents: bacteria and EPS were evaluated. The relative areas occupied by bacteria areas (A) and extracellular matrix (B) through biofilm evolution phases are shown. (* p<0.05; ** p<0.01)

40
between K. pneumoniae 703;O:1 and K. pneumoniae 2948 EPS relative areas were detected. This
fact supports our previous assumption that these two bacteria form similar biofilms following different
kinetics.
The increased EPS secretion by K. pneumoniae 45 also supports the fact that biofilms
assembled by this bacterium are distinct. This exacerbated production of EPS could be explained by
need of structures that promote bacterial attachment. As already referred this bacterium is less prone
to attach to the cell culture plate surface, at initial stage. This fact could enhance EPS production [84]
which will promote attachment to surface [88]. The EPS amount is not uniform and may be altered in
space and time, being proved that different bacteria produce it in different amounts [84]. The amount
of EPS within biofilm varies over time, with highest amount at attachment and dispersion phases.
Studies have shown that EPS plays an important role in attachment and dispersion phases, binding
cells to surface [84, 89]. Remembering that the dispersion stage occurs due to a local nutrient
depletion and bacteria need to colonize other areas from the surface [84]. Extracellular matrix
contributes to increased virulence of microorganisms, blocking mass transport of antibiotics through
the biofilm [84].
The amount of extracellular matrix produced by K. pneumoniae 45 can be verified in figure 29.
This difference is more obvious between figures 29.A and 29.C, where it is clearly seen the matrix
surrounding bacteria. The last phase of biofilm assembly, where bacteria are dispersing from a mature
biofilm to form a new biofilm in other location can be identified in figure 29.D [90, 91]. Bacteria have
this behavior in order to ensure their persistence, searching for nutrients [91].
K. pneumoniae 703;O:1
Figure 29 – Comparison between K. pneumoniae biofilms on cell culture plate. At 12 hours biofilm K. pneumoniae 45 (A) excreted more extracellular matrix (red arrows) than K. pneumoniae 703;O:1 (C). At 24 hours both K. pneumoniae 45 (B) and K. pneumoniae 703;O:1 (D)started to disperse assembling new biofilms in another area. Bacteria attaching in a different area are highlighted by a blue arrow. (Scale bars = 1 µm)

41
3.1.4 Biofilm assembly on silicon and stainless steel surfaces
Once the ability to assemble biofilm on cell culture plate was confirmed, the next step was to
test this ability on other surfaces. The chosen surfaces mimic those present in healthcare units, in
order to study the contribution of biofilm assembly for HAIs spread. The selected materials were
silicon and stainless steel.
a) Silicon
Silicon was the first evaluated surface. This material is used as coating of endoscopes and
catheters, e.g. urinary catheters being chosen by this reason [38]. Biofilm assembled on silicon were
analyzed by SEM with the main goals of evaluating its structure and composition.
Micrographs, obtained under secondary electron beam, show the evolution of K. pneumoniae
biofilms assembled on silicon (Figure 30). As described, for cell culture plate biofilms, these
micrographs can be related to phases of biofilm assembly. The attachment (Figures 30.A, B and C),
maturation (Figure 30.D) and dispersion (Figure 30.E) phases could be clearly identified. Evolution of
biofilm mass is visible between phases of biofilm assembly, for all strains (data shown only for K.
pneumoniae 45).
For K. pneumoniae 45, the same conclusion reached out before, can be confirmed. Klebsiella
pneumoniae 45 revealed less biomass than K. pneumoniae 703;O:1, although they had similar biofilm
kinetic assembly (Figure 23). As referred before, the attachment of this bacterium is more difficult than
for other strains.
Although biofilms assembled on silicon have not been assayed, the data acquired by SEM
showed that bacteria ability to assemble biofilms is similar for both materials. In other words the rank
of biofilm assembling was kept unchanged. Despite this fact, the biofilms assembled on silicon were
denser than on cell culture plate as could be observed in figure 30 [92]. The difference between
biofilms assembled on cell culture plates and silicon were especially notorious at early phases for the
bacteria less prone to assemble biofilms. For K. pneumoniae 703;O:1 the kinetic of biofilm assembly
was kept unchanged as shown in figure 25.A (cell culture plate) and figure 30.A (silicon). The other
two bacteria improved their ability to attach to the surface. This fact could be confirmed comparing
figures 25.D and 30.B for K. pneumoniae 45 and figures 25.G and 30.C for K. pneumoniae 2948.

42
Att
ach
me
nt
Ma
tura
tion
Figure 30 – Biofilms of K. pneumoniae assembled on silicon. Representative micrographs of attachment, maturation and dispersion phases for K. pneumoniae are shown. The attachment phase is illustrated by 4 hours old biofilms of K. pneumoniae 703;O:1 (A) K. pneumoniae 45 (B) and K. pneumoniae 2948 (C). For K. pneumoniae 45 at 12 hours old biofilm in maturation phase (D) and 1 day old biofilm in dispersion phase (E) are also shown. (Scale bars = 10µm)
Dis
pe
rsio
n

43
In order to characterize internal structure of biofilm, and understand how bacteria within silicon
biofilm organize themselves an approach similar to the adopted before for cell culture plates were
used. The results obtained for the bacteria (Figure 31.A) and extracellular matrix (Figure 31.B) relative
areas are shown in figure 31. For biofilms assembled on silicon no significant differences in bacteria
relative areas were found. This fact supports the previous observations that biofilms assembled on cell
culture plates and silicon are distinct. In addition the profile obtained for EPS secretion was also
different. On silicon were registered significant differences in EPS secretion only at 4 hours
(attachment phase). Once more, these differences were observed only between K. pneumoniae 45
and the other two bacteria (p<0.053). This observation strengthens our previous conclusion that K.
pneumoniae 703;O:1 and K. pneumoniae 2948 assemble similar biofilms whereas K. pneumoniae 45
assembled a distinct biofilm.
The comparison between biofilms assembled on the two surfaces is shown in figure 32.
Differences in bacteria behavior between cell culture plate and silicon biofilm were observed. The
relative areas occupied by bacteria in 12 hours old biofilms were significantly higher for K.
pneumoniae 45 (p=0.042). For the best biofilm assembler microorganism no difference was found
(Figure 32.A). For K. pneumoniae 2948 bacteria area on silicon had increased, although it was not
statistically significant. As described in the literature bacterial biofilms can display many phenotypes,
being influenced by surface features and microorganisms structure [93]. In the present work for K.
pneumoniae 703;O:1 biofilm assembler ability was not affected by the material surface, whereas K.
pneumoniae 45 was affected. The bacteria less prone to assemble biofilms increased their
performance on silicon.
For this outcome the differential secretion of EPS by bacteria on cell culture plates and silicon
might play a crucial role. As reported previously EPS influence biofilm assembly being particularly
important on attachment an dispersion phases [84, 86, 89]. The relative areas occupied by EPS were
higher for all bacteria for biofilms assemble on silicon (Figure 32.B). Nevertheless, the differences
were not statistically significant in all cases. For instance, K. pneumoniae 45 which differences in
attachment to the different surfaces could be observed in figures 25 and 30 has an increase in EPS
secretion that although being not statistically significant has biological relevance. The exacerbate
secretion of EPS by K. pneumoniae 45 (Figure 33.A) in comparison to K. pneumoniae 703;O:1 (Figure
33.B) could be observed by SEM under backscattered electron beam, shown in figure 33. The most
notorious differences were observed for K. pneumoniae 2948. The relative areas occupied by
excreted matrix at 4 hours (p=0.042), 12 hours (p=0.006) and 24 hours (p=0.013) with biofilm were
statistically different between cell culture plate and silicon. This could account for the existence of K.
pneumoniae 2948 biofilms with different organizations in both materials.

44
Figure 31 – Characterization of K. pneumoniae biofilms assembled on silicon. The relative amounts of biofilm main constituents: bacteria and EPS were evaluated. The relative areas occupied by bacteria areas (A) and extracellular matrix (B) through biofilm evolution phases are shown. (*p<0.05)

45
Figure 33 – Comparison between K. pneumoniae biofilms assembled on silicon. Klebsiella pneumoniae 45, 12 hours biofilm (A), excretes more matrix than K. pneumoniae 703;O:1, 12 hours biofilm (B). Exacerbated matrix produced by K. pneumoniae 45 is highlighted by red arrows. (Scale bars = 1µm)
Figure 32 – Comparison between K. pneumoniae cell culture plate and silicon biofilms. Biofilms assembled on cell culture plates (blue) or silicon (red) are shown for K. pneumoniae 45, and K. pneumoniae 2948. A significant statistical difference was observed at 12 hours for K pneumoniae 45 relative area for both materials (A). For extracellular matrix a statistical difference was observed for K. pneumoniae 2948 at all time points (B). (*p<0.05; **p<0.01)
46
b) Stainless steel
The development of bacterial biofilms on water distribution systems is well-known [84]. For this
reason the ability to assemble biofilms on metal was evaluated. This material is present in plumbing
pipes in hospitals, and in water delivering-systems [94].
Here the work was focused on only one time point chosen with the assumption that biofilm
assembly will follow a kinetic similar to the previously described. Since maturation was achieved for 12
hours old biofilms this was the chosen time point. The topographic structures of biofilm are shown in
figure 34. The biofilms assembled by K. pneumoniae 45 (Figure 34.A), K. pneumoniae 703;O:1
(Figure 34.B) and K. pneumoniae 2948 (Figure 34.C) are shown in figure 45.
Klebsiella pneumoniae 703;O:1 revealed to have more ability to assemble biofilm, and K.
pneumoniae 2948 revealed to be the worse biofilm assembler, concordant to described for previous
surfaces. At 12 hours, biofilms are in maturation stage, so it is possible to foresee that they have
maximum of biofilm mass at this stage. In figures 34.A, B and C it is possible to notice bacteria
clusters that represent a mature biofilm. Only for K. pneumoniae 2948 these clusters are more difficult
to find. This bacterium is the worse biofilm assembler, so we can conclude that at 12 hours K.
pneumoniae 2948 is at the beginning of maturation stage. Here, few clusters of bacteria had formed,
and structures are not as much organized than for other strains. This conclusion has been already
reached for cell culture plate and silicon biofilms.
In comparison with cell culture plate and silicon, the metallic surface revealed to be less
suitable for biofilm assembly. It has been shown that hydrophobic, nonpolar surfaces (plastic) are
more suitable for bacterial colonization than hydrophilic materials (metal) [84, 95]. Stainless steel can
be produced in varying degrees of polishing, which affects bacterial adhesion due to its topographical
and physicochemical properties [9]. Studying roughness of stainless steel plates would be useful to
understand lower bacterial adhesion, and to establish a satisfactory roughness level to biofilm
assembly. Although this was out of the scope of the present study it was possible to observe that
metal roughness is important for biofilm assembly. A detailed observation of K. pneumoniae 2948
biofilms (Figure 37.C) showed that the few bacterial clusters present were assembled in areas with
irregular surface. For the other bacteria this fact is less notorious because bacterial clusters are
abundant, covering almost all the area available and preventing the observation of metal roughness.

47
3.1.5 Adhesion to biotic surface
The last step was the evaluation of bacteria adhesion to biotic surfaces in vitro, to mimic in
vivo interactions between bacteria and human cells. In other words, to mimic the host-pathogen
interaction this can result in host infection and disease development.
An adhesion assay was performed in order to evaluate the existence of preferential bacterial
adhesion to a model of epithelial cells (HeLa cells). The existence of preferential adhesion to HeLa
cells was translated by existence of colony forming units. The results are shown in figure 35.A. These
data show that only K. pneumoniae 45 adheres preferentially to human cells (Figure 35.A).
Nevertheless, HeLa cells are not able to phagocyte this bacterium as shown in figure 35.B [96]. The
bacteria could be observed around the cell attached to the cell membrane (red arrows in figure 35.B)
but not in the cell cytoplasm. In opposition, K. pneumoniae 703;O:1 which did not show preferential
adhesion to HeLa cells, was phagocytized being observed within the cytoplasm (Figure 35.C).
Figure 34 – Klebsiella pneumoniae biofilms on a metallic surface. All K. pneumoniae strains had the ability to assembler biofilm on a metallic surface. Although, they followed different kinetics, a ranking could be established. Klebsiella pneumoniae 45 (A) was in an intermediate position, while K. pneumoniae 703;O:1 (B) was the best biofilm assembler and K. pneumoniae 2948 (C) the worse. (Scale bars=10µm)

48
The analysis of SEM micrographs confirmed that K. pneumoniae 45 adhered to HeLa cells
(Figure 36.A). At higher magnifications (Figure 36.B) it is possible to observe the interaction between
the cellular surface and the bacteria. In the bacterial surface are present elongated filaments,
denominated pili, which link bacteria to each other and to the cell surface [96, 97]. Pili can mediate
adhesion to host cells being also related to biofilm assembly [34]. The human cells also play a role in
this interaction. In figure 36.B is possible to observe filamentous structures which extend from the cell
body to the bacteria.
The preferential adhesion exhibited by K. pneumoniae 45 can be due to cell tropism. Tropism
describes the phenomenon by which bacteria are restricted to certain hosts or tissues or even cell
types [98]. As referred before K pneumoniae 45 was isolated from skin (neck scrub). The cells present
in this sample and HeLa cells are both epithelial which could explain the tropism of K pneumoniae 45.
Nevertheless, we did not test the selective adhesion of these bacteria to other cells, for instance to
human bladder epithelial cells. For this reason the existence of tropism is at this stage is only an
interesting working hypothesis.
Figure 35 – Adhesion assay. The results of the adhesion assay performed for 4 and 8 hours with the three K. pneumoniae strains are shown(A). Only K. pneumoniae 45 adhered to HeLa cells. Analysis performed by optical microscopy after 8 hours for K. pneumoniae 45 (B) and K. pneumoniae 703;O:1 (C) supports this observation. Klebsiella pneumoniae 45 adherent to the cell membrane are highlighted by red arrows (B) and phagocytized K. pneumoniae 703;O:1 are highlighted by red circles (C).

49
The results obtained for K. pneumoniae 703;O:1 were surprising and interesting. Surprising
because the best biofilm assembler in all abiotic surfaces tested is now unable to assemble a biofilm
and, interesting since it was the only bacterium phagocytized by HeLa cells. The absence of biofilm
assembly could be, at least partially, explained by our provocative hypothesis of cell tropism
previously described. On the other hand the selective phagocytosis of K. pneumoniae 703;O:1 could
be explained by the absence of a capsule. The presence of a capsule is related to virulence,
protecting bacteria from ingestion by phagocytes [96]. Phagocytes are members of the host immune
system, such as dendritic cells and macrophages, which ingest bacteria and other harmful foreign
particles, providing an alert of danger to the system [97]. This alert triggers a cascade of events which
outcome will be determined by the host immune status and the bacteria virulence [99, 100, 101].
Virulence is defined as the capacity of a microorganism to be pathogenic and cause damage
to a host [99, 102]. Microorganism’s virulence is enhanced by the presence of diverse structures. In
the present work we have already identified several virulence factors which by definition enable
bacteria to invade a host, causing diseases and evade its defenses [102]. The identified structures
contributing for virulence are pili, bacterial capsule, and extracellular matrix. Pili are related to initial
bacterial attachment, promoting adherence to host and contributing to increased virulence of
pathogens [103]. Bacterial capsule can be related to virulence, since the bacterium without capsule
was phagocytized Capsules protect bacteria from phagocytosis avoiding the exposure harmful
molecules such as, oxygen radicals, nitrogen radical, acidic pH and enzymatic digestion [102].
Extracellular matrix increases bacterial virulence by preventing antibiotics to reach their bacterial
targets.
Figure 36 – Evaluation of K. pneumoniae 45 adhesion assay. Adhesion assay performed for 8 hours, at lower magnifications (A) bacteria adhere to cell surface and at higher magnifications, (B) bacteria attached to cell and to each other through pili. Clusters of organized bacteria adhere to cell surface (red arrow). Clusters of organized bacteria adhere to cell culture plate (blue arrow). Pili are filaments that link bacteria to each other and to cell surface (white arrows).

50
Altogether our data shows that biofilm assembly in abiotic and biotic surfaces follows different
rules. Despite this fact, several players collectively referred as virulence factors, are involved in the
final outcome.
3.2 Gram-positive bacteria - Nontuberculous mycobacteria
3.2.1 Planktonic bacteria and generation time
Nontuberculous mycobacteria (NTM) are heterogeneous group of microorganisms including
environmental bacteria and human pathogens. Among the latest M. avium is the most famous
pathogen due to disseminated infections in immunosupressed patients. Nevertheless, in recent years
fast growing NTM such as M. fortuitum have been involved in human infections. One of the problems
raised by these bacteria is their resistance to antibiotics.
Nontuberculous mycobacteria antibiotic susceptibility is determined by the minimum inhibitory
concentration as described before for K. pneumoniae [104]. In the literature are a vast number of
studies where MIC were determined by the microdilution method [105, 106, 107, 108, 109]. Most of
strains are resistant to antibiotics, revealing an increase of MIC value in biofilm organized form.
Mycobacteria within biofilm revealed resistance to antibiotics but they are susceptible at planktonic
form [110]. For example, M. smegmatis revealed a resistance to antibiotics of biofilm form 8-times
higher than planktonic form [58]. For this reason we decided to include NTM in this study.
Four strains of (NTM) were studied following the strategy described previously for K.
pneumoniae. Micrographs of planktonic bacteria were obtained by SEM, under backscattered electron
beam, and a significant number of bacteria were measured in length and width. Dimensions reported
for M. smegmatis mc2
155 in the literature are 1.755 µm ± 0.101 in length and 0.457 µm ± 0,039 in
width [111]. Cell dimensions obtained for the NTM strains are shown in table 6. The obtained results
are in good agreement with those reported in the literature supporting the use of SEM, a less
demanding technique than TEM, for evaluating microorganism dimensions.
NTM strains cells are similar in length and width. The exception is M. fortuitum ATCC 6841
which both length and width are different from other studied NTM strains. Mycobacterium fortuitum
ATCC 6841 is the biggest of all strains, with lowest width of all. This suggests that this bacterium has
a more elongated form. Other three strains have similar lengths and widths, being M. chelonae the
bacterium with more round shape, due to balance between length and width.

51
Table 6 – NTM cell dimensions.
Bacteria
Cell Length (µm) Cell Width (µm)
Average SD Average SD
M. smegmatis mc2155 1.65 0.246 0.609 0.270
M. fortuitum 747/08 1.51 0.756 0.519 0.060
M. fortuitum ATCC 6841 2.22 0.416 0.457 0.030
M. chelonae ATCC 35752 1.55 0.557 0.561 0.070
After planktonic cell measurement, growth profile of NTM strains was evaluated, through
bacteria growth curve (Figure 37). Additionally bacteria generation times were also determined (Table
7).
Nontuberculous mycobacteria behave differently from K. pneumoniae strains. These strains
need longer incubation time to reach a significant number of bacteria. Although they have longer
growth time in comparison to K. pneumoniae strains, they have a specific growth pattern. They are
0,0
0,2
0,4
0,6
0,8
1,0
1,2
0 20 40 60 80 100 120 140
Op
tica
l D
en
sity (
57
0n
m)
Arb
itra
ry U
nits
Time (h)
M. smegmatis M.fortuitum M.chelonae
Figure 37 – Growth curve for NTM.

52
considered rapid-growers among mycobacteria genus. We tried to relate the bacteria growth curve
obtained experimentally with those from literature, as described for K. pneumoniae. However, phases
from bacterial growth are difficult to found in figure 37. Initially all strains behave similar, once they are
adapting to surface conditions. At 24 hours of bacterial growth, M. chelonae revealed to have more
pronounced growth than other two strains, but at 72 hours, M. smegmatis revealed advanced bacterial
growth although M. fortuitum revealed similar growth profile.
These variations in growth curve can be explained by bacteria generation time, which was
evaluated for planktonic NTM strains. Generation time values were obtained, in hours, and are shown
in table 7.
Table 7 – Planktonic NTM generation time.
Bacteria
Generation Time (h)
Lag phase* Exponential phase*
M. smegmatis mc2155 12.7 6.65
M. fortuitum ATCC 6841 14.8 7.97
M. chelonae ATCC 35752 287 5.03
*The lag and exponential phases correspond to 4 and 24 hours incubation time, respectively.
Regarding to evolution of generation time, NTM and K. pneumoniae strains behave in a similar
way. As the incubation time increases, the generation time of bacteria increases, resulting in slower
bacterial division. NTM divides slower than K. pneumoniae being generation time at 24 hours 3-times
slower for NTM than for K. pneumoniae strains.
All NTM strains have different generation times. Mycobacterium fortuitum and M. smegmatis
have identical generation time at 4 and 24 hours. Mycobacterium chelonae had the longest generation
time at 4 hours and the shortest at 24 hours, increasing faster at later hours. These variations in
generation times are reflected in the growth curve (Figure 37).
3.2.2 Biofilm assembly on cell culture plate
In similarity to what was done with K. pneumoniae strains, bacteria ability to assemble biofilm
was evaluated. Biofilm assembly was first evaluated on a chosen model surface. All strains revealed a
significant increase of their biofilm mass across time points. Kinetic of biofilm assembly for NTM
strains is shown in figure 38. Biofilm assembly was assessed at 1, 3 and 5 days, instead of 4, 12 and
24 hours, in accordance to NTM generation times.
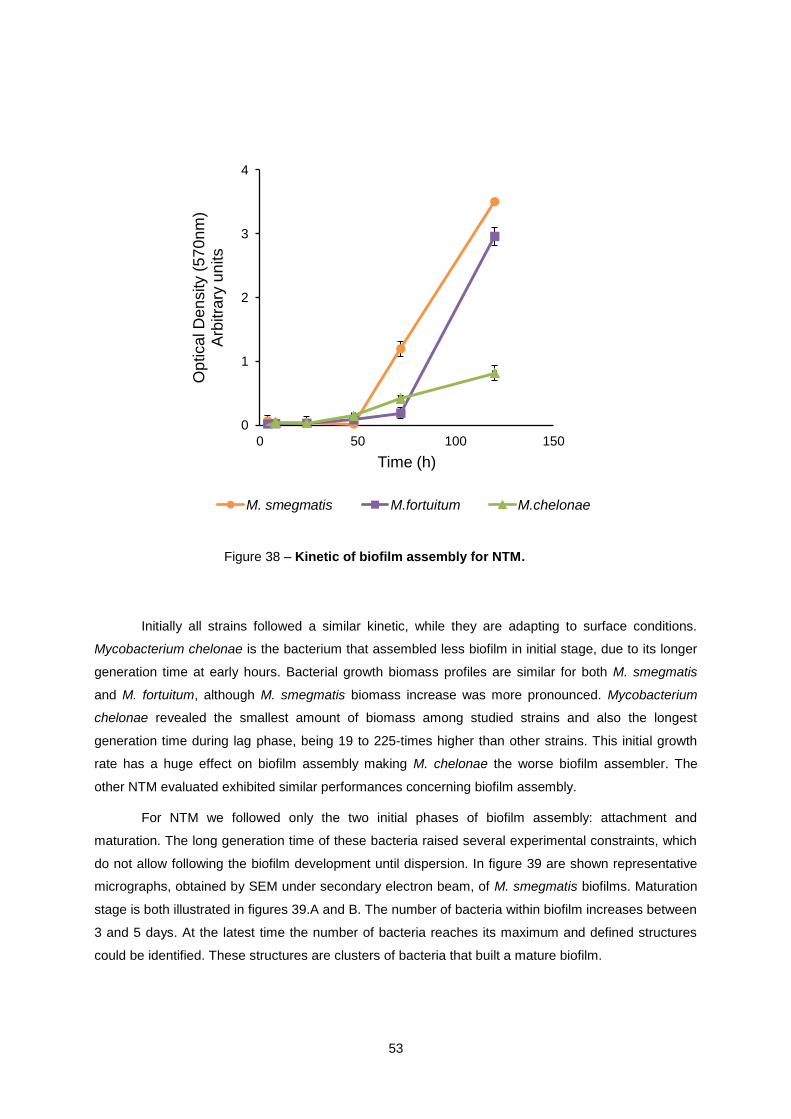
53
0
1
2
3
4
0 50 100 150
Op
tica
l D
en
sity (
57
0n
m)
Arb
itra
ry u
nits
Time (h)
M. smegmatis M.fortuitum M.chelonae
Initially all strains followed a similar kinetic, while they are adapting to surface conditions.
Mycobacterium chelonae is the bacterium that assembled less biofilm in initial stage, due to its longer
generation time at early hours. Bacterial growth biomass profiles are similar for both M. smegmatis
and M. fortuitum, although M. smegmatis biomass increase was more pronounced. Mycobacterium
chelonae revealed the smallest amount of biomass among studied strains and also the longest
generation time during lag phase, being 19 to 225-times higher than other strains. This initial growth
rate has a huge effect on biofilm assembly making M. chelonae the worse biofilm assembler. The
other NTM evaluated exhibited similar performances concerning biofilm assembly.
For NTM we followed only the two initial phases of biofilm assembly: attachment and
maturation. The long generation time of these bacteria raised several experimental constraints, which
do not allow following the biofilm development until dispersion. In figure 39 are shown representative
micrographs, obtained by SEM under secondary electron beam, of M. smegmatis biofilms. Maturation
stage is both illustrated in figures 39.A and B. The number of bacteria within biofilm increases between
3 and 5 days. At the latest time the number of bacteria reaches its maximum and defined structures
could be identified. These structures are clusters of bacteria that built a mature biofilm.
Figure 38 – Kinetic of biofilm assembly for NTM.

54
To support previous conclusion that M. chelonae was the worse biofilm assembler, figure 40
show M. chelonae cell culture plate biofilm structure. A 3 days (Figure 40.A) and 5 days old biofilm
(Figure 40.B) of M. chelonae can be compared with figure 39. It is clear that M. smegmatis had more
biofilm mass than M. chelonae. The kinetic of M. chelonae biofilm assembly is different from the other
strains (Figure 38).
Figure 39 – Mycobacterium smegmatis biofilms assembled on cell culture plate with different ages. SEM micrographs of 3 (A) and 5 (B) days old M. smegmatis biofilms. Bacteria organized in clusters within a mature biofilm (red asterisks) are present in figure B but not in figure A. (Scale bars = 10 µm)
Figure 40 – Mycobacterium chelonae biofilms assembled on cell culture plate with different ages. SEM micrographs of 3 (A) and 5 (B) days old M. chelonae biofilms. Bacteria are more organized at 5 days. (Scale bars = 10 µm)
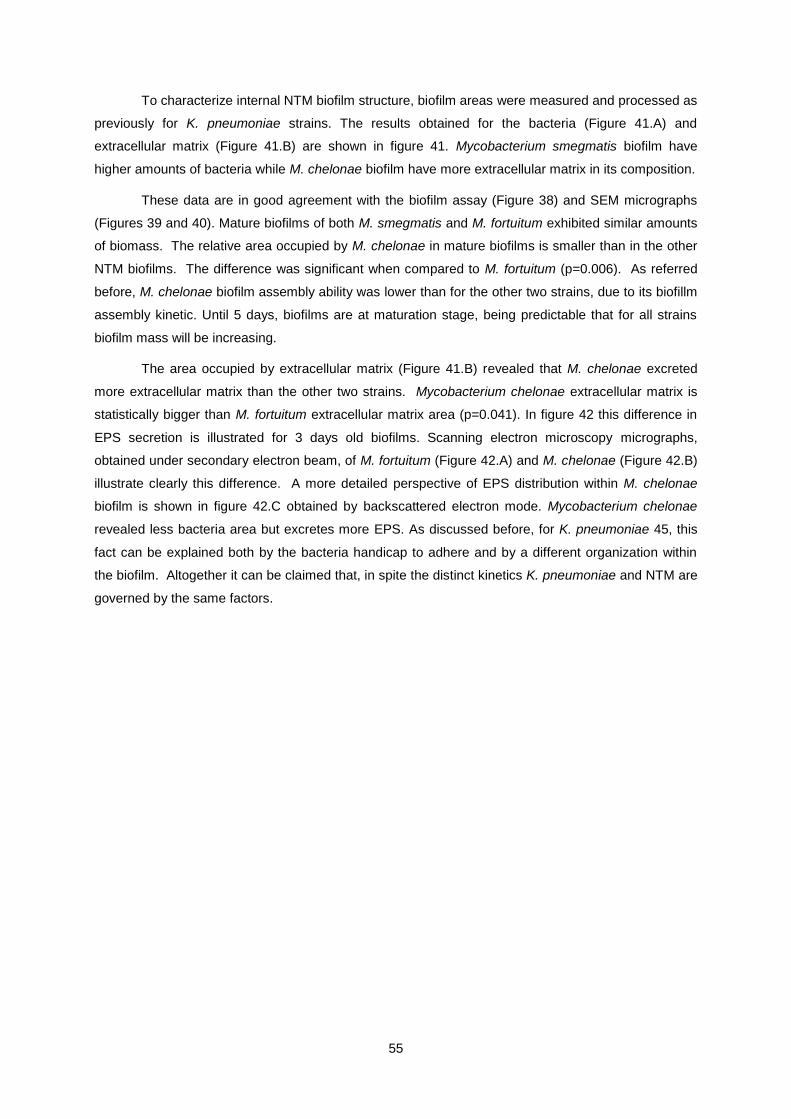
55
To characterize internal NTM biofilm structure, biofilm areas were measured and processed as
previously for K. pneumoniae strains. The results obtained for the bacteria (Figure 41.A) and
extracellular matrix (Figure 41.B) are shown in figure 41. Mycobacterium smegmatis biofilm have
higher amounts of bacteria while M. chelonae biofilm have more extracellular matrix in its composition.
These data are in good agreement with the biofilm assay (Figure 38) and SEM micrographs
(Figures 39 and 40). Mature biofilms of both M. smegmatis and M. fortuitum exhibited similar amounts
of biomass. The relative area occupied by M. chelonae in mature biofilms is smaller than in the other
NTM biofilms. The difference was significant when compared to M. fortuitum (p=0.006). As referred
before, M. chelonae biofilm assembly ability was lower than for the other two strains, due to its biofillm
assembly kinetic. Until 5 days, biofilms are at maturation stage, being predictable that for all strains
biofilm mass will be increasing.
The area occupied by extracellular matrix (Figure 41.B) revealed that M. chelonae excreted
more extracellular matrix than the other two strains. Mycobacterium chelonae extracellular matrix is
statistically bigger than M. fortuitum extracellular matrix area (p=0.041). In figure 42 this difference in
EPS secretion is illustrated for 3 days old biofilms. Scanning electron microscopy micrographs,
obtained under secondary electron beam, of M. fortuitum (Figure 42.A) and M. chelonae (Figure 42.B)
illustrate clearly this difference. A more detailed perspective of EPS distribution within M. chelonae
biofilm is shown in figure 42.C obtained by backscattered electron mode. Mycobacterium chelonae
revealed less bacteria area but excretes more EPS. As discussed before, for K. pneumoniae 45, this
fact can be explained both by the bacteria handicap to adhere and by a different organization within
the biofilm. Altogether it can be claimed that, in spite the distinct kinetics K. pneumoniae and NTM are
governed by the same factors.

56
Figure 41 – Characterization of NTM biofilms assembled on cell culture plates. The relative amounts of biofilm main constituents: bacteria and EPS were evaluated. The relative areas occupied by bacteria (A) and extracellular matrix (B) for a 3 days old biofilm are shown. (*p<0.05; **p<0.01)

57
Figure 42 – Differences between NTM biofilms assembled on cell culture plate. SEM micrograps for M. fortuitum and M. chelonae 3 days old cell culture plate biofiilm were evaluated. Differences in extracellular matrix are observed between M. fortuitum (A) and M. chelonae (B). A micrograph, obtained under backscattered electron beam, for M. chelonae biofilm (C), show bacteria surrounded by self-produced extracellular matrix highlighted by red arrows. (Scale bars=1µm)

58
3.2.3 Biofilm assembly on air-liquid interface
Nontuberculous mycobacteria revealed a particular feature when comparing to K.
pneumoniae. Biofilms were assembled on two distinct interfaces. The bottom of the cell culture plate
(solid-liquid interface) and the liquid surface (air-liquid interface) as schematically illustrated in figure
43. This fact has already been described by others [112, 113]. Mycobacterium smegmatis biofilm
assembled on air-liquid interface is very similar to a pellicle, involving sliding motility [113].
Nontuberculous mycobacteria assemble biofilm on water, namely in potable water systems present in
healthcare units, making this subject an interesting topic for study. Furthermore, it has been reported
that the highest rate of NTM on water systems are related to hospitals [25].
Biofilm assembled on air-liquid interface were analyzed by SEM under secondary electron
beam. A detailed observation of these samples showed that floating biofilms were denser and more
compact than those assembled on cell culture plate with the same age. The increased in thickness for
biofilms assembled on air-liquid interface as already been described [114]. On air-liquid interface
bacteria are in contact with both gaseous and liquid phases having privileged access to all nutrients of
both phases, e.g., oxygen [115].
Next we compared for the same bacteria, biofilms assembled on different interfaces with
different maturation times. In order to test the hypothesis that biofilms assembled on air-liquid interface
are better organized that those assembled on solid-liquid interface, the first were 2 days younger. The
1 day old biofilm assembled on air-liquid interface (Figure 44.A) is denser than the 3 days old biofilm
assembled on solid-liquid interface (Figure 44.B). Nevertheless, the second is better organized being
possible to identify the tower shaped structures characteristic of mature biofilm. At higher
magnifications (Figures 44.C and 46.D), it is possible to observe the differences in bacteria structure.
Bacteria within air-liquid biofilms are “fused” with each other whereas in the other interface they are
Figure 43 – Outline of air-liquid assembly, for one NTM strain. Bacteria not only attached on cell culture bottom surface (purple) but also formed a pellicle covering the liquid surface (blue).

59
individualized. The fusion phenomenon is mainly due to the presence of higher amounts of EPS.
The internal structure of biofilms assembled on air-liquid interface was then accessed as
previously described. The results obtained for bacteria relative area are shown in figure 45. When
comparing these values with those presented in figure 41.A we can observe an increase in the
bacterial area. Nevertheless, only for M. chelonae the bacterial area revealed to be significantly
smaller on cell culture plate (p=0.005). This bacterium exhibited more relative bacteria mass on air-
liquid interface (Figure 46.A). As discussed above, NTM strains had more ability to assemble biofilm
on air-liquid interface, due to enhanced level of nutrients. This results in a more compact biofilm, with
higher bacteria mass. It is possible to conclude that the bacterium less prone to biofilm assemble had
enhanced performance on air-liquid interface. The secretion of EPS on air-liquid interface was smaller
than on cell culture plate being statistically significant for M. fortuitum and M. chelonae (p<0.043). This
Figure 44 – Evaluation of NTM cell culture plate and air-liquid interface biofilms. SEM micrographs for M. fortuitum 1 and 3 days biofilms were evaluated. Biofilms on air-liquid interface (A and C) and on cell culture plate (B and D) were compared. One day old biofilm on air-liquid interface (A) is denser than 3 days old biofilm on cell culture plate (B). At higher magnifications, biofilm on air-liquid interface (1 day old) exhibited “fused” bacteria (C) while in 3 day old cell culture plate biofilm bacteria are more individualized (D).

60
result looks contradictory but could be explained. As already discussed, EPS promotes cell to cell
attachment. Once bacteria are less prone to link to cell culture plate surface, they must secrete higher
amounts of EPS in order to be able to attach. On the hand the “fusion” phenomenon described for air-
liquid biofilms in which bacteria lost their individuality due to the accumulation of EPS could lead to the
under-evaluation of the last. In this case it is difficult to distinguish between bacterial membranes and
the EPS deposited over them.
Altogether our data showed that NTM are prone to form air-liquid biofilms in good agreement
with the fact of being aerobic microorganisms and highly hydrophobic. This fact could account for the
high rate of NTM found in water distribution systems.
Figure 45 – Characterization of NTM biofilms assembled on air-liquid interface. The relative amounts bacteria were evaluated. The relative areas occupied by bacteria areas through biofilm evolution phases are shown.

61
Figure 46 – Comparison between NTM cell culture plate and air-liquid interface biofilms. Biofilms assembled on cell culture plates (blue) or air-liquid interface (green) are shown for M. fortuitum and M. chelonae. Biofilm total areas were evaluated at 3 days (A). A significant statistical difference was observed for M. chelonae 3 days biofilm (A). For extracellular matrix statistical differences were observed for M. fortuitum and M. chelonae for 3 days biofilm (B). (*p<0.05; **p<0.01)

62
3.2.4 Biofilm assembly on silicon
Evolution of biofilms was evaluated by SEM observation. Micrographs, obtained under
secondary electron beam, are shown in figure 47. Micrographs of M. chelonae 1 and 3 days biofilm on
silicon were evaluated. As described for previous surfaces, assembled biofilm obeys to assembly
phases described in literature. The number of bacteria increases between attachment (Figure 47.A)
and maturation (Figure 47.B) phases. In maturation stage it is possible to notice clusters of bacteria,
organized in defined structures, forming the mature biofilm.
In all cases biofilms assembled on silicon exhibited less biomass. This observation shows that,
in opposition to K. pneumoniae, NTM are less prone to assemble biofilm on silicon. Nevertheless, the
ranking for biofilm assembly within NTM tested was kept unchanged.
The relative areas occupied by bacteria and EPS were evaluated. The data analysis showed
the absence of significant differences in the relative areas occupied by bacteria (Figure 48.A). The fact
that both silicon and NTM are hydrophobic could account for this outcome. During attachment
superficial charges play a key role [116]. If bacteria and the attachment surface have the same charge
the attachment will be hampered since a repulsive phenomenon will be generated.
The secretion of EPS was evaluated (Figure 48.B). Once again M. fortuitum secreted
significantly less EPS than the other two bacteria (p<0.035) being simultaneously the best biofilm
assembler. This repetitive pattern observed for M. fortuitum suggests that it is due to bacteria intrinsic
factors instead of differences between the surfaces where the biofilms were assembled.
Figure 47 – Mycobacterium chelonae biofilms assembled on silicon. SEM micrographs for M. chelonae silicon biofilm, 1 day (A) and 3 days old (B) were compared. The second exhibited organized structures. Clusters of organized bacteria form a mature biofilm (red asterisks). (Scale bars=10µm)

63
The comparison between biofilms assembled on cell culture plate and silicon was performed
(Figure 49) confirming differences in bacteria behavior. All NTM strains exhibited higher values for
bacteria areas on cell culture plate than on silicon (p<0.033). This results show that NTM are less
prone to biofilm assembly on silicon due to the reasons stated before.
Figure 48 – Characterization of NTM biofilms assembled on silicon. The relative amounts of biofilm main constituents: bacteria and EPS were evaluated. The relative areas occupied by bacteria areas (A) and extracellular matrix (B) through biofilm evolution phases are show. (*p<0.05; **p<0.01)

64
3.3 Exploring factors involved in biofilm assembly
In the last part of this work was an attempt to understand the factors involved in biofilm
assembly. Among this we evaluated zeta potential, electrophoretic mobility and bacteria ability to
move independently of flagella (sliding).
3.3.1 Zeta potential and electrophoretic mobility
Zeta potential and electrophoretic mobility (EM) values are related to bacterial membrane
charges and biofilm assembly [117]. As these values decrease, biofilm forming ability also decreases
[118]. Bacterial strains that present heterogeneity in zeta potential and EM adhere better to surfaces
and are more capable of assemble biofilm. Zeta potential is not measured directly being calculated
using theoretical models and experimentally-determined electrophoretic mobility or dynamic
electrophoretic mobility. Zeta potential is affected by pH values and conductivity of the medium [118].
The values of zeta potential obtained in water are shown in table 8. All tested bacteria were
negatively charged. For NTM strains, the bacterium with highest zeta potential value was M.
smegmatis (-39.7 ± 1.01 mV) whereas M. chelonae (-55.7 ± 1,58 mV) revealed the lowest value. For
K. pneumoniae strains, the bacterium with highest zeta potential value was K. pneumoniae 2948 (-
41.3 ± 0.693 mV) and the lowest was K. pneumoniae 45 (-53.1 ± 0.709 mV). The values of EM follow
the same tendency registered for zeta potential.
Figure 49 – Comparison between NTM biofilms assembled on cell culture plate and silicon. Biofilms assembled on cell culture plates (blue) or silicon (red) are shown for all NTM. Biofilm total areas were evaluated for 3 days old biofilm. Significant statistical differences were observed for all strains. (*p<0.05)
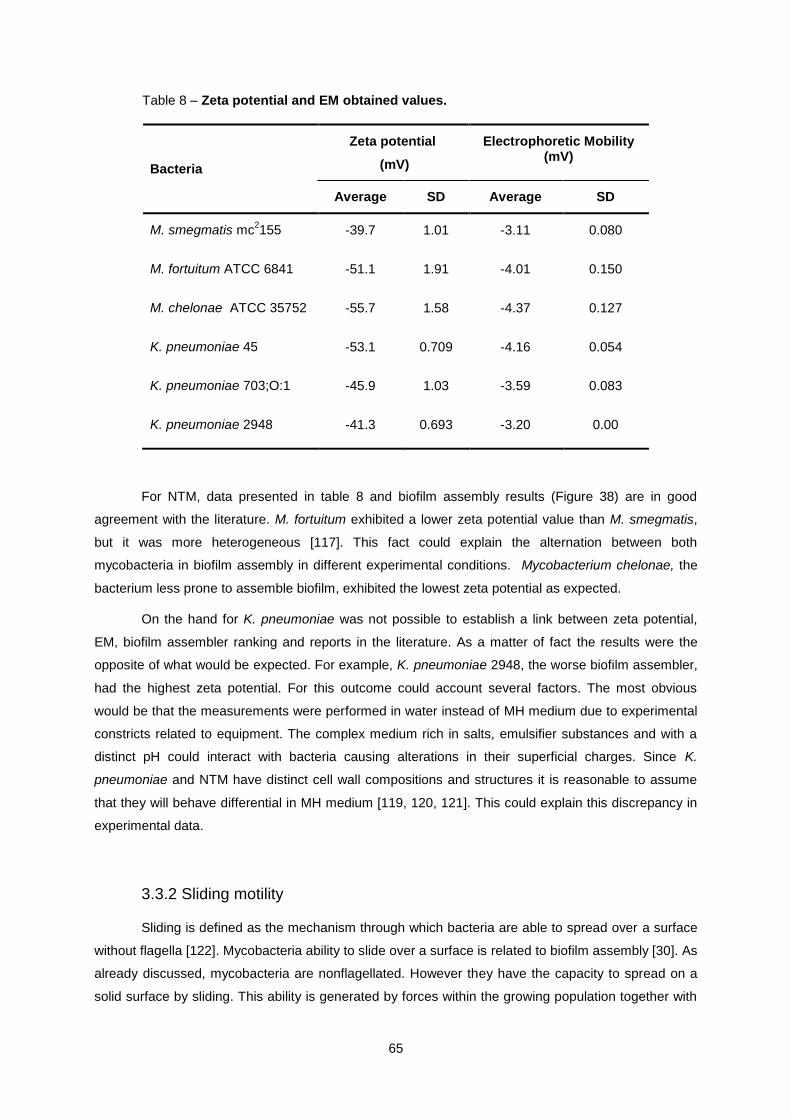
65
Table 8 – Zeta potential and EM obtained values.
Bacteria
Zeta potential
(mV)
Electrophoretic Mobility (mV)
Average SD Average SD
M. smegmatis mc2155 -39.7 1.01 -3.11 0.080
M. fortuitum ATCC 6841 -51.1 1.91 -4.01 0.150
M. chelonae ATCC 35752 -55.7 1.58 -4.37 0.127
K. pneumoniae 45 -53.1 0.709 -4.16 0.054
K. pneumoniae 703;O:1 -45.9 1.03 -3.59 0.083
K. pneumoniae 2948 -41.3 0.693 -3.20 0.00
For NTM, data presented in table 8 and biofilm assembly results (Figure 38) are in good
agreement with the literature. M. fortuitum exhibited a lower zeta potential value than M. smegmatis,
but it was more heterogeneous [117]. This fact could explain the alternation between both
mycobacteria in biofilm assembly in different experimental conditions. Mycobacterium chelonae, the
bacterium less prone to assemble biofilm, exhibited the lowest zeta potential as expected.
On the hand for K. pneumoniae was not possible to establish a link between zeta potential,
EM, biofilm assembler ranking and reports in the literature. As a matter of fact the results were the
opposite of what would be expected. For example, K. pneumoniae 2948, the worse biofilm assembler,
had the highest zeta potential. For this outcome could account several factors. The most obvious
would be that the measurements were performed in water instead of MH medium due to experimental
constricts related to equipment. The complex medium rich in salts, emulsifier substances and with a
distinct pH could interact with bacteria causing alterations in their superficial charges. Since K.
pneumoniae and NTM have distinct cell wall compositions and structures it is reasonable to assume
that they will behave differential in MH medium [119, 120, 121]. This could explain this discrepancy in
experimental data.
3.3.2 Sliding motility
Sliding is defined as the mechanism through which bacteria are able to spread over a surface
without flagella [122]. Mycobacteria ability to slide over a surface is related to biofilm assembly [30]. As
already discussed, mycobacteria are nonflagellated. However they have the capacity to spread on a
solid surface by sliding. This ability is generated by forces within the growing population together with
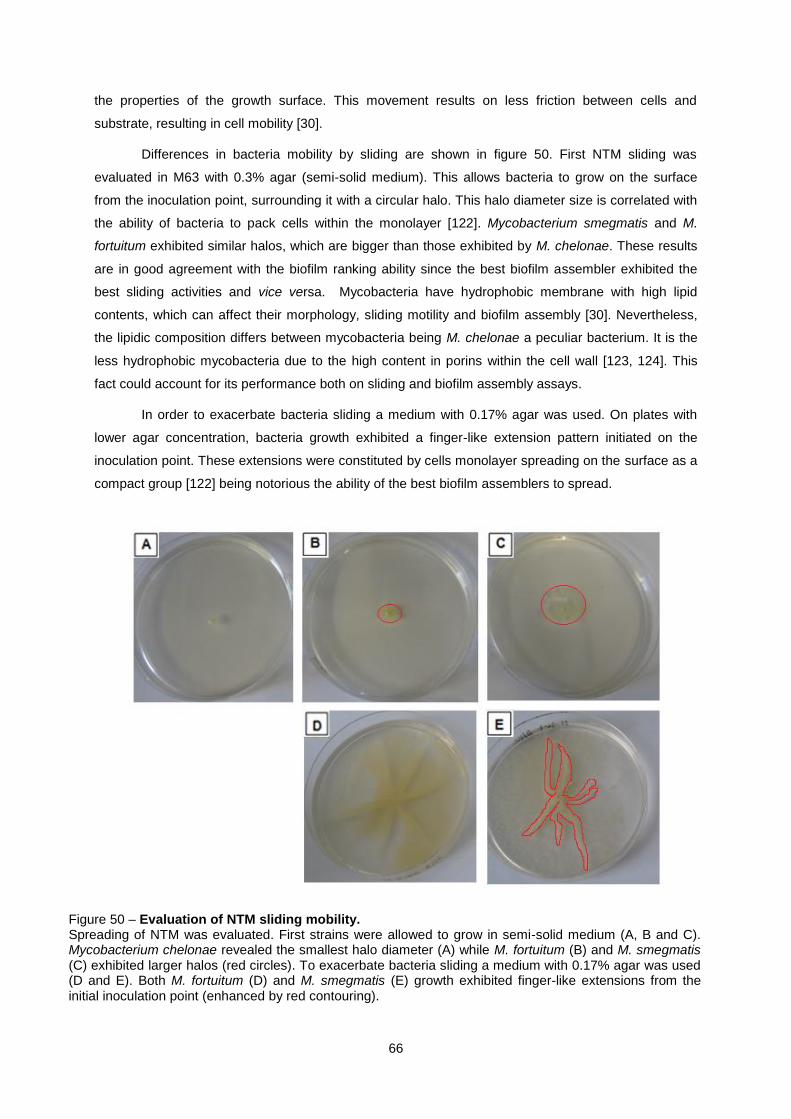
66
the properties of the growth surface. This movement results on less friction between cells and
substrate, resulting in cell mobility [30].
Differences in bacteria mobility by sliding are shown in figure 50. First NTM sliding was
evaluated in M63 with 0.3% agar (semi-solid medium). This allows bacteria to grow on the surface
from the inoculation point, surrounding it with a circular halo. This halo diameter size is correlated with
the ability of bacteria to pack cells within the monolayer [122]. Mycobacterium smegmatis and M.
fortuitum exhibited similar halos, which are bigger than those exhibited by M. chelonae. These results
are in good agreement with the biofilm ranking ability since the best biofilm assembler exhibited the
best sliding activities and vice versa. Mycobacteria have hydrophobic membrane with high lipid
contents, which can affect their morphology, sliding motility and biofilm assembly [30]. Nevertheless,
the lipidic composition differs between mycobacteria being M. chelonae a peculiar bacterium. It is the
less hydrophobic mycobacteria due to the high content in porins within the cell wall [123, 124]. This
fact could account for its performance both on sliding and biofilm assembly assays.
In order to exacerbate bacteria sliding a medium with 0.17% agar was used. On plates with
lower agar concentration, bacteria growth exhibited a finger-like extension pattern initiated on the
inoculation point. These extensions were constituted by cells monolayer spreading on the surface as a
compact group [122] being notorious the ability of the best biofilm assemblers to spread.
Figure 50 – Evaluation of NTM sliding mobility. Spreading of NTM was evaluated. First strains were allowed to grow in semi-solid medium (A, B and C). Mycobacterium chelonae revealed the smallest halo diameter (A) while M. fortuitum (B) and M. smegmatis (C) exhibited larger halos (red circles). To exacerbate bacteria sliding a medium with 0.17% agar was used (D and E). Both M. fortuitum (D) and M. smegmatis (E) growth exhibited finger-like extensions from the initial inoculation point (enhanced by red contouring).

67
Chapter 4
Conclusions and future work

68
4.1 Conclusions
All bacteria tested had the ability to assemble biofilms. Nevertheless, biofilm assembly
followed different kinetics and bacteria exhibited propensity for the different surfaces evaluated. In
general, K. pneumoniae strains had more ability to assemble biofilm on silicon. This explains the high
rates of colonization in catheters and endoscopes. Nontuberculous mycobacteria had more ability to
assemble biofilm on air-liquid interface, being mostly common in water-distribution systems. Klebsiella
pneumoniae 703;O:1 was the bacterium with the best performance among the Gram-negative
bacteria. Two of the three NTM tested M.smegmatis and M.fortuitum, revealed similar ability to
assemble biofilms.
Biofilm assembly was also performed on biotic surfaces. Here biofilm assembly was governed
by factors distinct from abiotic surfaces. The bacteria tropism for host cells is an important factor.
Additionally, bacteria features such as presence / absence of capsule were crucial for bacteria fate.
Bacterial generation time had influence on biofilm assembly, being crucial for bacteria
organization within biofilm. Other factors as membrane charges and sliding properties play a key role
on biofilm assembly ability. For NTM a link between these factors and biofilm assembly was
established. However, for K. pneumoniae this relation could not be achieved. A more detailed study
exploring bacteria properties such as cell wall composition could bring more insights in this issue.
All studied bacteria were susceptible to tested antibiotics in vitro. However, bacteria within
biofilm could enhance their resistance to antibiotics up to 1000-fold as compared with the ones in
planktonic form. Several virulence factors, crucial for increased resistance of microorganisms, have
been identified. Factors within biofilm or intrinsic to bacteria revealed influence on bacteria increased
resistance to antibiotics. These data revealed that a link between biofilm assembly, antibiotic
resistance and spread of HAIs can be established.

69
4.2 Future work
Bacterial adhesion to biotic surfaces revealed evidence of tropism and of being ruled by
factors distinct from abiotic surfaces. More detailed studies in this area should be conducted to confirm
the tropism, e.g., using bladder epithelium cells for K. pneumoniae. The identification of the factors
and the mechanisms involved in biofilm assembly in vivo are an important topic of study that should be
carried out.
The study of a biofilm, assembled on a certain surface, as a living entity using RNA
sequencing could improve our knowledge. This experimental approach might allow the identification of
specific targets on different stages of biofilm assembly. If this targets are drugable new strategies
either to avoid or eradicate biofilms could be developed. Among the strategies to avoid biofilm
assembly would be the development of surface that inhibits bacterial growth. Coatings that function as
inhibitors could also be a solution, for preventing biofilm assembly on medical devices.

70
References
[1] Calfee, D. P. 2012. Crisis in hospital-Acquired healthcare-associated infections. Annual Review of
Medicine. 63: 359-371.
[2] Musau, J. 2013. The impact of healthcare-associated infections disease outbreaks on the nature of
the healthcare professionals daily work. A Thesis Submitted to the School of Graduate Studies in
Partial Fulfilment of the Requirements for the Degree Master of Science (Nursing). McMaster
University, Ontario.
[3] Girard, R., Perraud, M., Pruss, A., Savey, A., Tikhomirov, E., Thuriaux, M. and Vanhems, P. in
Prevention of hospital-acquired infections, A pratical guide, 2nd Edition,
WHO/CDS/CSR/EPH/2002.12. Edited by Ducel, G., Fabry, J. and Nicolle, L. pp. 4-7. World Health
Organization, 2002.
[4] Shetty, N., Tang, J. W., Andrews, J., Aarons, E., Chan, P. K. S., Mack, D., Smith, R., Srivastava, S.
and Wren, M. in Infectious diseases: Pathogenesis, prevention and case studies. Chapter 14. Edited
by Shetty, N., Tang, J. W. and Andrews, J. Wiley-Blackwell, 2009.
[5] Schaberg, D. R., Culver, D. H. and Gaynes, R. P. 1991. Major trends in the microbial etiology of
nosocomial infection. American Journal of Medicine. 91(3B):72S-75S.
[6] Devrajani, B. R., Shah, S. Z., Devrajani, T. and Qureshi, G. A. 2009. Nosocomial infections in
medical ward (four months descriptive study in a tertiary care hospital). World Journal of Medical
Sciences. 4 (1): 13-17
[7] Aitken, C. and Donald, J. J. 2001. Nosocomial spread of viral disease. Clinical Microbiology
Reviews. 14(3): 528-546.
[8] Alangaden, G. J. 2011. Nosocomial fungal infections: epidemology, infection control and
prevention. Infectious Disease Clinical North America. 25: 201–225.
[9] Araújo, E. A., de Andrade, N. J., de Carvalho, A. F., Ramos, A. M., Silva, C. A., da Silva, L.H. M.
2010. Aspectos coloidais da adesão de micro-organismos. Química Nova. 33(9): 1940-1948.
[10] Takeuchi, O., Hoshino, K., Kawai, T., Sanjo, H., Takada, H., Ogawa, T., Takeda, K., Akira, S.
1999. Differential roles of TLR2 and TLR4 in recognition of Gram-negative and Gram-positive bacterial
cell wall components. Immunity. 11(4):443-51.
[11] Taylor, P. 2011. Combating intrinsic antibiotic resistance in Gram-negative. A thesis submitted to
the school of graduate studies on partial fulfillment of the requirements for the degree doctor of
philosophy. McMaster University, Ontario.
[12] Mamo, W. 1989. Physical and biochemical surface properties of Gram-positive bacteria in relation
to adhesion to bovine mammary cells and tissues. Scientific and Technical Review of the Office
International des Epizooties. 8 (1): 163-176.

71
[13] Recth, J. and Kolter, R. 2001. Glycopeptidolipd acetylation affects sliding motility and biofilm
formation in Mycobacterium smegmatis. Journal of Bacteriology. 183(19):5718-24.
[14] Sarathy, J. P., Dartois, V. and Lee, E., J., D. 2012. The role of transport mechanisms in
Mycobacterium tuberculosis drug resistance and tolerance. Pharmaceuticals. 5: 1210-1235.
[15] Brennan, P. J. 2003. Structure, function, and biogenisis of the cell wall of Mycobacterium
tuberculosis. Tuberculosis. 83(1-3):91-7.
[16] O’Brien, T., Simonsen, L., Taber, H., Tomasz, A., Wenzel, R., Townsend, C. and A
Zasloff, M. in Impacts of Antibiotic-Resistant Bacteria. Edited by Herdman, R. R. OTA-H-629,
Washington, DC: U.S. Government Printing Office, 1995.
[17] Moreira, V. C. and Freire, D. Klebsiella pneumoniae e sua resistência a antibióticos in Mostra de
Produção Científica da Pós-Graduação Latu-Sensu da Puc De Goiás, 6. Goiás, 2011.
[18] Podschum, R. and Ullmann, U. 1998. Klebsiella spp. As nosocomial phathogens: epidemiology,
taxonomy, typing methods, and pathogenicity factors. Clinical Microbiology Reviews. 11: 589-603.
[19] Favre-Bonte, S., Joly, B. and Forestier, C. 1999. Consequences of reduction of Klebsiella
pneumoniae capsule expression on interactions of this bacterium with epithelial cells. Infection and
Immunity. 67(2): 554-56.
[20] Abedon, S. T. 1998. Supplemental Lecture in (http://www.mansfield.ohio-
state.edu/~sabedon/biol1080.htm)
[21] Röse, L. 1974. Role of undecaprenyl phosphokinase in mycobacteria: impact on biofilm assembly,
growth properties, persistence, and virulence. Dissertation. Geesthacht.
[22] De Groote, M. A. and Huitt, G. 2006. Infections due to rapidly growing mycobacteria. Clinical
Infectious Diseases. 15;42(12): 1756-63.
[23] Hatzenbuehler, L. A. and Starke, J. R. 2014. Common presentations of Nontuberculous
mycobacteria infections. The Pediatric Infections Disease Journal. 33(1): 89-91.
[24] Philips, M. S. and von Reyn, C. F. 2001. Nosocomial infections due to nontuberculous
mycobacteria, Clinical Infectious Diseases. 15;33(8): 1363-74.
[25] Portaels, F. 1995. Epidemiology of mycobacterial diseases. Clinics in Dermatology. 13(3): 207-
222
[26] Pang, J. M., Layre, E., Sweet, L., Sherrid, A., Moody, D. B., Ojha, A. and Sherman, D. R. 2011.
The Polyketide Pks1 contributes to biofilm formation in Mycobacterium tuberculosis. Journal of
Bacteriology. 194(3): 715-21.
[27] Bordi, C and de Bentzmann, S. 2011. Hacking into bacterial biofilms: a new therapeutic challenge.
Annual Intensive Care.1(1): 19.
[28] Cortés, M. E., Bonilla, J. C. and Sinisterra, R. D. Biofilm formation, control and novel strategies for
eradication in Science against microbial pathogens: communicating current research and technologies

72
advances. Edited by Méndez-Vilas, A. pp. 896-905. Formatex, 2011.
[29] Trinidad, A., Ibáñez, A., Gómez, D., Carcía-Berrocal, J. R. and Ramiréz-Camacho, R. Application
of environmental scanning electron microscopy for study of biofilms in medical devices in Microscopy:
Science, Technology, Applications and Education. Edited by Méndez-Vilas, A and J. Díaz. pp. 204-
210. Formatex, 2010.
[30] Shi, T., Fu, T., Xie, J. 2011. Polyphospate deficiency affects the sliding motility and biofilm
formation of Mycobacterium smegmatis. Current Microbiology. 63(5): 470-6.
[31] Simões, L. C., Simões, M. and Vieira, M. J. 2010. Adhesion and biofilm formation on polystyrene
by drinking water-isolated bacteria. Antonie Van Leeuwenhoek. 98(3): 317-29.
[32] O’Toole, G., Kaplan, H. B. and Kolter, R. 2000. Biofilm formation as microbial development.
Annual Review of Microbiology. 54: 49-79.
[33] Monroe, D. 2007. Looking for chinks in the armor of bacterial biofilms. PLOS Biology. 5(11): e307.
[34] Proft, T. and Baker, E. N. 2009. Pili in Gram-negative and Gram-positive bacteria – structure,
assembly and their role in disease. Cellular and Molecular Life Sciences. 66(4): 613-35.
[35] Davey, M. E. and O’Toole, G. A. 2000. Microbial Biofilms: from ecology to molecular genetics.
Microbiology and molecular biology reviews. 64(4): 847-867.
[36] Abed, S. E., Ibnsouda, S. K., Latrache, H. and Hamadi, F. Scanning Electron Microscopy (SEM)
and environmental SEM: Suitable tools for study of adhesion stage and biofilm formation in Scanning
Electron Microscopy. Edited by Kazmiruk, V. InTech, 2012.
[37] Hoiby, N., Bjarnsholt, T., Givskov, M., Molin, S. and Ciofu, O. 2010. Antibiotic resistance of
bacterial biofilms, International Journal of Antimicrobial Agents. 35 (4): 322-332.
[38] Niveditha, S., Pramodhini, S., Umadevi, S., Kumar, S. and Stephen, S. 2012. The Isolation and
the biofilm assembly of urophatogens in the patients with catheter associated urinary tract infections
(UTIs). Journal of Clinical and Diagnostic Research. 6(9): 1478-1482.
[39] Mulcahy, L. R., Isabella, V. M., and Lewis, K. 2013. Psedomonas aeruginosa biofilms in disease.
Microbial Ecology.
[40] Donlan, R. M. 2010. Biofilms and device-associated infections. Emerging Infectious Diseases
Journal. 7(2): 277–281.
[41] Peleg, A. Y., and Hooper, D. C. 2010. Hospital-acquired infections due to Gram-negative bacteria.
The New England Journal of Medicine. 362(19):1804-13.
[42] Inglis, T. J., Millar, M. R., Jones, J. G. and Robinson, D. A. 1989. Tracheal tube biofilm as a
source of bacterial colonization of the lung. Journal of Clinical Microbiology. 27(9): 2014-8.
[43] Adair, C. G, Gorman, S. P, Feron, B. M., Byers, L. M.,Jones, D. S., Goldsmith, C. E., Moore, J. E.,
Kerr, J. R., Curran, M. D., Hogg, G., Webb, C. H., McCarthy, G. J. and Milligan, K. R. 1999.
Implications on endotracheal tube biofilm for ventilator-associated pneumonia. Intensive Care
73
Medicine. 25(10): 1072-6.
[44] Bauer, T. T., Torres, A., Ferrer, R., Heyer, C. M., Schultze-Werninghaus, G. and Rasche, K. 2002.
Biofilm assembly in endotracheal tubes. Association between pneumonia and the persistence of
pathogens. Monaldi Archives for Chest Disease. 57(1): 84-7.
[45] Darouiche, R. O. 2001. Device-associated infections: a macroproblem that starts with
microadherence. Clinical Infectious Diseases. 33(9): 1567-72.
[46] Hoiby, N., Ciofu, O., Johansen, H. K., Song, Z. J., Moser, C., Jensen, P. O., Molin, S., Givskov,
M., Tolker-Nielsen, T. and Bjarnshotl, T. 2011. The clinical impact of bacterial biofilms. International
Journal of Oral Science. 3(2): 55-65.
[47] Wecke, J., Kersten, T., Madela, K., Moter, A., Gobel, U. B., Friedmann, A. and Bernimoulin, J.
2000. A novel technique for monitoring the development of bacterial biofilms in human periodontal
pockets. FEMS Microbiology Letters. 191(1): 95-101.
[48] Socransky S. S. and Haffajee A. D. 1991. Microbial mechanisms in the pathogenesis of
destructive periodontal diseases: a critical assessment. Journal of Periodontal Research. 26(3 Pt 2):
195-212.
[49] Song, Z., Borgwardt, L., Hoiby, N., Wu, H., Sorensen, T. S. and Borgwardt, A. 2013. Prosthetic
infections after orthopedic joint replacement: the possible role of bacterial biofilms. Orthopedic
Reviews. 5(2): e14.
[50] Sousa J., Cerqueira F. and Abreu C. in Microbiologia Protocolos Laboratoriais. Edições
Universidade Fernando Pessoa,Porto, 2006.
[51] Derderian, S. L. 2007. Alexander Fleming Miraculous Discovery of Penicillin. Rivier Academic
Journal. (3)2: 1-5.
[52] Chamlagain, B. S. 2010. Characterization of antibiotic-resistant psychrotrophic bacteria in raw
milk. A thesis to obtain the master degree on food sciences. University of Helsinki, Helsinki.
[53] Levy, S. B. and Marshall, B. 2004. Antibacterial resistance worldwide: Causes, challenges and
responses. Nature Medicine. 10(12): S122-9.
[54] Castañeda-García, A., Blázquez, J. and Rodríguez-Rojas, A. 2013. Molecular mechanisms and
clinical impact of acquired and intrinsic fosfomycin resistance. Antibiotics. 2(2): 217-236.
[55] Kadurugamuwa, J. L., Clarke, A. J. and Beveridge, T. J. 1993. Surface action of gentamicin on
Pseudomonas aeruginosa. Journal of Bacteriology. 175(18): 5798–5805.
[56] Hammes, W. P and Neuhaus, F. C. 1974. On the mechanism of action of vancomycin: inhibition
of peptidoglycan synthesis in Gaffkya homari, Antimicrobial Agents and Chemotherapy. 6(6): 722-8.
[57] Mah, E. F. and O’Toole, G. A. 2001. Mechanisms of biofilm resistance to antimicrobial agents.
Trends in Microbiology. 9(1): 34-9.
[58] Teng, R. and Dick, T. 2003. Isoniazid resistance of exponentially growing Mycobacterium
smegmatis biofilm culture. FEMS Microbiology Letters. 227(2): 171-174.

74
[59] Anderl, J.N., Franklin, M. J. and Stewart, P. S. 2000. Role of antibiotic penetration limitation in
Klebsiella pneumoniae biofilm resistance to ampicillin and ciprofloxacin. Antimicrobial Agents and
Chemotherapy. 44: 1818–1824.
[60] Helt, C. 2012. Occurrence, fate, and mobility of antibiotic resistant bacteria and antibiotic
resistance genes among microbial communities exposed to alternative wastewater treatment systems.
A thesis presented to the University of Waterloo in fulfillment of the thesis requirement for the degree
of doctor of philosophy in biology. University of Waterloo, Waterloo, Ontario, Canada.
[61] Ito, A., Taniuchi, A., May, T., Kawata, K. and Okabe, S. 2009. Increased antibiotic resistance of
Escherichia coli in mature biofilms. Applied and Environmental Microbiology. 75(12): 4093-100.
[62] Stewart, P. S. and Costerton, J. W. 2001. Antibiotic resistance of bacteria in biofilms, The Lancet.
358(9276): 135-8.
[63] Corona, F. and Martinez, J. L. 2013. Phenotypic Resistance to Antibiotics. Antibiotics. 2(2): 237-
255.
[64] Sousa, A. M. and Machado, I. Phenotypic switching: an opportunity to bacteria thrive in Science
against microbial pathogens: communicating current research and technological advances. Edited by
Mendéz-Vilas, A. pp. 252-262. Formatex, 2011.
[65] Voutou, B. and Stefanaki, E. 2008. Electron microscopy: The basis. Lecture from Physics of
Advanced Materials Winter School, January 14-18, Thessalonoki, Greece.
[66] Nguyen, T., Roddick F. A. & Fan, L. 2012. Biofouling of water treatment membranes: a review of
the underlying causes, monitoring techniques and control measures. Membranes. 2(4): 804-840.
[67] Adamski, Z., Rybska, E. and Bloszyk, J. Pros and cons of scanning electron microscopy as a
research method in acarology in Current microscopy contributions to advances in science and
technology. Edited by Méndez-Vilas, A. pp. 215-221. Formatex, 2012.
[68] Bettencourt, P., Pires, D., Carmo, N. and Anes, E. 2010. Application of confocal microscopy for
quantification of intracellular mycobacteria in macrophages in Microscopy: Science, Technology,
Applications and Education. Edited by Méndez-Vilas, A. and J. Díaz. pp. 614-621. Formatex, Basajoz,
2010.
[69] Todar, K. 2012. Todar’s Online Textbook of Bacteriology. Online lecture
(http://textbookofbacteriology.net/growth_3.html)
[70] Stepanovic S., Vukovic D., Dakic I., Savic B. and Svabic-Vlahovic M., 2000, A modified microtiter-
plate test for quantification of staphylococcal biofilm formation. Journal of Microbiological Methods. 40:
175-9.
[71] Agarwal, R. K.,Singh, S. Bhilegaonkar, K. N and Singh, V. P. 2011. Optimization of microtitre
plate assay for the testing of biofilm formation ability in different Salmonella serotypes. International
Journal of Food Research. 8(4): 1493-1498.
[72] (http://www.malvernstore.com/cnb/shop/malvern?productID=11&op=catalogue-product_info-
75
null&prodCategoryID=7)
[73] Singh, V. Keshab, T. and Chauhan, P. K. 2012. Effect of poly herbal formulation against Klebsiella
pneumoniae causing pneumonia in children’s. Asian Journal of Pharmaceutical and Clinical Research.
5(1): 69-75.
[74] Ingraham, J.L.; Maaløe, O.; Neidhardt, F.C. in Growth of the Bacterial Cell. Edited by Sinauer
Associates, p. 127-132, Sunderland, 1983.
[75] Bacun-Druzina, V., Butorac, A., Mrvcic, J., Dragicevic, T. B. and Sthelik-Thomas, V. 2011.
Bacterial stationary-phase evolution. Food Technology and Biotechnology. 49 (1): 13-23.
[76] Hossain, S. M. and Anantharaman, N. 2006. Studies on bacterial growth and lead (IV) biosorption
using Bacillus subtilis. Indian Journal of Chemical Technology. 13: 591-596.
[77] Olson, M. E. Ceri, H., Morck, D. W., Buret, A. G. and Read, R. R. 2002. Biofilm bacteria: formation
and comparative susceptibility to antibiotics. Canadian Journal of Veterinary Research. 66(2): 86-92.
[78] Stock, I. and Wiedemann B. 2001. Natural antibiotic susceptibility of Klebsiella pneumoniae, K.
oxytoca, K. planticola, K. ornithinolytica and K. terrigena strains. Journal of Medical Microbiology.
50(5): 396-406.
[79] Pérez-Moreno, M.O., Centelles-Serrano, M. J., Cortell-Ortolá, M., Fort-Gallifa, I., Ruiz, J., Llovet-
Lombarte, M. I., Picó-Plana, E. and Jardí-Baiges, A. M. 2011. Molecular epidemiology and resistance
mechanisms involved in reduced susceptibility to amoxicillin/clavulanic acid in Klebsiella pneumoniae
isolates from a chronic care centre. International Journal of Antimicrobial Agents. 37(5): 462-6.
[80] Díaz P.Q., Bello, H., Domínguez, M. Trabal, N., Mella, S., Xemelman, R. And Gonzaléz, G. 2004.
Resistance to gentamicin, amikacin and ciprofloxacin among nosocomial isolates of Klebsiella
pneumoniae subspecie pneumoniae producing extended spectrum β-lactamases. Revista Médica de
Chile. 132(10): 1173-1178.
[81] Gilbert, P., Collier, P. J. and Brown, M. R. 1990. Influence of growth rate on susceptibility to
antimicrobial agents: biofilms, cell cycle, dormancy and stringent response. Antimicrobial Agents and
Chemotherapy. 34(10): 1865–1868.
[82] Watnick, P.and Kolter, R. 2000. Biofilm, city of microbes. Journal of Bacteriology. 182(10): 2675-
9.
[83] Stewart, P. S. 1994. Biofilm accumulation model that predicts antibiotic resistance of
Pseudomonas aeruginosa biofilms. Antimicrobial Agents and Chemotherapy. 38(5): 1052–1058.
[84] Donlan, R. M. 2002. Biofilms: microbial life on surfaces. Emerging Infectious Diseases Journal.
8(9): 881-90.
[85] Heilmann, C. and Gotz, F. Cell-cell communication in biofilm formation in Gram-positive bacteria.
Bacteria signaling. Edited by Kramer, E. and Jung, K. Wiley-VCH, Weinheim, 2010.
[86] Koczan, J. M., Lenneman, B. R., McGrath, M. J. and Sundin, G. W. 2011. Cell surface attachment
structures contribute to biofilm formation and xylem colonization by Erwinia amylovora. Applied and

76
Environmental Microbiology. 77(19): 7031-7039.
[87] Hall-Stoodley, L., Keevil, C. W. and Lappin-Scott, H. M. 1998. Mycobacterium fortuitum and
Mycobacterium chelonae biofilm formsation under high and low nutrient conditions. Journal of Applied
Microbiology. 85(1): 60S-69S.
[88] Kolari, M. 2003. Attachment mechanisms and properties of bacterial biofilms on non-living
surfaces. Academic dissertation in microbiology. Department of Applied Chemistry and Microbiology.
University of Helsinki, Finland.
[89] Jefferson, K. K. 2004. What drives bacteria to produce a biofilm?. FEMS Microbiology Letters.
236(2): 163-73.
[90] Kaplan, J. B. 2010. Biofilm dispersal: mechanisms, clinical implications, and potential therapeutic
uses. Journal of Dental Research. 89(3): 205-218.
[91] Davies, D. G. Biofilm Dispersion in Biofilm Highlights. Edited by Flemming, H-C., Wingender, J.
and Szewzyk, J. Springer, 2001.
[92] Hancock, V., Witso, I. L. and Klemm, P. 2011. Biofilm formation as a function of adhesin, growth
medium, substratum and strain type. International Journal of Medical Microbiology. 301(7): 570-6.
[93] Abee, T., Kovács, A. T., Kuipers, O. P. and van der Veen, S. 2011. Biofilm formation and
dispersal in Gram-positive bacteria. Current Opinion in Biotechnology. 22(2): 172-9.
[94] Percival, S. L., Knapp, J. S., Edyvean, R. G. K. and Wales, D. S. 1998. Biofilms, mains water and
stainless steel. Water Research. 32(7): 2187-2201.
[95] Bendinger, B., Rijnaarts, H. H. M., Altendorf, K. and Zehnder, A. J. B. 1993. Physicochemical cell
surface and adhesive properties of coryneform bacteria related to the presence and chain length of
mycolic acids. Applied and Environmental Microbiology. 59: 3973-77.
[96] Favre-Bonte, S., Darfeuille-Michaud, A. and Forestier, C. 1995. Aggregative adherence of
Klebsiella pneumoniae to humam intestine-407 cells. Infection and Immunity. 63(4): 1318-28.
[97] Kline, K. A., Falker, S., Dahlberg, S., Normark, S. and Henriques-Normark, B. 2009. Bacterial
adhesins in host-microbe infections. Cell Host & Microbe. 5(6): 580-592.
[98] Roberts, J. A. 1996. Tropism in bacterial infections:urinary tract infections. Journal of Urology.
156(5): 1552-9.
[99] Casadevall, A. and Pirofski, L. 2001. Host-pathogen interactions: the attributes of virulence. The
Journal of Infectious Diseases. 184(3): 337-44.
[100] Medzhitov, R. 2007. Recognition of microorganisms and activation of the immune response.
Nature. 449(7164): 819-26.
[101] Monack, D. M., Mueller, A. and Falkow, S. 2004. Persistent bacterial infections: the interface of
the pathogen and the host immune system. Nature Reviews Microbiology. 2(9): 747-65.
[102] Peterson, J. W. Bacterial Pathogenesis in Medical Microbiology. Edited by Baron, S. Chapter 7.
77
Copyright, Galveston, 1996.
[103] Mandlik, A., Swierczynske, A., Das, A. and Ton-That, H. 2007. Pili in Gram-positive bacteria:
assembly, involvement in colonization and biofilm development. Trends in Microbiology. 16(1): 33–40.
[104] Gayathri, R., Therese, K. L., Deepa, P., Mandai, S. and Madhavan, H. N. 2010. Antibiotic
susceptibility pattern of rapidly growing mycobacteria. Journal of Postgraduate Medicine. 56(2): 76-8.
[105] Swenson, J. M., Wallace, R. J., Silcox, V. A. and Thornsberry, C. 1985. Antimicrobial
susceptibility of five subgroups of Mycobacterium fortuitum and Mycobacterium chelonae.
Antimicrobial Agents and Chemotherapy. 28(6): 807.
[106] Aubry, A., Chosidow, O., Caumes, E., Robert, J. and Cambau, E. 2002. Sixty-three cases of
Mycbacterium marinum infection: clinical features, treatment, and antibiotic susceptibility of causative
isolates. Archieves of Internal Medicine. 162(15): 1746-52.
[107] Aubry, A., Jarlier, V., Escolano, S., Truffot-Pernot, C. and Cambau, E. 2000. Antibiotic
susceptibility pattern of Mycobacterium marinum. Antimicrobial Agents and Chemotherapy. 44(11):
3133-3136.
[108] Swenson, J. M., Thornsberry, C. and Silcox, V. A. 1982. Rapidly growing mycobacteria: testing
of susceptibility to 34 antimicrobial agents by broth microdilution. Antimicrobial Agents and
Chemotheraphy. 22(2): 186-92.
[109] Woods, G. L. 2000. Susceptibility testing for mycobacteria. Clinical Infectious Diseases. 31(5):
1209-1215.
[110] Greendyke, R. and Byrd, T. F. 2008. Differential antibiotic susceptibility of Mycobacterium
abscessus variants in biofilms and macrophages compared to that of planktonic bacteria. Antimicrobial
Agents and Chemotheraphy. 52(6): 2019-26.
[111] Silva, C., Perdigao, J., Alverca, E., de Matos, A. P., Carvalho, P. A., Portugal, I. and Jordão, L.
2013. Exploring the Contribuition of Mycobacteria Characteristics in Their Interaction with Humam
Macrophages. Microscopy and Microanalysis. 19(5): 1159-69.
[112] Khoo, B. and Gulati, P. 2013. Developing and mature biofilms produced by Mycobacterium
smegmatis. American Society for Microbiology.
[113] Ojha, A. and Hatfull, G. F. 2007. The role of iron in Mycobacterium smegmatis biofilm formation:
the exochelin siderophores is essential in limiting iron conditions for biofilm formation but not for
planktonic growth. Molecular microbiology. 66(2): 468-483.
[114] Spiers, A. J., Bohannon, J., Gehrig, S. M. and Rainey, P. B. 2003. Biofilm formation at the air-
liquid interface by the Pseudomonas fluorescens SBW25 wrinkly spreader requires an acetylated
forms of cellulose. Molecular Microbiology. 50(1): 15-27.
[115] Scher, K., Romling, U. and Yaron, S. 2005. Effect of heat, acidification, and chlorination on
Salmonella enterica serovar typhimurium cells in a biofilm formed at the air-liquid interface. Applied
and Environmental Microbiology. 71(3): 1163-8.
78
[116] Borges, M. T., Nascimento, A. G., Rocha, U. N. and Tótola, M. R. 2008. Nitrogen starvation
affects bacterial adhesion to soil. Brazilian Journal of Microbiology. 39: 457-463
[117] Tariq, M., Bruijs, C., Kok, J. and Krom, B. P. 2012. Link between culture zeta potential
homogeneity and Ebp in Enterococcus faecalis. Applied and Environmental Microbiology. 78(7):
2282–2288.
[118] Pang, C. M., Hong, P., Guo, H. and Liu, W. T. 2005. Biofilm formation characteristics of bacterial
isolates retrieved from a reverse osmosis membrane. Environmental Science and Technology. 39(19):
7541-50.
[119] Carlsson, S. 2012. Surface characterization of Gram-negative bacteria and their vesicles,
Degree Thesis in Chemistry. Umea University, Sweden.
[120] Weidenmaier, C. and Peschel, A. 2008. Teichoic acids and related cell-wall glycopolymers in
Gram-positive physiology and host interactions. Nature Reviews Microbiology. 6(4): 276-87.
[121] Schleifer, K. H. and Kandler, O. 1972. Peptidoglycan types of bacterial cell walls and their
taxonomic implications. Bacteriology Reviews. 36(4): 407-77.
[122] Martinéz, A., Torello, S. and Kolter, R. 1999. Sliding motility in mycobacteria. Journal of
Bacteriology. 181(23): 7331–7338.
[123] van Houdt, R., Aertsen, A., Jansen, A. Quintana, A. L. and Michiels, C. W. 2004. Biofilm
formation and cell-to-cell signaling in Gram-negative bacteria isolated from a food processing
environment. Journal of Appliel Microbiology. 96(1):177-84.
[124] Nikaido, H., Kim, S. and Rosenberg, E. Y. 1993. Physical organization of lipids in the cell wall of
Mycobacterium chelonae. Molecular Microbiology. 8(6): 1025-1030.