HOSPITAL ACQUIRED INFECTIONS AND...
40
‐ 1 of 2 ‐ Healthcare Quality Reporting Program HOSPITAL‐ACQUIRED INFECTIONS AND PREVENTION ADVISORY SUBCOMMITTEE 8:00‐9:00am, 4/16/2012 at Healthcentric Advisors Goals/Objectives To discuss HAI work to date and make policy recommendations for pending and upcoming reports Members Nicole Alexander, MD Linda McDonald, RN Georgette Uttley, MEd, BSN, RN Rosa Baier, MPH Leonard Mermel, DO, ScM Nancy Vallande, MSM, MT, CIC Utpala Bandy, MD Pat Mastors Cindy Vanner Marlene Fishman, MPH, CIC Robin Neale, MT (ASCP), SM,CIC Margaret Vigorito, MS, RN Yongwen Jiang Kathleen O’Connell, RN,BSN,CIC Samara Viner‐Brown, MS Julie Jefferson, RN, MPH, CIC Lee Ann Quinn, RN, BS, CIC Maureen Marsella, RN, BS Janet Robinson, RN, Med, CIC Time Topic/Notes 8:00am Welcome & Administrative Updates Leonard Mermel, DO, ScM Samara Viner‐Brown, MS - Today’s objectives - Previous meeting’s action items: Distribute hand hygiene 5‐day preview report (Margaret) Ask Dr. Fine about discussing PCR testing with the hospital CEOs (Sam) Confirm the date for Dr. Fine’s HARI presentation (Rosa) Draft advisory letter for the Rules and Regulations (Rosa/Len) Comment on the advisory letter (Subcommittee) 8:15am Reporting Topics Leonard Mermel, DO, ScM Rosa Baier, MPH - C. Difficile methodology update - MDR‐GNB (ESBL & CPE‐producing Gram negative bacilli) issues: Microbiology lab director survey Next steps - Rhode Island HAI Plan: Review previous version Update
Transcript of HOSPITAL ACQUIRED INFECTIONS AND...

‐ 1 of 2 ‐
Healthcare Quality Reporting Program
HOSPITAL‐ACQUIRED INFECTIONS AND PREVENTION ADVISORY SUBCOMMITTEE
8:00‐9:00am, 4/16/2012 at Healthcentric Advisors
Goals/Objectives
To discuss HAI work to date and make policy recommendations for pending and upcoming reports
Members
Nicole Alexander, MD Linda McDonald, RN Georgette Uttley, MEd, BSN, RN
Rosa Baier, MPH Leonard Mermel, DO, ScM Nancy Vallande, MSM, MT, CIC
Utpala Bandy, MD Pat Mastors Cindy Vanner
Marlene Fishman, MPH, CIC Robin Neale, MT (ASCP), SM,CIC Margaret Vigorito, MS, RN
Yongwen Jiang Kathleen O’Connell, RN,BSN,CIC Samara Viner‐Brown, MS
Julie Jefferson, RN, MPH, CIC Lee Ann Quinn, RN, BS, CIC
Maureen Marsella, RN, BS Janet Robinson, RN, Med, CIC
Time Topic/Notes
8:00am Welcome & Administrative Updates Leonard Mermel, DO, ScM Samara Viner‐Brown, MS
- Today’s objectives
- Previous meeting’s action items:
Distribute hand hygiene 5‐day preview report (Margaret)
Ask Dr. Fine about discussing PCR testing with the hospital CEOs (Sam)
Confirm the date for Dr. Fine’s HARI presentation (Rosa)
Draft advisory letter for the Rules and Regulations (Rosa/Len)
Comment on the advisory letter (Subcommittee)
8:15am Reporting Topics Leonard Mermel, DO, ScM Rosa Baier, MPH
- C. Difficile methodology update
- MDR‐GNB (ESBL & CPE‐producing Gram negative bacilli) issues:
Microbiology lab director survey
Next steps
- Rhode Island HAI Plan:
Review previous version
Update

‐ 2 of 2 ‐
8:55am Open Forum & Action Items Rosa Baier, MPH
- Action items
- Next meeting: 5/21/12 at Healthcentric Advisors

Last updated 03/20/2012 1 Center for Health Data and Analysis
Healthcare Quality Reports
HOSPITAL HAND HYGIENE
Data Report, March 2012
Clean hands are the most important strategy to prevent germs from spreading in hospital. As a result, how hospital healthcare workers clean their hands—their “hand hygiene”—is an important part of how the hospital controls infections. Hospitals’ hand hygiene processes are reported on the Department of Health’s (HEALTH’s) Web site as part of the Department’s hospital reporting work. You can learn more about these measures—including what each measure means, how it is calculated, and why this information is important—by reading the Technical Page. With questions about a hospital’s performance, please contact the hospital directly by clicking on each hospital’s name.
Hospital (Alphabetical)
Hand Hygiene & Glove Use Education Provided*
Hand Hygiene Measured
Hand Hygiene Reported
(Yes/No)
Eleanor Slater Hospital Yes Yes Yes
Kent County Memorial Hospital Yes Yes Yes
Landmark Medical Center Yes Yes Yes
Memorial Hospital Yes Yes Yes
Miriam Hospital Yes Yes Yes
Newport Hospital Yes Yes Yes
Our Lady of Fatima Hospital Yes Yes Yes
Rhode Island Hospital Yes Yes Yes
Roger Williams Medical Center Yes Yes Yes
South County Hospital Yes Yes Yes
Westerly Hospital Yes No No
Women & Infants’ Hospital Yes Yes Yes
* Hand hygiene and glove use educational program in place
Hand hygiene compliance measured through direct observation, collected at least once every three months (quarterly)
Hand hygiene compliance measured through direct observation, collected at least once every three months (quarterly), with feedback provided to credentialed staff, the Chief Executive Officer, and Executive Leadership

Last updated 2/22/11 1 Center for Health Data and Analysis
Healthcare Quality Reports
HOSPITAL HAND HYGIENE
Technical Page
The hand hygiene compliance measures are reported on the Department of Health’s (HEALTH’s) Web site as part of the HCQP Program’s Hospital-Acquired Infections work. This information provides additional details about the measures, including their data source, how they are calculated, and why each is important.
Measure Information
Topic Why is this information important? 1. Hand hygiene & glove
use education provided
Clean hands are the single most important strategy to prevent germs from spreading in hospitals. Making sure that staff know hand hygiene—how to clean their hands with an alcohol-based product or soap and water—and how to use gloves is important.
2. Hand hygiene measured Going to different parts of the hospital (wards, clinics, etc.) to see if staff are actually cleaning their hands properly before and after caring for patients is important. This information helps hospitals know how often staff are cleaning their hands properly. They can then use this information to improve hand hygiene compliance, and help to prevent the spread of germs.
3. Hand hygiene reported
It is important for hospitals to use the information they collect about how staff are cleaning their hands to provide feedback. This feedback should include the staff who were observed and also the hospital administration. This tells the hospital if their staff are doing a good job or need to improve.
These measures are process measures. Process measures look at how hospitals work. The goal is for every hospital to have a ‘Yes’ for all three measures.
Definitions
Key Term/Phrase Definition
Credentialed staff and licensed independent practitioners (LIPs)
Healthcare workers engaged in direct patient contact, including: - Physician assistants (PAs) - Nurse practitioners (NPs) - Physicians (MDs and DOs)
Includes clinicians who are hospital employees and also those who are not hospital employees.
Direct patient contact Any face-to-face interaction with patients.
Executive leadership High-level hospital administrative staff who run the hospital, including people such as the president and vice president, chief executive officer (CEO), chief financial officer (CFO), chief medical officer (CMO), chief nursing officer (CNO), chief operating officer (COO), and others.
Hand hygiene A general term that applies to cleaning hands with soap and water or using an antiseptic (e.g., alcohol) hand rub, gel, or foam (i.e., hand sanitizer).

HCQP Program Hand Hygiene Compliance – Technical Page
Last updated 2/22/11 2 Center for Health Data and Analysis
Key Term/Phrase Definition
Measuring hand hygiene The act of collecting data on hand hygiene compliance by collecting data, for example by observing staff.
Monitoring hand hygiene The act of using collected data to look at how a hospital’s compliance rate changes over time (e.g., looking at trends).
May be part of a program or quality improvement initiative to improve the hospital’s hand hygiene compliance.
Physicians Includes both Medical Doctors (MDs) and Doctors of Osteopathy (DOs).
Includes physicians who are hospital employees (e.g., hospitalists) and also those who are not hospital employees, but have direct patient contact with patients at the hospital.
Program to improve rates A team of staff, usually with different types of experience, who meet regularly to review data, identify improvement opportunities, and implement projects to improve the hospital’s performance.
Data Source
The hand hygiene compliance measures are calculated based on information collected each year from hospitals in Rhode Island. Hospitals answer the following questions:
1. Does your hospital have an educational program regarding the following? (Select all that apply.)
Principles of hand hygiene
Proper glove use
2. Does your hospital measure hand hygiene compliance on a regular basis?
No (Stop)
Yes
a. How does your hospital measure hand hygiene compliance?
By measuring the volume of hand cleansing agent (e.g., hand sanitizer)
Through direct observation
Other (please specify): ____________________________________________________
b. How often does your hospital collect hand hygiene compliance data?
Every quarter (3 months)
Monthly
Weekly
Daily
Other (please specify): ____________________________________________________
3. Does your hospital have an ongoing program to improve hand hygiene compliance rates?
No
Yes
4. Does your hospital provide feedback regarding hand hygiene compliance to the following? (Select all that apply.)
Credentialed staff and licensed independent practitioners (LIPs)
Chief Executive Officer (CEO)
HCQP Program Hand Hygiene Compliance – Technical Page
Last updated 2/22/11 3 Center for Health Data and Analysis
Executive Leadership
None of the above
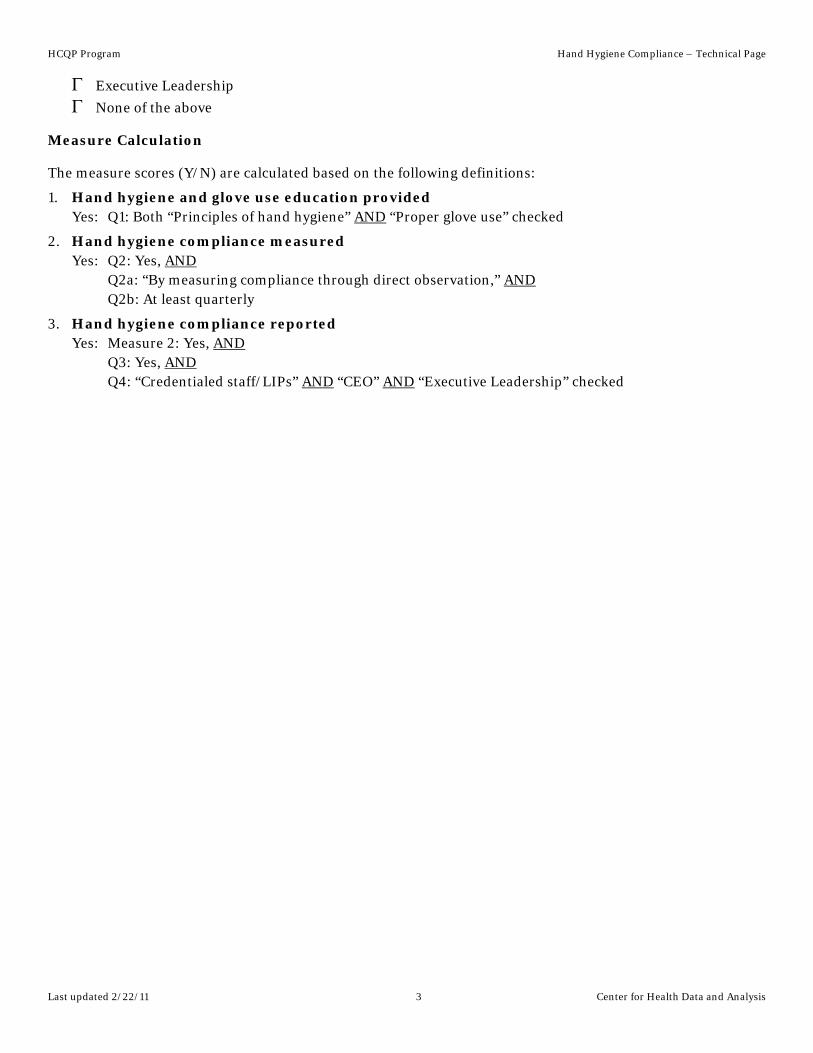
Measure Calculation
The measure scores (Y/N) are calculated based on the following definitions:
1. Hand hygiene and glove use education provided Yes: Q1: Both “Principles of hand hygiene” AND “Proper glove use” checked
2. Hand hygiene compliance measured Yes: Q2: Yes, AND Q2a: “By measuring compliance through direct observation,” AND Q2b: At least quarterly
3. Hand hygiene compliance reported Yes: Measure 2: Yes, AND Q3: Yes, AND Q4: “Credentialed staff/LIPs” AND “CEO” AND “Executive Leadership” checked

RHODE ISLAND
HEALTHCARE-ASSOCIATED INFECTIONS PLAN
JANUARY 1,2010
Submitted by
The Rhode Island Department of Health
Rhode Island Department of Health Healthcare-Associated Infections Plan
Final December 23, 2009 1
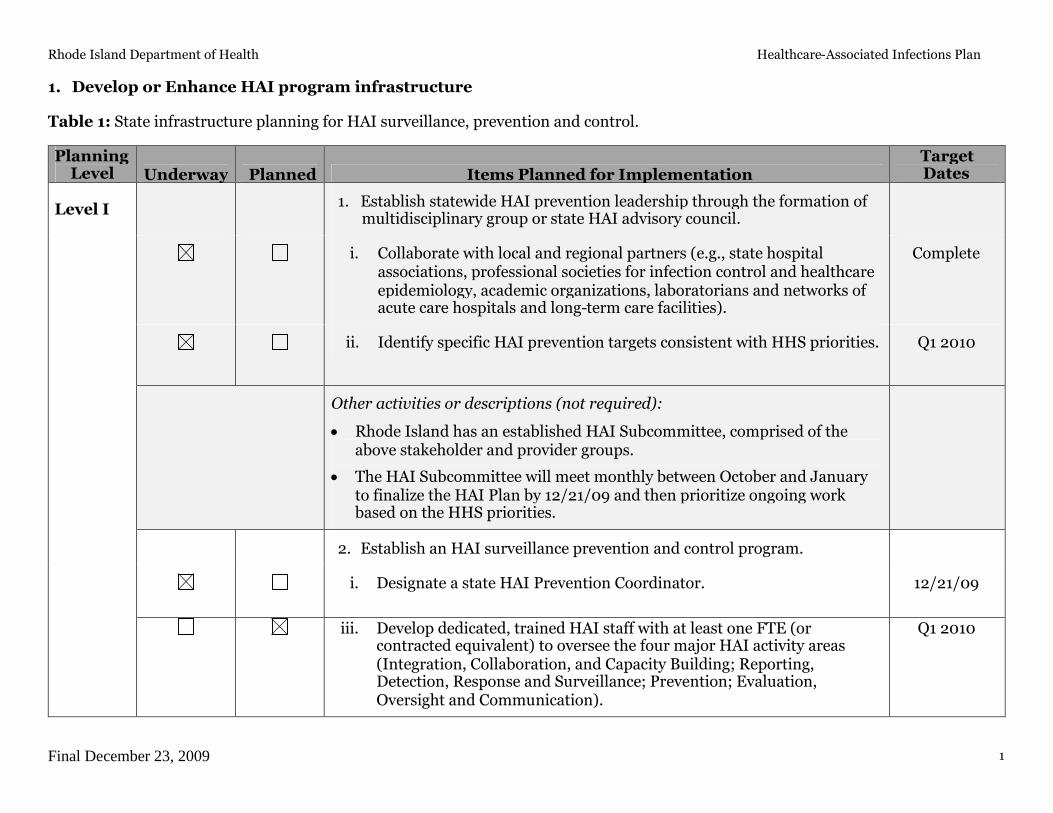
1. Develop or Enhance HAI program infrastructure
Table 1: State infrastructure planning for HAI surveillance, prevention and control.
PlanningLevel Underway Planned Items Planned for Implementation
TargetDates
1. Establish statewide HAI prevention leadership through the formation ofmultidisciplinary group or state HAI advisory council.
i. Collaborate with local and regional partners (e.g., state hospitalassociations, professional societies for infection control and healthcareepidemiology, academic organizations, laboratorians and networks ofacute care hospitals and long-term care facilities).
Complete
ii. Identify specific HAI prevention targets consistent with HHS priorities. Q1 2010
Other activities or descriptions (not required):
Rhode Island has an established HAI Subcommittee, comprised of theabove stakeholder and provider groups.
The HAI Subcommittee will meet monthly between October and Januaryto finalize the HAI Plan by 12/21/09 and then prioritize ongoing workbased on the HHS priorities.
2. Establish an HAI surveillance prevention and control program.
i. Designate a state HAI Prevention Coordinator. 12/21/09
Level I
iii. Develop dedicated, trained HAI staff with at least one FTE (orcontracted equivalent) to oversee the four major HAI activity areas(Integration, Collaboration, and Capacity Building; Reporting,Detection, Response and Surveillance; Prevention; Evaluation,Oversight and Communication).
Q1 2010

Rhode Island Department of Health Healthcare-Associated Infections Plan
Final December 23, 2009 2
PlanningLevel Underway Planned Items Planned for Implementation
TargetDates
Other activities or descriptions (not required):
The Department of Health will identify both internal and external HAIsubject matter experts (to ensure a range of clinical and epidemiologicalskill sets), comprising at least 1.0 FTE.
Rhode Island’s contractor for the HAI Plan is Quality Partners of RhodeIsland, the state’s Quality Improvement Organization (QIO). This enablesthe state to align the HAI Plan work with the QIOs’ HAI and NSHNexpertise/focus. Two hospitals are working with Quality Partners to useNHSN (Our Lady of Fatima Hospital and Roger Williams Medical Center).
3. Integrate laboratory activities with HAI surveillance, prevention andcontrol efforts.
i. Improve laboratory capacity to confirm emerging resistance in HAIpathogens and perform typing where appropriate (e.g., outbreakinvestigation support, HL7 messaging of laboratory results).
Ongoing
Other activities or descriptions (not required):
In response to this grant a representative from the state’s SpecialPathogens Laboratory has joined the HAI Subcommittee and will assistwith coordination between the public reporting program and the statelaboratories. The Special Pathogens Laboratory conducts regular testingand sends results to the CDC, as appropriate.
Additionally, we propose to accomplish capacity building by standardizingand overseeing hospital laboratory activities through the State Laboratory.
Level II
4. Improve coordination among government agencies or organizations thatshare responsibility for assuring or overseeing HAI surveillance,prevention and control (e.g., State Survey Agencies, CommunicableDisease Control, State Licensing Boards).
12/21/09

Rhode Island Department of Health Healthcare-Associated Infections Plan
Final December 23, 2009 3
PlanningLevel Underway Planned Items Planned for Implementation
TargetDates
Other activities or descriptions (not required):
The HAI Subcommittee includes Department of Health representativeswho are involved in epidemiology, physician licensing, and other activitiesthat help to ensure shared responsibility for HAI surveillance, prevention,and control.
5. Facilitate use of standards-based formats (e.g., Clinical DocumentArchitecture, electronic messages) by healthcare facilities for purposes ofelectronic reporting of HAI data.
i. Provide technical assistance or other incentives for implementationsof standards-based reporting can help develop capacity for HAIsurveillance and other types of public health surveillance, such as forconditions deemed reportable to state and local health agencies usingelectronic laboratory reporting (ELR).
ii. Facilitate use of standards-based solutions for external reporting alsocan strengthen relationships between healthcare facilities andregional nodes of healthcare information, such as Regional HealthInformation Organizations (RHIOs) and Health InformationExchanges (HIEs).
n/a
n/a
Other activities or descriptions (not required):
While the Department of Health encourages the use of standards-basedformats to ensure interoperability and consistency of HAI and otherreporting efforts, this was not part of the scope of work proposed by theDepartment for this grant.
There is a state HIE in the early stages of implementation. It requirespatients to opt-in, and will take time for sufficient patients to accrue inorder to make it a useful tool for HAI.

Rhode Island Department of Health Healthcare-Associated Infections Plan
Final December 23, 2009 4
PlanningLevel Underway Planned Items Planned for Implementation
TargetDates
Please note:
Due to a state fiscal crisis, the state’s 11-year-old public reporting program is being eliminated from the current fiscal year’sbudget, effective 12/31/09. While the HAI Subcommittee, which was established as part of the public reporting program, willcontinue under the CDC funding, this means that the programmatic oversight and infrastructure in existence when the grant wasawarded will be eliminated. As a result, the HAI Subcommittee has updated the HAI Plan to reflect a stand-alone project limited tothe CDC funding. Regardless, the state and its providers remain committed to transparency and reporting, and have a long-standing track record and culture of collecting and disseminating data about quality of care and patient satisfaction.
The Department of Health applied for a CDC Epidemiology and Laboratory Capacity for Infectious Diseases (ELC) grant toimplement a MDRO Collaborative, with focus topics to include c-diff and MRSA—but was notified in December 2009 that fundingwas not awarded. These funds would have enabled the Department to increase the FTE allocated to Rhode Island HAI efforts. Inthe absence of this funding, the HAI Plan cannot support and does not propose to expand NHSN use within Rhode Island. TheHAI Subcommittee’s prioritization and implementation of the HHS targets will reflect this limitation.
Rhode Island has already published two HAI reports: (1) Surgical Care Infection Program (SCIP) Measures I, II, and III; and (2)Central Line-Associated Bloodstream Infections (CLABSI). These reports are updated quarterly. The next HAI report isanticipated to be employee influenza vaccination data, beginning with data from the 2008-2009 flu season.
Rhode Island is the only state in the nation to have 100% of adult ICUs participating in the ICU Collaborative. The multi-yearcollaborative has achieved significant improvement on measures such as CLABSI, as well as lives saved and cost savings.

Rhode Island Department of Health Healthcare-Associated Infections Plan
Final December 23, 2009 5
2. Surveillance, Detection, Reporting, and Response
Table 2: State planning for surveillance, detection, reporting, and response for HAIs
PlanningLevel Underway Planned Items Planned for Implementation
TargetDates
1. Improve HAI outbreak detection and investigation.
i. Work with partners including CSTE, CDC, state legislatures, andproviders across the healthcare continuum to improve outbreakreporting to state health departments.
Ongoing
ii. Establish protocols and provide training for health department staff toinvestigate outbreaks, clusters or unusual cases of HAIs.
Ongoing
iii. Develop mechanisms to protect facility/provider/ patient identity wheninvestigating incidents and potential outbreaks during the initialevaluation phase where possible to promote reporting of outbreaks.
Ongoing
iv. Improve overall use of surveillance data to identify and prevent HAIoutbreaks or transmission in HC settings (e.g., hepatitis B, hepatitis C,multi-drug resistant organisms [MDRO], and other reportable HAIs).
Ongoing
Other activities or descriptions (not required):
Surveillance is currently done daily by hospital Infection ControlPractitioners (ICPs), with results reported to the state’s epidemiologists.The HAI Subcommittee will work with the epidemiologists to learn what isreported, at what thresholds, and what steps are followed, as well as toexplore guidelines for non-reportable infections.
Level I
2. Enhance laboratory capacity for state and local detection and response tonew and emerging HAI issues.
n/a
Rhode Island Department of Health Healthcare-Associated Infections Plan
Final December 23, 2009 6
PlanningLevel Underway Planned Items Planned for Implementation
TargetDates
Other activities or descriptions (not required):
Without additional staff and funding, enhanced laboratory capacity is notpossible within the Department. The state is currently in a fiscal crisis, withhiring freezes and budget cuts.
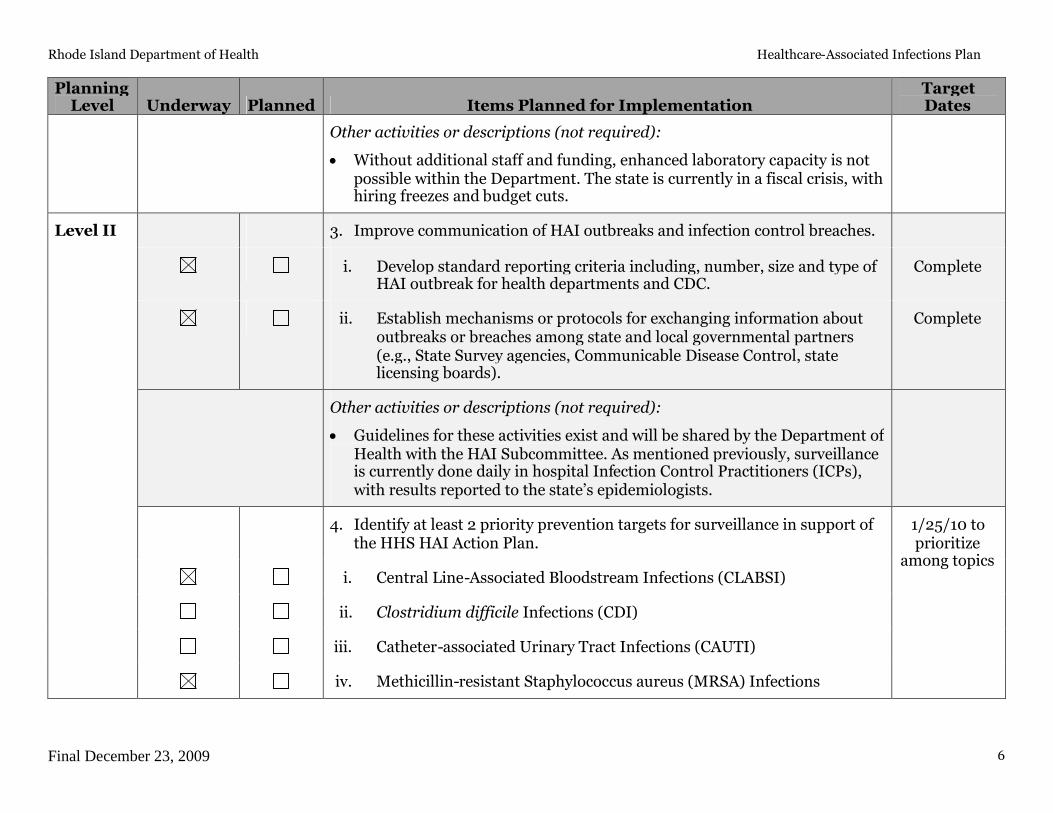
3. Improve communication of HAI outbreaks and infection control breaches.
i. Develop standard reporting criteria including, number, size and type ofHAI outbreak for health departments and CDC.
Complete
ii. Establish mechanisms or protocols for exchanging information aboutoutbreaks or breaches among state and local governmental partners(e.g., State Survey agencies, Communicable Disease Control, statelicensing boards).
Complete
Other activities or descriptions (not required):
Guidelines for these activities exist and will be shared by the Department ofHealth with the HAI Subcommittee. As mentioned previously, surveillanceis currently done daily in hospital Infection Control Practitioners (ICPs),with results reported to the state’s epidemiologists.
4. Identify at least 2 priority prevention targets for surveillance in support ofthe HHS HAI Action Plan.
i. Central Line-Associated Bloodstream Infections (CLABSI)
ii. Clostridium difficile Infections (CDI)
1/25/10 toprioritize
among topics
iii. Catheter-associated Urinary Tract Infections (CAUTI)
Level II
iv. Methicillin-resistant Staphylococcus aureus (MRSA) Infections

Rhode Island Department of Health Healthcare-Associated Infections Plan
Final December 23, 2009 7
PlanningLevel Underway Planned Items Planned for Implementation
TargetDates
v. Surgical Site Infections (SSI) [via Surgical Care Infection Program(SCIP) Measures I, II, and III – not NHSN]
vi. Ventilator-associated Pneumonia (VAP) (via the ICU Collaborative)
Other activities or descriptions (not required):
Rhode Island has an established HAI Subcommittee that has begunprioritizing HAI reporting topics and will expand its existing work toidentify at least two HHS priority topics from the above list. However, inlight of the fact that Rhode Island’s recent application for ELC funding toimplement a MDRO Collaborative was denied, the HAI Plan cannotsupport and does not propose to expand NHSN use within Rhode Island.The HAI Subcommittee’s prioritization, implementation of, andmeasurement of the HHS targets will reflect this limitation.
The HAI Subcommittee met monthly between October and December2009 to finalize the HAI Plan and will begin to meet in January 2010 tofinalize prioritization of ongoing work based on the HHS priorities.
As mentioned previously, the public reporting program has alreadypublished two HAI reports: (1) Surgical Care Infection Program (SCIP)Measures I, II, and III; and (2) Central Line-Associated BloodstreamInfections (CLABSI). These reports are updated quarterly. The next HAIreport will be employee influenza vaccination data, beginning with datafrom the 2008-2009 flu season. Please note that none of these reports useNHSN reporting or data.
The ICU Collaborative participants (all adult ICUs) submit and monitorVAP through the Collaborative’s reporting system, not NHSN.
5. Adopt national standards for data and technology to track HAIs (e.g.,NHSN).
Rhode Island Department of Health Healthcare-Associated Infections Plan
Final December 23, 2009 8
PlanningLevel Underway Planned Items Planned for Implementation
TargetDates
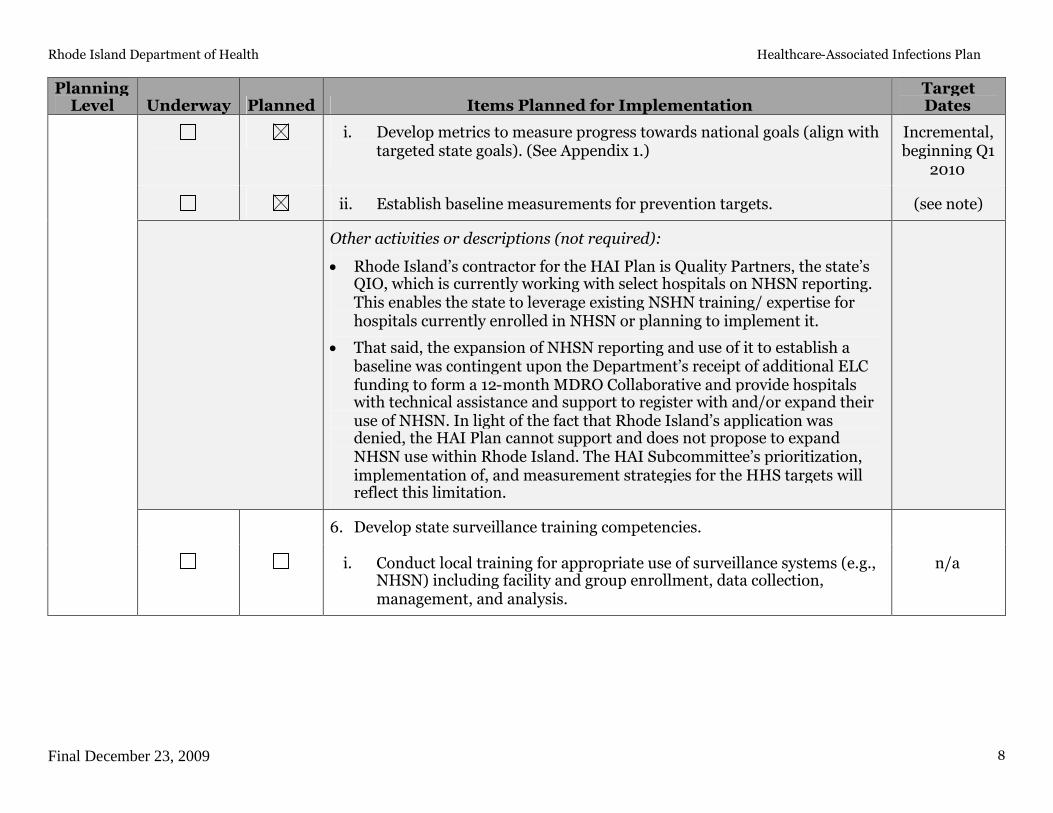
i. Develop metrics to measure progress towards national goals (align withtargeted state goals). (See Appendix 1.)
Incremental,beginning Q1
2010
ii. Establish baseline measurements for prevention targets. (see note)
Other activities or descriptions (not required):
Rhode Island’s contractor for the HAI Plan is Quality Partners, the state’sQIO, which is currently working with select hospitals on NHSN reporting.This enables the state to leverage existing NSHN training/ expertise forhospitals currently enrolled in NHSN or planning to implement it.
That said, the expansion of NHSN reporting and use of it to establish abaseline was contingent upon the Department’s receipt of additional ELCfunding to form a 12-month MDRO Collaborative and provide hospitalswith technical assistance and support to register with and/or expand theiruse of NHSN. In light of the fact that Rhode Island’s application wasdenied, the HAI Plan cannot support and does not propose to expandNHSN use within Rhode Island. The HAI Subcommittee’s prioritization,implementation of, and measurement strategies for the HHS targets willreflect this limitation.
6. Develop state surveillance training competencies.
i. Conduct local training for appropriate use of surveillance systems (e.g.,NHSN) including facility and group enrollment, data collection,management, and analysis.
n/a

Rhode Island Department of Health Healthcare-Associated Infections Plan
Final December 23, 2009 9
PlanningLevel Underway Planned Items Planned for Implementation
TargetDates
Other activities or descriptions (not required):
Rhode Island’s contractor for the HAI Plan is Quality Partners, the state’sQIO, which is currently working with two hospitals on NHSN reporting(Our Lady of Fatima Hospital and Roger Williams Medical Center). QualityPartners’ experience enables the State to leverage existing NSHNtraining/expertise.
Two additional hospitals, Rhode Island Hospital and Women and Infants’Hospital, have also begun using select NHSN modules.
7. Develop tailored reports of data analyses for state or region prepared bystate personnel.
Quarterly
Other activities or descriptions (not required):
Rhode Island’s 11-year-old public reporting mandate (which will beunfunded beginning 1/1/10) uses a stakeholder-guided consensus processto develop and disseminate public reporting formats. The Department ofHealth will use the HAI Subcommittee to fulfill the above objective.
HAI reporting is already underway, with SCIP, CLABSI, and employeeinfluenza vaccination measures published regularly.
8. Validate data entered into HAI surveillance (e.g., through healthcarerecords review, parallel database comparison) to measure accuracy andreliability of HAI data collection.
i. Develop a validation plan. n/a
ii. Pilot test validation methods in a sample of healthcare facilities. n/a
Level III
iii. Modify validation plan and methods in accordance with findings frompilot project.
n/a
Rhode Island Department of Health Healthcare-Associated Infections Plan
Final December 23, 2009 10
PlanningLevel Underway Planned Items Planned for Implementation
TargetDates
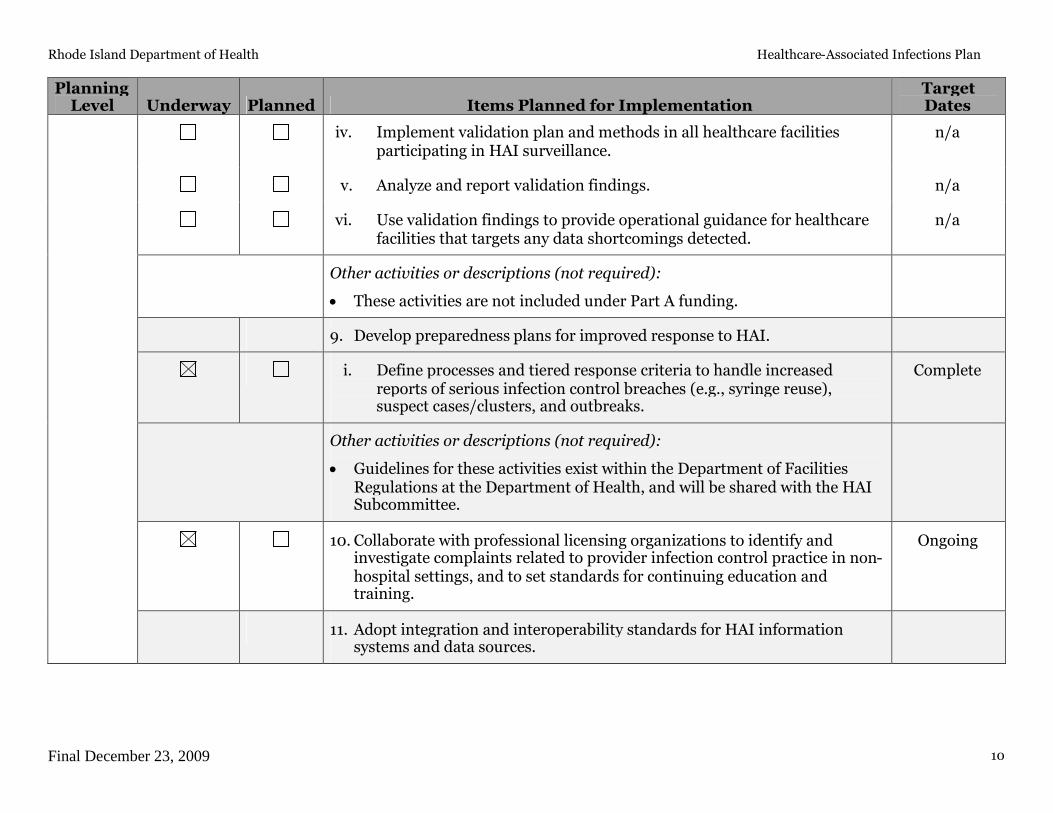
iv. Implement validation plan and methods in all healthcare facilitiesparticipating in HAI surveillance.
n/a
v. Analyze and report validation findings. n/a
vi. Use validation findings to provide operational guidance for healthcarefacilities that targets any data shortcomings detected.
n/a
Other activities or descriptions (not required):
These activities are not included under Part A funding.
9. Develop preparedness plans for improved response to HAI.
i. Define processes and tiered response criteria to handle increasedreports of serious infection control breaches (e.g., syringe reuse),suspect cases/clusters, and outbreaks.
Complete
Other activities or descriptions (not required):
Guidelines for these activities exist within the Department of FacilitiesRegulations at the Department of Health, and will be shared with the HAISubcommittee.
10. Collaborate with professional licensing organizations to identify andinvestigate complaints related to provider infection control practice in non-hospital settings, and to set standards for continuing education andtraining.
Ongoing
11. Adopt integration and interoperability standards for HAI informationsystems and data sources.

Rhode Island Department of Health Healthcare-Associated Infections Plan
Final December 23, 2009 11
PlanningLevel Underway Planned Items Planned for Implementation
TargetDates
i. Improve overall use of surveillance data to identify and prevent HAIoutbreaks or transmission in HC settings (e.g., hepatitis B, hepatitis C,multi-drug resistant organisms (MDRO), and other reportable HAIs)across the spectrum of inpatient and outpatient healthcare settings.
Ongoing
ii. Promote definitional alignment and data element standardizationneeded to link HAI data across the nation.
Ongoing
Other activities or descriptions (not required):
Surveillance is currently done daily by hospital Infection ControlPractitioners (ICPs), with results reported to the state’s epidemiologists. Asdiscussed previously, the HAI Subcommittee will work with theepidemiologists to learn what is reported, at what thresholds, and whatsteps follow, as well as to explore guidelines for non-reportable infections.
Improved use of the surveillance data will result from the inclusion of Dr.Utalpa Bandy, state epidemiologist, and Cindy Vanner, from the state’sSpecial Pathogens Laboratory, on the HAI Subcommittee. They will assistwith coordination between the public reporting program and the stateepidemiology and laboratory work.
12. Enhance electronic reporting and information technology for healthcarefacilities to reduce reporting burden and increase timeliness, efficiency,comprehensiveness, and reliability of the data.
i. Report HAI data to the public. Ongoing
Rhode Island Department of Health Healthcare-Associated Infections Plan
Final December 23, 2009 12
PlanningLevel Underway Planned Items Planned for Implementation
TargetDates
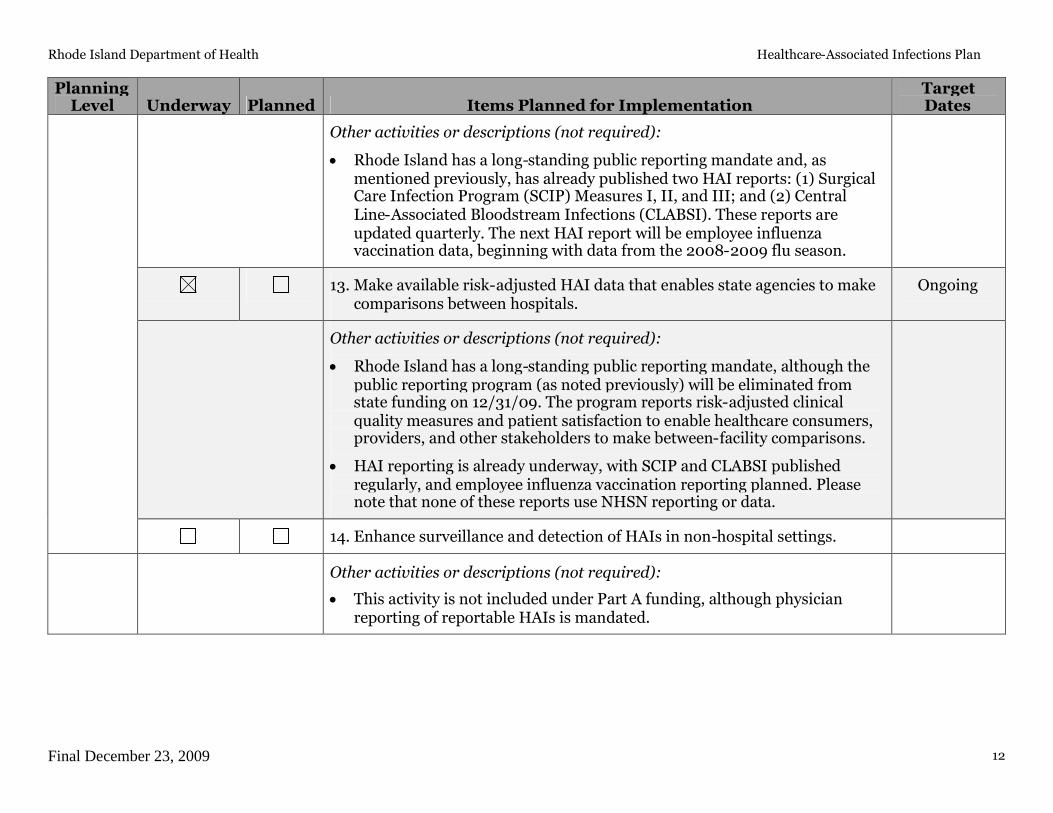
Other activities or descriptions (not required):
Rhode Island has a long-standing public reporting mandate and, asmentioned previously, has already published two HAI reports: (1) SurgicalCare Infection Program (SCIP) Measures I, II, and III; and (2) CentralLine-Associated Bloodstream Infections (CLABSI). These reports areupdated quarterly. The next HAI report will be employee influenzavaccination data, beginning with data from the 2008-2009 flu season.
13. Make available risk-adjusted HAI data that enables state agencies to makecomparisons between hospitals.
Ongoing
Other activities or descriptions (not required):
Rhode Island has a long-standing public reporting mandate, although thepublic reporting program (as noted previously) will be eliminated fromstate funding on 12/31/09. The program reports risk-adjusted clinicalquality measures and patient satisfaction to enable healthcare consumers,providers, and other stakeholders to make between-facility comparisons.
HAI reporting is already underway, with SCIP and CLABSI publishedregularly, and employee influenza vaccination reporting planned. Pleasenote that none of these reports use NHSN reporting or data.
14. Enhance surveillance and detection of HAIs in non-hospital settings.
Other activities or descriptions (not required):
This activity is not included under Part A funding, although physicianreporting of reportable HAIs is mandated.

Rhode Island Department of Health Healthcare-Associated Infections Plan
Final December 23, 2009 13
3. Prevention
Table 3: State planning for HAI prevention activities
PlanningLevel Underway Planned Items Planned for Implementation
TargetDates
1. Implement HICPAC recommendations.
i. Develop strategies for implementation of HICPAC recommendationsfor at least 2 prevention targets specified by the state multidisciplinarygroup.
Q1 2010
Other activities or descriptions (not required):
The HAI Subcommittee will prioritize the HHS prevention targets andidentify measurement strategies for those targets selected forimplementation (e.g., hand hygiene process measures for MRSAcontainment).
However, in light of the fact that Rhode Island’s recent application for ELCfunding to implement a MDRO Collaborative was denied, the HAI Plancannot support and does not propose to expand NHSN use within RhodeIsland. The HAI Subcommittee’s prioritization, implementation of, andmeasurement strategies for the HHS targets will reflect this limitation.
2. Establish prevention working group under the state HAI advisory councilto coordinate the state HAI collaborative.
i. Assemble expertise to consult, advise, and coach inpatient healthcarefacilities involved in HAI prevention collaborative.
n/a
Level I
Other activities or descriptions (not required):
The Department of Health did not propose a HAI prevention collaborativeas part of the grant application. This work is not funded.
Rhode Island HAI Subcommittee already exists and is comprised of theabove stakeholder and provider groups.

Rhode Island Department of Health Healthcare-Associated Infections Plan
Final December 23, 2009 14
PlanningLevel Underway Planned Items Planned for Implementation
TargetDates
3. Establish HAI collaboratives with at least 10 hospitals (i.e. this may requirea multi-state or regional collaborative in low population density regions).
i. Identify staff trained in project coordination, infection control, andcollaborative coordination.
n/a
ii. Develop a communication strategy to facilitate peer-to-peer learningand sharing of best practices.
n/a
iii. Establish and adhere to feedback of a clear and standardized outcomedata to track progress.
n/a
Other activities or descriptions (not required):
The Department of Health did not propose a HAI prevention collaborativeas part of this grant application. This work is not funded.
The Department of Health will identify both internal and external HAIsubject matter experts, to ensure a range of clinical and epidemiologicalskill sets, comprising at least 1.0 FTE.
4. Develop state HAI prevention training competencies.
i. Consider establishing requirements for education and training ofhealthcare professionals in HAI prevention (e.g., certificationrequirements, public education campaigns and targeted providereducation) or work with healthcare partners to establish best practicesfor training and certification.
n/a
Other activities or descriptions (not required):
The HAI Subcommittee will review the state’s education and trainingstandards and consider any opportunities for alignment with nationalstandards, but this work is not specifically funded under the CDC grant.

Rhode Island Department of Health Healthcare-Associated Infections Plan
Final December 23, 2009 15
PlanningLevel Underway Planned Items Planned for Implementation
TargetDates
5. Implement strategies for compliance to promote adherence to HICPACrecommendations.
i. Consider developing statutory or regulatory standards for healthcareinfection control and prevention or work with healthcare partners toestablish best practices to ensure adherence.
n/a
ii. Coordinate/liaise with regulation and oversight activities such asinpatient or outpatient facility licensing/accrediting bodies andprofessional licensing organizations to prevent HAIs.
n/a
iii. Improve regulatory oversight of hospitals, enhancing surveyor trainingand tools, and adding sources and uses of infection control data.
n/a
iv. Consider expanding regulation and oversight activities to currentlyunregulated settings where healthcare is delivered or work withhealthcare partners to establish best practices to ensure adherence.
n/a
Other activities or descriptions (not required):
The HAI Subcommittee is comprised of Infection Control Practitioners(ICPs), hospital staff, Department staff, and other stakeholders with vestedinterests in limiting HAI in Rhode Island. These Subcommittee memberswill assist with establishing collaborative partnerships and policies andprocedures that further reduce HAI in the state, although this work is notspecifically funded by the CDC grant.
6. Enhance prevention infrastructure by increasing joint collaboratives withat least 20 hospitals (i.e., this may require a multi-state or regionalcollaborative in low population density regions)
Level II
Other activities or descriptions (not required):
The Department of Health did not propose a HAI prevention collaborativeas part of the grant application. This work is not funded.
n/a

Rhode Island Department of Health Healthcare-Associated Infections Plan
Final December 23, 2009 16
PlanningLevel Underway Planned Items Planned for Implementation
TargetDates
7. Establish collaborative to prevent HAIs in nonhospital settings (e.g., longterm care, dialysis)
n/a
Other activities or descriptions (not required):
The Department of Health did not propose a HAI prevention collaborativeas part of the grant application. This work is not funded.
Please also describe any additional activities, not listed above, that your state plans to undertake. Please include target dates for anynew activities.
The Department of Health applied for a CDC Epidemiology and Laboratory Capacity for Infectious Diseases (ELC) grant toimplement a 12-month MDRO Collaborative. If funded, this project would have aligned with the existing state HAI Plan andongoing public reporting work, and would have provided a mechanism for the Department to expand the Plan to include theactivities listed in Table 3. Unfortunately, this application for funding was denied.

Rhode Island Department of Health Healthcare-Associated Infections Plan
Final December 23, 2009 17
4. Evaluation and Communications
Table 4: State HAI communication and evaluation planning
PlanningLevel Underway Planned Items Planned for Implementation Target Dates
1. Conduct needs assessment and/or evaluation of the state HAIprogram to learn how to increase impact.
i. Establish evaluation activity to measure progress towards targets,and
Q1 2010
ii. Establish systems for refining approaches based on data gathered. Q2 2011
Other activities or descriptions (not required):
The HAI Subcommittee will continually review the publicly reporteddata to observe trends and make recommendations to the Departmentand, possibly, to the hospitals. Please note that this funding does notestablish a MDRO Collaborative to specifically implement, measure,or refine improvement strategies.
2. Develop and implement a communication plan about the state’s HAIprogram and progress to meet public and private stakeholders’ needs.
Level I
i. Disseminate state priorities for HAI prevention to healthcareorganizations, professional provider organizations, governmentalagencies, non-profit public health organizations, and the public.
Q2 2010
Other activities or descriptions (not required):
Rhode Island’s established HAI Subcommittee is comprised of theabove stakeholder and provider groups, and often outreaches toInfection Control Practitioners (ICPs) and others in the state with aninterest in HAI surveillance and prevention. The communication planwill enable more formal dissemination of information.
Rhode Island Department of Health Healthcare-Associated Infections Plan
Final December 23, 2009 18
PlanningLevel Underway Planned Items Planned for Implementation Target Dates
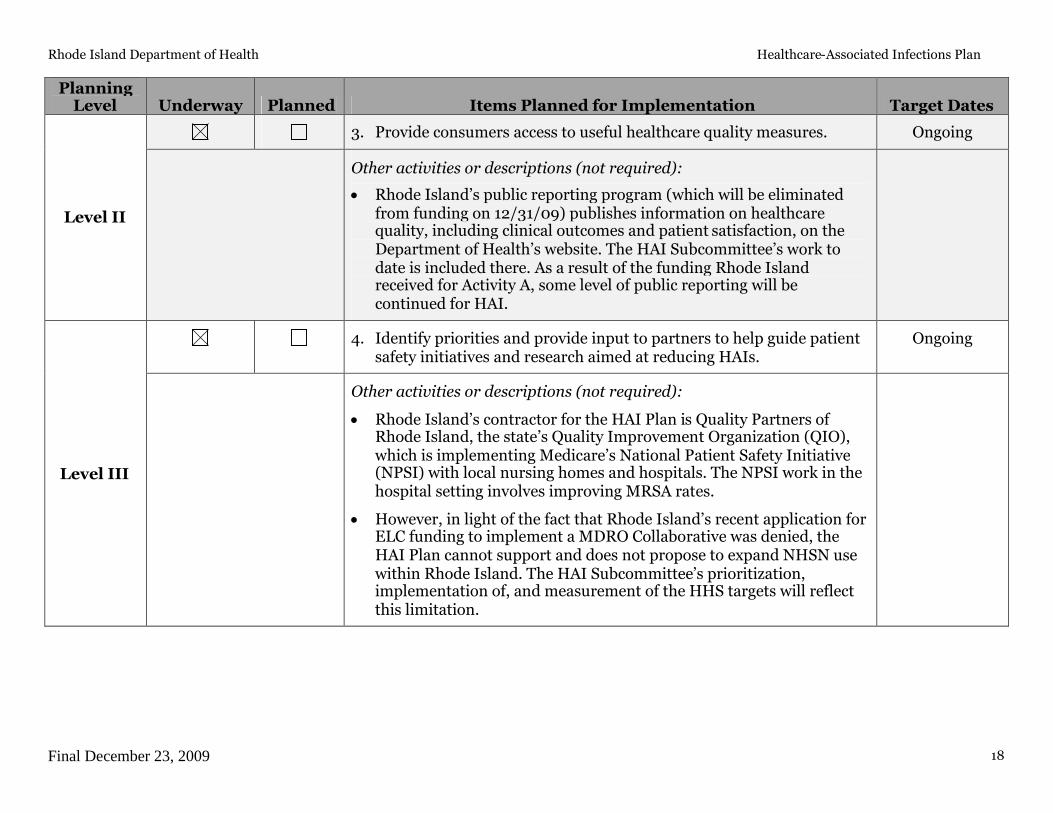
3. Provide consumers access to useful healthcare quality measures. Ongoing
Level II
Other activities or descriptions (not required):
Rhode Island’s public reporting program (which will be eliminatedfrom funding on 12/31/09) publishes information on healthcarequality, including clinical outcomes and patient satisfaction, on theDepartment of Health’s website. The HAI Subcommittee’s work todate is included there. As a result of the funding Rhode Islandreceived for Activity A, some level of public reporting will becontinued for HAI.
4. Identify priorities and provide input to partners to help guide patientsafety initiatives and research aimed at reducing HAIs.
Ongoing
Level III
Other activities or descriptions (not required):
Rhode Island’s contractor for the HAI Plan is Quality Partners ofRhode Island, the state’s Quality Improvement Organization (QIO),which is implementing Medicare’s National Patient Safety Initiative(NPSI) with local nursing homes and hospitals. The NPSI work in thehospital setting involves improving MRSA rates.
However, in light of the fact that Rhode Island’s recent application forELC funding to implement a MDRO Collaborative was denied, theHAI Plan cannot support and does not propose to expand NHSN usewithin Rhode Island. The HAI Subcommittee’s prioritization,implementation of, and measurement of the HHS targets will reflectthis limitation.
Rhode Island Department of Health Healthcare-Associated Infections Plan
Final December 23, 2009 19
Appendix 1.
The HHS Action plan identifies metrics and 5-year national prevention targets. These metrics and prevention targets were developed byrepresentatives from various federal agencies, the Healthcare Infection Control Practices Advisory Committee (HICPAC), professionaland scientific organizations, researchers, and other stakeholders. The group of experts was charged with identifying potential targetsand metrics for six categories of healthcare-associated infections:
Central Line-associated Bloodstream Infections (CLABSI)Clostridium difficile Infections (CDI)Catheter-associated Urinary Tract Infections (CAUTI)Methicillin-resistant Staphylococcus aureus (MRSA) InfectionsSurgical Site Infections (SSI)Ventilator-associated Pneumonia (VAP)
Following the development of draft metrics as part of the HHS Action Plan in January 2009, HHS solicited comments fromstakeholders for review.
Stakeholder feedback and revisions to the original draft Metrics
Comments on the initial draft metrics published as part of the HHS Action Plan in January 2009 were reviewed and incorporated intorevised metrics. While comments ranged from high level strategic observations to technical measurement details, commentersencouraged established baselines, both at the national and local level, use of standardized definitions and methods, engagement withthe National Quality Forum, raised concerns regarding the use of a national targets for payment or accreditation purposes and of thevalidity of proposed measures, and would like to have both a target rate and a percent reduction for all metrics. Furthermore,commenters emphasized the need for flexibility in the metrics, to accommodate advances in electronic reporting and informationtechnology and for advances in prevention of HAIs, in particular ventilator-associated pneumonia.
To address comments received on the Action Plan Metrics and Targets, proposed metrics have been updated to include source of metricdata, baselines, and which agency would coordinate the measure. To respond to the requests for percentage reduction in HAIs inaddition to HAI rates, a new type of metric, the standardized infection ratio (SIR), is being proposed. Below is a detailed technicaldescription of the SIR.
To address concerns regarding validity, HHS is providing funding, utilizing Recovery Act of 2009 funds, to CDC to support states invalidating NHSN-related measures and to support reporting on HHS metrics through NHSN. Also, most of the reporting metricsoutlined here have already been endorsed by NQF and for population-based national measures on MRSA and C. difficile, work to

Rhode Island Department of Health Healthcare-Associated Infections Plan
Final December 23, 2009 20
develop hospital level measures will be conducted in the next year utilizing HHS support to CDC through funds available in theRecovery Act.
Finally, to address concerns regarding flexibility in accommodating new measures, reviewing progress on current measures, andincorporating new sources of measure data (e.g., electronic data, administrative data) or new measures, HHS and its constituentagencies will commit to an annual review and update of the HHS Action Plan Targets and Metrics.
Below is a table of the revised metrics described in the HHS Action plan. Please select items or add additional items for state planningefforts.
MetricNumber
and Label
Original HAIElimination
Metric
HAIComparison
Metric
Measurement System
National BaselineEstablished
(State BaselinesEstablished)
National 5-YearPrevention Target
Coordinatorof
Measurement System
Is themetric NQFendorsed?
1. CLABSI 1 CLABSIs per 1000device days by ICUand other locations
CLABSI SIR CDC NHSNDevice-AssociatedModule
2006-2008
(Proposed 2009, inconsultation with states)
Reduce the CLABSI SIR by atleast 50% from baseline or tozero in ICU and otherlocations
CDC Yes*
2. CLIP 1(formerlyCLABSI 4)
Central line bundlecompliance
CLIP Adherencepercentage
CDC NHSNCLIP inDevice-AssociatedModule
2009
(Proposed 2009, inconsultation with states)
100% adherence with centralline bundle
CDC Yes†
3a. C diff 1 Case rate perpatient days;administrative/discharge data for ICD-9 CM codedClostridium difficileInfections
Hospitalizationswith C. difficileper 1000 patientdischarges
Hospitaldischarge data
2008
(Proposed 2008, inconsultation with states)
At least 30% reduction inhospitalizations with C.difficile per 1000 patientdischarges
AHRQ No
3b. C diff 2
(New)
C. difficile SIR CDC NHSNMDRO/CDADModuleLabID‡
2009-2010 Reduce the facility-widehealthcare facility-onset C.difficile LabID event SIR by atleast 30% from baseline or tozero
CDC No

Rhode Island Department of Health Healthcare-Associated Infections Plan
Final December 23, 2009 21
MetricNumber
and Label
Original HAIElimination
Metric
HAIComparison
Metric
Measurement System
National BaselineEstablished
(State BaselinesEstablished)
National 5-YearPrevention Target
Coordinatorof
Measurement System
Is themetric NQFendorsed?
4. CAUTI 2 # of symptomaticUTI per 1,000urinary catheterdays
CAUTI SIR CDC NHSNDevice-AssociatedModule
2009 for ICUs and otherlocations
2009 for other hospital units
(Proposed 2009, inconsultation with states)
Reduce the CAUTI SIR by atleast 25% from baseline or tozero in ICU and otherlocations
CDC Yes*
5a. MRSA 1 Incidence rate(number per100,000 persons) ofinvasive MRSAinfections
MRSA Incidencerate
CDCEIP/ABCs
2007-2008
(for non-EIP states, MRSAmetric to be developed incollaboration with EIP states)
At least a 50% reduction inincidence of healthcare-associated invasive MRSAinfections
CDC No
5b. MRSA 2
(New)
MRSA bacteremiaSIR
CDC NHSNMDRO/CDADModuleLabID‡
2009-2010 Reduce the facility-widehealthcare facility-onsetMRSA bacteremia LabIDevent SIR by at least 25%from baseline or to zero
CDC No
6. SSI 1 Deep incision andorgan spaceinfection ratesusing NHSNdefinitions (SCIPprocedures)
SSI SIR CDC NHSNProcedure-AssociatedModule
2006-2008
(Proposed 2009, inconsultation with states)
Reduce the admission andreadmission SSI§ SIR by atleast 25% from baseline or tozero
CDC Yes¶
7. SCIP 1(formerly SSI2)
Adherence toSCIP/NQF infectionprocess measures
SCIP Adherencepercentage
CMS SCIP To be determined by CMS At least 95% adherence toprocess measures to preventsurgical site infections
CMS Yes
* NHSN SIR metric is derived from NQF-endorsed metric data†NHSN does not collect information on daily review of line necessity, which is part of the NQF‡ LabID, events reported through laboratory detection methods that produce proxy measures for infection surveillance§ Inclusion of SSI events detected on admission and readmission reduces potential bias introduced by variability in post-discharge surveillance efforts¶ The NQF-endorsed metric includes deep wound and organ space SSIs only which are included the target.

Rhode Island Department of Health Healthcare-Associated Infections Plan
Final December 23, 2009 22
Understanding the Relationship between HAI Rate and SIR Comparison Metrics
The Original HAI Elimination Metrics listed above are very useful for performing evaluations. Several of these metrics are based on the science employed in theNHSN. For example, metric #1 (CLABSI 1) for CLABSI events measures the number of CLABSI events per 1000 device (central line) days by ICU and otherlocations. While national aggregate CLABSI data are published in the annual NHSN Reports these rates must be stratified by types of locations to be risk-adjusted.This scientifically sound risk-adjustment strategy creates a practical challenge to summarizing this information nationally, regionally or even for an individualhealthcare facility. For instance, when comparing CLABSI rates, there may be quite a number of different types of locations for which a CLABSI rate could bereported. Given CLABSI rates among 15 different types of locations, one may observe many different combinations of patterns of temporal changes. This raisesthe need for a way to combine CLABSI rate data across location types.
A standardized infection ratio (SIR) is identical in concept to a standardized mortality ratio and can be used as an indirect standardization method forsummarizing HAI experience across any number of stratified groups of data. To illustrate the method for calculating an SIR and understand how it could be usedas an HAI comparison metric, the following example data are displayed below:
Risk GroupStratifier
Observed CLABSI Rates NHSN CLABSI Rates for 2008(Standard Population)
LocationType #CLABSI #Central line-days CLABSI rate* #CLABSI
#Central line-days CLABSI rate*
ICU 170 100,000 1.7 1200 600,000 2.0
WARD 58 58,000 1.0 600 400,000 1.5
SIR = 79.0287228
87200228
10005.1000,58
10002100000
58170expectedobserved
95%CI = (0.628,0.989)
*defined as the number of CLABSIs per 1000 central line-days
In the table above, there are two strata to illustrate risk-adjustment by location type for which national data exist from NHSN. The SIR calculation is based ondividing the total number of observed CLABSI events by an “expected” number using the CLABSI rates from the standard population. This “expected” number iscalculated by multiplying the national CLABSI rate from the standard population by the observed number of central line-days for each stratum, which can also beunderstood as a prediction or projection. If the observed data represented a follow-up period such as 2009 one would state that an SIR of 0.79 implies that therewas a 21% reduction in CLABSIs overall for the nation, region or facility.
The SIR concept and calculation is completely based on the underlying CLABSI rate data that exist across a potentially large group of strata. Thus, the SIRprovides a single metric for performing comparisons rather than attempting to perform multiple comparisons across many strata, which makes the taskcumbersome. Given the underlying CLABSI rate data, one retains the option to perform comparisons within a particular set of strata where observed rates may

Rhode Island Department of Health Healthcare-Associated Infections Plan
Final December 23, 2009 23
differ significantly from the standard populations. These types of more detailed comparisons could be very useful and necessary for identifying areas for morefocused prevention efforts.
The National 5-year prevention target for metric #1 could be implemented using the concept of an SIR equal to 0.25 as the goal. That is, an SIR value based on theobserved CLABSI rate data at the 5-year mark could be calculated using NHSN CLABSI rate data stratified by location type as the baseline to assess whether the75% reduction goal was met. There are statistical methods that allow for calculation of confidence intervals, hypothesis testing and graphical presentation usingthis HAI summary comparison metric called the SIR.
The SIR concept and calculation can be applied equitably to other HAI metrics list above. This is especially true for HAI metrics for which national data areavailable and reasonably precise using a measurement system such as the NHSN. The SIR calculation methods differ in the risk group stratification only. Tobetter understand metric #6 (SSI 1) see the following example data and SIR calculation:
† SSI, surgical site infection* defined as the number of deep incision or organ space SSIs per 100 procedures
This example uses SSI rate data stratified by procedure and risk index category. Nevertheless, an SIR can be calculated using the same calculation process as forCLABSI data except using different risk group stratifiers for these example data. The SIR for this set of observed data is 0.74 which indicates there’s a 26%reduction in the number of SSI events based on the baseline NHSN SSI rates as representing the standard population. Once again, these data can reflect thenational picture at the 5-year mark and the SIR can serve as metric that summarizes the SSI experience into a single comparison.
There are clear advantages to reporting and comparing a single number for prevention assessment. However, since the SIR calculations are based on standard HAIrates among individual risk groups there is the ability to perform more detailed comparisons within any individual risk group should the need arise. Furthermore,the process for determining the best risk-adjustment for any HAI rate data is flexible and always based on more detailed risk factor analyses that provide amplescientific rigor supporting any SIR calculations. The extent to which any HAI rate data can be risk-adjusted is obviously related to the detail and volume of datathat exist in a given measurement system.
Risk Group Stratifiers Observed SSI Rates NHSN SSI Rates for 2008(Standard Population)
Procedure Code
Risk IndexCategory #SSI† #procedures SSI rate* #SSI† #procedures SSI rate*
CBGB 1 315 12,600 2.5 2100 70,000 3.0
CBGB 2,3 210 7000 3.0 1000 20,000 5.0
HPRO 1 111 7400 1.5 1020 60,000 1.7
SIR = 74.08.853
6368.125350378
636
1007.17400
1000.57000
1000.312600
111210315expectedobserved
95%CI = (0.649,0.851)

Rhode Island Department of Health Healthcare-Associated Infections Plan
Final December 23, 2009 24
In addition to the simplicity of the SIR concept and the advantages listed above, it’s important to note another benefit of using an SIR comparison metric for HAIdata. If there was need at any level of aggregation (national, regional, facility-wide, etc.) to combine the SIR values across mutually exclusive data one could do so.The below table demonstrates how the example data from the previous two metric settings could be summarized.
Observed HAIs Expected HAIsHAI Metric
#CLABSI #SSI†#Combined
HAI #CLABSI #SSI† #Combined HAI
CLABSI 1 228 287
SSI 1 636 853.8
CombinedHAI
228 + 636 =864
287+853.8 =1140.8
SIR = 76.08.1140
8648.853287
636228expectedobserved
95%CI = (0.673,0.849)
† SSI, surgical site infection

Antimicrobial Stewardship at a Large Tertiary Care Academic Medical Center: Cost AnalysisBefore, During, and After a 7-Year ProgramAuthor(s): Harold C. Standiford, Shannon Chan, Megan Tripoli, Elizabeth Weekes, Graeme N.ForrestReviewed work(s):Source: Infection Control and Hospital Epidemiology, Vol. 33, No. 4, Special Topic Issue:Antimicrobial Stewardship (April 2012), pp. 338-345Published by: The University of Chicago Press on behalf of The Society for Healthcare Epidemiology ofAmericaStable URL: http://www.jstor.org/stable/10.1086/664909 .Accessed: 19/03/2012 13:15
Your use of the JSTOR archive indicates your acceptance of the Terms & Conditions of Use, available at .http://www.jstor.org/page/info/about/policies/terms.jsp
JSTOR is a not-for-profit service that helps scholars, researchers, and students discover, use, and build upon a wide range ofcontent in a trusted digital archive. We use information technology and tools to increase productivity and facilitate new formsof scholarship. For more information about JSTOR, please contact [email protected].
The University of Chicago Press and The Society for Healthcare Epidemiology of America are collaboratingwith JSTOR to digitize, preserve and extend access to Infection Control and Hospital Epidemiology.
http://www.jstor.org
infection control and hospital epidemiology april 2012, vol. 33, no. 4
o r i g i n a l a r t i c l e
Antimicrobial Stewardship at a Large Tertiary Care AcademicMedical Center: Cost Analysis Before, During,
and After a 7-Year Program
Harold C. Standiford, MD;1,2 Shannon Chan, PharmD;3 Megan Tripoli, BA;1
Elizabeth Weekes, PharmD;4 Graeme N. Forrest, MBBS5
background. An antimicrobial stewardship program was fully implemented at the University of Maryland Medical Center in July 2001(beginning of fiscal year [FY] 2002). Essential to the program was an antimicrobial monitoring team (AMT) consisting of an infectiousdiseases–trained clinical pharmacist and a part-time infectious diseases physician that provided real-time monitoring of antimicrobial ordersand active intervention and education when necessary. The program continued for 7 years and was terminated in order to use the resourcesto increase infectious diseases consults throughout the medical center as an alternative mode of stewardship.
design. A descriptive cost analysis before, during, and after the program.
patients/setting. A large tertiary care teaching medical center.
methods. Monitoring the utilization (dispensing) costs of the antimicrobial agents quarterly for each FY.
results. The utilization costs decreased from $44,181 per 1,000 patient-days at baseline prior to the full implementation of the program(FY 2001) to $23,933 (a 45.8% decrease) by the end of the program (FY 2008). There was a reduction of approximately $3 million withinthe first 3 years, much of which was the result of a decrease in the use of antifungal agents in the cancer center. After the program wasdiscontinued at the end of FY 2008, antimicrobial costs increased from $23,933 to $31,653 per 1,000 patient-days, a 32.3% increase within2 years that is equivalent to a $2 million increase for the medical center, mostly in the antibacterial category.
conclusions. The antimicrobial stewardship program, using an antimicrobial monitoring team, was extremely cost effective over this7-year period.
Infect Control Hosp Epidemiol 2012;33(4):338-345
Affiliations: 1. University of Maryland Medical Center, Baltimore, Maryland; 2. Department of Medicine, University of Maryland School of Medicine,Baltimore, Maryland; 3. Department of Pediatrics, A. I. DuPont Hospital for Children, Wilmington, Delaware; 4. Department of Pharmacy, Denver Health,Denver, Colorado; 5. Division of Infectious Diseases, Portland Veterans Affairs Medical Center, Portland, Oregon.
Received October 1, 2011; accepted December 27, 2011; electronically published March 15, 2012.� 2012 by The Society for Healthcare Epidemiology of America. All rights reserved. 0899-823X/2012/3304-0005$15.00. DOI: 10.1086/664909
Antimicrobial resistance is increasing throughout the UnitedStates. Furthermore, there are fewer new antimicrobials beingdeveloped to treat these resistant organisms.1 This has led theInfectious Diseases Society of America, the Society for HealthCare Epidemiology, and the Centers for Disease Control andPrevention to recommend that hospitals develop antimicro-bial stewardship programs (ASPs) to help protect our existingarmamentarium as long as possible.2 Despite this recom-mendation, many medical centers have not established activeprograms. Such programs require resources during timeswhen competition for finances is great and return of invest-ment is uncertain.
The University of Maryland Medical Center (UMMC) de-veloped an ASP using an antimicrobial monitoring team(AMT) in calendar year 2001. However, after 7 years theprogram was discontinued in favor of using the resources to
provide additional infectious diseases physicians to enhanceinfectious diseases consultation throughout the medical cen-ter. The rationale for this was that the infectious diseasesphysicians, via consultations, would provide the necessarystewardship, making the AMT superfluous. This article doc-uments the marked cost savings that resulted after the im-plementation of the ASP and the AMT in 2001 and the majorcost impact that resulted after the program was discontinued.
methods
Background
The ASP was established at UMMC in 2001, in response tothe perceived need for more appropriate use and the esca-lating costs of antimicrobial agents. It was continued throughJune 2008. At the time of the implementation of the ASP,

antimicrobial stewardship cost analysis 339
UMMC had approximately 28,700 patient admissions peryear; this has steadily increased, to 38,590 admissions in fiscalyear (FY) 2010. The medical center has a very active cancercenter, trauma center, and transplantation program. It hasapproximately 175 intensive care beds in the facility.
At the time of initiating the program, UMMC had a reg-ulated formulary with restricted antimicrobials that requiredpreauthorization for their use and an active pharmacy andtherapeutics committee with an antimicrobial subcommittee.Despite this, annualized antimicrobial purchasing costs in-creased from $4.7 million in calendar year (CY) 1997 to over$8 million in CY 2000. Additionally, hospitals in Marylandwere to be reimbursed for the disease entity treated (a drug-related group [DRG] system) instead of for the expenses in-curred. This provided an additive monetary incentive for ini-tiating the ASP.
Developing the ASP and the AMT
Leadership of the initiative was established within the infectioncontrol program and by working closely with the pharmacydepartment. The program was developed by the medical di-rector for infection control and the infectious diseases clinicalpharmacist and vetted at a number of meetings with key hos-pital personnel, including the director of pharmacy, the chiefof infectious diseases, the vice president of quality for the med-ical center, and the chief medical officer. Essential and centralto the ASP was the establishment of an AMT. This team con-sisted of (1) an infectious diseases physician with an initialdedicated effort to the program of 25% that subsequently in-creased to 50% and (2) a clinical pharmacist with infectiousdiseases training with a dedicated effort to the program of 80%.A data analyst with a dedicated effort of 5% and direction ofthe program was incorporated in the infection control programand required no additional resources.
Responsibilities of the AMT
The duties of the team were to provide an active computer-assisted real-time review of antimicrobial orders for the des-ignated restricted antimicrobials and to provide active inter-vention when necessary. During their review, the teamattempted to (1) identify ineffective or excessive antimicrobialcoverage, (2) assure that the orders adhered to policies andguidelines, (3) discontinue unnecessary double coverage, (4)determine patients whose treatment could be converted safelyfrom parenteral to oral therapy (IV-PO), and (5) suggestinfectious diseases consults for difficult and complex cases.The team prioritized for review those patients receiving re-stricted antimicrobial agents and those areas of the medicalcenter not served by specialized infectious diseases physicianssuch as were present in the trauma center.
Preauthorization Using the “BUGS Beeper”
Prior to the stewardship program, preauthorization for theuse of certain antimicrobial agents was required, and this
consent was provided by the infectious diseases consult ser-vice. To improve the process, a “BUGS beeper” program wasdeveloped. In this a beeper, activated by dialing “BUGS,” wascarried by the on-duty infectious diseases fellows on a ro-tational schedule. The fellow was supervised by the infectiousdiseases–trained faculty member assigned to the antimicrobialteam. If preauthorization was not provided, the attendingphysician on the requesting service could directly call theattending physician on the antimicrobial team. If the conflictwas still not resolved, a dose of the antimicrobial agent wouldbe administered and an infectious diseases consult would beobtained in order to clarify the situation. Initially, an on-dutyfellow carried the beeper until 10:00 p.m., but this was soonextended to 24 hours, 7 days a week. The program was ini-tiated in late January 2001 and became fully implemented byJuly 2001 (beginning of FY 2002).
Development of Guidelines and Policies
To provide consistency for the physicians ordering the an-timicrobials and for the antimicrobial team monitoring theiruse, guidelines and policies were developed where applicable.The AMT frequently provided leadership when formulatingthese guidelines, but attempts were made to have those mostinvolved with their use participate in the development. Whenthe policies and guidelines were written, they were approvedthrough the normal channels, including the antimicrobialsubcommittee of the pharmacy and therapeutics (P&T) com-mittee, the parent P&T committee, and the medical executivecommittee, when appropriate.
Financial Goals
The financial goals for the antimicrobial program, which werebased on those of other programs using an active interven-tional model at the time, were purposefully conservative: tosave 10%–20% of the costs of antibiotics, based on an an-timicrobial budget of $6 million per year over a 3-year period(a savings of $600,000–$1,200,000 over the 3-year period).3
Data Analysis
The actual costs for the antimicrobials were determined bythe pharmacy service, and they represented the purchasingcost for the drug per unit. These costs were obtained by thepharmacy administration, independent of the antimicrobialteam. The data program captured the utilization of antimi-crobials, which was defined as those antimicrobials orderedby the provider who was caring for the patient and dispensedby the pharmacy. Any unused medication returned to thepharmacy was subtracted from this amount. Initially, theseutilization data were captured using the Mega Source pro-gram. The data in this program were transferred using Mon-arche into Access, so that they could be categorized and ma-nipulated into a usable database. On October 7, 2002 (secondquarter of FY 2003), PharmNet was initiated. During thischangeover, there were no data collected for the first 7 days

340 infection control and hospital epidemiology april 2012, vol. 33, no. 4
figure 1. Quarterly costs of all antimicrobials, beginning with the first quarter of fiscal year 1998 (July 1997) and continuing throughthe 4th quarter of fiscal year (FY) 2010 (June 1, 2010). The solid horizontal lines represent the average cost for each fiscal year. Thebeginning and end of the antimicrobial stewardship program in the 3rd quarter of fiscal year 2001 and ending in the 4th quarter of fiscalyear 2008, respectively, are indicated with arrows.
of that quarter. Instead, data for this period were estimatedby extrapolating costs for the remaining portion of the quar-ter. Data from the PharmNet program were transferred intoAccess so that they could be categorized in a manner similarto the data from the Mega Source program.
Beginning in May 2004, PharmWatch (Cereplex; nowowned by Premier), a decision-support program designed toassist in antimicrobial utilization, was used to evaluate for a3-month period one-half of the patient population monitoredby the antimicrobial team. Results of this evaluation havebeen reported previously.4 The use of this program was sub-sequently expanded to include the entire hospital.
Defined Daily Doses (DDDs)
DDDs were determined according to dosages recommendedby the World Health Organization (http://www.whocc.no/atc_ddd_index/). When no daily dosage was suggested by thatorganization, one was assigned that was thought to representa typical daily dosage for adults with normal renal and hepaticfunctions. When a dosage amount was assigned, it was not
changed throughout the evaluation period. The DDDs areexpressed per 1,000 patient-days.
Quality Indicators
To monitor the safety of the stewardship program, we moni-tored selective quality indicators for the medical center in-cluding length of stay, readmissions within 30 days, and 30-day mortality. The DRG case mix index was monitored toensure that changes in outcomes were not related to this index.
Statistical Analysis
The x2 test was used to compare the annual and cumulativereductions of antibiotic usage overall and then after intro-duction and after discontinuation of the AMT. To examinethe trend in the prevalence of antimicrobial utilization overtime, the results were compared using the x2 test for trend.For all analyses, the threshold for establishing statistical sig-nificance was set at . Statistical analyses were com-P ! .05pleted using the SPSS statistical package (ver 16).

antimicrobial stewardship cost analysis 341
table 1. Cost of Antimicrobials by Category, Before, During, and After the Antimicrobial Stewardship Program
Before During After
FY 2001 FY 2002 FY 2003 FY 2004 FY 2005 FY 2006 FY 2007 FY 2008 FY 2009 FY 2010
Antibacterials 3,503,878 3,017,828 3,189,081 2,990,834 3,117,084 3,283,178 3,498,911 3,183,232 4,020,487 4,751,641Antifungals 3,710,465 2,926,270 2,011,050 1,458,489 1,605,573 1,513,837 1,343,056 1,154,256 1,268,795 1,268,498Antimycobacterials 17,416 16,919 14,843 17,765 27,985 16,518 15,498 10,336 34,879 66,135Antiparasitics 5,056 5,839 2,822 2,387 2,832 3,124 4,698 5,647 9,637 11,416Antivirals 424,627 470,503 441,811 345,674 333,553 403,628 441,576 403,324 503,220 609,474Total 7,774,588 6,490,231 5,667,893 4,824,883 5,094,800 5,227,490 5,315,848 4,776,663 5,869,764 6,742,948Total per 1,000
patient-days 44,181 35,974 30,951 27,718 27,031 28,146 27,363 23,933 27,833 31,653Savings (loss) from
previous year 1,284,357 822,338 843,010 (269,917) (132,690) (88,358) 539,185 (1,093,101) (873,184)
note. Costs are in US dollars. FY, fiscal year.
results
Cost Savings after Implementation of the ASP
The utilization costs by quarter for the medical center fromFY 1998 through FY 2010 are presented in Figure 1. (Forexample, the fiscal year for 2001 extends from July 1, 2000,through June 30, 2001.) The overall upward trend of coststhat occurred from FY 1998 through the third quarter of FY2001 (prior to the time of implementation of the ASP) isreadily apparent. Similarly, the downward trend that occurredafter the program was fully implemented (beginning in FY2002) is marked, particularly in the first 3 years. Thereafter,a relatively stable period exists from FY 2004 until the firstquarter of FY 2009, at which point the program was termi-nated. Following this termination, the costs for antimicrobialsincrease dramatically for the next 2 years.
The yearly costs before the stewardship program was im-plemented (FY 2001), for the 7 years of the program’s ex-istence (FY 2002–FY 2008), and for 2 years after it was ter-minated (FY 2009–FY 2010), including dollars perpatient-days, are presented in Table 1. These costs are furtherseparated into antimicrobial categories. The total expendi-tures for antimicrobial agents were reduced from $44,181 to$23,933 per 1,000 patient-days (45.8%; ) over theP p .04duration of the program. In terms of costs for the hospital,a reduction of $2,949,705 occurred for the medical centerwithin the first 3 years after implementation of the ASP.
By antimicrobial category, for FY 2001 (baseline), almostone-half ($3.7 million) of the entire budget of $7,774,588went to pay for antifungal agents, with an additional $3.5million (45%) paying for antibacterial agents. Together, these2 categories were responsible for 93% of the antimicrobialcosts. After the program began, the majority of the cost sav-ings occurred in the antifungal category, which were reducedby $2,251,976 (60.7%) over the 3-year period, driven pri-marily by treatment guidelines for fungal infections in themedical center ( ). However, costs of antibacterialP p .003agents were also reduced by $513,044 (14.6%) over this 3-
year period after the program was implemented ( ).P p .035Reductions are noted for the beta-lactam antibiotics as agroup (10.2%), which include the carbapenems (primarilyimipenem), the cephalosporins, and the penicillins (see Table2). There was a slight reduction in the use of the antipseu-domonal penicillins, primarily piperacillin/tazobactam,whereas use of the aminopenicillins (primarily ampicillin/sulbactam) increased. Reductions were also noted for the mis-cellaneous antimicrobial agents as a group, including van-comycin, quinipristin/dalfopristin, and metronidazole. Thecost of the quinolones was reduced by 47% over the 3-yearperiod. From FY 2004 to FY 2008, costs appeared to stabilize,decreasing by only $48,220 (1%); however, when patient-daysare considered, this was a decrease of $3,785 per 1,000 patient-days, or 13.7%
Switch from Intravenous to Oral Delivery
An early intervention initiated by the stewardship programwas the switch from intravenous to oral routes of deliverywhen the oral intake of other drugs was apparent and whenthe bioavailability of the antimicrobial agents permitted it.This was subsequently instituted as a policy. The reductionof costs resulting from this initiative was $179,285 in FY 2002compared with baseline (FY 2001). The savings resulting fromthis switch were most apparent for fluconazole ($142,534)and linezolid ($19,597).
The increases in costs by antimicrobial category after theprogram was discontinued also is noted in Table 1, with theeffects on specific antimicrobials presented in Table 2. Therewas an immediate increase in cost of $1 million during thefirst year after the program was discontinued and an additionalincrease of $873,184 during the second year, which representsan increase in cost of 41.2% for the 2-year period over the lastyear of the program (FY 2008; ). After the discon-P p .025tinuation of the program, the increased costs primarily oc-curred in the antibacterial category, particularly the agents act-ing against gram-positive organisms, including vancomycin,linezolid, and daptomycin (see Table 2; ). Also duringP p .002

342 infection control and hospital epidemiology april 2012, vol. 33, no. 4
table 2. Utilization Costs for Selected Antibacterial and Antifungal Agents Before, During, and After the Antimicrobial StewardshipProgram
Before During After
FY 2001 FY 2002 FY 2003 FY 2004 FY 2005 FY 2006 FY 2007 FY 2008 FY 2009 FY 2010
Antibacterials 3,503,878 3,017,828 3,189,081 2,990,834 3,177,084 3,283,178 3,498,911 3,183,132 4,020,487 4,751,641Carbapenems 369,047 319,933 326,954 341,042 357,589 277,989 363,596 405,181 548,137 541,279
Imipenem 348,726 257,882 304,715 313,190 342,389 256,860 310,791 348,642 143,578 63Doripenem 0 0 0 0 0 0 0 0 293,453 420,300Meropenem 0 0 0 24,506 6,838 15,638 33,966 31,295 79,504 73,093Ertapenem 0 0 0 3,347 8,362 5,491 18,839 25,245 32,203 47,823
PenicillinsPiperacillin/
tazobactam 874,728 791,625 880,279 847,236 957,241 1,069,452 1,021,410 877,809 1,339,270 1,465,469Ampicillin/
sulbactam 206,505 202,394 287,697 259,691 276,605 196,909 193,521 134,874 105,370 63,024Cephalosporins
Ceftriaxone 404,352 216,748 332,965 260,586 244,449 278,274 125,188 67,694 44,482 90,231Cefepime 225,052 173,304 273,947 209,023 222,517 222,385 366,537 271,541 160,392 166,591
Total quinolones 336,773 299,349 203,674 179,896 168,783 177,561 141,323 92,831 47,410 47,348Ciprofloxacin 155,902 83,542 32,560 27,026 35,442 55,203 79,106 62,319 21,342 17,147Gatifloxacin 23,359 163,810 155,305 145,216 129,904 95,047 6 0 0 0Moxifloxacin 0 0 14 56 545 16,183 60,836 30,251 25,852 29,484
MiscellaneousVancomycin 177,830 160,211 136,395 111,177 132,576 149,188 188,117 193,424 249,130 469,830Linezolid 164,396 136,922 220,484 287,461 258,030 332,132 427,656 343,725 499,845 643,968Daptomycin 0 0 0 5,074 16,058 79,006 162,501 102,944 254,294 369,779Tigecycline 0 0 0 0 0 0 0 187,305 274,554 199,766Metronidazole 177,346 167,516 71,624 27,861 30,869 34,947 28,170 11,673 8,763 20,990Quinupristin/
dalfopristin102,858 49,912 12,724 4,158 12,782 7,679 0 8,607 4,321 10,307
Total antifungals 3,710,465 2,926,270 2,011,050 1,458,489 1,605,573 1,513,837 1,343,056 1,154,256 1,268,795 1,268,498Amphotericin B 64,503 50,567 16,528 1,138 1,126 1,108 1,451 742 660 4,511ABLC 1,591,090 1,977,355 1,139,801 440,191 464,585 276,213 241,977 157,147 151,587 152,960LAMP 1,383,179 15,528 12,137 41,623 52,473 267,896 90,221 237,551 175,303 189,373Fluconazole 604,611 461,486 369,196 361,525 342,970 337,820 251,431 51,127 54,829 31,959Voriconazole 0 0 234,367 341,298 340,649 374,922 385,788 400,351 505,229 486,359Caspofungin 23,949 137,780 124,073 222,690 359,473 184,608 172,443 23,956 28,162 26,958Micofungin 0 0 0 0 0 26,155 160,841 253,678 289,640 284,304
note. Costs are in US dollars. ABLC, amphotericin B lipid complex; FY, fiscal year; LAMP, liposomal amphotericin B.
this 2-year period, the costs of the antifungals as a class in-creased by approximately $100,000 (9.9%; ).P p .34
Utilization Costs by Hospital Location
Cost savings after the program was implemented were ob-served in all 3 major areas of the medical center: the cancercenter, the shock trauma center, and the main hospital (Table3). However, the savings that occurred during the first 3 yearsof implementation were most apparent in the cancer center(∼$2,000,000). Cost savings also occurred in the medical in-tensive care unit (MICU), the surgical ICU (SICU), and thetransplantation service.
Discontinuation of the Program
After the program was discontinued, cost increases were mostmarked in the main portion of the medical center
($1,585,957), with very little added cost occurring in the can-cer center. Costs in the shock trauma center also increased,but a new 12-bed ICU opened in this area at that time.Increases in costs after the ASP was terminated were alsonoted in the MICU and the SICU.
DDDs per 1,000 Patient-Days
Since 2004, we were able to obtain DDDs per 1,000 patient-days for all of the antimicrobial agents. These are indicated inTable 4 for selected antimicrobials and for the antimicrobialcategories. Overall, there was a significant decrease in DDDsfrom FY 2004 through FY 2008, when the program was ter-minated. Total antimicrobial DDDs per 1,000 patient-days de-creased by 439 (29%; ), and for antibacterial agentsP p .014they decreased by 323 (27.5%; ). DDDs per 1,000 pa-P p .03tient-days for antifungals and antivirals were also reduced, by
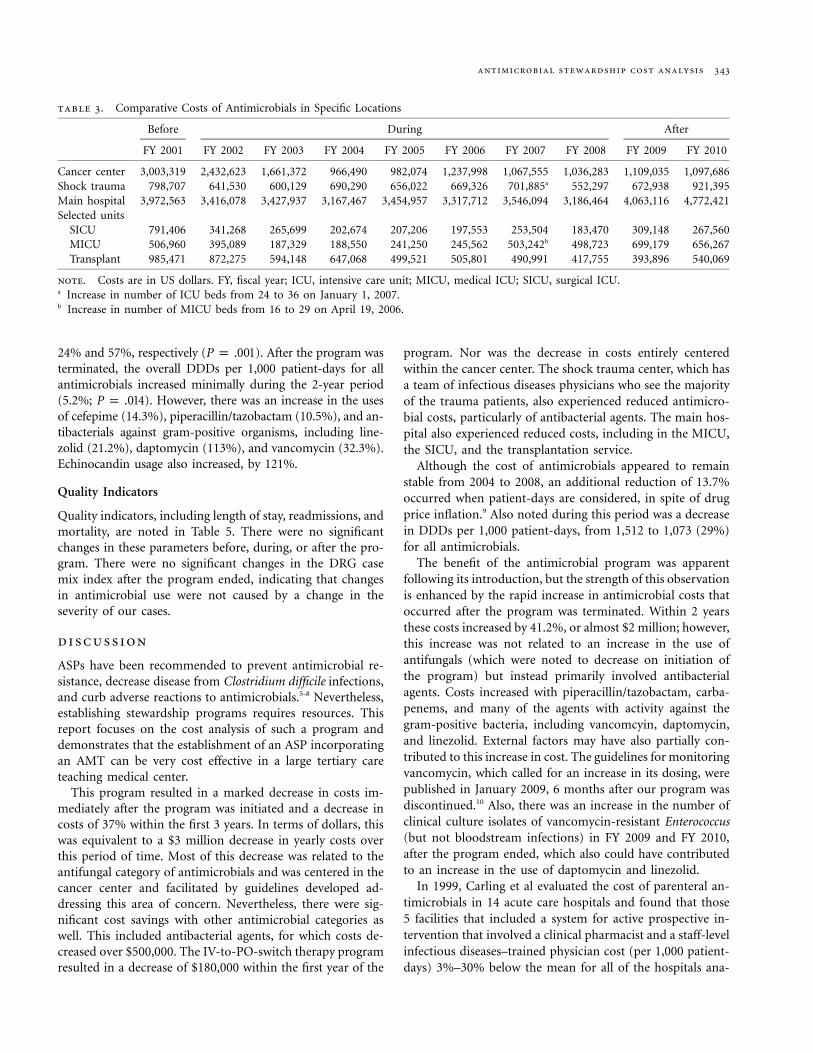
antimicrobial stewardship cost analysis 343
table 3. Comparative Costs of Antimicrobials in Specific Locations
Before During After
FY 2001 FY 2002 FY 2003 FY 2004 FY 2005 FY 2006 FY 2007 FY 2008 FY 2009 FY 2010
Cancer center 3,003,319 2,432,623 1,661,372 966,490 982,074 1,237,998 1,067,555 1,036,283 1,109,035 1,097,686Shock trauma 798,707 641,530 600,129 690,290 656,022 669,326 701,885a 552,297 672,938 921,395Main hospital 3,972,563 3,416,078 3,427,937 3,167,467 3,454,957 3,317,712 3,546,094 3,186,464 4,063,116 4,772,421Selected units
SICU 791,406 341,268 265,699 202,674 207,206 197,553 253,504 183,470 309,148 267,560MICU 506,960 395,089 187,329 188,550 241,250 245,562 503,242b 498,723 699,179 656,267Transplant 985,471 872,275 594,148 647,068 499,521 505,801 490,991 417,755 393,896 540,069
note. Costs are in US dollars. FY, fiscal year; ICU, intensive care unit; MICU, medical ICU; SICU, surgical ICU.a Increase in number of ICU beds from 24 to 36 on January 1, 2007.b Increase in number of MICU beds from 16 to 29 on April 19, 2006.
24% and 57%, respectively ( ). After the program wasP p .001terminated, the overall DDDs per 1,000 patient-days for allantimicrobials increased minimally during the 2-year period(5.2%; ). However, there was an increase in the usesP p .014of cefepime (14.3%), piperacillin/tazobactam (10.5%), and an-tibacterials against gram-positive organisms, including line-zolid (21.2%), daptomycin (113%), and vancomycin (32.3%).Echinocandin usage also increased, by 121%.
Quality Indicators
Quality indicators, including length of stay, readmissions, andmortality, are noted in Table 5. There were no significantchanges in these parameters before, during, or after the pro-gram. There were no significant changes in the DRG casemix index after the program ended, indicating that changesin antimicrobial use were not caused by a change in theseverity of our cases.
discussion
ASPs have been recommended to prevent antimicrobial re-sistance, decrease disease from Clostridium difficile infections,and curb adverse reactions to antimicrobials.5-8 Nevertheless,establishing stewardship programs requires resources. Thisreport focuses on the cost analysis of such a program anddemonstrates that the establishment of an ASP incorporatingan AMT can be very cost effective in a large tertiary careteaching medical center.
This program resulted in a marked decrease in costs im-mediately after the program was initiated and a decrease incosts of 37% within the first 3 years. In terms of dollars, thiswas equivalent to a $3 million decrease in yearly costs overthis period of time. Most of this decrease was related to theantifungal category of antimicrobials and was centered in thecancer center and facilitated by guidelines developed ad-dressing this area of concern. Nevertheless, there were sig-nificant cost savings with other antimicrobial categories aswell. This included antibacterial agents, for which costs de-creased over $500,000. The IV-to-PO-switch therapy programresulted in a decrease of $180,000 within the first year of the
program. Nor was the decrease in costs entirely centeredwithin the cancer center. The shock trauma center, which hasa team of infectious diseases physicians who see the majorityof the trauma patients, also experienced reduced antimicro-bial costs, particularly of antibacterial agents. The main hos-pital also experienced reduced costs, including in the MICU,the SICU, and the transplantation service.
Although the cost of antimicrobials appeared to remainstable from 2004 to 2008, an additional reduction of 13.7%occurred when patient-days are considered, in spite of drugprice inflation.9 Also noted during this period was a decreasein DDDs per 1,000 patient-days, from 1,512 to 1,073 (29%)for all antimicrobials.
The benefit of the antimicrobial program was apparentfollowing its introduction, but the strength of this observationis enhanced by the rapid increase in antimicrobial costs thatoccurred after the program was terminated. Within 2 yearsthese costs increased by 41.2%, or almost $2 million; however,this increase was not related to an increase in the use ofantifungals (which were noted to decrease on initiation ofthe program) but instead primarily involved antibacterialagents. Costs increased with piperacillin/tazobactam, carba-penems, and many of the agents with activity against thegram-positive bacteria, including vancomcyin, daptomycin,and linezolid. External factors may have also partially con-tributed to this increase in cost. The guidelines for monitoringvancomycin, which called for an increase in its dosing, werepublished in January 2009, 6 months after our program wasdiscontinued.10 Also, there was an increase in the number ofclinical culture isolates of vancomycin-resistant Enterococcus(but not bloodstream infections) in FY 2009 and FY 2010,after the program ended, which also could have contributedto an increase in the use of daptomycin and linezolid.
In 1999, Carling et al evaluated the cost of parenteral an-timicrobials in 14 acute care hospitals and found that those5 facilities that included a system for active prospective in-tervention that involved a clinical pharmacist and a staff-levelinfectious diseases–trained physician cost (per 1,000 patient-days) 3%–30% below the mean for all of the hospitals ana-

344 infection control and hospital epidemiology april 2012, vol. 33, no. 4
table 4. Defined Daily Doses per 1,000 Patient-Days of Selected Antimicrobials
During program After program
FY 2004 FY 2005 FY 2006 FY 2007 FY 2008 FY 2009 FY 2010
Total antibacterials 1,174 1,023 1,023 990 851 868 867Quinolones 123 103 100 96 88 81 78Moxifloxacin 1 1 6.9 41 36 32 32Gatifloxacin 99 81 59 0 0 0 0Ciprofloxacin 17 19 28 54 52 49 46
Cephalosporins 201 177 181 190 163 152 159Cefepime 57 54 57 70 56 59 64
PenicillinsPiperacillin/tazobactam 98 92 100 91 76 95 84
Carbapenems 25 24 19 26 28 30 30Doripenem 0 0 0 0 0 14 21Imipenem 23 23 17 20 22 8.3 0Meropenem 2.5 0.7 1.6 3.1 2.8 5.4 3.9Ertapenem 0.5 1.3 0.8 2.7 3.3 2.9 5.1
MiscellaneousLinezolid 16.0 12.5 16.5 20.2 15.6 19.6 18.9Daptomycin 1.0 2.2 7.4 10.9 6.8 10.2 14.5Vancomycin 85.1 92.6 107 106 99 98 131Colistin 0.3 0 0 0.1 0.1 3.2 7.7Tigecycline 0 0 0 0 8.7 13.2 9.2
Antifungals 150 129 129 123 120 139 142Fluconazole 78 63 66 61 69 71 66Voriconazole 28 22 27 24 25 31 29Caspofungin 4.6 9.1 5.7 7.2 0.4 0.4 0.4Micafungin 0 0 2.2 9.2 14 23 31
Total antivirals 142 99 125 116 63 79 81Total antimicrobials 1,512 1,303 1,321 1,272 1,073 1,125 1,129
note. FY, fiscal year.
lyzed, and all 5 had costs that were below the those of the 9hospitals that used only passive measures.3 Passive measuresincluded measures such as automatic stop orders, antimicro-bial order forms, limited formularies, measures to controlcontact between pharmaceutical representatives and prescrib-ers, educational intervention (eg, institutional guidelines forantibiotic use), and restricted antibiotic susceptibility re-porting by the microbiology laboratory. It was partially onthe basis of this report that we established an active programwith an AMT for active prospective antimicrobial monitoringand intervention.
Prior to initiating the program with the team, there wasrestriction of antimicrobials and a preauthorization processwas in place. Although this process was made simpler usinga “BUGS” beeper to call for preauthorization, the basic pro-cess that was in use prior to the initiation of the programremained in effect. The addition of the AMT, through real-time monitoring, assured that this preauthorization processwas followed and that the information given at the time ofthe request was accurate. Furthermore, after the program wasterminated, use of the “BUGS” beeper for authorization con-tinued but the antimicrobial team was no longer present toassure that the information given to request the antimicro-
bials was accurate and that the release of the antimicrobialsadhered to the policies of the medical center and were ap-propriate in the treatment situation. Thus, the major imple-mentation in the program was the addition of the AMT.
Another component of the ASP, which enhanced the ef-fectiveness of the AMT, was the use of a computer decisionsupport system.4 Indeed, this was developed to do what theAMT was already doing, but to make the team more efficientin their duties. This computer program organized and alertedthe AMT when restricted drugs were ordered and indicatedwhere the patient resided, other medications the patient wasreceiving, and microbiologic laboratory results. In additionto notifications of patients receiving “restricted” antimicro-bials, some other alerts included notification if a patient wasreceiving double antimicrobial coverage or no antimicrobialcoverage for an identified pathogen and identification of po-tential candidates for the switch from IV to oral therapy andpatients who had received 5 days of antimicrobial therapywithout the isolation of potential pathogens. In a carefullycontrolled blinded study, it was projected that this systemsaved the UMMC over $600,000, compared with the use ofthe antimicrobial team without the decision-support systemif it were used in the major portion of the medical facility

antimicrobial stewardship cost analysis 345
table 5. Hospital Quality Statistics Before, During, and After the Stewardship Program
Before During After
FY 2001 FY 2002 FY 2003 FY 2004 FY 2005 FY 2006 FY 2007 FY 2008 FY 2009 FY 2010
Admissions 28,667 28,959 29,702 30,507 30,079 34,752 35,888 35,982 36,447 38,590Patient-days 175,971 180,416 183,122 184,247 185,462 184,903 192,568 191,697 201,154 205,232LOS 6.1 6.2 6.18 6.05 6.37 5.48 5.56 5.54 5.74 5.55Unplanned
readmissions 1,533 1,290 1,232 1,496 1,652 1,735 2,080 2,218 2,375 2,164% of
admissions 5.30 4.50 4.10 4.90 4.96 4.99 5.80 6.15 6.02 5.75Mortality 867 901 908 876 898 1,019 970 983 948 981
% ofadmissions 3.0 3.1 3.1 2.9 2.9 2.6 2.8 2.7 2.7 2.5
DRG CMI ... 1.638 1.701 1.752 1.792 1.779 1.788 1.762 1.742 1.741
note. DRG CMI, drug-related group case mix index; FY, fiscal year; LOS, length of stay.
for an entire year. When the stewardship program was ter-minated, the decision-support system was also not continued.
The stewardship program was discontinued because of somedissatisfaction over the preauthorization requirements as wellas so that the funding for the program could be used to providepersonnel for additional infectious diseases consultationthroughout the medical center. The rationale for this changewas that infectious diseases experts were the best trained in-dividuals to make the necessary decisions for appropriate ther-apy in this difficult patient population and thereby could pro-vide antimicrobial stewardship, therefore, rendering the AMTredundant. We cannot say for certain that this would not bean effective strategy, given more time. However, costs havecontinued to increase and the quality markers have remainedstable, suggesting that more and more costly antimicrobials arebeing used, with no obvious increase in benefit.
In summary, the ASP with a preauthorization protocolusing a “BUGS” beeper, an AMT to assure appropriate use,and computer decision-support assistance was an extremelycost-effective model for antimicrobial stewardship over a pe-riod of 7 years, and its discontinuation has proven to be verycostly. On the basis of this information an ASP using an AMThas been restarted, but an automatic infectious diseases con-sult has replaced the preauthorization requirement for “re-stricted” antimicrobials.
acknowledgments
We would like to thank the following for their help in developing and main-taining the Antimicrobial Stewardship Program: for the development of theprogram: David Rorison, MD, MBA (senior vice president of medical affairs),Sherry Perkins, PhD, RN (vice president for clinical effectiveness), and Mi-chael Donnenberg, MD (chief of the division of infectious diseases); fromthe antimicrobial team: Molly Kent, Pharm D; regarding policy and guide-lines: Michael Kleinberg, MD (division of infectious diseases); and for dataanalysis: Marshall Bryant (pharmacy service).
Potential conflicts of interest. All authors report no potential conflicts ofinterest relevant to this article. All authors submitted the ICMJE Form for
Disclosure of Potential Conflicts of Interest, and the conflicts that the editorsconsider relevant to this article are disclosed here.
Address correspondence to Harold C. Standiford, MD, Medical Directorfor Antimicrobial Stewardship, University of Maryland Medical Center, 110South Paca Street, 6th Floor, Baltimore, MD 21201 ([email protected]).
references
1. Boucher HW, Talbot GH, Bradley JS, et al. Bad bugs, no drugs:no ESKAPE! an update from the Infectious Diseases Society ofAmerica. Clin Infect Dis 2009;48:1–12.
2. Dellit TH, Owens RC, McGowan JE, et al. Infectious DiseasesSociety of America and the Society for Healthcare Epidemiologyof America guidelines for developing an institutional programto enhance antimicrobial stewardship. Clin Infect Dis 2007;44:159–177.
3. Carling PC, Fung T, Coldiron JS. Parenteral antibiotic use inacute-care hospitals: a standardized analysis of fourteen insti-tutions. Clin Infect Dis 1999;29:1189–1196.
4. McGregor JC, Weekes E, Forrest GN, et al. Impact of a com-puterized decision support system on reducing inappropriateantimicrobial use: a randomized controlled trial. J Am Med In-form Assoc 2006;13:378–384.
5. Carling P, Fung T, Killion A, et al. Favorable impact of a mul-tidisciplinary antibiotic management program conducted during7 years. Infect Control Hosp Epidemiol 2003;24:699–706.
6. Stevens V, Dumyati G, Fine S, et al. Cumulative antibiotic ex-posures over time and the risk of Clostridium difficile infection.Clin Infect Dis 2011;53:42–48.
7. Fishman N. Antimicrobial stewardship. Am J Med 2006;119:S53–S61.
8. Singh N, Rogers P, Atwood CW, et al. Short-course empiricantibiotic therapy for patients with pulmonary infiltrates in theintensive care unit. Am J Respir Crit Care Med 2000;162:505–511.
9. Hoffman JM, Shan ND, Vermeulen LC, Schumock GT, GrimP, Hunkler RJ, Hontz KM. Projecting future drug expenditures:2007. Am J Health Syst Pharm 2007;64:298–314.
10. Rybak M, Lomaestro B, Rotschafer JC, et al. Therapeutic mon-itoring of vancomycin in adult patients: a consensus review ofthe American Society of Health-System Pharmacists, the Infec-tious Diseases Society of America, and the Society of InfectiousDiseases Pharmacists. Am J Health Syst Pharm 2009;66:82–98.


![Hospital Acquired Infections, Sources, Route of …...hospital acquired infections worldwide is Enterococci [17]. Three to seven percent of hospital-acquired bacterial infections are](https://static.fdocuments.in/doc/165x107/5e8d2da3c3edfd174827a4ae/hospital-acquired-infections-sources-route-of-hospital-acquired-infections.jpg)