Horizontal Permeameter
28
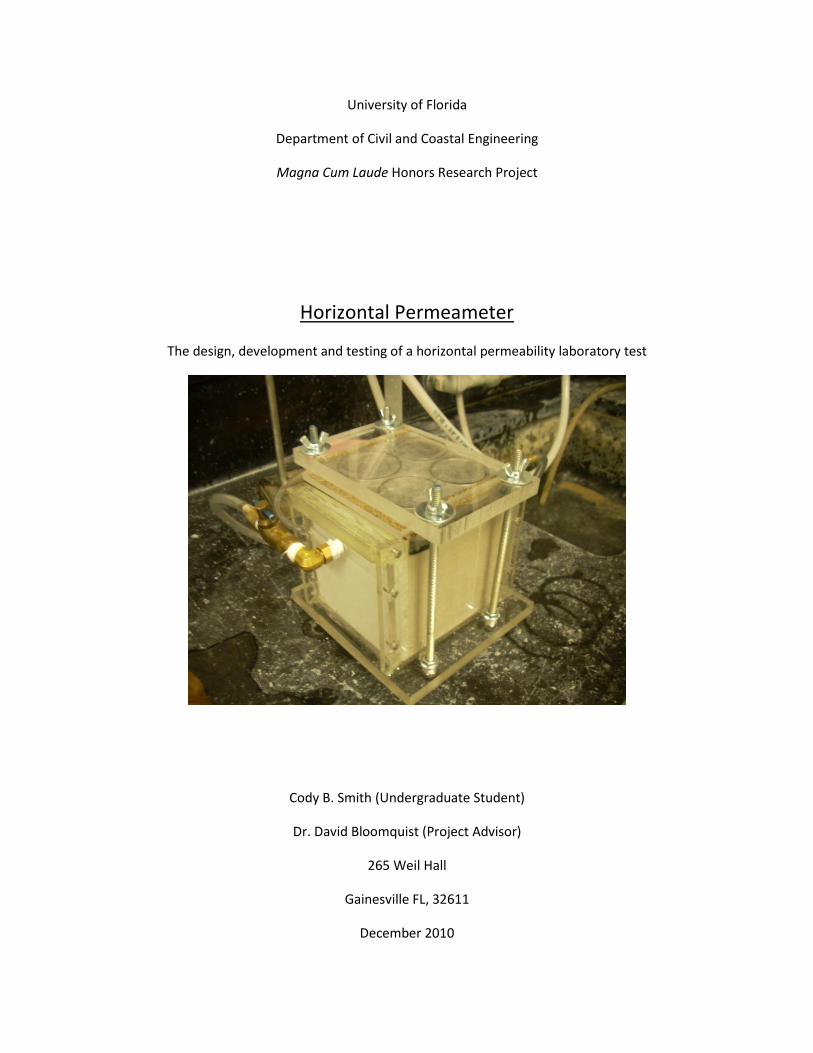
University of Florida Department of Civil and Coastal Engineering Magna Cum Laude Honors Research Project Horizontal Permeameter The design, development and testing of a horizontal permeability laboratory test Cody B. Smith (Undergraduate Student) Dr. David Bloomquist (Project Advisor) 265 Weil Hall Gainesville FL, 32611 December 2010
Transcript of Horizontal Permeameter
University of Florida
Department of Civil and Coastal Engineering
Magna Cum Laude Honors Research Project
Horizontal Permeameter
The design, development and testing of a horizontal permeability laboratory test
Cody B. Smith (Undergraduate Student)
Dr. David Bloomquist (Project Advisor)
265 Weil Hall
Gainesville FL, 32611
December 2010
1
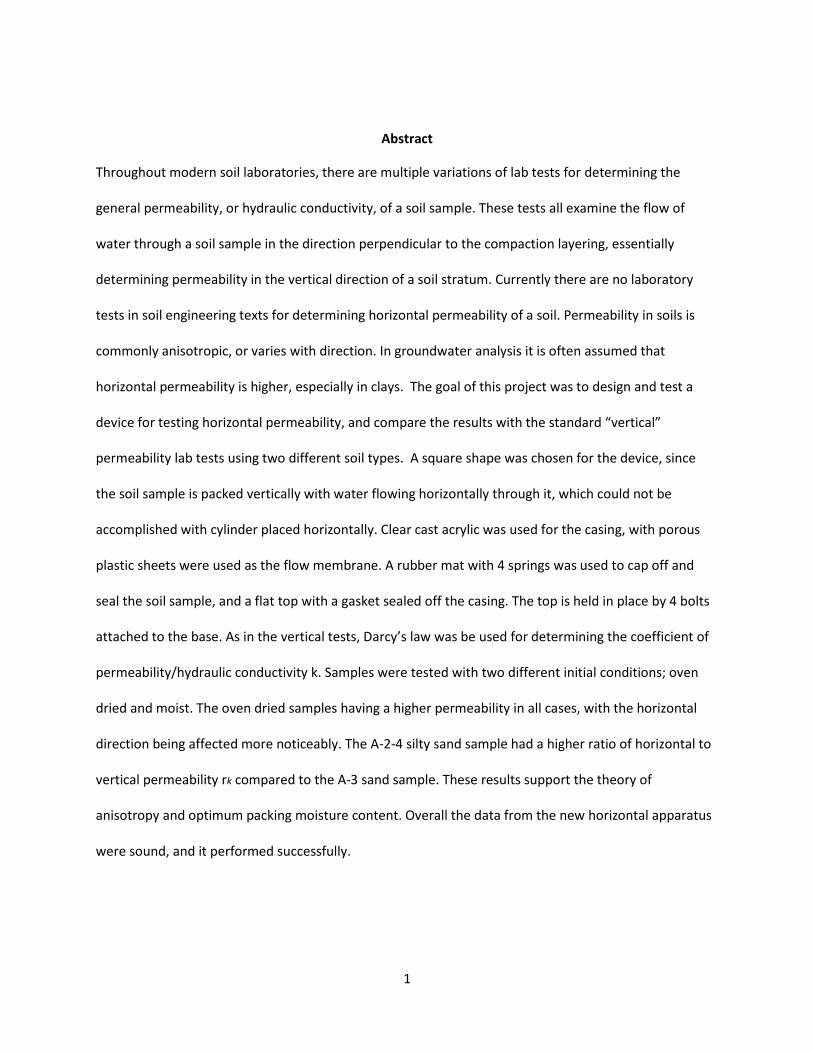
Abstract
Throughout modern soil laboratories, there are multiple variations of lab tests for determining the
general permeability, or hydraulic conductivity, of a soil sample. These tests all examine the flow of
water through a soil sample in the direction perpendicular to the compaction layering, essentially
determining permeability in the vertical direction of a soil stratum. Currently there are no laboratory
tests in soil engineering texts for determining horizontal permeability of a soil. Permeability in soils is
commonly anisotropic, or varies with direction. In groundwater analysis it is often assumed that
horizontal permeability is higher, especially in clays. The goal of this project was to design and test a
device for testing horizontal permeability, and compare the results with the standard “vertical”
permeability lab tests using two different soil types. A square shape was chosen for the device, since
the soil sample is packed vertically with water flowing horizontally through it, which could not be
accomplished with cylinder placed horizontally. Clear cast acrylic was used for the casing, with porous
plastic sheets were used as the flow membrane. A rubber mat with 4 springs was used to cap off and
seal the soil sample, and a flat top with a gasket sealed off the casing. The top is held in place by 4 bolts
attached to the base. As in the vertical tests, Darcy’s law was be used for determining the coefficient of
permeability/hydraulic conductivity k. Samples were tested with two different initial conditions; oven
dried and moist. The oven dried samples having a higher permeability in all cases, with the horizontal
direction being affected more noticeably. The A-2-4 silty sand sample had a higher ratio of horizontal to
vertical permeability rk compared to the A-3 sand sample. These results support the theory of
anisotropy and optimum packing moisture content. Overall the data from the new horizontal apparatus
were sound, and it performed successfully.
2
Table of Contents
Title Page
Abstract……………………………………………………………………………………………………………………............................... 1
1.0 Introduction……………………………………………………………………………………………………….…………………………….3
11.1 Problem Statement…………………………………………………………………………….…………………………….……...4
2.0 Current Procedures……………………………………………………………………………………….…………………………………4
2.1 Vertical Rigid Walled Permeameters………………………………………………………….………………….……………4
2.1.1 Constant Head Test Method………………………………………………………………………………………...……….…5
2.1.2 Falling Head Test Method…..………………………………………………………………………………………….………..6
2.2 Limitations of Laboratory Testing……………………………………………………………………………………….……….8
3.0 Development of the Horizontal Permeameter..……………………………………………………………………….………8
3.1 Design Considerations………………………..……………………………………………………………………………….………8
3.2 Design Features…………………………………………………………………………………………………………………….…….9
3.3 Testing Procedures…………………………………………………………………………………………………………..……….13
4.0 Results…………………………………………………………………………………………………………………………………………....16
4.1 Tables………………………………………………………………………………………………………………………………………..16
4.2 Charts…………………………………………………………………………………………………………………………………..…..17
4.3 Data Analysis………………………………………………………………………………………………………………………..…..19
5.0 Conclusions and Recommendations……………………………………………………………………………………..…..….…20
5.1 Conclusions……………………………………………………………………..…………………………………………………..…...20
5.2 Recommendations………………………………………………..…………….…………………………………………………….20
6.0 Appendices……………………………………………………………………………………………………………………………………..23
6.1 Experimental Data…………………………………………………………………………………………………………………….23
6.2 Additional Images……………………………………………………………………………….…………………………………….25
6.3 References……………………………………………………………………………………………………………..…………………27

3
1.0 Introduction
Of the many properties of soils studied for engineering purposes, none is as variable and difficult to
quantify as permeability. Also known as hydraulic conductivity, the permeability of soils can vary over
many orders of magnitude, with coarse grained soils at the high end of the spectrum to fine grained and
clayey soils at the lower end. These values often vary even within a single deposit due to stratification
and layering of different soils. Permeability is important to engineers because it is needed to analyze
geotechnical problems such as seepage, consolidation, and stability. This can apply to the design of
everything from damns and earthen walls to landfills and foundations.
Permeability is controlled by many factors, such as void ratio, pore size, water content, degree
of saturation, confining pressure, electrolyte content and particle orientation. The fabric of a soil is
broken down into three levels; the microfabric, minifabric, and macrofabric. The microfabric consists of
regular aggregations of particles pores generally around 1µm in size and allows little water flow. The
minifabric consists of aggregations and pore spaces between the aggregations, generally 10’s of µm’s in
size. These larger channels have much less resistance to flow, and largely contribute to total
permeability values. The macrofabric consists of the cracks, fissures, and laminations, and is where the
greatest flow occurs. This usually dwarfs flow within the other layers, and is responsible for the
variations in permeability within a deposit (Mitchell, 1993). Understanding the composition of a soil’s
structure is very important regarding permeability, as variations in a soil of a constant void ratio can
yield very different values.
Soils are also generally anisotropic, meaning that permeability varies between the vertical and
horizontal direction. This is most common in clays, which have an average ratio of horizontal to vertical
permeability of two, but can range from less than one up to seven (Mitchell, 1993). This is a result of the
orientation of the elongated plate-like particles that are characteristic of clays, allowing much more flow

4
in the direction parallel to the platelets than in the perpendicular direction. Clays can be virtually
impermeable in the perpendicular direction with the right conditions, which is why they are used in
waste containment applications. Knowledge of these ratios can be applied to help predict rates of
groundwater flow and consolidation within a soil deposit.
Table 1.1: Typical values for Hydraulic Conductivity k
Hydraulic Conductivity k (cm/sec)
Soil type Particle Diameter
(mm) Permeability Range
1 to 10¯³ Gravel 10 to 2 High
10¯² to 10¯⁵ Clean sand 2 to 5x10¯²
Medium
10¯³ to 10¯⁷ Silty Sand Medium to low
10¯⁵ to 10¯⁹ Silt 5x10¯² to 5x10¯³ Low to very low
10¯⁹ to 10¯¹² Clay 5x10¯³ to 1x10¯⁴ Practically Impervious Based on USBS (Niing and Likos, 2004, pg.332)
1.1 Problem Statement
Due to the importance of hydraulic flow characteristics of a soil, various field and laboratory
tests have been developed to measure permeability. While there are many lab tests available for testing
general permeability of soils in the vertical direction perpendicular to layering, no test is currently
available in soil engineering texts for determining horizontal permeability. The standard tests will be
referred to as vertical permeability tests in this paper. The goal of this project is to design and test such
an apparatus which can be easily integrated into the standard vertical permeability lab tests, and to
determine if tests yield accurate results.
2.0 Current Procedures
2.1 Vertical Rigid Walled Permeameter
The common vertical permeability lab tests are comprised of a cylindrical casing held in place by
a metal base and head. The base has an intake port for water inflow, and an outflow port in the head. A
5
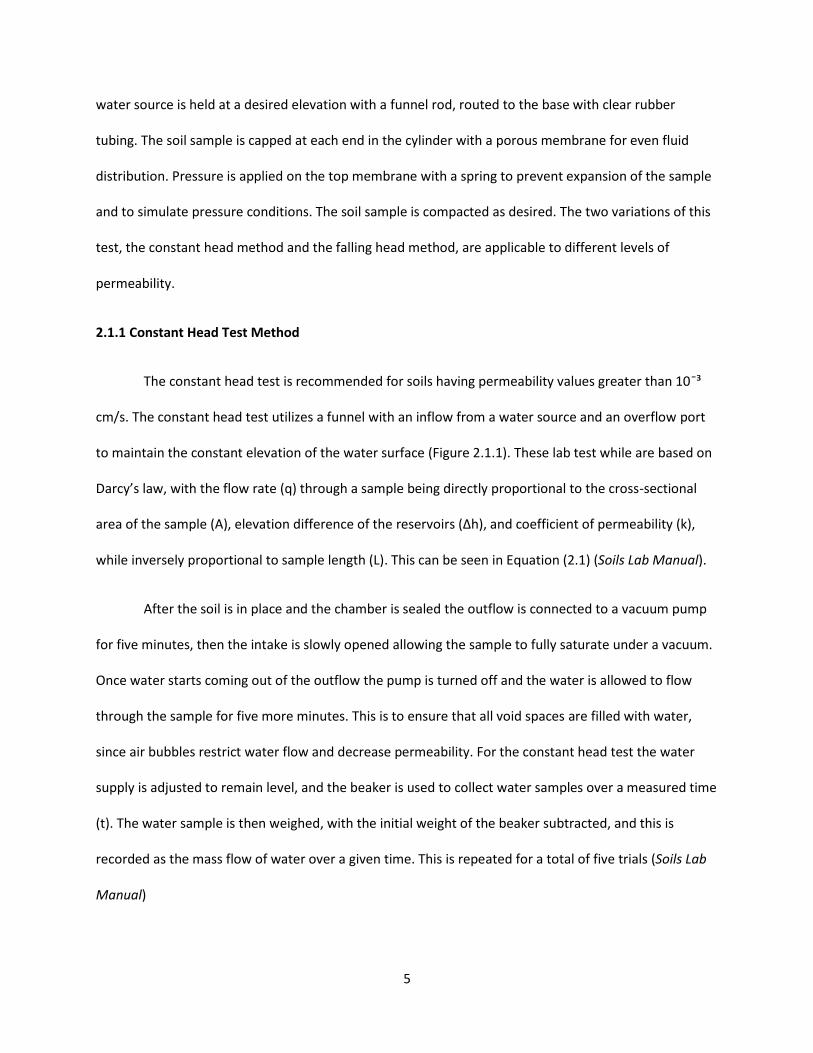
water source is held at a desired elevation with a funnel rod, routed to the base with clear rubber
tubing. The soil sample is capped at each end in the cylinder with a porous membrane for even fluid
distribution. Pressure is applied on the top membrane with a spring to prevent expansion of the sample
and to simulate pressure conditions. The soil sample is compacted as desired. The two variations of this
test, the constant head method and the falling head method, are applicable to different levels of
permeability.
2.1.1 Constant Head Test Method
The constant head test is recommended for soils having permeability values greater than 10¯³
cm/s. The constant head test utilizes a funnel with an inflow from a water source and an overflow port
to maintain the constant elevation of the water surface (Figure 2.1.1). These lab test while are based on
Darcy’s law, with the flow rate (q) through a sample being directly proportional to the cross-sectional
area of the sample (A), elevation difference of the reservoirs (Δh), and coefficient of permeability (k),
while inversely proportional to sample length (L). This can be seen in Equation (2.1) (Soils Lab Manual).
After the soil is in place and the chamber is sealed the outflow is connected to a vacuum pump
for five minutes, then the intake is slowly opened allowing the sample to fully saturate under a vacuum.
Once water starts coming out of the outflow the pump is turned off and the water is allowed to flow
through the sample for five more minutes. This is to ensure that all void spaces are filled with water,
since air bubbles restrict water flow and decrease permeability. For the constant head test the water
supply is adjusted to remain level, and the beaker is used to collect water samples over a measured time
(t). The water sample is then weighed, with the initial weight of the beaker subtracted, and this is
recorded as the mass flow of water over a given time. This is repeated for a total of five trials (Soils Lab
Manual)

6
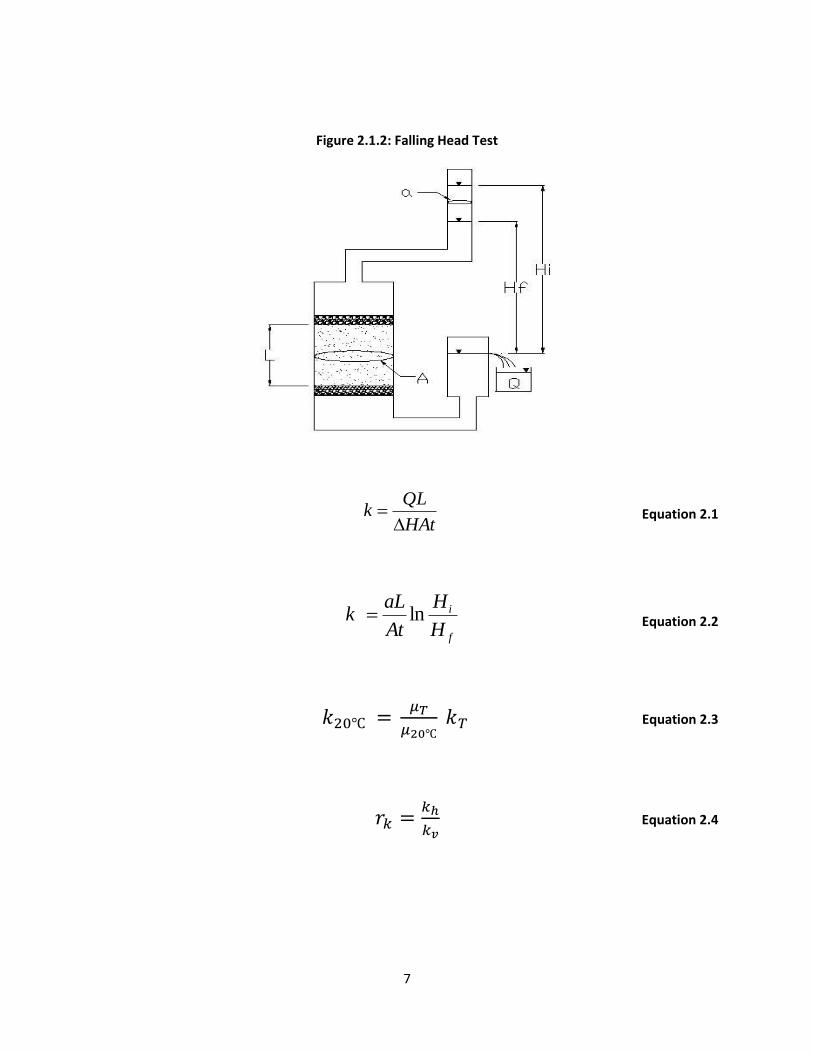
2.1.2 Falling Head Test Method
The falling head test is usually used with soils having coefficient of permeability values that are
less than 10¯³ cm/s. It follows the same procedure as the constant head test, but instead of maintaining
a constant supply water elevation the source is cut off for the trial and the time is recorded for the
elevation to change over a known distance. A clear glass burette with markings is usually used (Figure
2.1.2). These initial and final elevations are used with the same sample values in the constant head test
to determine the coefficient of permeability using Equation (2.2). The temperature of the water is also
measured and recorded, which is used to adjust the coefficient of permeability the standard at 20°C
using the ratio of dynamic viscosities (µ) of water at the two temperatures in Equation (2.3) (Soils Lab
Manual).
Figure 2.1.1: Constant Head Test
7
Figure 2.1.2: Falling Head Test
HAt
QLk
Equation 2.1
f
i
H
H
At
aLk ln Equation 2.2
𝑘20℃ = 𝜇𝑇
𝜇20℃ 𝑘𝑇 Equation 2.3
𝑟𝑘 =𝑘ℎ
𝑘𝑣 Equation 2.4

8
2.2 Limitations of Laboratory Testing
The laboratory sample temperature, pressure, hydraulic gradient, and pore fluid chemistry
should simulate field conditions for the most accurate results, but this is difficult to replicate. Moisture
content and compaction rate is a very important factor in simulating the field conditions, and can greatly
vary the results of a sample. Compaction of a dry sample allows particles to flocculate resulting in a high
resistance to rearrangement and larger pores, while compaction of a moist sample disperses particles
and results in weaker particle groups that are less resistant to rearrangement with smaller pores. Tests
have shown that the re-molding of undisturbed soft clays can decrease horizontal permeability by a
factor of four (Mitchel).
While Darcy’s law is appropriate for low flow regimes and has been accepted as valid for such
applications, it has its limitations. Hydraulic gradients used in laboratory tests are often much greater
than those experienced in the field, which is because the long amounts of time required to test such
small gradients are often not economical. Tests have shown that at these low gradients the flow rate is
not always directly proportional in clays, with the presence of a threshold gradient when below no flow
exists. However this error is attributed to undetected experimental errors and equipment
contamination (Mitchel).
3.0 Development of the Horizontal Permeameter
3.1 Design Considerations
The vertical permeability testing methods discussed have been used successfully by many
scientists and engineers; however it accounts only for fluid flow in the direction parallel to the
compaction force and perpendicular to the soil layering. The proposed horizontal permeameter
operates under the same principles as the vertical permeameter, but allows for determination of fluid
9
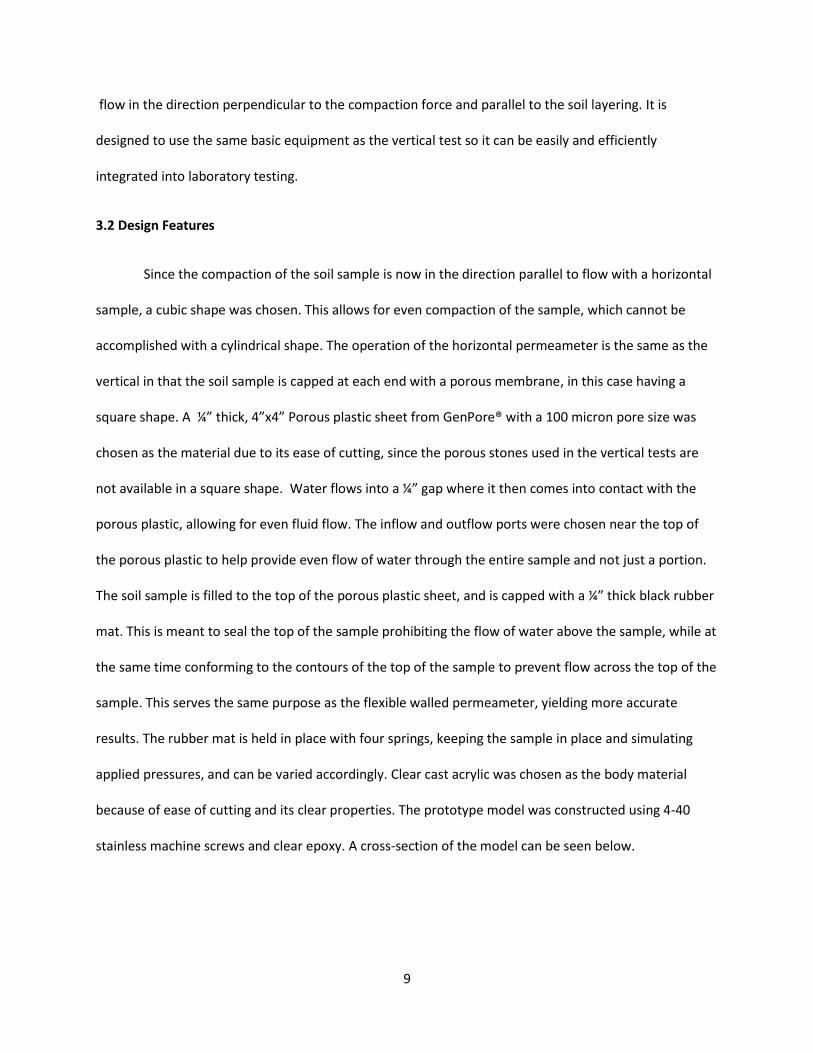
flow in the direction perpendicular to the compaction force and parallel to the soil layering. It is
designed to use the same basic equipment as the vertical test so it can be easily and efficiently
integrated into laboratory testing.
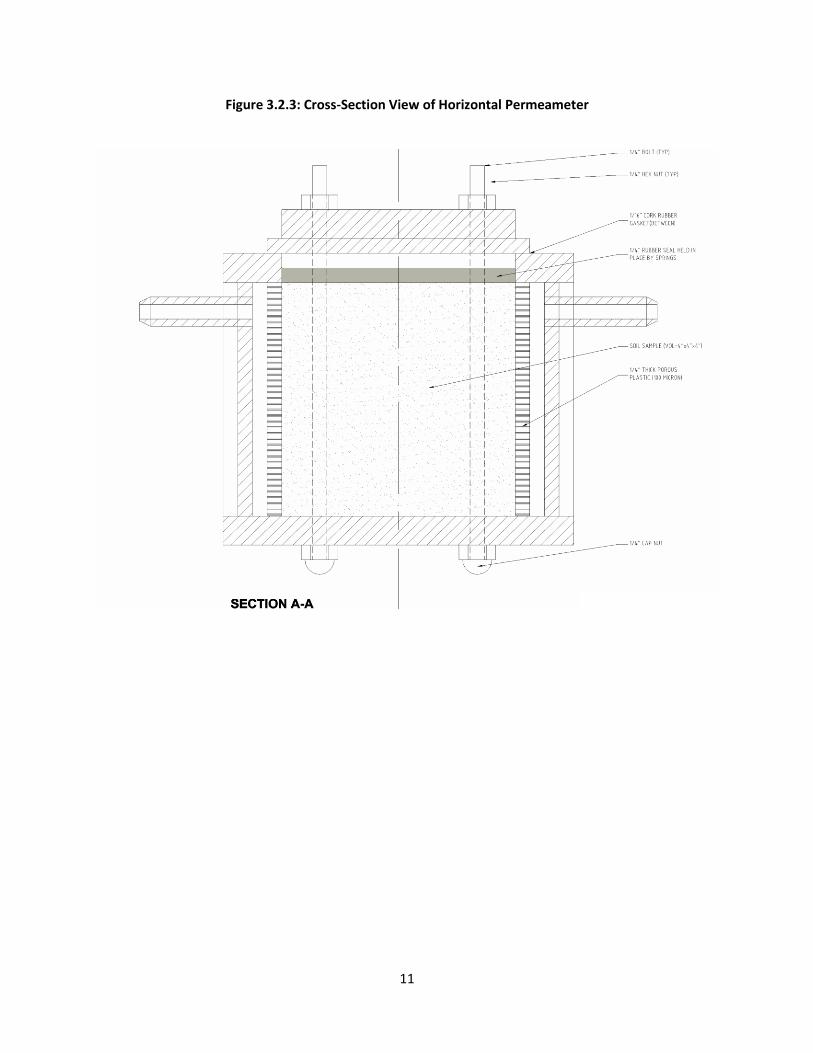
3.2 Design Features
Since the compaction of the soil sample is now in the direction parallel to flow with a horizontal
sample, a cubic shape was chosen. This allows for even compaction of the sample, which cannot be
accomplished with a cylindrical shape. The operation of the horizontal permeameter is the same as the
vertical in that the soil sample is capped at each end with a porous membrane, in this case having a
square shape. A ¼” thick, 4”x4” Porous plastic sheet from GenPore® with a 100 micron pore size was
chosen as the material due to its ease of cutting, since the porous stones used in the vertical tests are
not available in a square shape. Water flows into a ¼” gap where it then comes into contact with the
porous plastic, allowing for even fluid flow. The inflow and outflow ports were chosen near the top of
the porous plastic to help provide even flow of water through the entire sample and not just a portion.
The soil sample is filled to the top of the porous plastic sheet, and is capped with a ¼” thick black rubber
mat. This is meant to seal the top of the sample prohibiting the flow of water above the sample, while at
the same time conforming to the contours of the top of the sample to prevent flow across the top of the
sample. This serves the same purpose as the flexible walled permeameter, yielding more accurate
results. The rubber mat is held in place with four springs, keeping the sample in place and simulating
applied pressures, and can be varied accordingly. Clear cast acrylic was chosen as the body material
because of ease of cutting and its clear properties. The prototype model was constructed using 4-40
stainless machine screws and clear epoxy. A cross-section of the model can be seen below.

10
Figure 3.2.1: 3d Image of Horizontal Permeameter
Figure 3.2.2: Different Drawing Views of Horizontal Permeameter
11
Figure 3.2.3: Cross-Section View of Horizontal Permeameter
12
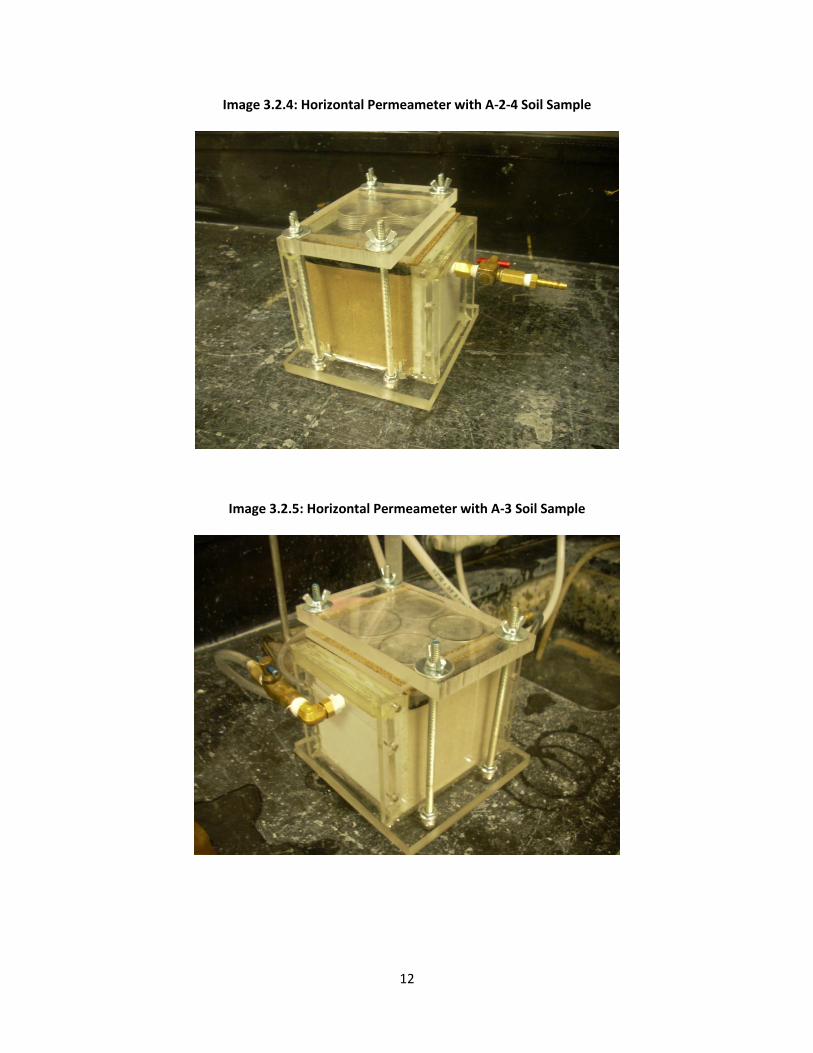
Image 3.2.4: Horizontal Permeameter with A-2-4 Soil Sample
Image 3.2.5: Horizontal Permeameter with A-3 Soil Sample

13
3.3 Testing Procedures
Since the horizontal permeameter is designed in a similar manner as the vertical, testing
procedures are very similar. The only difference is the preparation of the sample. The soil is poured into
the chamber from the top in layers and compacted to the desired density. The soil is to be filled to the
top of the white porous sheets, as seen in image 3.3.1. The sample has ¼’ give for where the sample
stops, because the rubber mat is ¼” thick and the sample cannot be placed above the porous sheets.
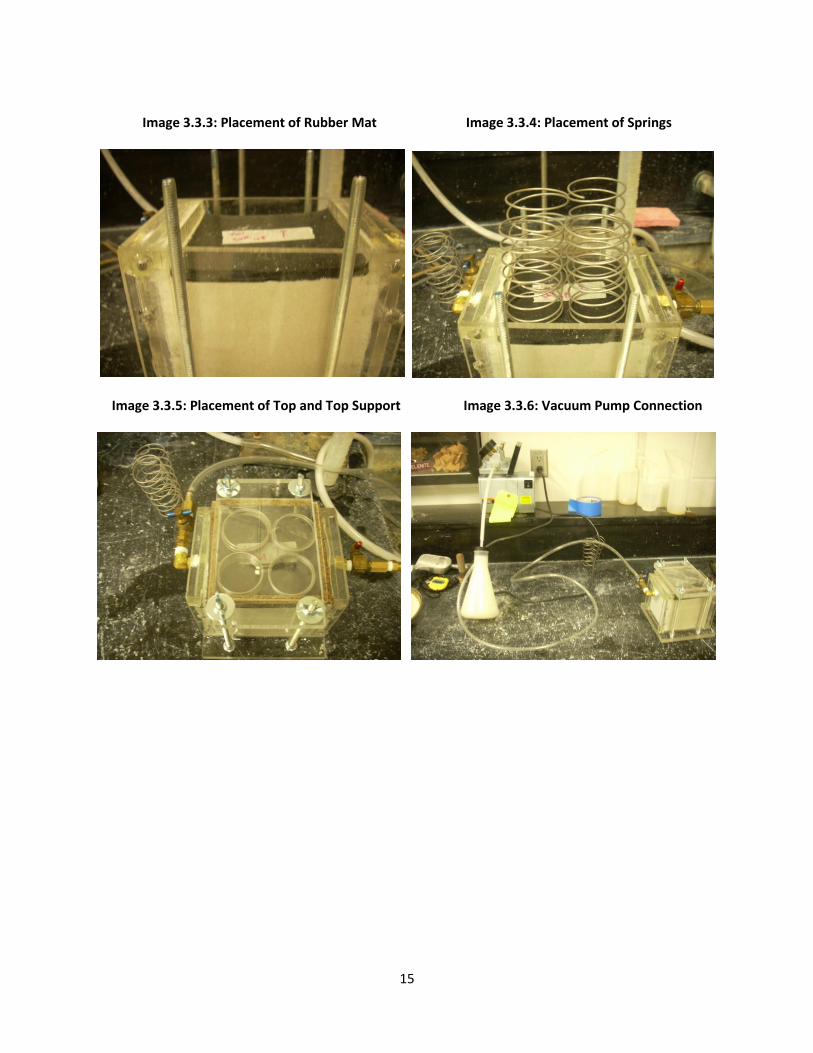
Once the soil has been flattened out, the rubber mat can be inserted on top of the sample. This is shown
in images 3.3.2 and 3.3.3. The rubber mat is forced down along the edges to ensure a good seal, and to
conform to the soil layer. Next the four springs are placed appropriately on top of the rubber mat, as
seen in image 3.3.4. Next the edge of the opening is cleaned of debris, and the gasket is lubricated and
placed around the opening. The first square top is then pushed down until it is in contact with the gasket
and the springs are not in prohibiting full closure. While the top is being held down with one hand, the
support top is placed over the top and fastened with the provided wing nuts. This is shown in image
3.3.5. The wing nuts only need to be hand tightened, ensuring an even seal.
Next the procedure follows the same steps as the vertical tests, with the application of the
vacuum pump and slow saturation of the sample. The user should maintain carefully control of the
intake flow to allow even saturation. Once the soil is saturated and water is coming through the outflow,
the intake can be slowly opened to the full position and the vacuum pump can be disconnected for
testing. When calculating the cross-sectional area of the sample, the base is constant at 10.31 cm, with
the height measured using a caliper. The length of the soil sample is also constant at 10.32 cm. the
elevation head is measure from the centerline of the outflow as in the vertical test. The same equation
is used as in the vertical tests.

14
Image 3.3.1: Placement of Sample
Image 3.3.2: Filling of the Sample to the Appropriate Level
15
Image 3.3.3: Placement of Rubber Mat Image 3.3.4: Placement of Springs
Image 3.3.5: Placement of Top and Top Support Image 3.3.6: Vacuum Pump Connection
16
4.0 Results
4.1 Tables
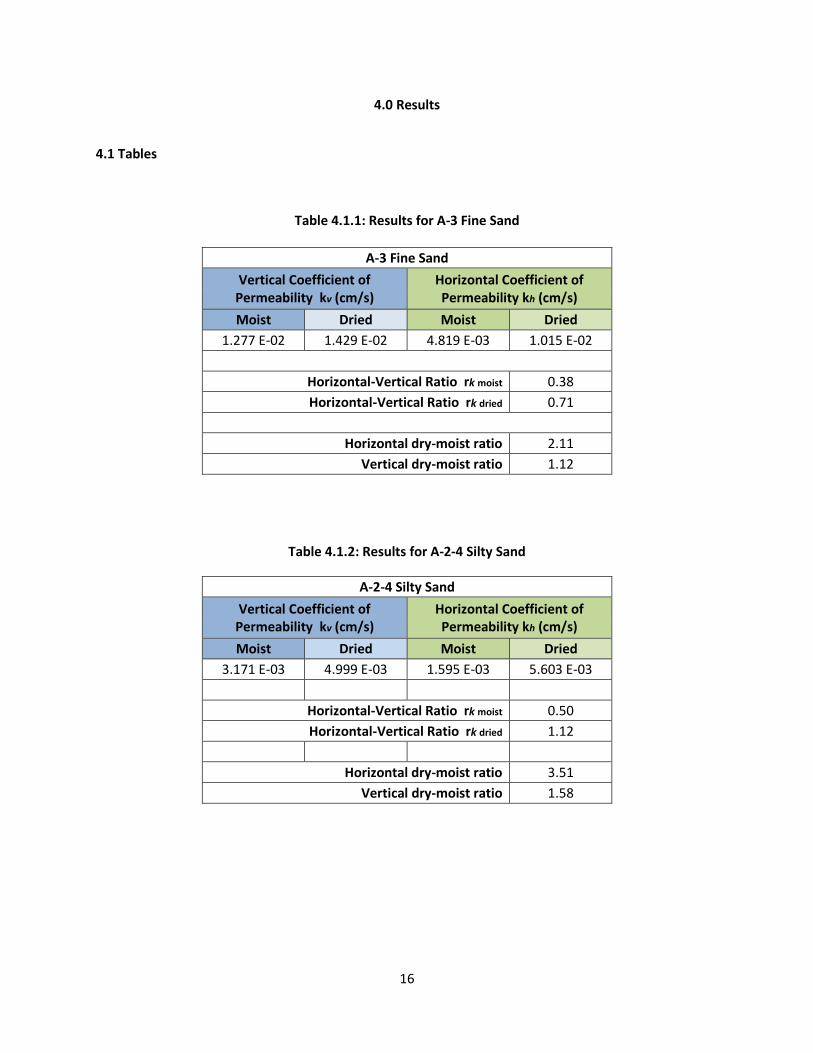
Table 4.1.1: Results for A-3 Fine Sand
A-3 Fine Sand
Vertical Coefficient of Permeability kv (cm/s)
Horizontal Coefficient of Permeability kh (cm/s)
Moist Dried Moist Dried
1.277 E-02 1.429 E-02 4.819 E-03 1.015 E-02
Horizontal-Vertical Ratio rk moist 0.38
Horizontal-Vertical Ratio rk dried 0.71
Horizontal dry-moist ratio 2.11
Vertical dry-moist ratio 1.12
Table 4.1.2: Results for A-2-4 Silty Sand
A-2-4 Silty Sand
Vertical Coefficient of Permeability kv (cm/s)
Horizontal Coefficient of Permeability kh (cm/s)
Moist Dried Moist Dried
3.171 E-03 4.999 E-03 1.595 E-03 5.603 E-03
Horizontal-Vertical Ratio rk moist 0.50
Horizontal-Vertical Ratio rk dried 1.12
Horizontal dry-moist ratio 3.51
Vertical dry-moist ratio 1.58
17
4.2 Charts
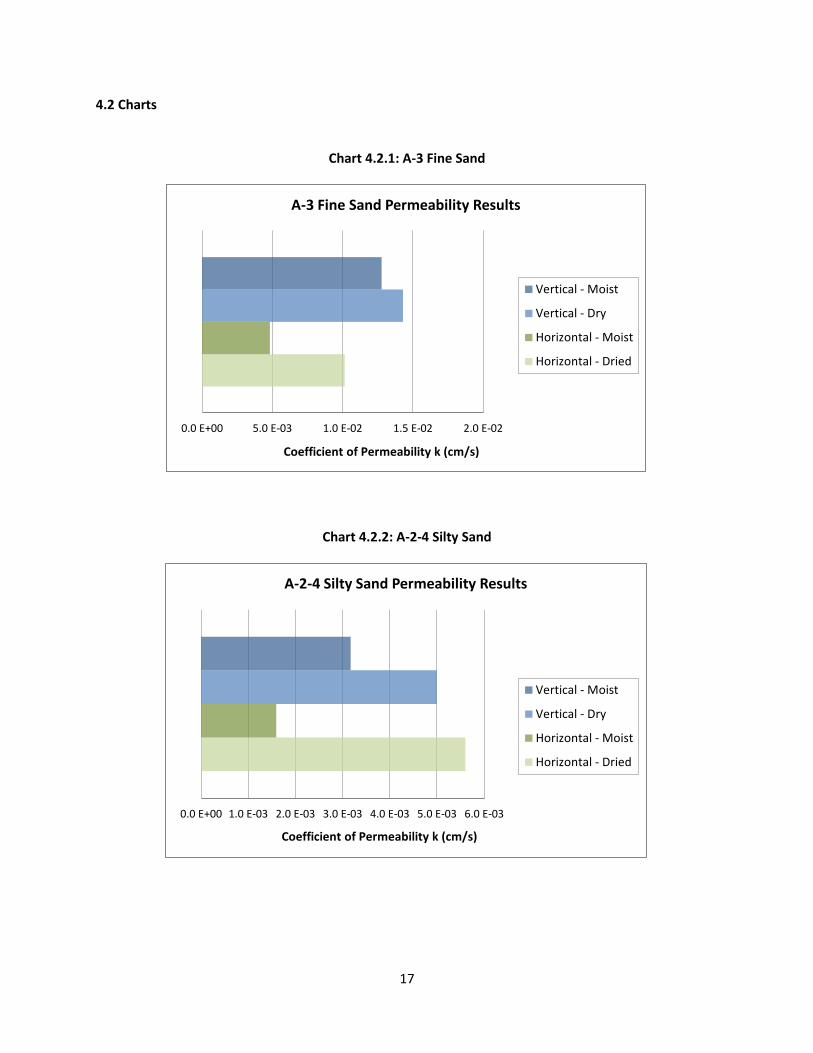
Chart 4.2.1: A-3 Fine Sand
Chart 4.2.2: A-2-4 Silty Sand
0.0 E+00 5.0 E-03 1.0 E-02 1.5 E-02 2.0 E-02
Coefficient of Permeability k (cm/s)
A-3 Fine Sand Permeability Results
Vertical - Moist
Vertical - Dry
Horizontal - Moist
Horizontal - Dried
0.0 E+00 1.0 E-03 2.0 E-03 3.0 E-03 4.0 E-03 5.0 E-03 6.0 E-03
Coefficient of Permeability k (cm/s)
A-2-4 Silty Sand Permeability Results
Vertical - Moist
Vertical - Dry
Horizontal - Moist
Horizontal - Dried
18
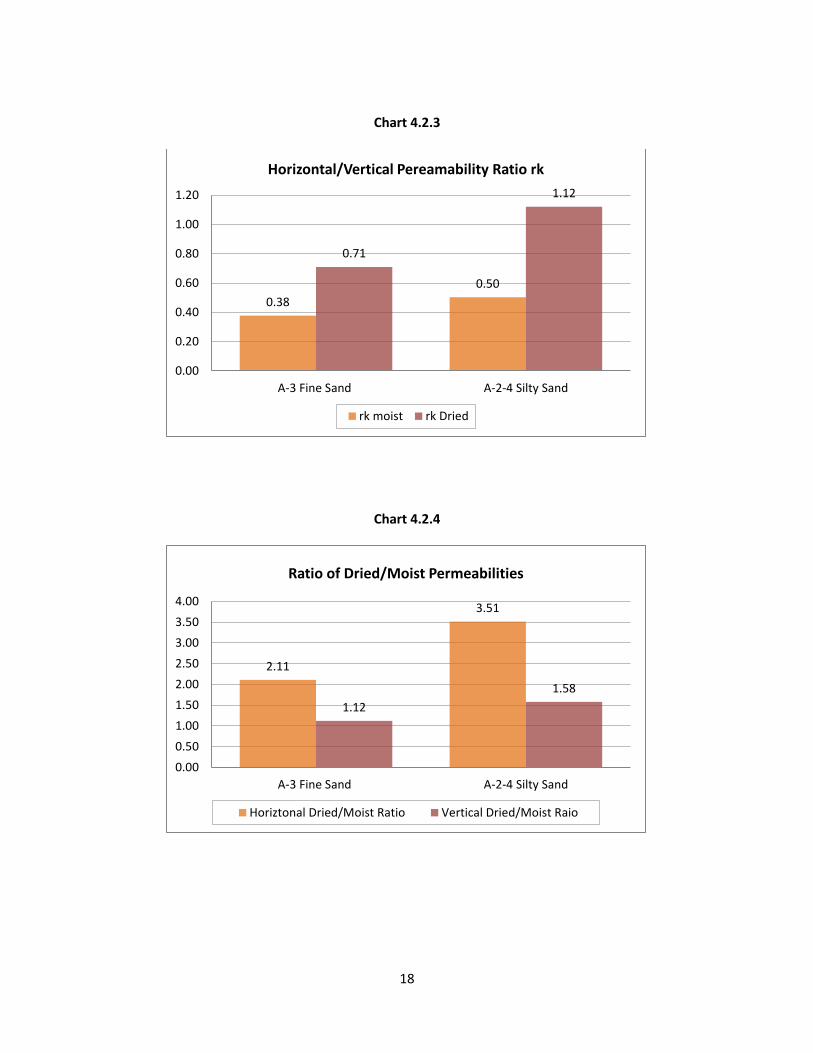
Chart 4.2.3
Chart 4.2.4
0.38
0.50
0.71
1.12
0.00
0.20
0.40
0.60
0.80
1.00
1.20
A-3 Fine Sand A-2-4 Silty Sand
Horizontal/Vertical Pereamability Ratio rk
rk moist rk Dried
2.11
3.51
1.12
1.58
0.00
0.50
1.00
1.50
2.00
2.50
3.00
3.50
4.00
A-3 Fine Sand A-2-4 Silty Sand
Ratio of Dried/Moist Permeabilities
Horiztonal Dried/Moist Ratio Vertical Dried/Moist Raio

19
4.3 Data Analysis
Standard vertical permeability lab tests in conjunction with horizontal permeability tests were
conducted on two soil groups, A-3 fine sand and A-2-4 silty Sand. Tests were conducted with initially
moist and initially oven dried samples for determination of the effect of water content. Results for the
coefficient of permeability k for the A-3 fine sand can be seen in Table 4.1.1 and Chart 4.1.1. Values in
the vertical direction were 1.227x10¯² cm/s for the moist sample and 1.429x10¯² cm/s for the dry
sample. Values in the horizontal direction were 4.819x10¯³ cm/s for the moist sample and 1.015x10¯²
cm/s for the dry sample. These values are within the appropriate range, although at the high end, for
the given soil type. The horizontal values were very similar to the vertical values, showing that the
prototype horizontal permeameter yields usable results. For both the moist and dry cases the vertical
permeability was greater, and was more significant in the moist condition. The moist rk ratio was 0.38,
compared to a dry rk ratio of 0.71. These ratios rk can be seen in Table 4.1.1 and Chart 4.1.3. The effect
of initial moisture content was more pronounced in the horizontal tests, with values greater in the dry
condition by a factor of 2.11 compared to 1.12 for the vertical tests. These horizontal to vertical ratios
can be seen in Table 4.1.1 and Chart 4.1.4.
The A-2-4 silty sand was also tested in the same manner. These results can be seen in Table
4.1.2 and Chart 4.1.2. Values in the vertical direction were 3.171x10¯³ cm/s for the moist condition and
4.999x10¯³ cm/s for the dry condition. The horizontal tests yielded 1.595x10¯³ cm/s for the moist
condition and 5.603x10¯³ cm/s for the dry condition. These values were similar for both directions and
also fell within the appropriate range for the soil. As seen in the A-3 sand tests, the value of horizontal to
vertical permeability rk was much lower for the moist condition, yielding a value of 0.50. The dry
condition yielded an rk value of 1.12. These values can be seen in Table 4.2 and Chart 4.3. Both moist

20
and dry rk values for the A-2-4 sample were greater than that of the A-3 sample. Although only slightly
higher, this reflects the theoretical effect that the presence of silt particles has on rk.
The initial moisture content seemed to have a greater effect on the variability of permeability in
both directions for the A-2-4 sample. The vertical dry to moist permeability ratio was 1.58 for the A-2-4
compared to 1.12 for the A-3 sample, an increase of 41%. The horizontal dry to moist permeability ratio
was even greater, with a value of 3.51 compared to 2.11 for the A-3 sample, an increase of 66%. These
results can be seen in Chart 4.1.4. In both samples the permeability in the horizontal direction was
influenced more by the differences in initial moisture content.
5.0 Conclusions and Recommendations
5.1 Conclusions
Initial tests of the horizontal permeameter proved successful, generating similar results to the
standard vertical test. Variations in horizontal and vertical permeability were logical and followed
theory. The A-2-4 silty sand samples proved to have higher ratios of horizontal to vertical permeability
rates than the A-3 Fine sand, while for both samples the moisture content at compaction lowered
horizontal permeability rates more than the vertical. However further test should be done with various
soil samples of different silt and clay contents to further investigate the importance of the horizontal
permeability test and its future in the soil engineering laboratory.
5.2 Recommendations
Since the design is a prototype, some flaws in the design were noticed during testing. Since the
cuts were made on a band saw and not a mill, there are some rough edges resulting in small leaks that
needed to be filled with epoxy. When the vacuum pump was connected to the sample it caused small
21
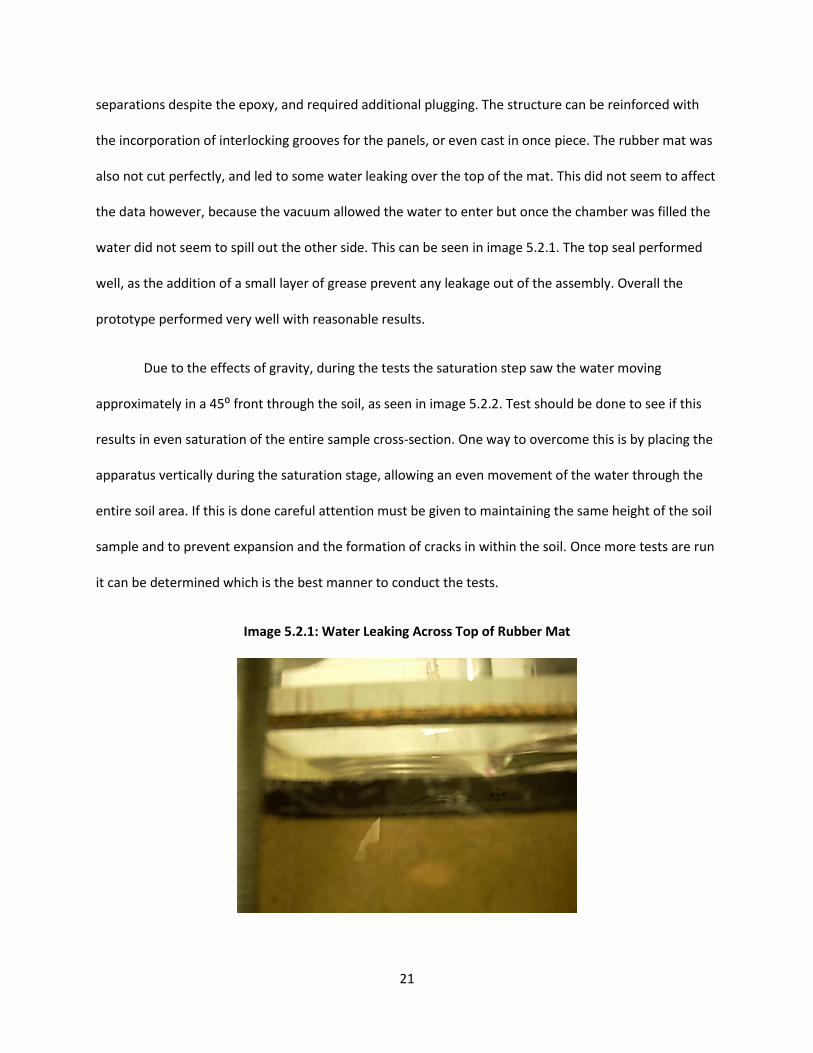
separations despite the epoxy, and required additional plugging. The structure can be reinforced with
the incorporation of interlocking grooves for the panels, or even cast in once piece. The rubber mat was
also not cut perfectly, and led to some water leaking over the top of the mat. This did not seem to affect
the data however, because the vacuum allowed the water to enter but once the chamber was filled the
water did not seem to spill out the other side. This can be seen in image 5.2.1. The top seal performed
well, as the addition of a small layer of grease prevent any leakage out of the assembly. Overall the
prototype performed very well with reasonable results.
Due to the effects of gravity, during the tests the saturation step saw the water moving
approximately in a 45⁰ front through the soil, as seen in image 5.2.2. Test should be done to see if this
results in even saturation of the entire sample cross-section. One way to overcome this is by placing the
apparatus vertically during the saturation stage, allowing an even movement of the water through the
entire soil area. If this is done careful attention must be given to maintaining the same height of the soil
sample and to prevent expansion and the formation of cracks in within the soil. Once more tests are run
it can be determined which is the best manner to conduct the tests.
Image 5.2.1: Water Leaking Across Top of Rubber Mat

22
Image 5.2.2: Progression of Water Front through Sample during Saturation

23
6.0 Appendices
6.1 Experimental Data
A-2-4 Silty Sand - Falling Head Test
Vertical Sample 1 - Compacted Moist
Raw Data
Di (cm) A (cm²) L (cm) V (cm³) hi (cm) hf (cm) di (cm)
6.36 31.77 13.31 422.86 109 67 1.4225
a (cm²) T (°C) M (g) ρ (kg/m³)
1.589 24 708.3 1675.03
Calculations
Trial Time (s) k24°c (cm/s) µw24° (g/ml) µw20° (g/ml) k20°c (cm/s)
1 90.91 0.003560 0.000911 0.001003 0.003233137
2 91.72 0.003528 0.000911 0.001003 0.003204584
3 92.81 0.003487 0.000911 0.001003 0.003166948
4 93.50 0.003461 0.000911 0.001003 0.003143577
5 94.58 0.003422 0.000911 0.001003 0.003107681
3.171 E-03 cm/s
Vertical Sample 2 - Compacted Oven Dried
Raw Data
Di (cm) A (cm²) L (cm) V (cm³) hi (cm) hf (cm) di (cm)
6.36 31.77 12.694 403.29 109 67 1.4225
a (cm²) T (°C) M (g) ρ (kg/m³)
1.589 24 632.13 1567.44
Calculations
Trial Time (s) k24°c (cm/s) µw24° (g/ml) µw20° (g/ml) k20°c (cm/s)
1 56.47 0.005465 0.000911 0.001003 0.004964076
2 56.25 0.005487 0.000911 0.001003 0.004983491
3 56.00 0.005511 0.000911 0.001003 0.005005739
4 56.03 0.005508 0.000911 0.001003 0.005003058
5 55.66 0.005545 0.000911 0.001003 0.005036316
4.999 E-03 cm/s
Horizontal Sample 1 -Compacted Moist
Raw Data
A (cm²) L (cm) V (cm³) hi (cm) hf (cm) di (cm) a (cm²)
105.162 10.32 1085.27 112 70 1.4225 1.589
T (°C) M (g) ρ (kg/m³)
24 1817.86 1675.03
Calculations
Trial Time (s) k24°c (cm/s) µw24° (g/ml) µw20° (g/ml) k20°c (cm/s)
1 41.04 0.001784 0.000911 0.001003 0.001620198
2 40.75 0.001797 0.000911 0.001003 0.001631729
3 43.28 0.001691 0.000911 0.001003 0.001536343
4 42.37 0.001728 0.000911 0.001003 0.00156934
5 41.15 0.001779 0.000911 0.001003 0.001615867
1.595 E-03 cm/s
Horizontal Sample 2 - Compacted Oven Dried
Raw Data
A (cm²) L (cm) V (cm³) hi (cm) hf (cm) di (cm) a (cm²)
101.03 10.32 1042.63 113.75 71.75 1.4225 1.589
T (°C) M (g) ρ (kg/m³)
24 1728.74 1658.06
Calculations
Trial Time (s) k24°c (cm/s) µw24° (g/ml) µw20° (g/ml) k20°c (cm/s)
1 12.69 0.005887 0.000911 0.001003 0.005347466
2 12.25 0.006099 0.000911 0.001003 0.005539538
3 11.91 0.006273 0.000911 0.001003 0.005697678
4 11.97 0.006242 0.000911 0.001003 0.005669118
5 11.78 0.006342 0.000911 0.001003 0.005760555
5.603 E-03 cm/sAverage k20°c
Average k20°c
Average k20°c
Average k20°c

24
A-3 Fine Sand - Constant Head Test
Vertical Sample 1 - Compacted Moist
Raw Data
A (cm²) L (cm) V (cm³) h (cm) T (°C) ρw @24°C M (g) ρ (kg/m³)
31.77 13.11 416.50 71.00 24.00 0.99730 646.76 1554.01
Calculations
Trial Time (s) Flow (g) Flow (ml) k24°c (cm/s) µw24° (g/ml) µw20° (g/ml) k20°c (cm/s)
1 90.13 212.564 213.140 0.013744 0.000911 0.001003 0.012483609
2 90.97 218.468 219.060 0.013996 0.000911 0.001003 0.012711871
3 92.43 227.852 228.470 0.014366 0.000911 0.001003 0.013048506
4 90.06 220.452 221.050 0.014265 0.000911 0.001003 0.012956961
5 91.94 219.834 220.430 0.013935 0.000911 0.001003 0.012656417
1.277 E-02 cm/s
Vertical Sample 2 - Compacted Oven Dried
Raw Data
A (cm²) L (cm) V (cm³) h (cm) T (°C) ρw @24°C M (g) ρ (kg/m³)
31.77 12.26 389.50 62.00 24.00 0.99730 573.60 1472.66
Calculations
Trial Time (s) Flow (g) Flow (ml) k24°c (cm/s) µw24° (g/ml) µw20° (g/ml) k20°c (cm/s)
1 56.18 140.150 140.530 0.015569 0.000911 0.001003 0.014141201
2 56.41 141.490 141.874 0.015654 0.000911 0.001003 0.014218199
3 55.46 140.310 140.690 0.015789 0.000911 0.001003 0.014341141
4 55.84 141.250 141.633 0.015787 0.000911 0.001003 0.014338971
5 55.41 141.040 141.422 0.015886 0.000911 0.001003 0.014428762
1.429 E-02 cm/s
Horizontal Sample 1 - Compacted Moist
Raw Data
A (cm²) L (cm) V (cm³) h (cm) T (°C) ρw @24°C M (g) ρ (kg/m³)
102.79 10.32 1060.80 90.00 24.00 0.99730 1669.76 1574.05
Calculations
Trial Time (s) Flow (g) Flow (ml) k24°c (cm/s) µw24° (g/ml) µw20° (g/ml) k20°c (cm/s)
1 25.41 117.160 117.478 0.005157 0.000911 0.001003 0.004684359
2 24.56 115.130 115.442 0.005243 0.000911 0.001003 0.004762507
3 23.31 111.610 111.913 0.005356 0.000911 0.001003 0.004864479
4 24.31 115.800 116.114 0.005328 0.000911 0.001003 0.004839484
5 24 116.840 117.157 0.005446 0.000911 0.001003 0.004946019
4.819 E-03 cm/s
Horizontal Sample 2 - Compacted Oven Dried
Raw Data
A (cm²) L (cm) V (cm³) h (cm) T (°C) ρw @24°C M (g) ρ (kg/m³)
98.35 10.32 1014.97 76.00 24.00 0.99730 1546.76 1523.94
Calculations
Trial Time (s) Flow (g) Flow (ml) k24°c (cm/s) µw24° (g/ml) µw20° (g/ml) k20°c (cm/s)
1 13.06 105.940 106.227 0.011230 0.000911 0.001003 0.010200041
2 14.72 117.420 117.738 0.011043 0.000911 0.001003 0.010030426
3 12.65 103.420 103.700 0.011318 0.000911 0.001003 0.010280142
4 13.44 107.990 108.283 0.011124 0.000911 0.001003 0.010103443
5 13.75 110.970 111.271 0.011173 0.000911 0.001003 0.010148176
1.015 E-02 cm/s
Average k20°c
Average k20°c
Average kh20°c
Average k20°c

25
6.2 Additional Images
Image 6.2.1: A-2-4 Vertical Sample, Falling Head Test Setup
Image 6.2.2: A-3 Sample, Constant Head Test Setup
26
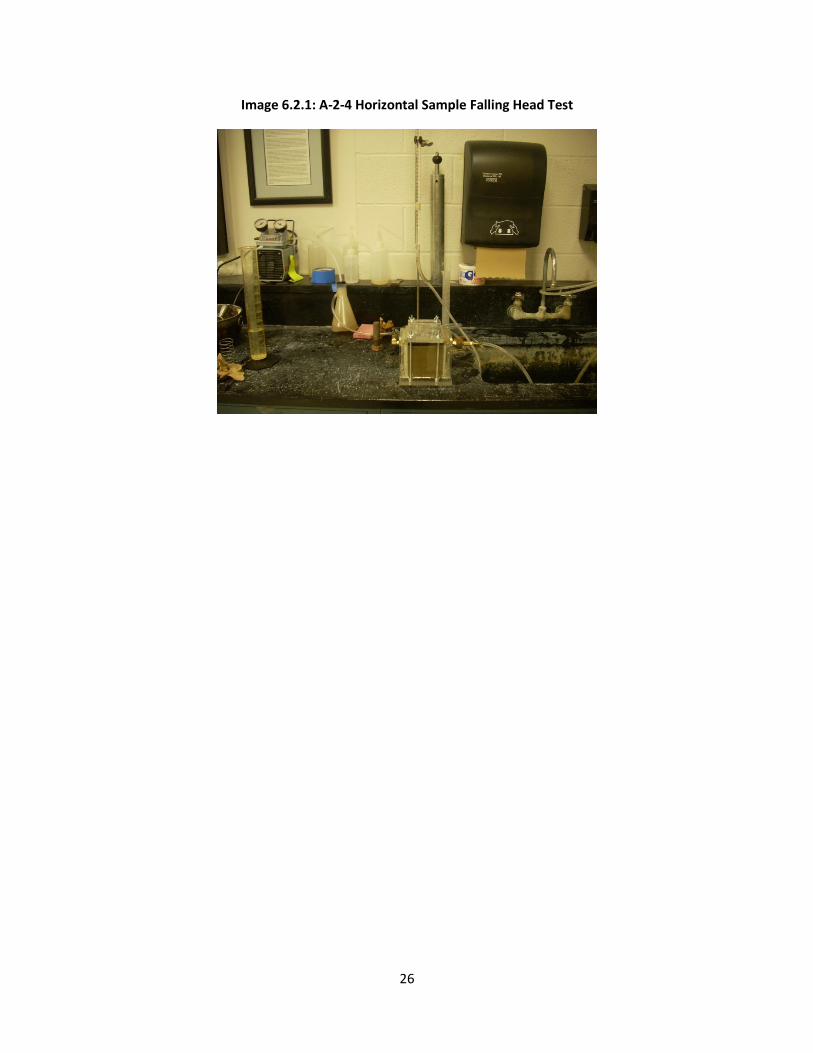
Image 6.2.1: A-2-4 Horizontal Sample Falling Head Test
27
6.3 References
1) Department of Civil Engineering, comp. Soils Mechanics Laboratory Manual. Gainesville: University of
Florida, Gainesville. Print.
2) Tindall, James A., and James R. Kunkel. Unsaturated Zone Hydrology for Scientists and Engineers.
Upper Saddle River: Prentice-Hall, 1999. Print.
3) Lu, Niing, and William J. Likos. Unsaturated Soil Mechanics. Hoboken: John Wiley & Sons, 2004. Print.
4) Mitchell, James K. Fundamentals of Soil Behavior. Second Ed. New York: John Wiley & Sons, 1993.
Print.
5) Bloomquist, David, Adrian A. Viala, and Mike Gartner. "Vertical and Horizontal Insitu Permeameter."
Thesis. University of Florida, 2007. Print.