Hopes, fears, and reality - MassMutual · Retirement Strategies Hopes, fears, and reality What...
44
Retirement Strategies Hopes, fears, and reality What workers expect in retirement and what steps help them achieve the retirement they want A Research Study
Transcript of Hopes, fears, and reality - MassMutual · Retirement Strategies Hopes, fears, and reality What...
Retirement Strategies
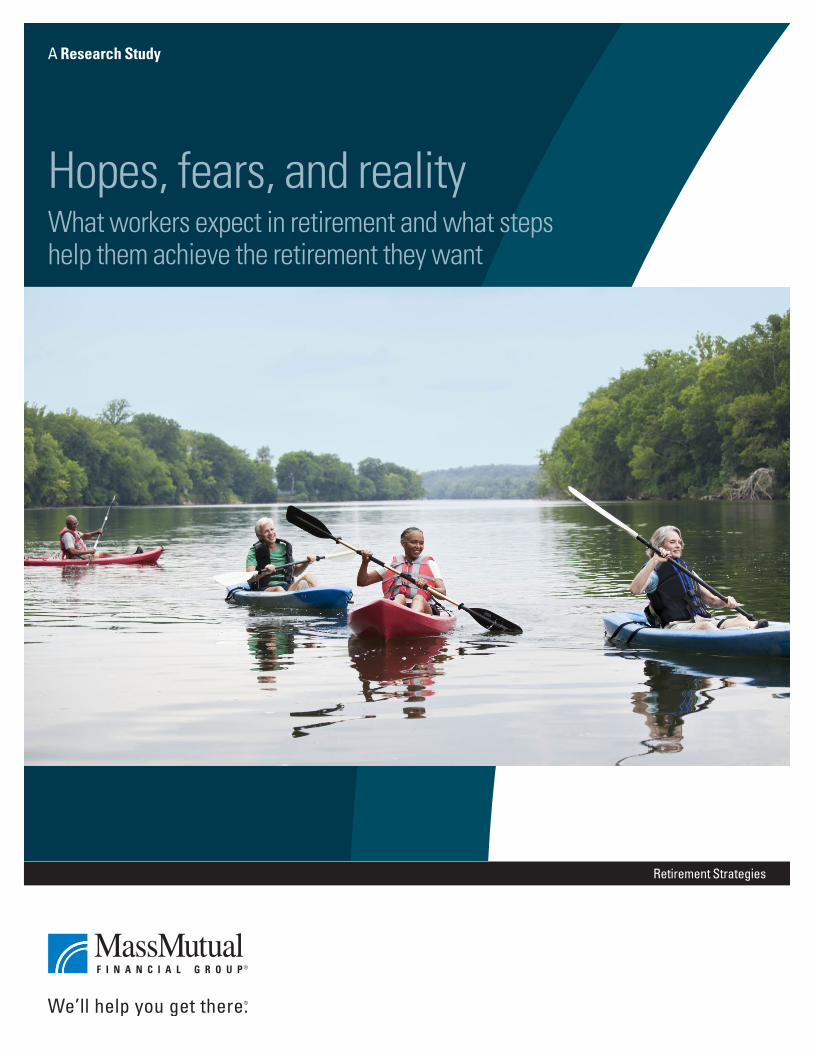
Hopes, fears, and realityWhat workers expect in retirement and what steps help them achieve the retirement they want
A Research Study

3
Background and methodology
OverviewThis report presents the results of research conducted by Greenwald & Associates, on behalf of MassMutual, examining pre-retirees’ expectations and preparations for retirement, and how those plans and visions compare to the actual experiences people have after they retire.
The research was conducted in two parts: a survey of 1,817 pre-retirees and retirees, and four focus groups (two of retirees only and two of pre-retirees only).
In order to understand changes in expectations and planning as people get closer to retirement, as well as the changes in activities and feelings of financial security as retirees progress further into retirement, both the survey and focus group portions of the research are designed to include pre-retirees and retirees that are at varying distances from retirement.
Additional details about the methodology follow this overview. The key findings and detailed results are presented next, organized around key themes.
Note that percentages in the tables and charts may not total to 100 due to rounding and/or missing categories. Labels for percentages under 5% are not included.
4
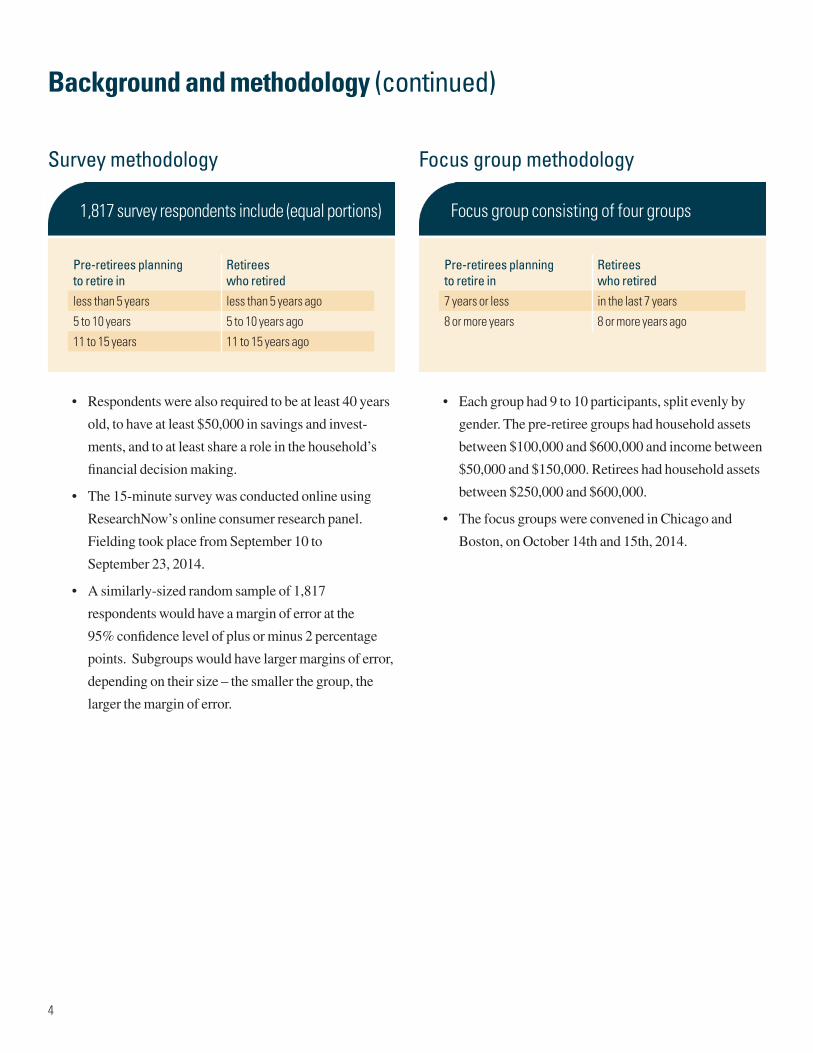
Survey methodology
• Respondents were also required to be at least 40 years
old, to have at least $50,000 in savings and invest-
ments, and to at least share a role in the household’s
financial decision making.
• The 15-minute survey was conducted online using
ResearchNow’s online consumer research panel.
Fielding took place from September 10 to
September 23, 2014.
• A similarly-sized random sample of 1,817
respondents would have a margin of error at the
95% confidence level of plus or minus 2 percentage
points. Subgroups would have larger margins of error,
depending on their size – the smaller the group, the
larger the margin of error.
Focus group methodology
• Each group had 9 to 10 participants, split evenly by
gender. The pre-retiree groups had household assets
between $100,000 and $600,000 and income between
$50,000 and $150,000. Retirees had household assets
between $250,000 and $600,000.
• The focus groups were convened in Chicago and
Boston, on October 14th and 15th, 2014.
Background and methodology (continued)
1,817 survey respondents include (equal portions)
Pre-retirees planning to retire in
Retirees who retired
less than 5 years less than 5 years ago
5 to 10 years 5 to 10 years ago
11 to 15 years 11 to 15 years ago
Focus group consisting of four groups
Pre-retirees planning to retire in
Retirees who retired
7 years or less in the last 7 years
8 or more years 8 or more years ago

5
• Most retirees feel financially secure and able to
engage in the activities they enjoy at least as much as
they had hoped, though 10-19% say they do not.
– Volunteering, however, is the exception, with 28%
saying they have done less than they had hoped.
– For activities that cost money, almost all retirees
report being able to afford to engage in these
activities as much as they would like.
• Retirees describe retirement as an opportunity to
reconnect with a spouse or partner, and even
become closer.
• Positive surprises about retirement include having
few time constraints (23%), and keeping busy and
active (18%).
Retiree experience is very positive In general, retirees indicate having high levels of financial
security, emotional well-being, and enjoyment in retirement.
• Six in 10 are very satisfied with their retirement
lifestyle. Satisfaction with retirement is greatest
among those who are in their 70s, in good health,
married/living with partner, have at least $500K in
assets, and have a pension.
• Retirees report enjoying themselves (82%), having
more free time (80%), and having new experiences
(69%). In fact, the degree to which retirees stay busy
in retirement is one of the top positive surprises about
retirement, according to retirees. Retirees over 70 are
especially likely to think this.
• Positive emotions increase and negative emotions
decrease in retirement.
– Retirees are happier and more relaxed than
pre-retirees. Around 7 in 10 retirees report being
extremely happy and extremely relaxed
(72% and 67%, respectively). In comparison,
only 6 in 10 pre-retirees feel extremely happy
and only a third feel extremely relaxed
(61% and 34%, respectively).
– Retirees are also, predictably, less stressed. Forty-
three percent of pre-retirees report being at least
moderately stressed. Amongst retirees, only 17%
report a similar stress level.
Key findings
6
Key findings (continued)
Adaptation to retirement Retirees are able to adapt to the financial challenges
of retirement.
• Satisfaction with retirement lifestyle increases
between the first 5 years of retirement versus 5+ years
since retiring (retired less than 5 years ago [56%], 5 to
10 years ago [63%], and 11 to 15 years ago [62%]).
• Concerns about retirement decrease as pre-retirees
approach retirement.
– Thirty-one percent of pre-retirees who are 11-15
years away from retirement say they are looking
forward to retirement with very few or no concerns,
but this percentage grows to 43% for those less than
5 years away. In addition, 46% of retirees say that
they had very few or no concerns in the year prior
to retirement.
• Projected sources of income in retirement shift as
pre-retirees approach retirement, and current sources
of income change as needed throughout retirement.
– As pre-retirees approach retirement, the less likely
they are to report employment as a projected source
of income (retiring in less than 5 years [47%], 5 to
10 years [59%], and 11 to 15 years [61%]). Those
who retired recently are more likely to report
employment as source of income than those who
have been retired 5 or more years (retired less than
5 years ago [36%], 5 to 10 years ago [28%], and 11
to 15 years ago [21%]).
– Many retirees are able to defer collecting their
Social Security benefits. The longer individuals
have been retired, the more likely they are to
indicate Social Security benefits as a current source
of income (retired less than 5 years ago [65%], 5 to
10 years ago [80%], and 11 to 15 years ago [91%]).
Unexpected paths to retirement Many enter retirement earlier than planned and the
transition is less gradual than expected.
• Nearly half (45%) retired earlier than planned.
– The most frequently cited reasons for retiring early
are changes at your company or place of work
(44%) and being able to afford to retire (39%).
Despite pre-retirees typically wanting to work as
long as possible, retirees discover that often, and
suddenly, “work can retire you.”
– The majority (79%) who retired early have no
regrets about the decision to retire when they did.
• Pre-retirees’ expectations about transitioning into
retirement gradually are unlikely to be realized, given
that the majority (71%) of retirees stopped working all
at once.
– As pre-retirees approach their expected retirement
date, the more likely they are to say they will
stop working all at once (retiring in less than
5 years [52%], 5 to 10 years [35%], and 11 to
15 years [29%]).
– While many retirees expect to get back into
the working world at some point, there can be
unexpected barriers to doing so, including the pace
of technology and age discrimination.

7
Lessons learned The experiences of current retirees provide a roadmap
for how to get in a better position for a positive
retirement experience.
• Given that nearly half retire earlier than expected,
don’t delay taking steps to prepare for retirement.
– Early preparation contributes to feelings of financial
security in retirement. The most important steps to
take early include calculating a target for how much
money is needed in order to afford to retire, making
efforts to increase savings, and calculating the best
time to collect Social Security benefits.
– When asked what is one thing they wish they had
done differently to prepare for retirement, many
retirees say they would have saved more (20%) and
prepared better financially (17%).
• Work with a financial advisor.
– Nearly everyone who has had a financial advisor
found that person to be helpful for retirement
planning (pre-retirees [96%]; retirees [93%]).
• Learn about effective ways to use home equity to
increase financial security in retirement.
• Don’t neglect to prepare for the social aspects of
retirement such as strengthening the relationship with
one’s spouse/significant other, cultivating new friend-
ships, and fostering old friendships.
– The earlier people can make it a priority to focus
on the relationship with their spouse or significant
other, the better. Those who do so 5 or more years
before retiring tend to enjoy retirement more.
– Once retired, it can be especially difficult to make
new friends, which is why it is important to have a
strong social network prior to retiring.
• Financial security increases as pre-retirees get closer
to retirement and as retirees progress in retirement.
– Only 63% of those retiring in 11-15 years feel
they are on track toward being financially secure,
but this percentage grows to a full 82% by the
time individuals are less than 5 years away from
their expected retirement date. This also matches
retirees’ recollections about where they were prior
to retiring.
• Retirees also adapt to a fixed income by finding
creative ways to cut expenses but not forgo activities
they enjoy.
8
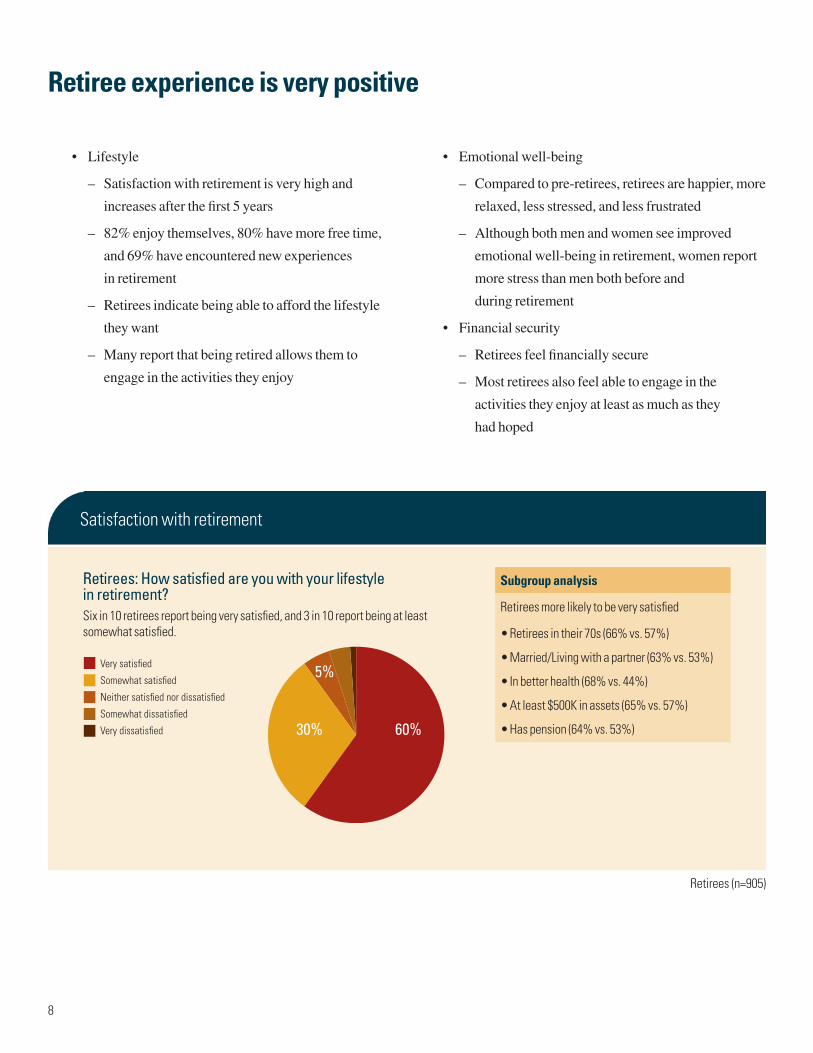
Retiree experience is very positive
• Lifestyle
– Satisfaction with retirement is very high and
increases after the first 5 years
– 82% enjoy themselves, 80% have more free time,
and 69% have encountered new experiences
in retirement
– Retirees indicate being able to afford the lifestyle
they want
– Many report that being retired allows them to
engage in the activities they enjoy
Retirees (n=905)
Satisfaction with retirement
Retirees: How satisfied are you with your lifestyle in retirement?Six in 10 retirees report being very satisfied, and 3 in 10 report being at least somewhat satisfied.
Subgroup analysis
Retirees more likely to be very satisfied
• Retirees in their 70s (66% vs. 57%)
• Married/Living with a partner (63% vs. 53%)
• In better health (68% vs. 44%)
• At least $500K in assets (65% vs. 57%)
• Has pension (64% vs. 53%)
legend 5
legend 4
legend 3
legend 2
legend 1
30%
5%
60%
Very satisfied
Somewhat satisfied
Neither satisfied nor dissatisfied
Somewhat dissatisfied
Very dissatisfied
legend 5
legend 4
legend 3
legend 2
legend 1
30%
5%
60%
Very satisfied
Somewhat satisfied
Neither satisfied nor dissatisfied
Somewhat dissatisfied
Very dissatisfied
• Emotional well-being
– Compared to pre-retirees, retirees are happier, more
relaxed, less stressed, and less frustrated
– Although both men and women see improved
emotional well-being in retirement, women report
more stress than men both before and
during retirement
• Financial security
– Retirees feel financially secure
– Most retirees also feel able to engage in the
activities they enjoy at least as much as they
had hoped
9
Subgroup analysis
Retirees more likely to be very satisfied
• Retirees in their 70s (66% vs. 57%)
• Married/Living with a partner (63% vs. 53%)
• In better health (68% vs. 44%)
• At least $500K in assets (65% vs. 57%)
• Has pension (64% vs. 53%) Retirees (n=905)
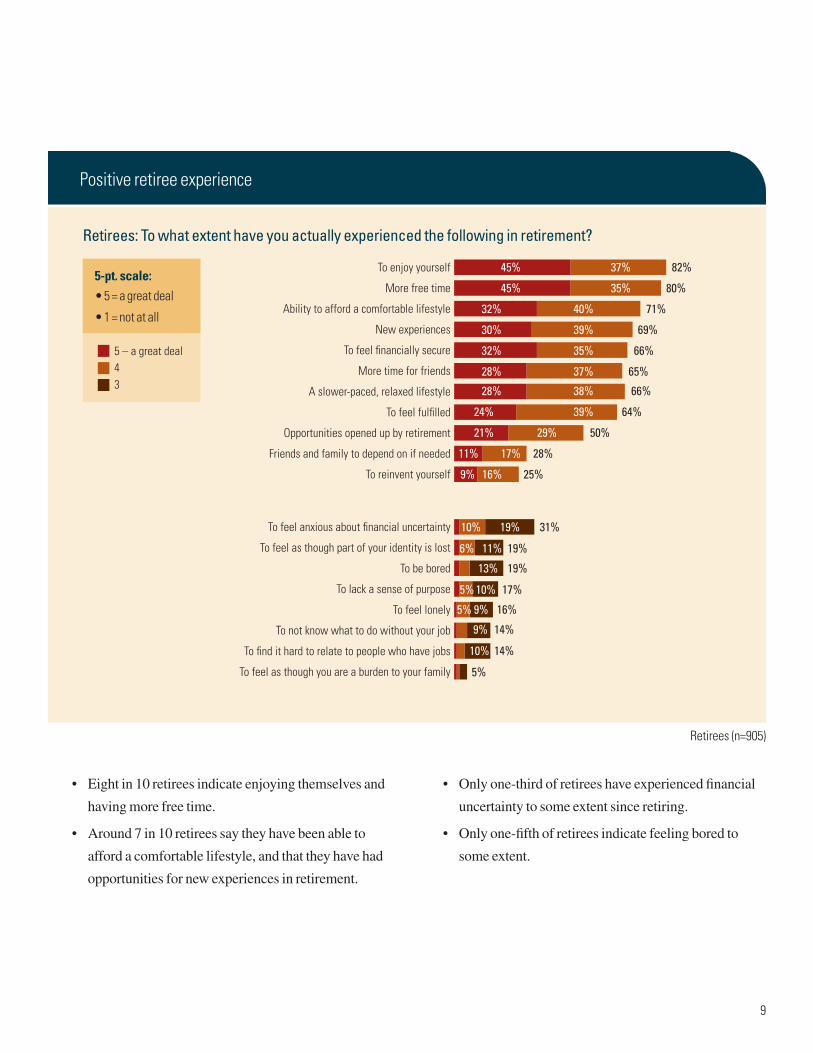
Positive retiree experience
Legend 2
Legend 1
To feel as though you are a burden to your family
To find it hard to relate to people who have jobs
To not know what to do without your job
To feel lonely
To lack a sense of purpose
To be bored
To feel as though part of your identity is lost
To feel anxious about financial uncertainty
To reinvent yourself
Friends and family to depend on if needed
Opportunities opened up by retirement
To feel fulfilled
A slower-paced, relaxed lifestyle
More time for friends
To feel financially secure
New experiences
Ability to afford a comfortable lifestyle
More free time
To enjoy yourself 45% 37% 82%
45% 35% 80%
32% 40% 71%
30% 39% 69%
32% 35% 66%
28% 37% 65%
28% 38% 66%
24% 39% 64%
21% 29% 50%
17%11% 28%
9% 16% 25%
10% 19% 31%
6% 11% 19%
13% 19%
5% 10% 17%
5% 9% 16%
9% 14%
10% 14%
5%
5 – a great deal43
Retirees: To what extent have you actually experienced the following in retirement?
5-pt. scale:• 5 = a great deal
• 1 = not at all
Legend 2
Legend 1
To feel as though you are a burden to your family
To find it hard to relate to people who have jobs
To not know what to do without your job
To feel lonely
To lack a sense of purpose
To be bored
To feel as though part of your identity is lost
To feel anxious about financial uncertainty
To reinvent yourself
Friends and family to depend on if needed
Opportunities opened up by retirement
To feel fulfilled
A slower-paced, relaxed lifestyle
More time for friends
To feel financially secure
New experiences
Ability to afford a comfortable lifestyle
More free time
To enjoy yourself 45% 37% 82%
45% 35% 80%
32% 40% 71%
30% 39% 69%
32% 35% 66%
28% 37% 65%
28% 38% 66%
24% 39% 64%
21% 29% 50%
17%11% 28%
9% 16% 25%
10% 19% 31%
6% 11% 19%
13% 19%
5% 10% 17%
5% 9% 16%
9% 14%
10% 14%
5%
5 – a great deal43
• Eight in 10 retirees indicate enjoying themselves and
having more free time.
• Around 7 in 10 retirees say they have been able to
afford a comfortable lifestyle, and that they have had
opportunities for new experiences in retirement.
• Only one-third of retirees have experienced financial
uncertainty to some extent since retiring.
• Only one-fifth of retirees indicate feeling bored to
some extent.

10
Negative emotions decrease in retirement
In general lately, I tend to feel...n Extremely/quite a bit n Moderately
• Compared with pre-retirees, retirees report feeling less stressed, frustrated, nervous, and distressed.
• More than 4 in 10 pre-retirees indicate feeling moderately to extremely stressed, compared with less than 1 in 5 retirees.
Pre-retirees (n=912); Retirees (n=905)
Positive emotions increase in retirement
Pre-retirees (n=912); Retirees (n=905)
In general lately, I tend to feel...n Extremely/quite a bit n Moderately
RetireesPre-retireesHappy
RetireesPre-retireesDetermined
RetireesPre-retireesRelaxed
RetireesPre-retireesExcited
23%72%32%61%
45%36%39%50%
25%67%43%34%
40%31%44%
95%93%
81%89%
92%77%
71%70%26%
RetireesPre-retireesStressed
RetireesPre-retireesFrustrated
RetireesPre-retireesNervous
RetireesPre-retireesDistressed
RetireesPre-retireesSad
RetireesPre-retireesAngry
RetireesPre-retireesLonely
11% 17%6%17% 26% 43%
10% 14%10% 27%17%
10%8%15%5% 20%
10%7%6% 12% 18%
11%7%9% 12%
7%5%8% 11%
9%6%7% 10%
Subgroup analysis
Pre-retirees more likely to feel determined
• In better health
• Higher assets
• Higher income
• Has DC plan
Retirees more likely to feel relaxed
• Men
• In better health
• Has pension
• Has DC plan
Subgroup analysis
Percentage at least moderately stressed
Men Women
Pre-retirees 38% 49%
Retirees 13% 20%
• Around 7 in 10 retirees report being extremely happy, compared with 6 in 10 pre-retirees.
• Retirees are particularly relaxed compared with pre-retirees, with the majority indicating feeling relaxed.
11
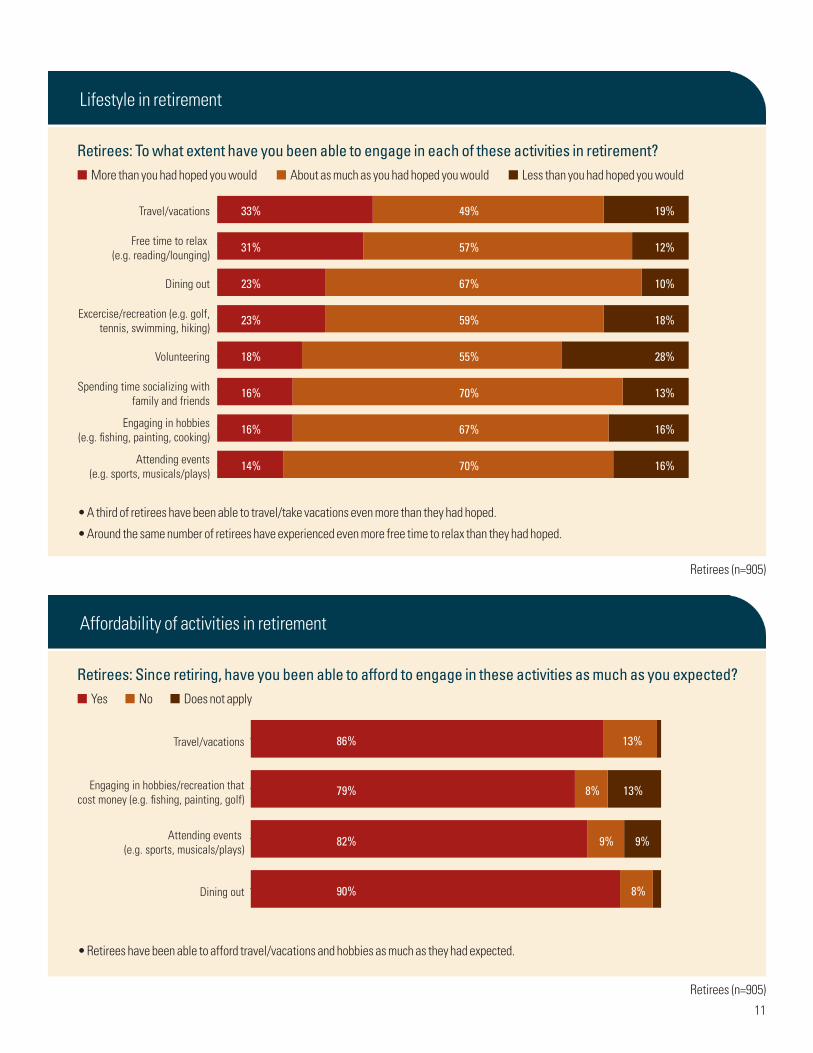
• A third of retirees have been able to travel/take vacations even more than they had hoped.
• Around the same number of retirees have experienced even more free time to relax than they had hoped.
• Retirees have been able to afford travel/vacations and hobbies as much as they had expected.
Retirees (n=905)
Retirees (n=905)
Lifestyle in retirement
Affordability of activities in retirement
Retirees: To what extent have you been able to engage in each of these activities in retirement?n More than you had hoped you would n About as much as you had hoped you would n Less than you had hoped you would
Retirees: Since retiring, have you been able to afford to engage in these activities as much as you expected?n Yes n No n Does not apply
Attending events(e.g. sports, musicals/plays)
Engaging in hobbies(e.g. fishing, painting, cooking)
Spending time socializing withfamily and friends
Volunteering
Excercise/recreation (e.g. golf,tennis, swimming, hiking)
Dining out
Free time to relax (e.g. reading/lounging)
Travel/vacations
70%
67%
70%
55%
59%
67%
57%
49%
16%
16%
13%
28%
18%
10%
12%
19%
14%
16%
16%
18%
23%
23%
31%
33%
Dining out
Attending events (e.g. sports, musicals/plays)
Engaging in hobbies/recreation thatcost money (e.g. fishing, painting, golf)
Travel/vacations
8%
9%
8%
13%
9%
13%
90%
82%
79%
86%
Subgroup analysis
Pre-retirees more likely to feel determined
• In better health
• Higher assets
• Higher income
• Has DC plan
Retirees more likely to feel relaxed
• Men
• In better health
• Has pension
• Has DC plan
12
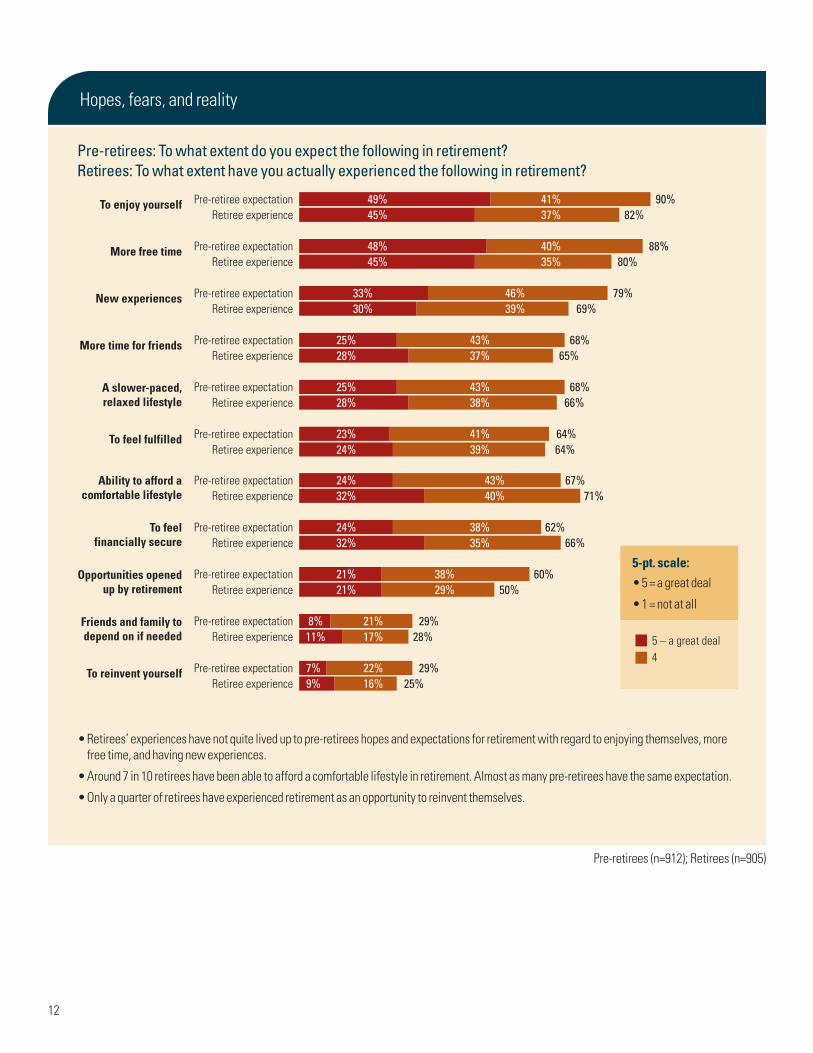
• Retirees’ experiences have not quite lived up to pre-retirees hopes and expectations for retirement with regard to enjoying themselves, more free time, and having new experiences.
• Around 7 in 10 retirees have been able to afford a comfortable lifestyle in retirement. Almost as many pre-retirees have the same expectation.
• Only a quarter of retirees have experienced retirement as an opportunity to reinvent themselves.
Pre-retirees (n=912); Retirees (n=905)
Hopes, fears, and reality
Pre-retirees: To what extent do you expect the following in retirement?Retirees: To what extent have you actually experienced the following in retirement?
Retiree experiencePre-retiree expectation
Retiree experiencePre-retiree expectation
Retiree experiencePre-retiree expectation
Retiree experiencePre-retiree expectation
Retiree experiencePre-retiree expectation
To reinvent yourself
Friends and family todepend on if needed
Opportunities openedup by retirement
To feelfinancially secure
Ability to afford acomfortable lifestyle
9%7%
11%8%
21%21%
32%24%
32%24%
16%22%
17%21%
29%38%
35%38%
40%43%
25%29%
28%29%
50%60%
66%62%
71%67%
Retiree experiencePre-retiree expectation
Retiree experiencePre-retiree expectation
Retiree experiencePre-retiree expectation
Retiree experiencePre-retiree expectation
Retiree experiencePre-retiree expectation
Retiree experiencePre-retiree expectation
24%23%
28%25%
28%25%
30%33%
45%48%
45%49%
64%64%
66%68%
65%68%
69%79%
80%88%
82%90%
39%41%
38%43%
37%43%
39%46%
35%40%
37%41%
To feel fulfilled
A slower-paced,relaxed lifestyle
More time for friends
New experiences
More free time
To enjoy yourself
5-pt. scale:• 5 = a great deal
• 1 = not at all
Legend 2
Legend 1
To feel as though you are a burden to your family
To find it hard to relate to people who have jobs
To not know what to do without your job
To feel lonely
To lack a sense of purpose
To be bored
To feel as though part of your identity is lost
To feel anxious about financial uncertainty
To reinvent yourself
Friends and family to depend on if needed
Opportunities opened up by retirement
To feel fulfilled
A slower-paced, relaxed lifestyle
More time for friends
To feel financially secure
New experiences
Ability to afford a comfortable lifestyle
More free time
To enjoy yourself 45% 37% 82%
45% 35% 80%
32% 40% 71%
30% 39% 69%
32% 35% 66%
28% 37% 65%
28% 38% 66%
24% 39% 64%
21% 29% 50%
17%11% 28%
9% 16% 25%
10% 19% 31%
6% 11% 19%
13% 19%
5% 10% 17%
5% 9% 16%
9% 14%
10% 14%
5%
5 – a great deal43
13
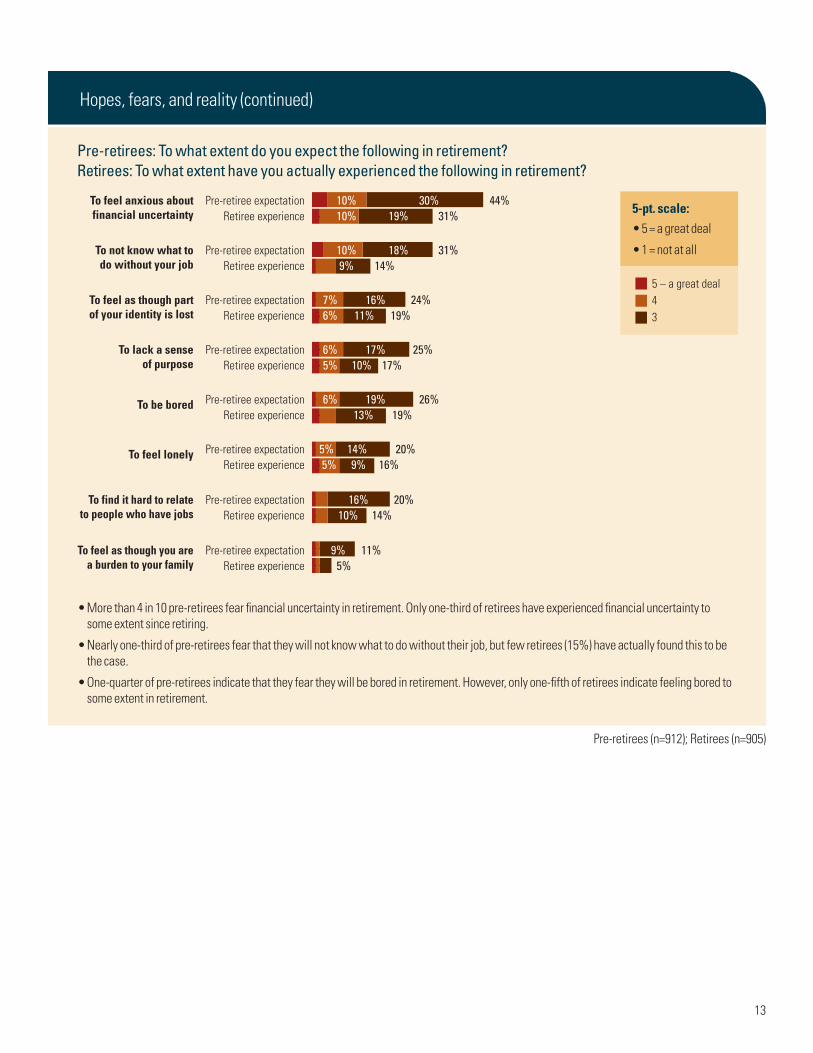
• More than 4 in 10 pre-retirees fear financial uncertainty in retirement. Only one-third of retirees have experienced financial uncertainty to some extent since retiring.
• Nearly one-third of pre-retirees fear that they will not know what to do without their job, but few retirees (15%) have actually found this to be the case.
• One-quarter of pre-retirees indicate that they fear they will be bored in retirement. However, only one-fifth of retirees indicate feeling bored to some extent in retirement.
Pre-retirees (n=912); Retirees (n=905)
Hopes, fears, and reality (continued)
Pre-retirees: To what extent do you expect the following in retirement?Retirees: To what extent have you actually experienced the following in retirement?
Retiree experiencePre-retiree expectationTo feel anxious about
financial uncertainty10% 30% 44%10% 19% 31%
Retiree experiencePre-retiree expectationTo not know what to
do without your job10% 18% 31%9% 14%
Retiree experiencePre-retiree expectationTo feel as though part
of your identity is lost7% 16% 24%6% 11% 19%
Retiree experiencePre-retiree expectationTo lack a sense
of purpose6% 17% 25%5% 10% 17%
Retiree experiencePre-retiree expectationTo be bored 6% 19% 26%
13% 19%
Retiree experiencePre-retiree expectationTo feel lonely 14% 20%
9%5%5% 16%
Retiree experiencePre-retiree expectationTo find it hard to relate
to people who have jobs16% 20%
10% 14%
Retiree experiencePre-retiree expectationTo feel as though you are
a burden to your family9% 11%
5%
5-pt. scale:• 5 = a great deal
• 1 = not at all
Legend 2
Legend 1
To feel as though you are a burden to your family
To find it hard to relate to people who have jobs
To not know what to do without your job
To feel lonely
To lack a sense of purpose
To be bored
To feel as though part of your identity is lost
To feel anxious about financial uncertainty
To reinvent yourself
Friends and family to depend on if needed
Opportunities opened up by retirement
To feel fulfilled
A slower-paced, relaxed lifestyle
More time for friends
To feel financially secure
New experiences
Ability to afford a comfortable lifestyle
More free time
To enjoy yourself 45% 37% 82%
45% 35% 80%
32% 40% 71%
30% 39% 69%
32% 35% 66%
28% 37% 65%
28% 38% 66%
24% 39% 64%
21% 29% 50%
17%11% 28%
9% 16% 25%
10% 19% 31%
6% 11% 19%
13% 19%
5% 10% 17%
5% 9% 16%
9% 14%
10% 14%
5%
5 – a great deal43
14
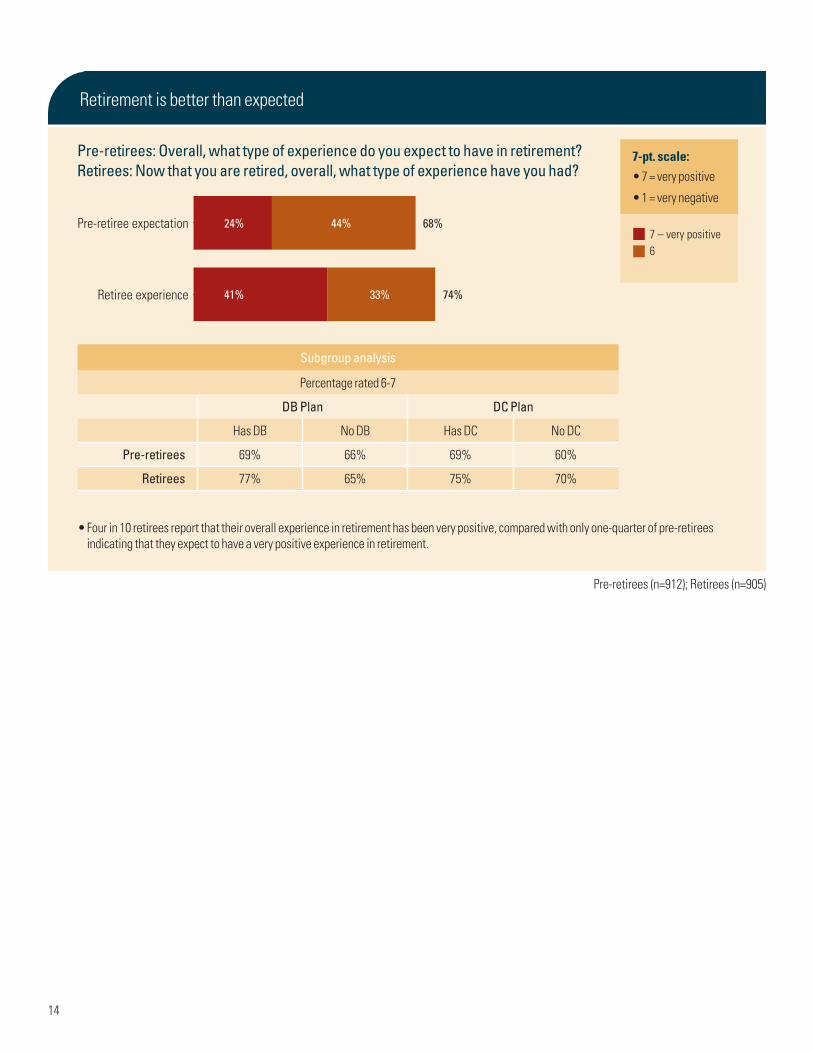
• Four in 10 retirees report that their overall experience in retirement has been very positive, compared with only one-quarter of pre-retirees indicating that they expect to have a very positive experience in retirement.
Pre-retirees (n=912); Retirees (n=905)
Retirement is better than expected
Pre-retirees: Overall, what type of experience do you expect to have in retirement? Retirees: Now that you are retired, overall, what type of experience have you had?
Retiree experience
Pre-retiree expectation
33%
44%
74%
68%
41%
24%
7-pt. scale:• 7 = very positive
• 1 = very negative
7 – very positive6
Subgroup analysis
Percentage rated 6-7
DB Plan DC Plan
Has DB No DB Has DC No DC
Pre-retirees 69% 66% 69% 60%
Retirees 77% 65% 75% 70%
15
Positive and negative retirement surprises
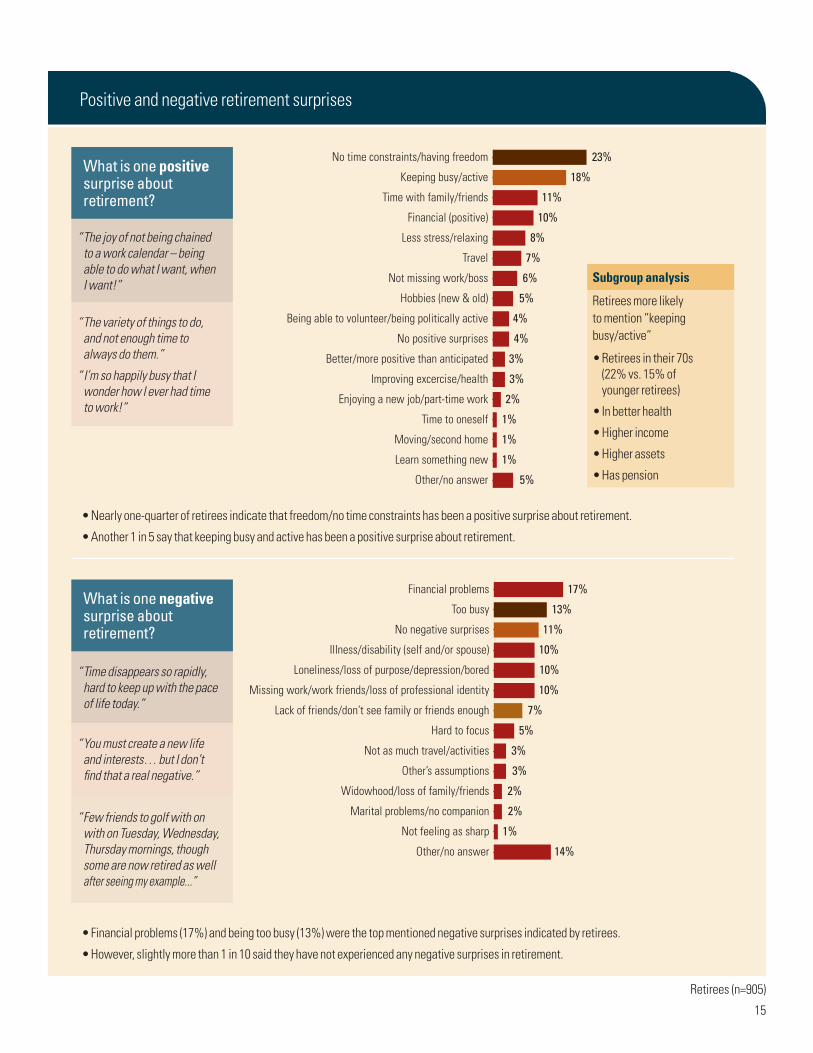
What is one positive surprise about retirement?
“The joy of not being chained to a work calendar – being able to do what I want, when I want!”
“Time disappears so rapidly, hard to keep up with the pace of life today.”
“The variety of things to do, and not enough time to always do them.”
“I’m so happily busy that I wonder how I ever had time to work!”
“You must create a new life and interests… but I don’t find that a real negative.”
“Few friends to golf with on with on Tuesday, Wednesday, Thursday mornings, though some are now retired as well after seeing my example...”
What is one negative surprise about retirement?
Other/no answer
Learn something new
Moving/second home
Time to oneself
Enjoying a new job/part-time work
Improving excercise/health
Better/more positive than anticipated
No positive surprises
Being able to volunteer/being politically active
Hobbies (new & old)
Not missing work/boss
Travel
Less stress/relaxing
Financial (positive)
Time with family/friends
Keeping busy/active
No time constraints/having freedom
5%
1%
1%
1%
2%
3%
3%
4%
4%
5%
6%
7%
8%
10%
11%
18%
23%
Other/no answer
Not feeling as sharp
Marital problems/no companion
Widowhood/loss of family/friends
Other’s assumptions
Not as much travel/activities
Hard to focus
Lack of friends/don’t see family or friends enough
Missing work/work friends/loss of professional identity
Loneliness/loss of purpose/depression/bored
Illness/disability (self and/or spouse)
No negative surprises
Too busy
Financial problems
14%
1%
2%
2%
3%
3%
5%
7%
10%
10%
10%
11%
13%
17%
Retirees (n=905)
Subgroup analysis
Retirees more likely to mention “keeping busy/active”
• Retirees in their 70s (22% vs. 15% of younger retirees)
• In better health
• Higher income
• Higher assets
• Has pension
• Financial problems (17%) and being too busy (13%) were the top mentioned negative surprises indicated by retirees.
• However, slightly more than 1 in 10 said they have not experienced any negative surprises in retirement.
• Nearly one-quarter of retirees indicate that freedom/no time constraints has been a positive surprise about retirement.
• Another 1 in 5 say that keeping busy and active has been a positive surprise about retirement.

16
Unexpected paths to retirement
Many do not end up retiring how and when they want. It
appears that hopes about work and method of retiring for the
current generation of pre-retirees will very often not
be realized.
• Almost half retired earlier than planned
– Changes in technology and changes within the
company were frequently cited as reasons why
people decided to retire earlier than planned.
• Also likely that expectations to transition out slowly,
or to work and earn money through work after retiring
from primary occupation will not be realized
– Pre-retirees indicate that they want to work as long
as possible, which means delaying retirement and
transitioning to retirement gradually.
– This highlights the need to have a financial
foundation well before the target age to retire.
Retiring earlier than planned
Other
Wanted to spend more time with family
The job was too physically demanding
You wanted to do something else
Buy-out/incentive
Your spouse or partner wanted you to
You had caregiving responsibilities
You had a health problem or disability
You lost your job
The stress of the job or commute was too much
You could afford to retire early
There were changes at your company/place of work
1%
1%
5%
7%
8%
9%
9%
16%
18%
18%
39%
44%
Retirees (n=905) Retirees who retired later (n=405)
Did you retire... ? Which of the following are reasons why you retired earlier than planned?
legend 3
legend 2
legend 152%
3%
45%
• Of retirees, 45% retired earlier than planned.
• The top reasons for retiring early include changes at their company/place of work (44%), and being able to afford to retire early (39%).
n Earlier than planned
n About when planned
n Later then planned
Subgroup analysis
Retirees with under $100K in assets are actually the most likely to retire early: 53% report retiring early vs. just 43% of those with more assets.

17
Retiring later than planned
Looking back at retirement timing
Loss of spouse
You had an unexpected health-related expense
Loyalty to company
You had an unexpected non-health-related expense
You had less in savings than you expected to have
You enjoyed your co-workers
You needed the income
You wanted to keep your benefits
Your job gave you a sense of identity
You enjoyed working
You decided to build up your savings more
6%
6%
10%
10%
13%
23%
26%
35%
39%
48%
48%
Retirees (n=905) Retirees who retired later (n=31) [small sample size]
Retirees (n=270)
Did you retire... ?
Retirees: Looking back, do you think... ?
Which of the following are reasons why you retired later than planned?
legend 3
legend 2
legend 152%
3%
45%
legend 4
legend 3
legend 2
legend 1
14%6%
79%
• Of retirees, only 3% retired later than planned.
• The top reasons for retiring later than planned include; deciding to build up savings (48%), enjoying working (48%), job giving you a sense of identity (39%), and wanting to keep benefits (35%).
• Of those who retired earlier than planned, nearly 4 in 5 believe they made the right decision about retiring when they did.
• Fourteen percent, however, wish they had worked longer than they did.
n Earlier than planned
n About when planned
n Later then planned
n Made the right decision about retiring when you did
n Should have worked longer than you did
n Should have retired earlier than you did
n Not applicable/did not have a choice about timing of retirement
Subgroup analysis
21% of those in poorer health feel that they should have worked longer, compared to just 11% of those in better health.
18
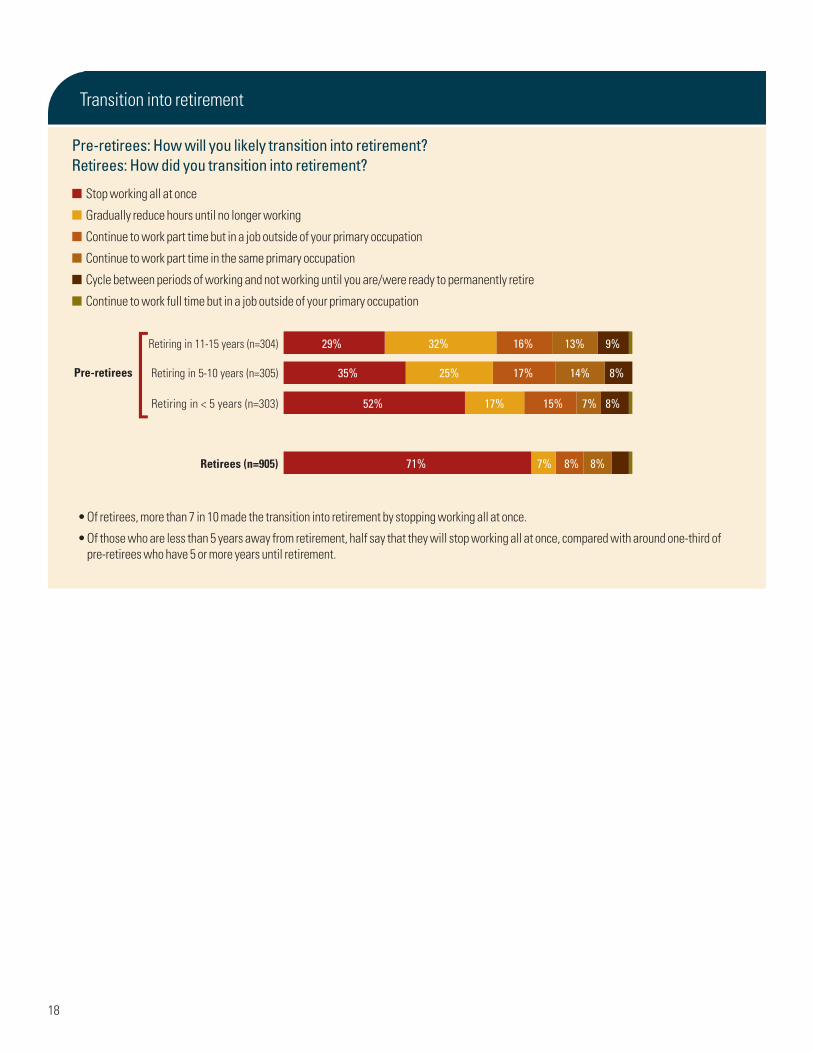
Transition into retirement
Retiring in 11-15 years (n=304)
Retiring in 5-10 years (n=305)
Retiring in < 5 years (n=303)
Retirees (n=905)
Pre-retirees[29% 32% 16% 13% 9%
35% 25% 17% 14% 8%
52% 17% 15% 7% 8%
71% 7% 8% 8%
Pre-retirees: How will you likely transition into retirement?Retirees: How did you transition into retirement?
• Of retirees, more than 7 in 10 made the transition into retirement by stopping working all at once.
• Of those who are less than 5 years away from retirement, half say that they will stop working all at once, compared with around one-third of pre-retirees who have 5 or more years until retirement.
n Stop working all at once
n Gradually reduce hours until no longer working
n Continue to work part time but in a job outside of your primary occupation
n Continue to work part time in the same primary occupation
n Cycle between periods of working and not working until you are/were ready to permanently retire
n Continue to work full time but in a job outside of your primary occupation
19
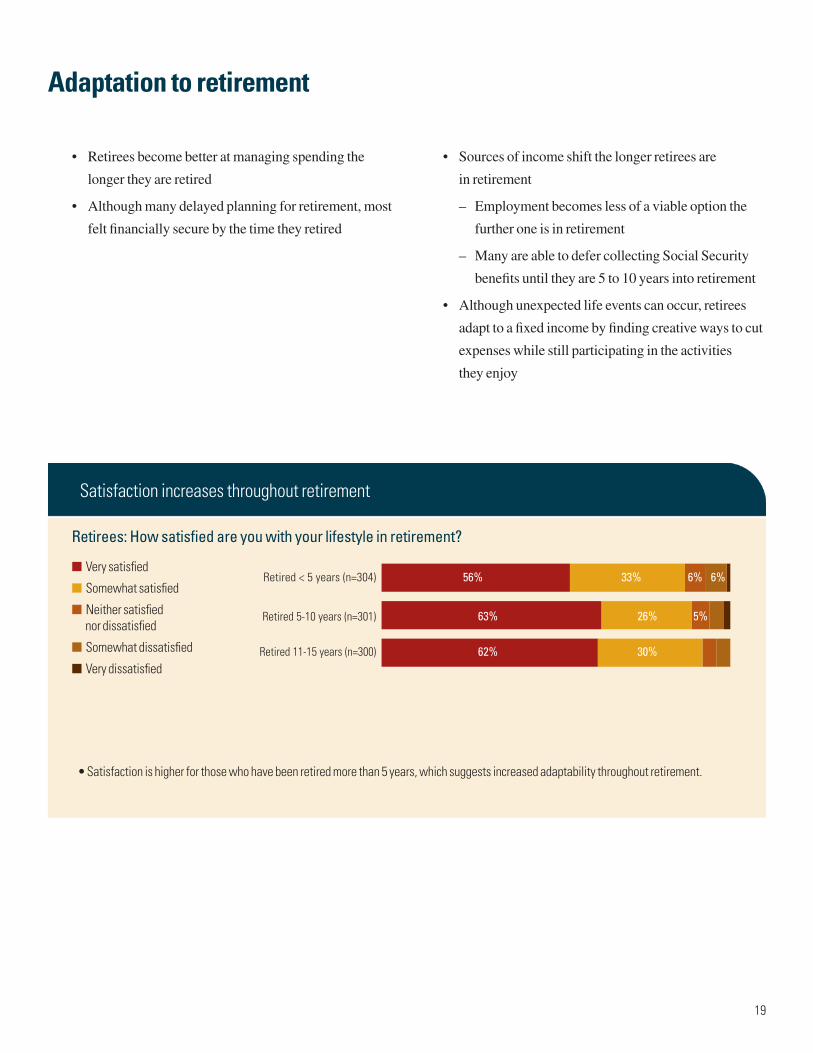
• Retirees become better at managing spending the
longer they are retired
• Although many delayed planning for retirement, most
felt financially secure by the time they retired
• Sources of income shift the longer retirees are
in retirement
– Employment becomes less of a viable option the
further one is in retirement
– Many are able to defer collecting Social Security
benefits until they are 5 to 10 years into retirement
• Although unexpected life events can occur, retirees
adapt to a fixed income by finding creative ways to cut
expenses while still participating in the activities
they enjoy
Adaptation to retirement
Satisfaction increases throughout retirement
Retirees: How satisfied are you with your lifestyle in retirement?
• Satisfaction is higher for those who have been retired more than 5 years, which suggests increased adaptability throughout retirement.
n Very satisfied
n Somewhat satisfied
n Neither satisfied nor dissatisfied
n Somewhat dissatisfied
n Very dissatisfiedRetired 11-15 years (n=300)
Retired 5-10 years (n=301)
Retired < 5 years (n=304) 56% 33% 6% 6%
63% 26% 5%
62% 30%

20
Preparations increase as people approach retirement
Pre-retirees: How good a job do you feel you are doing in terms of the following?
Retirees: How good a job do you feel you did leading up to retirement in terms of the following?
(% Excellent/very good)
• The closer pre-retirees get to their expected retirement date, the better they feel about their preparedness in terms of picking good investments, managing investments, saving enough, starting to save early enough, and getting good retirement advice.
Financial security in retirement
Pre-retirees: To what extent do you feel you are on track toward being financially secure in retirement? Retirees: At the time you retired, to what extent did you feel financially secure?
(% 4-5) Net Completely
Retired 11-15 years ago (n=300)
Retired 5-10 years ago (n=301)
Retired < 5 years ago (n=304)
Retiring in < 5 years (n=303)
Retiring in 5-10 years (n=305)
Retiring in 11-15 years (n=304)
77%
83%
83%
Retirees[
63%
69%
82%
Pre-retirees[
Managing investments foryour retirement savings
51%57%62%67%
Picking good investments foryour retirement savings
49%51%59%62%
Starting to save earlyenough for retirement
47%50%62%64%
Saving enoughfor retirement
45%52%60%67%
Getting good advice aboutsaving for retirement
43%51%62%60%
• Among pre-retirees, more than 8 in 10 of those who expect to retire in the next 5 years feel they are on track toward financial security in retirement, compared with less than 7 in 10 of those who have 5 or more years until they expect to retire.
• Irrespective of how many years ago they retired, around 8 in 10 retirees felt financially secure when they retired.
Pre-retirees
n Retiring in 11-15 years (n=304)
n Retiring in 5-10 years (n=305)
n Retiring in < 5 years (n=303)
n Retirees (n=905)
RETIREMENT
21
• Four in 10 pre-retirees expect their expenses to be about the same in the first 5 years of retirement, whereas 3 in 10 expect their expenses to be a little lower.
• Retirees’ actual expenses in the first 5 years of retirement are similar to pre-retirees’ estimates, which suggests that pre-retirees are being realistic about their expenses in retirement.
Pre-retirees (n=912); Retirees (n=905)
Expenses in retirement
Pre-retirees: Do you expect your expenses for the first 5 years of retirement to be...Retirees: So far in retirement have your expenses been...
40%
40%
22%
21%Pre-retirees
Retirees30%
33%
9%
7%
18%
18%
More likely to expect or have higher expenses
Pre-retirees• Women• Not married (or living with partner)
Retirees• In poorer health• Lower assets• No pension
n Much lower
n A little lower
n Much higher
n A little higher
• Nearly 4 in 10 of those who retired 11 to 15 years ago say they are doing an excellent job managing their spending, compared with only about a quarter of those who retired within the last 5 years.
• Retirees are slightly more likely than pre-retirees to say that their planning helped a great deal in helping them achieve their retirement goals.
Ability to manage spending increases in retirement
Retirees: How good a job do you feel you are doing now in terms of managing your spending?
Pre-retirees: How much will the planning you have done help you achieve your retirement goals? Retirees: How much did the planning you did before retiring help you achieve your retirement goals?
Retired < 5 years (n=304)
Retired 5-10 years (n=301)
Retired 11-15 years (n=300)
Pre-retirees (n=912)
Retirees (n=905)
23% 45% 25% 7%
34% 43% 17% 7%
38% 39% 20%
37% 41% 19%
7%43% 31% 18%
Retired < 5 years (n=304)
Retired 5-10 years (n=301)
Retired 11-15 years (n=300)
Pre-retirees (n=912)
Retirees (n=905)
23% 45% 25% 7%
34% 43% 17% 7%
38% 39% 20%
37% 41% 19%
7%43% 31% 18%
n Excellent
n Very good
n Good
n Fair/poor
n Will help/helped a great deal (5)
n 4
n 3
n Will do/did little help (net 1 to 2)
22
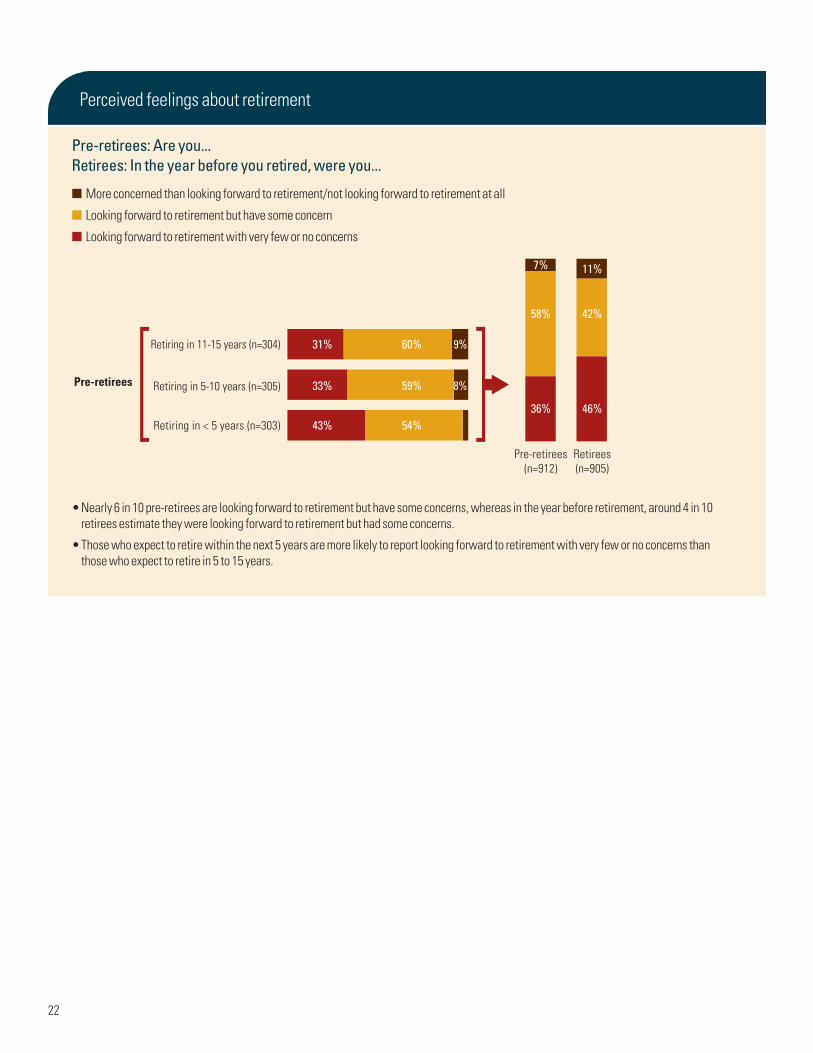
Perceived feelings about retirement
Retiring in 11-15 years (n=304)
Retiring in 5-10 years (n=305)
Retiring in < 5 years (n=303)
Retirees(n=905)
Pre-retirees(n=912)
Pre-retirees[ [33%
43%
31%
59%
54%
60%
8%
9%
58%
7%
36%
42%
11%
46%
Pre-retirees: Are you...Retirees: In the year before you retired, were you...
• Nearly 6 in 10 pre-retirees are looking forward to retirement but have some concerns, whereas in the year before retirement, around 4 in 10 retirees estimate they were looking forward to retirement but had some concerns.
• Those who expect to retire within the next 5 years are more likely to report looking forward to retirement with very few or no concerns than those who expect to retire in 5 to 15 years.
n More concerned than looking forward to retirement/not looking forward to retirement at all
n Looking forward to retirement but have some concern
n Looking forward to retirement with very few or no concerns

23
• Among pre-retirees, Social Security benefits and withdrawals from an employer-sponsored retirement savings plan are the most common projected sources of income in retirement.
• Those who are closer to their expected retirement date are slightly more likely to expect that payments from a defined benefit pension plan will be a source of income in retirement.
• Compared with pre-retirees who are 5 or more years away from retirement, those who are less than 5 years away from their expected retirement date are less likely to indicate employment in retirement as a projected source of income.
• Among pre-retirees, some of the less common projected sources of income in retirement are payouts from an annuity, rental property or real estate income, or a reverse mortgage.
Retiring in < 5 years (n=303); Retiring in 5-10 years (n=305); Retiring in 11-15 years (n=304)
Projected sources of income
Pre-Retirees: What are your projected sources of income in retirement?
Social Security benefitsRetiring in < 5 years
Retiring in 5-10 yearsRetiring in 11-15 years
94%99%96%
Withdrawals from anemployer-sponsored retirement
savings plan [e.g., 401(k)]
Retiring in < 5 yearsRetiring in 5-10 years
Retiring in 11-15 years
85%89%90%
Withdrawals from anIRA or Roth IRA
Retiring in < 5 yearsRetiring in 5-10 years
Retiring in 11-15 years
82%81%77%
Withdrawals from taxableinvestment or bank accounts
Retiring in < 5 yearsRetiring in 5-10 years
Retiring in 11-15 years
71%70%69%
Payments from a definedbenefit pension plan
Retiring in < 5 yearsRetiring in 5-10 years
Retiring in 11-15 years
69%60%59%
Employment in retirement,including self-employment
Retiring in < 5 yearsRetiring in 5-10 years
Retiring in 11-15 years
47%59%61%
Guaranteed lifetime incomepayments from payout annuity
Retiring in < 5 yearsRetiring in 5-10 years
Retiring in 11-15 years
32%30%21%
Rental property or real estate(excluding primary home)
Retiring in < 5 yearsRetiring in 5-10 years
Retiring in 11-15 years
20%19%26%
A reverse mortgage orhome equity loan
Retiring in < 5 yearsRetiring in 5-10 years
Retiring in 11-15 years7%
4%
5%
24
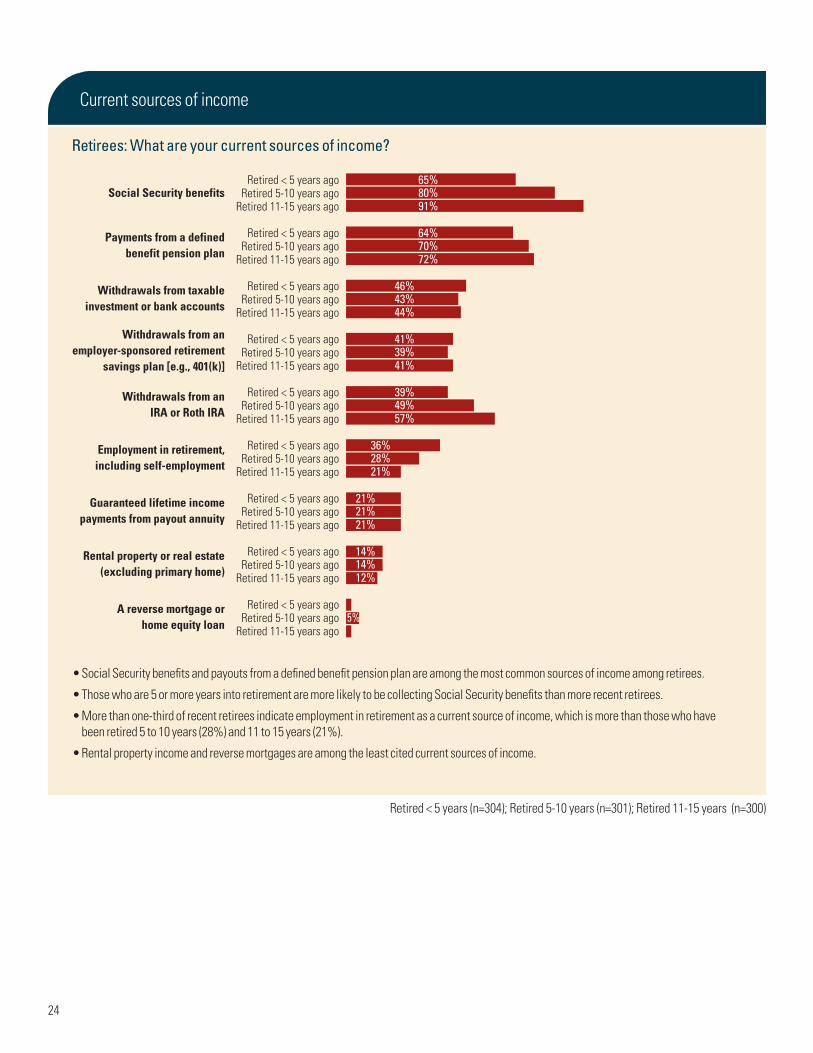
• Social Security benefits and payouts from a defined benefit pension plan are among the most common sources of income among retirees.
• Those who are 5 or more years into retirement are more likely to be collecting Social Security benefits than more recent retirees.
• More than one-third of recent retirees indicate employment in retirement as a current source of income, which is more than those who have been retired 5 to 10 years (28%) and 11 to 15 years (21%).
• Rental property income and reverse mortgages are among the least cited current sources of income.
Retirees: What are your current sources of income?
Social Security benefitsRetired < 5 years ago
Retired 5-10 years agoRetired 11-15 years ago
65%80%91%
Payments from a definedbenefit pension plan
Retired < 5 years agoRetired 5-10 years ago
Retired 11-15 years ago
64%70%72%
Withdrawals from taxableinvestment or bank accounts
Retired < 5 years agoRetired 5-10 years ago
Retired 11-15 years ago
46%43%44%
Withdrawals from anemployer-sponsored retirement
savings plan [e.g., 401(k)]
Retired < 5 years agoRetired 5-10 years ago
Retired 11-15 years ago
41%39%41%
Withdrawals from anIRA or Roth IRA
Retired < 5 years agoRetired 5-10 years ago
Retired 11-15 years ago
39%49%57%
Employment in retirement,including self-employment
Retired < 5 years agoRetired 5-10 years ago
Retired 11-15 years ago
36%28%21%
Guaranteed lifetime incomepayments from payout annuity
Retired < 5 years agoRetired 5-10 years ago
Retired 11-15 years ago
21%21%21%
Rental property or real estate(excluding primary home)
Retired < 5 years agoRetired 5-10 years ago
Retired 11-15 years ago
14%14%12%
A reverse mortgage orhome equity loan
Retired < 5 years agoRetired 5-10 years ago
Retired 11-15 years ago5%
Current sources of income
Retired < 5 years (n=304); Retired 5-10 years (n=301); Retired 11-15 years (n=300)

25
How to get in a better position
• Don’t delay preparations for retirement
– Earlier preparation contributes to feelings of
financial security, particularly in terms of calcu-
lating a target for how much money is needed in
order to afford to retire, making efforts to increase
savings, and calculating the best time to collect
Social Security benefits
• Work with a financial advisor
• Adjust expectations for the transition into retirement,
as many do not end up retiring when or how
they wanted
• Given the likelihood of retiring earlier than expected,
it is critical to begin financial preparations as early
as possible
Lessons learned
• Among retirees and pre-retirees who had a financial advisor, almost everyone saw their financial advisor as helpful for retirement planning.
• Employers were considered less helpful than financial advisors and plan providers. Still, about half of pre-retirees and retirees thought their (last) employer was helpful in planning/preparing for their retirement.
Retirement planning assistance
Pre-retirees: How helpful have the following been in terms of helping you to plan/ prepare for your retirement? Retirees: Prior to retiring, how helpful were the following in terms of helping you to plan/ prepare for your retirement?
n Very helpful n Somewhat helpful n Net not helpful
Retirees (n=496)
Pre-retirees (n=405)Your financialadvisor
Retirees (n=665)
Pre-retirees (n=763)The plan provider of your(last) employer-sponsored
retirement plan
Retirees (n=665)
Pre-retirees (n=763)Your employer/the lastemployer you hadbefore retirement
34%62%
33% 7%60%
34%45%
43%39%
50%39%
52%31%
21%
18%
12%
17%

26
Steps to prepare for retirement
• Perhaps surprisingly, around half of retirees did not create a budget or a written financial plan for retirement prior to retiring.
• The percentage of pre-retirees who indicate taking steps to prepare for retirement – such as creating a budget or written financial plan or calculating retirement fund targets or determining the best time to begin collecting Social Security benefits – increases as the expected retire-ment date gets closer.
• Around 6 in 10 pre-retirees have made efforts to increase savings for retirement, compared with around half of retirees taking this step prior to retiring.
Retiring in 11-15 years (n=304); Retiring in 5-10 years (n=305); Retiring in < 5 years (n=303); Retired (n=905)
Pre-retirees: Have you taken any of these steps? Retirees: Did you take any of these steps before retiring?
Retiring in 11-15 years
Retiring in 5-10 years
Retiring in < 5 years
Retired
Created a budgetfor retirement
Retiring in 11-15 years
Retiring in 5-10 years
Retiring in < 5 years
Retired
Created a written financialplan for retirement
Retiring in 11-15 years
Retiring in 5-10 years
Retiring in < 5 years
Retired
Calculated the best timeto begin collecting
Social Security benefits
Retiring in 11-15 years
Retiring in 5-10 years
Retiring in < 5 years
Retired
Calculated a target for howmuch money you need in
order to afford to retire
Retiring in 11-15 years
Retiring in 5-10 years
Retiring in < 5 years
Retired
Made efforts toincrease savings
Retiring in 11-15 years
Retiring in 5-10 years
Retiring in < 5 years
Retired
Used financial/investment guidanceprovided by your employers’
retirement plan provider*
Retiring in 11-15 years
Retiring in 5-10 years
Retiring in < 5 years
Retired
Rebalanced stocksand bonds
20% 68%
22% 61%
33% 52%
48% 9%
20% 54%
28% 47%
33% 39%
36% 10%
36% 59%
49% 47%
60% 33%
70% 5%
48% 45%
54% 37%
64% 28%
61% 7%
58% 33%
64% 26%
60% 22%
48% 10%
37% 28%
37% 31%
38% 23%
35% 10%
31% 54%
43% 43%
45% 33%
47% 4%
n Yes, did it
n Planning to do/wish I had done
27
• The trend among pre-retirees is that the percentage who indicate taking steps to prepare for retirement, such as rebalancing stocks and bonds or working with a financial advisor, gradually increases as they get closer to their expected retirement date.
• Nearly 6 in 10 pre-retirees have increased contributions to an employer-sponsored retirement savings plan to prepare for retirement, compared with only a third of retirees indicating that they took this step prior to retiring.
• Prior to retiring, more than half of retirees estimated medical and dental expenses in retirement.
– Although the majority of pre-retirees see this as a necessary step, those who are less than 5 years from retiring are more likely to have already taken this step.
Retiring in 11-15 years (n=304); Retiring in 5-10 years (n=305); Retiring in < 5 years (n=303); Retired (n=905)
Pre-retirees: Have you taken any of these steps? Retirees: Did you take any of these steps before retiring?
Retiring in 11-15 years
Retiring in 5-10 years
Retiring in < 5 years
Retired
Created a budgetfor retirement
Retiring in 11-15 years
Retiring in 5-10 years
Retiring in < 5 years
Retired
Created a written financialplan for retirement
Retiring in 11-15 years
Retiring in 5-10 years
Retiring in < 5 years
Retired
Calculated the best timeto begin collecting
Social Security benefits
Retiring in 11-15 years
Retiring in 5-10 years
Retiring in < 5 years
Retired
Calculated a target for howmuch money you need in
order to afford to retire
Retiring in 11-15 years
Retiring in 5-10 years
Retiring in < 5 years
Retired
Made efforts toincrease savings
Retiring in 11-15 years
Retiring in 5-10 years
Retiring in < 5 years
Retired
Used financial/investment guidanceprovided by your employers’
retirement plan provider*
Retiring in 11-15 years
Retiring in 5-10 years
Retiring in < 5 years
Retired
Rebalanced stocksand bonds
20% 68%
22% 61%
33% 52%
48% 9%
20% 54%
28% 47%
33% 39%
36% 10%
36% 59%
49% 47%
60% 33%
70% 5%
48% 45%
54% 37%
64% 28%
61% 7%
58% 33%
64% 26%
60% 22%
48% 10%
37% 28%
37% 31%
38% 23%
35% 10%
31% 54%
43% 43%
45% 33%
47% 4%
Retiring in 11-15 years
Retiring in 5-10 years
Retiring in < 5 years
Retired
Worked with afinancial advisor
Retiring in 11-15 years
Retiring in 5-10 years
Retiring in < 5 years
Retired
Increased contributions to anemployer-sponsored retirement
savings plan [e.g., 401(k)]
Retiring in 11-15 years
Retiring in 5-10 years
Retiring in < 5 years
Retired
Estimated your medical and dentalexpenses in retirement (including
the cost of Medicare)
Retiring in 11-15 years
Retiring in 5-10 years
Retiring in < 5 years
Retired
Downsized to a smaller house
Retiring in 11-15 years
Retiring in 5-10 years
Retiring in < 5 years
Retired
Made plans to establisha new career
Retiring in 11-15 years
Retiring in 5-10 years
Retiring in < 5 years
Retired
Developed a new hobby
Retiring in 11-15 years
Retiring in 5-10 years
Retiring in < 5 years
Retired
Made house orapartment renovations
40% 32%
44% 24%
50% 20%
55% 6%
55% 23%
58% 19%
55% 6%
34% 8%
16% 75%
28% 62%
43% 47%
55% 10%
7% 44%
9% 34%
11% 38%
17% 6%
6% 29%
24%
5% 19%
6%
6% 53%
8% 44%
9% 46%
21% 9%
17% 37%
29% 33%
28% 33%
33%
n Yes, did it
n Planning to do/wish I had done
*Only asked of those who had a employer-sponsored retirement plan
28
Steps to prepare for retirement (continued)
• Nearly half of pre-retirees plan to downsize to a smaller house before retiring, compared with 8 in 10 retirees indicating that they did not need to take this step.
• The majority of retirees report that they did not need to make plans to establish a new career (88%).
– In contrast, one-third of those who are 5+ years away from retiring indicate that they plan to take this step prior to retiring.
• One-third of retirees made house or apartment renovations and one-fifth developed a new hobby prior to retiring.
– However, more than half of pre-retirees indicate that they have taken or plan to take these steps in the future.
Retiring in 11-15 years (n=304); Retiring in 5-10 years (n=305); Retiring in < 5 years (n=303); Retired (n=905)
Pre-retirees: Have you taken any of these steps? Retirees: Did you take any of these steps before retiring?
Retiring in 11-15 years
Retiring in 5-10 years
Retiring in < 5 years
Retired
Worked with afinancial advisor
Retiring in 11-15 years
Retiring in 5-10 years
Retiring in < 5 years
Retired
Increased contributions to anemployer-sponsored retirement
savings plan [e.g., 401(k)]
Retiring in 11-15 years
Retiring in 5-10 years
Retiring in < 5 years
Retired
Estimated your medical and dentalexpenses in retirement (including
the cost of Medicare)
Retiring in 11-15 years
Retiring in 5-10 years
Retiring in < 5 years
Retired
Downsized to a smaller house
Retiring in 11-15 years
Retiring in 5-10 years
Retiring in < 5 years
Retired
Made plans to establisha new career
Retiring in 11-15 years
Retiring in 5-10 years
Retiring in < 5 years
Retired
Developed a new hobby
Retiring in 11-15 years
Retiring in 5-10 years
Retiring in < 5 years
Retired
Made house orapartment renovations
40% 32%
44% 24%
50% 20%
55% 6%
55% 23%
58% 19%
55% 6%
34% 8%
16% 75%
28% 62%
43% 47%
55% 10%
7% 44%
9% 34%
11% 38%
17% 6%
6% 29%
24%
5% 19%
6%
6% 53%
8% 44%
9% 46%
21% 9%
17% 37%
29% 33%
28% 33%
33%
n Yes, did it
n Planning to do/wish I had done

29
• About one-third of retirees researched a new place to live.
– Around 50% to 60% of pre-retirees have taken or intend to take this step.
• Nearly half of retirees indicate that they made new friends or reconnected with old friends to prepare for retirement, compared with less than a quarter of pre-retirees.
• Focusing on the relationship with one’s spouse or partner is a step that 4 in 10 retirees took prior to retirement, whereas 48% to 55% of pre-retirees have already taken this step.
Retiring in 11-15 years (n=304); Retiring in 5-10 years (n=305); Retiring in <5 years (n=303); Retired (n=905)
Pre-retirees: Have you taken any of these steps? Retirees: Did you take any of these steps before retiring?
Retiring in 11-15 years
Retiring in 5-10 years
Retiring in < 5 years
Retired
Researched a new place to live
Retiring in 11-15 years
Retiring in 5-10 years
Retiring in < 5 years
Retired
Made new friends/reconnectedwith old friends
Retiring in 11-15 years
Retiring in 5-10 years
Retiring in < 5 years
Retired
Focused on relationship withspouse or partner*
40% 32%
44% 24%
50% 20%
55% 6%
55% 23%
58% 19%
55% 6%
34% 8%
16% 75%
28% 62%
43% 47%
55% 10%
7% 44%
9% 34%
11% 38%
61%17% 6%
17% 43%
19% 30%
24% 32%
29%
14% 56%
22% 53%
18% 52%
45% 9%
55% 38%
53% 33%
48% 41%
41% 7%
n Yes, did it
n Planning to do/wish I had done
*Has spouse or partner

30
Early preparation is key
Key to financial security
Key to greater enjoyment
Late preparation = < 5 years before retiring; Early preparation = 5+ years before retiring
• Those who prepare earlier for retirement tend to feel
more financially secure in retirement.
• The key steps that contribute to financial security if
taken 5 or more years before retirement are:
– Calculating a target for how much money is needed
in order to afford to retire
– Making efforts to increase savings
– Calculating the best time to collect
Social Security benefits
• Prior to retiring, strengthening the relationship with
one’s spouse or significant other leads to greater
enjoyment in retirement.
– Taking this step earlier is better. Those who began
focusing on their relationship with their spouse or
significant other 5 or more years prior to retirement
are more likely to enjoy retirement than those who
took this step less than 5 years before retirement.
Percentage of retirees who feel financially secure by how early they prepare
Percentage of retirees who are enjoying retirement by how early they prepare
Early preparation (n=257)Late preparation (n=297)
Calculating a target for howmuch money is needed in
order to afford to retire
Early preparation (n=292)Late preparation (n=140)Making efforts to
increase savings
Early preparation (n=106)Late preparation (n=531)
Calculating the besttime to collect
Social Security benefits
Early preparation (n=120)Late preparation (n=117)Focusing on the relationship
with spouse/significant other 89%84%
77%67%
71%56%
74%65%
31
Timing of steps to prepare for retirement
• Retirees who took these steps prior to retiring often did
so in the 5 years leading up to their retirement date.
• Approximately half of retirees who took steps, such
as used financial guidance provided by employers’
retirement plan provider and worked with a financial
advisor, started 6+ years before retiring.
• Nearly one-third of retirees who increased contribu-
tions to an employer-sponsored retirement savings
plan [e.g., 401(k)] did so 11 or more years
before retiring.
Retiring in 5-10 years (n=305); Retiring in < 5 years (n=303); Retired (n=905)
Retirees: Approximately when did you start taking each of these steps?
Researched a new place to live (n=266)
Focused on relationship with spouse/partner (n=274)
Made new friends/reconnected with old friends (n=411)
Made plans to establish a new career (n=58)
Made house or apartment renovations (n=298)
Downsized to a smaller house (n=154)
Developed a new hobby (n=193)
Estimated medical and dental expenses(including the cost of Medicare) (n=500)
Increased contributions to an employer-sponsoredretirement savings plan [e.g., 40l(k)] (n=228)
Worked with a financial advisor (n=496)
Rebalanced stocks and bonds (n=426)
Used financial/investment guidance provided byyour employers’ retirement plan provider (n=241)
Made efforts to increase savings (n=432)
Calculated a target for how much money youneed in order to afford retirement (n=554)
Calculated the best time to begin collectingSocial Security benefits (n=637)
Created a written financial plan for retirement (n=322)
Created a budget for retirement (n=432)
80%
51%
13%
32%
7%
17%
83%
79%
11%
7%
6%
14%
83%
92%
14%
7%
83%
82%
9%
5%
7%
13%
25%
45%
45%
29%
31%
26%
74%
53%
20%
16%
5%
32%
32%
54%
36%
17%
31%
29%
83%
63%
13%
14%
4%
23%
76% 7%17%
Time before retirementn Less than 5 years n 5 to 10 years n 11 or more years
32
Timing of steps to prepare for retirement (continued)
Retiring in 5-10 years (n=305); Retiring in < 5 years (n=303); Retired (n=905)
Retirees: Approximately when did you start taking each of these steps?
Researched a new place to live (n=266)
Focused on relationship with spouse/partner (n=274)
Made new friends/reconnected with old friends (n=411)
Made plans to establish a new career (n=58)
Made house or apartment renovations (n=298)
Downsized to a smaller house (n=154)
Developed a new hobby (n=193)
Estimated medical and dental expenses(including the cost of Medicare) (n=500)
Increased contributions to an employer-sponsoredretirement savings plan [e.g., 40l(k)] (n=228)
Worked with a financial advisor (n=496)
Rebalanced stocks and bonds (n=426)
Used financial/investment guidance provided byyour employers’ retirement plan provider (n=241)
Made efforts to increase savings (n=432)
Calculated a target for how much money youneed in order to afford retirement (n=554)
Calculated the best time to begin collectingSocial Security benefits (n=637)
Created a written financial plan for retirement (n=322)
Created a budget for retirement (n=432)
80%
51%
13%
32%
7%
17%
83%
79%
11%
7%
6%
14%
83%
92%
14%
7%
83%
82%
9%
5%
7%
13%
25%
45%
45%
29%
31%
26%
74%
53%
20%
16%
5%
32%
32%
54%
36%
17%
31%
29%
83%
63%
13%
14%
4%
23%
76% 7%17%
Time before retirementn Less than 5 years n 5 to 10 years n 11 or more years
• Of retirees who took steps such as developed a new
hobby, downsized to a smaller house, made house/
apartment renovations, or made plans to establish a
new career, the majority took these steps when their
retirement date was within the next 5 years.
• The majority of retirees, who made it a point to make
new friends/reconnect with old friends and those who
researched a new place to live, did so within 5 years
of retirement.
• Of retirees that focused on the relationship with their
spouse/partner to prepare for retirement, the majority
took this step within 5 years of retirement.

33
Value of each retirement step
• In general, retirees and pre-retirees have similar beliefs about the value of each of these steps in preparing for retirement.
• Eight in 10 pre-retirees and retirees believe it is valuable to calculate a target for how much money is needed in order to afford to retire.
Pre-Retirees (n=912); Retirees (n=905)
Among the steps one can take to prepare for retirement, how valuable do you believe each one is?
(% valuable)
RetireesPre-retireesCalculating a target for money needed in order to afford to retire
80%83%
RetireesPre-retireesMaking efforts to increase savings
74%81%
RetireesPre-retireesCalculating the best time to begin collecting Social Security benefits
76%80%
RetireesPre-retireesFocusing on relationship with spouse/partner
68%76%
RetireesPre-retireesIncreasing contributions to an employer-sponsored retirement savings plan
71%75%
RetireesPre-retireesCreating a budget for retirement
68%73%
RetireesPre-retireesEstimating medical and dental expenses in retirement
70%72%
RetireesPre-retireesRebalancing stocks and bonds
53%64%
RetireesPre-retireesCreating a written financial plan for retirement
57%61%
RetireesPre-retireesWorking with a financial advisor
59%55%
RetireesPre-retireesUsing financial guidance provided by employers’ retirement plan provider
41%48%
RetireesPre-retireesMaking new friends/reconnecting with old friends
42%40%
RetireesPre-retireesResearching a new place to live
25%34%
RetireesPre-retireesDownsizing to a smaller house
21%32%
RetireesPre-retireesMaking house or apartment renovations
22%30%
RetireesPre-retireesDeveloping a new hobby
26%26%
RetireesPre-retireesMaking plans to establish a new career
11%14%
34
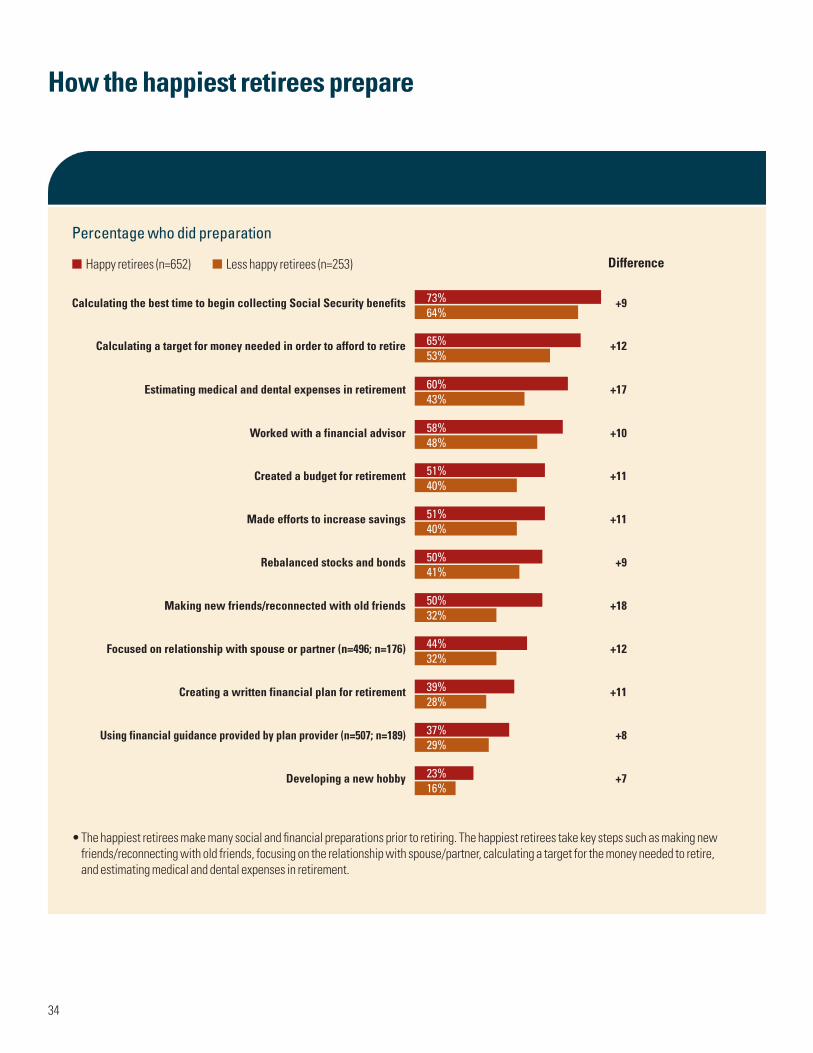
How the happiest retirees prepare
Percentage who did preparation
80%83%
81%
Developing a new hobby +716%23%
Using financial guidance provided by plan provider (n=507; n=189) +829%37%
Creating a written financial plan for retirement +1128%39%
Focused on relationship with spouse or partner (n=496; n=176) +1232%44%
Making new friends/reconnected with old friends +1832%50%
Rebalanced stocks and bonds +941%50%
Made efforts to increase savings +1140%51%
Created a budget for retirement +1140%51%
Worked with a financial advisor +1048%58%
Calculating the best time to begin collecting Social Security benefits +964%73%
Calculating a target for money needed in order to afford to retire +1253%65%
Estimating medical and dental expenses in retirement +1743%60%
n Happy retirees (n=652) n Less happy retirees (n=253) Difference
• The happiest retirees make many social and financial preparations prior to retiring. The happiest retirees take key steps such as making new friends/reconnecting with old friends, focusing on the relationship with spouse/partner, calculating a target for the money needed to retire, and estimating medical and dental expenses in retirement.
35
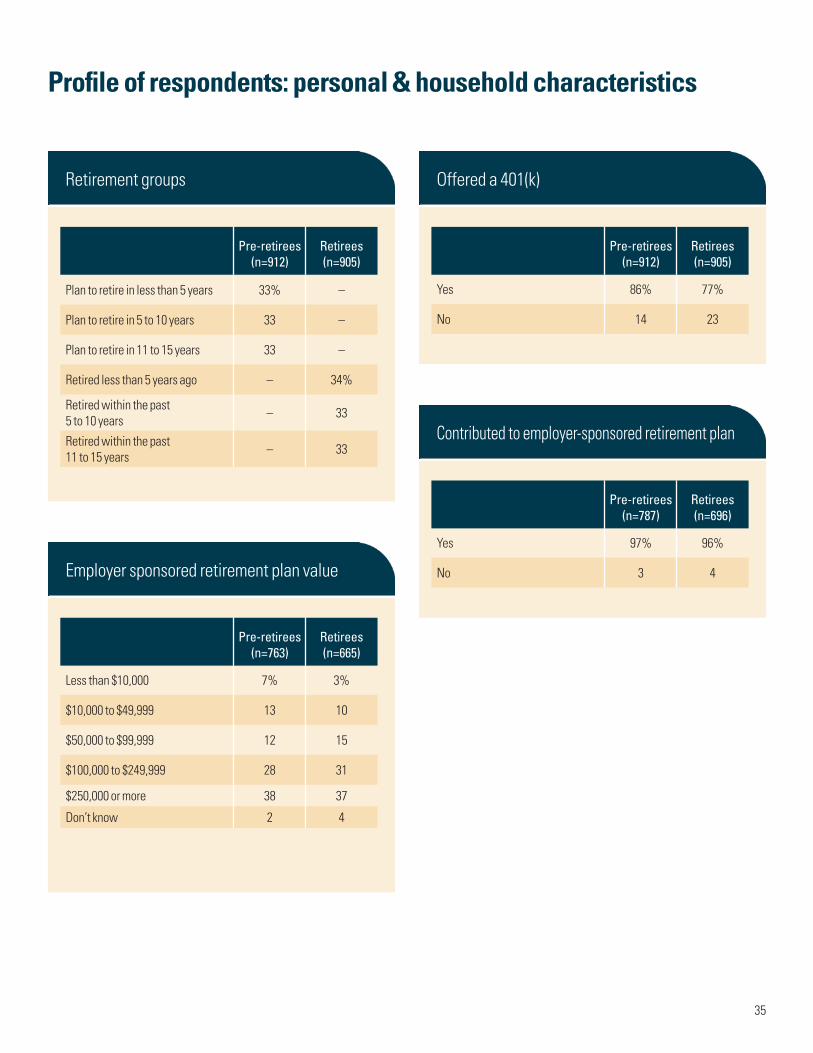
Profile of respondents: personal & household characteristics
Retirement groups
Employer sponsored retirement plan value
Offered a 401(k)
Contributed to employer-sponsored retirement plan
Pre-retirees (n=912)
Retirees (n=905)
Plan to retire in less than 5 years 33% –
Plan to retire in 5 to 10 years 33 –
Plan to retire in 11 to 15 years 33 –
Retired less than 5 years ago – 34%
Retired within the past 5 to 10 years – 33
Retired within the past 11 to 15 years – 33
Pre-retirees (n=763)
Retirees (n=665)
Less than $10,000 7% 3%
$10,000 to $49,999 13 10
$50,000 to $99,999 12 15
$100,000 to $249,999 28 31
$250,000 or more 38 37
Don’t know 2 4
Pre-retirees (n=912)
Retirees (n=905)
Yes 86% 77%
No 14 23
Pre-retirees (n=787)
Retirees (n=696)
Yes 97% 96%
No 3 4

36
Profile of respondents: personal & household characteristics (continued)
Pre-retirees (n=912)
Retirees (n=905)
Gender
Male 50% 50%
Female 50 50
Marital status
Married 70% 71%
Single, never married 11 6
Unmarried, live with partner 3 4
Divorced 11 10
Widowed 4 9
Separated 1 1
Financial decision-making
Primarily you 60% 55%
Both you and another person 40 45
Region
Northeast 28% 22%
South 23 33
Midwest 28 24
West 21 21
Pre-retirees (n=912)
Retirees (n=905)
Age
Less than 55 32% 3%
55 to 59 37 9
60 to 64 21 21
65 to 69 9 34
70 to 74 1 23
75 or older * 10
Education
Some high school or less * *
High School Graduate 7% 9%
Some college/trade or vocational school 23 28
Bachelor’s degree 36 31
Graduate or professional degree 33 31
37
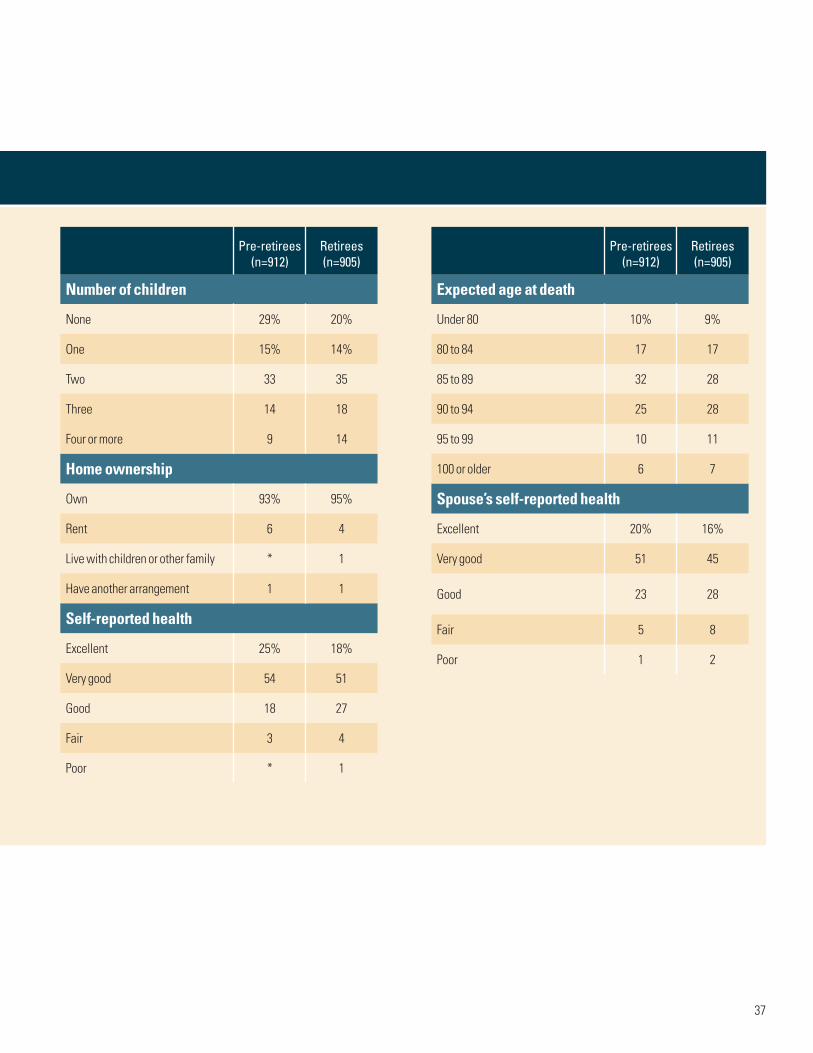
Pre-retirees (n=912)
Retirees (n=905)
Number of children
None 29% 20%
One 15% 14%
Two 33 35
Three 14 18
Four or more 9 14
Home ownership
Own 93% 95%
Rent 6 4
Live with children or other family * 1
Have another arrangement 1 1
Self-reported health
Excellent 25% 18%
Very good 54 51
Good 18 27
Fair 3 4
Poor * 1
Pre-retirees (n=912)
Retirees (n=905)
Expected age at death
Under 80 10% 9%
80 to 84 17 17
85 to 89 32 28
90 to 94 25 28
95 to 99 10 11
100 or older 6 7
Spouse’s self-reported health
Excellent 20% 16%
Very good 51 45
Good 23 28
Fair 5 8
Poor 1 2
38
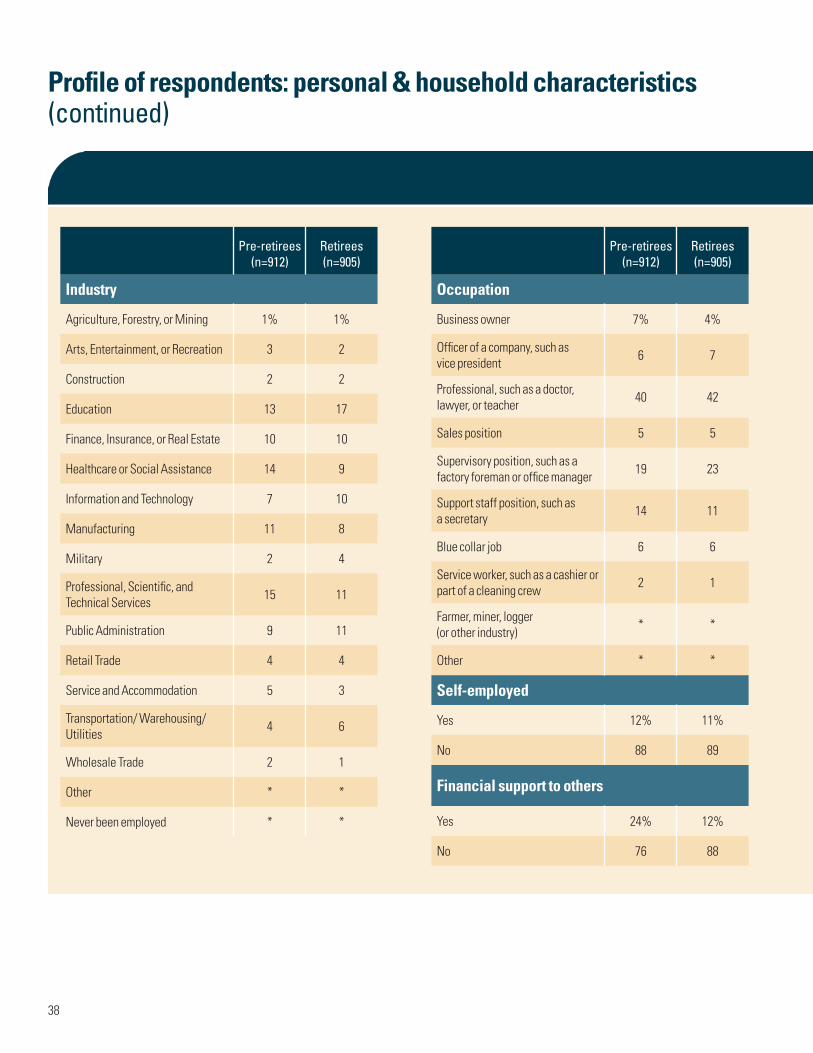
Profile of respondents: personal & household characteristics (continued)
Pre-retirees (n=912)
Retirees (n=905)
Industry
Agriculture, Forestry, or Mining 1% 1%
Arts, Entertainment, or Recreation 3 2
Construction 2 2
Education 13 17
Finance, Insurance, or Real Estate 10 10
Healthcare or Social Assistance 14 9
Information and Technology 7 10
Manufacturing 11 8
Military 2 4
Professional, Scientific, and Technical Services 15 11
Public Administration 9 11
Retail Trade 4 4
Service and Accommodation 5 3
Transportation/ Warehousing/ Utilities 4 6
Wholesale Trade 2 1
Other * *
Never been employed * *
Pre-retirees (n=912)
Retirees (n=905)
Occupation
Business owner 7% 4%
Officer of a company, such as vice president 6 7
Professional, such as a doctor, lawyer, or teacher 40 42
Sales position 5 5
Supervisory position, such as a factory foreman or office manager 19 23
Support staff position, such as a secretary 14 11
Blue collar job 6 6
Service worker, such as a cashier or part of a cleaning crew 2 1
Farmer, miner, logger (or other industry) * *
Other * *
Self-employed
Yes 12% 11%
No 88 89
Financial support to others
Yes 24% 12%
No 76 88
39
Pre-retirees (n=912)
Retirees (n=905)
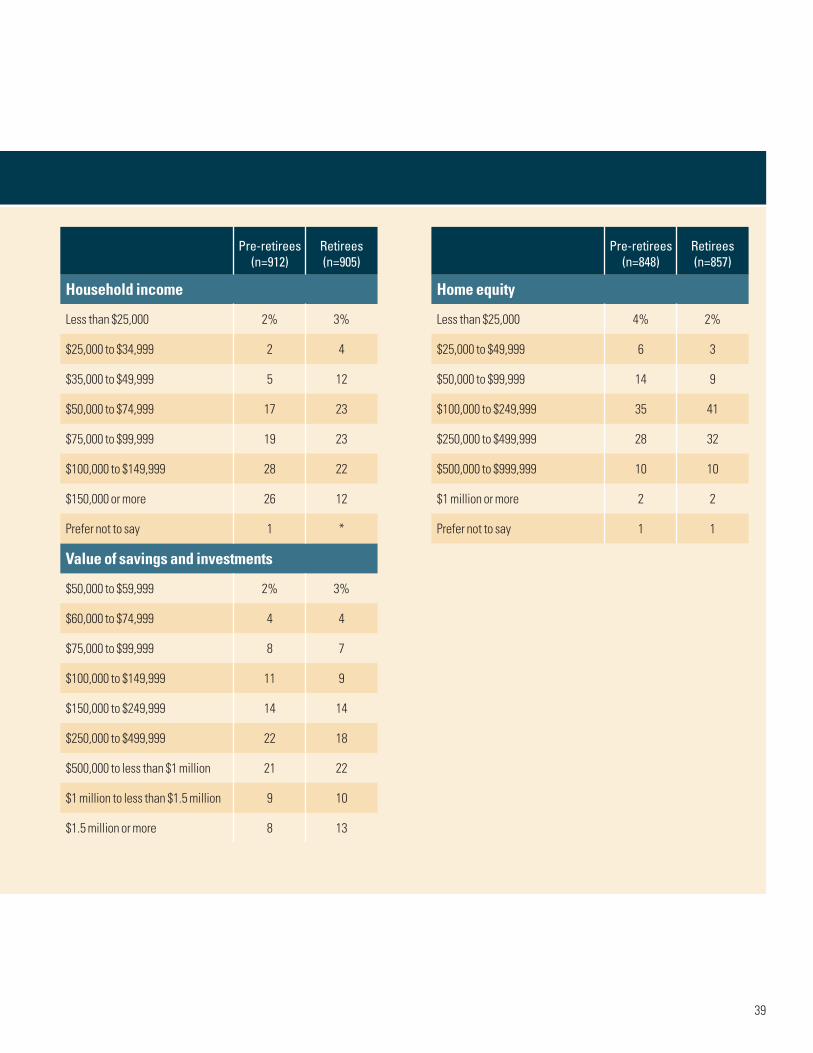
Household income
Less than $25,000 2% 3%
$25,000 to $34,999 2 4
$35,000 to $49,999 5 12
$50,000 to $74,999 17 23
$75,000 to $99,999 19 23
$100,000 to $149,999 28 22
$150,000 or more 26 12
Prefer not to say 1 *
Value of savings and investments
$50,000 to $59,999 2% 3%
$60,000 to $74,999 4 4
$75,000 to $99,999 8 7
$100,000 to $149,999 11 9
$150,000 to $249,999 14 14
$250,000 to $499,999 22 18
$500,000 to less than $1 million 21 22
$1 million to less than $1.5 million 9 10
$1.5 million or more 8 13
Pre-retirees (n=848)
Retirees (n=857)
Home equity
Less than $25,000 4% 2%
$25,000 to $49,999 6 3
$50,000 to $99,999 14 9
$100,000 to $249,999 35 41
$250,000 to $499,999 28 32
$500,000 to $999,999 10 10
$1 million or more 2 2
Prefer not to say 1 1
40
Profile of respondents: personal & household characteristics (continued)
Pre-retirees (n=912)
Retirees (n=905)
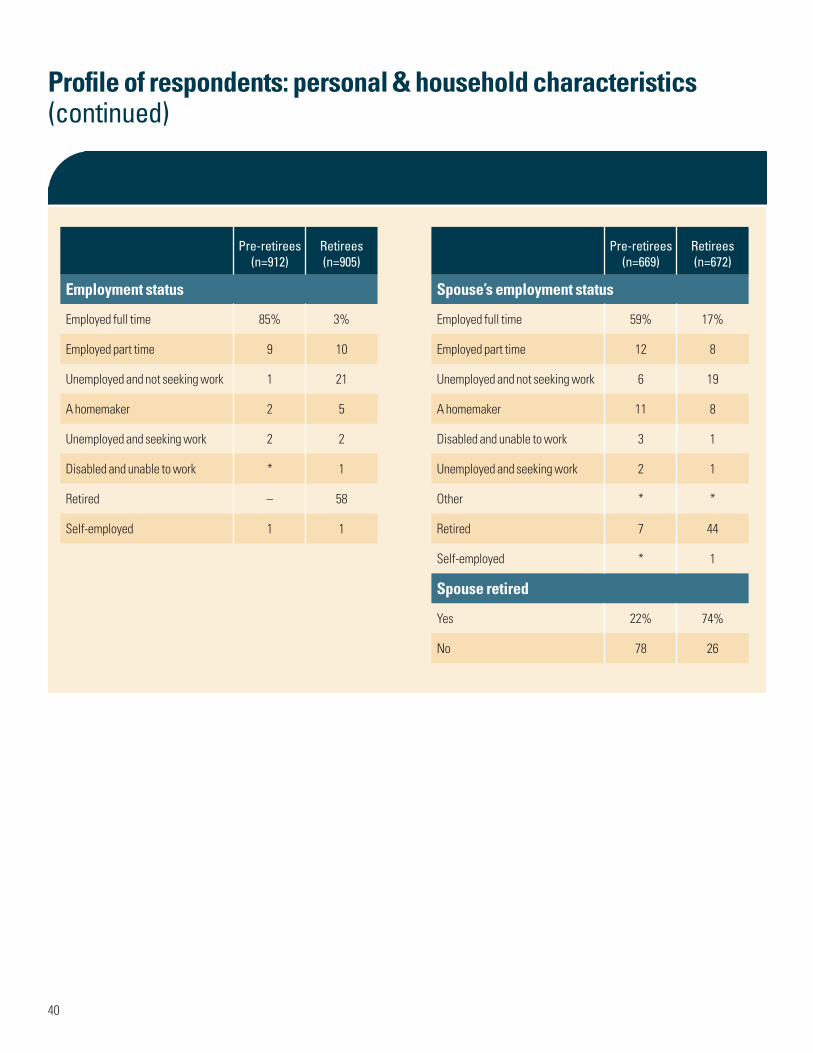
Employment status
Employed full time 85% 3%
Employed part time 9 10
Unemployed and not seeking work 1 21
A homemaker 2 5
Unemployed and seeking work 2 2
Disabled and unable to work * 1
Retired – 58
Self-employed 1 1
Pre-retirees (n=669)
Retirees (n=672)
Spouse’s employment status
Employed full time 59% 17%
Employed part time 12 8
Unemployed and not seeking work 6 19
A homemaker 11 8
Disabled and unable to work 3 1
Unemployed and seeking work 2 1
Other * *
Retired 7 44
Self-employed * 1
Spouse retired
Yes 22% 74%
No 78 26

Notes:

Notes:

MassMutual. We’ll help you get there.®

© 2014 Massachusetts Mutual Life Insurance Company, Springfield, MA 01111-0001. All rights reserved. www.massmutual.com. MassMutual Financial Group is a marketing name for Massachusetts Mutual Life Insurance Company (MassMutual) [of which Retirement Services is a division] and its affiliated companies and sales representatives.
RS5853 1214 RS-35278-00