Hopefield Wind Farm – Ready to GO - ESI-Africa.com · The Hopefield Wind Farm - Background Umoya...
17
Hopefield Wind Farm – Ready to GO ! Strictly Confidential 1
Transcript of Hopefield Wind Farm – Ready to GO - ESI-Africa.com · The Hopefield Wind Farm - Background Umoya...
Hopefield Wind Farm – Ready to GO !
Strictly Confidential 1

1 Background
The Hopefield Wind Farm - Background
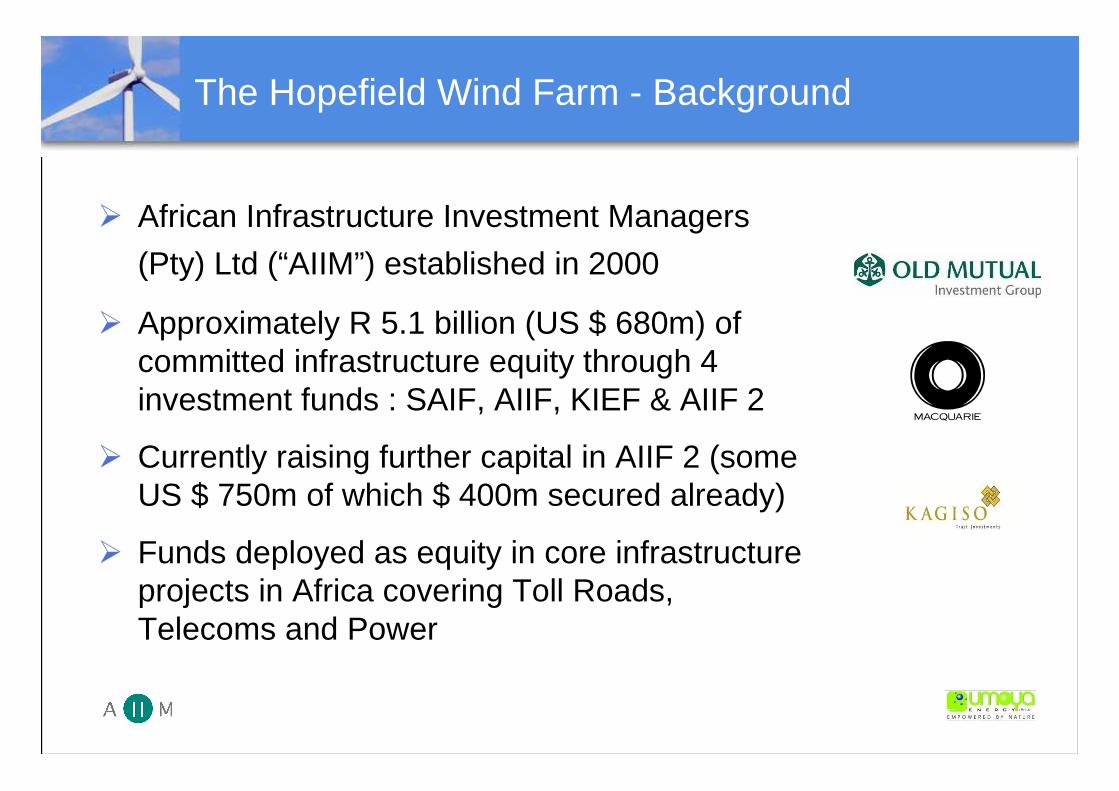
� African Infrastructure Investment Managers
(Pty) Ltd (“AIIM”) established in 2000
� Approximately R 5.1 billion (US $ 680m) of committed infrastructure equity through 4 investment funds : SAIF, AIIF, KIEF & AIIF 2
� Currently raising further capital in AIIF 2 (some US $ 750m of which $ 400m secured already)
� Funds deployed as equity in core infrastructure projects in Africa covering Toll Roads, Telecoms and Power

The Hopefield Wind Farm - Background
� Umoya Energy (Pty) Ltd was established by AIIM as a Renewable Energy Developer in 2008� Developer of the 100 MW Hopefield Wind Farm in W Cape
� Most advanced large scale commercial Wind Farm in RSA :• 24 months of hub height wind record (since Dec 2008)• Grid Connection & Generation License Application (Mar 2009)• Environmental Authorisation (Sep 2009)• Re-Zoning Approval (Local: Oct 2009 & Provincial: Aug 2010)• CAA Approval (incorporating SAAF) (Sep 2010)• Committed Equity (AIIF, KIEF, IDEAS, KTI)• Lead Arranger appointed = RMB• Lenders Technical Advisors (Legal & Technical) imminent • EPC Contractors identified (Turbine + Civil & Elec BoP)• Looking forward to the REFIT RFP process (April 2011)
� Umoya’s Hopefield Wind Farm can put energy into the grid in 2012 & 2013 during the critical pre - Medupi months.
80m monitoring mast at Hopefield site

2 From Sceptics to Believers

Hopefield Wind Farm – from Sceptics to Believers
� Hopefield Wind Farm was conceived in early 2008 by far-sighted investors. At that time, well before REFIT, the RSA market place was not a friendly place for a wind farm developer
� The Hopefield Wind Farm has been a pioneer in investigating, learning and spreading knowledge about wind energy –not as a green energy zealot, but as a serious, prudent investor.
� Umoya has had to face the usual criticisms, e.g. wind energy is unreliable, expensive, unsuitable for the grid, does not contribute to supply security etc
� We thought that sharing our findings on some of these issues was of more value than to simply detail the mechanics of wind farm development (which most of you understand anyway).

Hopefield Wind Farm – from Sceptics to Believers
� Wind Power is Unreliable – True or False ?
� Negative perceptions due to this issue are unfounded
� Wind is statistically predictable – with great accuracy
� Wind Energy is Variable but not Intermittent
� Intermittency is a binary concept, either On or Off, (actually a characteristic of conventional energy)
� Variability is significantly reduced by geographic dispersion & the portfolio effect
� Capacity factor is not an indicator of “% of time the wind blows” , e.g. Hopefield 30% vs 75%
� The variable output of a single turbine is irrelevant to the Grid Operator
� At 10% wind energy penetration levels the variability of wind is dwarfed by the normal variations of the load
200,000
205,000
210,000
215,000
220,000
225,000
230,000
235,000
240,000
1 10 19 28 37 46 55 64 73 82 91 100 109 118 127 136
Series1
Series2
Hopefield Wind Farm – from Sceptics to Believers
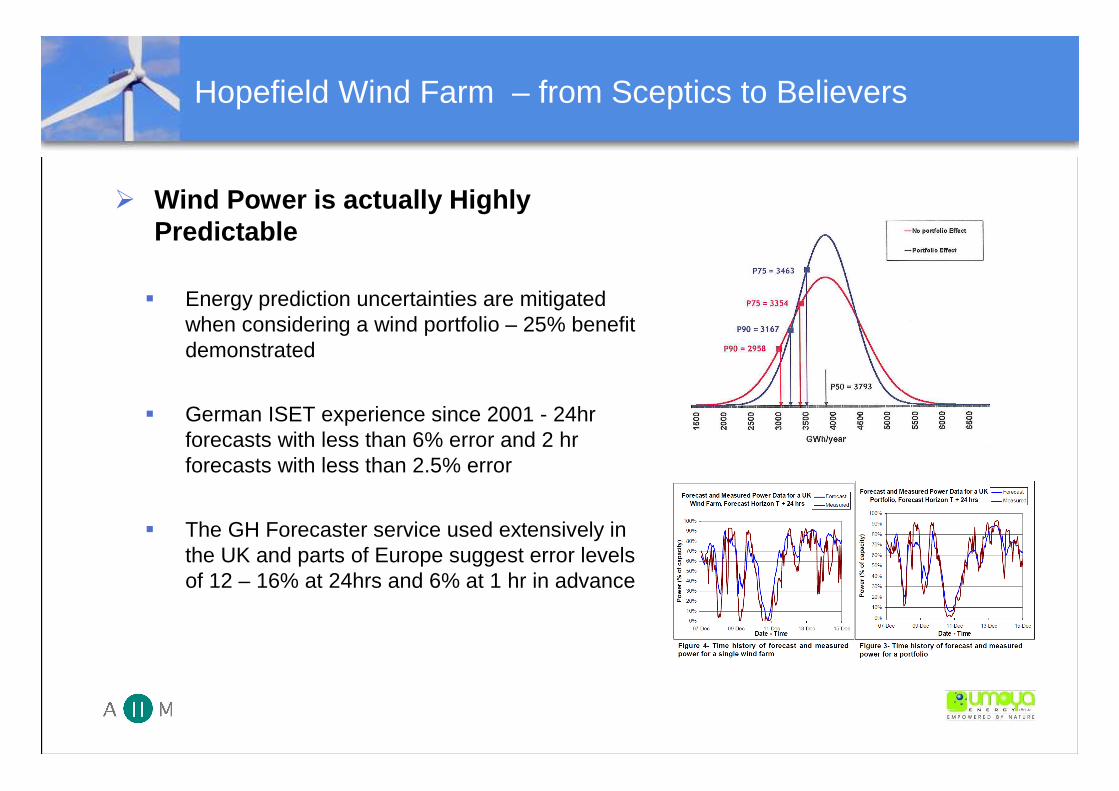
� Wind Power is actually Highly Predictable
� Energy prediction uncertainties are mitigated when considering a wind portfolio – 25% benefit demonstrated
� German ISET experience since 2001 - 24hr forecasts with less than 6% error and 2 hr forecasts with less than 2.5% error
� The GH Forecaster service used extensively in the UK and parts of Europe suggest error levels of 12 – 16% at 24hrs and 6% at 1 hr in advance

Hopefield Wind Farm – from Sceptics to Believers
� Wind Power is Expensive – True or False ?� In Europe, once externalities are included Wind
Power is no more expensive than Coal or Nuclear, in fact with CO2 @ Euro 30 / ton it is cheapest
� Wind Power costs are “certain” with 75% of energy cost upfront vs Coal & Gas with less than 50% upfront plus fuel price volatility & geo-political risk
� Over the past 20 years wind energy costs have decreased by between 9 – 17% for each doubling of installed capacity, i.e, roughly every 3 years
� RSA trends are in line with the above – see graphs of NERSA predictions
� Wind energy tariffs must be compared with the cost of adding new generation capacity (eg Medupi & Kusile) - not with the current average tariff
Projected Cost of Generation Technologies
-0.250.500.751.00
1.251.501.752.00
Rc/
KW
h
Coal CCGT Wind Biomass Biogas Landfill Gas
Coal 0.52 0.69 0.87 1.16 1.66
CCGT 1.04 1.08 1.13 1.19 1.33
Wind 1.25 1.06 1.00 0.95 0.90
Biomass 1.18 1.30 1.27 1.23 0.89
Biogas 0.96 0.93 0.91 0.89 0.87
Landfill Gas 0.90 0.92 0.89 0.87 0.75
2009 2015 2020 2025 2030`
Projected Cost of Generation Technologies
-0.501.001.502.002.503.003.504.004.50
Rc/
KW
h
Solar PV Nuclear Open Cycle Gas Turbine Solar CSP
Solar PV 3.94 3.89 3.80 3.71 3.59
Nuclear 0.73 0.78 0.92 1.19 1.76
Open Cycle Gas Turbine 2.52 3.93 3.97 3.99 4.23
Solar CSP 3.15 2.81 2.75 2.69 1.88
2009 2015 2020 2025 2030
Coal
Wind
Nuclear
Wind

Hopefield Wind Farm – from Sceptics to Believers
� Wind Power is Unsuitable for the Grid –True or False ?
� At wind energy penetration levels of around 10% the impact on the grid is limited with system operation hardly affected
� European experience is that established control methods are usually adequate for wind energy penetration levels up to 20%
� In Denmark with energy penetration of around 20%, there have been times when 100% of the energy consumed is generated by wind.
� In Spain, with wind energy penetration at around 12%, more than 50% of energy consumed was recently generated by wind.

Hopefield Wind Farm – from Sceptics to Believers
� Wind Power provides no Capacity Credit & Needs Reserves – True or False ?
� At energy penetration levels of around 10% the capacity credit of wind energy is approximated by the average of the wind farm capacity factors
� At energy penetration levels of around 10% the impact of wind energy on reserves and balancing is minimal
� At higher levels of penetration (20%) balancing costs have been found to increase by circa 10% of the wholesale price of wind generated energy (i.e. very limited)

3 RSA – Current Scenario

Wind Energy considered a Reliable Resource
� Wind Power in the RSA Energy Mix -Studies� The RSA potential wind resource has been shown to
be comfortably above 20 000 MW
� The 2009 GTZ Grid Integration Study showed that the W Cape grid can immediately accommodate almost 3 000 MW of wind without material impacts
� Eskom (2011) has confirmed this and stated that a further 1 000 MW of wind can immediately be accommodated on the E Cape grid
� These values increase by a further 1 600 MW after limited transmission strengthening (Eskom 2011)
� The 2010 Eskom / GTZ Capacity Credit Study shows that the System Operator can assume a wind capacity credit in the range of 22.5 – 27% of installed capacity for the first 10 000 MW installed
� Wind Power has been shown to be a reliable resource – a significant step change in 18 months
Wind Energy considered a Reliable Resource
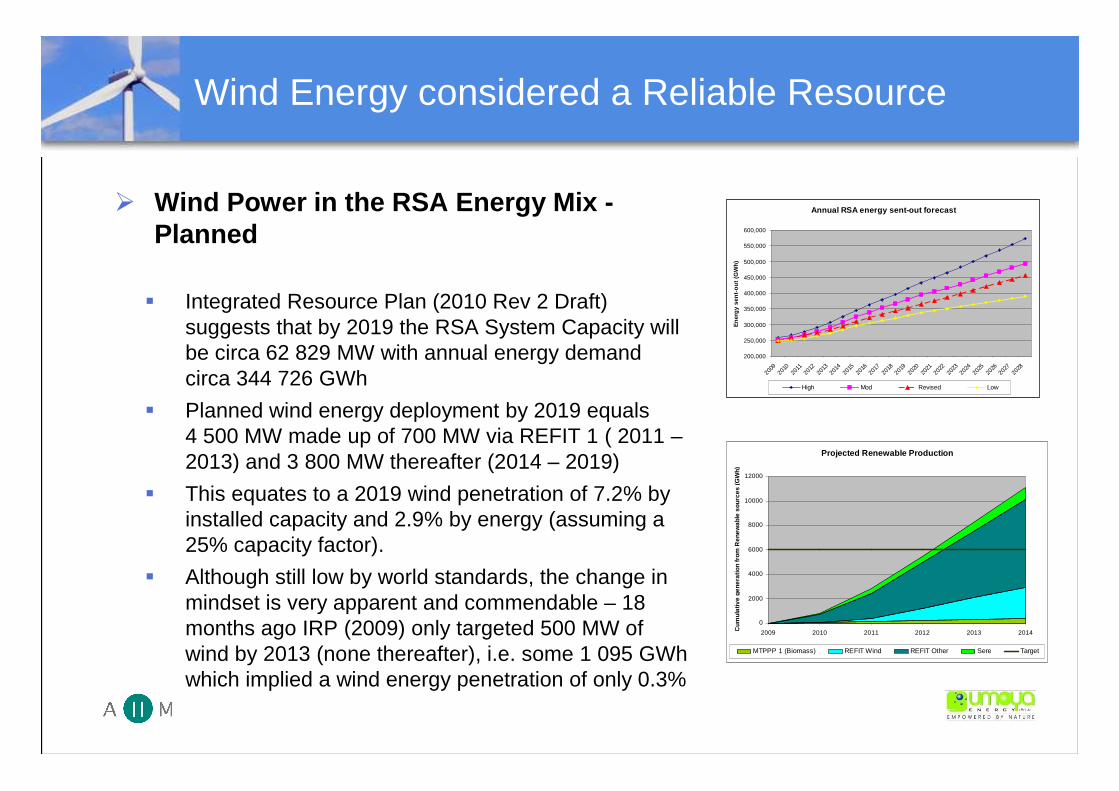
� Wind Power in the RSA Energy Mix -Planned
� Integrated Resource Plan (2010 Rev 2 Draft) suggests that by 2019 the RSA System Capacity will be circa 62 829 MW with annual energy demand circa 344 726 GWh
� Planned wind energy deployment by 2019 equals 4 500 MW made up of 700 MW via REFIT 1 ( 2011 –2013) and 3 800 MW thereafter (2014 – 2019)
� This equates to a 2019 wind penetration of 7.2% by installed capacity and 2.9% by energy (assuming a 25% capacity factor).
� Although still low by world standards, the change in mindset is very apparent and commendable – 18 months ago IRP (2009) only targeted 500 MW of wind by 2013 (none thereafter), i.e. some 1 095 GWhwhich implied a wind energy penetration of only 0.3%
Projected Renewable Production
0
2000
4000
6000
8000
10000
12000
2009 2010 2011 2012 2013 2014Cum
ula
tive
gene
ratio
n fr
om R
enew
able
sou
rces
(GW
h)
MTPPP 1 (Biomass) REFIT Wind REFIT Other Sere Target
Annual RSA energy sent-out forecast
200,000
250,000
300,000
350,000
400,000
450,000
500,000
550,000
600,000
2009
2010
2011
2012
2013
2014
2015
2016
2017
2018
2019
2020
2021
2022
2023
2024
2025
2026
2027
2028
Ene
rgy
sent
-out
(G
Wh)
High Mod Revised Low
4 Conclusion
Hopefield Wind Farm – a Contributor to Supply Security
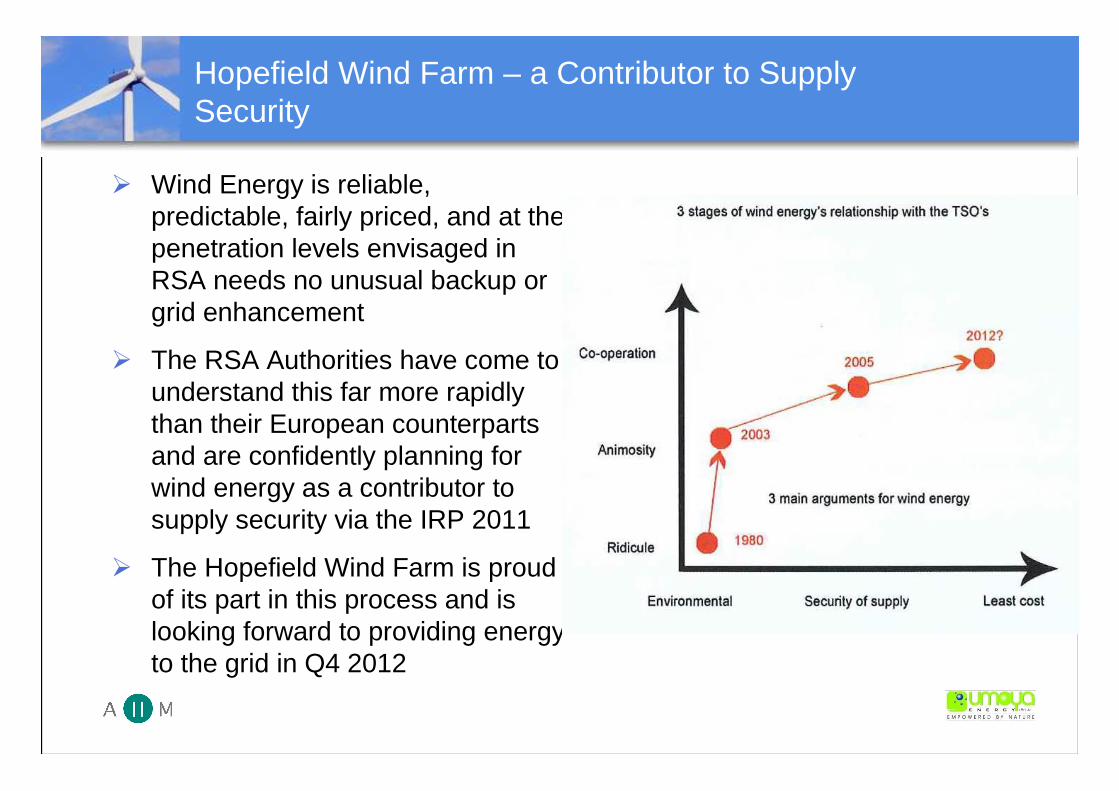
� Wind Energy is reliable, predictable, fairly priced, and at the penetration levels envisaged in RSA needs no unusual backup or grid enhancement
� The RSA Authorities have come to understand this far more rapidly than their European counterparts and are confidently planning for wind energy as a contributor to supply security via the IRP 2011
� The Hopefield Wind Farm is proud of its part in this process and is looking forward to providing energy to the grid in Q4 2012
5 Thank You


![[ODRCD503] Philip Clouts Quartet - UMOYA](https://static.fdocuments.in/doc/165x107/57906e311a28ab6874934e5d/odrcd503-philip-clouts-quartet-umoya.jpg)