Honeywell 2003 Annual Report
82
2003 ANNUAL REPORT WE ARE
Transcript of Honeywell 2003 Annual Report

2 0 0 3A N N U A L R E P O R T
WE ARE

BUILDINGThese materials contain certain statements that may be deemed “forward-looking statements” within the
meaning of Section 21E of the Securities Exchange Act of 1934. All statements, other than statements of
historical fact, that address activities, events or developments that we or our management intends, expects,
projects, believes, or anticipates will or may occur in the future are forward-looking statements. Such statements
are based upon certain assumptions and assessments made by our management in light of their experience
and their perception of historical trends, current conditions, expected future developments, and other factors
they believe to be appropriate. The forward-looking statements included in these materials are also subject to a
number of material risks and uncertainties, including but not limited to economic, competitive, governmental,
and technological factors affecting our operations, markets, products, services, and prices. Such forward-looking
statements are not guarantees of future performance, and actual results, developments, and business decisions
may differ from those envisaged by such forward-looking statements.
TABLE OF CONTENTSBuilding a World 1 Top-Performing Plants 10 Chairman’s Award for Everyday Heroes 11 Letter to Shareowners 12 Aerospace 20 Automation and Control Solutions 21 Specialty Materials 22 Transportation Systems 23 Honeywell Hometown Solutions 24 Financial Information 25 Senior Management Team and Leadership Team 77 Board of Directors 78 Shareowner Information 79

A WORLD
(Dollars and Shares in Millions, Except Per Share Amounts) 2003 2002 2001
Sales · · · · · · · · · · · · · · · · · · · · · · · · · · · · · · · · · · · · · · · · · · · $ 23,103 $ 22,274 $ 23,652
Net Income (Loss)1· · · · · · · · · · · · · · · · · · · · · · · · · · · · · · · · $ 1,324 $ (220) $ (99)
Diluted Earnings (Loss) Per Common Share· · · · · · · · · · · $ 1.54 $ (0.27) $ (0.12)
Cash Dividends Per Common Share · · · · · · · · · · · · · · · · · $ 0.75 $ 0.75 $ 0.75
Book Value Per Common Share · · · · · · · · · · · · · · · · · · · · · $ 12.45 $ 10.45 $ 11.25
Total Assets · · · · · · · · · · · · · · · · · · · · · · · · · · · · · · · · · · · · · $ 29,344 $ 27,565 $ 24,226
Cash Flows from Operating Activities · · · · · · · · · · · · · · · · $ 2,199 $ 2,380 $ 1,996
Common Shares Outstanding at Year-end · · · · · · · · · · · · 862 854 815
Employees at Year-end · · · · · · · · · · · · · · · · · · · · · · · · · · · · 108,000 108,000 115,000
1 In 2003, includes the cumulative after-tax charge of $20 million, or $0.02 per share, for the adoption of SFAS No. 143.In 2003, also includes net repositioning, environmental and other charges, gains on sales of non-strategic businessesand a gain related to the settlement of a patent infringement lawsuit resulting in a net after-tax charge of $22 million,or $0.03 per share. In 2002, includes net repositioning, litigation, business impairment, and other charges and gainson sales of non-strategic businesses resulting in a net after-tax charge of $1,864 million, or $2.27 per share. In 2001,includes net repositioning, litigation, business impairment, and other charges resulting in a net after-tax charge of $1,771 million, or $2.18 per share.
FINANCIAL HIGHLIGHTS
It’s a pretty basic formula. Elegant in its simplicity. Like everything else at
Honeywell, it starts with our customers and a singular focus on helping them
succeed. Then we add breakthrough technology that improves lives and makes
people safer, more secure, more comfortable, and more productive. The end
result is superior performance, a competitive edge for our customers, added
value for our shareowners, and great opportunities for Honeywell employees.
Customers + Technology = Performance. At Honeywell, it’s the way we work.
C U S TO M E R S+T E C H N O L O G Y=P E R F O R M A N C E
SALES BYBUSINESS SEGMENT*
(PERCENT)AEROSPACE 38%
AUTOMATION AND CONTROL SOLUTIONS 32%
SPECIALTY MATERIALS 14%
TRANSPORTATION AND POWER SYSTEMS 16%
AEROSPACE 38%
AUTOMATION AND
CONTROL SOLUTIONS 32%
SPECIALTY MATERIALS 14%
TRANSPORTATION SYSTEMS 16%
PROFIT BYBUSINESS SEGMENT*
(PERCENT)
AUTOMATION AND CONTROL SOLUTIONS 32%
SPECIALTY MATERIALS 5%
SPECIALTY MATERIALS 5%
TRANSPORTATION AND POWER SYSTEMS 17%
AEROSPACE 46%
AUTOMATION AND
CONTROL SOLUTIONS
32%
TRANSPORTATION SYSTEMS 17%
* Excludes Corporate sales of $7 million and general Corporate unallocated expenses of $142 million; see Note 23 to Financial Statements.

“Increased abduction of newborn babies worldwide promptedus to investigate additional security measures to
ensure patient safety. Fitting security bracelets to infants gives us the ability to trigger an alarm if a baby is
removed from the maternity floor.”
Allan Johns Director of Migration, Auckland District Health Board, Auckland City Hospital, Auckland, New Zealand
“Honeywell’s infant security system uses dynamic sensor technology to provide maximum value with minimum cost andgreater reliability for tailored solutions such as alarms andalerts via nurse call-announcer panels and paging, promptinghospital staff to respond quickly.”
Lee Ashton Project Engineer, Honeywell Automation and Control Solutions,Auckland, New Zealand
In every corner of our world, Honeywell
innovations improve the way we live. As
human safety is challenged by evolving
threats around the globe, people look to
us for cutting-edge technology solutions
to build a better world. When safety really
counts, customers count on Honeywell.
Parents will always worry about the
safety of their children, but they can
worry a little less with our help.
Honeywell’s Instant Alert™ service for
schools sends automated real-time
messages to the parent or guardian of
every child in the school, simultaneously,
informing them quickly of emergencies
and allowing them to react in a timely
manner. Our infant security system uses
radio-frequency identification technology
to help hospitals prevent newborns from
being taken from their maternity wards
or misidentified by hospital personnel.
Medications are safer and more
reliable, too, when pharmaceutical
manufacturers use Aclar® film blister
packs to protect pills from moisture,
tampering and to help patients follow
the appropriate dosage schedules. Sales
for blister packs were, well, blistering
in 2003 — up more than 14 percent.
Globalization means enterprises
are becoming more dispersed and people
are traveling more. Honeywell’s superior
avionics and flight management systems
make flying safer and more efficient for
2
Honeywell’s infant
security system uses
radio-frequency identifi-
cation technology to
sound an alarm if
someone tries to kidnap
a newborn from a hos-
pital maternity ward.
THAT’S

“Our wish and ultimate goal was a system that could offer a ‘one-stop’ solution to having a fully integrated network
designed and installed providing superior building services management and integration for the new high-tech millennium
building, the Sage Music Centre in Gateshead, United Kingdom.”
Martin McCrea Electrical Engineer, Building Services Engineers, Connell Mott McDonald, Belfast, Northern Ireland
“We designed and are installing a high-tech, integrated fire andsecurity system to provide our customer with a simple yetadvanced solution, which includes public address/voice alarm,access control, intruder detection, and CCTV for life safetythroughout the public and backstage areas of the Music Centre.”
Sivaji Boyapati Engineer, Honeywell Automation and Control Solutions, Pune, India
When the lights go out, Honeywell’s
Lumilux® phosphorescent pigments
illuminate emergency signage, guiding
people to safety in office, apartment,
government, and commercial buildings.
Lumilux® provided rescue lighting for
people trapped in the United Nations
building in New York City during a major
electrical failure in 2003.
Honeywell delivers peace of mind
for workers and residents of thousands
of factories, buildings, retail facilities,
schools, hospitals, and airport control
towers protected by our fire-detection
systems. Our laser-based smoke
detector, designed for early-warning
applications, and our enhanced fire
control systems integrate thousands
of individual smoke detectors, quickly
alerting people to potential fires.
pilots and passengers alike. Aviation
safety, where Honeywell has been a
technology leader for decades, is
reaching new heights with our Nitrogen
Generating System currently under
development. This system displaces
the oxygen in fuel tanks with nitrogen-
enriched air to reduce flammability.
Honeywell engineers are also
working on a next-generation auxiliary
power unit (APU) that will provide electri-
cal power for light aircraft. The new APU
will be significantly lighter than existing
models, more dependable because it has
fewer parts, and nearly maintenance-free
thanks to a gearless, oil-free design.
3
Integrated fire and
safety solutions from
Honeywell protect the
lives of millions of
people, including those
who attend events
at the Sage Music
Centre in Gateshead,
United Kingdom.
SAFER

“To respond to market demand, we had to find a quality sensorthat would meet our aggressive product development
needs and allow us to quickly expand C-Flex™ technologyacross our product platform. With a broader C-Flex™ product
offering, more patients may be able to breathe easierand sleep more comfortably.”
Jay Vreeland Global Product Manager, Sleep Therapy, Respironics Inc.,Murrysville, Pennsylvania, USA
“Meeting customer needs is our main priority, so we've spent time up front with Respironics to gather technical specifications and, using next-generation MEMS technology, we designed and optimized a low-cost, state-of-the-art, airflow sensor that met their needs for flow, pressure drop, and fast response time.”
Jamie Speldrich Senior Design Engineer, Honeywell Automation and Control Solutions,Freeport, Illinois, USA
MORE COMI
t is difficult to top Honeywell’s 12
decades of experience and our
place in more than 100 million homes
and buildings — we make the world
more comfortable.
In 2003, we celebrated the 50th
anniversary of the iconic Honeywell
Round™ thermostat, a masterpiece of
design and efficiency that earned us a
place in the Smithsonian Institution in
New York City. Honeywell marked the
anniversary of The Round® with the
introduction of the Digital Round™
thermostat, maintaining the recognizable
shape, twist-to-set selection, and accura-
cy that have distinguished The Round®
for 50 years. Today’s consumers demand
much more from their home comfort
controls than they did half a century ago,
and Honeywell technology is still the
benchmark. Our programmable thermo-
stats are easier to use and more efficient
than ever before. They offer zoning
controls, allowing different rooms to
be kept at different temperatures and
making sure that everyone in the home
stays comfortable, including the person
who pays the energy bills.
Breathing is more comfortable for
patients with the help of Honeywell’s
unwavering airflow sensor technology,
which makes an important difference for
patients with respiratory conditions such
as sleep apnea, who need specific volumes
of air to flow each time breathing ceases
during sleep. Patients experience a more
comfortable and effective method of
treatment, sleep more soundly, and
have a better chance to live normal,
healthy lives — something many of us
take for granted.
4
Sleep apnea patients
breathe easier thanks
to Honeywell airflow
sensors in Respironics’
C-Flex™ machine,
which monitors
breathing and reduces
airway pressure to
help people with
sleep disorders rest
comfortably.

“We are dedicated to providing the highest quality maintenance andmodifications that will allow our clients to remain comfortable and
productive in the business jet cabin. Honeywell has helped us upholdour goals by providing outstanding cabin management and enter-
tainment systems that ensure passenger satisfaction on every flightwhile providing our company with exceptional service and support.”
Rick Brainard Director, Avionics Sales, McKinney Aerospace, McKinney, Texas, USA
“Honeywell offers fully integrated Ovation™ cabin managementsystems that include all of the functionality required for seamlesstransition from the office to the sky, including high-speed data,multi-regional satellite TV, satellite, radio, passenger controlunits, and connectivity services.” Jeff Honeycutt Field Service Manager-Cabin Management Field Support, Honeywell Aerospace, Little Rock, Arkansas, USA
FORTABLEIndoor air quality is a growing
concern in many parts of the world and
Honeywell is a leader in addressing it.
Honeywell’s new consumer education
effort, in partnership with the American
Lung Association Health House®
program, focuses on the importance of
ensuring comfortable, high-quality air
inside a home. The program educates
consumers, homebuilders, and heating
contractors about devices that can zap
mold and bacteria in duct systems and
filter pollutants from indoor air. Our
indoor air quality products, including air
filtration and humidification systems, are
already the choice of many discerning
homebuilders and have earned premium
shelf space at major home improvement
retailers in North America.
Honeywell’s Environmental and
Combustion Controls business provides
residents of the Polat Tower, Europe’s
tallest all-residential building, located in
Istanbul, Turkey, with the latest integrated
building system. Our innovative technology
solutions combine comfort with safety
by integrating HVAC (heating, ventilation,
and air conditioning), card access,
lighting systems, burglar and fire alarms,
and CCTV (closed-circuit television). The
system provides residents maximum
comfort, lower energy costs, and enhanced
levels of security and fire safety.
When comfort is the objective,
no job is too big for Honeywell. Airports,
sports arenas, apartment buildings,
office complexes, and government
facilities on virtually every continent rely
on Honeywell technology to keep the
people who live, work, visit, and play
within their environs comfortable.
5
Business jet passengers
applaud Honeywell’s
Ovation™ cabin
management systems,
which provide travelers
with high-speed
communication tools,
intuitive cabin environ-
ment controls, and
in-flight entertainment
offerings.

“The U.S. Army requires specific projectile-stopping capabilitiesfor shield material and weight reduction for soldier equipment
items. Every ounce saved allows a soldier to tailor his/her load tomeet challenges in the environment and combat situation.”
James Q. Zheng, Ph.D. Physical Scientist, PM-Clothing & Individual Equipment,PEO-SOLDIER, U.S. Army Soldier Systems Center,
Natick, Massachusetts, USA
“Materials made from high modulus polyethylene (HMPE) fibers, such as Honeywell’s Spectra® HMPE fibers, stop high-velocity riflerounds at lower weights than most other commercially available materials, allowing breast-plate manufacturers to meet the U.S. military’s weight requirements, while reducing the weight of previousgeneration plates by 50 percent and offering more protection.”Ashok Bhatnagar, Ph.D. Principal Scientist-Spectra®, Honeywell Specialty Materials,Petersburg, Virginia, USA
Honeywell technologies play a
leading role in protecting people
and property around the world.
Honeywell security systems help
protect more than 200 airports world-
wide, from Warsaw, Poland, to Sydney,
Australia. Sales of these advanced
systems have shown significant growth
in the Middle East, where Honeywell was
awarded the Dubai International Airport
contract, among others, in 2003.
Our closed-circuit monitoring tech-
nology keeps an eye on the Itaipu Dam,
the world’s largest hydroelectric dam,
located between Brazil and Paraguay;
the U.S. Library of Congress; Marks &
Spencer department stores throughout
the United Kingdom; the U.S.-Mexican
border; French supermarket giants
Carrefour and Auchamp; the Mass
Transit Railway in Hong Kong; and
thousands of other critical installations
around the world. We strengthened our
leadership in the fast-growing surveil-
lance industry in 2003 by acquiring:
FutureSmart Systems, Inc.; TVS; Olympo;
and Silent Witness.
Honeywell’s expertise in access
control for public buildings combines an
array of technologies that include facial
recognition, fingerprint identification, and
cutting-edge video-based stress and lie
detection. Honeywell’s sensors detect
a broad range of security threats —
everything from physical intruders to
contamination by dangerous gases.
Honeywell Spectra® fiber is one of
the strongest and lightest fibers in the
world, making it ideal for all kinds of
security applications. Spectra® fiber is
used to make ballistic-resistant vests
for the military and law-enforcement
agencies, to reinforce aircraft cockpit
doors, and to create netting that protects
6
Pound for pound, 10
times stronger than
steel, yet light enough
to float, Honeywell’s
bullet-resistant
Spectra® fiber provides
protection when it
really counts for
military forces and law-
enforcement officers.
MORE

“Our goal is to help customers take advantage of technologies so they fly more safely with greater capability and enhanced
reliability. We perform a range of safety-oriented retrofits, including terrain awareness and warning systems. With
Honeywell’s EGPWS (Enhanced Ground Proximity Warning System) and its proven track record of reliability and service, we are confident our customers are receiving the safest and
most reliable terrain warning system available today.”Larry Flynn President, Product Support, Gulfstream Aerospace Corporation,
Savannah, Georgia, USA
“We use the latest breakthrough technology for our patentedEGPWS to support terrain alert notices, so our customersalways have the most current terrain information. Currently, weare testing a new, more sophisticated system that will prevent airplanes from flying into structures, terrain, or no-fly zones.”
Don Bateman Chief Engineer and inventor of EGPWS, Honeywell Aerospace,Redmond, Washington, USA
aircrew awareness and reduce workload,
all in a smaller, lighter package. Based
on our patented EGPWS technology,
Honeywell is testing a new system that
will prevent aircraft from intentional flight
into structures, terrain, or any designated
no-fly zone.
We also are playing a crucial role
in the U.S. Department of Defense’s
effort to transform America’s military
forces. Honeywell is working on nine
projects for the Future Combat Systems
(FCS), including a network-based,
vehicle-readiness assessment and
logistics support system, an unattended
ground-sensor battlefield-intelligence
system, and a micro-UAV (unmanned air
vehicle) development program. Our
electrical power-generation system for
the Joint Strike Fighter won us an award
as Lockheed Martin’s cost-cutting
partner of the year in 2003.
ships at anchor. Pound for pound, 10
times stronger than steel, Spectra®
fiber also floats, providing strength and
durability for ship mooring lines while
reducing injuries and docking time.
Honeywell’s air traffic alert and col-
lision avoidance technology helps planes
steer clear of other aircraft in flight. Our
Runway Awareness and Advisory System
sets new standards for collision avoidance
on the ground. Honeywell’s Enhanced
Ground Proximity Warning System
(EGPWS) alerts pilots when they get too
close to natural features such as moun-
tains or man-made structures — helping
prevent one of the most common causes
of aircraft accidents, controlled flight into
terrain. Our integrated Aircraft
Environment Surveillance System brings
together weather, terrain, and traffic
avoidance technologies to enhance
7
SECURE
Honeywell’s Enhanced
Ground Proximity
Warning System is
already credited with
27 aircraft saves. Now,
we are testing ways to
prevent aircraft from
being flown intentionally
into buildings and
no-fly zones.

“The new dilution headbox, controlled with the ProFlow actuators from Honeywell, greatly increased the quality and
uniformity of our paper.”
Yves Julien Machine Number 7 Supervisor, Cascades Fine Paper, St-Jérome, Quebec, Canada
“As the paper market globalizes, the need to produce higher quality paper increases for paper mills to remain competitive. Honeywell’s process automation system’s monitor and control capabilities enabled Cascades Fine Paper to reduce variability in its process, improving the final quality of its paper.”
Kathy Hutson Marketing Director, Honeywell Automation and Control Solutions, Phoenix, Arizona, USA
AND MORE
wireless sensor networks, with a goal
of reducing industrial plant energy
consumption by 10 to 15 percent.
Honeywell’s extensive portfolio of
patented fluorocarbon products is help-
ing nations meet their commitments in
the 1987 Montreal Protocol agreement to
eliminate the use of substances that
deplete the ozone layer. Honeywell is a
global leader in the development and
manufacture of refrigerants, aerosols,
and foam-insulation-blowing agents
used to replace ozone-depleting CFCs
and HCFCs. While protecting the environ-
ment, they also improve the energy
efficiency of homes, appliances, and
commercial refrigeration systems.
It stands to reason that a company that
is celebrated for its own productivity
would help its customers boost
their efficiency, too. By using Lean
Manufacturing techniques, Design
for Six Sigma (DFSS) tools, and Design-
Measure-Analyze-Improve-Control
(DMAIC) methodologies, that is just
what we are doing at Honeywell.
Our award-winning Experion
PKS™ system has solutions to automate,
control, and monitor manufacturing
operations for refineries, factories,
and pharmaceutical plants, enhancing
production efficiency and reducing energy
costs using a network of wireless sen-
sors. Under a $10 million program with
the U.S. Department of Energy, we are
developing the industry standard for
8
On the factory floor and
in many other industrial
settings, Honeywell’s
award-winning Experion
PKS™ system uses
wireless sensors to
make remote monitor-
ing and integrated
process control easy
and efficient.
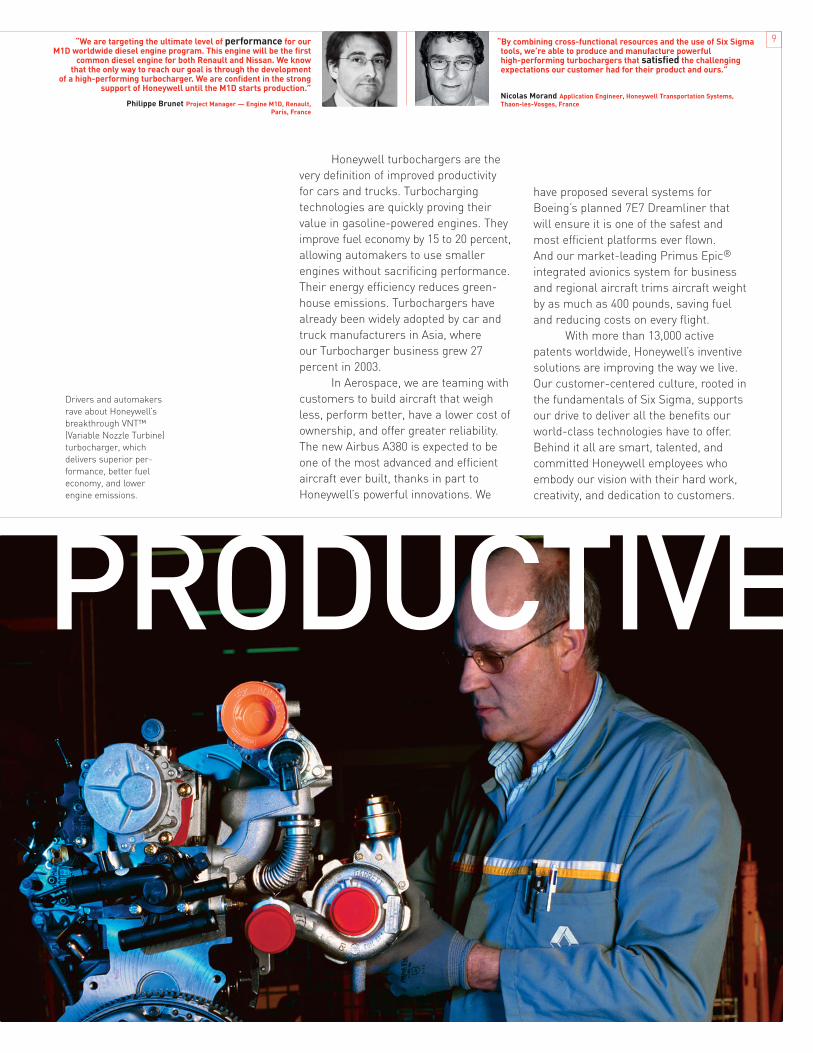
“We are targeting the ultimate level of performance for our M1D worldwide diesel engine program. This engine will be the first
common diesel engine for both Renault and Nissan. We know that the only way to reach our goal is through the development
of a high-performing turbocharger. We are confident in the strongsupport of Honeywell until the M1D starts production.”
Philippe Brunet Project Manager — Engine M1D, Renault, Paris, France
“By combining cross-functional resources and the use of Six Sigmatools, we’re able to produce and manufacture powerful high-performing turbochargers that satisfied the challenging expectations our customer had for their product and ours.”
Nicolas Morand Application Engineer, Honeywell Transportation Systems, Thaon-les-Vosges, France
PRODUCTIVE
Honeywell turbochargers are the
very definition of improved productivity
for cars and trucks. Turbocharging
technologies are quickly proving their
value in gasoline-powered engines. They
improve fuel economy by 15 to 20 percent,
allowing automakers to use smaller
engines without sacrificing performance.
Their energy efficiency reduces green-
house emissions. Turbochargers have
already been widely adopted by car and
truck manufacturers in Asia, where
our Turbocharger business grew 27
percent in 2003.
In Aerospace, we are teaming with
customers to build aircraft that weigh
less, perform better, have a lower cost of
ownership, and offer greater reliability.
The new Airbus A380 is expected to be
one of the most advanced and efficient
aircraft ever built, thanks in part to
Honeywell’s powerful innovations. We
have proposed several systems for
Boeing’s planned 7E7 Dreamliner that
will ensure it is one of the safest and
most efficient platforms ever flown.
And our market-leading Primus Epic®
integrated avionics system for business
and regional aircraft trims aircraft weight
by as much as 400 pounds, saving fuel
and reducing costs on every flight.
With more than 13,000 active
patents worldwide, Honeywell’s inventive
solutions are improving the way we live.
Our customer-centered culture, rooted in
the fundamentals of Six Sigma, supports
our drive to deliver all the benefits our
world-class technologies have to offer.
Behind it all are smart, talented, and
committed Honeywell employees who
embody our vision with their hard work,
creativity, and dedication to customers.
9
Drivers and automakers
rave about Honeywell’s
breakthrough VNT™
(Variable Nozzle Turbine)
turbocharger, which
delivers superior per-
formance, better fuel
economy, and lower
engine emissions.

WE ARE
OUR INITIATIVES:
Honeywell’s unwavering commit-
ment to our customers includes an
intense focus on the measurement
of product quality and delivery. This
commitment underscores the importance
of our Operations and Manufacturing
organizations throughout the world
to deliver superb customer service. The
Operations function is the backbone of
customer service for the company and
the place where the first pillar of our
Growth Initiative — doing a superb job for
our customers each and every day in
quality, delivery, value, and technology —
must be executed consistently.
HONEYWELL’S 2003 TOP 10 SITES FOR DELIVERY
LAWRENCE, KANSAS, USA Aerospace
ANNISTON, ALABAMA, USA Aerospace
CLEMSON, SOUTH CAROLINA, USA Specialty Materials
SHANGHAI, CHINA Specialty Materials
CLEARFIELD, UTAH, USA Transportation Systems
ARNPRIOR, ONTARIO, CANADA Specialty Materials
ANSAN, KOREA Transportation Systems
ANDERSON, SOUTH CAROLINA, USA Specialty Materials
FOMBELL, PENNSYLVANIA, USA Specialty Materials
GREENVILLE, OHIO, USA Transportation Systems
HONEYWELL’S 2003 TOP 10 SITES FOR QUALITY
MEXICO CITY, MEXICO Transportation Systems
ANNISTON, ALABAMA, USA Aerospace
SIPROEL, BRAZIL Automation and Control Solutions
FREEPORT 1, ILLINOIS, USA Automation and Control Solutions
FOSTORIA, OHIO/SPARTANBURG, SOUTH CAROLINA, USA Transportation Systems
ALSIP, ILLINOIS, USA Transportation Systems
KITEC, JAPAN Specialty Materials
GREENVILLE, OHIO, USA Transportation Systems
PLYMOUTH, MINNESOTA, USA Aerospace
TORRANCE, CALIFORNIA, USA Transportation Systems
OPERATIONS AND MANUFACTURING QUALITY AND DELIVERY AWARDS
10

HONEYWELL
GROWTH • PRODUCTIVITY • CASH • PEOPLE • ENABLERS: DIGITALWORKS AND SIX SIGMA
In 2003, we introduced a weekly
award — the Chairman’s Award for Everyday
Heroes — to reward employees who have
contributed to our Growth Initiative and,
specifically, to the first pillar of Growth:
doing a superb job for our customers each
and every day in quality, delivery, value, and
technology. The award emphasizes our
commitment to valuing contributions at all
levels of the organization.
2003 WINNERS
ALISTAIR BARKERAerospaceFleet, Hants, United Kingdom
PAUL BELDAMTransportation SystemsTorrance, California, USA
BILLY BLACKWELLAutomation and Control SolutionsOak Creek, Wisconsin, USA
MARY BOGDANSpecialty MaterialsBuffalo, New York, USA
MIKE BRIGGSAerospaceMinneapolis, Minnesota, USA
BECKY CARPENTERSpecialty MaterialsNewnan, Georgia, USA
BARBARA COSTAINSpecialty MaterialsColonial Heights, Virginia, USA
SID DHARNIAutomation and Control SolutionsGolden Valley, Minnesota, USA
GLORIA FANTransportation SystemsShanghai, China
GIORGIO FIGURATransportation SystemsThaon-Les-Vosges, France
STEFANO FORMISTransportation SystemsSkelmersdale, United Kingdom
FRANK GENNACOTransportation SystemsTorrance, California, USA
LEN HOMSpecialty MaterialsSunnyvale, California, USA
CARL JOHNSONAerospacePhoenix, Arizona, USA
MARY JOHNSONGlobal Business ServicesFarmington Hills, Michigan, USA
DAVE LYONSTransportation SystemsFostoria, Ohio, USA
CHRIS MATHEISAerospaceSouth Bend, Indiana, USA
SHANE MEENANAutomation and Control SolutionsChalfont, Pennsylvania, USA
DEANNA NEWBERRYTransportation SystemsRogers, Arkansas, USA
GARY OSTERFELDTransportation SystemsGreenville, Ohio, USA
JOHN RAJCHERTAutomation and Control SolutionsNorth Ryde, Australia
MARK RODERIQUEAerospaceAlexandria, Australia
SALEH SAADEHAutomation and Control SolutionsAbu Dhabi, United Arab Emirates
JON SCHRYVERAerospaceTorrance, California, USA
JOHN VACENDAKAutomation and Control SolutionsMunster, Indiana, USA
FRANCOIS VIGNÉAutomation and Control SolutionsVitrolles, France
RAYMUNDO WAYTransportation SystemsMexicali, Mexico
ZHANG YUAN JUNAutomation and Control SolutionsShanghai, China
CHAIRMAN’S AWARD FOR EVERYDAY HEROES
11

What a difference a year makes!
In last year’s letter, the comments
focused on bringing stability, establishing
credibility, and developing direction after
several years of turmoil and doing it all
during the tough economic times we
predicted (accurately unfortunately) for
2003. This year we can talk about the
significant progress achieved in all areas,
a resurgent organization, the stock price
up 39 percent in the year, and a much
more positive economic outlook for 2004.
Sales were up 3.7 percent to $23.1
billion largely resulting from the effects
of foreign exchange and acquisitions.
Volume was actually down slightly
reflecting the difficulties in our end
markets. Earnings per share were $1.54
consistent with our earnings guidance.
Included in these results is an increase in
non-cash pension expenses of $0.32 per
share. Most importantly, 2003 was the
first year in the last five to be free of any
large uncovered charges to income. Cash
flow from operations reached $2.2 billion
resulting, after capital expenditures,
in $1.5 billion in free cash flow … a
117 percent conversion rate on net
income. This included contributing
$670 million in cash to our U.S. pension
fund. After the puts and takes for
acquisitions, divestitures, and dividends
the result was an increase of $929 mil-
lion in our cash balance to $3.0 billion at
year-end. This further strengthened an
already excellent balance sheet resulting
in a 17 percent debt to capital ratio,
defined as net debt (short-term plus long-
term debt minus cash) divided by net
capital (shareowners’ equity plus net debt).
We are in very good shape financially.
Pension accounting on the other
hand is our bookkeeping irritant. While
bearing absolutely no resemblance to
cash needs, the esoteric and arcane
calculations are reflected in earnings in
ways surprisingly different between com-
panies. Our accounting practice provides
TO OUR SHAREOWNERS
12
much more aggressive book recognition
of market gains and losses versus our
peers. In effect, while the impact over a
long period is the same, in a short period
of time our approach causes much more
significant swings in earnings both up
and down. Nice after a few good market
years, painful today when 3 of the last 4
years were down. The net result is that
despite outperforming benchmarks
throughout the downturn and being
nearly fully funded with the $1.5 billion
contributed in the last 13 months, plus
the 23 percent investment return
in 2003, we book significant accounting
losses for pension expense versus our
peers. This trend will continue in 2004
with an additional negative EPS impact of
approximately 25 cents. While frustrating
to see, it’s also important for all of us
to recognize that none of the negative
earnings impact is related to cash and
as market returns improve and interest
rates rise the impact of this non-cash
expense will decline.
As we embark on a new year, I’m
very encouraged about prospects for
Honeywell. We have positioned ourselves
well during these last two years to bene-
fit from the nascent economic recovery.
Our pension funding issues are behind
us, our asbestos exposure is contained,
our businesses are launching new prod-
ucts and services, the business portfolio
continues to take shape with 8 acquisi-
tions ($500 million in revenue) and 4
divestitures ($445 million in revenue), and
the focus on our Five Initiatives is working.
13
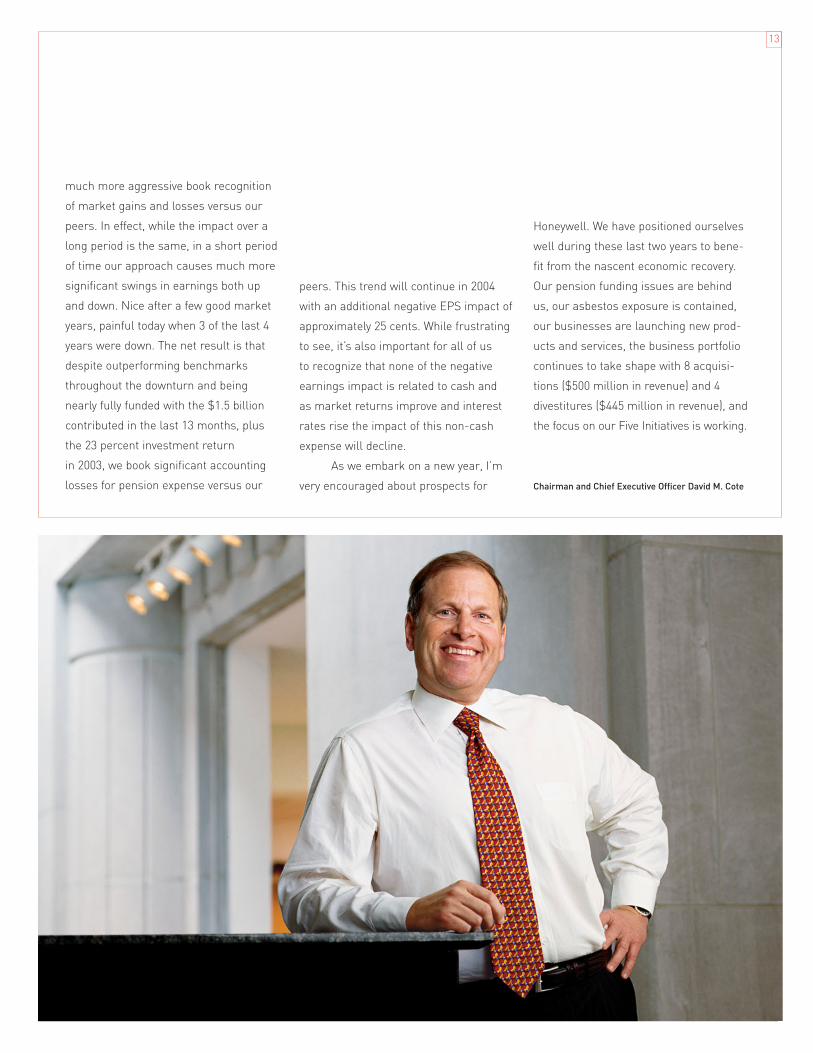
Chairman and Chief Executive Officer David M. Cote

FIVE INITIATIVES
Our focus on Growth, Productivity,
Cash, People, and the Enablers
(DigitalWorks and Six Sigma) continues
to provide direction for the company.
It’s great to see the progress in each.
PRODUCTIVITY
This continues to be both a focal
point and an area of expertise and
performance. Some maintain productivity
and growth are incompatible. We maintain
they are interdependent … as we grow we
become more productive, and as we
become more productive we grow. Good
business always requires being able to
accomplish two seemingly contradictory
goals simultaneously … low inventories
and good customer delivery, market
share and margins, empowerment and
controls, and of course growth and pro-
ductivity. In addition to continually driving
cost efficiency we will fund it with new
ideas. DigitalWorks achieved the $500
million annual savings goal a year earlier
than expected and will continue to grow.
We also launched a reinvigorated drive
on our $3.5 billion of indirect costs. An
area mined in the past of course but
one where we feel there is still real
opportunity for more consolidated buys.
CASH
While productivity provides the
income freedom to grow, cash pro-
vides the flexibility. The daily cash mind-
set is working and it shows in our cash
generation. The working capital
push is working well. As we reduce
order-to-delivery cycle times,
inventories are coming down while
delivery improves. Even with our
accomplishments we estimate there is
another $2 billion available to us in
improved working capital performance.
Generating cash is the first obliga-
tion of course. But just as important once
you have it is what to do with that
growing cash balance. A nice problem to
have … but an issue nonetheless. Our
first priority will always be investing in
our businesses. Even with that we antici-
pate continued strong generation of cash.
The money is not burning a hole in our
pocket. Few companies have been burned
by having cash. That being said, it’s
important to consider potential usage and
that leaves three alternatives … dividends,
stock buyback, and acquisitions. Our divi-
dend yield is approximately 2.0 percent
and at a reasonable level. We announced
a stock buyback program in December to
offset shares issued to employee plans
and hold share count relatively constant.
That still leaves lots of cash and the
idea of acquisitions.
14
The Honeywell brandcarries value and credibility around the world, and our products, services, and technologies travel well.

Building our businessesthrough steady, focusedorganic growth comple-mented by well-targetedacquisitions is a terrificpath for us to add valuefor our shareowners.
We’ll be the first to admit acquisi-
tions in general have a checkered past
and that includes us. No management
team ever goes into an acquisition
planning to blow money or integrate the
new company poorly … but it happens.
To improve our success rate we analyzed
our history in ten years of acquisitions
and distilled the learnings into a robust
disciplined process for identifying,
valuing, analyzing, and integrating acqui-
sitions. Results on businesses acquired
using this new process (about 18 months)
have been excellent. Invensys Sensor
Systems, BASF Carpet Fibers, Sensotec,
Gamewell, Baker Electronics, Ultrak …
all are generating accretive returns in
excess of acquisition estimates. The new
process works and is vigorously followed.
We recognize acquisitions can be high risk
and work hard to absolutely minimize the
odds of anything going awry. Building our
businesses through steady, focused
organic growth complemented by well-
targeted acquisitions is a terrific path for
us to add value for our shareowners.
PEOPLE
The ultimate differentiator in perform-
ance. People make all the difference.
We continue to focus on having the best
and rewarding them commensurately.
The Honeywell Behaviors focus on
results of course but just as importantly
on how people go about achieving them.
The Behaviors are taking root through
our CIS (Continuous Improvement
Summary) and MRR (Management
Resource Review) processes. When it
comes to having the best people that
starts at the top. With the addition of
Dave Anderson as our Chief Financial
Officer and Roger Fradin as the President
and CEO of Automation and Control
Solutions, we have a very strong manage-
ment team. We also added two very
strong directors with Lord Clive Hollick
(CEO-United Business Media) and
General Ric Shinseki (retired U.S. Army
Chief of Staff).
Reinforcing our commitment to
employees, we improved our safety and
environmental record again this year.
To push ourselves even further we are
striving for external safety certification
such as OSHA’s VPP STAR in all our
plants. Even with improvements, there
are regrets, accidents that could have
been prevented, and this keeps us
resolute in our commitment to safety.
To build greater esprit de corps, we
are establishing and invigorating employee
clubs around the world and uniting them
through Honeywell Hometown Solutions
(HHS). Through HHS we have also
concentrated our giving in three areas …
child and family safety; housing and
shelter; and science and math education.
Our signature partnerships with the
15

the most improvement. There is lots of
opportunity here given the strength of our
industries, our business positions, and
our balance sheet. Each business has
created a growth process to generate,
select, and nurture ideas. The results are
evident in the new products/services dis-
cussed in each of the Business Profiles.
We continue to focus on the four
pillars of growth … (1) doing a great job
for our customers every day in quality,
delivery, value, and technology, (2) Sales
and Marketing excellence, (3) globaliza-
tion, and (4) robust funded technology
roadmaps supported by DFSS.
While our customer focus has
clearly intensified we also clearly have
further to go. To reinforce the importance
of quality and delivery we measure it
monthly by manufacturing plant and
service location with awards and recogni-
tion for superior performance and
improvement letters from me to the
laggards. It has had a noticeable positive
effect on our performance for customers.
We also initiated a weekly Chairman’s
Award for Everyday Heroes which
recognizes superior employee perform-
ance at all levels in the organization in
support of the customer. We’re very
proud of the performance of these plants
and people all listed on pages 10 and 11.
The prospects forHoneywell are wonderful.In the past two years we have tackled our big issues head-on andworked hard in our businesses using our Five Initiatives to prepareourselves for recovery in our end markets.
National Center for Missing and Exploited
Children, Rebuilding Together, and
NASA are creating momentum and
making a difference in these important
areas. It’s a great way to build community
spirit and impact.
ENABLERS
DigitalWorks continues to deliver
savings and the Systems upgrade
projects in both Aerospace and ACS are
making good progress. Both businesses
have assigned full-time general managers
to ensure that effective process change
is the root of all the new systems. We
anticipate that in addition to productivity
benefits this effort will also generate
greater employee satisfaction as we
provide employees with better tools to
do their jobs.
Six Sigma training is largely com-
plete. Now the tough part … internalizing
it into how we work every day so it never
becomes “How do I get my job done
and Six Sigma too?” DFSS (Design
for Six Sigma) has taken root in all
our Engineering functions. And Lean
used in conjunction with Six Sigma is
the perfect combination as we improve
all our processes and reduce cycle
time. We continue to make great
progress and have terrific upside with
Lean and Six Sigma.
GROWTH
This initiative has been the source of
our greatest concern because it’s the
one in which we’ve had the least experi-
ence. It is also the area we are showing
16

Sales and Marketing excellence
gets a real boost this year with the intro-
duction of a Marketing curriculum for
leaders and development of a plan in
each business to introduce and develop
Marketing as a function. Commercial
excellence is a real opportunity for
us given we haven’t focused on it histori-
cally. By aggregating these functions
(functionalization) in each business,
we’ve been able to add critical mass
and drive functional excellence. Our
foundation for Marketing analysis will
always be grounded in developing a
terrific understanding of our customers
and our competition.
Globalization efforts made strides
as we added significantly to our presence
in emerging markets like India and
China and started a European Union
Government Relations office. The
Honeywell brand carries value and credi-
bility around the world and our products,
services, and technologies travel well.
Technology roadmaps and accom-
plishments by our Engineering teams
are getting truly exciting. While the new
products and services being introduced
and planned are impressive, equally
impressive is the work they have initiated
on VPD (Velocity Product Development)
to speed development times. Using
high-caliber customer information and
insights from our Marketing organization,
our technology teams are committed
to using Lean and Six Sigma tools to
eliminate development time white space,
reduce bottlenecks, and run activities
concurrently rather than sequentially
wherever possible. For a technology
focused company like ours, the impact
from this VPD effort along with great
marketing input at the beginning of the
process can be big.
SUMMARY
The prospects for Honeywell are
wonderful. In the past two years we
have tackled our big issues head-on and
worked hard in our businesses using our
Five Initiatives to prepare ourselves for
recovery in our end markets. We have
great positions in very good industries.
Technologies that differentiate. Social
and regulatory trends supportive of
our businesses. A superb balance
sheet. And increasingly a dynamic growth
and customer focus throughout our
company. This could not be a better
time for Honeywell.
It was true last year and it’s
even more true today when I say …
I’m excited about the future.
David M. CoteChairman and Chief Executive Officer
17
We have great positionsin very good industries.Technologies that differentiate. Social and regulatory trendssupportive of our businesses. A superb balance sheet. Andincreasingly a dynamicgrowth and customerfocus throughout our company.

AUTOMATION ANDCONTROL SOLUTIONS
AEROSPACE
Honeywell’s PrimusEpic® integratedavionics system for business andregional aircraft is a market and technology leader,reducing weightwhile improvingoverall reliabilityand ease of use.
To protect the irreplaceable arttreasures in theWinter Palace, curators at Russia’sState HermitageMuseum in St.Petersburg chose a fire-protection system they knewthey could trust —from Honeywell.

TRANSPORTATIONSYSTEMS
SPECIALTY MATERIALS
Honeywell’sEnovate® 3000 blowing agent givesour customers an effective andozone-friendly insulator for all kinds of applications— from commercialbuildings to homeappliances.
Our engine-boostingturbocharger brings power, fuel-efficiency, andtorque together to create a smallengine that performs like a big one for a stylishnew Europeansports car — theSmart Roadster.

AEROSPACEH
oneywell is a leading global supplier
of aircraft components, engines,
avionics, and related products and servic-
es for commercial airlines, business and
regional aircraft, manned and unmanned
military aircraft, and spacecraft. In
2003, we continued to secure major
new product and service contracts in
both the commercial aviation and the
defense and space sectors despite a
volatile economic environment.
One of Honeywell’s unique
strengths is that we sell total life-cycle
solutions that include product upgrades,
retrofits, and repairs. Because of the
tough economic conditions currently
challenging our commercial customers,
they depend on our repair and overhaul
services. These services help us
strengthen customer relationships
and bring us closer to our customer’s
customer in the process.
Among last year’s highlights was
the introduction of our new HTF7000
(formerly called AS907) turbofan engine
for transcontinental business aircraft,
which is designed to offer operators a
30-percent reduction in cost of ownership.
New wins on the Airbus A380
as well as development and production
contracts on leading-edge defense
programs are driving future growth. For
the A380, we won contracts for 10
systems, doubling our dollar content
to more than $2 million per aircraft.
We also are pursuing various new
opportunities with Boeing.
Our Primus Epic® integrated
avionics suite significantly improves
reliability, operating cost, and weight by
greatly reducing the number of separate
avionics boxes along with the connectors
and wiring bundles needed to tie them
together. Its large-format liquid crystal
displays and intuitive graphics enhance
20
safety by improving the pilot’s awareness
of the aircraft’s position and surroundings.
Honeywell has had outstanding
success with its next-generation
Micro-Electromechanical Systems
(MEMS) technology. MEMS are the
foundation of low-cost, smart-weapons
guidance and navigation solutions, and
they form the core of sophisticated
sensor systems that detect very small
amounts of a harmful or dangerous gas
or the first hint of a security threat. By
enabling the creation of miniature sen-
sors, MEMS technology offers futuristic
solutions with lower costs and greater
reliability for Honeywell customers.
Innovation is also the hallmark of
our Aircraft Landing Systems business.
We are the only aircraft wheel and brake
manufacturer that has an electric brake
system in operational use. Electric
brakes provide an alternative to hydraulic
brake systems and offer the potential for
improved safety and reliability.
Honeywell’s powerful,
efficient turbine aircraft
engines — like those
that power Chinook
helicopters — deliver
peak performance
and reliability for
our customers, while
reducing the cost
of ownership.

train. The unique automated subway is
an economical solution that reduces both
operating costs and energy consumption.
Innovation is first nature to us, the
foundation of our passion to find better
ways to get results for our customers.
Already a leading supplier of pressure
sensors to the auto industry, one of our
newest products is a cam-and-crank-
shaft sensor that reduces engine emis-
sions by signaling to the spark plug when
to ignite. Rugged sensors analyze manu-
facturing processes to determine when
maintenance should be performed on a
catalytic cracker in an oil refinery. Our
wireless sensor systems help firefighters
locate people in a burning building and
detect hazardous materials that could
put rescue efforts at risk.
Honeywell technology controls
and monitors production processes in
large industrial plants so customers can
improve safety and productivity, allowing
them to become more competitive. Winner
of the Technology and Business Vision
Award from Start magazine and
Microsoft®, and the Control EngineeringEditors’ 2003 Choice Award, Honeywell’s
Experion PKS™ system helps customers
track and analyze precisely the data
they need to best manage their plants.
The Experion PKS™ system will drive
growth in many industry segments,
including oil and gas, power generation,
pharmaceuticals, chemicals, and refining,
as well as pulp, paper, and printing.
Honeywell has taken communica-
tions technology to new levels by
introducing Instant Alert™, a new auto-
mated notification system that enables
schools to broadcast information to
parents and guardians. While the old-
fashioned phone-tree process could take
hours, our Web-based Instant Alert™
service enables schools to effectively and
accurately notify all parents via phone,
e-mail, or pager in a matter of minutes.
21
AUTOMATIONAND CONTROLSOLUTIONS
Honeywell makes homes, buildings,
industrial sites, and airport facilities
more efficient, safe, and comfortable. Our
high-performing products, solutions,
and services are well positioned in
promising growth areas such as sensors,
wireless technology, and real-time data
management. These features help our
customers improve productivity by
increasing output levels and improve
efficiency by reducing overall costs.
We are a global leader in the
growing application of sensors, a $40
billion segment. The development of
low-cost wireless sensor technology
gives customers access to data — on
energy management, in particular — that
previously, they could not retrieve and use.
In Nuremberg, Germany, where
one of the world’s first railways
started operating in 1835, Honeywell is
providing the technology that in 2004 will
enable operations of a fully automated,
driver-less subway with a high-frequency
transponder system. The technology is
based on modular sensors that commu-
nicate alerts via signals that move the
School days are less
stressful for parents
and guardians
thanks to Honeywell’s
automated Instant
Alert™ service, which
provides instant
communication in
an emergency.

SPECIALTYMATERIALS
combined revenue growth that exceeded
2002 by 50 percent.
The market for Spectra®, our light,
incredibly strong fiber best known for its
use in ballistic-resistant vests, expanded
into new applications in 2003. Spectra®
fiber is now used in protective gloves,
blast containment, netting, reinforced
cockpit doors, and deep-sea mooring,
and will expand to applications such as
high-pressure fuel hoses in 2004.
With 41 percent of its sales outside
the U.S., Aclar® film is making its mark
as a superior product for moisture-barrier
applications in the medical, pharmaceuti-
cal, military, and aerospace industries.
Resistant to pinholing and flex cracking,
Aclar® film is chemically stable and bio-
chemically inert. The chemical resistance
and low moisture vapor permeability of
these films provide the protection needed
for packaging of all types of corrosive-
sensitive military and electronic items.
Aclar® film is also nonflammable and
will not turn yellow or grow brittle
with age. In addition, we have introduced
new nylon food packaging resin that
uses nanotechnology to extend shelf
life for beer, soda, juices, and other
products. Marketed as Aegis™, this
innovative product eliminates the need
for bulky metal cans.
Honeywell Electronic Materials is
one of the five largest suppliers of materi-
als to the semiconductor industry. We
supply materials, such as DUO™ anti-
reflective coatings used in lithographic
patterning processes and other spin-on
offerings that produce the electrically
conductive and dielectric films used in
the manufacture of integrated circuits.
Our Research and Life Sciences
business has identified significant
opportunities for growth driven by biolog-
ics and DNA breakthroughs, and we are
developing alliances globally to provide us
with additional production capability and
to establish our branded products. The
portfolio includes high-purity solvents,
DNA reagents, active and intermediate
pharmaceutical ingredients, and
agricultural intermediates. We also
have a new applications development
facility in Shanghai, China, which will be
fully operational by mid-2004.
22
During the past year, Honeywell
focused its Specialty Materials busi-
ness on five growth platforms: Fluorines;
Advanced Fibers and Composites;
Barrier Films; Electronic Materials;
and Research and Life Sciences.
Honeywell’s years of research and
development of environmentally safer
fluorocarbon technology position us as a
leader in this fast-growing industry. One
of the highlights of 2003 was our capacity
expansion for HFC-125 (hydrofluorocar-
bon) at our production facility located in
Geismar, Louisiana. This product is the
core component for Genetron® HFC
blends used in refrigeration and air
conditioning applications, replacing
ozone-depleting HCFC-22.
The capacity expansion project
followed the 2002 introduction of our
Enovate® 3000 foam-blowing agent,
which quickly became a preferred
solution for appliance manufacturers
seeking high-efficiency insulation for
household and commercial refrigerators
and freezers. Driven by the global phase-
out of ozone-depleting HCFCs, Honeywell
sales of HFC replacements experienced
Pharmaceutical
companies choose
Honeywell’s Aclar®
film when they need
see-through blister
packaging that
protects their products
from moisture,
contamination, and
tampering.

As a leading automotive supplier,
Honeywell enhances vehicle perform-
ance, efficiency, and appearance through
state-of-the-art technologies, world-class
brands, and global solutions to our
customers’ needs.
Honeywell’s Turbocharger business
has grown at double-digit rates every year
for more than a decade as car and truck
manufacturers have sought fuel-efficient
technologies that meet stringent environ-
mental regulations without compromising
engine performance. Turbochargers allow
smaller engines to deliver the power and
performance of much larger engines while
consuming less fuel and lowering green-
house gas emissions. With the launch
of our most recent variable-geometry-
turbocharging technology, Honeywell
continues to help manufacturers meet
the challenges of engine downsizing,
emissions control, fuel efficiency,
performance, and drivability.
In 2003, the Turbocharger business
produced its millionth turbocharger in
China. As the Chinese economy grows and
the demand for turbocharged vehicles
grows with it, Honeywell’s position as
a technological leader will allow our
business to excel in this region.
In collaboration with
DaimlerChrysler, Honeywell developed
a unique technology to deliver high
performance in the small gasoline engine
of the Smart Roadster. Our compact
turbocharger design allows the engine to
operate at engine temperatures as high
as 1,050 degrees Celsius (1,922 degrees
Fahrenheit), and influences the respon-
siveness and durability of the overall
engine system. The result is a fuel-
efficient vehicle that delivers the perform-
ance and drivability of a sports car.
Honeywell’s best-selling and
segment-leading consumer automotive
products — FRAM®, Prestone®,
Autolite®, and Holts® — continue to
enjoy strong sales and number one
positions in key automotive categories.
Consumers are spending more time on
the appearance of their vehicles — a very
favorable trend for Honeywell. We are
TRANSPORTATIONSYSTEMS
23
addressing this trend by introducing new,
easy-to-use products such as Prestone®
Quik Fill™ antifreeze and Holts® appear-
ance products such as Simoniz® Saints
and Sinners™ range of washes and waxes.
In the filtration area, Fram® will introduce
a premium air filter, the Fram® AirHog™,
which caters to the high-performance
market in the first quarter of 2004.
Our Friction Materials business
continues to win new business and
perform well. Last year, the division was
chosen to supply the braking materials for
the number-one-selling pick-up truck in
the world; and, in Europe, it won significant
business with several premier automak-
ers. Introduced in early 2003, the Bendix®
ceramics line has been exceeding cus-
tomer expectations for its quiet, low-dust
performance, and will continue to expand
its offerings in this line. We continue to
position this business for growth in the
United States and abroad through its
well-known and well-regarded Bendix®
and Jurid® brands, and with aggressive
growth plans for its operations in China.
Honeywell’s new,
lifetime performance
Fram® AirHog™
brand air filter is
designed to maximize
airflow to the engine,
helping increase
horsepower and
acceleration.

HONEYWELL HOMETOWN SOLUTIONS
24
Community involvement is an essential
part of Honeywell’s legacy and a
critical part of our future.
Through Honeywell Hometown
Solutions, we focus our philanthropic and
volunteer resources on three issues of
vital importance to our community: Family
Safety and Security; Housing and Shelter;
and Science and Math Education.
Together with leading public and non-
profit institutions, we have developed
powerful programs to address these
needs in the communities we serve.
FAMILY SAFETY AND SECURITY
Teaching safety skills to our children
has never been more important.
Through our partnership with the
National Center for Missing & Exploited
Children, we have launched an abduc-
tion-prevention education program to
help empower children to keep them-
selves safer. In its first year, Got 2B Safe!
reached approximately 135,000 class-
rooms and more than 1.6 million
elementary school students in the
United States. Teachers have widely
praised Honeywell’s program, including
Todd Rowatt, a third-grade teacher at
Emerson Elementary School in Compton,
California, U.S.A. who states, “This is
a great program that ALL schools
should use. I have never seen anything
like this before.”
HOUSING AND SHELTER
With Rebuilding Together®, Honeywell
volunteers are revitalizing homes
in more than 25 communities to help
low-income homeowners — a group
that includes about 24 million elderly,
handicapped or single parents in the
United States alone — continue to live
in the warmth, safety, and independence
of their own homes.
SCIENCE AND MATH EDUCATION
To address the looming shortage of
scientists and engineers, we have
formed a partnership with the National
Aeronautics and Space Administration
(NASA) to deliver a dynamic science
education program to middle school
children, our next generation of explor-
ers. Named after Newton’s Second Law,
Force equals Mass times Acceleration,
FMA Live! energizes students’ interest
in science, math, and technology by
teaching them Newton’s Three Laws of
Motion and the Universal Law of Gravity,
a critical science curriculum objective
in all 50 states.
Our commitment also includes
community grants, support for higher
education and scientific research
around the world, diversity initiatives,
and our most important resource,
employee volunteerism.
Honeywell employees take an
active role in their communities. Our
Dollars for Doers program recognizes
these efforts through contributions to the
non-profit organizations they choose
after an employee has volunteered 50
hours in a 12-month period.
Focused programs, community
support, global perspectives, and
employee volunteers — these are the
fundamental ways in which Honeywell
Hometown Solutions continues our rich
history of corporate leadership.
Honeywell employees make a difference in our hometowns. Throughour national partnership with Rebuilding Together®, we are helpingimprove the quality of life for low-income homeowners.

25
Selected Financial Data 26 Management’s Discussion and Analysis 27 Consolidated Statement of Operations 45
Consolidated Balance Sheet 46 Consolidated Statement of Cash Flows 47 Consolidated Statement of Shareowners’ Equity 48
Notes to Financial Statements 49 Management’s Responsibility for Financial Statements 76 Report of Independent Auditors 76
FINANCIAL TABLE OF CONTENTS

26
SELECTED FINANCIAL DATA Honeywell International Inc.
Years Ended December 31,
(Dollars in Millions, Except Per Share Amounts) 2003 2002 2001 2000 1999 1998
RESULTS OF OPERATIONS
Net sales . . . . . . . . . . . . . . . . . . . . . . . . . . . . . . . . . . . $23,103 $22,274 $23,652 $25,023 $23,735 $23,555
Net income (loss) (1) . . . . . . . . . . . . . . . . . . . . . . . . . . . 1,324 (220) (99) 1,659 1,541 1,903
PER COMMON SHARE
Net earnings (loss):
Basic . . . . . . . . . . . . . . . . . . . . . . . . . . . . . . . . . . . 1.54 (0.27) (0.12) 2.07 1.95 2.38
Assuming dilution . . . . . . . . . . . . . . . . . . . . . . . . 1.54 (0.27) (0.12) 2.05 1.90 2.34
Dividends . . . . . . . . . . . . . . . . . . . . . . . . . . . . . . . . . . . 0.75 0.75 0.75 0.75 0.68 0.60
FINANCIAL POSITION AT YEAR-END
Property, plant and equipment—net . . . . . . . . . . . . . 4,295 4,055 4,933 5,230 5,630 5,600
Total assets . . . . . . . . . . . . . . . . . . . . . . . . . . . . . . . . . 29,344 27,565 24,226 25,175 23,527 22,738
Short-term debt . . . . . . . . . . . . . . . . . . . . . . . . . . . . . 199 370 539 1,682 2,609 2,190
Long-term debt . . . . . . . . . . . . . . . . . . . . . . . . . . . . . . 4,961 4,719 4,731 3,941 2,457 2,776
Total debt . . . . . . . . . . . . . . . . . . . . . . . . . . . . . . . . . . . 5,160 5,089 5,270 5,623 5,066 4,966
Shareowners’ equity . . . . . . . . . . . . . . . . . . . . . . . . . . 10,729 8,925 9,170 9,707 8,599 8,083
Note: Commencing January 1, 2002, we ceased amortization of goodwill and indefinite-lived intangible assets. See Note 13 of Notes to Financial Statements for
further details.
(1) In 2003, includes the cumulative after-tax charge of $20 million, or $0.02 per share, for the adoption of SFAS No. 143. In 2003, also includes net repositioning,
environmental and other charges, gains on sales of non-strategic businesses and a gain related to the settlement of a patent infringement lawsuit resulting in a net
after-tax charge of $22 million, or $0.03 per share. In 2002, includes net repositioning, litigation, business impairment and other charges and gains on sales of non-
strategic businesses resulting in a net after-tax charge of $1,864 million, or $2.27 per share. In 2001, includes net repositioning, litigation, business impairment and
other charges resulting in an after-tax charge of $1,771 million, or $2.18 per share. In 2000, includes net repositioning, litigation, business impairment and other
charges and a gain on the sale of the TCAS product line of Honeywell Inc. resulting in a net after-tax charge of $634 million, or $0.78 per share. In 1999, includes
merger, repositioning and other charges and gains on the sales of our Laminate Systems business and our investment in AMP Incorporated common stock resulting
in a net after-tax charge of $624 million, or $0.78 per share. In 1998, includes repositioning charges, a gain on settlement of litigation claims and a tax benefit
resulting from the favorable resolution of certain prior-year research and development tax claims resulting in a net after-tax charge of $4 million, with no impact on
the per share amount.

27
BUSINESS OVERVIEW
The Financial Section of Honeywell’s 2003 Annual Report con-
sists of Management’s Discussion and Analysis (MD&A) of
Honeywell’s critical accounting policies, results of operations,
financial position, liquidity and capital resources and legal
matters, as well as our Consolidated Financial Statements and
related notes thereto. This Business Overview provides a sum-
mary of Honeywell’s four reportable operating segments
(Aerospace, Automation and Control Solutions, Specialty
Materials and Transportation Systems), including how they
make money, the relevant economic and other factors impact-
ing their results, and business challenges and areas of focus in
both the short- and long-term. Each of these segments is
comprised of various business units and product classes that
serve multiple end markets. See Note 23 of Notes to Financial
Statements for further information on our reportable segments
and our definition of segment profit.
AEROSPACE
(Dollars in Millions) 2003 2002 2001
Net sales . . . . . . . . . . . . . . . . . . . . . . . $8,813 $8,855 $9,653
Segment profit . . . . . . . . . . . . . . . . . . $1,221 $1,308 $1,599
Segment profit % . . . . . . . . . . . . . . . . 13.9% 14.8% 16.6%
Aerospace is a leading global supplier of aircraft engines,
avionics, and related products and services for commercial
airlines, business and regional aircraft, manned and
unmanned military aircraft, and spacecraft. Our Aerospace
portfolio includes Engines, Systems and Services (auxiliary
power units; propulsion engines; environmental control sys-
tems; engine controls; repair and overhaul services; hardware;
logistics and power generation systems); Aerospace Electronic
Systems (flight safety communications, navigation, radar and
surveillance systems; aircraft and airport lighting; manage-
ment and technical services and advanced systems and
instruments); and Aircraft Landing Systems (aircraft wheels
and brakes). Aerospace sells its products to original equipment
(OE) manufacturers in the commercial air transport (Airbus
and Boeing) and business and regional (Bombardier, Dassault,
Embraer, and Gulfstream) aircraft segments, as well as spare
parts into the aftermarket (principally to aircraft operators).
The United States Government is also a major customer for our
space and defense products.
Economic and Other Factors
Aerospace’s operating results are principally driven by the
global demand for air travel as reflected in new aircraft orders,
as well as spare parts and maintenance and repair services for
aircraft currently in use. Aircraft orders by commercial air
transport OE manufacturers, business and regional jet deliver-
ies, as well as global flying hours and airline profitability are
the principal factors that drive our commercial aerospace
operating results. U.S. Government appropriations for defense
and space programs and military activity are critical factors
impacting our defense and space operating results.
Business Challenges/Areas of Focus
Aerospace’s primary business challenges and areas of
focus include:
• Continuing to grow the sales and profitability of the commer-
cial aerospace aftermarket as the worldwide airline industry
struggles to regain and maintain profitable operations.
• Securing Honeywell product content on new Airbus and
Boeing aircraft platforms.
• Expanding our knowledge management systems into crucial
new technologies, such as predictive monitoring and auto-
matic diagnosis of aircraft engines and utility systems,
further integration of in-flight and on-ground safety features
for aircraft and airports, and high-bandwidth wireless con-
nections from ground and satellite networks.
• Continuing to design equipment that enhances the safety,
performance and durability of aircraft, while reducing weight
and operating costs.
AUTOMATION AND CONTROL SOLUTIONS (ACS)
(Dollars in Millions) 2003 2002 2001
Net sales . . . . . . . . . . . . . . . . . . . . . . . $7,464 $6,978 $7,185
Segment profit . . . . . . . . . . . . . . . . . . $ 843 $ 860 $ 774
Segment profit % . . . . . . . . . . . . . . . . 11.3% 12.3% 10.8%
ACS provides innovative solutions that make homes, buildings,
industrial sites and airport facilities more efficient, safe and
comfortable. Our ACS portfolio includes Automation and
Control Products (controls for heating, cooling, indoor air qual-
ity, ventilation, humidification and home automation; advanced
software applications for home/building control and optimiza-
tion; sensors, switches, control systems and instruments for
MANAGEMENT’S DISCUSSION AND ANALYSIS Honeywell International Inc.

measuring pressure, air flow, temperature, electrical current
and, security and fire detection, access control and video sur-
veillance systems); Building Solutions (installs, maintains and
upgrades systems that keep buildings safe, comfortable and
productive); and Process Solutions (provides a full range of
automation and control solutions for industrial plants, offering
advanced software and automation systems that integrate,
control and monitor complex processes in many types of indus-
trial settings).
Economic and Other Factors
ACS’ operating results are principally driven by global residen-
tial and nonresidential construction, industrial production,
capital spending on process and building automation, and
security concerns and regulations.
Business Challenges/Areas of Focus
ACS’ primary business challenges and areas of focus include:
• Extending technology leadership: lowest total installed cost,
integrated solutions within our security, fire and sensors
product portfolios.
• Defending and extending our installed base through cus-
tomer productivity and globalization.
• Sustaining strong brand recognition.
• Investing in sales and marketing resources and capabilities.
SPECIALTY MATERIALS
(Dollars in Millions) 2003 2002 2001
Net sales . . . . . . . . . . . . . . . . . . . . . . . $3,169 $3,205 $3,313
Segment profit . . . . . . . . . . . . . . . . . . $ 136 $ 90 $ 56
Segment profit % . . . . . . . . . . . . . . . . 4.3% 2.8% 1.7%
Specialty Materials provides high-performance specialty mate-
rials for applications in the electronics, packaging, fibers,
refrigeration, wax and adhesives markets. Specialty Materials’
product portfolio includes fibers, specialty films, intermediate
chemicals, flourine-based products, pharmaceutical and agri-
cultural chemicals, specialty waxes, adhesives and sealants,
process technology, and wafer fabrication materials and serv-
ices. Core growth businesses include Fluorines, Electronic
Materials, Advanced Fibers and Composites, Specialty Films
and Research and Life Sciences.
Economic and Other Factors
Specialty Materials’ operating results are principally driven by
global gross domestic product, plant capacity utilization and
the costs of raw materials including natural gas and benzene.
Although we expect raw material costs to remain at historically
high levels in 2004, based on current volume usage, a 10 per-
cent increase in the year-end price of natural gas and benzene
would increase our costs by $12 and $15 million, respectively.
Business Challenges/Areas of Focus
Specialty Materials’ primary business challenges and areas of
focus include:
• Sharpening the focus on core growth platforms to drive new
product introduction and improved profitability.
• Continuing to restructure and exit non-core commodity lines
of business with minimal or no differentiating technology.
• Continuing to improve manufacturing productivity.
TRANSPORTATION SYSTEMS
(Dollars in Millions) 2003 2002 2001
Net sales . . . . . . . . . . . . . . . . . . . . . . . $3,650 $3,184 $3,457
Segment profit . . . . . . . . . . . . . . . . . . $ 461 $ 393 $ 307
Segment profit % . . . . . . . . . . . . . . . . 12.6% 12.3% 8.9%
Transportation Systems provides automotive products that
improve the performance, efficiency, and appearance of cars,
trucks, and other vehicles through state-of-the-art technolo-
gies, world class brands and global solutions to our customers
needs. Our Transportation Systems’ portfolio includes
Honeywell Turbo Technologies (Garrett® turbochargers and
charge-air and thermal systems); the Consumer Products
Group (car care products including anti-freeze (Prestone®),
filters (Fram®), spark plugs (Autolite®), and cleaners, waxes
and additives (Holts®); and Friction Materials (friction materi-
als and related brake system components (Bendix®).
Transportation Systems sells its products to OE automotive
and truck manufacturers (e.g., BMW, Caterpillar, Daimler-
Chrysler, Ford, Volkswagen), wholesalers and distributors and
through the retail aftermarket.
Economic and Other Factors
Transportation Systems’ operating results are principally
driven by worldwide automobile and truck production and the
global demand for automobiles and trucks equipped with tur-
bochargers to enhance power, increase engine efficiency and
lower emissions.
Business Challenges/Areas of Focus
Transportation Systems’ primary business challenges and
areas of focus include:
• Sustaining superior turbocharger technology.
• Increasing market penetration and share of diesel and gaso-
line turbocharger OEM demand.
• Continuing to strengthen established strong product brands
in the automotive industry including revitalizing our Friction
Materials business.
28

29
CRITICAL ACCOUNTING POLICIES
The preparation of our consolidated financial statements in
accordance with generally accepted accounting principles is
based on the selection and application of accounting policies
that require us to make significant estimates and assumptions
about the effect of matters that are inherently uncertain. We
consider the accounting policies discussed below to be critical
to the understanding of our financial statements. Actual
results could differ from our estimates and assumptions, and
any such differences could be material to our consolidated
financial statements.
We have discussed the selection, application and disclosure of
these critical accounting policies with the Audit Committee of
our Board of Directors and our Independent Auditors. We did
not initially adopt any accounting policies with a material
impact during 2003 other than those described in Note 1 of
Notes to Financial Statements.
Contingent Liabilities
We are subject to a number of lawsuits, investigations and
claims (some of which involve substantial dollar amounts) that
arise out of the conduct of our global business operations or
those of previously owned entities. These contingencies relate
to product liabilities, including asbestos, commercial transac-
tions, government contracts and environmental health and
safety matters. We recognize a liability for any contingency that
is probable of occurrence and reasonably estimable. We contin-
ually assess the likelihood of any adverse judgments or
outcomes to our contingencies, as well as potential ranges of
probable losses, and recognize a liability, if any, for these con-
tingencies based on a careful analysis of each matter with the
assistance of outside legal counsel and, if applicable, other
experts. Such analysis includes making judgments concerning
matters such as the costs associated with environmental mat-
ters, the outcome of negotiations, the number and cost of
pending and future asbestos claims (where possible) and the
impact of evidentiary requirements. Because most contingen-
cies are resolved over long periods of time, liabilities may
change in the future due to new developments or changes in
our settlement strategy. For a discussion of our contingencies
related to shareowners litigation, environmental and asbestos
matters, including management’s judgment applied in the
recognition and measurement of specific liabilities, see Notes
1 and 21 of Notes to Financial Statements.
Insurance for Asbestos Related Liabilities
In connection with recognition of liabilities for asbestos related
matters, we record asbestos related insurance recoveries that
are deemed probable. In assessing the probability of insurance
recovery, we make judgments concerning insurance coverage
that we believe are reasonable and consistent with our histori-
cal dealings with our insurers, our knowledge of any pertinent
solvency issues surrounding insurers and various judicial
determinations relevant to our insurance programs. We have
approximately $1.3 billion in insurance coverage remaining that
can be specifically allocated to North American Refractories
Company (NARCO) related asbestos liabilities. We also have
$1.9 billion in coverage remaining for Bendix related asbestos
liabilities although there are gaps in our coverage due to insur-
ance company insolvencies, a comprehensive policy buy-back
settlement with Equitas as discussed in Note 21 of Notes to
Financial Statements and certain uninsured periods, resulting
in approximately 50 percent of these claims being reimbursable
by insurance. Our insurance is with both the domestic insur-
ance market and the London excess market. While the
substantial majority of our insurance carriers are solvent,
some of our individual carriers are insolvent, which has been
considered in our analysis of probable recoveries. Some of our
insurance carriers have challenged our right to enter into
settlement agreements resolving all NARCO related asbestos
claims against Honeywell. However, we believe there is no
factual or legal basis for such challenges and that it is probable
that we will prevail in the resolution of, or in any litigation that
is brought regarding these disputes and have recognized
approximately $100 million in probable insurance recoveries
from these carriers. We are in advanced ongoing settlement
discussions with these carriers and while we cannot predict the
outcome of these discussions we expect that a substantial
majority of the carriers will participate in the settlement agree-
ment that is being negotiated. The amounts that we expect to
realize through the settlement process are consistent with our
recognized insurance recoveries. Projecting future events is
subject to various uncertainties that could cause the insurance
recovery on asbestos related liabilities to be higher or lower
than that projected and recorded. Given the inherent uncer-
tainty in making future projections, we reevaluate our
projections concerning our probable insurance recoveries in
light of any changes to the projected liability, our recovery
experience or other relevant factors that may impact future
insurance recoveries. See Note 21 of Notes to Financial
Statements for a discussion of management’s judgments
applied in the recognition and measurement of insurance
recoveries for asbestos related liabilities.
Defined Benefit Pension Plans
We maintain defined benefit pension plans covering a majority
of our employees and retirees. For financial reporting
purposes, net periodic pension expense (income) is calculated
based upon a number of actuarial assumptions including a
discount rate for plan obligations and an expected rate of
return on plan assets. We consider current market conditions,
including changes in investment returns and interest rates, in
making these assumptions. We determine the expected long-
term rate of return on plan assets utilizing historic plan asset
returns over varying long-term periods combined with current
market conditions and broad asset mix considerations (see

Note 22 of Notes to Financial Statements for actual and tar-
geted asset allocation percentages for our U.S. pension plans).
The expected rate of return on plan assets is a long-term
assumption and generally does not change annually. The dis-
count rate reflects the market rate for high-quality fixed
income debt instruments on our annual measurement date
(December 31) and is subject to change each year.
The key assumptions used in developing our 2003, 2002 and
2001 U.S. net periodic pension expense (income) included
the following:
2003 2002 2001
Discount rate for obligations . . . . . . . 6.75% 7.25 % 7.75 %
Assets:
Expected rate of return . . . . . . . . . 9% 10 % 10 %
Actual rate of return . . . . . . . . . . . . 23% (8)% (3)%
Actual 10 year average annual
compounded rate of return . . . . 10% 9 % 11 %
The reduction in the 2003 discount rate reflects the lower mar-
ket interest rate environment for high-quality fixed income debt
instruments. The expected rate of return on plan assets was
reduced from 10 to 9 percent for 2003 to reflect the impact of
the poor performance of the equity markets during the three
year period ended December 31, 2002. Net periodic pension
expense for our U.S. pension plans is expected to be $380
million in 2004, a $241 million increase from 2003, primarily
resulting from a reduction in the discount rate from 6.75 to 6.0
percent and the systematic recognition of unrecognized net
losses. The unrecognized net losses for our U.S. pension plans
were $3.2 billion at December 31, 2003, down from $3.5 billion
at December 31, 2002. These unrecognized losses mainly
result from actual plan asset returns below expected rates of
return during 2002, 2001 and 2000 and from lower discount
rates and are being systematically recognized in future net
periodic pension expense in accordance with Statement of
Financial Accounting Standards No. 87, “Employers Accounting
for Pensions” (SFAS No. 87). Under SFAS No. 87, we use the
market-related value of plan assets reflecting changes in the
fair value of plan assets over a three-year period. Further,
unrecognized losses in excess of 10 percent of the greater of
the market-related value of plan assets or the plans’ projected
benefit obligation are recognized over a six-year period.
Due to the poor performance of the equity markets during the
three-year period ended December 31, 2002, as well as the
declining interest rate environment over the past three years,
we made voluntary contributions of $670 and $830 million
($700 million in Honeywell common stock and $130 million in
cash) to our U.S. pension plans in 2003 and 2002, respectively.
Future plan contributions are dependent upon actual plan
asset returns and interest rates. Assuming that actual plan
returns are consistent with our expected plan return of 9 per-
cent in 2004 and beyond, and that interest rates remain
constant, we would not be required to make any contributions
to our U.S. pension plans for the foreseeable future.
Changes in net periodic pension expense may occur in the
future due to changes in our expected rate of return on plan
assets and discount rate resulting from economic events. The
following table highlights the sensitivity of our U.S. pension
obligations and expense to changes in these assumptions,
assuming all other assumptions remain constant:
Change in Impact on AnnualAssumption Pension Expense Impact on PBO
0.25 percent decrease
in discount rate Increase $50 million Increase $300 million
0.25 percent increase
in discount rate Decrease $50 million Decrease $300 million
0.25 percent decrease
in expected rate of
return on assets Increase $25 million —
0.25 percent increase
in expected rate of
return on assets Decrease $25 million —
SFAS No. 87 requires recognition of an additional minimum
pension liability if the fair value of plan assets is less than the
accumulated benefit obligation at the end of the plan year. In
2003, we recorded a non-cash adjustment to equity through
accumulated other nonowner changes of $369 million ($604
million on a pretax basis) to reduce the additional minimum
pension liability by $304 million and reinstate a portion of our
pension assets ($300 million) written off as a result of the prior
year’s minimum pension liability adjustment. The 2003 adjust-
ment resulted from an increase in our pension assets in 2003
due to the improvement in equity markets and our contribution
of $670 million to our U.S. plans. In 2002, due to the poor per-
formance of the equity markets which adversely affected our
pension assets and a decline in the discount rate, we recorded
a non-cash adjustment to equity through accumulated other
nonowner changes of $606 million ( $956 million on a pretax
basis) which increased the additional minimum pension liability.
Equity market returns and interest rates significantly impact
the funded status of our pension plans. Based on future plan
asset performance and interest rates, additional adjustments
to equity might be required.
Long-Lived Assets (including Tangible and Definite-Lived
Intangible Assets)
To conduct our global business operations and execute our
business strategy, we acquire tangible and intangible assets.
We periodically evaluate the recoverability of the carrying
amount of our long-lived assets (including property, plant and
equipment and definite-lived intangible assets) whenever
events or changes in circumstances indicate that the carrying
amount of a long-lived asset group may not be fully recover-
30

31
able. These events or changes in circumstances include busi-
ness plans and forecasts, economic or competitive positions
within an industry, as well as current operating performance
and anticipated future performance based on a business’ com-
petitive position. An impairment is assessed when the
undiscounted expected future cash flows derived from an asset
are less than its carrying amount. Impairment losses are
measured as the amount by which the carrying value of a long-
lived asset exceeds its fair value and are recognized in
earnings. We continually apply our best judgment when apply-
ing the impairment rules to determine the timing of the
impairment test, the undiscounted cash flows used to assess
impairment, and the fair value of an impaired long-lived asset
group. The dynamic economic environment in which each of
our businesses operate and the resulting assumptions used to
estimate future cash flows, such as economic growth rates,
industry growth rates, product life cycles, selling price changes
and cost inflation can significantly influence and impact the
outcome of all impairment tests. For a discussion of the result
of management’s judgment applied in the recognition and
measurement of impairment charges see the repositioning,
litigation, business impairment and other charges section of
this MD&A.
Income Taxes
The future tax benefit arising from net deductible temporary
differences and tax carryforwards was $1.8 and $2.3 billion at
December 31, 2003 and 2002, respectively. We believe that our
earnings during the periods when the temporary differences
become deductible will be sufficient to realize the related
future income tax benefits. For those jurisdictions where the
expiration date of tax carryforwards or the projected operating
results indicate that realization is not likely, a valuation
allowance is provided.
In assessing the need for a valuation allowance, we consider all
available positive and negative evidence, including past operat-
ing results, estimates of future taxable income and the
feasibility of ongoing tax planning strategies. Significant man-
agement judgment is required in determining the provision for
income taxes and, in particular, any valuation allowance
recorded against our deferred tax assets. Additionally, valua-
tion allowances related to deferred tax assets can be impacted
by changes to tax laws and future taxable income levels. In the
event we determine that we will not be able to realize our
deferred tax assets in the future, we will reduce such amounts
through a charge to income in the period that such determina-
tion is made. Conversely, if we determine that we will be able to
realize deferred tax assets in excess of the carrying amounts,
we will decrease the recorded valuation allowance through a
credit to income in the period that such determination is made.
Sales Recognition on Long-Term Contracts
In 2003, we recognized approximately 10 percent of our total
net sales using the percentage-of-completion method for long-
term contracts in our Automation and Control Solutions and
Aerospace reportable segments. The percentage-of-comple-
tion method requires us to make judgments in estimating
contract revenues, contract costs and progress toward comple-
tion. These judgments form the basis for our determinations
regarding overall contract value, contract profitability and tim-
ing of revenue recognition based on measured progress toward
contract completion. Revenue and cost estimates are moni-
tored on an ongoing basis and revised based on changes in
circumstances. Anticipated losses on long-term contracts are
recognized when such losses become evident. We maintain
financial controls over the customer qualification, contract
pricing and cost estimation processes to reduce the risk of
contract losses.
Aerospace Customer Incentives
Consistent with most suppliers to commercial aircraft manu-
facturers and airlines, we offer sales incentives to commercial
aircraft manufacturers and airlines in connection with their
selection of our products for installation on commercial air-
craft. These incentives may consist of free products, credits,
discounts or upfront cash payments. The cost of these incen-
tives is recognized in the period incurred unless the incentive is
subject to recovery through a long-term product maintenance
requirement mandated by the Federal Aviation Administration
for certified replacement equipment and service. Amounts
capitalized at December 31, 2003, 2002 and 2001 were $719,
$662, and $607 million, respectively, and are being recognized
over the estimated minimum service life of the aircraft (up to
25 years) as a reduction in future sales or an increase in cost of
goods sold based on the type of incentive granted. We routinely
evaluate the recoverability of capitalized amounts based on
forecasted replacement equipment sales over the estimated
minimum life of the aircraft considering estimated aircraft
flight hours, number of landings, as well as actual aircraft
retirements. For additional information see Notes 1 and 13 of
Notes to Financial Statements.
RESULTS OF OPERATIONS
Net Sales
(Dollars in Millions) 2003 2002 2001
Net sales . . . . . . . . . . . . . . . . . . . . $23,103 $22,274 $23,652
% change compared with
prior year . . . . . . . . . . . . . . . . . . 4% (6)% (5)%

The change in net sales in 2003 and 2002 is attributable to
the following:
2003 2002Versus Versus
2002 2001
Acquisitions . . . . . . . . . . . . . . . . . . . . . . . . . . . . 3 % — %
Divestitures . . . . . . . . . . . . . . . . . . . . . . . . . . . . . (2) (3)
Price . . . . . . . . . . . . . . . . . . . . . . . . . . . . . . . . . . — (2)
Volume . . . . . . . . . . . . . . . . . . . . . . . . . . . . . . . . — (2)
Foreign Exchange . . . . . . . . . . . . . . . . . . . . . . . . 3 1
4 % (6)%
A discussion of net sales by reportable segment can be found
in the Review of Business Segments section of this MD&A.
Cost of Goods Sold
(Dollars in Millions) 2003 2002 2001
Cost of Goods Sold . . . . . . . . . . . . . . $18,235 $17,615 $20,125
Gross Margin % . . . . . . . . . . . . . . . . . 21.1% 20.9% 14.9%
Gross margin increased in 2003 by 0.2 percentage points com-
pared with 2002. This increase resulted mainly from a $289
million reduction in repositioning and other charges partially
offset by higher pension expense and a decrease in sales of
higher-margin products and services, mainly in our Aerospace
and Automation and Control Solutions reportable segments.
Gross margin increased in 2002 by 6.0 percentage points com-
pared with 2001 due primarily to a $1,573 million reduction in
repositioning and other charges. See the repositioning, litiga-
tion, business impairment and other charges section of this
MD&A for further details. This increase in gross margin also
resulted from lower costs due to the benefits of repositioning
actions, mainly workforce reductions, and the elimination of
goodwill and indefinite-lived intangible asset amortization of
$204 million. Such amortization expense was excluded from
cost of goods sold in 2002 in conformity with Statement of
Financial Accounting Standards No. 142, “Goodwill and Other
Intangible Assets” (SFAS No. 142), which we adopted January 1,
2002. See Notes 1 and 13 of Notes to Financial Statements for
further discussion of the adoption of SFAS No. 142. This
increase in gross margin was partially offset by lower sales of
higher-margin products and services mainly in our Aerospace
reportable segment.
Selling, General and Administrative Expenses
(Dollars in Millions) 2003 2002 2001
Selling, general and
administrative expenses . . . . . . . . $ 2,950 $ 2,757 $ 3,064
Percent of sales . . . . . . . . . . . . . . . . 12.8% 12.4% 13.0%
Selling, general and administrative expenses as a percentage of
sales increased by 0.4 percentage points in 2003 compared with
2002 due mainly to higher pension and other employee benefit
expenses. Selling, general and administrative expenses as a
percentage of sales decreased by 0.6 percentage points in 2002
compared with 2001 due mainly to a $106 million reduction in
repositioning and other charges as well as lower costs due to
the benefits of repositioning actions, mainly workforce reduc-
tions. See the repositioning, litigation, business impairment and
other charges section of this MD&A for further details.
(Dollars in Millions) 2003 2002 2001
Pension and other postretirement
benefit expense (income) included
in cost of goods sold and selling,
general and administrative
expenses . . . . . . . . . . . . . . . . . . . . . $325 $ (11) $(165)
Increase (decrease) compared with
prior year . . . . . . . . . . . . . . . . . . . . . $336 $154 $(122)
Pension expense increased by $290 and $151 million in 2003
and 2002, respectively, mainly due to the following:
• A decrease in the market-related value of our pension plan
assets during the period 2000 to 2002 due to the poor per-
formance of the equity markets which adversely affected our
pension fund assets during this period.
• A systematic recognition of higher losses resulting mainly
from actual plan asset returns below the expected rate of
return during the period 2000 to 2002.
• A reduction in 2003 in the expected rate of return on plan
assets from 10 to 9 percent in response to the continued
deterioration in financial market returns in 2002.
• A decrease in the discount rate from 7.75 percent in 2001 to
6.75 percent in 2003.
Using an expected long-term rate of return of 9 percent and a
discount rate of 6 percent, pension expense for our U.S. plans
is expected to be $380 million in 2004, an increase of $241
million compared with 2003.
(Gain) Loss on Sale of Non-Strategic Businesses
(Dollars in Millions) 2003 2002 2001
(Gain) loss on sale of non-strategic
businesses . . . . . . . . . . . . . . . . . . . $ (38) $124 $ —
Gain on sale of non-strategic businesses of $38 million in 2003
represents the net pretax gain on the dispositions of certain
Specialty Materials (Engineering Plastics, Rudolstadt and
Metglas) and Aerospace (Honeywell Aerospace Defense
Services) businesses. The dispositions of these businesses did
not materially impact net sales and segment profit in 2003
compared with 2002. Loss on sale of non-strategic businesses
32
33
of $124 million in 2002 represented the pretax loss on the dis-
positions of Specialty Materials Pharmaceutical Fine
Chemicals (PFC) and Advanced Circuits businesses and
Automation and Control Solutions Consumer Products busi-
ness totaling $249 million, partially offset by the pretax gain on
the disposition of our Bendix Commercial Vehicle Systems
(BCVS) business of $125 million. The divestitures of these
businesses reduced net sales and increased segment profit in
2002 compared with 2001 by approximately $500 and $31 mil-
lion, respectively.
Asbestos Related Litigation Charges, Net of Insurance
(Dollars in Millions) 2003 2002 2001
Asbestos related litigation charges,
net of insurance . . . . . . . . . . . . . . . $ — $1,548 $159
Asbestos related litigation charges, net of insurance related
mainly to costs associated with asbestos claims related to
NARCO. See Asbestos Matters in Note 21 of Notes to Financial
Statements for further discussion.
Business Impairment Charges
(Dollars in Millions) 2003 2002 2001
Business impairment charges . . . . . . $ — $ 877 $145
Business impairment charges related principally to the write-
down of property, plant and equipment in businesses in our
Specialty Materials reportable segment and in our Friction
Materials business. See the repositioning, litigation, business
impairment and other charges section of this MD&A for
further details.
Equity in (Income) Loss of Affiliated Companies
(Dollars in Millions) 2003 2002 2001
Equity in (income) loss of
affiliated companies . . . . . . . . . . . . $(38) $ (42) $193
Equity income decreased by $4 million in 2003 compared with
2002 due to a charge of $2 million in 2003 related to the sale of
a Specialty Materials’ equity investee’s investment. Also, 2002
included income of $15 million resulting from exiting joint
ventures in our Aerospace and Transportation Systems
reportable segments partially offset by a charge of $13 million
for severance actions by our UOP joint venture. Equity income
increased by $235 million in 2002 compared with 2001 mainly
due to a $187 million decrease in repositioning and other
charges. See the repositioning, litigation, business impairment
and other charges section of this MD&A for further details.
This increase also resulted from an improvement in earnings
of $23 million from joint ventures in our Specialty Materials
and Automation and Control Solutions reportable segments
and from income of $15 million resulting from exiting joint
ventures in our Aerospace and Transportation Systems
reportable segments.
Other (Income) Expense
(Dollars in Millions) 2003 2002 2001
Other (income) expense . . . . . . . . . . . $ 19 $ (4) $ (17)
Other expense increased by $23 million in 2003 compared with
2002 due mainly to an increase of $65 million in foreign
exchange losses resulting from weakness in the U.S. dollar
mainly against the EURO partially offset by a gain of $20 million
related to a settlement of a patent infringement lawsuit and an
increase of $19 million in interest income from higher cash
balances. Other income decreased by $13 million in 2002 com-
pared with 2001 due to an increase in foreign exchange losses
of $47 million and an increase in other charges of $9 million,
largely offset by income of $15 million from a partial settle-
ment of a patent infringement lawsuit with an automotive
supplier, lower minority interests of $16 million and higher
interest income of $13 million. The increase of $9 million in
other charges resulted from charges of $15 million in 2002
related to an other than temporary decline in value of cost
basis equity investments versus a $6 million loss in 2001
related to the early redemption of our $200 million 5 3/4% dealer
remarketable securities.
Interest and Other Financial Charges
(Dollars in Millions) 2003 2002 2001
Interest and other financial charges . . $335 $ 344 $ 405
% change compared with prior year . . (3)% (15)% (16)%
Interest and other financial charges decreased by 3 percent in
2003 compared with 2002 due mainly to lower average interest
rates. Interest and other financial charges decreased by 15
percent in 2002 compared with 2001 due mainly to lower aver-
age interest rates and lower average debt outstanding.
Tax Expense (Benefit)
(Dollars in Millions) 2003 2002 2001
Tax expense (benefit) . . . . . . . . . . . . . $296 $ (725) $ (323)
Effective tax (benefit) rate . . . . . . . . . 18.0% (76.7)% (76.6)%
The effective tax rate (benefit) in 2003, 2002 and 2001 was dif-
ferent than the statutory rate of 35 percent due in part to tax
benefits from export sales, favorable tax audit settlements and
foreign tax planning strategies. The effective tax rate in 2003
also includes tax benefits expected to be realized as a result of
the redesignation of our Friction Materials business from held
for sale to held and used resulting from the termination of
discussions with Federal-Mogul Corp. The effective (benefit)
rate in 2002 included the tax benefit resulting from a higher
deductible tax basis than book basis related to sales of our

Advanced Circuits, PFC and Consumer Products businesses.
The impact of tax benefits from export sales, U.S. tax credits
and favorable audit settlements had a more favorable impact
on our effective (benefit) rates in 2002 and 2001 principally due
to the relative amount of these benefits in comparison to the
amount of our pretax losses in 2002 and 2001. See Note 7 of
Notes to Financial Statements for further information on taxes
including a detailed effective tax rate reconciliation.
In 2003, we derived tax benefits of $60 million from an exclu-
sion provided under U.S. income tax laws with respect to
certain extraterritorial income (ETI) attributable to receipts
from U.S. exports. In January 2002, the World Trade
Organization (WTO) held that the ETI regime, like its predeces-
sor, the Foreign Sales Corporation, constituted a prohibited
export subsidy under the relevant trade agreements and has
stated that sanctions would be imposed if the law is not
repealed or appropriately changed. If ETI is repealed, it is
unlikely that we would be able to realize an equivalent tax ben-
efit under current legislative proposals. Nonetheless, we
believe that the impact of final legislation will not have a mate-
rial effect on our consolidated results of operations, operating
cash flows or financial position.
Net Income (Loss)
(Dollars in Millions, Except Per Share Amounts) 2003 2002 2001
Net income (loss) . . . . . . . . . . . . . . . . $1,324 $ (220) $ (99)
Earnings (loss) per share of common
stock—assuming dilution . . . . . . . . $ 1.54 $(0.27) $(0.12)
The increase of $1.81 per share in 2003 compared with 2002
mainly relates to a decrease in repositioning, litigation, busi-
ness impairment and other charges partially offset by the
impact of higher pension expense and lower sales of higher-
margin products and services, principally in our Aerospace and
Automation and Control Solutions reportable segments. The
increase of $0.15 loss per share in 2002 compared with 2001
resulted mainly from an increase in repositioning, litigation,
business impairment and other charges, lower pension income
and a decrease in sales of higher-margin Aerospace products
and services partially offset by the exclusion of amortization of
goodwill and indefinite-lived intangible assets in 2002. Such
amortization expense is excluded from the 2002 results, in
conformity with SFAS No. 142. Repositioning, litigation, busi-
ness impairment and other charges in 2003, 2002 and 2001 are
discussed in detail in this MD&A.
Review of Business Segments
(Dollars in Millions) 2003 2002 2001
NET SALESAerospace . . . . . . . . . . . . . . . . . . . . $ 8,813 $ 8,855 $ 9,653
Automation and Control Solutions 7,464 6,978 7,185
Specialty Materials . . . . . . . . . . . . . 3,169 3,205 3,313
Transportation Systems . . . . . . . . . 3,650 3,184 3,457
Corporate . . . . . . . . . . . . . . . . . . . . 7 52 44
$23,103 $22,274 $23,652
SEGMENT PROFITAerospace . . . . . . . . . . . . . . . . . . . . $ 1,221 $ 1,308 $ 1,599
Automation and Control Solutions 843 860 774
Specialty Materials . . . . . . . . . . . . . 136 90 56
Transportation Systems . . . . . . . . . 461 393 307
Corporate . . . . . . . . . . . . . . . . . . . . (142) (154) (153)
$ 2,519 $ 2,497 $ 2,583
A reconciliation of segment profit to income (loss) before taxes
and cumulative effect of accounting change follows:
(Dollars in Millions) 2003 2002 2001
Segment profit (1) . . . . . . . . . . . . . . . $ 2,519 $ 2,497 $ 2,583
Gain (loss) on sale of non-strategic
businesses . . . . . . . . . . . . . . . . . 38 (124) —
Asbestos related litigation charges,
net of insurance . . . . . . . . . . . . . — (1,548) (159)
Business impairment charges . . . — (877) (145)
Repositioning and other charges (2) (276) (606) (2,285)
Pension and other postretirement
benefits (expense) income (2) . . . (325) 11 165
Equity in income (loss) of
affiliated companies . . . . . . . . . . 38 42 (193)
Other income (expense) . . . . . . . . . (19) 4 17
Interest and other financial
charges . . . . . . . . . . . . . . . . . . . . (335) (344) (405)
Income (loss) before taxes and
cumulative effect of accounting
change . . . . . . . . . . . . . . . . . . . . . $ 1,640 $ (945) $ (422)
(1) Segment profit in 2001 includes pretax amortization of goodwill and indefinite-
lived intangible assets of $204 million (Aerospace—$60 million, Automation
and Control Solutions—$92 million, Specialty Materials—$32 million and
Transportation Systems—$20 million). Such amortization expense is excluded
from the 2003 and 2002 results, in conformity with SFAS No. 142.
(2) Amounts included in cost of goods sold and selling, general and administra-
tive expenses.
During 2003, we changed our definition of segment profit to
exclude pension and other postretirement benefits (expense)
income. See Note 23 of Notes to Financial Statements for fur-
ther information on our reportable segments and our definition
of segment profit.
34

35
Aerospace
(Dollars in Millions) 2003 2002 2001
Net sales . . . . . . . . . . . . . . . . . . . . . $8,813 $8,855 $9,653
% change compared with
prior year . . . . . . . . . . . . . . . . . . . — % (8)% (3)%
Segment profit . . . . . . . . . . . . . . . . $1,221 $1,308 $1,599
% change compared with
prior year . . . . . . . . . . . . . . . . . . . (7)% (18)% (20)%
Aerospace sales by the major market segments follows:
% of Aerospace % Change in
Sales Sales_________________ _____________
2003 2002
Versus Versus
MARKET SEGMENT 2003 2002 2001 2002 2001
Commercial:Air transport aftermarket . . . . . 21% 20% 22% (1)% (13)%
Air transport original
equipment . . . . . . . . . . . . . . . 9 11 14 (16) (28)
Regional transport
aftermarket . . . . . . . . . . . . . . 9 9 9 (8) (13)
Regional transport original
equipment . . . . . . . . . . . . . . . 2 2 4 (15) (45)
Business and general aviation
aftermarket . . . . . . . . . . . . . . 8 8 7 6 7
Business and general aviation
original equipment . . . . . . . . 6 8 10 (21) (27)
Defense and Space:Defense and space original
equipment . . . . . . . . . . . . . . . 32 31 25 4 13
Defense and space
aftermarket . . . . . . . . . . . . . . 13 11 9 16 12
Total . . . . . . . . . . . . . . . . . . . . . . 100% 100% 100% — % (8)%
Aerospace sales in 2003 and 2002 were adversely impacted by
general weakness in the economy and other factors as follows:
• Air transport aftermarket sales have been adversely
impacted in 2003 and 2002 by lower global flying hours and
the financial problems being experienced by many of the
commercial airlines. This sales decline trend began in 2001
and was exacerbated by the abrupt downturn in the aviation
industry following the terrorists attacks on September 11,
2001. While sales of repair and overhaul services have
improved in 2003 signaling increased maintenance and out-
sourcing activity by the major airlines, discretionary spending
by airlines for purchases of spare parts for replacements and
upgrades continues to be weak.
• Air transport original equipment (OE) sales decreased signifi-
cantly in both 2003 and 2002 reflecting dramatically lower
deliveries by our OE customers (primarily Airbus and Boeing)
due to reduced aircraft orders by commercial airlines.
• Defense and space OE and aftermarket sales were strong in
both 2003 and 2002 due mainly to increased military activity
from increased military replenishment, platform upgrades
and growth in precision guidance munitions.
• Regional aftermarket sales were lower in 2003 and 2002
due mainly to lower sales of spare parts to regional
airline operators.
• Business and general aviation OE sales were lower in 2003
and 2002 reflecting a decline in projected deliveries of busi-
ness jet airplanes due to weakness in the demand for
fractional interests in aircraft and corporate profitability.
• Business and general aviation aftermarket sales increased in
both 2003 and 2002 largely due to higher repair and overhaul
activity in the fractional jet market.
Trends which may impact Aerospace operating results in
2004 include:
• Preliminary indications that the financial condition of the
airline industry is beginning to stabilize and that there will be
moderate improvement in global flying hours.
• The extent to which increased military activity is offset by
lower OE sales due to program completions and reductions.
• The magnitude of an expected increase in aircraft orders
and deliveries in the air transport, business and general
aviation segments.
Aerospace segment profit in 2003 decreased by 7 percent
compared with 2002 due mainly to lower sales of commercial
original equipment and higher-margin commercial after-
market spare parts. Aerospace segment profit in 2002
decreased by 18 percent compared with 2001 due mainly to
lower sales of higher-margin commercial aftermarket prod-
ucts such as avionics upgrades and spare parts and contract
losses. This decrease was partially offset by lower costs prima-
rily from workforce reductions.
Automation and Control Solutions
(Dollars in Millions) 2003 2002 2001
Net sales . . . . . . . . . . . . . . . . . . . . . . $7,464 $6,978 $7,185
% change compared with
prior year . . . . . . . . . . . . . . . . . . . . 7 % (3)% (3)%
Segment profit . . . . . . . . . . . . . . . . . . $ 843 $ 860 $ 774
% change compared with
prior year . . . . . . . . . . . . . . . . . . . . (2)% 11% (15)%
Automation and Control Solutions sales in 2003 increased by 7
percent compared with 2002 due to favorable effects of foreign
exchange of 5 percent and acquisitions, net of the disposition of
our Consumer Products business, of 4 percent, partially offset
by the impact of lower prices and volumes of 1 percent each.
Sales increased by 11 percent for our Automation and Control
Products business as the favorable effects of foreign exchange

and acquisitions, mainly Invensys Sensor Systems (Invensys),
more than offset the impact of the disposition of our Consumer
Products business and lower volumes. Sales for our Process
Solutions business increased by 4 percent due to the favorable
effect of foreign exchange partially offset by lower unit vol-
umes. Sales for our Building Solutions business increased by 2
percent as the favorable effect of foreign exchange more than
offset lower volumes due to continued softness in the non-
residential construction market. Automation and Control
Solutions sales in 2002 decreased by 3 percent compared with
2001 due to the impact of lower prices and volumes of 2 and 1
percent, respectively, and net divestitures of 1 percent, mainly
our Consumer Products business. This decrease was partially
offset by the favorable effect of foreign exchange of 1 percent.
Sales declined by 2 percent for our Automation and Control
Products business primarily due to the disposition of our
Consumer Products business and softness in capital spending
partially offset by increased demand for security-related prod-
ucts. Sales for our Process Solutions business declined by 4
percent resulting from ongoing softness in industrial produc-
tion and capital spending. Sales for our Building Solutions
business decreased by 3 percent due primarily to general
weakness in the economy.
Trends which may impact Automation and Control Solutions
operating results in 2004 include the extent, if any, of recovery
in non-residential construction spending and capital spending
on process and building automation.
Automation and Controls Solutions segment profit in 2003
decreased by 2 percent compared with 2002 due mainly to the
decline in higher-margin energy-retrofit and discretionary spot
sales in our Building Solutions business, and increased
research and development and investments in sales and mar-
keting capacity, mainly in our Automation and Control Products
and Building Solutions businesses, respectively. Segment profit
was also adversely impacted by pricing pressures mainly in our
Automation and Control Products and Process Solutions busi-
nesses. Automation and Control Solutions segment profit in
2002 increased by 11 percent compared with 2001. This
increase resulted primarily from the absence of goodwill amor-
tization expense in 2002 and lower costs due to the benefits of
repositioning actions, mainly workforce reductions. This
increase was partially offset by the impact of lower sales vol-
umes and pricing pressures, mainly in our Automation and
Control Products and Building Solutions businesses.
Specialty Materials
(Dollars in Millions) 2003 2002 2001
Net sales . . . . . . . . . . . . . . . . . . . . . . $3,169 $3,205 $3,313
% change compared with
prior year . . . . . . . . . . . . . . . . . . . . (1)% (3)% (18)%
Segment profit . . . . . . . . . . . . . . . . . . $ 136 $ 90 $ 56
% change compared with
prior year . . . . . . . . . . . . . . . . . . . . 51 % 61 % (83)%
Specialty Materials sales in 2003 decreased by 1 percent com-
pared with 2002 due to the impact of the divestitures of our
Advanced Circuits, PFC and Engineering Plastics businesses,
net of the acquisition of BASF’s nylon fiber business, of 6 per-
cent partially offset by the favorable effects of foreign exchange
of 3 percent and higher volumes of 2 percent. Higher volumes
were principally driven by strong demand for Spectra fiber from
the U.S. military, increasing demand for HFCs, a key compo-
nent of many non-ozone depleting refrigerants and foam
blowing agents and increased demand for electronic materials
from the semiconductor industry. Volumes were adversely
affected by the temporary plant shutdowns in our
Fluorocarbons and Nylon System businesses. Specialty
Materials sales in 2002 decreased by 3 percent compared with
2001 due to the impact of lower prices of 5 percent and divesti-
tures of 1 percent, mainly our PFC business, partially offset by
higher volumes of 2 percent and the favorable effect of foreign
exchange of 1 percent. Industrial overcapacity resulted in pric-
ing pressures in several businesses such as Nylon System,
Specialty Chemicals, Polyester and Flourines. The adverse
impact of pricing in these businesses was somewhat offset by
higher demand principally in our Nylon System and Electronic
Materials businesses. In addition, weakness in the telecommu-
nication industry drove a substantial decline in sales in our
Advanced Circuits business which we sold in the fourth quarter
of 2002.
Trends which may impact Specialty Materials operating results
in 2004 include:
• Continued excess global capacity in the production of poly-
ester and nylon.
• Key raw material costs (natural gas and benzene) remaining
at historically high levels.
Specialty Materials segment profit in 2003 increased by 51
percent compared with 2002 due mainly to the impact of the
prior year write-down of property, plant and equipment in sev-
eral businesses, the benefits of cost actions including synergies
from the nylon transaction, divestitures of non-strategic busi-
nesses and higher sales volumes. This increase was partially
offset by higher raw material costs (mainly natural gas and
benzene) and the impact of the temporary plant shutdowns in
our Fluorocarbons and Nylon System businesses. Specialty
Materials segment profit in 2002 increased by 61 percent
compared with 2001 due mainly to the absence of goodwill
amortization expense in 2002 and the impact of higher volumes
in our Electronic Materials and Nylon System businesses, lower
raw material costs, and lower costs resulting from plant shut-
downs and workforce reductions. This increase was partially
offset by the negative impact of pricing pressures in many of our
markets and by start-up costs for our new Fluorines plant.
36

37
Transportation Systems
(Dollars in Millions) 2003 2002 2001
Net sales . . . . . . . . . . . . . . . . . . . . . . . $3,650 $3,184 $3,457
% change compared with
prior year . . . . . . . . . . . . . . . . . . . . 15% (8)% (2)%
Segment profit . . . . . . . . . . . . . . . . . . $ 461 $ 393 $ 307
% change compared with
prior year . . . . . . . . . . . . . . . . . . . . 17% 28 % 11 %
Transportation Systems sales in 2003 increased by 15 percent
compared with 2002 due mainly to the favorable effects of
foreign exchange of 9 percent and a favorable sales mix and
volume growth of 5 percent. This increase resulted mainly from
a 27 percent increase in sales for our Honeywell Turbo
Technologies business due to a favorable sales mix and volume
growth of 15 percent as worldwide demand for our turbocharg-
ers continued to be strong and the favorable effect of foreign
exchange of 12 percent. Transportation Systems sales in 2002
decreased by 8 percent compared with 2001 due to the disposi-
tion of our BCVS business of 12 percent partially offset by
higher volumes of 3 percent and the favorable effect of foreign
exchange of 2 percent. Sales for our Honeywell Turbo
Technologies business increased by 6 percent due to higher
build rates for medium and heavy-duty vehicles in Asia and
North America. Sales for our Consumer Products Group and
Friction Materials businesses also both increased by 2 percent
due mainly to favorable foreign exchange.
Trends which may impact Transportation Systems operating
results in 2004 include:
• Rate of increase in global diesel and gasoline turbocharger
OEM demand arising from continued penetration of diesel
passenger cars into the European market, and North
America truck shipments.
• The adoption of regulations aimed at reducing emissions.
Transportation Systems segment profit in 2003 increased by 17
percent compared with 2002 as the effect of higher sales in our
Honeywell Turbo Technologies business was partially offset by
higher new product development and introduction and facility
relocations expenses, and lower aftermarket sales at our
Friction Materials business. Transportation Systems segment
profit in 2002 increased by 28 percent compared with 2001 due
mainly to higher sales and the effects of cost-structure
improvements, mainly workforce reductions and low-cost
sourcing, in all of the segment’s businesses. The shutdown of
our Turbogenerator product line in 2001 also contributed to
higher segment profit. This increase was partially offset by the
absence of segment profit from our BCVS business which was
sold in the first quarter of 2002.
Repositioning, Litigation, Business Impairment and Other
Charges
A summary of repositioning, litigation, business impairment
and other charges follows:
(Dollars in Millions) 2003 2002 2001
Severance . . . . . . . . . . . . . . . . . . . . . . $ 69 $ 270 $ 727
Asset impairments . . . . . . . . . . . . . . . 6 121 194
Exit costs . . . . . . . . . . . . . . . . . . . . . . . 7 62 95
Reserve adjustments . . . . . . . . . . . . . (69) (76) (119)
Total net repositioning charge . . . . . . 13 377 897
Asbestos related litigation charges,
net of insurance . . . . . . . . . . . . . . . — 1,548 159
Litton litigation settlement . . . . . . . . . — — 440
Other probable and reasonably
estimable legal and
environmental liabilities . . . . . . . . . 261 30 249
Business impairment charges . . . . . . — 877 145
Customer claims and settlements
of contract liabilities . . . . . . . . . . . . — 152 310
Write-offs of receivables, inventories
and other assets . . . . . . . . . . . . . . . 2 60 335
Investment impairment charges . . . . 2 15 112
Aerospace jet engine contract
cancellation . . . . . . . . . . . . . . . . . . . — — 100
General Electric merger expenses . . — — 42
Debt extinguishment loss . . . . . . . . . — — 6
Total net repositioning, litigation, business
impairment and other charges . . . $278 $3,059 $2,795
The following table summarizes the pretax distribution of total
net repositioning, litigation, business impairment and other
charges by income statement classification:
(Dollars in Millions) 2003 2002 2001
Cost of goods sold . . . . . . . . . . . . . . . $272 $ 561 $2,134
Selling, general and administrative
expenses . . . . . . . . . . . . . . . . . . . . . 4 45 151
Asbestos related litigation charges,
net of insurance . . . . . . . . . . . . . . . — 1,548 159
Business impairment charges . . . . . . — 877 145
Equity in (income) loss of affiliated
companies . . . . . . . . . . . . . . . . . . . . 2 13 200
Other (income) expense . . . . . . . . . . . — 15 6
$278 $3,059 $2,795
In 2003, we recognized a repositioning charge of $82 million
mainly for severance costs related to workforce reductions of
1,501 manufacturing and administrative positions across all of
our reportable segments. Also, $69 million of previously estab-
lished accruals, mainly for severance, were returned to income
in 2003, due to fewer employee separations than originally
anticipated associated with certain 2002 repositioning actions,
resulting in reduced severance liabilities in our Automation and
Control Solutions, Aerospace and Specialty Materials
reportable segments.

In 2002, we recognized a repositioning charge of $453 million
for workforce reductions across all of our reportable segments
and our UOP process technology joint venture. The charge also
related to costs for the planned shutdown and consolidation of
manufacturing plants in our Specialty Materials and
Automation and Control Solutions reportable segments.
Severance costs related to announced workforce reductions of
approximately 8,100 manufacturing and administrative posi-
tions, which are substantially complete. Asset impairments
principally related to manufacturing plant and equipment held
for sale and capable of being taken out of service and actively
marketed in the period of impairment. Exit costs related princi-
pally to incremental costs to exit facilities, including lease
termination losses negotiated or subject to reasonable estima-
tion related mainly to closed facilities in our Automation and
Control Solutions and Specialty Materials reportable
segments. Also, $76 million of previously established sever-
ance accruals were returned to income in 2002, due to fewer
employee separations than originally anticipated and higher
than expected voluntary employee attrition resulting in reduced
severance liabilities in our Aerospace, Automation and Control
Solutions and Specialty Materials reportable segments.
In 2001, we recognized a repositioning charge of $1,016 million
for the cost of actions designed to reduce our cost structure
and improve our future profitability. These actions consisted of
announced global workforce reductions of approximately
20,000 manufacturing and administrative positions across all of
our reportable segments, which are complete. The reposition-
ing charge also included asset impairments and other exit
costs related to plant closures and the rationalization of manu-
facturing capacity and infrastructure, principally in our
Specialty Materials, Engines, Systems and Services and
Transportation Systems businesses, including the shutdown of
our Turbogenerator product line. Other exit costs consisted of
contract cancellations and penalties, including lease termina-
tions, negotiated or subject to reasonable estimation. Also,
$119 million of previously established accruals, mainly for
severance, were returned to income in 2001 due principally to
higher than expected voluntary employee attrition resulting in
reduced severance liabilities, principally in our Aerospace and
Automation and Control Solutions reportable segments.
Our 2003 repositioning actions are expected to generate
incremental pretax savings of approximately $70 million in
2004 compared with 2003 principally from planned workforce
reductions. Cash expenditures for severance and other exit
costs necessary to execute our repositioning actions were
$200, $447 and $422 million in 2003, 2002 and 2001, respec-
tively. Such expenditures for severance and other exit costs
have been funded principally through operating cash flows.
Cash expenditures for severance and other exit costs neces-
sary to execute the remaining actions will approximate $200
million in 2004 and will be funded principally through operating
cash flows.
In 2003, we recognized other charges for probable and reason-
ably estimable legal and environmental liabilities of $261
million. This includes $235 million for environmental liabilities
mainly related to the matter entitled Interfaith CommunityOrganization, et al. v. Honeywell International Inc., et al. and for
environmental conditions in and around Onondaga Lake in
Syracuse, New York, both as discussed in Note 21 of Notes to
Financial Statements. We also recognized a charge of $4 million
in our Specialty Materials reportable segment including a loss
on sale of an investment owned by an equity investee.
In 2002, we recognized business impairment charges of $877
million related to businesses in our Specialty Materials and
Automation and Control Solutions reportable segments, as
well as our Friction Materials business. Based on current oper-
ating losses and deteriorating economic conditions in certain
chemical and telecommunications end-markets, we performed
impairment tests and recognized impairment charges of $785
million in 2002 principally related to the write-down of prop-
erty, plant and equipment held and used in our Nylon System,
Performance Fibers and Metglas Specialty Materials busi-
nesses, as well as an Automation and Control Solutions
communication business. We also recognized impairment
charges of $92 million related principally to the write-down of
property, plant and equipment of our Friction Materials busi-
ness, which was classified as assets held for disposal in Other
Current Assets as of December 31, 2002 (a plan of disposal of
Friction Materials was adopted in 2001; in January 2003, we
entered into a letter of intent to sell this business to Federal-
Mogul Corp. We formally ended negotiations to sell our Friction
Materials business to Federal-Mogul Corp. and reclassified the
business from held for sale to held and used as of December
31, 2003—see Note 21 of Notes to Financial Statements for
further discussion). In 2002, we recognized asbestos related
litigation charges of $1,548 million principally related to costs
associated with the potential resolution of asbestos claims of
NARCO (see Note 21 of Notes to Financial Statements for
further discussion). In 2002, we also recognized other charges
consisting of customer claims and settlements of contract
liabilities of $152 million and write-offs of receivables, inven-
tories and other assets of $60 million. These other charges
related mainly to our Advanced Circuits business, bankruptcy
of a customer in our Aerospace reportable segment, and cus-
tomer claims in our Aerospace and Automation and Control
Solutions reportable segments. Additionally, we recognized
other charges consisting of other probable and reasonably
estimable environmental liabilities of $30 million and write-offs
related to an other than temporary decline in the value of
certain equity investments of $15 million.
In 2001, we recognized other charges consisting of a settle-
ment of the Litton Systems, Inc. litigation for $440 million,
other probable and reasonably estimable legal and environ-
mental liabilities of $249 million (see Note 21 of Notes to
38

39
Financial Statements for further discussion), asbestos related
litigation charges of $159 million (see Note 21 of Notes to
Financial Statements for further discussion), customer claims
and settlements of contract liabilities of $310 million and
write-offs of receivables, inventories and other assets of $335
million. Our Friction Materials business was designated as
held for disposal, and we recognized an impairment charge of
$145 million related to the write-down of property, plant and
equipment, goodwill and other identifiable intangible assets to
their fair value less costs to sell. We recognized charges of
$112 million related to an other than temporary decline in the
value of an equity investment and an equity investee’s loss
contract, and a $100 million charge for write-off of invest-
ments, including inventory, related to a regional jet engine
contract cancellation. We also recognized $42 million of trans-
action expenses related to the proposed merger with General
Electric and redeemed our $200 million 53⁄4% dealer remarket-
able securities due 2011, resulting in a loss of $6 million.
The following tables provide details of the pretax impact of total
net repositioning, litigation, business impairment and other
charges by reportable segment.
Aerospace
(Dollars in Millions) 2003 2002 2001
Net repositioning charge . . . . . . . . . . $ 10 $ 15 $198
Litton litigation settlement . . . . . . . . . — — 440
Other probable and reasonably
estimable legal and environmental
liabilities . . . . . . . . . . . . . . . . . . . . . — — 2
Customer claims and settlements
of contract liabilities . . . . . . . . . . . . — 99 111
Write-offs of receivables, inventories
and other assets . . . . . . . . . . . . . . . — 21 44
Investment impairment charges . . . . — 11 —
Aerospace jet engine contract
cancellation . . . . . . . . . . . . . . . . . . . — — 100
$ 10 $146 $895
Automation and Control Solutions
(Dollars in Millions) 2003 2002 2001
Net repositioning charge . . . . . . . . . . $ (22) $131 $289
Other probable and reasonably
estimable legal and
environmental liabilities . . . . . . . . . — — 53
Business impairment charges . . . . . . — 22 —
Customer claims and settlements
of contract liabilities . . . . . . . . . . . . — 42 114
Write-offs of receivables, inventories
and other assets . . . . . . . . . . . . . . . — 17 236
Investment impairment charges . . . . — — 93
$ (22) $212 $785
Specialty Materials
(Dollars in Millions) 2003 2002 2001
Net repositioning charge . . . . . . . . . . $ 16 $ 167 $ 172
Other probable and reasonably
estimable legal and
environmental liabilities . . . . . . . . . — 23 —
Business impairment charges . . . . . . — 763 —
Customer claims and settlements
of contract liabilities . . . . . . . . . . . . — 11 29
Write-offs of receivables, inventories
and other assets . . . . . . . . . . . . . . . 2 12 22
Investment impairment charges . . . . 2 — 19
$ 20 $ 976 $ 242
Transportation Systems
(Dollars in Millions) 2003 2002 2001
Net repositioning charge . . . . . . . . . . $ 5 $ 26 $ 133
Asbestos related litigation charges,
net of insurance . . . . . . . . . . . . . . . — 167 —
Other probable and reasonably
estimable legal and
environmental liabilities . . . . . . . . . 11 — 2
Business impairment charges . . . . . . — 92 145
Customer claims and settlements
of contract liabilities . . . . . . . . . . . . — — 56
Write-offs of receivables, inventories
and other assets . . . . . . . . . . . . . . . — 10 31
$ 16 $ 295 $ 367
Corporate
(Dollars in Millions) 2003 2002 2001
Net repositioning charge . . . . . . . . . . $ 4 $ 38 $ 105
Asbestos related litigation charges,
net of insurance . . . . . . . . . . . . . . . — 1,381 159
Other probable and reasonably
estimable legal and
environmental liabilities . . . . . . . . . 250 7 192
Write-offs of receivables, inventories
and other assets . . . . . . . . . . . . . . . — — 2
Investment impairment charges . . . . — 4 —
Debt extinguishment loss . . . . . . . . . — — 6
General Electric merger expenses . . — — 42
$ 254 $1,430 $ 506
LIQUIDITY AND CAPITAL RESOURCES
Cash Flow Summary
Our cash flows from operating, investing and financing activi-
ties, as reflected in the Consolidated Statement of Cash Flows,
are summarized as follows:
(Dollars in Millions) 2003 2002 2001
Cash provided by (used for):
Operating activities . . . . . . . . . . . . . $2,199 $2,380 $1,996
Investing activities . . . . . . . . . . . . . (680) (870) (906)
Financing activities . . . . . . . . . . . . . (895) (932) (884)
Effect of exchange rate changes
on cash . . . . . . . . . . . . . . . . . . . . 305 50 (9)
Net increase in cash and
cash equivalents . . . . . . . . . . . . . . . $ 929 $ 628 $ 197

Cash provided by operating activities decreased by $181 million
during 2003 compared with 2002 mainly due to a $540 million
increase in voluntary U.S. pension contributions as well as a
reduced improvement in working capital (receivables, invento-
ries and accounts payable) turnover due primarily to a
weakening of the U.S. dollar versus the Euro and Canadian
dollar throughout 2003. This decrease was partially offset by
reduced severance and exit costs payments of $247 million,
lower litigation payments of $222 million, as well as insurance
receipts in excess of asbestos liability payments of $107 million
during 2003. Cash provided by operating activities increased by
$384 million during 2002 compared with 2001 mainly due to an
improvement in working capital turnover and lower tax pay-
ments. This increase was partially offset by a voluntary U.S.
pension contribution of $130 million and higher spending for
repositioning actions, mainly severance.
Cash used for investing activities decreased by $190 million
during 2003 compared with 2002 due mainly to reduced spend-
ing of $321 million for acquisitions, principally reflecting the
acquisition of Invensys in October 2002. This decrease was
partially offset by reduced proceeds from sales of investments
of $91 million related to the disposition of a cost investment in
our Automation and Controls Solutions reportable segment in
2002, and reduced proceeds from sales of businesses of $46
million. Proceeds from business sales in 2003 resulted from
the sale of certain non-core Specialty Materials (Engineering
Plastics, Rudolstadt and Metglas) and Aerospace (Honeywell
Aerospace Defense Services) businesses. Cash used for invest-
ing activities decreased by $36 million during 2002 compared
with 2001 due to higher proceeds from sales of businesses of
$139 million and lower capital spending of $205 million. During
2002, we realized proceeds from the sales of our BCVS, PFC
and Consumer Products businesses. The decrease in capital
spending reflected the completion in 2002 of a major plant in
our Fluorines business and our intention to limit capital spend-
ing at non-strategic businesses. This decrease in cash used for
investing activities also reflects the proceeds of $91 million
from the disposition of a cost investment in our Automation and
Control Solutions reportable segment. This decrease in cash
used for investing activities was partially offset by an increase
in spending for acquisitions of $398 million, principally reflect-
ing the acquisition of Invensys.
Cash used for financing activities decreased by $37 million
during 2003 compared with 2002 mainly due to lower net debt
repayments in 2003, partially offset by cash used to repurchase
shares in the fourth quarter of 2003. Total debt of $5,160 mil-
lion at December 31, 2003 was $71 million, or 1 percent higher
than at December 31, 2002 principally reflecting the assump-
tion of $267 million of debt associated with the purchase of
assets under operating leases partially offset by lower short-
term borrowings. Cash used for financing activities increased
by $48 million during 2002 compared with 2001 mainly due to a
decrease in proceeds from issuance of common stock upon
stock option exercises. Total debt of $5,089 million at
December 31, 2002 was $181 million, or 3 percent lower than
at December 31, 2001 principally reflecting scheduled repay-
ments of long-term debt.
At December 31, 2003 we had approximately $2.6 billion of
cash and cash equivalents held by non U.S. subsidiaries mainly
in local currencies (principally the Euro, British pound and
Canadian dollar). The $305 million increase in cash and cash
equivalents due to exchange rate changes principally resulted
from a weakening of the U.S. dollar mainly against the Euro
and Canadian dollar throughout 2003. We manage our world-
wide cash requirements considering available cash balances
and the most cost effective method to access those cash bal-
ances. The repatriation of cash balances from some non U.S.
subsidiaries to the U.S. could have adverse U.S. tax conse-
quences; however, substantially all cash balances held by non
U.S. subsidiaries are available without legal restrictions to fund
business operations.
Liquidity
We manage our businesses to maximize operating cash flows
as the primary source of our liquidity. Operating cash flows
were $2.2 billion in 2003. We have approximately $6.2 billion in
working capital (trade receivables and inventories) and each of
our businesses continues to focus on strategies to improve
working capital turnover in 2004 to increase operating cash
flows. Considering the current economic environment in which
each of our businesses operate and our business plans and
strategies, including our focus on growth, cost reduction and
productivity initiatives, we believe that our operating cash flows
will remain our principal source of liquidity. In addition
to our operating cash flows and available cash, additional
sources of liquidity include committed credit lines, access to
the public debt and equity markets using debt and equity secu-
rities and commercial paper, as well as our ability to sell trade
accounts receivables.
A source of liquidity is our short-term borrowings in the com-
mercial paper market. Our ability to access the commercial
paper market and the related cost of these borrowings is
affected by the strength of our credit ratings and our $2.3 bil-
lion committed bank revolving credit facilities (Revolving Credit
Facilities). Our credit ratings are periodically reviewed by the
major independent debt-rating agencies. Our current ratings
as provided by Moody’s Investors Service, Standard & Poor’s
and Fitch, Inc. are A-2, A and A+, respectively, for long-term
debt and P-1, A-1 and F-1, respectively, for short-term debt.
Our credit ratings by each of the three major debt-rating
agencies reflect a “negative outlook” due principally to the
lower operating results for our Aerospace reportable segment
40

41
due to the depressed market conditions in the commercial air
transport industry and our potential exposure to asbestos
liabilities. The “negative outlook” ratings have not impaired,
nor do we expect it to impair, our access to the commercial
paper markets.
We may from time to time issue unsecured short-term promis-
sory notes in the commercial paper market. The commercial
paper notes may bear interest or may be sold at a discount and
have a maturity of not more than 364 days from date of
issuance. Borrowings under the commercial paper program
are available for general corporate purposes as well as for
financing potential acquisitions. There was no commercial
paper outstanding at year-end 2003.
We maintain $2.3 billion of Revolving Credit Facilities with a
group of banks, arranged by Citigroup Global Markets Inc. and
J.P. Morgan Securities Inc., comprised of: (a) a $1.3 billion
Five-Year Credit Agreement, with a $300 million letter of credit
sub-limit and (b) a $1 billion 364-Day Credit Agreement. The
credit agreements are maintained for general corporate pur-
poses, including support for the issuance of commercial paper.
The Five-Year Credit Agreement was increased in November
2003 from $1 billion to $1.3 billion with the addition of a $300
million sub-limit for the potential issuance of letters of credit.
See Note 15 of Notes to Financial Statements for details of long
term debt and description of our Revolving Credit Facilities.
We also have a shelf registration statement filed with the
Securities and Exchange Commission which allows us to issue
up to $3 billion in debt securities, common stock and preferred
stock that may be offered in one or more offerings on terms to
be determined at the time of the offering. Net proceeds of any
offering would be used for general corporate purposes, includ-
ing repayment of existing indebtedness, capital expenditures
and acquisitions.
We also sell interests in designated pools of trade accounts
receivables to third parties. The sold receivables are over-
collateralized by $174 million at December 31, 2003 and we
retain a subordinated interest in the pool of receivables repre-
senting that over-collateralization as well as an undivided
interest in the balance of the receivables pools. New receivables
are sold under the agreement as previously sold receivables
are collected. The retained interests in the receivables are
shown at the amounts expected to be collected by us, and such
carrying value approximates the fair value of our retained inter-
ests. The sold receivables were $500 million at both
December 31, 2003 and 2002.
In addition to our normal operating cash requirements, our
principal future cash requirements will be to fund capital
expenditures, debt repayments, employee benefit obligations,
environmental remediation costs, asbestos claims, severance
and exit costs related to repositioning actions, share repur-
chases and any strategic acquisitions. Our total capital
expenditures in 2004 are currently projected at approximately
$665 million. These expenditures are primarily intended for
maintenance, replacement, production capacity expansion and
cost reduction. There are no significant long-term debt repay-
ments scheduled for 2004. Assuming that actual pension plan
returns are consistent with our expected rate of return of 9
percent in 2004 and beyond and that interest rates remain
constant, we would not be required to make any contributions
to our U.S. pension plans for the foreseeable future. We cur-
rently expect to repurchase approximately 10 million shares on
an annual basis under our share repurchase program initiated
in the fourth quarter of 2003. Cash expenditures for severance
and other exit costs necessary to execute the remaining reposi-
tioning actions will approximate $200 million in 2004. We
expect our cash expenditures for asbestos claims in 2004 to be
approximately $730 million and insurance recoveries to be
approximately $130 million in 2004. See Asbestos Matters in
Note 21 of Notes to Financial Statements for further discussion.
We continuously assess the relative strength of each business
in our portfolio as to strategic fit, market position, profit and
cash flow contribution in order to upgrade our combined port-
folio and identify business units that will most benefit from
increased investment. We identify acquisition candidates that
will further our strategic plan and strengthen our existing core
businesses. We also identify business units that do not fit into
our long-term strategic plan based on their market position,
relative profitability or growth potential. These business units
are considered for potential divestiture, restructuring or other
repositioning actions subject to regulatory constraints. In 2003,
we realized $137 million in cash proceeds from sales of non-
strategic businesses.
We believe that our operating cash flows will be sufficient to
meet our future cash needs. Our available cash, committed
credit lines, access to the public debt and equity markets using
debt and equity securities and commercial paper, as well as
our ability to sell trade accounts receivables, provide additional
sources of short-term and long-term liquidity to fund current
operations and future investment opportunities. Based on our
current financial position and expected economic performance,
we do not believe that our liquidity will be adversely impacted
by an inability to access our sources of financing.
Contractual Obligations and Probable Liability Payments
Following is a summary of our significant contractual obliga-
tions and probable liability payments at December 31, 2003:

Payments by Period
(Dollars in Millions) Total 2004 2005-2006 2007-2008 Thereafter
Long-term debt, including capitalized leases (1) . . . . . . . . . . . $ 5,008 $ 47 $1,883 $ 758 $2,320Minimum operating lease payments . . . . . . . . . . . . . . . . . . . . 1,042 274 351 209 208Purchase obligations (2) . . . . . . . . . . . . . . . . . . . . . . . . . . . . . . 2,644 629 786 288 941Environmental liability payments . . . . . . . . . . . . . . . . . . . . . . 593 90 200 200 103Asbestos related liability payments (3) . . . . . . . . . . . . . . . . . . . 3,009 730 1,110 372 797
12,296 1,770 4,330 1,827 4,369
Asbestos insurance recoveries (4) . . . . . . . . . . . . . . . . . . . . . . (1,447) (130) (310) (91) (916)
$10,849 $1,640 $4,020 $1,736 $3,453
(1) Assumes all long-term debt is outstanding until scheduled maturity.
(2) Purchase obligations are entered into with various vendors in the normal course of business and are consistent with our expected requirements.
(3) These amounts are estimates of asbestos related cash payments for NARCO and Bendix. NARCO estimated payments are based on the terms and conditions, includ-
ing evidentiary requirements, specified in the definitive agreements or agreements in principle and pursuant to Trust Distribution Procedures. Bendix payments are
based on our estimate of pending claims. Projecting future events is subject to many uncertainties that could cause asbestos liabilities to be higher or lower than
those projected and recorded. There is no assurance that NARCO or Bendix insurance recoveries will be timely, that a NARCO plan of reorganization will be proposed
or confirmed, or whether there will be any NARCO related asbestos claims beyond 2018. See Asbestos Matters in Note 21 of Notes to Financial Statements.
(4) These amounts represent probable insurance recoveries through 2018. See Asbestos Matters in Note 21 of Notes to Financial Statements.
42
The table excludes our pension and other postretirement bene-
fits (OPEB) obligations. We made voluntary contributions of
$670 and $830 million ($700 million in Honeywell common
stock and $130 million in cash) to our U.S. pension plans in
2003 and 2002, respectively. Future plan contributions are
dependent upon actual plan asset returns and interest rates.
Assuming that actual plan asset returns are consistent with
our expected plan return of 9 percent in 2004 and beyond, and
that interest rates remain constant, we would not be required
to make any contributions to our U.S. pension plans for the
foreseeable future. Payments due under our OPEB plans are
not required to be funded in advance, but are paid as medical
costs are incurred by covered retiree populations, and are
principally dependent upon the future cost of retiree medical
benefits under our plans. We expect our OPEB payments to
approximate $210 million in 2004. See Note 22 of Notes to
Financial Statements for further discussion of our pension and
OPEB plans.
Off-Balance Sheet Arrangements
Following is a summary of our off-balance sheet arrangements:
GuaranteesWe have issued or are a party to the following direct and indi-
rect guarantees at December 31, 2003:
Maximum Potential
Future (Dollars in Millions) Payments
Operating lease residual values . . . . . . . . . . . . $ 73Other third parties’ financing . . . . . . . . . . . . . . 5Unconsolidated affiliates’ financing . . . . . . . . . 38Customer and vendor financing . . . . . . . . . . . . 24
$140
We do not expect that these guarantees will have a material
adverse effect on our consolidated results of operations, finan-
cial position or liquidity.
In connection with the disposition of certain businesses and
facilities we have indemnified the purchasers for the expected
cost of remediation of environmental contamination, if any,
existing on the date of disposition. Such expected costs are
accrued when environmental assessments are made or
remedial efforts are probable and the costs can be
reasonably estimated.
Retained Interests in Factored Pools of Trade AccountsReceivablesAs a source of liquidity, we sell interests in designated pools of
trade accounts receivables to third parties. The sold receivables
($500 million at December 31, 2003) are over-collateralized and
we retain a subordinated interest in the pool of receivables
representing that over-collateralization as well as an undivided
interest in the balance of the receivables pools. The over-col-
lateralization provides credit support to the purchasers of the
receivable interest by limiting their losses in the event that a
portion of the receivables sold becomes uncollectible. At
December 31, 2003, our retained subordinated and undivided
interests at risk were $174 and $321 million, respectively.
Based on the underlying credit quality of the receivables placed
into the designated pools of receivables being sold, we do not
expect that any losses related to our retained interests at risk
will have a material adverse effect on our consolidated results
of operations, financial position or liquidity.
Environmental Matters
We are subject to various federal, state and local government
requirements relating to the protection of the environment. We
believe that, as a general matter, our policies, practices and
procedures are properly designed to prevent unreasonable risk
of environmental damage and personal injury and that our

43
handling, manufacture, use and disposal of hazardous or toxic
substances are in accord with environmental and safety laws
and regulations. However, mainly because of past operations
and operations of predecessor companies, we, like other com-
panies engaged in similar businesses, have incurred remedial
response and voluntary cleanup costs for site contamination
and are a party to lawsuits and claims associated with environ-
mental and safety matters, including past production of
products containing toxic substances. Additional lawsuits,
claims and costs involving environmental matters are likely to
continue to arise in the future.
With respect to environmental matters involving site contami-
nation, we continually conduct studies, individually at our
owned sites, and jointly as a member of industry groups at
non-owned sites, to determine the feasibility of various reme-
dial techniques to address environmental matters. It is our
policy (see Note 1 of Notes to Financial Statements) to record
appropriate liabilities for environmental matters when environ-
mental assessments are made or remedial efforts or damage
claim payments are probable and the costs can be reasonably
estimated. With respect to site contamination, the timing of
these accruals is generally no later than the completion of
feasibility studies. We expect to fund expenditures for these
matters from operating cash flow. The timing of cash expendi-
tures depends on a number of factors, including the timing of
litigation and settlements of personal injury and property dam-
age claims, regulatory approval of cleanup projects, remedial
techniques to be utilized and agreements with other parties.
Remedial response and voluntary cleanup expenditures were
$77, $81 and $82 million in 2003, 2002, and 2001, respectively,
and are currently estimated to be approximately $90 million
in 2004. We expect to fund such expenditures from operating
cash flow.
Remedial response and voluntary cleanup costs charged
against pretax earnings were $235, $60 and $152 million in
2003, 2002 and 2001, respectively. At December 31, 2003 and
2002, the recorded liability for environmental matters was $593
and $435 million, respectively. In addition, in 2003 and 2002 we
incurred operating costs for ongoing businesses of approxi-
mately $80 and $75 million, respectively, relating to
compliance with environmental regulations.
Although we do not currently possess sufficient information to
reasonably estimate the amounts of liabilities to be recorded
upon future completion of studies, litigation or settlements, and
neither the timing nor the amount of the ultimate costs associ-
ated with environmental matters can be determined, they could
be material to our consolidated results of operations or operat-
ing cash flows in the periods recognized or paid. However,
considering our past experience and existing reserves, we do
not expect that environmental matters will have a material
adverse effect on our consolidated financial position.
See Note 3 of Notes to Financial Statements for a discussion of
our legal and environmental charges and Note 21 of Notes to
Financial Statements for a discussion of our commitments and
contingencies, including those related to environmental mat-
ters and toxic tort litigation.
Financial Instruments
As a result of our global operating and financing activities, we
are exposed to market risks from changes in interest and for-
eign currency exchange rates and commodity prices, which
may adversely affect our operating results and financial posi-
tion. We minimize our risks from interest and foreign currency
exchange rate and commodity price fluctuations through our
normal operating and financing activities and, when deemed
appropriate, through the use of derivative financial
instruments. We do not use derivative financial instruments for
trading or other speculative purposes and do not use leveraged
derivative financial instruments. A summary of our accounting
policies for derivative financial instruments is included in Note
1 of Notes to Financial Statements.
We conduct our business on a multinational basis in a wide
variety of foreign currencies. Our exposure to market risk for
changes in foreign currency exchange rates arises from inter-
national financing activities between subsidiaries, foreign
currency denominated monetary assets and liabilities and
anticipated transactions arising from international trade. Our
objective is to preserve the economic value of cash flows in
non-functional currencies. We attempt to have all transaction
exposures hedged with natural offsets to the fullest extent
possible and, once these opportunities have been exhausted,
through foreign currency forward and option agreements
with third parties. Our principal currency exposures relate
to the Euro, the British pound, the Canadian dollar, and the
U.S. dollar.
Our exposure to market risk from changes in interest rates
relates primarily to our debt obligations. As described in Notes
15 and 17 of Notes to Financial Statements, we issue both fixed
and variable rate debt and use interest rate swaps to manage
our exposure to interest rate movements and reduce overall
borrowing costs.
Financial instruments, including derivatives, expose us to
counterparty credit risk for nonperformance and to market risk
related to changes in interest or currency exchange rates. We
manage our exposure to counterparty credit risk through spe-
cific minimum credit standards, diversification of
counterparties, and procedures to monitor concentrations of
credit risk. Our counterparties are substantial investment and
commercial banks with significant experience using such
derivative instruments. We monitor the impact of market risk
on the fair value and cash flows of our derivative and other
financial instruments considering reasonably possible changes
in interest and currency exchange rates and restrict the use of
derivative financial instruments to hedging activities.
The following table illustrates the potential change in fair value
for interest rate sensitive instruments based on a hypothetical
immediate one-percentage-point increase in interest rates
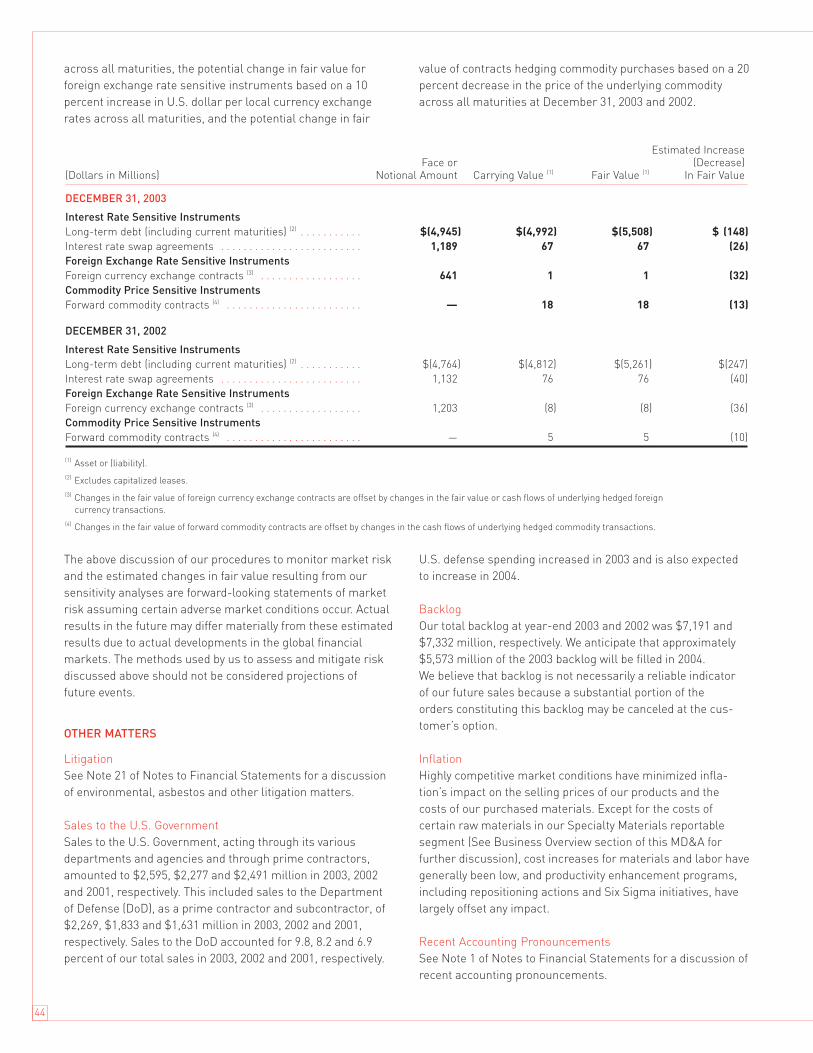
across all maturities, the potential change in fair value for
foreign exchange rate sensitive instruments based on a 10
percent increase in U.S. dollar per local currency exchange
rates across all maturities, and the potential change in fair
value of contracts hedging commodity purchases based on a 20
percent decrease in the price of the underlying commodity
across all maturities at December 31, 2003 and 2002.
44
Estimated IncreaseFace or (Decrease)
(Dollars in Millions) Notional Amount Carrying Value (1) Fair Value (1) In Fair Value
DECEMBER 31, 2003
Interest Rate Sensitive InstrumentsLong-term debt (including current maturities) (2) . . . . . . . . . . . $(4,945) $(4,992) $(5,508) $ (148)Interest rate swap agreements . . . . . . . . . . . . . . . . . . . . . . . . . 1,189 67 67 (26)Foreign Exchange Rate Sensitive InstrumentsForeign currency exchange contracts (3) . . . . . . . . . . . . . . . . . . 641 1 1 (32)Commodity Price Sensitive InstrumentsForward commodity contracts (4) . . . . . . . . . . . . . . . . . . . . . . . . — 18 18 (13)
DECEMBER 31, 2002
Interest Rate Sensitive InstrumentsLong-term debt (including current maturities) (2) . . . . . . . . . . . $(4,764) $(4,812) $(5,261) $(247)
Interest rate swap agreements . . . . . . . . . . . . . . . . . . . . . . . . . 1,132 76 76 (40)
Foreign Exchange Rate Sensitive InstrumentsForeign currency exchange contracts (3) . . . . . . . . . . . . . . . . . . 1,203 (8) (8) (36)
Commodity Price Sensitive InstrumentsForward commodity contracts (4) . . . . . . . . . . . . . . . . . . . . . . . . — 5 5 (10)
(1) Asset or (liability).
(2) Excludes capitalized leases.
(3) Changes in the fair value of foreign currency exchange contracts are offset by changes in the fair value or cash flows of underlying hedged foreign
currency transactions.
(4) Changes in the fair value of forward commodity contracts are offset by changes in the cash flows of underlying hedged commodity transactions.
The above discussion of our procedures to monitor market risk
and the estimated changes in fair value resulting from our
sensitivity analyses are forward-looking statements of market
risk assuming certain adverse market conditions occur. Actual
results in the future may differ materially from these estimated
results due to actual developments in the global financial
markets. The methods used by us to assess and mitigate risk
discussed above should not be considered projections of
future events.
OTHER MATTERS
Litigation
See Note 21 of Notes to Financial Statements for a discussion
of environmental, asbestos and other litigation matters.
Sales to the U.S. Government
Sales to the U.S. Government, acting through its various
departments and agencies and through prime contractors,
amounted to $2,595, $2,277 and $2,491 million in 2003, 2002
and 2001, respectively. This included sales to the Department
of Defense (DoD), as a prime contractor and subcontractor, of
$2,269, $1,833 and $1,631 million in 2003, 2002 and 2001,
respectively. Sales to the DoD accounted for 9.8, 8.2 and 6.9
percent of our total sales in 2003, 2002 and 2001, respectively.
U.S. defense spending increased in 2003 and is also expected
to increase in 2004.
Backlog
Our total backlog at year-end 2003 and 2002 was $7,191 and
$7,332 million, respectively. We anticipate that approximately
$5,573 million of the 2003 backlog will be filled in 2004.
We believe that backlog is not necessarily a reliable indicator
of our future sales because a substantial portion of the
orders constituting this backlog may be canceled at the cus-
tomer’s option.
Inflation
Highly competitive market conditions have minimized infla-
tion’s impact on the selling prices of our products and the
costs of our purchased materials. Except for the costs of
certain raw materials in our Specialty Materials reportable
segment (See Business Overview section of this MD&A for
further discussion), cost increases for materials and labor have
generally been low, and productivity enhancement programs,
including repositioning actions and Six Sigma initiatives, have
largely offset any impact.
Recent Accounting Pronouncements
See Note 1 of Notes to Financial Statements for a discussion of
recent accounting pronouncements.

45
CONSOLIDATED STATEMENT OF OPERATIONS Honeywell International Inc.
Years Ended December 31,
(Dollars in Millions, Except Per Share Amounts) 2003 2002 2001
Net sales . . . . . . . . . . . . . . . . . . . . . . . . . . . . . . . . . . . . . . . . . . . . . . . . . . . . . . . . . . . . . . . . . . $23,103 $22,274 $23,652
Costs, expenses and other
Cost of goods sold . . . . . . . . . . . . . . . . . . . . . . . . . . . . . . . . . . . . . . . . . . . . . . . . . . . . . . . 18,235 17,615 20,125
Selling, general and administrative expenses . . . . . . . . . . . . . . . . . . . . . . . . . . . . . . . . 2,950 2,757 3,064
(Gain) loss on sale of non-strategic businesses . . . . . . . . . . . . . . . . . . . . . . . . . . . . . . . (38) 124 —
Asbestos related litigation charges, net of insurance . . . . . . . . . . . . . . . . . . . . . . . . . . — 1,548 159
Business impairment charges . . . . . . . . . . . . . . . . . . . . . . . . . . . . . . . . . . . . . . . . . . . . . — 877 145
Equity in (income) loss of affiliated companies . . . . . . . . . . . . . . . . . . . . . . . . . . . . . . . (38) (42) 193
Other (income) expense . . . . . . . . . . . . . . . . . . . . . . . . . . . . . . . . . . . . . . . . . . . . . . . . . . 19 (4) (17)
Interest and other financial charges . . . . . . . . . . . . . . . . . . . . . . . . . . . . . . . . . . . . . . . . 335 344 405
21,463 23,219 24,074
Income (loss) before taxes and cumulative effect of accounting change . . . . . . . . . . . . . . 1,640 (945) (422)
Tax expense (benefit) . . . . . . . . . . . . . . . . . . . . . . . . . . . . . . . . . . . . . . . . . . . . . . . . . . . . . . . . 296 (725) (323)
Income (loss) before cumulative effect of accounting change . . . . . . . . . . . . . . . . . . . . . . . 1,344 (220) (99)
Cumulative effect of accounting change . . . . . . . . . . . . . . . . . . . . . . . . . . . . . . . . . . . . . . . . (20) — —
Net income (loss) . . . . . . . . . . . . . . . . . . . . . . . . . . . . . . . . . . . . . . . . . . . . . . . . . . . . . . . . . . . $ 1,324 $ (220) $ (99)
Earnings (loss) per share of common stock—basic:
Income (loss) before cumulative effect of accounting change . . . . . . . . . . . . . . . . . . . $ 1.56 $ (0.27) $ (0.12)
Cumulative effect of accounting change . . . . . . . . . . . . . . . . . . . . . . . . . . . . . . . . . . . . . (.02) — —
Net income (loss) . . . . . . . . . . . . . . . . . . . . . . . . . . . . . . . . . . . . . . . . . . . . . . . . . . . . . . . $ 1.54 $ (0.27) $ (0.12)
Earnings (loss) per share of common stock—assuming dilution:
Income (loss) before cumulative effect of accounting change . . . . . . . . . . . . . . . . . . . $ 1.56 $ (0.27) $ (0.12)
Cumulative effect of accounting change . . . . . . . . . . . . . . . . . . . . . . . . . . . . . . . . . . . . . (.02) — —
Net income (loss) . . . . . . . . . . . . . . . . . . . . . . . . . . . . . . . . . . . . . . . . . . . . . . . . . . . . . . . $ 1.54 $ (0.27) $ (0.12)
The Notes to Financial Statements are an integral part of this statement.
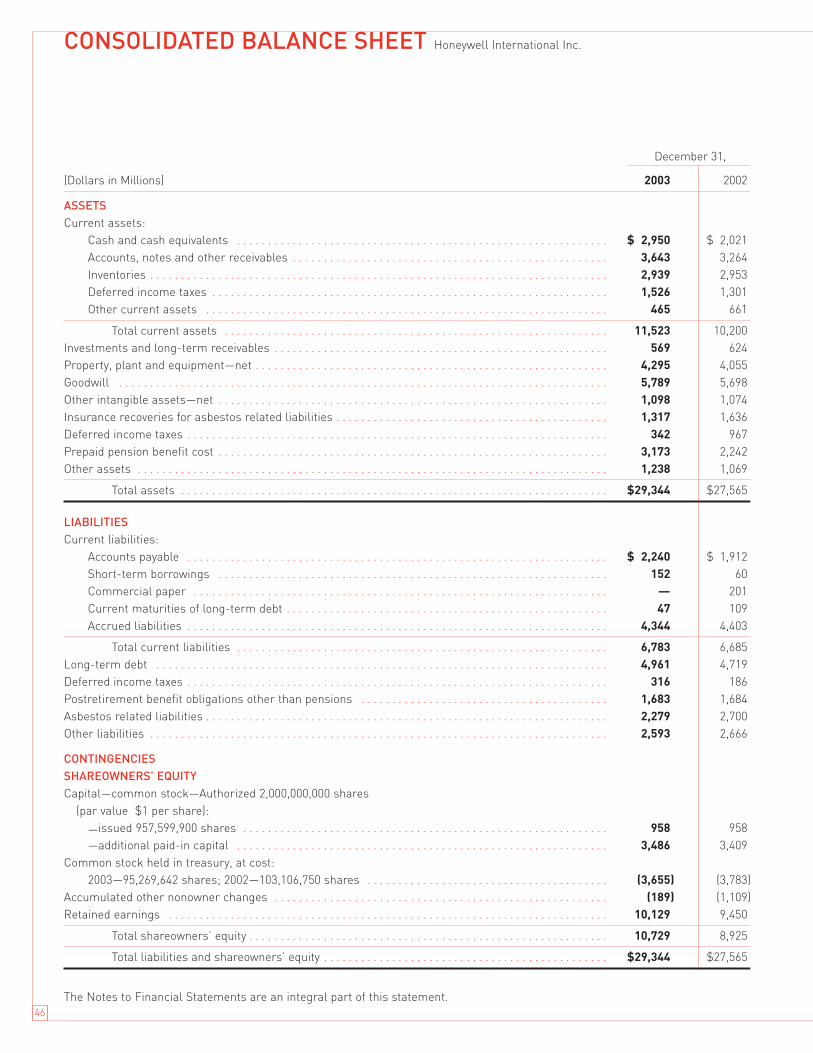
46
CONSOLIDATED BALANCE SHEET Honeywell International Inc.
December 31,
(Dollars in Millions) 2003 2002
ASSETSCurrent assets:
Cash and cash equivalents . . . . . . . . . . . . . . . . . . . . . . . . . . . . . . . . . . . . . . . . . . . . . . . . . . . . . . . . . . . . $ 2,950 $ 2,021
Accounts, notes and other receivables . . . . . . . . . . . . . . . . . . . . . . . . . . . . . . . . . . . . . . . . . . . . . . . . . . . 3,643 3,264
Inventories . . . . . . . . . . . . . . . . . . . . . . . . . . . . . . . . . . . . . . . . . . . . . . . . . . . . . . . . . . . . . . . . . . . . . . . . . . 2,939 2,953
Deferred income taxes . . . . . . . . . . . . . . . . . . . . . . . . . . . . . . . . . . . . . . . . . . . . . . . . . . . . . . . . . . . . . . . . 1,526 1,301
Other current assets . . . . . . . . . . . . . . . . . . . . . . . . . . . . . . . . . . . . . . . . . . . . . . . . . . . . . . . . . . . . . . . . . 465 661
Total current assets . . . . . . . . . . . . . . . . . . . . . . . . . . . . . . . . . . . . . . . . . . . . . . . . . . . . . . . . . . . . . . 11,523 10,200
Investments and long-term receivables . . . . . . . . . . . . . . . . . . . . . . . . . . . . . . . . . . . . . . . . . . . . . . . . . . . . . . 569 624
Property, plant and equipment—net . . . . . . . . . . . . . . . . . . . . . . . . . . . . . . . . . . . . . . . . . . . . . . . . . . . . . . . . . 4,295 4,055
Goodwill . . . . . . . . . . . . . . . . . . . . . . . . . . . . . . . . . . . . . . . . . . . . . . . . . . . . . . . . . . . . . . . . . . . . . . . . . . . . . . . 5,789 5,698
Other intangible assets—net . . . . . . . . . . . . . . . . . . . . . . . . . . . . . . . . . . . . . . . . . . . . . . . . . . . . . . . . . . . . . . . 1,098 1,074
Insurance recoveries for asbestos related liabilities . . . . . . . . . . . . . . . . . . . . . . . . . . . . . . . . . . . . . . . . . . . . 1,317 1,636
Deferred income taxes . . . . . . . . . . . . . . . . . . . . . . . . . . . . . . . . . . . . . . . . . . . . . . . . . . . . . . . . . . . . . . . . . . . . 342 967
Prepaid pension benefit cost . . . . . . . . . . . . . . . . . . . . . . . . . . . . . . . . . . . . . . . . . . . . . . . . . . . . . . . . . . . . . . . 3,173 2,242
Other assets . . . . . . . . . . . . . . . . . . . . . . . . . . . . . . . . . . . . . . . . . . . . . . . . . . . . . . . . . . . . . . . . . . . . . . . . . . . . 1,238 1,069
Total assets . . . . . . . . . . . . . . . . . . . . . . . . . . . . . . . . . . . . . . . . . . . . . . . . . . . . . . . . . . . . . . . . . . . . . $29,344 $27,565
LIABILITIESCurrent liabilities:
Accounts payable . . . . . . . . . . . . . . . . . . . . . . . . . . . . . . . . . . . . . . . . . . . . . . . . . . . . . . . . . . . . . . . . . . . . $ 2,240 $ 1,912
Short-term borrowings . . . . . . . . . . . . . . . . . . . . . . . . . . . . . . . . . . . . . . . . . . . . . . . . . . . . . . . . . . . . . . . 152 60
Commercial paper . . . . . . . . . . . . . . . . . . . . . . . . . . . . . . . . . . . . . . . . . . . . . . . . . . . . . . . . . . . . . . . . . . . — 201
Current maturities of long-term debt . . . . . . . . . . . . . . . . . . . . . . . . . . . . . . . . . . . . . . . . . . . . . . . . . . . . 47 109
Accrued liabilities . . . . . . . . . . . . . . . . . . . . . . . . . . . . . . . . . . . . . . . . . . . . . . . . . . . . . . . . . . . . . . . . . . . . 4,344 4,403
Total current liabilities . . . . . . . . . . . . . . . . . . . . . . . . . . . . . . . . . . . . . . . . . . . . . . . . . . . . . . . . . . . . 6,783 6,685
Long-term debt . . . . . . . . . . . . . . . . . . . . . . . . . . . . . . . . . . . . . . . . . . . . . . . . . . . . . . . . . . . . . . . . . . . . . . . . . 4,961 4,719
Deferred income taxes . . . . . . . . . . . . . . . . . . . . . . . . . . . . . . . . . . . . . . . . . . . . . . . . . . . . . . . . . . . . . . . . . . . . 316 186
Postretirement benefit obligations other than pensions . . . . . . . . . . . . . . . . . . . . . . . . . . . . . . . . . . . . . . . . 1,683 1,684
Asbestos related liabilities . . . . . . . . . . . . . . . . . . . . . . . . . . . . . . . . . . . . . . . . . . . . . . . . . . . . . . . . . . . . . . . . . 2,279 2,700
Other liabilities . . . . . . . . . . . . . . . . . . . . . . . . . . . . . . . . . . . . . . . . . . . . . . . . . . . . . . . . . . . . . . . . . . . . . . . . . . 2,593 2,666
CONTINGENCIES SHAREOWNERS’ EQUITYCapital—common stock—Authorized 2,000,000,000 shares
(par value $1 per share):
—issued 957,599,900 shares . . . . . . . . . . . . . . . . . . . . . . . . . . . . . . . . . . . . . . . . . . . . . . . . . . . . . . . . . . . 958 958
—additional paid-in capital . . . . . . . . . . . . . . . . . . . . . . . . . . . . . . . . . . . . . . . . . . . . . . . . . . . . . . . . . . . . 3,486 3,409
Common stock held in treasury, at cost:
2003—95,269,642 shares; 2002—103,106,750 shares . . . . . . . . . . . . . . . . . . . . . . . . . . . . . . . . . . . . . . . (3,655) (3,783)
Accumulated other nonowner changes . . . . . . . . . . . . . . . . . . . . . . . . . . . . . . . . . . . . . . . . . . . . . . . . . . . . . . (189) (1,109)
Retained earnings . . . . . . . . . . . . . . . . . . . . . . . . . . . . . . . . . . . . . . . . . . . . . . . . . . . . . . . . . . . . . . . . . . . . . . . 10,129 9,450
Total shareowners’ equity . . . . . . . . . . . . . . . . . . . . . . . . . . . . . . . . . . . . . . . . . . . . . . . . . . . . . . . . . . 10,729 8,925
Total liabilities and shareowners’ equity . . . . . . . . . . . . . . . . . . . . . . . . . . . . . . . . . . . . . . . . . . . . . . $29,344 $27,565
The Notes to Financial Statements are an integral part of this statement.

47
CONSOLIDATED STATEMENT OF CASH FLOWS Honeywell International Inc.
Years Ended December 31,
(Dollars in Millions) 2003 2002 2001
CASH FLOWS FROM OPERATING ACTIVITIESNet income (loss) . . . . . . . . . . . . . . . . . . . . . . . . . . . . . . . . . . . . . . . . . . . . . . . . . . . . . . . $1,324 $ (220) $ (99)
Adjustments to reconcile net income (loss) to net cash provided by operating activities:
Cumulative effect of accounting change . . . . . . . . . . . . . . . . . . . . . . . . . . . . . . . . . 20 — —
(Gain) loss on sale of non-strategic businesses . . . . . . . . . . . . . . . . . . . . . . . . . . . (38) 124 —
Repositioning and other charges . . . . . . . . . . . . . . . . . . . . . . . . . . . . . . . . . . . . . . . 278 634 2,491
Severance and exit cost payments . . . . . . . . . . . . . . . . . . . . . . . . . . . . . . . . . . . . . . (200) (447) (422)
Environmental and non-asbestos litigation payments . . . . . . . . . . . . . . . . . . . . . . (91) (313) (380)
Business impairment charges . . . . . . . . . . . . . . . . . . . . . . . . . . . . . . . . . . . . . . . . . — 877 145
Asbestos related litigation charges, net of insurance . . . . . . . . . . . . . . . . . . . . . . — 1,548 159
Asbestos related liability payments . . . . . . . . . . . . . . . . . . . . . . . . . . . . . . . . . . . . . (557) (135) (176)
Insurance receipts for asbestos related liabilities . . . . . . . . . . . . . . . . . . . . . . . . . 664 76 50
Depreciation . . . . . . . . . . . . . . . . . . . . . . . . . . . . . . . . . . . . . . . . . . . . . . . . . . . . . . . . 595 671 724
Goodwill and indefinite-lived intangible asset amortization . . . . . . . . . . . . . . . . . — — 204
Undistributed earnings of equity affiliates . . . . . . . . . . . . . . . . . . . . . . . . . . . . . . . (38) (55) (1)
Deferred income taxes . . . . . . . . . . . . . . . . . . . . . . . . . . . . . . . . . . . . . . . . . . . . . . . 344 (775) (447)
Net taxes paid on sales of businesses . . . . . . . . . . . . . . . . . . . . . . . . . . . . . . . . . . — — (42)
Pension and other postretirement benefits expense (income) . . . . . . . . . . . . . . . 325 (11) (165)
Pension contributions—U.S. plans . . . . . . . . . . . . . . . . . . . . . . . . . . . . . . . . . . . . . (670) (130) —
Other postretirement benefit payments . . . . . . . . . . . . . . . . . . . . . . . . . . . . . . . . . (203) (199) (169)
Other . . . . . . . . . . . . . . . . . . . . . . . . . . . . . . . . . . . . . . . . . . . . . . . . . . . . . . . . . . . . . . 50 (74) (233)
Changes in assets and liabilities, net of the effects of acquisitions and divestitures:
Accounts, notes and other receivables . . . . . . . . . . . . . . . . . . . . . . . . . . . . . . (236) 105 601
Inventories . . . . . . . . . . . . . . . . . . . . . . . . . . . . . . . . . . . . . . . . . . . . . . . . . . . . . 118 333 168
Other current assets . . . . . . . . . . . . . . . . . . . . . . . . . . . . . . . . . . . . . . . . . . . . . (20) 51 51
Accounts payable . . . . . . . . . . . . . . . . . . . . . . . . . . . . . . . . . . . . . . . . . . . . . . . . 240 63 (400)
Accrued liabilities . . . . . . . . . . . . . . . . . . . . . . . . . . . . . . . . . . . . . . . . . . . . . . . 294 257 (63)
Net cash provided by operating activities . . . . . . . . . . . . . . . . . . . . . . . . 2,199 2,380 1,996
CASH FLOWS FROM INVESTING ACTIVITIESExpenditures for property, plant and equipment . . . . . . . . . . . . . . . . . . . . . . . . . . . . . . (655) (671) (876)
Proceeds from disposals of property, plant and equipment . . . . . . . . . . . . . . . . . . . . . 37 41 46
Decrease in investments . . . . . . . . . . . . . . . . . . . . . . . . . . . . . . . . . . . . . . . . . . . . . . . . . — 91 —
Cash paid for acquisitions . . . . . . . . . . . . . . . . . . . . . . . . . . . . . . . . . . . . . . . . . . . . . . . . (199) (520) (122)
Proceeds from sales of businesses . . . . . . . . . . . . . . . . . . . . . . . . . . . . . . . . . . . . . . . . . 137 183 44
Decrease in short-term investments . . . . . . . . . . . . . . . . . . . . . . . . . . . . . . . . . . . . . . . — 6 2
Net cash (used for) investing activities . . . . . . . . . . . . . . . . . . . . . . . . . . (680) (870) (906)
CASH FLOWS FROM FINANCING ACTIVITIESNet (decrease) increase in commercial paper . . . . . . . . . . . . . . . . . . . . . . . . . . . . . . . . (201) 198 (1,189)
Net increase (decrease) in short-term borrowings . . . . . . . . . . . . . . . . . . . . . . . . . . . . 81 (96) 18
Proceeds from issuance of common stock . . . . . . . . . . . . . . . . . . . . . . . . . . . . . . . . . . . 54 41 79
Proceeds from issuance of long-term debt . . . . . . . . . . . . . . . . . . . . . . . . . . . . . . . . . . — 6 1,237
Payments of long-term debt . . . . . . . . . . . . . . . . . . . . . . . . . . . . . . . . . . . . . . . . . . . . . . (147) (428) (390)
Repurchases of common stock . . . . . . . . . . . . . . . . . . . . . . . . . . . . . . . . . . . . . . . . . . . . (37) — (30)
Cash dividends on common stock . . . . . . . . . . . . . . . . . . . . . . . . . . . . . . . . . . . . . . . . . . (645) (614) (609)
Other . . . . . . . . . . . . . . . . . . . . . . . . . . . . . . . . . . . . . . . . . . . . . . . . . . . . . . . . . . . . . . . . . — (39) —
Net cash (used for) financing activities . . . . . . . . . . . . . . . . . . . . . . . . . . (895) (932) (884)
Effect of foreign exchange rate changes on cash and cash equivalents . . . . . . . . . . . . . . . 305 50 (9)
Net increase in cash and cash equivalents . . . . . . . . . . . . . . . . . . . . . . . . . . . . . . . . . . . . . . 929 628 197
Cash and cash equivalents at beginning of year . . . . . . . . . . . . . . . . . . . . . . . . . . . . . . . . . . 2,021 1,393 1,196
Cash and cash equivalents at end of year . . . . . . . . . . . . . . . . . . . . . . . . . . . . . . . . . . . . . . . $2,950 $2,021 $1,393
The Notes to Financial Statements are an integral part of this statement.

48
CONSOLIDATED STATEMENT OF SHAREOWNERS’ EQUITYHoneywell International Inc.
AccumulatedCommon Additional Common Stock Other Total
Stock Issued Paid-in Held in Treasury Nonowner Retained Shareowners’_________________ ___________________
(In Millions, Except Per Share Amounts) Shares Amount Capital Shares Amount Changes Earnings Equity
Balance at December 31, 2000 . . . 957.6 $ 958 $ 2,782 (150.3) $ (4,296) $ (729) $ 10,992 $ 9,707
Net loss . . . . . . . . . . . . . . . . . . . . . (99) (99)
Foreign exchange translationadjustments . . . . . . . . . . . . . . . (51) (51)
Minimum pension liabilityadjustment . . . . . . . . . . . . . . . . (47) (47)
Unrealized holding loss onmarketable securities . . . . . . . (3) (3)
Change in fair value of effectivecash flow hedges . . . . . . . . . . . (5) (5)
Nonowner changes in shareowners’ equity . . . . . . . . . (205)
Common stock issued for employee savings and option plans (including related tax benefits of $38) . . . 225 8.1 71 296
Repurchases of common stock . . (0.8) (30) (30)
Cash dividends on common stock ($.75 per share) . . . . . . . (609) (609)
Other owner changes . . . . . . . . . . 8 0.4 3 11
Balance at December 31, 2001 . . . 957.6 958 3,015 (142.6) (4,252) (835) 10,284 9,170
Net loss . . . . . . . . . . . . . . . . . . . . . (220) (220)
Foreign exchange translationadjustments . . . . . . . . . . . . . . . 310 310
Minimum pension liabilityadjustment . . . . . . . . . . . . . . . . (606) (606)
Change in fair value of effectivecash flow hedges . . . . . . . . . . . 22 22
Nonowner changes in shareowners’ equity . . . . . . . . . (494)
Common stock issued for employee savings and option plans (including related tax expense of $28) . . . 138 7.7 54 192
Common stock contributed topension plans . . . . . . . . . . . . . . 286 31.5 414 700
Cash dividends on common stock ($.75 per share) . . . . . . . (614) (614)
Other owner changes . . . . . . . . . . (30) .3 1 (29)
Balance at December 31, 2002 . . . 957.6 958 3,409 (103.1) (3,783) (1,109) 9,450 8,925
Net income . . . . . . . . . . . . . . . . . . . 1,324 1,324Foreign exchange translation
adjustments . . . . . . . . . . . . . . . 551 551Minimum pension liability
adjustment . . . . . . . . . . . . . . . . 369 369Change in fair value of effective
cash flow hedges . . . . . . . . . . . — —
Nonowner changes in shareowners’ equity . . . . . . . . . 2,244
Common stock issued foremployee savings and option plans (including related tax benefits of $19) . . . . . . . . . 75 9.3 182 257
Repurchases of common stock . . (1.9) (62) (62)Cash dividends on common
stock ($.75 per share) . . . . . . . (645) (645)Other owner changes . . . . . . . . . . 2 .4 8 10
BALANCE AT DECEMBER 31, 2003 957.6 $958 $3,486 (95.3) $(3,655) $(189) $10,129 $10,729
The Notes to Financial Statements are an integral part of this statement.

49
NOTE 1—SUMMARY OF SIGNIFICANT ACCOUNTINGPOLICIES
Honeywell International Inc. is a diversified technology and
manufacturing company, serving customers worldwide with
aerospace products and services, control, sensing and security
technologies for buildings, homes and industry, turbochargers,
automotive products, specialty chemicals, fibers, and electronic
and advanced materials. The following is a description of the
significant accounting policies of Honeywell International Inc.
Principles of Consolidation
The consolidated financial statements include the accounts of
Honeywell International Inc. and all of its subsidiaries and
entities in which a controlling interest is maintained. Our con-
solidation policy requires the consolidation of entities where a
controlling financial interest is obtained as well as consolida-
tion of variable interest entities in which we are designated as
the primary beneficiary in accordance with Financial
Accounting Standards Board (FASB) Interpretation No. 46,
“Consolidation of Variable Interest Entities” (FIN 46), as
amended. See Recent Accounting Pronouncements in this Note
for further discussion of FIN 46. All intercompany transactions
and balances are eliminated in consolidation.
Cash and Cash Equivalents
Cash and cash equivalents include cash on hand and on
deposit and highly liquid, temporary cash investments with an
original maturity of three months or less.
Inventories
Inventories are valued at the lower of cost or market using the
first-in, first-out or the average cost method and the last-in, first-
out (LIFO) method for certain qualifying domestic inventories.
Investments
Investments in affiliates over which we have a significant influ-
ence, but not a controlling interest, are accounted for using the
equity method of accounting. Other investments are carried at
market value, if readily determinable, or cost. All equity
investments are periodically reviewed to determine if declines
in fair value below cost basis are other-than-temporary.
Significant and sustained decreases in quoted market prices
and a series of historic and projected operating losses by
investees are considered in the review. If the decline in fair
value is determined to be other-than-temporary, an impair-
ment loss is recorded and the investment is written down to a
new carrying value.
Property, Plant and Equipment
Property, plant and equipment are recorded at cost less accu-
mulated depreciation. For financial reporting, the straight-line
method of depreciation is used over the estimated useful lives
of 10 to 40 years for buildings and improvements and 3 to 15
years for machinery and equipment.
Goodwill and Indefinite-Lived Intangible Assets
Goodwill represents the excess of acquisition costs over the fair
value of net assets of businesses acquired and, prior to
January 1, 2002, was amortized on a straight-line basis over
appropriate periods up to 40 years. Effective January 1, 2002,
we adopted Statement of Financial Accounting Standards
No. 142, “Goodwill and Other Intangible Assets” (SFAS No.
142). SFAS No. 142 requires that goodwill and certain other
intangible assets having indefinite lives no longer be amortized
to income, but instead be replaced with periodic testing for
impairment. Intangible assets determined to have definite lives
will continue to be amortized over their useful lives. With the
adoption of SFAS No. 142, we reassessed the useful lives and
residual values of all acquired intangible assets to make any
necessary amortization period adjustments. Based on that
assessment, an amount related to a trademark in our automo-
tive consumer products business was determined to be an
indefinite-lived intangible asset because it is expected to gen-
erate cash flows indefinitely. There were no other adjustments
made to the amortization period or residual values of other
intangible assets. We also completed our goodwill impairment
testing during the three months ended March 31, 2002 and
determined that there was no impairment as of January 1,
2002. This initial impairment assessment was updated as of
March 31, 2003 and no impairment was determined. Future
impairment tests for our reporting units will be performed
annually as of March 31 or when events or changes in circum-
stances occur. See Note 13 for additional details.
Other Intangible Assets with Determinable Lives
Other intangible assets with determinable lives are amortized
on a straight-line basis over the expected period benefited by
future cash inflows up to 25 years.
NOTES TO FINANCIAL STATEMENTS Honeywell International Inc.

Long-Lived Assets
We periodically evaluate the recoverability of the carrying
amount of long-lived assets (including property, plant and
equipment, and intangible assets with determinable lives)
whenever events or changes in circumstances indicate that the
carrying amount of an asset may not be fully recoverable. We
evaluate events or changes in circumstances based on a num-
ber of factors including operating results, business plans and
forecasts, general and industry trends and, economic projec-
tions and anticipated cash flows. An impairment is assessed
when the undiscounted expected future cash flows derived
from an asset are less than its carrying amount. Impairment
losses are measured as the amount by which the carrying
value of an asset exceeds its fair value and are recognized in
earnings. We also continually evaluate the estimated useful
lives of all long-lived assets and periodically revise such esti-
mates based on current events.
Sales Recognition
Product and service sales are recognized when persuasive evi-
dence of an arrangement exists, product delivery has occurred
or services have been rendered, pricing is fixed or deter-
minable, and collection is reasonably assured. Sales under
long-term contracts in the Aerospace and Automation and
Control Solutions reportable segments are recorded on a per-
centage-of-completion method measured on the cost-to-cost
basis for engineering-type contracts and the units-of-delivery
basis for production-type contracts. Provisions for anticipated
losses on long-term contracts are recorded in full when such
losses become evident. Revenues from contracts with multiple
element arrangements are recognized as each element is
earned based on the relative fair value of each element and
when the delivered elements have value to customers on a
standalone basis. Amounts allocated to each element are
based on its objectively determined fair value, such as the
sales price for the product or service when it is sold separately
or competitor prices for similar products or services.
Aerospace Customer Incentives
We offer sales incentives to commercial aircraft manufactur-
ers and airlines in connection with their selection of our prod-
ucts for installation on commercial aircraft. These incentives
may consist of free products, credits, discounts or upfront
cash payments. The cost of these incentives is recognized in
the period incurred unless the incentive is subject to recovery
through a long-term product maintenance requirement man-
dated by the Federal Aviation Administration for certified
replacement equipment and service. Amounts capitalized at
December 31, 2003 and 2002 were $719 and $662 million,
respectively, and are being recognized over the estimated min-
imum service life of the aircraft (up to 25 years) as a reduction
in future sales or an increase in cost of goods sold based on
the type of incentive granted. We routinely evaluate the recov-
erability of capitalized amounts based on forecasted replace-
ment equipment sales over the estimated minimum life of the
aircraft considering estimated aircraft flight hours, number of
landings, as well as actual aircraft retirements. See Note 13
for additional details.
Environmental Expenditures
Environmental expenditures that relate to current operations
are expensed or capitalized as appropriate. Expenditures that
relate to an existing condition caused by past operations, and
that do not provide future benefits, are expensed as incurred.
Liabilities are recorded when environmental assessments are
made or remedial efforts are probable and the costs can be
reasonably estimated. The timing of these accruals is general-
ly no later than the completion of feasibility studies. The
undiscounted liabilities for environmental costs recorded in
Accrued Liabilities and Other Liabilities at December 31, 2003
were $90 and $503 million, respectively, and at December 31,
2002 were $75 and $360 million, respectively.
Asbestos Related Contingencies and Insurance Recoveries
Honeywell is a defendant in personal injury actions related to
asbestos containing products (refractory products and friction
products). We recognize a liability for any asbestos related
contingency that is probable of occurrence and reasonably
estimable. Regarding North American Refractories Company
(NARCO) asbestos related claims, we accrue for pending claims
based on terms and conditions, including evidentiary require-
ments, in definitive agreements or agreements in principle with
current claimants. We also accrued for the probable value of
future asbestos related claims through 2018 based on the dis-
ease criteria and payment values contained in the NARCO trust
as described in Note 21. In light of the inherent uncertainties in
making long term projections regarding claims filing rates and
disease manifestation, we do not believe that we have a reason-
able basis for estimating asbestos claims beyond 2018 under
Statement of Financial Accounting Standards No. 5, “Accounting
for Contingencies” (SFAS No. 5). Regarding Bendix asbestos
related claims, we accrue for the estimated value of pending
claims based on expected claim resolution values and
dismissal rates. We have not accrued for future Bendix
asbestos related claims as we cannot reasonably predict how
many additional claims may be brought against us, the allega-
tions in such claims or their probable outcomes and resulting
settlement values in the tort system. We continually assess the
likelihood of any adverse judgments or outcomes to our contin-
gencies, as well as potential ranges of probable losses and
recognize a liability, if any, for these contingencies based on a
careful analysis of each individual issue with the assistance of
outside legal counsel and, if applicable, other experts.
In connection with the recognition of liabilities for asbestos
related matters, we record asbestos related insurance recov-
eries that are deemed probable. In assessing the probability of
insurance recovery, we make judgments concerning insurance
coverage that we believe are reasonable and consistent with
50

51
our historical dealings with our insurers, our knowledge of any
pertinent solvency issues surrounding insurers and various
judicial determinations relevant to our insurance programs.
Research and Development
Research and development costs for company-sponsored
research and development projects are expensed as incurred.
Such costs are classified as part of Cost of Goods Sold
and were $751, $757 and $832 million in 2003, 2002 and
2001, respectively.
Stock-Based Compensation Plans
We account for our fixed stock option plans under Accounting
Principles Board Opinion No. 25, “Accounting for Stock Issued
to Employees” (APB No. 25). Under APB No. 25, there is no
compensation cost recognized for our fixed stock option plans,
because the options granted under these plans have an exer-
cise price equal to the market value of the underlying stock at
the grant date. Statement of Financial Accounting Standards
No. 123, “Accounting for Stock-Based Compensation” (SFAS
No. 123) allows, but does not require, companies to record
compensation cost for fixed stock option plans using a fair
value based method. As permitted by SFAS No. 123, we elect-
ed to continue to account for compensation cost for our fixed
stock option plans using the intrinsic value based method
under APB No. 25. The following table sets forth pro forma
information as if compensation cost had been determined
consistent with the requirements of SFAS No. 123.
(Dollars in Millions, Except Per Share Amounts) 2003 2002 2001
Net income (loss), as reported . . . . . $1,324 $ (220) $ (99)
Deduct: Total stock-based employee
compensation cost determined
under fair value method for fixed
stock option plans, net of
related tax effects . . . . . . . . . . . . . (48) (64) (85)
Pro forma net income (loss) . . . . . . . $1,276 $ (284) $ (184)
Earnings (loss) per share of
common stock:
Basic—as reported . . . . . . . . . . $ 1.54 $ (0.27) $ (0.12)
Basic—pro forma . . . . . . . . . . . $ 1.48 $ (0.35) $ (0.23)
Earnings (loss) per share of
common stock:
Assuming dilution
—as reported . . . . . . . . . . . . . . . $ 1.54 $ (0.27) $ (0.12)
Assuming dilution—pro forma . $ 1.48 $ (0.35) $ (0.23)
The following table sets forth fair value per share information,
including related assumptions, used to determine compensa-
tion cost consistent with the requirements of SFAS No. 123.
2003 2002 2001
Weighted average fair value per
share of options granted during
the year (1) . . . . . . . . . . . . . . . . . . . $8.82 $12.64 $13.71
Assumptions:
Historical dividend yield . . . . . . 2.0% 1.9% 1.5%
Historical volatility . . . . . . . . . . . 46.7% 43.8% 40.9%
Risk-free rate of return . . . . . . . 2.9% 4.2% 5.2%
Expected life (years) . . . . . . . . . . 5.0 5.0 5.0
(1) Estimated on date of grant using Black-Scholes option-pricing model.
Foreign Currency Translation
Assets and liabilities of subsidiaries operating outside the
United States with a functional currency other than U.S. dol-
lars are translated into U.S. dollars using year-end exchange
rates. Sales, costs and expenses are translated at the average
exchange rates effective during the year. Foreign currency
translation gains and losses are included as a component of
Accumulated Other Nonowner Changes. For subsidiaries oper-
ating in highly inflationary environments, inventories and
property, plant and equipment, including related expenses, are
remeasured at the exchange rate in effect on the date the
assets were acquired, while monetary assets and liabilities are
remeasured at year-end exchange rates. Remeasurement
adjustments for these subsidiaries are included in earnings.
Derivative Financial Instruments
Derivative financial instruments are accounted for under
Statement of Financial Accounting Standards No. 133,
“Accounting for Derivative Instruments and Hedging Activities”,
as amended (SFAS No. 133). Under SFAS No. 133, all deriva-
tives are recorded on the balance sheet as assets or liabilities
and measured at fair value. For derivatives designated as
hedges of the fair value of assets or liabilities, the changes in
fair values of both the derivatives and the hedged items are
recorded in current earnings. For derivatives designated as
cash flow hedges, the effective portion of the changes in fair
value of the derivatives are recorded in Accumulated Other
Nonowner Changes and subsequently recognized in earnings
when the hedged items impact income. Changes in the fair
value of derivatives not designated as hedges and the
ineffective portion of cash flow hedges are recorded in
current earnings.
Transfers of Financial Instruments
Sales, transfers and securitization of financial instruments are
accounted for under Statement of Financial Accounting
Standards No. 140, “Accounting for Transfers and Servicing of
Financial Assets and Extinguishments of Liabilities”. We sell
interests in designated pools of trade accounts receivables to
third parties. The receivables are removed from the
Consolidated Balance Sheet at the time they are sold. The
value assigned to our subordinated interests and undivided
interests retained in trade receivables sold is based on the

relative fair values of the interests retained and sold. The
carrying value of the retained interests approximates fair value
due to the short-term nature of the collection period for
the receivables.
Income Taxes
Deferred tax liabilities or assets reflect temporary differences
between amounts of assets and liabilities for financial and tax
reporting. Such amounts are adjusted, as appropriate, to
reflect changes in tax rates expected to be in effect when the
temporary differences reverse. A valuation allowance is estab-
lished to offset any deferred tax assets if, based upon the
available evidence, it is more likely than not that some or all of
the deferred tax assets will not be realized.
Earnings Per Share
Basic earnings per share is based on the weighted average
number of common shares outstanding. Diluted earnings per
share is based on the weighted average number of common
shares outstanding and all dilutive potential common
shares outstanding.
Use of Estimates
The preparation of consolidated financial statements in con-
formity with generally accepted accounting principles requires
management to make estimates and assumptions that affect
the reported amounts in the financial statements and related
disclosures in the accompanying notes. Actual results could
differ from those estimates. Estimates and assumptions are
periodically reviewed and the effects of revisions are reflected
in the consolidated financial statements in the period they are
determined to be necessary.
Reclassifications
Certain prior year amounts have been reclassified to conform
with the current year presentation.
Recent Accounting Pronouncements
In December 2003, the FASB issued Statement of Financial
Accounting Standards No. 132 (Revised 2003), “Employers’
Disclosures about Pensions and Other Postretirement
Benefits, an amendment of FASB Statements No. 87, 88, and
106” (SFAS No. 132-Revised 2003) which revises employers’
disclosures about pension plans and other postretirement
benefit plans. The provisions of this statement are effective for
the year ended December 31, 2003, except for disclosures of
certain information about foreign plans and estimated future
benefit payments. See Note 22 for further information.
In January 2003, the FASB issued FIN 46, which provides guid-
ance on consolidation of variable interest entities. In December
2003, the FASB deferred the effective date of FIN 46 for certain
variable interest entities (i.e., non-special purpose entities)
until the first interim or annual period ending after March 31,
2004. The partial adoption of the provisions of FIN 46 did not
have a material effect on our consolidated results of operations
or financial position in 2003 and we do not expect that the full
adoption of the provisions of FIN 46 will have a material effect
on our consolidated results of operations or financial position.
In November 2002, the FASB issued FASB Interpretation
No. 45, “Guarantor’s Accounting and Disclosure Requirements
for Guarantees, Including Indirect Guarantees of Indebtedness
of Others” (FIN 45), which requires us to recognize a liability for
the fair value of an obligation assumed by issuing a guarantee.
FIN 45 was effective for guarantees issued or modified on or
after January 1, 2003. The adoption of FIN 45 did not have a
material effect on our consolidated results of operations or
financial position. See Note 21 for further information.
In November 2002, the Emerging Issues Task Force (EITF)
reached a consensus on EITF Issue No. 00-21, “Accounting for
Revenue Arrangements with Multiple Deliverables”. EITF Issue
No. 00-21 provides guidance on when and how to separate
elements of an arrangement that may involve the delivery or
performance of multiple products, services and rights to use
assets into separate units of accounting. The guidance in the
consensus was effective for revenue arrangements entered
into in fiscal periods beginning after June 15, 2003. We adopted
EITF Issue No. 00-21 prospectively in the quarter beginning
July 1, 2003. The adoption of EITF Issue No. 00-21 did not have
a material effect on our consolidated results of operations or
financial position.
In June 2002, the FASB issued Statement of Financial
Accounting Standards No. 146, “Accounting for Costs
Associated with Exit or Disposal Activities” (SFAS No. 146), the
provisions of which were effective for any exit or disposal activi-
ties initiated by us after December 31, 2002. SFAS No. 146
provides guidance on the recognition and measurement of
liabilities associated with exit or disposal activities and requires
that such liabilities be recognized when incurred. The adoption
of the provisions of SFAS No. 146 impacted the measurement
and timing of costs associated with any exit or disposal activi-
ties initiated after December 31, 2002.
In June 2001, the FASB issued Statement of Financial
Accounting Standards No. 143, “Accounting for Asset
Retirement Obligations” (SFAS No. 143) which requires recog-
nition of the fair value of obligations associated with the
retirement of tangible long-lived assets when there is a legal
obligation to incur such costs. Upon initial recognition of a
liability the cost is capitalized as part of the related long-lived
asset and depreciated over the corresponding asset’s useful
life. SFAS No. 143 primarily impacts our accounting for costs
associated with the future retirement of nuclear fuel conver-
sion facilities in our Specialty Materials reportable segment.
Upon adoption on January 1, 2003, we recorded an increase in
property, plant and equipment, net of $16 million and recog-
nized an asset retirement obligation of $47 million. This
52

53
resulted in the recognition of a non-cash charge of $31 million
($20 million after-tax, or $0.02 per share) that is reported as a
cumulative effect of an accounting change. This accounting
change did not have a material impact on results of operations
for 2003. Pro forma effects for 2002 and 2001 assuming adop-
tion of SFAS No. 143 as of January 1, 2001, were not material to
net income or per share amounts.
NOTE 2—ACQUISITIONS
We acquired businesses for an aggregate cost of $199, $520
and $122 million in 2003, 2002 and 2001, respectively. All our
acquisitions were accounted for under the purchase method of
accounting, and accordingly, the assets and liabilities of the
acquired businesses were recorded at their estimated fair
values at the dates of acquisition. Significant acquisitions made
in these years are discussed below.
In May 2003, Honeywell sold its Engineering Plastics business
to BASF in exchange for BASF’s nylon fiber business and $90
million in cash. BASF’s nylon fiber business became part of
Specialty Materials’ nylon business. Specialty Materials’
Engineering Plastics business and BASF’s nylon fiber business
both have annual sales of approximately $400 million.
In October 2002 we acquired Invensys Sensor Systems (ISS) for
approximately $416 million in cash with $115 million allocated
to tangible net assets, $206 million allocated to goodwill and
$95 million allocated to other intangible assets with deter-
minable lives. ISS is a global supplier of sensors and controls
used in the medical, office automation, aerospace, HVAC, auto-
motive, off-road vehicle and consumer appliance industries.
ISS is part of our Automation and Control Products business in
our Automation and Control Solutions reportable segment and
is expected to strengthen our product offerings in the high-
growth medical and automotive-onboard segments. ISS had
sales of approximately $253 million in 2002.
In connection with all acquisitions in 2003, 2002 and 2001, the
amounts recorded for transaction costs and the costs of inte-
grating the acquired businesses into Honeywell were not
material. The results of operations of all acquired businesses
have been included in the consolidated results of Honeywell
from their respective acquisition dates. The pro forma results
for 2003, 2002 and 2001, assuming these acquisitions had been
made at the beginning of the year, would not be materially
different from reported results.
NOTE 3—REPOSITIONING, LITIGATION, BUSINESSIMPAIRMENT AND OTHER CHARGES
A summary of repositioning, litigation, business impairment
and other charges follows:
Years Ended December 31,
(Dollars in Millions) 2003 2002 2001
Severance . . . . . . . . . . . . . . . . . . . . . . . $ 69 $ 270 $ 727
Asset impairments . . . . . . . . . . . . . . . . 6 121 194
Exit costs . . . . . . . . . . . . . . . . . . . . . . . . 7 62 95
Reserve adjustments . . . . . . . . . . . . . . (69) (76) (119)
Total net repositioning charge . . . . . . . . 13 377 897
Asbestos related litigation charges,
net of insurance . . . . . . . . . . . . . . . . — 1,548 159
Litton litigation settlement . . . . . . . . . — — 440
Other probable and reasonably
estimable legal and
environmental liabilities . . . . . . . . . 261 30 249
Business impairment charges . . . . . . — 877 145
Customer claims and settlements
of contract liabilities . . . . . . . . . . . . — 152 310
Write-offs of receivables, inventories
and other assets . . . . . . . . . . . . . . . 2 60 335
Investment impairment charges . . . . . 2 15 112
Aerospace jet engine contract
cancellation . . . . . . . . . . . . . . . . . . . — — 100
General Electric merger expenses . . . — — 42
Debt extinguishment loss . . . . . . . . . . — — 6
Total net repositioning, litigation,
business impairment and
other charges . . . . . . . . . . . . . . . . . . $278 $3,059 $2,795
The following table summarizes the pretax distribution of total
net repositioning, litigation, business impairment and other
charges by income statement classification.
Years Ended December 31,
(Dollars in Millions) 2003 2002 2001
Cost of goods sold . . . . . . . . . . . . . . . . $272 $ 561 $2,134
Selling, general and administrative
expenses . . . . . . . . . . . . . . . . . . . . . . 4 45 151
Asbestos related litigation charges,
net of insurance . . . . . . . . . . . . . . . . — 1,548 159
Business impairment charges . . . . . . — 877 145
Equity in (income) loss of affiliated . . .
companies . . . . . . . . . . . . . . . . . . . . 2 13 200
Other (income) expense . . . . . . . . . . . . — 15 6
$278 $3,059 $2,795

The following table summarizes the pretax impact of total net
repositioning, litigation, business impairment and other
charges by reportable segment.
Years Ended December 31,
(Dollars in Millions) 2003 2002 2001
Aerospace . . . . . . . . . . . . . . . . . . . . . . . $ 10 $ 146 $ 895
Automation and Control Solutions . . . (22) 212 785
Specialty Materials . . . . . . . . . . . . . . . . 20 976 242
Transportation Systems . . . . . . . . . . . . 16 295 367
Corporate . . . . . . . . . . . . . . . . . . . . . . . 254 1,430 506
$278 $3,059 $2,795
In 2003, we recognized a repositioning charge of $82 million
mainly for severance costs related to workforce reductions of
1,501 manufacturing and administrative positions across all of
our reportable segments. Also, $69 million of previously estab-
lished accruals, mainly for severance, were returned to income
in 2003, due to fewer employee separations than originally
anticipated associated with certain 2002 repositioning actions,
resulting in reduced severance liabilities in our Automation and
Control Solutions, Aerospace and Specialty Materials
reportable segments.
In 2002, we recognized a repositioning charge of $453 million
for workforce reductions across all of our reportable segments
and our UOP process technology joint venture. The charge also
related to costs for the planned shutdown and consolidation of
manufacturing plants in our Specialty Materials and
Automation and Control Solutions reportable segments.
Severance costs related to announced workforce reductions of
approximately 8,100 manufacturing and administrative posi-
tions, which are substantially complete. Asset impairments
principally related to manufacturing plant and equipment held
for sale and capable of being taken out of service and actively
marketed in the period of impairment. Exit costs related princi-
pally to incremental costs to exit facilities, including lease
termination losses negotiated or subject to reasonable estima-
tion related mainly to closed facilities in our Automation and
Control Solutions and Specialty Materials reportable
segments. Also, $76 million of previously established sever-
ance accruals were returned to income in 2002, due to fewer
employee separations than originally anticipated and higher
than expected voluntary employee attrition resulting in reduced
severance liabilities in our Aerospace, Automation and Control
Solutions and Specialty Materials reportable segments.
In 2001, we recognized a repositioning charge of $1,016 million
for the cost of actions designed to reduce our cost structure
and improve our future profitability. These actions consisted of
announced global workforce reductions of approximately
20,000 manufacturing and administrative positions across all of
our reportable segments, which are complete. The reposition-
ing charge also included asset impairments and other exit
costs related to plant closures and the rationalization of manu-
facturing capacity and infrastructure, principally in our
Specialty Materials, Engines, Systems and Services and
Transportation Systems businesses, including the shutdown of
our Turbogenerator product line. Other exit costs consisted of
contract cancellations and penalties, including lease termina-
tions, negotiated or subject to reasonable estimation. Also,
$119 million of previously established accruals, mainly for
severance, were returned to income in 2001 due principally to
higher than expected voluntary employee attrition resulting in
reduced severance liabilities, principally in our Aerospace and
Automation and Control Solutions reportable segments.
The following table summarizes the status of our total reposi-
tioning costs.
Severance Asset Exit(Dollars in Millions) Costs Impairments Costs Total
Balance at
December 31, 2000 . . $ 236 $ — $ 80 $ 316
2001 charges . . . . . . . . . 727 194 95 1,016
2001 usage . . . . . . . . . . . (364) (194) (58) (616)
Adjustments . . . . . . . . . . (115) — (4) (119)
Balance at
December 31, 2001 . . 484 — 113 597
2002 charges . . . . . . . . . 270 121 62 453
2002 usage . . . . . . . . . . . (355) (121) (92) (568)
Adjustments . . . . . . . . . . (74) — (2) (76)
Balance at
December 31, 2002 . . 325 — 81 406
2003 charges . . . . . . . . . 69 6 7 822003 usage . . . . . . . . . . . (166) (6) (34) (206)Adjustments . . . . . . . . . . (57) — (12) (69)
BALANCE AT DECEMBER 31, 2003 . $ 171 $ — $ 42 $ 213
In 2003, we recognized other charges for probable and reason-
ably estimable legal and environmental liabilities of $261
million. This includes $235 million for environmental liabilities
mainly related to the matter entitled Interfaith CommunityOrganization, et al. v. Honeywell International Inc., et al. and for
environmental conditions in and around Onondaga Lake in
Syracuse, New York, both as discussed in Note 21. We also
recognized a charge of $4 million in our Specialty Materials
reportable segment including a loss on sale of an investment
owned by an equity investee.
In 2002, we recognized business impairment charges of $877
million related to businesses in our Specialty Materials and
Automation and Control Solutions reportable segments, as
well as our Friction Materials business. Based on current oper-
ating losses and deteriorating economic conditions in certain
chemical and telecommunications end markets, we performed
impairment tests and recognized impairment charges of $785
54

55
million in 2002 principally related to the write-down of prop-
erty, plant and equipment held and used in our Nylon System,
Performance Fibers and Metglas Specialty Materials busi-
nesses, as well as an Automation and Control Solutions
communication business. We also recognized impairment
charges of $92 million related principally to the write-down of
property, plant and equipment of our Friction Materials busi-
ness, which was classified as assets held for disposal in Other
Current Assets as of December 31, 2002 (a plan of disposal of
Friction Materials was adopted in 2001; in January 2003, we
entered into a letter of intent to sell this business to Federal-
Mogul Corp. We formally ended negotiations to sell our Friction
Materials business to Federal-Mogul Corp. and reclassified
the business from held for sale to held and used as of
December 31, 2003—see Note 21). In 2002, we recognized
asbestos related litigation charges of $1,548 million principally
related to costs associated with the potential resolution of
asbestos claims of NARCO (see Note 21). In 2002, we also
recognized other charges consisting of customer claims and
settlements of contract liabilities of $152 million and write-offs
of receivables, inventories and other assets of $60 million.
These other charges related mainly to our Advanced Circuits
business, bankruptcy of a customer in our Aerospace
reportable segment, and customer claims in our Aerospace
and Automation and Control Solutions reportable segments.
Additionally, we recognized other charges consisting of other
probable and reasonably estimable environmental liabilities of
$30 million and write-offs related to an other than temporary
decline in the value of certain equity investments of $15 million.
In 2001, we recognized other charges consisting of a settle-
ment of the Litton Systems, Inc. litigation for $440 million,
other probable and reasonably estimable legal and environ-
mental liabilities of $249 million (see Note 21), asbestos
related litigation charges of $159 million (see Note 21), cus-
tomer claims and settlements of contract liabilities of $310
million and write-offs of receivables, inventories and other
assets of $335 million. Our Friction Materials business was
designated as held for disposal, and we recognized an impair-
ment charge of $145 million related to the write-down of
property, plant and equipment, goodwill and other identifiable
intangible assets to their fair value less costs to sell. We recog-
nized charges of $112 million related to an other than
temporary decline in the value of an equity investment and an
equity investee’s loss contract, and a $100 million charge for
write-off of investments, including inventory, related to a
regional jet engine contract cancellation. We also recognized
$42 million of transaction expenses related to the proposed
merger with General Electric and redeemed our $200 million
5 3/4% dealer remarketable securities due 2011, resulting in a
loss of $6 million.
NOTE 4—GAIN (LOSS) ON SALE OF NON-STRATEGICBUSINESSES
The following is a summary of non-strategic businesses sold:
Year EndedDecember 31, 2003
Pretax After-tax(Dollars in Millions) Gain (Loss) Gain (Loss)
Specialty Materials—Engineering
Plastics, Rudolstadt and Metglas . . . $ 25 $ (5)Aerospace—Honeywell Aerospace
Defense Services . . . . . . . . . . . . . . . . 13 9
$ 38 $ 4
In 2003, we realized proceeds of approximately $137 million in
cash on the sales of these businesses. The sales of these busi-
nesses did not materially impact net sales and segment profit
in 2003 compared with 2002. The after-tax loss on the sale of
our Specialty Materials’ businesses resulted mainly from tax
benefits associated with prior capital losses.
Year EndedDecember 31, 2002
Pretax After-tax(Dollars in Millions) Gain (Loss) Gain (Loss)
Automation and Control Solutions—
Consumer Products . . . . . . . . . . . . . $(131) $ (10)
Specialty Materials—Advanced
Circuits . . . . . . . . . . . . . . . . . . . . . . . (83) 18
Specialty Materials—Pharmaceutical
Fine Chemicals (PFC) . . . . . . . . . . . (35) 108
Transportation Systems—Bendix
Commercial Vehicle Systems
(BCVS) . . . . . . . . . . . . . . . . . . . . . . . . 125 79
$(124) $195
In 2002, we realized proceeds of approximately $435 million in
cash and investment securities on the sales of these busi-
nesses. Our Advanced Circuits and PFC businesses had a
higher deductible tax basis than book basis which resulted in
an after-tax gain. The sales of these businesses reduced net
sales and increased segment profit in 2002 compared with
2001 by approximately $500 and $31 million, respectively.
NOTE 5—OTHER (INCOME) EXPENSE
Years Ended December 31,
(Dollars in Millions) 2003 2002 2001
Interest income and other . . . . . . . . . $(109) $(68) $ (50)
Minority interests . . . . . . . . . . . . . . . . 7 8 24
Foreign exchange loss . . . . . . . . . . . . 121 56 9
$ 19 $ (4) $ (17)

56
NOTE 6—INTEREST AND OTHER FINANCIAL CHARGES
Years Ended December 31,
(Dollars in Millions) 2003 2002 2001
Total interest and other financial
charges . . . . . . . . . . . . . . . . . . . . . . $ 350 $ 365 $ 422
Less—capitalized interest . . . . . . . . . (15) (21) (17)
$ 335 $ 344 $ 405
The weighted average interest rate on short-term borrowings
and commercial paper outstanding at December 31, 2003 and
2002 was 6.81 and 1.23 percent, respectively.
NOTE 7—INCOME TAXES
Income (loss) before taxes and cumulative
effect of accounting change
Years Ended December 31,
(Dollars in Millions) 2003 2002 2001
United States . . . . . . . . . . . . . . . . . . . . $ 925 $(1,262) $(751)
Foreign . . . . . . . . . . . . . . . . . . . . . . . . . 715 317 329
$1,640 $ (945) $(422)
Tax expense (benefit)
Years Ended December 31,
(Dollars in Millions) 2003 2002 2001
United States . . . . . . . . . . . . . . . . . . . . $ 98 $ (894) $(472)
Foreign . . . . . . . . . . . . . . . . . . . . . . . . . 198 169 149
$ 296 $ (725) $(323)
Years Ended December 31,
(Dollars in Millions) 2003 2002 2001
Tax expense (benefit) consist of:
Current:
United States . . . . . . . . . . . . . . . . . $ (251) $ (175) $ (47)
State . . . . . . . . . . . . . . . . . . . . . . . . (1) 28 (1)
Foreign . . . . . . . . . . . . . . . . . . . . . . 204 197 172
(48) 50 124
Deferred:
United States . . . . . . . . . . . . . . . . . . 347 (679) (336)
State . . . . . . . . . . . . . . . . . . . . . . . . . 3 (68) (88)
Foreign . . . . . . . . . . . . . . . . . . . . . . . (6) (28) (23)
344 (775) (447)
$ 296 $ (725) $(323)
Years Ended December 31,
(Dollars in Millions) 2003 2002 2001
The U.S. statutory federal income tax
rate is reconciled to our effective
income tax rate as follows:
Statutory U.S. federal income
tax rate . . . . . . . . . . . . . . . . . . . 35.0 % (35.0)% (35.0)%
Taxes on foreign earnings over
(under) U.S. tax rate (1) . . . . . . . (5.0) 10.0 15.3
Asset basis differences . . . . . . . . (2.2) (33.1) (18.5)
Nondeductible amortization . . . . 1.9 2.4 13.4
State income taxes(1) . . . . . . . . . . .4 (2.6) (9.3)
Tax benefits on export sales . . . . (3.6) (8.5) (25.4)
ESOP dividend tax benefit . . . . . . (1.2) (1.9) (4.3)
Tax credits . . . . . . . . . . . . . . . . . . (1.0) (1.5) (7.7)
Equity income . . . . . . . . . . . . . . . . (.8) (1.7) (3.6)
Redesignation of Friction Materials
business from held for sale
to held and used . . . . . . . . . . . (6.6) — —
All other items—net . . . . . . . . . . . 1.1 (4.8) (1.5)
18.0 % (76.7)% (76.6)%
(1)
Net of changes in valuation allowance.
Deferred tax assets (liabilities)
December 31,
(Dollars in Millions) 2003 2002
Deferred income taxes represent the future tax
effects of transactions which are reported in
different periods for tax and financial reporting
purposes. The tax effects of temporary
differences and tax carryforwards which give
rise to future income tax benefits and payables
are as follows:
Property, plant and equipment
basis differences . . . . . . . . . . . . . . . . . . . $ (570) $ (572)
Postretirement benefits other than pensions
and postemployment benefits . . . . . . . . 707 781
Investment and other asset basis differences (215) (69)
Other accrued items . . . . . . . . . . . . . . . . . . 535 796
Net operating losses . . . . . . . . . . . . . . . . . . 967 863
U.S. net capital loss . . . . . . . . . . . . . . . . . . — 196
Tax credits . . . . . . . . . . . . . . . . . . . . . . . . . . 373 253
Undistributed earnings of subsidiaries . . . (33) (33)
All other items—net . . . . . . . . . . . . . . . . . . 52 59
1,816 2,274
Valuation allowance . . . . . . . . . . . . . . . . . . (299) (191)
$1,517 $2,083
The amount of federal tax net operating losses available for
carryback or carryforward at December 31, 2003 was $1.2 bil-
lion, including $311 million generated in 2003. Also, included
are $82 million of loss carryforwards that were generated by
certain subsidiaries prior to their acquisition and have expira-
tion dates through 2019. The use of pre-acquisition operating
losses is subject to limitations imposed by the Internal
Revenue Code. We do not anticipate that these limitations will

In 2003, the diluted earnings per share calculation excludes
the effect of stock options when the options’ exercise prices
exceed the average market price of the common shares during
the period. In 2003, the number of stock options not included
in the computation was 41,908,964. These stock options were
outstanding at the end of 2003. As a result of the net loss for
2002 and 2001, 2,527,229 and 4,269,601, respectively, of dilutive
securities issuable in connection with stock plans have been
excluded from the diluted loss per share calculations because
their effect would reduce the loss per share.
NOTE 9—ACCOUNTS, NOTES AND OTHER RECEIVABLES
December 31,
(Dollars in Millions) 2003 2002
Trade . . . . . . . . . . . . . . . . . . . . . . . . . . . . . . . . . . $3,230 $3,064
Other . . . . . . . . . . . . . . . . . . . . . . . . . . . . . . . . . . 563 347
3,793 3,411
Less—Allowance for doubtful accounts . . . . . . (150) (147)
$3,643 $3,264
We sell interests in designated pools of trade accounts
receivables to third parties. The sold receivables are over-
57
affect utilization of the carryforwards prior to their expiration.
Various subsidiaries have state tax net operating loss carryfor-
wards of $4.4 billion at December 31, 2003 with varying
expiration dates through 2023. We also have foreign net operat-
ing losses of $1.6 billion which are available to reduce future
income tax payments in several countries, subject to varying
expiration rules.
We have U.S. tax credit carryforwards of $160 million at
December 31, 2003, including carryforwards of $80 million with
various expiration dates through 2023, and tax credits of $80
million which are not subject to expiration. In addition, we have
$213 million of foreign tax credits available for carryback or
carryforward at December 31, 2003 with varying expiration
dates through 2008.
The valuation allowance was increased by $108, $80 and $47
million in 2003, 2002 and 2001, respectively. The increase in 2003
was primarily due to an increase in foreign net operating losses
that are not expected to be utilized. The increase in 2002 was
primarily due to foreign tax credits which are not expected to be
realized and state tax net operating loss carryforwards (net of
federal impact) which we believe will expire unutilized. The
increase in 2001 was primarily due to an increase in foreign net
operating losses attributable to a Specialty Materials business
that are not expected to be utilized.
Honeywell has not provided for U.S. federal income and foreign
withholding taxes on $3.3 billion of undistributed earnings from
non-U.S. operations as of December 31, 2003. Such earnings
are currently intended to be reinvested indefinitely. It is not
practicable to estimate the amount of tax that might be payable
if some or all of such earnings were to be remitted, and foreign
tax credits would be available to reduce or eliminate the result-
ing U.S. income tax liability.
NOTE 8—EARNINGS (LOSS) PER SHARE
The following table sets forth the computations of basic and diluted earnings (loss) per share:
(Dollars in Millions, Except Per Share Amounts) 2003 2002 2001
Assuming Assuming AssumingBasic Dilution Basic Dilution Basic Dilution
Income (loss)
Income (loss) before cumulative effect
of accounting change . . . . . . . . . . . . . $1,344 $1,344 $ (220) $ (220) $ (99) $ (99)
Cumulative effect of accounting change (20) (20) — — — —
Net income (loss) . . . . . . . . . . . . . . . . . . $1,324 $1,324 $ (220) $ (220) $ (99) $ (99)
Average shares
Average shares outstanding . . . . . . . . . . 860,671,264 860,671,264 820,292,870 820,292,870 812,273,417 812,273,417
Dilutive securities issuable in
connection with stock plans . . . . . . . — 1,423,992 — — — —
Total average shares . . . . . . . . . . . . . . . . 860,671,264 862,095,256 820,292,870 820,292,870 812,273,417 812,273,417
Earnings (loss) per share of
common stock
Income (loss) before cumulative effect
of accounting change . . . . . . . . . . . . . $ 1.56 $ 1.56 $(0.27) $(0.27) $(0.12) $(0.12)
Cumulative effect of accounting change (0.02) (0.02) — — — —
Net income (loss) . . . . . . . . . . . . . . . . . . $ 1.54 $ 1.54 $(0.27) $(0.27) $(0.12) $(0.12)

CurrencyDecember 31, Translation December 31,
(Dollars in Millions) 2002 Acquisitions Divestitures Adjustment 2003
Aerospace . . . . . . . . . . . . . . . . . . . . . . . . . . . . . . . . . . . . $1,644 $ — $ (3) $ — $1,641Automation and Control Solutions . . . . . . . . . . . . . . . 2,678 136 — 18 2,832Specialty Materials . . . . . . . . . . . . . . . . . . . . . . . . . . . . 849 5 (89) 16 781Transportation Systems . . . . . . . . . . . . . . . . . . . . . . . . 527 — — 8 535
$5,698 $141 $(92) $42 $5,789
Intangible assets are comprised of:
December 31, 2003 December 31, 2002
Gross Net Gross NetCarrying Accumulated Carrying Carrying Accumulated Carrying
(Dollars in Millions) Amount Amortization Amount Amount Amortization Amount
Intangible assets with determinable lives:
Investments in Aerospace customer incentives . . $ 860 $(141) $ 719 $ 769 $(107) $ 662
Patents and trademarks . . . . . . . . . . . . . . . . . . . . . 425 (295) 130 411 (286) 125
Other . . . . . . . . . . . . . . . . . . . . . . . . . . . . . . . . . . . . . 398 (186) 212 433 (183) 250
1,683 (622) 1,061 1,613 (576) 1,037
Trademark with indefinite life . . . . . . . . . . . . . . . . . . . 46 (9) 37 46 (9) 37
$1,729 $(631) $1,098 $1,659 $(585) $1,074
58
collateralized by $174 million at December 31, 2003 and we
retain a subordinated interest in the pool of receivables repre-
senting that over-collateralization as well as an undivided
interest in the balance of the receivables pools. New receiv-
ables are sold under the agreement as previously sold
receivables are collected. Losses are recognized when our
interest in the receivables are sold. The retained interests in
the receivables are shown at the amounts expected to be col-
lected by us, and such carrying value approximates the fair
value of our retained interests. We are compensated for our
services in the collection and administration of the receivables.
December 31,
(Dollars in Millions) 2003 2002
Designated pools of trade receivables . . . . . . . $ 995 $ 911
Interest sold to third parties . . . . . . . . . . . . . . . (500) (500)
Retained interest . . . . . . . . . . . . . . . . . . . . . . . . $ 495 $ 411
Losses on sales of receivables were $7, $10 and $22 million in
2003, 2002 and 2001, respectively. No credit losses were
incurred during those years.
NOTE 10—INVENTORIES
December 31,
(Dollars in Millions) 2003 2002
Raw materials . . . . . . . . . . . . . . . . . . . . . . . . . . $ 972 $ 936
Work in process . . . . . . . . . . . . . . . . . . . . . . . . . 802 804
Finished products . . . . . . . . . . . . . . . . . . . . . . . . 1,311 1,361
3,085 3,101
Less—Progress payments . . . . . . . . . . . . . . . . . (20) (28)
—Reduction to LIFO cost basis . . . . . . . . . (126) (120)
$ 2,939 $2,953
Inventories valued at LIFO amounted to $144 and $146 million
at December 31, 2003 and 2002, respectively. Had such LIFO
inventories been valued at current costs, their carrying values
would have been approximately $126 and $120 million higher
at December 31, 2003 and 2002, respectively.
NOTE 11—INVESTMENTS AND LONG-TERM RECEIVABLES
December 31,
(Dollars in Millions) 2003 2002
Investments . . . . . . . . . . . . . . . . . . . . . . . . . . . . $ 181 $ 160
Long-term receivables . . . . . . . . . . . . . . . . . . . . 388 464
$ 569 $ 624
There were no equity securities classified as available-for-sale
at December 31, 2003 and 2002.
NOTE 12—PROPERTY, PLANT AND EQUIPMENT
December 31,
(Dollars in Millions) 2003 2002
Land and improvements . . . . . . . . . . . . . . . . . . $ 335 $ 297
Machinery and equipment . . . . . . . . . . . . . . . . . 9,011 8,646
Buildings and improvements . . . . . . . . . . . . . . 1,964 1,836
Construction in progress . . . . . . . . . . . . . . . . . . 435 378
11,745 11,157
Less—Accumulated depreciation
and amortization . . . . . . . . . . . . . . . . . . . . . . (7,450) (7,102)
$ 4,295 $ 4,055
Depreciation expense was $595, $671 and $724 million in
2003, 2002 and 2001, respectively.
NOTE 13—GOODWILL AND OTHER INTANGIBLES—NET
The change in the carrying amount of goodwill for the year
ended December 31, 2003 by reportable segment is as follows:

59
Intangible assets amortization expense was $66, $59 and $56
million in 2003, 2002 and 2001, respectively. Estimated intangi-
ble assets amortization expense for each of the five succeeding
years approximates $70 million.
In accordance with SFAS No. 142, prior year amounts were not
restated to adjust for the amortization of goodwill. A reconcilia-
tion of the previously reported net (loss) and (loss) per share to
the amounts adjusted for the reduction of amortization
expense, net of the related income tax effect, is as follows:
Year Ended(Dollars in Millions, December 31,Except Per Share Amounts) 2001
Net Income (Loss)
Reported net (loss) . . . . . . . . . . . . . . . . . . . . . . . . . . . . . . . $ (99)
Amortization adjustment . . . . . . . . . . . . . . . . . . . . . . . . . . 196
Adjusted net income . . . . . . . . . . . . . . . . . . . . . . . . . . . . . . $ 97
Earnings (loss) per share of
common stock—basic
Reported (loss) per share—basic . . . . . . . . . . . . . . . . . . . . $ (0.12)
Amortization adjustment . . . . . . . . . . . . . . . . . . . . . . . . . . 0.24
Adjusted earnings per share—basic . . . . . . . . . . . . . . . . . $ 0.12
Earnings (loss) per share of
common stock—assuming dilution
Reported (loss) per share—assuming dilution . . . . . . . . . $ (0.12)
Amortization adjustment . . . . . . . . . . . . . . . . . . . . . . . . . . 0.24
Adjusted earnings per share—assuming dilution . . . . . . $ 0.12
NOTE 14—ACCRUED LIABILITIES
December 31,
(Dollars in Millions) 2003 2002
Compensation and benefit costs . . . . . . . . . . . . . $ 386 $ 440
Customer advances . . . . . . . . . . . . . . . . . . . . . . . 516 458
Income taxes . . . . . . . . . . . . . . . . . . . . . . . . . . . . . 145 38
Environmental costs . . . . . . . . . . . . . . . . . . . . . . . 90 75
Asbestos related liabilities . . . . . . . . . . . . . . . . . . 730 741
Severance . . . . . . . . . . . . . . . . . . . . . . . . . . . . . . . 171 325
Product warranties and performance guarantees 242 179
Other . . . . . . . . . . . . . . . . . . . . . . . . . . . . . . . . . . . 2,064 2,147
$4,344 $4,403
NOTE 15—LONG-TERM DEBT AND CREDIT AGREEMENTS
December 31,
(Dollars in Millions) 2003 2002
6.875% notes due 2005 . . . . . . . . . . . . . . . . . . . . . $ 750 $ 750
5.25% notes due 2006 . . . . . . . . . . . . . . . . . . . . . . 339 282
8 5/8% debentures due 2006 . . . . . . . . . . . . . . . . . 100 100
5 1/8% notes due 2006 . . . . . . . . . . . . . . . . . . . . . . 500 500
7.0% notes due 2007 . . . . . . . . . . . . . . . . . . . . . . . 350 350
7 1/8% notes due 2008 . . . . . . . . . . . . . . . . . . . . . . 200 200
6.20% notes due 2008 . . . . . . . . . . . . . . . . . . . . . . 200 200
Zero coupon bonds and money multiplier notes,
13.0%–14.26%, due 2009 . . . . . . . . . . . . . . . . . 100 100
Floating rate notes due 2009–2011 . . . . . . . . . . . 267 —
7.50% notes due 2010 . . . . . . . . . . . . . . . . . . . . . . 1,000 1,000
6 1/8% notes due 2011 . . . . . . . . . . . . . . . . . . . . . . 500 500
Industrial development bond obligations,
4.40%–6.75%, maturing at various dates
through 2037 . . . . . . . . . . . . . . . . . . . . . . . . . . . 66 86
6 5/8% debentures due 2028 . . . . . . . . . . . . . . . . . 216 216
9.065% debentures due 2033 . . . . . . . . . . . . . . . . 51 51
Other (including capitalized leases),
1.83%–9.5%, maturing at various
dates through 2016 . . . . . . . . . . . . . . . . . . . . . . 322 384
$4,961 $ 4,719
The schedule of principal payments on long-term debt is
as follows:
At December 31,(Dollars in Millions) 2003
2004 . . . . . . . . . . . . . . . . . . . . . . . . . . . . . . . . . . . . $ 472005 . . . . . . . . . . . . . . . . . . . . . . . . . . . . . . . . . . . . 9282006 . . . . . . . . . . . . . . . . . . . . . . . . . . . . . . . . . . . . 9552007 . . . . . . . . . . . . . . . . . . . . . . . . . . . . . . . . . . . . 3572008 . . . . . . . . . . . . . . . . . . . . . . . . . . . . . . . . . . . . 401Thereafter . . . . . . . . . . . . . . . . . . . . . . . . . . . . . . . 2,320
5,008Less—current portion . . . . . . . . . . . . . . . . . . . . . . (47)
$4,961
We maintain $2.3 billion of bank revolving credit facilities with a
group of banks, arranged by Citigroup Global Markets Inc. and
J.P. Morgan Securities Inc., comprised of: (a) a $1.3 billion
Five-Year Credit Agreement, with a $300 million letter of credit
sub-limit and (b) a $1 billion 364-Day Credit Agreement. The
credit agreements are maintained for general corporate pur-
poses, including support for the issuance of commercial paper.
The Five-Year Credit Agreement was increased in November
2003 from $1 billion to $1.3 billion with the addition of a $300
million sub-limit for the potential issuance of letters of credit.

60
Neither of the credit agreements restricts our ability to pay
dividends and neither contains financial covenants. The failure
to comply with customary conditions or the occurrence of cus-
tomary events of default contained in the credit agreements
would prevent any further borrowings and would generally
require the repayment of any outstanding borrowings under
such credit agreements. Such events of default include:
(a) non-payment of credit agreement debt, interest or fees;
(b) non-compliance with the terms of the credit agreement
covenants; (c) cross-default to other debt in certain circum-
stances; (d) bankruptcy; and (e) defaults upon obligations
under Employee Retirement Income Security Act. Additionally,
each of the banks has the right to terminate its commitment to
lend additional funds or issue additional letters of credit under
the credit agreements if any person or group acquires benefi-
cial ownership of 30 percent or more of our voting stock, or,
during any 12-month period, individuals who were directors of
Honeywell at the beginning of the period cease to constitute a
majority of the Board of Directors (the Board).
Loans under the Five-Year Credit Agreement are required to be
repaid no later than November 26, 2008. We have agreed to pay
a facility fee of 0.08 percent per annum on the aggregate com-
mitment for the Five-Year Credit Agreement.
Interest on borrowings under the Five-Year Credit Agreement
would be determined, at Honeywell’s option, by (a) an auction
bidding procedure; (b) the highest of the floating base rate
publicly announced by Citibank, N.A., 0.5 percent above the
average CD rate, or 0.5 percent above the Federal funds rate; or
(c) the Eurocurrency rate plus 0.22 percent (applicable margin).
The commitments under the 364-Day Credit Agreement termi-
nate on November 24, 2004. If the credit facility is drawn, any
outstanding balance on November 24, 2004 may be converted
to a one-year term loan at our option. We have agreed to pay a
facility fee of 0.06 percent per annum on the aggregate com-
mitment for the 364-Day Credit Agreement.
Interest on borrowings under the 364-Day Credit Agreement
would be determined, at Honeywell’s option, by (a) an auction
bidding procedure; (b) the highest of the floating base rate
publicly announced by Citibank, N.A., 0.5 percent above the
average CD rate, or 0.5 percent above the Federal funds rate;
or (c) the Eurocurrency rate plus 0.24 percent (applicable
margin). The applicable margin on and after the term loan
conversion is 0.60 percent.
The facility fee, the applicable margin over the Eurocurrency
rate on both the Five-Year Credit Agreement and the 364-Day
Credit Agreement, and the letter of credit issuance fee in the
Five-Year Credit Agreement, are subject to change, based upon
a grid determined by our long-term debt ratings. Neither credit
agreement is subject to termination based upon a decrease in
our debt ratings or a material adverse change.
NOTE 16—LEASE COMMITMENTS
Future minimum lease payments under operating leases hav-
ing initial or remaining noncancellable lease terms in excess of
one year are as follows:
At December 31,(Dollars in Millions) 2003
2004 . . . . . . . . . . . . . . . . . . . . . . . . . . . . . . . . . . . . $ 2742005 . . . . . . . . . . . . . . . . . . . . . . . . . . . . . . . . . . . . 2072006 . . . . . . . . . . . . . . . . . . . . . . . . . . . . . . . . . . . . 1442007 . . . . . . . . . . . . . . . . . . . . . . . . . . . . . . . . . . . . 1062008 . . . . . . . . . . . . . . . . . . . . . . . . . . . . . . . . . . . . 103Thereafter . . . . . . . . . . . . . . . . . . . . . . . . . . . . . . . 208
$1,042
We have entered into agreements to lease land, equipment and
buildings. Principally all our operating leases have initial terms
of up to 25 years, and some contain renewal options subject to
customary conditions. At any time during the terms of some of
our leases, we may at our option purchase the leased assets
for amounts that approximate fair value. At December 31, 2003,
we were leasing aircraft on which we provided residual value
guarantees on the leased assets of approximately $24 million.
We do not expect that any of our commitments under the lease
agreements will have a material adverse effect on our consoli-
dated results of operations, financial position or liquidity.
Rent expense was $314, $274 and $321 million in 2003, 2002
and 2001, respectively.
NOTE 17—FINANCIAL INSTRUMENTS
As a result of our global operating and financing activities,
we are exposed to market risks from changes in interest
and foreign currency exchange rates and commodity prices,
which may adversely affect our operating results and
financial position. We minimize our risks from interest and
foreign currency exchange rate and commodity price fluctua-
tions through our normal operating and financing activities
and, when deemed appropriate, through the use of derivative
financial instruments.
Credit and Market Risk
Financial instruments, including derivatives, expose us to
counterparty credit risk for nonperformance and to market
risk related to changes in interest or currency exchange rates.
We manage our exposure to counterparty credit risk through
specific minimum credit standards, diversification of counter-
parties, and procedures to monitor concentrations of credit
risk. Our counterparties are substantial investment and
commercial banks with significant experience using such
derivative instruments. We monitor the impact of market risk
on the fair value and cash flows of our derivative and other
financial instruments considering reasonably possible changes
in interest and currency exchange rates and restrict the use
of derivative financial instruments to hedging activities.
We do not use derivative financial instruments for trading or
other speculative purposes and do not use leveraged derivative
financial instruments.

61
We continually monitor the creditworthiness of our customers
to which we grant credit terms in the normal course of busi-
ness. While concentrations of credit risk associated with our
trade accounts and notes receivable are considered minimal
due to our diverse customer base, a significant portion of our
customers are in the commercial air transport industry (air-
craft manufacturers and airlines) accounting for approximately
12 percent of our consolidated sales in 2003. Following the
abrupt downturn in the aviation industry after the terrorist
attacks on September 11, 2001 and the already weak economy,
we modified terms and conditions of our credit sales to miti-
gate or eliminate concentrations of credit risk with any single
customer. Our sales are not materially dependent on a single
customer or a small group of customers.
Foreign Currency Risk Management
We conduct our business on a multinational basis in a wide
variety of foreign currencies. Our exposure to market risk for
changes in foreign currency exchange rates arises from
international financing activities between subsidiaries, foreign
currency denominated monetary assets and liabilities and
anticipated transactions arising from international trade.
Our objective is to preserve the economic value of cash
flows in non-functional currencies. We attempt to have all
transaction exposures hedged with natural offsets to the fullest
extent possible and, once these opportunities have been
exhausted, through foreign currency forward and option agree-
ments with third parties. Our principal currency exposures
relate to the Euro, the British pound, the Canadian dollar, and
the U.S. dollar.
We hedge monetary assets and liabilities denominated in for-
eign currencies. Prior to conversion into U.S dollars, these
assets and liabilities are remeasured at spot exchange rates in
effect on the balance sheet date. The effects of changes in spot
rates are recognized in earnings and included in Other
(Income) Expense. We hedge our exposure to changes in for-
eign exchange rates principally with forward contracts.
Forward contracts are marked-to-market with the resulting
gains and losses similarly recognized in earnings offsetting the
gains and losses on the foreign currency denominated mone-
tary assets and liabilities being hedged.
We partially hedge forecasted 2004 sales and purchases
denominated in foreign currencies with currency forward con-
tracts. When the dollar strengthens against foreign currencies,
the decline in value of forecasted foreign currency cash inflows
(sales) or outflows (purchases) is partially offset by the recogni-
tion of gains (sales) and losses (purchases), respectively, in the
value of the forward contracts designated as hedges.
Conversely, when the dollar weakens against foreign curren-
cies, the increase in value of forecasted foreign currency cash
inflows (sales) or outflows (purchases) is partially offset by the
recognition of losses (sales) and gains (purchases), respectively,
in the value of the forward contracts designated as hedges.
Market value gains and losses on these contracts are recog-
nized in earnings when the hedged transaction is recognized.
All open forward contracts mature by December 31, 2004.
At December 31, 2003 and 2002, we had contracts with notional
amounts of $641 and $1,203 million, respectively, to exchange
foreign currencies, principally in the Euro countries and
Great Britain.
Commodity Price Risk Management
Our exposure to market risk for commodity prices arises from
changes in our cost of production. We mitigate our exposure to
commodity price risk through the use of long-term, firm-price
contracts with our suppliers and forward commodity purchase
agreements with third parties hedging anticipated purchases of
several commodities (principally natural gas). Forward com-
modity purchase agreements are marked-to-market, with the
resulting gains and losses recognized in earnings when the
hedged transaction is recognized.
Interest Rate Risk Management
We use a combination of financial instruments, including
medium-term and short-term financing, variable-rate com-
mercial paper, and interest rate swaps to manage the interest
rate mix of our total debt portfolio and related overall cost of
borrowing. At December 31, 2003 and 2002, interest rate swap
agreements designated as fair value hedges effectively
changed $1,189 and $1,132 million, respectively, of fixed rate
debt at an average rate of 6.45 and 6.51 percent, respectively, to
LIBOR based floating rate debt. Our interest rate swaps mature
through 2007.
Fair Value of Financial Instruments
The carrying value of cash and cash equivalents, trade
accounts and notes receivables, payables, commercial paper
and short-term borrowings contained in the Consolidated
Balance Sheet approximates fair value. Summarized below are
the carrying values and fair values of our other financial instru-
ments at December 31, 2003 and 2002. The fair values are
based on the quoted market prices for the issues (if traded),
current rates offered to us for debt of the same remaining
maturity and characteristics, or other valuation techniques,
as appropriate.

December 31, December 31,2003 2002
Carrying Fair Carrying Fair(Dollars in Millions) Value Value Value Value
Assets
Long-term receivables . . . . $ 388 $ 369 $ 464 $ 443
Interest rate swap
agreements . . . . . . . . . . . 67 67 76 76
Foreign currency exchange
contracts . . . . . . . . . . . . . 12 12 8 8
Forward commodity
contracts . . . . . . . . . . . . . 18 18 5 5
Liabilities
Long-term debt and related
current maturities
(excluding capitalized
leases) . . . . . . . . . . . . . . . $(4,992) $(5,508) $(4,812) $(5,261)
Foreign currency exchange
contracts . . . . . . . . . . . . . (11) (11) (16) (16)
NOTE 18—CAPITAL STOCK
We are authorized to issue up to 2,000,000,000 shares of com-
mon stock, with a par value of one dollar. Common
shareowners are entitled to receive such dividends as may be
declared by the Board, are entitled to one vote per share, and
are entitled, in the event of liquidation, to share ratably in all
the assets of Honeywell which are available for distribution to
the common shareowners. Common shareowners do not have
preemptive or conversion rights. Shares of common stock
issued and outstanding or held in the treasury are not liable to
further calls or assessments. There are no restrictions on us
relative to dividends or the repurchase or redemption of com-
mon stock.
In November 2003, Honeywell announced its intention to repur-
chase sufficient outstanding shares of its common stock to
offset the dilutive impact of employee stock based compensa-
tion plans, including future option exercises, restricted unit
vesting and matching contributions under our savings plans.
During 2003, we repurchased 1.9 million shares of our com-
mon stock for $62 million in connection with our share
repurchase program.
We are authorized to issue up to 40,000,000 shares of preferred
stock, without par value, and can determine the number of
shares of each series, and the rights, preferences and limita-
tions of each series. At December 31, 2003, there was no
preferred stock outstanding.
NOTE 19—OTHER NONOWNER CHANGES INSHAREOWNERS’ EQUITY
Total nonowner changes in shareowners’ equity are included in
the Consolidated Statement of Shareowners’ Equity. The changes
in Accumulated Other Nonowner Changes are as follows:
After-(Dollars in Millions) Pretax Tax Tax
YEAR ENDED DECEMBER 31, 2003Foreign exchange translation
adjustments . . . . . . . . . . . . . . . . . . $ 551 $ — $ 551Change in fair value of effective
cash flow hedges . . . . . . . . . . . . . . — — —Minimum pension liability
adjustment . . . . . . . . . . . . . . . . . . . 604 (235) 369
$1,155 $ (235) $ 920
Year ended December 31, 2002
Foreign exchange translation
adjustments . . . . . . . . . . . . . . . . . . $ 310 $ — $ 310
Change in fair value of effective
cash flow hedges . . . . . . . . . . . . . . 35 (13) 22
Minimum pension liability
adjustment . . . . . . . . . . . . . . . . . . . (956) 350 (606)
$ (611) $ 337 $(274)
Year ended December 31, 2001
Unrealized losses on securities
available-for-sale . . . . . . . . . . . . . . $ (4) $ 1 $ (3)
Reclassification adjustment for
losses on securities available-for-
sale included in net income . . . . . . — — —
Net unrealized losses arising
during the year . . . . . . . . . . . . . . . . (4) 1 (3)
Foreign exchange translation
adjustments . . . . . . . . . . . . . . . . . . (51) — (51)
Change in fair value of effective
cash flow hedges . . . . . . . . . . . . . . (8) 3 (5)
Minimum pension liability
adjustment . . . . . . . . . . . . . . . . . . . (78) 31 (47)
$ (141) $ 35 $(106)
The components of Accumulated Other Nonowner Changes are
as follows:
December 31,
(Dollars in Millions) 2003 2002 2001
Cumulative foreign exchange
translation adjustments . . . . . . . . . $ 138 $ (413) $(723)
Fair value of effective cash flow
hedges . . . . . . . . . . . . . . . . . . . . . . . 17 17 (5)
Minimum pension liability . . . . . . . . . (344) (713) (107)
$ (189) $(1,109) $(835)
62

63
NOTE 20—STOCK-BASED COMPENSATION PLANS
We have stock plans available to grant incentive stock options,
non-qualified stock options and stock appreciation rights to
officers and employees.
Fixed Stock Options
The exercise price, term and other conditions applicable to
each option granted under the stock plans are generally deter-
mined by the Management Development and Compensation
Committee of the Board. The options are granted at a price
equal to our stock’s fair market value on the date of grant. The
options generally become exercisable over a three-year period
and expire after ten years.
The following table summarizes information about stock option
activity for the three years ended December 31, 2003:
WeightedAverage
Number of ExerciseOptions Price
Outstanding at December 31, 2000 . . . . . . . 46,000,324 $40.36
Granted . . . . . . . . . . . . . . . . . . . . . . . . . . . . 15,479,120 36.23
Exercised . . . . . . . . . . . . . . . . . . . . . . . . . . (3,121,867) 21.49
Lapsed or canceled . . . . . . . . . . . . . . . . . . (4,477,952) 51.24
Outstanding at December 31, 2001 . . . . . . . 53,879,625 39.37
Granted . . . . . . . . . . . . . . . . . . . . . . . . . . . . 2,996,005 33.61
Exercised . . . . . . . . . . . . . . . . . . . . . . . . . . (1,692,005) 18.15
Lapsed or canceled . . . . . . . . . . . . . . . . . . (3,168,916) 43.14
Outstanding at December 31, 2002 . . . . . . . 52,014,709 39.50
Granted . . . . . . . . . . . . . . . . . . . . . . . . . . . . 9,372,850 23.70Exercised . . . . . . . . . . . . . . . . . . . . . . . . . . (2,361,930) 18.34Lapsed or canceled . . . . . . . . . . . . . . . . . . (4,735,283) 39.58
OUTSTANDING AT DECEMBER 31, 2003 . . . 54,290,346 37.68
There were 38,179,208 and 30,142,728 options exercisable at
weighted average exercise prices of $39.58 and $37.66 at
December 31, 2002 and 2001, respectively. There were
27,942,430 shares available for future grants under the terms
of our stock option plans at December 31, 2003.
Restricted Stock Units
Restricted stock unit (RSU) awards entitle the holder to receive
one share of common stock for each unit when the units vest.
RSU’s are issued to certain key employees as compensation
and as incentives tied directly to the achievement of certain
performance objectives.
RSU’s issued were 1,578,000, 1,777,700 and 186,500 in 2003,
2002 and 2001, respectively. There were 3,103,513, 2,342,960
and 1,580,091 RSU’s outstanding, with a weighted average
grant date fair value per share of $30.10, $37.12 and $43.49 at
December 31, 2003, 2002 and 2001, respectively.
Non-Employee Directors’ Plan
We also have a Stock Plan for Non-Employee Directors
(Directors’ Plan) under which restricted shares and options are
granted. Each new director receives a one-time grant of 3,000
shares of common stock, subject to specific restrictions.
The Directors’ Plan also provides for an annual grant to each
director of options to purchase 5,000 shares of common stock
at the fair market value on the date of grant. We have set aside
450,000 shares for issuance under the Directors’ Plan. Options
generally become exercisable over a three-year period and
expire after ten years.
The following table summarizes information about stock options outstanding at December 31, 2003:
Options Outstanding Options Exercisable
Weighted WeightedWeighted Average Average
Number Average Exercise Number ExerciseRange of exercise prices Outstanding Life (1) Price Exercisable Price
$16.85–$29.86 . . . . . . . . . . . . . . . . . . . . . . . . . . . . . . . 14,485,978 6.4 $22.96 5,239,428 $21.88$30.14–$39.94 . . . . . . . . . . . . . . . . . . . . . . . . . . . . . . . 22,320,901 6.4 36.07 17,889,850 36.24$40.02–$49.97 . . . . . . . . . . . . . . . . . . . . . . . . . . . . . . . 9,750,354 5.0 43.46 9,687,249 43.48$50.13–$66.73 . . . . . . . . . . . . . . . . . . . . . . . . . . . . . . . 7,733,113 5.9 62.62 7,730,713 62.62
54,290,346 6.1 37.68 40,547,240 41.14
(1) Average remaining contractual life in years.

NOTE 21—COMMITMENTS AND CONTINGENCIES
Shareowner Litigation
Honeywell and three of its former officers are defendants in a
class action lawsuit filed in the United States District Court for
the District of New Jersey. Plaintiffs allege, among other
things, that the defendants violated federal securities laws by
purportedly making false and misleading statements and by
failing to disclose material information concerning Honeywell’s
financial performance, thereby allegedly causing the value of
Honeywell’s stock to be artificially inflated. The Court has certi-
fied a class consisting of all purchasers of Honeywell stock
between December 20, 1999 and June 19, 2000. Discovery is
ongoing. Although we continue to believe that the allegations in
this matter are without merit, we are engaged in mediation
with the plaintiffs in an effort to resolve the matter without
resorting to a trial. While we cannot be certain that the parties
will be able to resolve the matter through mediation, a provi-
sion has been made in our financial statements regarding a
potential settlement. Although it is not possible at this time to
predict the outcome of this matter, we expect to prevail if the
parties are unable to resolve this litigation through mediation.
However, an adverse outcome could be material to our consoli-
dated financial position or results of operations.
ERISA Class Action Lawsuit
Honeywell and several of its current and former officers and
directors are defendants in a purported class action lawsuit
filed in the United States District Court for the District of New
Jersey. The complaint principally alleges that the defendants
breached their fiduciary duties to participants in the Honeywell
Savings and Ownership Plan (the “Savings Plan”) by purport-
edly making false and misleading statements, failing to
disclose material information concerning Honeywell’s financial
performance, and failing to diversify the Savings Plan’s assets
and monitor the prudence of Honeywell stock as a Savings
Plan investment. In September 2003, Honeywell filed a motion
to dismiss this matter.
Although it is not possible at this time to predict the outcome of
this matter, we believe that the allegations in this matter are
without merit and we expect to prevail. An adverse litigation
outcome could, however, be material to our consolidated finan-
cial position or results of operations. As a result of the
uncertainty regarding the outcome of this matter, no provision
has been made in our financial statements with respect to this
contingent liability.
Environmental Matters
We are subject to various federal, state and local government
requirements relating to the protection of the environment. We
believe that, as a general matter, our policies, practices and
procedures are properly designed to prevent unreasonable risk
of environmental damage and personal injury and that our
handling, manufacture, use and disposal of hazardous or toxic
substances are in accord with environmental and safety laws
and regulations. However, mainly because of past operations
and operations of predecessor companies, we, like other com-
panies engaged in similar businesses, have incurred remedial
response and voluntary cleanup costs for site contamination
and are a party to lawsuits and claims associated with environ-
mental and safety matters, including past production of
products containing toxic substances. Additional lawsuits,
claims and costs involving environmental matters are likely to
continue to arise in the future.
With respect to environmental matters involving site contami-
nation, we continually conduct studies, individually at our
owned sites, and jointly as a member of industry groups at
non-owned sites, to determine the feasibility of various reme-
dial techniques to address environmental matters. It is our
policy to record appropriate liabilities for environmental mat-
ters when environmental assessments are made or remedial
efforts or damage claim payments are probable and the costs
can be reasonably estimated. With respect to site contamina-
tion, the timing of these accruals is generally no later than the
completion of feasibility studies. We expect to fund expendi-
tures for these matters from operating cash flow. The timing of
cash expenditures depends on a number of factors, including
the timing of litigation and settlements of personal injury and
property damage claims, regulatory approval of cleanup proj-
ects, remedial techniques to be utilized and agreements with
other parties.
Although we do not currently possess sufficient information to
reasonably estimate the amounts of liabilities to be recorded
upon future completion of studies, litigation or settlements,
and neither the timing nor the amount of the ultimate costs
associated with environmental matters can be determined,
they could be material to our consolidated results of operations
or operating cash flows in the periods recognized or paid.
However, considering our past experience and existing
reserves, we do not expect that these environmental matters
will have a material adverse effect on our consolidated finan-
cial position.
In the matter entitled Interfaith Community Organization, et al. v.Honeywell International Inc., et al., the United States District
Court for the District of New Jersey held in May 2003 that a
predecessor Honeywell site located in Jersey City, New Jersey
constituted an imminent and substantial endangerment and
ordered Honeywell to conduct the excavation and transport for
offsite disposal of approximately one million tons of chromium
residue present at the site. Honeywell strongly disagrees with
the Court’s determinations and has appealed the Court’s deci-
64
65
sion to the Third Circuit Court of Appeals. Per the Appeals
Court’s order, the parties are engaged in mediation. In
October 2003, the District Court denied Honeywell’s motion for
a stay of certain aspects of its May 2003 order, and we are
considering whether to appeal such ruling. The site at issue is
one of twenty-one sites located in Jersey City, New Jersey
which are the subject of an Administrative Consent Order (ACO)
entered into with the New Jersey Department of Environmental
Protection (NJDEP) in 1993. Under the ACO, Honeywell agreed
to study and remediate these sites in accordance with NJDEP’s
directions, provided that the total costs of such studies and
remediation do not exceed $60 million. Honeywell has cooper-
ated with the NJDEP under the ACO and believes that decisions
regarding site cleanups should be made by the NJDEP under
the ACO. We are confident that proceeding under the ACO will
ensure a safe remediation and allow the property to be placed
back into productive use much faster and at a cost significantly
less than the remedies required by the Court’s order. We have
not completed development of a remedial action plan for the
excavation and offsite disposal directed under the Court’s order
and therefore are unable to estimate the cost of such actions.
At trial, plaintiff’s expert testified that the excavation and offsite
disposal cost might be $400 million. However, there are signifi-
cant variables in the implementation of the Court’s order and
depending on the method of implementation chosen, the esti-
mate could increase or decrease. Prior to 2003, provisions
were made in our financial statements as to remedial costs
consistent with the ACO and during the three months ended
June 30, 2003 we provided for additional costs which are likely
to be incurred during the pendency of our appeal, which provi-
sions do not assume excavation and offsite removal of
chromium from the site. There are alternative outcomes and
remedies beyond the scope of the ACO that could result from
the remanding, reversal or replacement of the Court’s decision
and order. At this time, we can neither identify a probable alter-
native outcome nor reasonably estimate the cost of an
alternative remedy. Although we expect the Court’s decision
and order to be remanded, reversed or replaced, should the
remedies prescribed in the Court’s decision and order ulti-
mately be upheld, such outcome could have a material adverse
impact on our consolidated results of operations or operating
cash flows in the periods recognized or paid. We do not expect
that this matter will have a material adverse effect on our
consolidated financial position.
In accordance with a 1992 consent decree with the State of
New York, Honeywell is studying environmental conditions in
and around Onondaga Lake (the Lake), in Syracuse, New York.
The purpose of the study is to identify, evaluate and propose
remedial measures that can be taken to remedy historic indus-
trial contamination in the Lake. A predecessor company to
Honeywell operated a chemical plant which is alleged to have
contributed mercury and other contaminants to the Lake and
certain surrounding areas. In May 2003, Honeywell submitted
to the New York State Department of Environmental
Conservation (DEC) a draft Feasibility Study for the Lake and
certain surrounding areas. In November 2003, the DEC issued
formal comments on the Feasibility Study. Those comments
include a request for further evaluation of remedies for the
Lake and surrounding areas. Accordingly, pursuant to the
consent decree, Honeywell is required to submit a revised
Feasibility Study on or before May 3, 2004. Provisions have been
made in our financial statements based on our expected revi-
sions to our Feasibility Study. We do not expect that this matter
will have a material adverse effect on our consolidated finan-
cial position. However, should the DEC ultimately require a
substantially more extensive remedy than that expected to be
proposed in the revised Feasibility Study and should Honeywell
agree to undertake such a remedy, such outcome could have
a material adverse impact on our consolidated results of oper-
ations and operating cash flows in the periods recognized
or paid.
During 2003, three incidents occurred at Honeywell’s Baton
Rouge, Louisiana chemical plant including a release of chlo-
rine, a release of antimony pentachloride which resulted in an
employee fatality, and an employee exposure to hydrofluoric
acid. As a result of these incidents, the United States
Environmental Protection Agency (USEPA), Occupational
Health and Safety Administration (OSHA), the Chemical Safety
Board and state and local agencies commenced investigations.
A number of potential government claims have been settled,
including a $110,000 penalty paid to OSHA for citations arising
from the incidents. The USEPA and Chemical Safety Board
investigations are ongoing however no charges have been filed
or claims asserted. Honeywell has been served with several
civil lawsuits. We do not expect that these matters will have a
material adverse effect on our consolidated financial position,
consolidated results of operations or operating cash flows.
Asbestos Matters
Like many other industrial companies, Honeywell is a defen-
dant in personal injury actions related to asbestos. We did not
mine or produce asbestos, nor did we make or sell insulation
products or other construction materials that have been identi-
fied as the primary cause of asbestos related disease in the
vast majority of claimants. Products containing asbestos previ-
ously manufactured by Honeywell or by previously owned
subsidiaries fall into two general categories; refractory prod-
ucts and friction products.

Refractory ProductsHoneywell owned NARCO from 1979 to 1986. NARCO
produced refractory products (high temperature bricks and
cement) which were sold largely to the steel industry in the
East and Midwest. Less than 2 percent of NARCO’s products
contained asbestos.
When we sold the NARCO business in 1986, we agreed to
indemnify NARCO with respect to personal injury claims for
products that had been discontinued prior to the sale (as
defined in the sale agreement). NARCO retained all liability for
all other claims. NARCO had resolved approximately 176,000
claims through January 4, 2002, the date NARCO filed for
reorganization under Chapter 11 of the U.S. Bankruptcy Code,
at an average cost per claim of two thousand two hundred
dollars. Of those claims, 43 percent were dismissed on the
ground that there was insufficient evidence that NARCO was
responsible for the claimant’s asbestos exposure. As of the
date of NARCO’s bankruptcy filing, there were approximately
116,000 remaining claims pending against NARCO, including
approximately 7 percent in which Honeywell was also named
as a defendant. Since 1983, Honeywell and our insurers have
contributed to the defense and settlement costs associated
with NARCO claims. We have approximately $1.3 billion of
insurance remaining that can be specifically allocated to
NARCO related liability.
As a result of the NARCO bankruptcy filing, all of the claims
pending against NARCO are automatically stayed pending the
reorganization of NARCO, except one claim which is not mate-
rial as to which the stay was lifted in August 2003. Because the
claims pending against Honeywell necessarily will impact the
liabilities of NARCO, because the insurance policies held by
Honeywell are essential to a successful NARCO reorganization,
and because Honeywell has offered to commit the value of
those policies to the reorganization, the bankruptcy court has
temporarily enjoined any claims against Honeywell, current or
future, related to NARCO. Although the stay has been extended
twenty-two times since January 4, 2002, there is no assurance
that such stay will remain in effect. In connection with NARCO’s
bankruptcy filing, we paid NARCO’s parent company $40 mil-
lion and agreed to provide NARCO with up to $20 million in
financing. We also agreed to pay $20 million to NARCO’s parent
company upon the filing of a plan of reorganization for NARCO
acceptable to Honeywell, and to pay NARCO’s parent company
$40 million, and to forgive any outstanding NARCO indebted-
ness, upon the confirmation and consummation of such a plan.
As a result of ongoing negotiations with counsel representing
NARCO related asbestos claimants regarding settlement of all
pending and potential NARCO related asbestos claims against
Honeywell, we have reached definitive agreements or agree-
ments in principle with approximately 256,000 claimants, which
represents in excess of 90 percent of the approximately 275,000
current claimants who are now expected to file a claim as part
of the NARCO reorganization process. We are also in discus-
sions with the NARCO Committee of Asbestos Creditors on
Trust Distribution Procedures for NARCO. We believe that, as
part of the NARCO plan of reorganization, a trust will be estab-
lished pursuant to these Trust Distribution Procedures for the
benefit of all asbestos claimants, current and future. If the
trust is put in place and approved by the Court as fair and equi-
table, Honeywell as well as NARCO will be entitled to a
permanent channeling injunction barring all present and future
individual actions in state or federal courts and requiring all
asbestos related claims based on exposure to NARCO products
to be made against the federally-supervised trust. We expect
the NARCO plan of reorganization and the NARCO trust to be
approved by the Court in 2004. As part of its ongoing settlement
negotiations, Honeywell has reached agreement in principle
with the representative for future NARCO claimants to cap its
annual contributions to the trust with respect to future claims
at a level that would not have a material impact on Honeywell’s
operating cash flows. Given the substantial progress of negoti-
ations between Honeywell and NARCO related asbestos
claimants and between Honeywell and the Committee of
Asbestos Creditors during the fourth quarter of 2002,
Honeywell developed an estimated liability for settlement of
pending and future asbestos claims and recorded a charge of
$1.4 billion for NARCO related asbestos litigation charges, net
of insurance recoveries. This charge consists of the estimated
liability to settle current asbestos related claims, the estimated
liability related to future asbestos related claims through 2018
and obligations to NARCO’s parent, net of insurance recoveries
of $1.8 billion.
The estimated liability for current claims is based on terms and
conditions, including evidentiary requirements, in definitive
agreements or agreements in principle with in excess of 90
percent of current claimants. Once finalized, settlement pay-
ments with respect to current claims are expected to be made
over approximately a four-year period.
The liability for future claims estimates the probable value of
future asbestos related bodily injury claims asserted against
NARCO over a 15 year period and obligations to NARCO’s par-
ent as discussed above. The estimate is based upon the
disease criteria and payment values contained in the NARCO
Trust Distribution Procedures negotiated with the NARCO
Committee of Asbestos Creditors and the NARCO future
66
67
claimants representative. In light of the uncertainties inherent
in making long-term projections we do not believe that we have
a reasonable basis for estimating asbestos claims beyond 2018
under SFAS No. 5. Honeywell retained the expert services of
Hamilton, Rabinovitz and Alschuler, Inc. (HR&A) to project the
probable number and value, including trust claim handling
costs, of asbestos related future liabilities based upon histori-
cal experience with similar trusts. The methodology used to
estimate the liability for future claims has been commonly
accepted by numerous courts and is the same methodology
that is utilized by an expert who is routinely retained by the
asbestos claimants committee in asbestos related bankrupt-
cies. The valuation methodology includes an analysis of the
population likely to have been exposed to asbestos containing
products, epidemiological studies to estimate the number of
people likely to develop asbestos related diseases, NARCO
claims filing history, the pending inventory of NARCO asbestos
related claims and payment rates expected to be established
by the NARCO trust.
Honeywell has substantial insurance that reimburses it for
portions of the costs incurred to settle NARCO related claims
and court judgments as well as defense costs. This coverage is
provided by a large number of insurance policies written by
dozens of insurance companies in both the domestic insurance
market and the London excess market. At December 31, 2003,
a significant portion of this coverage is with London-based
insurance companies under a coverage-in-place agreement.
Coverage-in-place agreements are settlement agreements
between policyholders and the insurers specifying the terms
and conditions under which coverage will be applied as claims
are presented for payment. These agreements govern such
things as what events will be deemed to trigger coverage, how
liability for a claim will be allocated among insurers and what
procedures the policyholder must follow in order to obligate
the insurer to pay claims. We conducted an analysis to deter-
mine the amount of insurance that we estimate is probable that
we will recover in relation to payment of current and projected
future claims. While the substantial majority of our insurance
carriers are solvent, some of our individual carriers are insol-
vent, which has been considered in our analysis of probable
recoveries. Some of our insurance carriers have challenged
our right to enter into settlement agreements resolving all
NARCO related asbestos claims against Honeywell. However,
we believe there is no factual or legal basis for such challenges
and we believe that it is probable that we will prevail in the
resolution of, or in any litigation that is brought regarding these
disputes and, as of December 31, 2003, we have recognized
approximately $100 million in probable insurance recoveries
from these carriers. We are in advanced ongoing settlement
discussions with these carriers and while we cannot predict the
outcome of these discussions we expect that a substantial
majority of the carriers will participate in the settlement agree-
ment that is being negotiated. The amounts that we expect to
realize through the settlement process are consistent with our
reserves. We made judgments concerning insurance coverage
that we believe are reasonable and consistent with our histori-
cal dealings with our insurers, our knowledge of any pertinent
solvency issues surrounding insurers and various judicial
determinations relevant to our insurance programs. Based on
our analysis, during the fourth quarter of 2002 we recorded
insurance recoveries that were deemed probable through 2018
of $1.8 billion. A portion of this insurance has been received, as
discussed below.
Projecting future events is subject to many uncertainties that
could cause the NARCO related asbestos liabilities to be higher
or lower than those projected and recorded. There is no assur-
ance that a plan of reorganization will be proposed or
confirmed, that insurance recoveries will be timely or whether
there will be any NARCO related asbestos claims beyond 2018.
Given the inherent uncertainty in predicting future events, we
review our estimates periodically, and update them based on
our experience and other relevant factors. Similarly we will
reevaluate our projections concerning our probable insurance
recoveries in light of any changes to the projected liability or
other developments that may impact insurance recoveries.
Friction ProductsHoneywell’s Bendix Friction Materials (Bendix) business manu-
factured automotive brake pads that contained chrysotile
asbestos in an encapsulated form. There is a group of existing
and potential claimants consisting largely of individuals that
allege to have performed brake replacements.
From 1981 through December 31, 2003, we have resolved about
64,000 Bendix related asbestos claims including trials, cover-
ing 120 plaintiffs, which resulted in 115 favorable verdicts.
Trials covering five individuals resulted in adverse verdicts;
however, two of these verdicts were reversed on appeal and the
remaining three claims were settled.
Through the second quarter of 2002, Honeywell had no out-of-
pocket costs for Bendix related asbestos claims since its
insurance deductible was satisfied many years ago. Beginning
with claim payments made in the third quarter of 2002,
Honeywell began advancing indemnity and defense claim
costs. During the years ended December 31, 2003 and 2002,
those indemnity and defense costs amounted to approximately

$112 and $70 million, respectively. Approximately 50 percent of
these amounts are deemed probable to be reimbursed by
insurance. During the year ended December 31, 2003
Honeywell collected $90 million in insurance reimbursements
and settlements related to asbestos claims. See further dis-
cussion of insurance coverage below.
The following tables present information regarding asbestos
claims activity during the past two years:
Claims Activity 2003 2002
Claims Unresolved at the beginning of year . . . 50,821 47,000
Claims Filed . . . . . . . . . . . . . . . . . . . . . . . . . . . . . 25,765 10,000
Claims Resolved . . . . . . . . . . . . . . . . . . . . . . . . . (3,610) (6,179)
Claims Unresolved at the end of year . . . . . . . . 72,976 50,821
Disease Distribution of Unresolved Claims 2003 2002
Mesothelioma and Other Cancer Claims . . . . . 3,277 3,810
Other Claims . . . . . . . . . . . . . . . . . . . . . . . . . . . . 69,699 47,011
Total Claims . . . . . . . . . . . . . . . . . . . . . . . . . . . . . 72,976 50,821
Approximately 20 percent of the 73,000 pending claims are on
the inactive, deferred, or similar dockets established in some
jurisdictions for claimants who allege minimal or no impair-
ment. The approximately 73,000 pending claims also include
claims filed in jurisdictions such as Texas, Virginia and
Mississippi that allow for consolidated filings. In these jurisdic-
tions, plaintiffs are permitted to file complaints against a
pre-determined master list of defendants, regardless of
whether they have claims against each individual defendant.
Many of these plaintiffs may not actually have claims against
Honeywell. Based on state rules and prior experience in these
jurisdictions, we anticipate that many of these claims will ulti-
mately be dismissed. During the second quarter of 2003,
Honeywell was served with numerous complaints filed in
Mississippi in advance of the January 1, 2003 effective date for
tort reform in that state. Also during 2003, Honeywell experi-
enced an increase in nonmalignancy filings that we believe
were in response to the possibility of federal legislation. Based
on prior experience, we anticipate that many of these claims
will be placed on deferred, inactive or similar dockets or be
dismissed. Honeywell has experienced average resolution
values excluding legal costs for malignant claims of approxi-
mately ninety five thousand and one hundred sixty six thousand
dollars in 2003 and 2002, respectively. Honeywell has experi-
enced average resolution values excluding legal costs for
nonmalignant claims of approximately three thousand five
hundred and one thousand three hundred dollars in 2003 and
2002, respectively. It is not possible to predict whether resolu-
tion values for Bendix related asbestos claims will increase,
decrease or stabilize in the future.
At December 31, 2003, we had accrued approximately $250
million for pending asbestos related liability claims. Honeywell
retained the expert services of HR&A (see discussion of HR&A
under Refractory products above) to assist in developing the
estimated liability. The estimate is based on the number of
pending claims at December 31, 2003, disease classifications,
expected settlement values and historic dismissal rates. We
cannot reasonably estimate losses which could arise from
future Bendix related asbestos claims because we cannot
predict how many additional claims may be brought against us,
the allegations in such claims or their probable outcomes and
resulting settlement values in the tort system.
Honeywell presently has approximately $1.9 billion of insur-
ance coverage remaining with respect to pending Bendix
related asbestos claims as well as claims which may be filed
against us in the future. This coverage is provided by a large
number of insurance policies written by dozens of insurance
companies in both the domestic insurance market and the
London excess market. Although Honeywell has approximately
$1.9 billion in insurance, there are gaps in our coverage due to
insurance company insolvencies, the comprehensive policy
buy-back settlement with Equitas as discussed below and
certain uninsured periods. We analyzed the amount of insur-
ance that we estimate is probable that we will recover in
relation to payment of asbestos related claims and determined
that approximately 50 percent of expenditures for such claims
are recoverable by insurance. While the substantial majority of
our insurance carriers are solvent, some of our individual car-
riers are insolvent, which has been considered in our analysis
of probable recoveries. We made judgments concerning insur-
ance coverage that we believe are reasonable and consistent
with our historical dealings with our insurers, our knowledge of
any pertinent solvency issues surrounding insurers and various
judicial determinations relevant to our insurance programs.
Based on our analysis, at December 31, 2003 we had amounts
receivable from our insurers of approximately $210 million
representing probable reimbursements associated with our
liability for pending claims as well as amounts due to us for
previously settled and paid claims related to the estimated
liabilities for pending claims.
In the fourth quarter of 2002, we recorded a charge of $167
million consisting of a $131 million reserve for the then con-
templated sale of Bendix to Federal-Mogul, our estimate of
asbestos related liability net of insurance recoveries and costs
to complete the anticipated transaction with Federal-Mogul.
Discussions regarding this transaction have been terminated.
68

69
Honeywell believes it has sufficient insurance coverage and
reserves to cover all pending Bendix related asbestos claims.
Although it is impossible to predict the outcome of pending
claims or to reasonably estimate losses which could arise from
future Bendix related asbestos claims, we do not believe that
such claims would have a material adverse effect on our con-
solidated financial position in light of our insurance coverage
and our prior experience in resolving such claims. If the rate
and types of claims filed, the average indemnity cost of such
claims and the period of time over which claim settlements are
paid (collectively, the “Variable Claims Factors”) does not sub-
stantially increase, Honeywell would not expect future Bendix
related asbestos claims to have a material adverse effect on
our results of operations or operating cash flows in any fiscal
year. No assurances can be given, however, that the Variable
Claims Factors will not substantially increase.
Refractory and Friction ProductsDuring the twelve months ended December 31, 2003, we made
asbestos related payments of $557 million, including legal
fees. During the twelve months ended December 31, 2003, we
received $664 million in insurance reimbursements including
$472 million in cash received from Equitas related to a compre-
hensive policy buy-back settlement of all insurance claims by
Honeywell against Equitas. The settlement resolves all claims
by Honeywell against Equitas arising from asbestos claims
related to NARCO and Bendix.
NARCO and Bendix asbestos related balances are included in
the following balance sheet accounts:
December 31,
(Dollars in Millions) 2003 2002
Other current assets . . . . . . . . . . . . . . . . . . . . . . $ 130 $ 320
Insurance recoveries for asbestos
related liabilities . . . . . . . . . . . . . . . . . . . . . . . 1,317 1,636
$1,447 $1,956
Accrued liabilities . . . . . . . . . . . . . . . . . . . . . . . . $ 730 $ 741
Asbestos related liabilities . . . . . . . . . . . . . . . . . 2,279 2,700
$3,009 $3,441
We are monitoring proposals for federal asbestos legislation
pending in the United States Congress. Due to the uncertainty
surrounding the proposed legislation, it is not possible at this
point in time to determine what impact such legislation would
have on the NARCO bankruptcy strategy or our asbestos liabili-
ties and related insurance recoveries.
Warranties and Guarantees
We have issued or are a party to the following direct and indi-
rect guarantees at December 31, 2003:
MaximumPotential
Future(Dollars in Millions) Payments
Operating lease residual values . . . . . . . . . . . . . . . . . . . . . $ 73Other third parties’ financing . . . . . . . . . . . . . . . . . . . . . . . 5Unconsolidated affiliates’ financing . . . . . . . . . . . . . . . . . . 38Customer and vendor financing . . . . . . . . . . . . . . . . . . . . . 24
$140
We do not expect that these guarantees will have a material
adverse effect on our consolidated results of operations, finan-
cial position or liquidity.
In connection with the disposition of certain businesses and
facilities we have indemnified the purchasers for the expected
cost of remediation of environmental contamination, if any,
existing on the date of disposition. Such expected costs are
accrued when environmental assessments are made or
remedial efforts are probable and the costs can be
reasonably estimated.
In the normal course of business we issue product warranties
and product performance guarantees. We accrue for the esti-
mated cost of product warranties and performance guarantees
based on contract terms and historical experience at the time
of sale. Adjustments to initial obligations for warranties and
guarantees are made as changes in the obligations become
reasonably estimable. The following table summarizes infor-
mation concerning our recorded obligations for product
warranties and product performance guarantees:
December 31,
(Dollars in Millions) 2003 2002 2001
Beginning of year . . . . . . . . . . . . . . . . $ 217 $ 217 $ 198
Accruals for warranties/guarantees
issued during the year . . . . . . . . . . 215 158 216
Adjustment of pre-existing
warranties/guarantees . . . . . . . . . . 35 (18) (3)
Settlement of warranty/guarantee
claims . . . . . . . . . . . . . . . . . . . . . . . (192) (140) (194)
End of year $ 275 $ 217 $ 217
Product warranties and product performance guarantees are
included in the following balance sheet accounts:
December 31,
(Dollars in Millions) 2003 2002
Accrued liabilities . . . . . . . . . . . . . . . . . . . . . . . . $242 $ 179
Other liabilities . . . . . . . . . . . . . . . . . . . . . . . . . . . 33 38
$275 $ 217
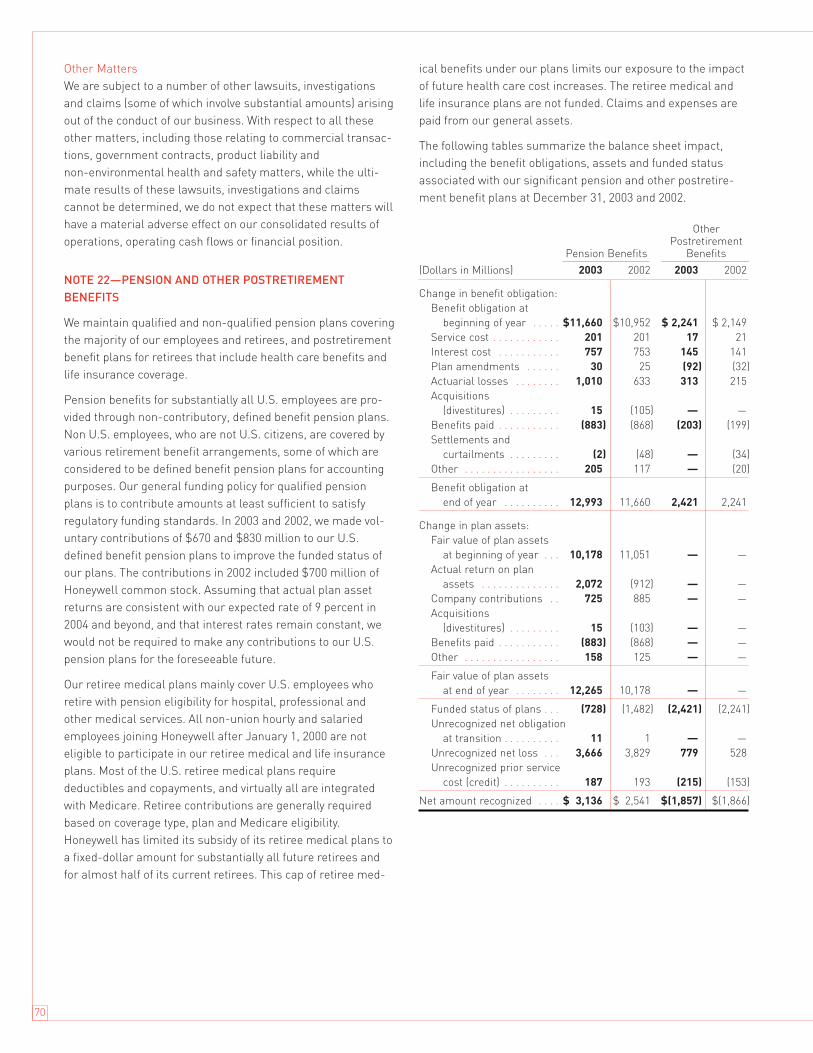
Other Matters
We are subject to a number of other lawsuits, investigations
and claims (some of which involve substantial amounts) arising
out of the conduct of our business. With respect to all these
other matters, including those relating to commercial transac-
tions, government contracts, product liability and
non-environmental health and safety matters, while the ulti-
mate results of these lawsuits, investigations and claims
cannot be determined, we do not expect that these matters will
have a material adverse effect on our consolidated results of
operations, operating cash flows or financial position.
NOTE 22—PENSION AND OTHER POSTRETIREMENTBENEFITS
We maintain qualified and non-qualified pension plans covering
the majority of our employees and retirees, and postretirement
benefit plans for retirees that include health care benefits and
life insurance coverage.
Pension benefits for substantially all U.S. employees are pro-
vided through non-contributory, defined benefit pension plans.
Non U.S. employees, who are not U.S. citizens, are covered by
various retirement benefit arrangements, some of which are
considered to be defined benefit pension plans for accounting
purposes. Our general funding policy for qualified pension
plans is to contribute amounts at least sufficient to satisfy
regulatory funding standards. In 2003 and 2002, we made vol-
untary contributions of $670 and $830 million to our U.S.
defined benefit pension plans to improve the funded status of
our plans. The contributions in 2002 included $700 million of
Honeywell common stock. Assuming that actual plan asset
returns are consistent with our expected rate of 9 percent in
2004 and beyond, and that interest rates remain constant, we
would not be required to make any contributions to our U.S.
pension plans for the foreseeable future.
Our retiree medical plans mainly cover U.S. employees who
retire with pension eligibility for hospital, professional and
other medical services. All non-union hourly and salaried
employees joining Honeywell after January 1, 2000 are not
eligible to participate in our retiree medical and life insurance
plans. Most of the U.S. retiree medical plans require
deductibles and copayments, and virtually all are integrated
with Medicare. Retiree contributions are generally required
based on coverage type, plan and Medicare eligibility.
Honeywell has limited its subsidy of its retiree medical plans to
a fixed-dollar amount for substantially all future retirees and
for almost half of its current retirees. This cap of retiree med-
ical benefits under our plans limits our exposure to the impact
of future health care cost increases. The retiree medical and
life insurance plans are not funded. Claims and expenses are
paid from our general assets.
The following tables summarize the balance sheet impact,
including the benefit obligations, assets and funded status
associated with our significant pension and other postretire-
ment benefit plans at December 31, 2003 and 2002.
OtherPostretirement
Pension Benefits Benefits________________ ________________
(Dollars in Millions) 2003 2002 2003 2002
Change in benefit obligation:
Benefit obligation at
beginning of year . . . . . $11,660 $10,952 $ 2,241 $ 2,149
Service cost . . . . . . . . . . . . 201 201 17 21
Interest cost . . . . . . . . . . . 757 753 145 141
Plan amendments . . . . . . 30 25 (92) (32)
Actuarial losses . . . . . . . . 1,010 633 313 215
Acquisitions
(divestitures) . . . . . . . . . 15 (105) — —
Benefits paid . . . . . . . . . . . (883) (868) (203) (199)
Settlements and
curtailments . . . . . . . . . (2) (48) — (34)
Other . . . . . . . . . . . . . . . . . 205 117 — (20)
Benefit obligation at
end of year . . . . . . . . . . 12,993 11,660 2,421 2,241
Change in plan assets:
Fair value of plan assets
at beginning of year . . . 10,178 11,051 — —
Actual return on plan
assets . . . . . . . . . . . . . . 2,072 (912) — —
Company contributions . . 725 885 — —
Acquisitions
(divestitures) . . . . . . . . . 15 (103) — —
Benefits paid . . . . . . . . . . . (883) (868) — —
Other . . . . . . . . . . . . . . . . . 158 125 — —
Fair value of plan assets
at end of year . . . . . . . . 12,265 10,178 — —
Funded status of plans . . . (728) (1,482) (2,421) (2,241)
Unrecognized net obligation
at transition . . . . . . . . . . 11 1 — —
Unrecognized net loss . . . 3,666 3,829 779 528
Unrecognized prior service
cost (credit) . . . . . . . . . . 187 193 (215) (153)
Net amount recognized . . . . $ 3,136 $ 2,541 $(1,857) $(1,866)
70

71
OtherPostretirement
Pension Benefits Benefits
(Dollars in Millions) 2003 2002 2003 2002
Amounts recognized in
Consolidated Balance Sheet
consist of:
Prepaid pension benefit
cost . . . . . . . . . . . . . . . . $ 3,173 $ 2,242 $ — $ —
Intangible asset (1) . . . . . . . 101 101 — —
Accrued liabilities . . . . . . . — — (197) (197)
Postretirement benefit
obligations other than
pensions (2) . . . . . . . . . . . — — (1,660) (1,669)
Accrued benefit
liability (3) . . . . . . . . . . . . (170) (134) — —
Additional minimum
liability (3) . . . . . . . . . . . . (453) (757) — —
Accumulated other
nonowner changes . . . . 485 1,089 — —
Net amount recognized. . . . . $ 3,136 $ 2,541 $(1,857) $(1,866)
(1) Included in Other Assets—Non-Current on Consolidated Balance Sheet.
(2) Excludes Non U.S. plans of $23 and $15 million in 2003 and 2002, respectively.
(3) Included in Other Liabilities—Non-Current on Consolidated Balance Sheet.
The accumulated benefit obligation for our U.S. defined benefit
pension plans was $10,996 and $9,785 million at December 31,
2003 and 2002, respectively.
Net periodic pension and other postretirement benefit
costs (income) for our significant plans include the
following components:
Pension Benefits
Years Ended
December 31,
(Dollars in Millions) 2003 2002 2001
Service cost . . . . . . . . . . . . . . . . . . . . . $ 201 $ 201 $ 194
Interest cost . . . . . . . . . . . . . . . . . . . . 757 753 765
Expected return on plan assets . . . . . (1,030) (1,164) (1,201)
Amortization of transition asset . . . . (7) (7) (11)
Amortization of prior service cost . . . 37 43 49
Recognition of actuarial
(gains) losses . . . . . . . . . . . . . . . . . 178 13 (52)
Net periodic benefit cost (income) . . 136 (161) (256)
Settlements and curtailments . . . . . . — 14 (54)
Net periodic benefit cost
(income) after settlements
and curtailments . . . . . . . . . . . . . . $ 136 $ (147) $ (310)
OtherPostretirement Benefits
Years EndedDecember 31,
(Dollars in Millions) 2003 2002 2001
Service cost . . . . . . . . . . . . . . . . . . . . . $ 17 $ 21 $ 20
Interest cost . . . . . . . . . . . . . . . . . . . . 145 141 142
Expected return on plan assets . . . . . — — —
Amortization of prior service
(credit) . . . . . . . . . . . . . . . . . . . . . . . (30) (22) (19)
Recognition of actuarial losses . . . . . 62 10 2
Net periodic benefit cost . . . . . . . . . . 194 150 145
Settlements and curtailments . . . . . . — (30) —
Net periodic benefit cost after
settlements and curtailments . . . . $ 194 $ 120 $ 145
Other PostretirementPension Benefits Benefits
2003 2002 2001 2003 2002 2001
Actuarial assumptions used to determine
benefit obligations as of December 31
(measurement date):
Discount rate . . . . . . . . . . . . . . . . . . . . . . . . . . . . . . . . . . . 6.00% 6.75% 7.25% 6.00% 6.75% 7.25%
Expected annual rate of compensation increase . . . . . . 4.00% 4.00% 4.00% — — —
Actuarial assumptions used to determine net
periodic benefit cost (income) for years ended
December 31:
Discount rate . . . . . . . . . . . . . . . . . . . . . . . . . . . . . . . . . . . 6.75% 7.25% 7.75% 6.75% 7.25% 7.75%
Expected rate of return on plan assets . . . . . . . . . . . . . . 9.00% 10.00% 10.00% — — —
Expected annual rate of compensation increase . . . . . . 4.00% 4.00% 4.00% — — —

Pension Benefits
Pension plans with accumulated benefit obligations exceeding
the fair value of plan assets were as follows at December 31,
2003 and 2002:
(Dollars in Millions) 2003 2002
Projected benefit obligation . . . . . . . . . . . $1,639 $4,315
Accumulated benefit obligation . . . . . . . . 1,566 4,036
Fair value of plan assets . . . . . . . . . . . . . . 906 3,109
SFAS No. 87 requires recognition of an additional minimum
pension liability if the fair value of plan assets is less than the
accumulated benefit obligation at the end of the plan year. In
2003, we recorded a non-cash adjustment to equity through
accumulated other nonowner changes of $369 million ($604
million on a pretax basis) to reduce the additional minimum
pension liability by $304 million and reinstate a portion of the
pension assets ($300 million) written off in the prior year’s
minimum pension liability adjustment. This 2003 adjustment
resulted from an increase in our pension assets in 2003 due to
the improvement in equity markets and our contribution of
$670 million to our U.S. plans. In 2002, due to the poor
performance of the equity markets which adversely affected
our pension assets and a decline in the discount rate, we
recorded a non-cash adjustment to equity through accumu-
lated other nonowner changes of $606 million ( $956 million on
a pretax basis) which increased the additional minimum pen-
sion liability.
Our U.S. pension plans assets were $10.9 and $9.0 billion at
December 31, 2003 and 2002, respectively. Our asset allocation
at December 31, 2003 and 2002 and target allocation for our
U.S. pension plans assets are as follows:
Percentage of PlansAssets at
Long-termDecember 31,
Target
Asset Category 2003 2002 Allocation
Equity securities . . . . . . . . . . . . . . . . 58% 54% 40–65%
Debt securities, including cash . . . 35 38 30–45
Real estate . . . . . . . . . . . . . . . . . . . . 5 5 2–8
Other . . . . . . . . . . . . . . . . . . . . . . . . . 2 3 2–4
100% 100%
Equity securities include Honeywell common stock of $544 and
$811 million at December 31, 2003 and 2002, respectively. An
independent fiduciary holds and makes all investment deci-
sions with respect to the Honeywell common stock.
Our asset investment strategy focuses on maintaining a diver-
sified portfolio, using various asset classes, in order to achieve
our long-term investment objectives on a risk adjusted basis.
To achieve our objectives, our investment policy requires that
our U.S. Master Retirement Trust be invested as follows:
(a) no less than 30 percent be invested in fixed income securi-
ties; (b) no more than 10 percent in high-yield securities; (c) no
more than 10 percent in private real estate investments; and (d)
no more than 6 percent in other investment alternatives involv-
ing limited partnerships of various types. There is no stated
limit on investments in publically-held U.S. and international
equity securities. Our actual invested positions in various secu-
rities changes over time based on short and longer-term
investment opportunities.
Our expected rate of return on plan assets of 9 percent is a
long-term rate based on historic plan asset returns over vary-
ing long-term periods combined with current market
conditions and broad asset mix considerations. The expected
rate of return is a long-term assumption and generally does
not change annually.
Other Postretirement Benefits
December 31,
2003 2002
Assumed health care cost trend rate:
Health care cost trend rate assumed
for next year . . . . . . . . . . . . . . . . . . . . . . . . 11.0% 9.0%
Rate that the cost trend rate gradually
declines to . . . . . . . . . . . . . . . . . . . . . . . . . 5.0% 5.0%
Year that the rate reaches the rate it
is assumed to remain at . . . . . . . . . . . . . 2010 2007
The assumed health care cost trend rate has a significant
effect on the amounts reported. A one-percentage-point
change in the assumed health care cost trend rate would have
the following effects:
1 percentage point
(Dollars in Millions) Increase Decrease
Effect on total of service and interest
cost components . . . . . . . . . . . . . . . . . . . . . . $ 8 $ (7)
Effect on postretirement benefit obligation . . $127 $(115)
In December 2003, the Medicare Prescription Drug, Improve-
ment and Modernization Act of 2003 (the Act) was signed into
law. The Act will offer on a voluntary basis, prescription drug
coverage to Medicare beneficiaries. The Act will also offer a
subsidy equal to 28 percent of the prescription drug costs
between $250 and $5,000 per plan participant to plan sponsors
who offer prescription drug coverage that is at least actuarially
equivalent to that offered by Medicare. In January 2004, the
FASB issued FASB Staff Position No. 106-1, “Accounting and
Disclosure Requirements Related to the Medicare Prescription
Drug, Improvement and Modernization Act of 2003” which
permits postretirement plan sponsors to make a one-time
election to defer accounting for the effects of the Act. We have
elected to defer this recognition because specific authoritative
guidance on the accounting for the federal subsidy is still pend-
72

73
ing and guidance on the application of actuarial equivalence is
also pending. Based on the current uncertainties surrounding
the accounting for the Act, we believe that it is not possible to
reasonably estimate the effect of the Act until such guidance is
issued. Therefore, all measures of accumulated postretirement
benefit obligation and net periodic postretirement benefit
cost reflected in the financial statements and accompanying
notes do not reflect the effects of the Act on our plans. We
recognize that when guidance on the accounting for the federal
subsidy is issued, we may be required to change previously
reported information.
Employee Savings Plans
We sponsor employee savings plans under which we match,
in the form of our common stock, certain eligible U.S.
employee savings plan contributions. Shares issued under
the stock match plans were 6.5, 5.6 and 4.9 million in 2003,
2002 and 2001, respectively, at a cost of $173, $173 and $185
million, respectively.
NOTE 23—SEGMENT FINANCIAL DATA
We globally manage our business operations through strategic
business units (SBUs) serving customers worldwide with aero-
space products and services,control, sensing and security
technologies for buildings, homes and industry, automotive
products and chemicals. Segment information is consistent
with how management reviews the businesses, makes invest-
ing and resource allocation decisions and assesses operating
performance. Based on similar economic and operational
characteristics, our SBUs are aggregated and managed in four
reportable segments as follows:
• Aerospace includes Engines, Systems and Services (auxiliary
power units; propulsion engines; environmental control sys-
tems; engine controls; repair and overhaul services;
hardware; logistics and power generation systems);
Aerospace Electronic Systems (flight safety communications,
navigation, radar and surveillance systems; aircraft and
airport lighting; management and technical services and
advanced systems and instruments); and Aircraft Landing
Systems (aircraft wheels and brakes).
• Automation and Control Solutions includes Automation and
Control Products (controls for heating, cooling, indoor air
quality, ventilation, humidification and home automation;
advanced software applications for home/building control
and optimization; sensors, switches, control systems and
instruments for measuring pressure, air flow, temperature,
electrical current and, security and fire detection, access
control and video surveillance systems); Building Solutions
(installs, maintains and upgrades systems that keep build-
ings safe, comfortable and productive); and Process Solutions
(provides a full range of automation and control solutions for
industrial plants, offering advanced software and automation
systems that integrate, control and monitor complex
processes in many types of industrial settings).
• Specialty Materials includes fibers; specialty films; interme-
diate chemicals; fluorine-based products; pharmaceutical
and agricultural chemicals; specialty waxes, adhesives and
sealants; process technology; wafer fabrication materials
and services.
• Transportation Systems includes Honeywell Turbo
Technologies (turbochargers and charge-air and thermal
systems); the Consumer Products Group (car care products
including anti-freeze, filters, spark plugs, cleaners, waxes
and additives); and Friction Materials (friction materials and
related brake system components).
The accounting policies of the segments are the same as those
described in Note 1. Honeywell’s senior management evaluates
segment performance based on segment profit. Segment profit
is business unit income (loss) before taxes excluding general
corporate unallocated expenses, gains (losses) on sales of
non-strategic businesses, equity income (loss), other income
(expense), interest and other financial charges, pension and
other postretirement benefits (expense) income and reposition-
ing, litigation, business impairment and other charges and
accounting changes. In 2003, Honeywell changed its definition
of segment profit to exclude pension and other postretirement
benefits (expense) income. Pension and other postretirement
benefits (expense) income is significantly impacted by external
factors such as investment returns, interest rates and other
actuarial assumptions that Honeywell does not consider
indicative of the underlying business segment operating per-
formance under the control of business unit management. All
periods presented in this annual report have been restated to
reflect this change. Intersegment sales approximate market
and are not significant. Reportable segment data follows:
Years Ended December 31,
(Dollars in Millions) 2003 2002 2001
Net sales
Aerospace . . . . . . . . . . . . . . . . . . . $ 8,813 $ 8,855 $ 9,653
Automation and Control Solutions 7,464 6,978 7,185
Specialty Materials . . . . . . . . . . . . 3,169 3,205 3,313
Transportation Systems . . . . . . . . 3,650 3,184 3,457
Corporate . . . . . . . . . . . . . . . . . . . . 7 52 44
$23,103 $22,274 $ 23,652
Depreciation
Aerospace . . . . . . . . . . . . . . . . . . . $ 215 $ 224 $ 232
Automation and Control Solutions 143 167 178
Specialty Materials . . . . . . . . . . . . 133 180 199
Transportation Systems . . . . . . . . 80 66 78
Corporate . . . . . . . . . . . . . . . . . . . . 24 34 37
$ 595 $ 671 $ 724

74
Years Ended December 31,
(Dollars in Millions) 2003 2002 2001
Goodwill and indefinite-lived intangible
asset amortization
Aerospace . . . . . . . . . . . . . . . . . . . $ — $ — $ 60
Automation and Control Solutions — — 92
Specialty Materials . . . . . . . . . . . . — — 32
Transportation Systems . . . . . . . . — — 20
$ — $ — $ 204
Segment profit
Aerospace . . . . . . . . . . . . . . . . . . . $ 1,221 $ 1,308 $ 1,599
Automation and Control Solutions 843 860 774
Specialty Materials . . . . . . . . . . . . 136 90 56
Transportation Systems . . . . . . . . 461 393 307
Corporate . . . . . . . . . . . . . . . . . . . . (142) (154) (153)
$ 2,519 $ 2,497 $ 2,583
Capital expenditures
Aerospace . . . . . . . . . . . . . . . . . . . $ 218 $ 182 $ 212
Automation and Control Solutions 100 106 154
Specialty Materials . . . . . . . . . . . . 144 233 325
Transportation Systems . . . . . . . . 108 108 172
Corporate . . . . . . . . . . . . . . . . . . . . 85 42 13
$ 655 $ 671 $ 876
December 31,
(Dollars in Millions) 2003 2002 2001
Total assets
Aerospace . . . . . . . . . . . . . . . . . . . $ 7,792 $ 7,006 $ 8,003
Automation and Control Solutions 7,590 7,017 6,827
Specialty Materials . . . . . . . . . . . . 3,239 3,517 4,053
Transportation Systems . . . . . . . . 2,612 2,206 2,195
Corporate . . . . . . . . . . . . . . . . . . . . 8,111 7,819 3,148
$29,344 $27,565 $24,226
A reconciliation of segment profit to consolidated income (loss)
before taxes and cumulative effect of accounting change is
as follows:
Years Ended December 31,
(Dollars in Millions) 2003 2002 2001
Segment profit . . . . . . . . . . . . . . . . . . $ 2,519 $ 2,497 $ 2,583
Gain (loss) on sale of non-strategic
businesses . . . . . . . . . . . . . . . . . . . 38 (124) —
Asbestos related litigation charges,
net of insurance . . . . . . . . . . . . . . . — (1,548) (159)
Business impairment charges . . . . . . — (877) (145)
Repositioning and other charges (1) . . (276) (606) (2,285)
Pension and other postretirement
benefits (expense) income (1). . . . . . (325) 11 165
Equity in income (loss) of affiliated
companies . . . . . . . . . . . . . . . . . . . . 38 42 (193)
Other income (expense) . . . . . . . . . . . (19) 4 17
Interest and other financial charges . (335) (344) (405)
Income (loss) before taxes and
cumulative effect of accounting
change . . . . . . . . . . . . . . . . . . . . . . . $ 1,640 $ (945) $ (422)
(1) Amounts included in cost of goods sold and selling, general and
administrative expenses.
NOTE 24—GEOGRAPHIC AREAS—FINANCIAL DATA
(Dollars in Millions) Years Ended December 31,
Net Sales (1) 2003 2002 2001
United States . . . . . . . . . . . . . . . . . . . . $15,178 $15,522 $17,421
Europe . . . . . . . . . . . . . . . . . . . . . . . . . 5,433 4,483 4,264
Other International . . . . . . . . . . . . . . . 2,492 2,269 1,967
$23,103 $22,274 $23,652
(Dollars in Millions) December 31,
Long-lived Assets (2) 2003 2002 2001
United States . . . . . . . . . . . . . . . . . . . . $ 8,963 $ 8,665 $ 9,402
Europe . . . . . . . . . . . . . . . . . . . . . . . . . 1,833 1,756 1,491
Other International . . . . . . . . . . . . . . . 386 406 396
$11,182 $10,827 $11,289
(1) Sales between geographic areas approximate market and are not significant.
Net sales are classified according to their country of origin. Included in United
States net sales are export sales of $2,246, $2,249 and $3,074 million in 2003,
2002 and 2001, respectively.
(2) Long-lived assets are comprised of property, plant and equipment, goodwill
and other intangible assets.
NOTE 25—SUPPLEMENTAL CASH FLOW INFORMATION
Years Ended December 31,
(Dollars in Millions) 2003 2002 2001
Interest paid, net of amounts
capitalized . . . . . . . . . . . . . . . . . . . . $ 367 $ 352 $ 297
Income taxes paid, net of refunds . . . 31 (14) 79
Non-cash investing and financing
activities:
Common stock contributed to U.S.
pension plans . . . . . . . . . . . . . . . . — 700 —
Common stock contributed to
U.S. savings plans . . . . . . . . . . . . 173 173 185
Debt assumed in the purchase of
leased assets . . . . . . . . . . . . . . . . 267 — —
Investment securities received in
connection with sale of BCVS
business . . . . . . . . . . . . . . . . . . . . — 250 —

NOTE 26—UNAUDITED QUARTERLY FINANCIAL INFORMATION
(Dollars in Millions,
Except Per Share Amounts) 2003 2002
Mar. 31 June 30 Sept. 30 Dec. 31 Year Mar. 31 June 30 Sept. 30 Dec. 31 Year(1) (2)(3)(4) (5)(6) (7)(8) (9)(10) (11)(12) (13)(14)
Net sales . . . . . . . $5,399 $5,749 $5,768 $6,187 $23,103 $5,199 $5,651 $5,569 $5,855 $22,274
Gross profit . . . . . . 1,159 1,235 1,259 1,215 4,868 1,126 1,220 1,333 980 4,659
Income (loss)
before cumulative
effect of
accounting
change . . . . . . . 274 319 344 407 1,344 376 459 412 (1,467) (220)
Net income (loss) . 254 319 344 407 1,324 376 459 412 (1,467) (220)
Earnings (loss)
per share—
basic:
Income (loss)
before cumulative
effect of accounting
change . . . . . .32 .37 .40 .47 1.56 .46 .56 .50 (1.78) (.27)
Net income (loss) .30 .37 .40 .47 1.54 .46 .56 .50 (1.78) (.27)
Earnings (loss) per
share—assuming
dilution:
Income (loss) before
cumulative effect
of accounting
change . . . . . .32 .37 .40 .47 1.56 .46 .56 .50 (1.78) (15) (.27) (15)
Net income (loss) .30 .37 .40 .47 1.54 .46 .56 .50 (1.78) (15) (.27) (15)
Dividends paid . . . .1875 .1875 .1875 .1875 .75 .1875 .1875 .1875 .1875 .75
Market price (16)
High . . . . . . . . . . 25.65 29.02 30.06 33.43 33.43 40.37 40.76 36.50 27.08 40.76
Low . . . . . . . . . . 20.73 21.61 26.22 26.56 20.73 29.11 34.85 21.66 19.20 19.20
(1) Includes the January 1, 2003 adoption of SFAS No. 143. This adoption resulted in an after-tax cumulative effect expense adjustment of $20 million, or $0.02 per share.
(2) Includes a $34 million provision for legacy environmental matters deemed probable and reasonably estimable in the second quarter of 2003 and net repositioning and
other charges. Total after-tax charge was $21 million, or $0.03 per share. The total pretax charge included in gross profit was $29 million.
(3) Includes an after-tax gain of $9 million, or $0.01 per share, on the sale of our Engineering Plastics business.
(4) Includes an after-tax gain of $15 million, or $0.02 per share, related to the settlement of a patent infringement lawsuit.
(5) Includes a $30 million provision for legacy environmental matters deemed probable and reasonably estimable in the third quarter of 2003 and net repositioning and
other charges. Total after-tax charge was $1 million, with no effect on earnings per share. The total pretax charge included in gross profit was $26 million.
(6) Includes an after-tax loss of $3 million, with no effect on earnings per share, on the sale of several non-strategic businesses.
(7) Includes a $214 million provision for legacy environmental matters deemed probable and reasonably estimable in the fourth quarter of 2003 and net repositioning and
other charges. Total after-tax charge was $19 million, or $0.02 per share. The total pretax charge included in gross profit was $217 million.
(8) Includes an after-tax loss of $2 million, with no effect on earnings per share, on adjustments to sales of non-strategic businesses in the third quarter of 2003.
(9) Includes a $53 million provision for net repositioning charges and business impairment charges of $43 million for the write-down of long-lived assets of our Friction
Materials business and a chemical manufacturing facility. The total pretax charge was $96 million, after-tax $69 million, or $0.08 per share. The total pretax charge
included in gross profit was $46 million.
(10) Includes an after-tax gain of $79 million, or $0.09 per share, on the sale of our Bendix Commercial Vehicle Systems business.
(11) Includes a $137 million provision for net repositioning and other charges, after-tax $93 million, or $0.11 per share. The total pretax charge included in gross profit
was $127 million.
(12) Includes an after-tax gain of $98 million, or $0.12 per share, on the sales of our Pharmaceutical Fine Chemicals and Automation and Control’s Consumer
Products businesses.
(13) Includes a $444 million provision for net repositioning and other charges, business impairment charges of $834 million and asbestos related litigation charges of
$1,548 million. The total pretax charge was $2,826 million, after-tax $1,897 million, or $2.30 per share. The total pretax charge included in gross profit was
$444 million.
(14) Includes an after-tax gain of $18 million, or $0.02 per share, on the sale of our Advanced Circuits business.
(15) Dilutive securities issuable in connection with stock plans have been excluded from the calculation of loss per share because their effect would reduce the loss
per share.
(16) From composite tape—stock is primarily traded on the New York Stock Exchange.
75

76
MANAGEMENT’S RESPONSIBILITY FOR FINANCIAL STATEMENTSHoneywell International Inc.
The consolidated financial statements of Honeywell International Inc. and subsidiaries are the responsibility of the Company’s
management and have been prepared in accordance with generally accepted accounting principles in the United States of America.
Management is responsible for the integrity and objectivity of the financial statements, including estimates and judgments
reflected in them, and fulfills this responsibility primarily by establishing and maintaining accounting systems and practices sup-
ported by internal controls.
Our internal controls are designed to provide reasonable assurance as to the integrity and reliability of our consolidated financial
statements and to adequately safeguard, verify and maintain accountability of assets. Our internal controls include disclosure con-
trols and procedures designed to ensure timely, accurate and complete disclosure. These internal controls are based on
established written policies and procedures, are implemented by trained and skilled personnel, and are monitored and evaluated
by management.
PricewaterhouseCoopers LLP, independent auditors, are retained to audit Honeywell International Inc.’s consolidated financial
statements. Their accompanying report is based on an audit conducted in accordance with auditing standards generally accepted in
the United States of America, which include the consideration of the Company’s internal controls to establish the basis for deter-
mining the nature, timing and extent of audit tests to be applied.
Our Board of Directors exercises its responsibility for these financial statements through its Audit Committee, which consists
entirely of independent, non-employee Directors. The Audit Committee meets regularly with the independent auditors and with
the Company’s internal auditors, both privately and with management present, to review accounting, auditing, internal control and
financial reporting matters.
David M. Cote David J. Anderson
Chairman and Chief Senior Vice President and
Executive Officer Chief Financial Officer
REPORT OF INDEPENDENT AUDITORSTO THE BOARD OF DIRECTORS AND SHAREOWNERS OF HONEYWELL INTERNATIONAL INC.
In our opinion, the accompanying consolidated balance sheet and the related consolidated statements of operations, of shareown-
ers’ equity and of cash flows present fairly, in all material respects, the financial position of Honeywell International Inc. and its
subsidiaries at December 31, 2003 and 2002, and the results of their operations and their cash flows for each of the three years in
the period ended December 31, 2003 in conformity with accounting principles generally accepted in the United States of America.
These financial statements are the responsibility of the Company’s management; our responsibility is to express an opinion on
these financial statements based on our audits. We conducted our audits of these statements in accordance with auditing stan-
dards generally accepted in the United States of America, which require that we plan and perform the audit to obtain reasonable
assurance about whether the financial statements are free of material misstatement. An audit includes examining, on a test basis,
evidence supporting the amounts and disclosures in the financial statements, assessing the accounting principles used and signifi-
cant estimates made by management, and evaluating the overall financial statement presentation. We believe that our audits
provide a reasonable basis for our opinion.
As discussed in Note 1 to the consolidated financial statements, on January 1, 2003, the Company adopted the provisions of
Statement of Financial Accounting Standards No. 143, “Accounting for Asset Retirement Obligations,” and on January 1, 2002, the
Company adopted the provisions of Statement of Financial Accounting Standards No. 142, “Goodwill and Other Intangible Assets.”
PricewaterhouseCoopers LLP
Florham Park, New Jersey
February 5, 2004

77
SENIOR MANAGEMENT TEAM (FROM LEFT TO RIGHT) FRONT ROW: Robert J. Gillette, Rhonda G. Germany, Larry E. Kittelberger MIDDLE ROW: Nance K. Dicciani, William L. Ramsey, Robert D. Johnson, David J. Anderson BACK ROW: Peter M. Kreindler, Roger Fradin, Thomas W. Weidenkopf
THOMAS L. BUCKMASTERVice PresidentCorporate Communications andPresidentHoneywell Hometown Solutions
THOMAS F. LARKINSVice President Corporate Secretary and Deputy General Counsel
EDWARD T. TOKARVice President Investments
JOHN J. TUSVice PresidentCorporate Treasurer andController
LEADERSHIP TEAM
DAVID M. COTEChairman and Chief Executive Officer
NANCE K. DICCIANIPresident and Chief Executive OfficerSpecialty Materials
ROGER FRADINPresident and Chief Executive OfficerAutomation and Control Solutions
ROBERT J. GILLETTEPresident and Chief Executive OfficerTransportation Systems
ROBERT D. JOHNSON President and Chief Executive OfficerAerospace
RHONDA G. GERMANYCorporate Vice PresidentStrategy and BusinessDevelopment
WILLIAM L. RAMSEYCorporate Vice PresidentSix Sigma and Operations
DEAN M. FLATTPresidentAerospace Electronic Systems
RUSSELL D. TURNERPresidentEngines, Systems & Services
TIMOTHY J. KEATINGSenior Vice PresidentGovernment Relations
DAVID J. ANDERSONSenior Vice President and Chief Financial Officer
LARRY E. KITTELBERGERSenior Vice PresidentAdministration andChief Information Officer
PETER M. KREINDLERSenior Vice President and General Counsel
THOMAS W. WEIDENKOPFSenior Vice PresidentHuman Resources andCommunications

78
MICHAEL W. WRIGHT 1, 4
Retired Chairman, President and Chief Executive OfficerSUPERVALU INC.(food distributor and retailer)Age 65; elected in 1999
COMMITTEES OF THE BOARD
1 Audit CommitteeRussell E. Palmer, Chair
2 Corporate Governance and
Responsibility Committee Bruce Karatz, Chair
3 Management Development
and Compensation CommitteeRobert P. Luciano, Chair
4 Retirement Plans CommitteeMichael W. Wright, Chair
BOARD OF DIRECTORS
DAVID M. COTEChairman and Chief Executive OfficerHoneywell International Inc.Age: 51; elected in 2002
HANS W. BECHERER 3, 4
Former Chairman and Chief Executive Officer Deere & Company(mobile power machinery and financial services)Age 68; elected in 1991
GORDON M. BETHUNE 2, 3
Chairman and Chief Executive OfficerContinental Airlines, Inc.(international commercial airline company)Age 62; elected in 1999
MARSHALL N. CARTER 1, 2
Senior Fellow at the Center forBusiness and Government, John F. Kennedy School ofGovernment, Harvard University Age 63; elected in 1999
JAIME CHICO PARDO 2, 4
Vice Chairman and Chief Executive OfficerTelefonos de MexicoS.A. de C.V. (TELMEX)(telecommunications)Age 54; elected in 1999
IVAN G. SEIDENBERG 2, 3
Chairman and Chief Executive Officer Verizon Communications Inc.(telecommunications and information services provider)Age 57; elected in 1995
GENERAL ERIC K. SHINSEKI 1, 2
Retired U.S. Army Chief of Staff(U.S. Military)Age 61; elected in 2003
JOHN R. STAFFORD 1, 3
Retired Chairman of the BoardWyeth(pharmaceutical, health careproducts and animal health)Age 66; elected in 1993
LORD CLIVE R. HOLLICK 3, 4
Chief ExecutiveUnited Business Media plc(information and publication services)Age 58; elected in 2003
JAMES J. HOWARD 1, 4
Chairman EmeritusXcel Energy Inc. (energy company)Age 68; elected in 1999
BRUCE KARATZ 2, 3
Chairman and Chief Executive OfficerKB Home(residential and commercial builder)Age 58; elected in 1999
ROBERT P. LUCIANO 2, 3
Chairman EmeritusSchering-Plough Corporation(pharmaceuticals and consumerproducts)Age 70; elected in 1989
RUSSELL E. PALMER 1, 2
Chairman and Chief Executive OfficerThe Palmer Group (private investment firm)Age 69; elected in 1987
BOARD OF DIRECTORS (FROM LEFT TO RIGHT)FRONT ROW: General Eric K. Shinseki, David M. Cote, John R. Stafford MIDDLE ROW: Michael W. Wright, Lord Clive R. Hollick, James J. Howard, Bruce Karatz, Ivan G. Seidenberg BACK ROW: Gordon M. Bethune, Marshall N. Carter, Hans W. Becherer, Russell E. Palmer, Jaime Chico PardoNOT PICTURED: Robert P. Luciano

ANNUAL MEETING The Annual Meeting of Shareowners will be held
at 10:30 a.m. on Monday, April 26, 2004, at Honeywell’s corporate
headquarters, 101 Columbia Road, Morristown, New Jersey.
DIVIDENDS/SHAREOWNERS MATTERS Honeywell’s Dividend
Reinvestment and Share Purchase Plan provides for automatic rein-
vestment of common stock dividends at market price. Participants
also may add cash for the purchase of additional shares of common
stock without payment of any brokerage commission or service
charge. Honeywell offers Direct Registration, or paperless stock
ownership. This means that instead of getting a paper stock certifi-
cate to represent your shares, your shares are held in your name
and tracked electronically on our records.
The company has established a Direct Deposit of Dividends
service enabling registered shareowners to have their quarterly
dividend payments sent electronically to their bank accounts on
the payment date.
For more information on these services or for answers to questions
about dividend checks, stock transfers, or other shareowner matters,
please contact Honeywell’s transfer agent and registrar:
AMERICAN STOCK TRANSFER & TRUST CO.59 Maiden Lane
New York, NY 10038
1-800-647-7147
http://www.amstock.com
E-mail: [email protected]
FORM 10-KHoneywell's Form 10-K is available, free of charge, at
www.honeywell.com. When visiting the Website, click on
“SEC Filings” under the heading,”Investor Relations.” Copies
may also be obtained by contacting:
HONEYWELL INTERNATIONAL INC.Corporate Publications
P.O. Box 2245
Morristown, NJ 07962-2245
973-455-5402
STOCK EXCHANGE LISTINGS Honeywell’s Common Stock is listed
on the New York, Chicago, and Pacific stock exchanges under
the symbol HON. It is also listed on the London stock exchange.
Shareowners of record as of December 31, 2003, totaled 88,454.
GENERAL INQUIRIES For additional shareowner inquiries,
please contact Honeywell’s Shareowner Services at
1-800-647-7147. For information on Honeywell’s products,
please call the company’s Customer Support Center at
1-800-421-2133 or 602-365-2180. The company’s Internet address is
http://www.honeywell.com.
SHAREOWNER INFORMATION
De
sig
ne
d a
nd
Pro
du
ce
d b
y Ta
ylo
r &
Ive
s,
Inc.,
NYC

Honeywell International Inc.
101 Columbia Road
P.O. Box 2245
Morristown, NJ 07962-2245
USA
For more information about our company, visit our Internet site at: www.honeywell.com