Homelessness in the United States
17
O O Homelessness in the United States Beth Awalt This report serves as an introduction to the issue of homelessness in the United States. Each section details a little bit about the definitions of, causes of, violence against and ways to end homelessness (and poverty) in the United States. These sections each have a mixture of mathematics/statistics and research. Enjoy! The Basics of Homelessness and Poverty The population in the United States is increasing! Total Midyear Population in the United States Year Population 1980 22772646 3 1985 23846628 3 1990 25013189 4 1995 26655709 1 2000 28233863 1 2005 29573413 4 2006 29844421 5 2007 30113994 7 2008 30382464 6 Source: U.S. Census Bureau, International Data Base, www.census.gov/ipc/www/idb . with plots : pointplot 0, 227.726463 , 5, 238.466283 , 10, 250.131894 , 15, 266.557091 , 20, 282.338631 , 25, 295.734134 , 26, 298.444215 , 27, 301.139947 , 28, 303.824646 , labels = typeset "Year (1980=0)" , typeset "Population in millions of people" , labeldirections = horizontal ,
Transcript of Homelessness in the United States
OOOO OOOO
Homelessness in the United States
Beth Awalt
This report serves as an introduction to the issue of homelessness in the United States. Each section details a little bit about the definitions of, causes of, violence against and ways to end homelessness (andpoverty) in the United States. These sections each have a mixture of mathematics/statistics and research. Enjoy!
The Basics of Homelessness and Poverty
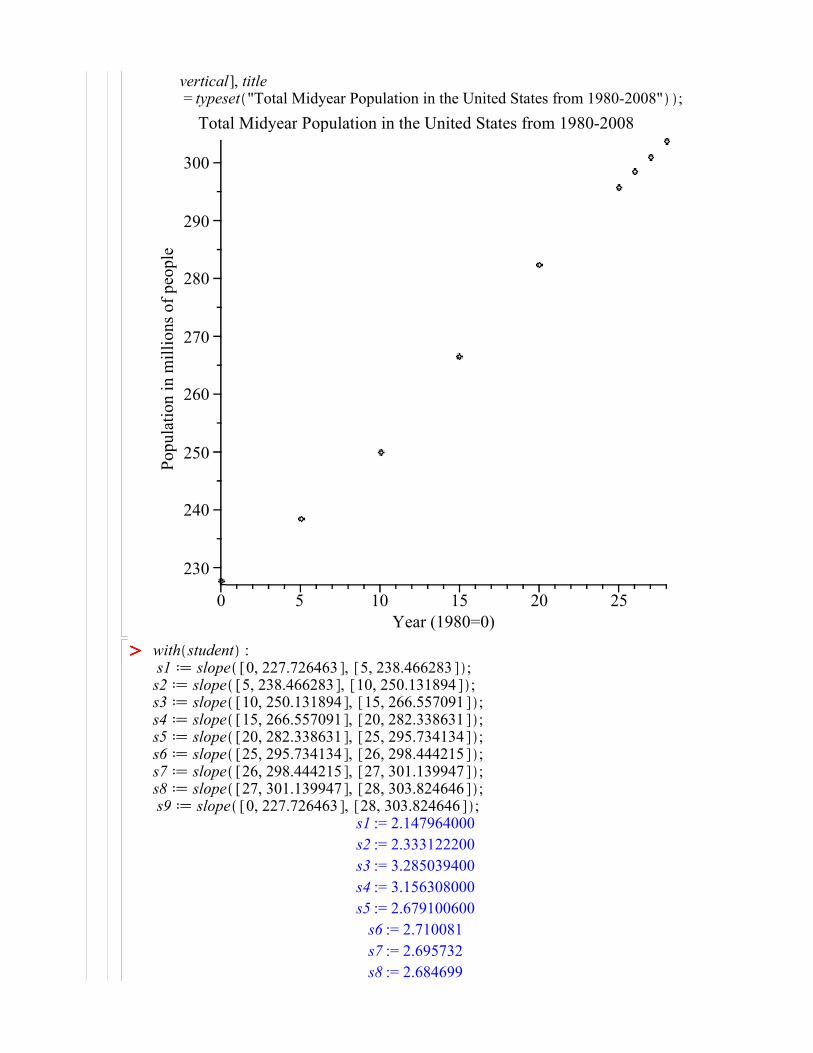
The population in the United States is increasing!
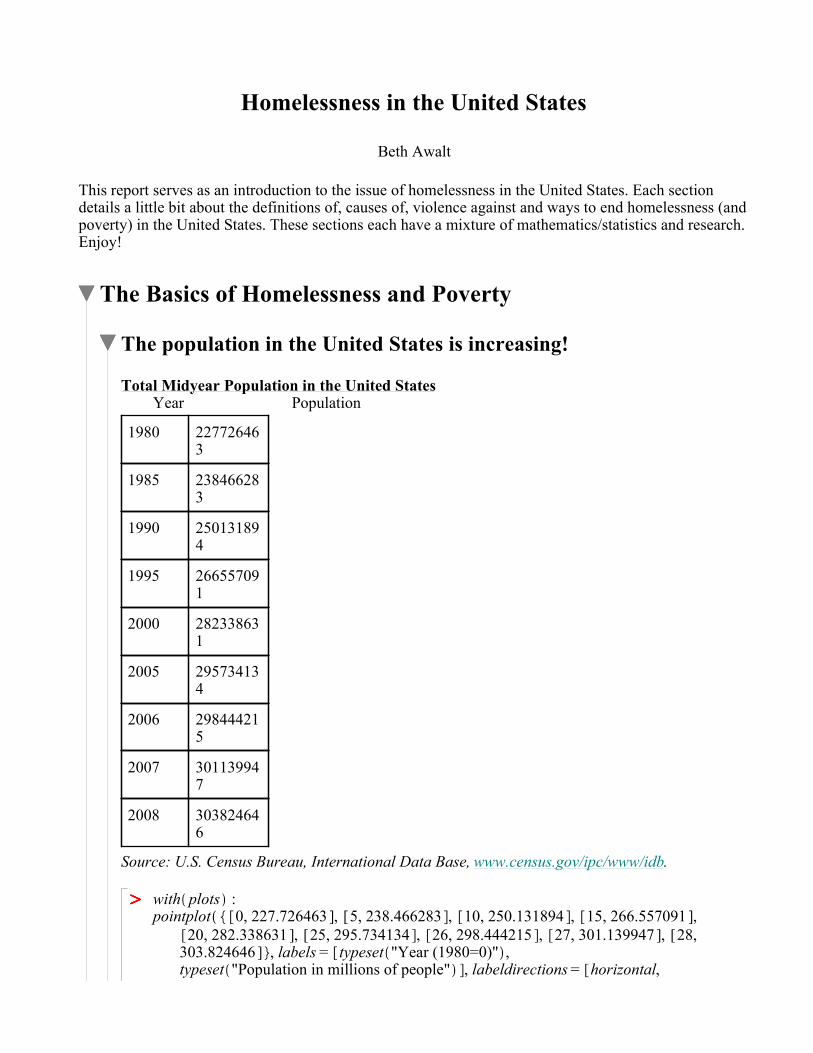
Total Midyear Population in the United States Year Population
1980 227726463
1985 238466283
1990 250131894
1995 266557091
2000 282338631
2005 295734134
2006 298444215
2007 301139947
2008 303824646
Source: U.S. Census Bureau, International Data Base, www.census.gov/ipc/www/idb.
with plots :pointplot 0, 227.726463 , 5, 238.466283 , 10, 250.131894 , 15, 266.557091 ,
20, 282.338631 , 25, 295.734134 , 26, 298.444215 , 27, 301.139947 , 28,303.824646 , labels = typeset "Year (1980=0)" ,typeset "Population in millions of people" , labeldirections = horizontal,
OOOO OOOO
vertical , title= typeset "Total Midyear Population in the United States from 1980-2008" ;
Year (1980=0)
0 5 10 15 20 25
Popula
tion in m
illions of peo
ple
230
240
250
260
270
280
290
300
Total Midyear Population in the United States from 1980-2008
with student : s1d slope 0, 227.726463 , 5, 238.466283 ;s2d slope 5, 238.466283 , 10, 250.131894 ;s3d slope 10, 250.131894 , 15, 266.557091 ;s4d slope 15, 266.557091 , 20, 282.338631 ;s5d slope 20, 282.338631 , 25, 295.734134 ;s6d slope 25, 295.734134 , 26, 298.444215 ;s7d slope 26, 298.444215 , 27, 301.139947 ;s8d slope 27, 301.139947 , 28, 303.824646 ; s9d slope 0, 227.726463 , 28, 303.824646 ;
s1 := 2.147964000
s2 := 2.333122200
s3 := 3.285039400
s4 := 3.156308000
s5 := 2.679100600
s6 := 2.710081
s7 := 2.695732
s8 := 2.684699
(1.1.2)(1.1.2)
OOOO OOOO
OOOO OOOO
(1.1.1)(1.1.1)s9 := 2.717792250
AverageSlopeds1Cs2Cs3Cs4Cs5Cs6Cs7Cs8
8AverageSlope := 2.711505775
Based on this scatterplot, we can see that the population is in fact increasing. By finding the slope (first between consecutive years, and then the average of that slope - very close to the slope from 2008 to 1980), we can calculate the increase in millions of people per year in the United States: about 2.71 million. Becuase the population is increasing each year, that also means the number of people in poverty is increasing each year. This means that the United States has to accomadate forthis steady increase in population, by responding with more jobs, public assistance and affordable housing for Americans.
What does it mean to be in poverty, and how many people in the
United States are in poverty?
"[National Coalition for the Homeless] believes that people without housing should be counted bythe Census for the same reasons that people with housing should be counted -- in order to have more comprehensive demographic information about communities, including more accurate data on poverty. However, NCH opposes the release of a separate "count" of people enumerated in homeless situations (at selected service sites and identified outdoor locations) because such a number would be, by its very nature, both inaccurate and misleading, and therefore lead to uninformed decision-making by policymakers." from www.nationalhomeless.org
"One limited measure of the growth in homelessness is the increase in the number of shelter beds over time. A 1991 study examined homelessness "rates" (the number of shelter beds in a city divided by the city's population) in 182 U.S. cities with populations over 100,000. The study found that homelessness rates tripled between 1981 and 1989 for the 182 cities as a group (Burt, 1997).
A 1997 review of research conducted over the past decade (1987-1997) in 11 communities and 4 states found that shelter capacity more than doubled in 9 communities and 3 states during that time period (National Coalition for the Homeless, 1997). In two communities and two states, shelter capacity tripled over the decade." from www.nationalhomeless.org.
Those who are homeless, however, are in poverty, so we can analyze factors of people in poverty. The table below shows the dollar amount used to determine poverty status, sorted by size of family and age of members. It is important to notice the changes in amount ne
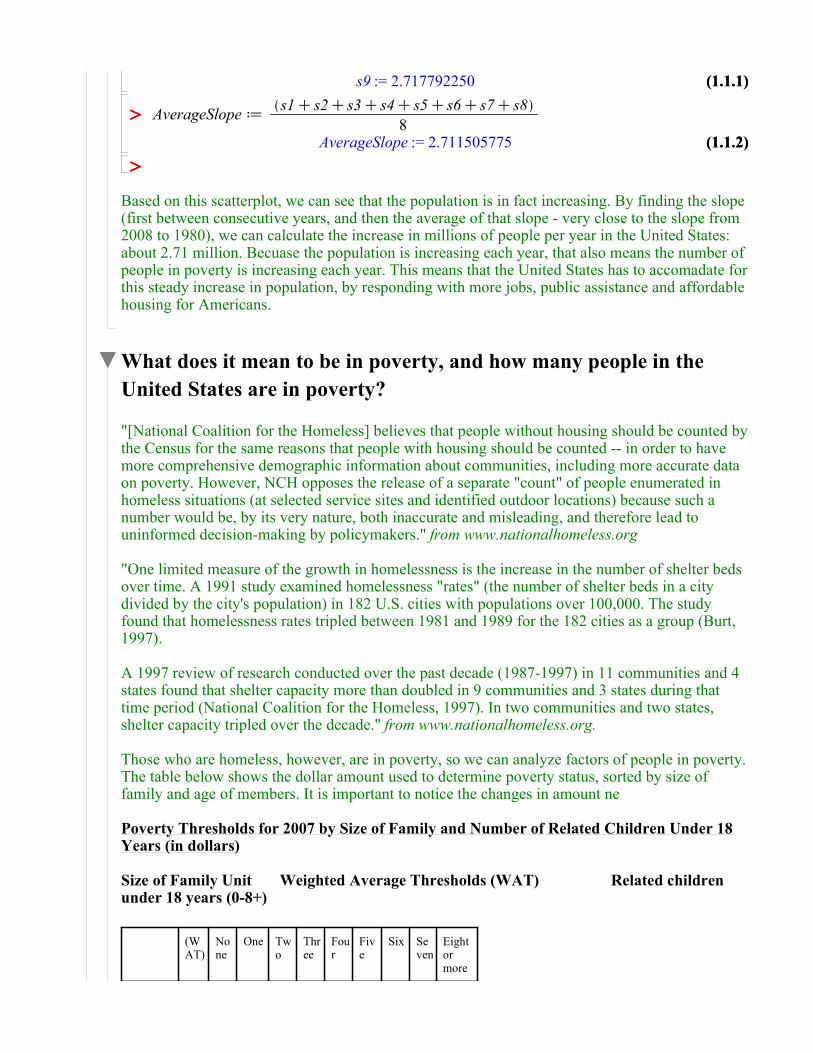
Poverty Thresholds for 2007 by Size of Family and Number of Related Children Under 18 Years (in dollars)
Size of Family Unit Weighted Average Thresholds (WAT) Related children under 18 years (0-8+)
(WAT)
None
One Two
Three
Four
Five
Six Seven
Eight or more
One person (unrelated)
10,590
...under 65 yrs.
10,787
10,787
...65 yrs. & older
9,944
9,944
Two people
13,540
...householder < 65 years
13,954
13,884
14,291
...householder 65 years +
12,550
12,533
14,237
Three people
16,530
16,218
16,689
16,705
Four people
21,203
21,386
21,736
21,027
21,100
Five people
25,080
25,791
26,166
25,364
24,744
24,366
Six people
28,323
29,664
29,782
29,168
28,579
27,705
27,187
Seven people
32,233
34,132
34,345
33,610
33,098
32,144
31,031
29,810
Eight people
35,816
38,174
38,511
37,818
37,210
36,348
35,255
34,116
33,827
Nine people +
42,739
45,921
46,143
45,529
45,014
44,168
43,004
41,952
41,691
40,085
Source: U.S. Census Bureau, www.census.gov.
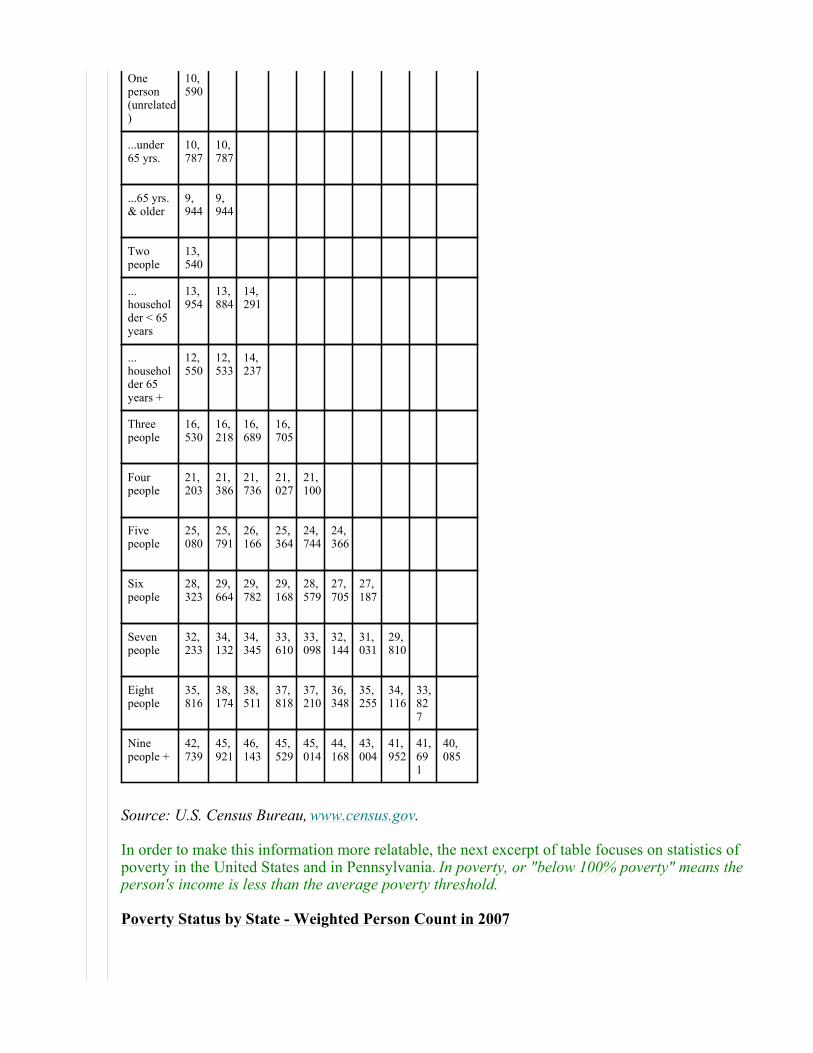
In order to make this information more relatable, the next excerpt of table focuses on statistics of poverty in the United States and in Pennsylvania. In poverty, or "below 100% poverty" means the person's income is less than the average poverty threshold.
Poverty Status by State - Weighted Person Count in 2007
OOOO OOOO
OOOO OOOO
OOOO OOOO
All Income Levels
In Poverty
Standard error
Percent
Standard error
United States
298,699,000
37,276,000
415,000
12.5
0.1
Pennsylvania
12,297,000
1,273,000
81,000 10.4 0.7
Source: U.S. Census Bureau, Current Population Survey, 2008 Annual Social and Economic Supplement.
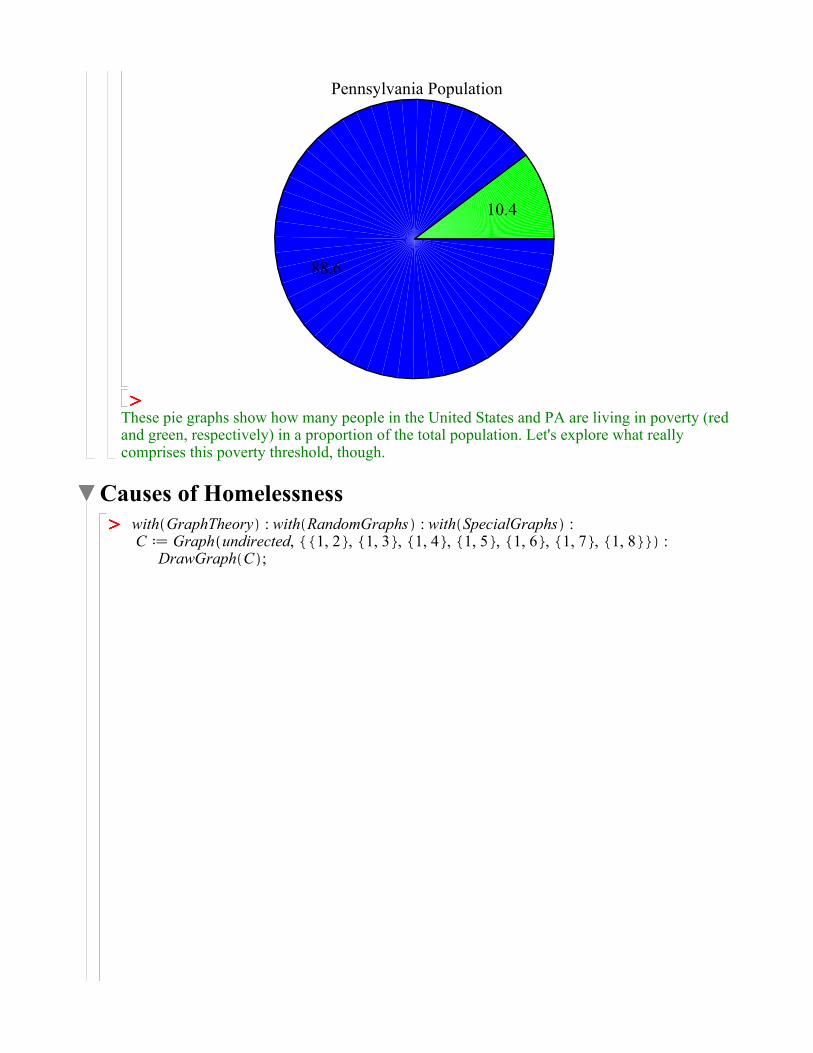
Looking at this table, it can be inferred that out of the almost 300 million people living in the United States, 12.4-12.6% of the people are living in poverty (average of 12.5% with a possible error on either end of 0.1%). In Pennsylvania, 1.273 million people are living in poverty, about 10.4 percent of the state. That means one in ten people are living in poverty! A little less than the national average, yes, but still a very startling number.
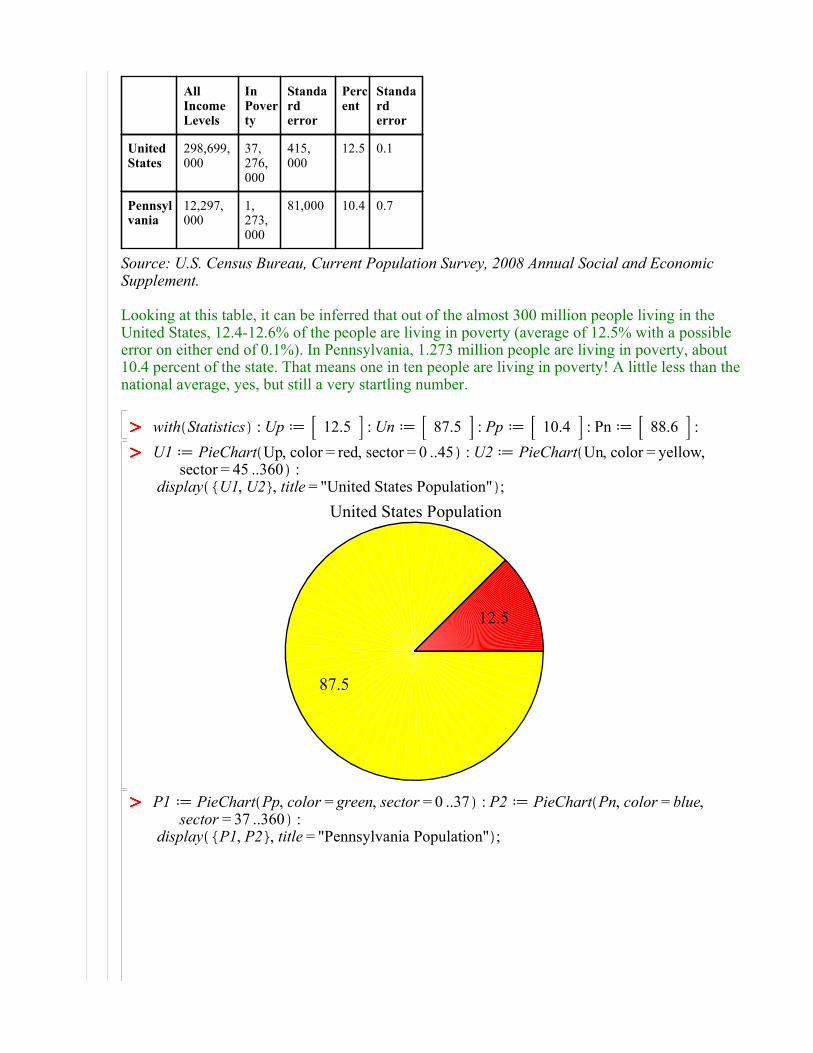
with Statistics : Upd 12.5 : Und 87.5 : Ppd 10.4 : Pnd 88.6 :
U1d PieChart Up, color = red, sector = 0 ..45 : U2d PieChart Un, color = yellow,sector = 45 ..360 :
display U1, U2 , title = "United States Population" ;
87.5
12.5
United States Population
P1d PieChart Pp, color = green, sector = 0 ..37 : P2d PieChart Pn, color = blue,sector = 37 ..360 :
display P1, P2 , title = "Pennsylvania Population" ;
OOOO OOOO
OOOO OOOO
88.6
10.4
Pennsylvania Population
These pie graphs show how many people in the United States and PA are living in poverty (red and green, respectively) in a proportion of the total population. Let's explore what really comprises this poverty threshold, though.
Causes of Homelessness
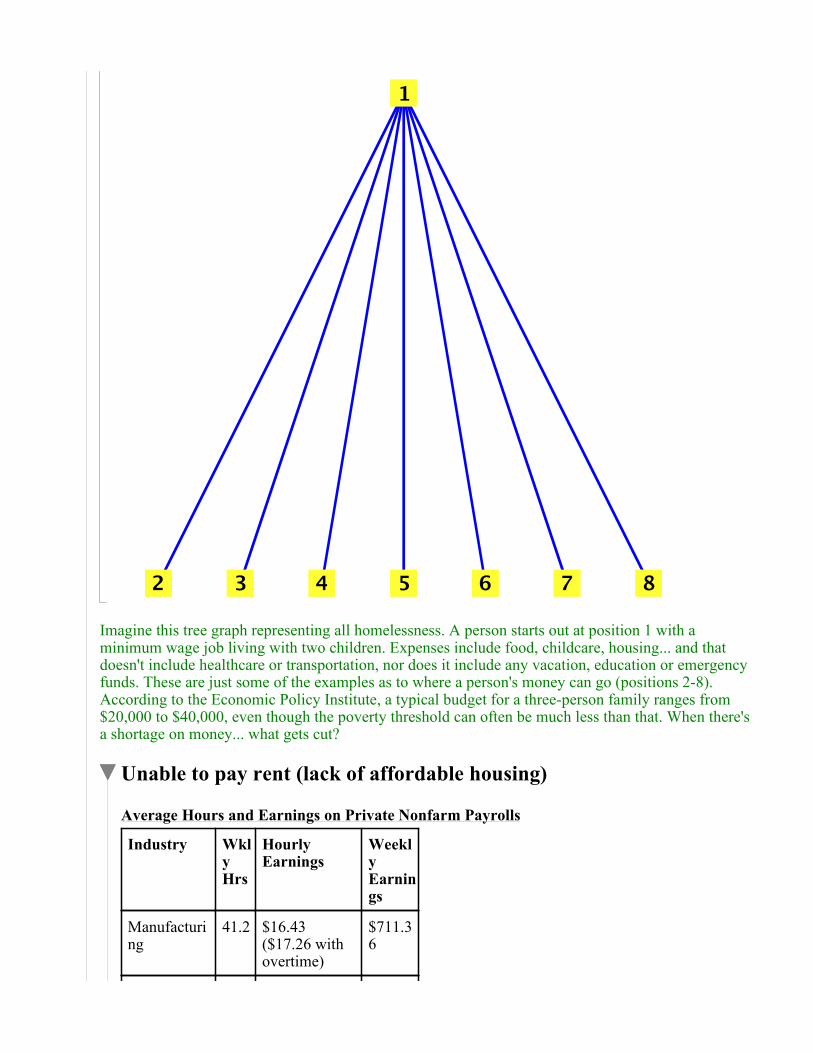
with GraphTheory : with RandomGraphs : with SpecialGraphs : C dGraph undirected, 1, 2 , 1, 3 , 1, 4 , 1, 5 , 1, 6 , 1, 7 , 1, 8 :
DrawGraph C ;
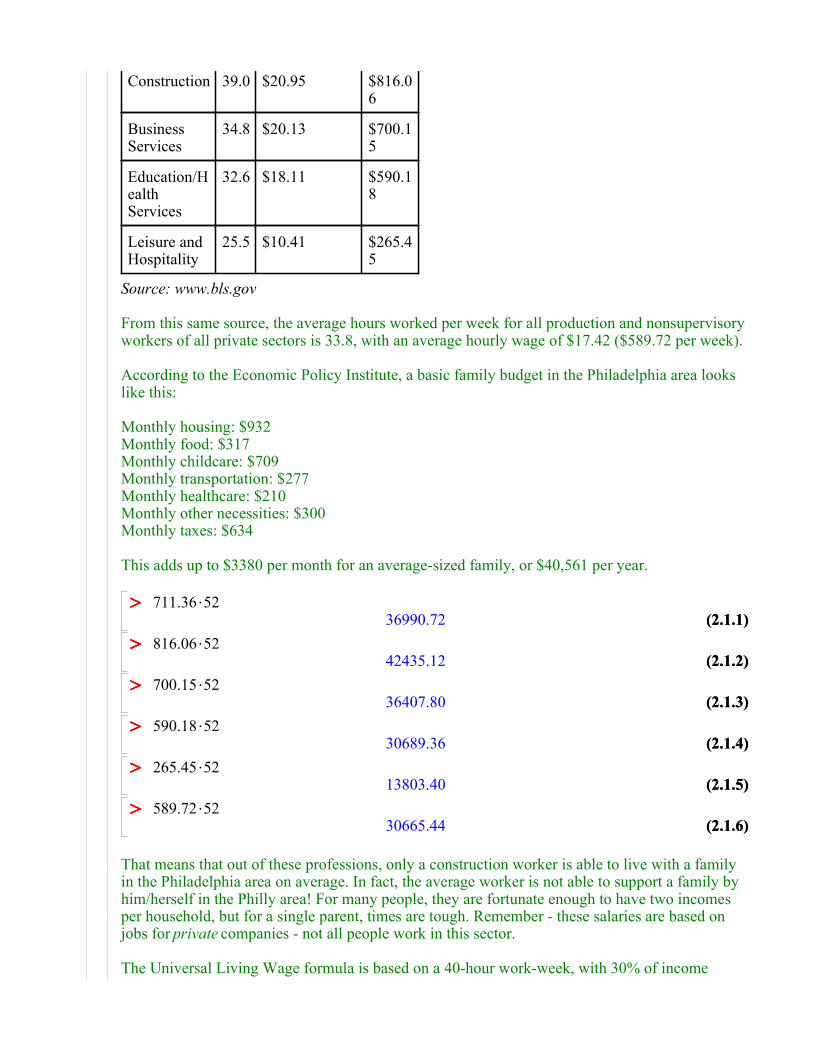
1
2 3 4 5 6 7 8
Imagine this tree graph representing all homelessness. A person starts out at position 1 with a minimum wage job living with two children. Expenses include food, childcare, housing... and that doesn't include healthcare or transportation, nor does it include any vacation, education or emergencyfunds. These are just some of the examples as to where a person's money can go (positions 2-8). According to the Economic Policy Institute, a typical budget for a three-person family ranges from $20,000 to $40,000, even though the poverty threshold can often be much less than that. When there'sa shortage on money... what gets cut?
Unable to pay rent (lack of affordable housing)
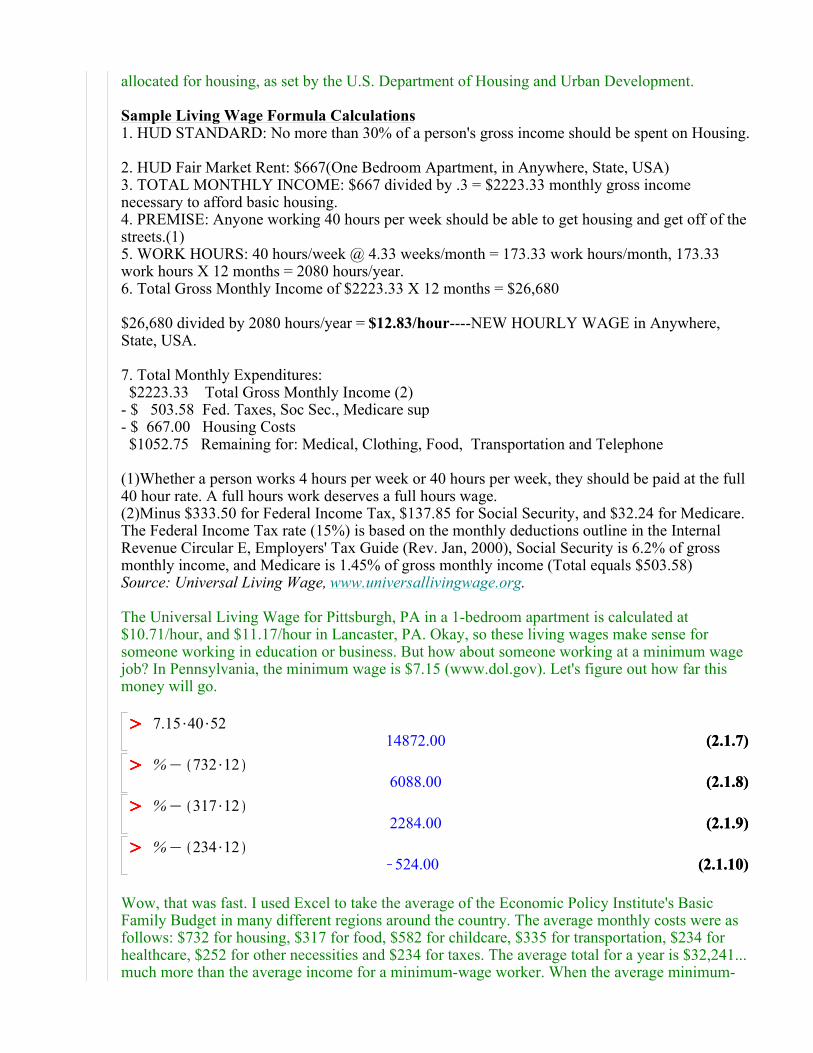
Average Hours and Earnings on Private Nonfarm Payrolls
Industry Wkly Hrs
Hourly Earnings
Weekly Earnings
Manufacturing
41.2 $16.43 ($17.26 with overtime)
$711.36
(2.1.3)(2.1.3)
(2.1.6)(2.1.6)
(2.1.4)(2.1.4)
OOOO OOOO
OOOO OOOO
OOOO OOOO
OOOO OOOO
OOOO OOOO
(2.1.1)(2.1.1)
OOOO OOOO
(2.1.2)(2.1.2)
(2.1.5)(2.1.5)
Construction 39.0 $20.95 $816.06
Business Services
34.8 $20.13 $700.15
Education/Health Services
32.6 $18.11 $590.18
Leisure and Hospitality
25.5 $10.41 $265.45
Source: www.bls.gov
From this same source, the average hours worked per week for all production and nonsupervisory workers of all private sectors is 33.8, with an average hourly wage of $17.42 ($589.72 per week).
According to the Economic Policy Institute, a basic family budget in the Philadelphia area looks like this:
Monthly housing: $932Monthly food: $317Monthly childcare: $709Monthly transportation: $277Monthly healthcare: $210Monthly other necessities: $300Monthly taxes: $634
This adds up to $3380 per month for an average-sized family, or $40,561 per year.
711.36$5236990.72
816.06$5242435.12
700.15$5236407.80
590.18$5230689.36
265.45$5213803.40
589.72$5230665.44
That means that out of these professions, only a construction worker is able to live with a family in the Philadelphia area on average. In fact, the average worker is not able to support a family by him/herself in the Philly area! For many people, they are fortunate enough to have two incomes per household, but for a single parent, times are tough. Remember - these salaries are based on jobs for private companies - not all people work in this sector.
The Universal Living Wage formula is based on a 40-hour work-week, with 30% of income
(2.1.10)(2.1.10)
(2.1.7)(2.1.7)
OOOO OOOO
OOOO OOOO
OOOO OOOO
(2.1.8)(2.1.8)
(2.1.9)(2.1.9)
OOOO OOOO
allocated for housing, as set by the U.S. Department of Housing and Urban Development.
Sample Living Wage Formula Calculations1. HUD STANDARD: No more than 30% of a person's gross income should be spent on Housing.
2. HUD Fair Market Rent: $667(One Bedroom Apartment, in Anywhere, State, USA) 3. TOTAL MONTHLY INCOME: $667 divided by .3 = $2223.33 monthly gross income necessary to afford basic housing.4. PREMISE: Anyone working 40 hours per week should be able to get housing and get off of thestreets.(1) 5. WORK HOURS: 40 hours/week @ 4.33 weeks/month = 173.33 work hours/month, 173.33 work hours X 12 months = 2080 hours/year. 6. Total Gross Monthly Income of $2223.33 X 12 months = $26,680
$26,680 divided by 2080 hours/year = $12.83/hour----NEW HOURLY WAGE in Anywhere, State, USA. 7. Total Monthly Expenditures: $2223.33 Total Gross Monthly Income (2)- $ 503.58 Fed. Taxes, Soc Sec., Medicare sup - $ 667.00 Housing Costs $1052.75 Remaining for: Medical, Clothing, Food, Transportation and Telephone
(1)Whether a person works 4 hours per week or 40 hours per week, they should be paid at the full 40 hour rate. A full hours work deserves a full hours wage. (2)Minus $333.50 for Federal Income Tax, $137.85 for Social Security, and $32.24 for Medicare. The Federal Income Tax rate (15%) is based on the monthly deductions outline in the Internal Revenue Circular E, Employers' Tax Guide (Rev. Jan, 2000), Social Security is 6.2% of gross monthly income, and Medicare is 1.45% of gross monthly income (Total equals $503.58) Source: Universal Living Wage, www.universallivingwage.org.
The Universal Living Wage for Pittsburgh, PA in a 1-bedroom apartment is calculated at $10.71/hour, and $11.17/hour in Lancaster, PA. Okay, so these living wages make sense for someone working in education or business. But how about someone working at a minimum wage job? In Pennsylvania, the minimum wage is $7.15 (www.dol.gov). Let's figure out how far this money will go.
7.15$40$5214872.00
%K 732$126088.00
%K 317$122284.00
%K 234$12K524.00
Wow, that was fast. I used Excel to take the average of the Economic Policy Institute's Basic Family Budget in many different regions around the country. The average monthly costs were as follows: $732 for housing, $317 for food, $582 for childcare, $335 for transportation, $234 for healthcare, $252 for other necessities and $234 for taxes. The average total for a year is $32,241...much more than the average income for a minimum-wage worker. When the average minimum-
OOOO OOOO
• •
• •
• •
• •
wage income was calculated ($7.15/hour * 40 hours/week * 52 weeks/year = $14,872/year), there was only enough money to pay for housing, food and part of healthcare before resulting in a negative number! Clearly the minimum wage is not enough to cover a basic family budget.
"The connection between impoverished workers and homelessness can be seen in homeless shelters, many of which house significant numbers of full-time wage earners. In 2007, a survey performed by the U.S. Conference of Mayors found that 17.4% of homeless adults in families were employed while 13% of homeless single adults or unaccompanied youth were employed. A survey of 24 U.S. cities found that 13% of persons in homeless situations are employed (U.S. Conference of Mayors, 2005). Surveys in past years have yielded the percentage of homeless working to be as high as 26% (U.S. Conference of Mayors, 2000). In a number of cities not surveyed by the U.S. Conference of Mayors - as well as in many states - the percentage is even higher (National Coalition for the Homeless, 1997).
The future of job growth does not appear promising for many workers: a 1998 study estimated that 46% of the jobs with the most growth between 1994 and 2005 pay less than $16,000 a year; these jobs will not lift families out of poverty (National Priorities Project, 1998). Moreover, 74% of these jobs pay below a livable wage ($32,185 for a family of four)." from www.nationalhomeless.org
Unfortunately, this proves that people are not homeless because they are not working. Instead, many people with a full-time job are still not able to make ends meet.
Lack of affordable health care
Health care is obviously a large cost that many poor people unwisely forgo. In 2004, according to the U.S. Bureau of the Census, about 15% of the population did not have health insurance. For people experiencing homelessness, prevalent health problems include infections, abuse from attacks, malnutrition, poor hygiene and sometimes drug abuse or HIV/AIDS.
Imagine a person has to go to the doctor's office for a $200 visit. Is it worth it to get insurance for a yearly doctor's appt? For a doctor's appointment every 5 years? When will it be worth it?
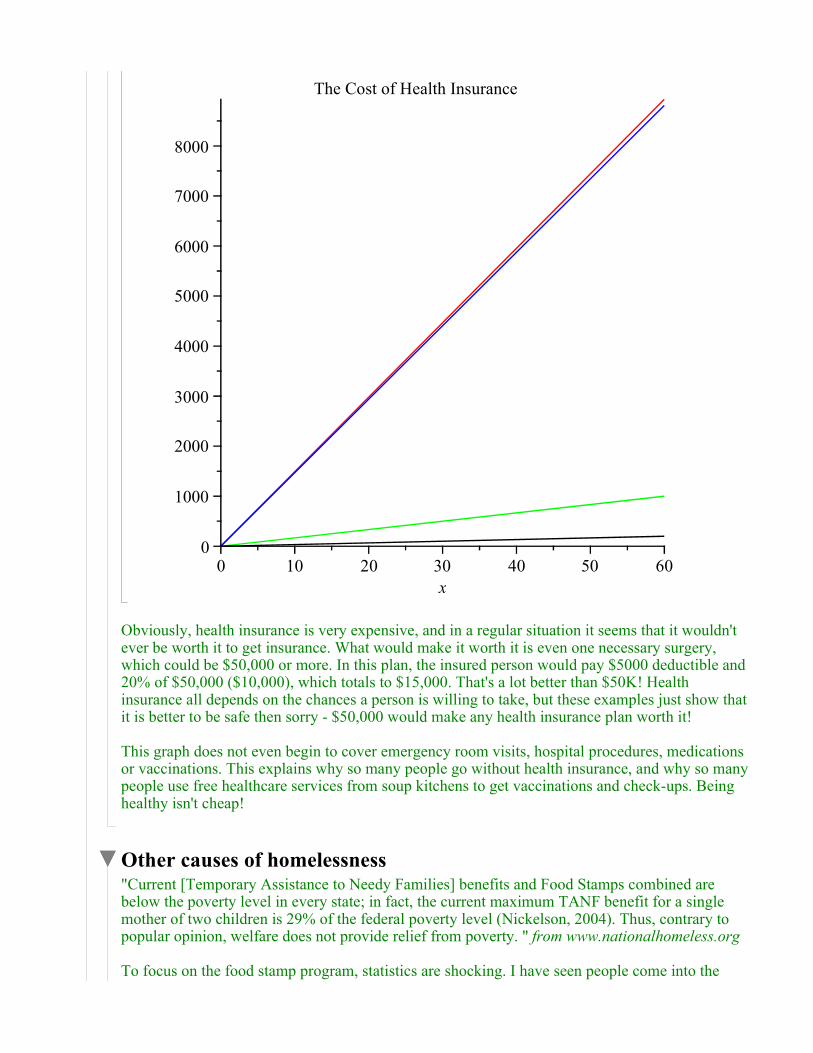
CELTIC PPO 80/20 - deductible $5000, coinsurance 20%, office visit $30, monthly cost $146.34Red line represents a yearly doctor's appointment with insurance - $30/12 months = $2.50 per month to budget for the visit plus $146.34 = $148.84 per monthGreen line represents a yearly doctor's appt w/o insurance - $200/12 months = $16.67 monthlyBlue line represents a doctor's appointment every 5 years - $30/60 months - $.50 per month plus $146.34 = $146.84 monthlyBlack line represents a doctor's appt every 5 years w/o insurance - $200/12 months = $3.33 monthly
plot 148.84 x, 16.67 x, 146.84 x, 3.33 x , x = 0 ..60, color = red, green, blue, black ,title = "The Cost of Health Insurance" ;
x
0 10 20 30 40 50 600
1000
2000
3000
4000
5000
6000
7000
8000
The Cost of Health Insurance
Obviously, health insurance is very expensive, and in a regular situation it seems that it wouldn't ever be worth it to get insurance. What would make it worth it is even one necessary surgery, which could be $50,000 or more. In this plan, the insured person would pay $5000 deductible and 20% of $50,000 ($10,000), which totals to $15,000. That's a lot better than $50K! Health insurance all depends on the chances a person is willing to take, but these examples just show thatit is better to be safe then sorry - $50,000 would make any health insurance plan worth it!
This graph does not even begin to cover emergency room visits, hospital procedures, medications or vaccinations. This explains why so many people go without health insurance, and why so manypeople use free healthcare services from soup kitchens to get vaccinations and check-ups. Being healthy isn't cheap!
Other causes of homelessness"Current [Temporary Assistance to Needy Families] benefits and Food Stamps combined are below the poverty level in every state; in fact, the current maximum TANF benefit for a single mother of two children is 29% of the federal poverty level (Nickelson, 2004). Thus, contrary to popular opinion, welfare does not provide relief from poverty. " from www.nationalhomeless.org
To focus on the food stamp program, statistics are shocking. I have seen people come into the
(2.3.3)(2.3.3)
(2.3.2)(2.3.2)
(2.3.4)(2.3.4)
OOOO OOOO
OOOO OOOO
OOOO OOOO
OOOO OOOO
(2.3.6)(2.3.6)
OOOO OOOO
(2.3.5)(2.3.5)
OOOO OOOO
(2.3.1)(2.3.1)
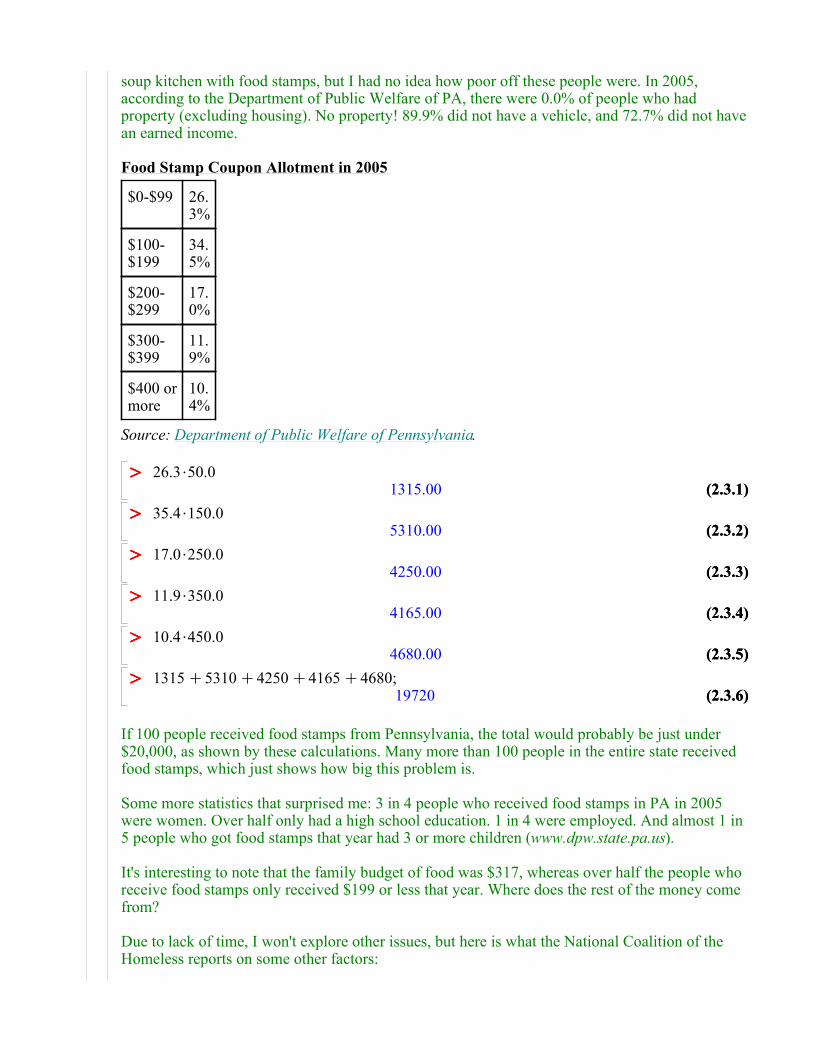
soup kitchen with food stamps, but I had no idea how poor off these people were. In 2005, according to the Department of Public Welfare of PA, there were 0.0% of people who had property (excluding housing). No property! 89.9% did not have a vehicle, and 72.7% did not havean earned income.
Food Stamp Coupon Allotment in 2005
$0-$99 26.3%
$100-$199
34.5%
$200-$299
17.0%
$300-$399
11.9%
$400 ormore
10.4%
Source: Department of Public Welfare of Pennsylvania.
26.3$50.01315.00
35.4$150.05310.00
17.0$250.04250.00
11.9$350.04165.00
10.4$450.04680.00
1315C5310C4250C4165C4680;19720
If 100 people received food stamps from Pennsylvania, the total would probably be just under $20,000, as shown by these calculations. Many more than 100 people in the entire state received food stamps, which just shows how big this problem is.
Some more statistics that surprised me: 3 in 4 people who received food stamps in PA in 2005 were women. Over half only had a high school education. 1 in 4 were employed. And almost 1 in 5 people who got food stamps that year had 3 or more children (www.dpw.state.pa.us).
It's interesting to note that the family budget of food was $317, whereas over half the people who receive food stamps only received $199 or less that year. Where does the rest of the money come from?
Due to lack of time, I won't explore other issues, but here is what the National Coalition of the Homeless reports on some other factors:
"Domestic Violence: Battered women who live in poverty are often forced to choose between abusive relationships and homelessness. In a study of 777 homeless parents (the majority of whom were mothers) in ten U.S. cities, 22% said they had left their last place of residence because of domestic violence (Homes for the Homeless, 1998). In addition, 50% of the cities surveyed by the U.S. Conference of Mayors identified domestic violence as a primary cause of homelessness (U.S. Conference of Mayors, 2005). Studying the entire country, though, reveals that the problem is even more serious. Nationally, approximately half of all women and children experiencing homelessness are fleeing domestic violence (Zorza, 1991; National Coalition Against Domestic Violence, 2001).
Mental Illness: Approximately 16% of the single adult homeless population suffers from some form of severe and persistent mental illness (U.S. Conference of Mayors, 2005). Despite the disproportionate number of severely mentally ill people among the homeless population, increasesin homelessness are not attributable to the release of severely mentally ill people from institutions.Most patients were released from mental hospitals in the 1950s and 1960s, yet vast increases in homelessness did not occur until the 1980s, when incomes and housing options for those living onthe margins began to diminish rapidly. According to the 2003 U.S. Department of Health and Human Services Report, most homeless persons with mental illness do not need to be institutionalized, but can live in the community with the appropriate supportive housing options (U.S. Department of Health and Human Services, 2003). However, many mentally ill homeless people are unable to obtain access to supportive housing and/or other treatment services. The mental health support services most needed include case management, housing, and treatment.
Addiction Disorders: The relationship between addiction and homelessness is complex and controversial. While rates of alcohol and drug abuse are disproportionately high among the homeless population, the increase in homelessness over the past two decades cannot be explained by addiction alone. Many people who are addicted to alcohol and drugs never become homeless, but people who are poor and addicted are clearly at increased risk of homelessness. During the 1980s, competition for increasingly scarce low-income housing grew so intense that those with disabilities such as addiction and mental illness were more likely to lose out and find themselves on the streets. The loss of SRO housing, a source of stability for many poor people suffering from addiction and/or mental illness, was a major factor in increased homelessness in many communities.
Addiction does increase the risk of displacement for the precariously housed; in the absence of appropriate treatment, it may doom one's chances of getting housing once on the streets. Homeless people often face insurmountable barriers to obtaining health care, including addictive disorder treatment services and recovery supports. The following are among the obstacles to treatment for homeless persons: lack of health insurance; lack of documentation; waiting lists; scheduling difficulties; daily contact requirements; lack of transportation; ineffective treatment methods; lack of supportive services; and cultural insensitivity. An in-depth study of 13 communities across the nation revealed service gaps in every community in at least one stage of the treatment and recovery continuum for homeless people (National Coalition for the Homeless, 1998)."
Violence against the Homeless
Beaten to death with a claw hammer Brutally beaten with baseball bats and sticks "It's just totally senseless beating"
OOOO OOOO
"...I could feel my skin burning""There was so much blood, I thought I was going to die" Bludgeoned with a shovel Act of Absolute Hatred Raped repeatedly Stomped on Attacked by a gang Sucker-punched Stalked--from the National Coalition of the Homeless
"The term “hate crime” generally conjures up images of cross burnings and lynchings, swastikas on Jewish synagogues, and horrific murders of gays and lesbians. In 1968, the U.S. Congress defined a hate crime as a crime in which the defendant intentionally selects a victim, or in the case of a property crime, the property that is the object of the crime, because of their race, color or national origin (Title 18 U.S.C Section 245). The first federal law to combat hate crimes, 18 USC Section 245, passed in 1968; it mandated that the government must prove both that the crime occurred because of a victim’s membership in a designated group and because the victim was engaged in certain specified federally-protected activities -- such as serving on a jury, voting, or attending public school.Federal bias crime laws enacted subsequently have provided additional coverage. The Hate Crimes Statistics Act of 1990 (HCSA) authorizes the Justice Department to collect data from law enforcement agencies about crimes that “manifest evidence of prejudice based upon race, religion, -sexual orientation, or ethnicity.” The Hate Crimes Sentencing Enhancement Act, enacted as a sectionof the Violent Crime Control and Law Enforcement Act of 1994, defines hate crimes as “a crime in which the defendant intentionally selects a victim, or in the case of a property crime, the property thatis the object of the crime, because of the actual or perceived race, color, national origin, ethnicity, gender, disability, or sexual orientation of any person.” This measure only applies to attacks and vandalism that occur in national parks and on federal property." from www.nationalhomeless.org
Hate crimes are becoming more prevalent against the homeless in more recent years.
Statistics from the National Coalition for the Homeless show...
"Age Ranges of the Accused/Convicted: 10(two), 11, 12, 13(three), 14(eight), 15(eighteen), 16(eleven), 17(eleven), 18(fifteen), 19(eight), 20(seven) 22(three), 23, 24(six), 25(five), 27(four), 28(two), 29(two), 30, 32 (two), 33, 36, 47, 61, 62.
Age ranges of the victims in 2007: 22, 26, 29, 30 31, 32(four), 33, 34, 35(five), 36, 37, 38(two), 39(three), 40(four), 41, 42(three), 43(three), 44(four), 45(two), 46(two), 47(three), 48(three), 49(seven),50(five), 51, 53(two), 54, 55(three), 56, 57, 58 (two), 59, 63(two), 68(two). Gender of victims: Male: 108 Female: 18"
Accd 10, 10, 11, 12, 13, 13, 13, 14, 14, 14, 14, 14, 14, 14, 14, 15, 15, 15, 15, 15, 15, 15,15, 15, 15, 15, 15, 15, 15, 15, 15, 15, 15, 16, 16, 16, 16, 16, 16, 16, 16, 16, 16, 16, 17,17, 17, 17, 17, 17, 17, 17, 17, 17, 17, 18, 18, 18, 18, 18, 18, 18, 18, 18, 18, 18, 18, 18,18, 18, 19, 19, 19, 19, 19, 19, 19, 19, 20, 20, 20, 20, 20, 20, 20, 22, 22, 22, 23, 24, 24,24, 24, 24, 24, 25, 25, 25, 25, 25, 27, 27, 27, 27, 28, 28, 29, 29, 30, 32, 33, 36, 47, 61,62 :
Vicd 22, 22, 26, 29, 30, 31, 32, 32, 32, 32, 33, 34, 35, 35, 35, 35, 35, 36, 37, 38, 38, 39,39, 39, 40, 40, 40, 40, 41, 42, 42, 42, 43, 43, 43, 44, 44, 44, 44, 45, 45, 46, 46, 47, 47, 47, 48, 48, 48, 49, 49, 49, 49, 49, 49, 49, 50, 50, 50, 50, 50, 51, 53, 53, 54, 55, 55, 55,
OOOO OOOO
(3.1)(3.1)
(3.2)(3.2)
OOOO OOOO
OOOO OOOO
(3.3)(3.3)
56, 57, 58 , 58, 59, 63, 63, 68, 68 :
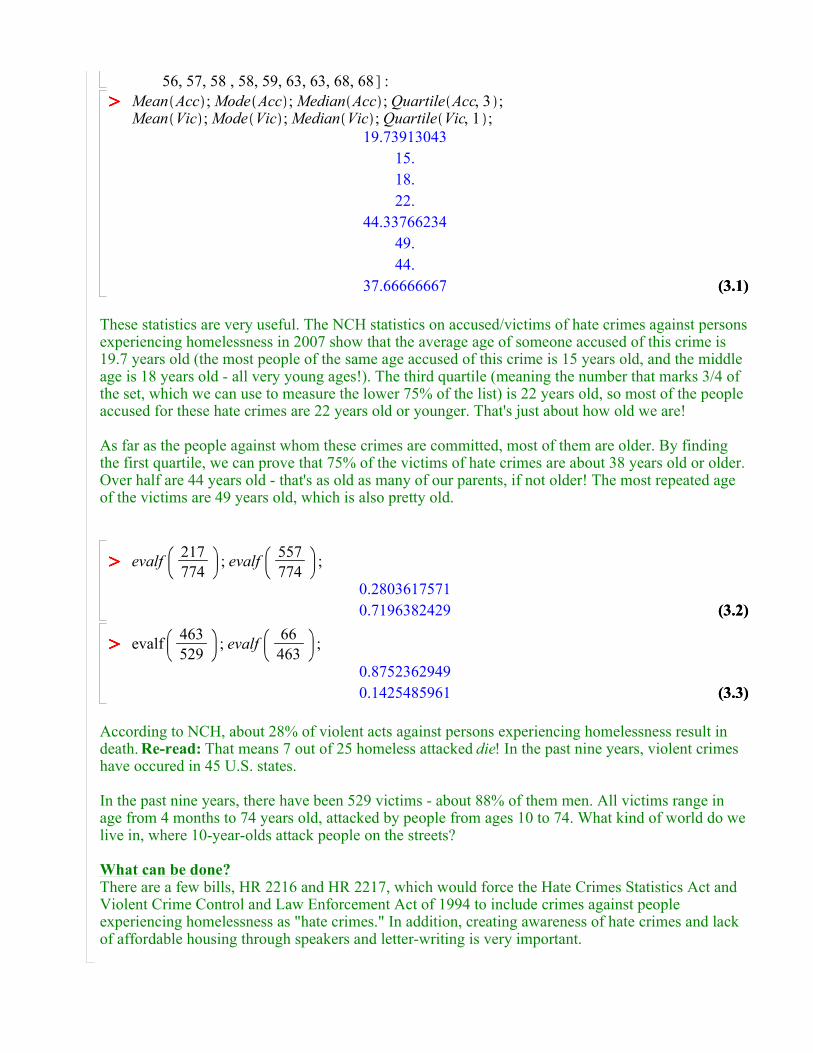
Mean Acc ; Mode Acc ; Median Acc ; Quartile Acc, 3 ;Mean Vic ; Mode Vic ; Median Vic ; Quartile Vic, 1 ;
19.73913043
15.
18.
22.
44.33766234
49.
44.
37.66666667
These statistics are very useful. The NCH statistics on accused/victims of hate crimes against personsexperiencing homelessness in 2007 show that the average age of someone accused of this crime is 19.7 years old (the most people of the same age accused of this crime is 15 years old, and the middle age is 18 years old - all very young ages!). The third quartile (meaning the number that marks 3/4 of the set, which we can use to measure the lower 75% of the list) is 22 years old, so most of the people accused for these hate crimes are 22 years old or younger. That's just about how old we are!
As far as the people against whom these crimes are committed, most of them are older. By finding the first quartile, we can prove that 75% of the victims of hate crimes are about 38 years old or older. Over half are 44 years old - that's as old as many of our parents, if not older! The most repeated age of the victims are 49 years old, which is also pretty old.
evalf217
774; evalf
557
774;
0.2803617571
0.7196382429
evalf463
529; evalf
66
463;
0.8752362949
0.1425485961
According to NCH, about 28% of violent acts against persons experiencing homelessness result in death. Re-read: That means 7 out of 25 homeless attacked die! In the past nine years, violent crimes have occured in 45 U.S. states.
In the past nine years, there have been 529 victims - about 88% of them men. All victims range in age from 4 months to 74 years old, attacked by people from ages 10 to 74. What kind of world do we live in, where 10-year-olds attack people on the streets?
What can be done?There are a few bills, HR 2216 and HR 2217, which would force the Hate Crimes Statistics Act and Violent Crime Control and Law Enforcement Act of 1994 to include crimes against people experiencing homelessness as "hate crimes." In addition, creating awareness of hate crimes and lack of affordable housing through speakers and letter-writing is very important.
OOOO OOOO
OOOO OOOO
OOOO OOOO
Ending Homelessness - Doing Our Part to Make a Difference
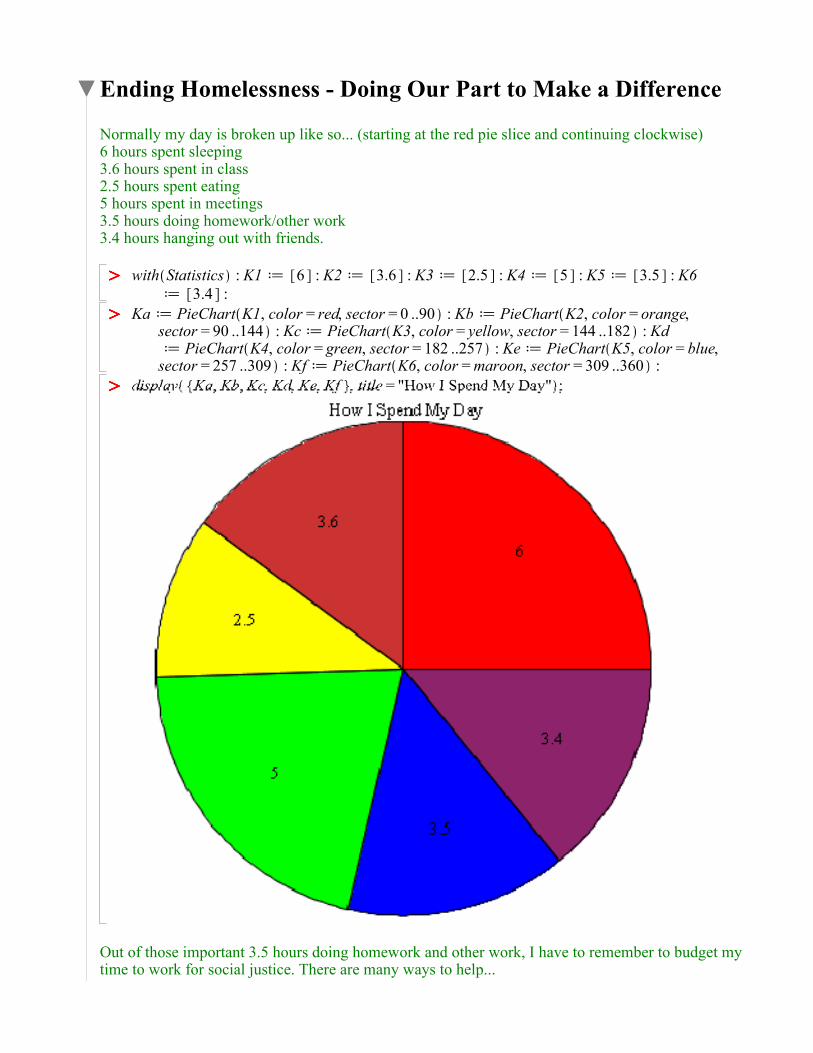
Normally my day is broken up like so... (starting at the red pie slice and continuing clockwise)6 hours spent sleeping3.6 hours spent in class2.5 hours spent eating5 hours spent in meetings3.5 hours doing homework/other work3.4 hours hanging out with friends.
with Statistics : K1 d 6 : K2 d 3.6 : K3 d 2.5 : K4 d 5 : K5 d 3.5 : K6
d 3.4 :
Ka d PieChart K1, color = red, sector = 0 ..90 : Kb d PieChart K2, color = orange,sector = 90 ..144 : Kcd PieChart K3, color = yellow, sector = 144 ..182 : Kdd PieChart K4, color = green, sector = 182 ..257 : Ked PieChart K5, color = blue,sector = 257 ..309 : Kfd PieChart K6, color =maroon, sector = 309 ..360 :
display Ka, Kb, Kc, Kd, Ke, Kf , title = "How I Spend My Day" ;
Out of those important 3.5 hours doing homework and other work, I have to remember to budget my time to work for social justice. There are many ways to help...
(4.2)(4.2)
• •
OOOO OOOO
OOOO OOOO
• •
(4.1)(4.1)
• • VOLUNTEER: work with the homeless at a soup kitchen, or help build houses with an organization like Habitat for Humanity.ADVOCATE: send emails through a nonprofit (like National Coalition for the Homeless) to Congress or call Senators/Representatives.BECOME AWARE: attend a panel/lecture on homelessness, say hi to the homeless person on the street, or buy a local street newspaper from a vendor (profits go to the vendors, often poor and homeless).
3.5$60 $7$5276440.0
%$.053822.000
3.5 hours each day and sixty minutes per hour, for 7 days a week and 52 weeks a year: 76,440 minutes each year to spend on work. Imagine spending only 5% of that time working to end homelessness in one of these ways (or any other). That's over 3500 minutes! Many of these actions only take a few minutes each, so why not spend time doing what can be done? Homelessness is a very serious problem that can definitely be prevented, if we all only give a little time to the cause. Now that you know, what are you going to do about it?