Homelessness in Austin/Travis County: Current … in Austin/Travis County: Current Needs ... as a...
31
Homelessness in Austin/Travis County: Current Needs and Gaps Report Ending Community Homelessness Coalition (ECHO) September 1, 2017 DRAFT
Transcript of Homelessness in Austin/Travis County: Current … in Austin/Travis County: Current Needs ... as a...
Homelessness in Austin/Travis County:Current Needs and Gaps Report
Ending Community Homelessness Coalition (ECHO)
September 1, 2017
DRAFT

About ECHOThe Ending Community Homelessness Coalition (ECHO) is a non-profit that plans,
develops, prioritizes and implements systemic, community-wide strategies to end
homelessness in Austin and Travis County, Texas. Together with its community partners,
ECHO uses strategic, data-driven decision-making and innovative, bold thinking to
transform the system to end homelessness. ECHO engages over 100 stakeholders every
month through taskforces and working groups.
ECHO is recognized by the U.S. Department of Housing and Urban Development (HUD)
as the Continuum of Care (CoC) lead agency, the local leader in coordinating the
system of housing and services for persons experiencing homelessness. ECHO is also
designated as the lead agency for the Homeless Management Information System
(HMIS), a system-wide database that tracks the needs of households experiencing
homelessness, services received across the community and their outcomes.
2Ending Community Homelessness Coalition (ECHO)
We would like to thank the following contributors who generously provided data,
information and time toward the completion of this document:
• Persons with lived experiences of homelessness,
• Services providers,
• Elected officials,
• Business leaders
• City of Austin and Travis County staff, and
• The many other public- and private-sector stakeholders who participated in the
public input process, including input sessions, meetings and interviews.
Acknowledgements
Ending Community Homelessness Coalition (2017). DRAFT Homelessness in Austin: Current
Needs and Gaps Report. Austin, TX.
Recommended Citation

About this Report
3Ending Community Homelessness Coalition (ECHO)
The primary data and information sources for this document include the following:
• Focus groups and interviews with 20 persons with lived experiences of
homelessness.
• Surveys of over 5,836 households experiencing homelessness conducted since
October 2014 per Coordinated Assessment Surveys assessing their needs.
• Historical data on the number of persons experiencing homelessness on a given
day since 2007 per the annual Point in Time Count.
• Data on the number of shelter beds provided by different agencies as reported to
the U.S. Department of Housing and Urban Development as a part of the Housing
Inventory Count.
• Population data from the U.S. Census Bureau American Community Survey.
• Literature review of research and effective practices from other communities
around the country.
• Consultation with national industry experts.
• Analysis of existing local homeless programs including investments and system
performance measures.
Data Sources
ECHO created this report on data, trends, and actions to address the needs of persons
experiencing homelessness to inform ongoing efforts to prevent and end homelessness in
our community.
This visual report describes (1) the characteristics of the homeless population in Austin
and Travis County, (2) their current needs, (3) our current community public investments
to address homelessness, and (4) gaps in services.
We hope this information is helpful in efforts to improve programs, plan community
investments, and shape local policies. We encourage others to borrow and cite this
material.

1Data Trends

5Ending Community Homelessness Coalition (ECHO)
The Many Factors Contributing to Homelessness
Homelessness is often caused by the breakdown and failure of many inter-related systems and safety nets.
Lack of Family or
Support Networks
o Mental health issues
o Family conflict
o Lack of support networks
o Domestic violence or abuse
o Substance use
o Rejection of youth by parent or guardian due to sexual orientation, gender identity or pregnancy
Economic/
Environmental Factors
o Stagnant Wages
o Limited job skills
o Limited affordable housing
o Increased cost of living (e.g. medical, transportation, rents)
o Displacement after natural disasters
Inadequate
Supportive Services
o Insufficient mental health services and basic healthcare
o Exit from foster care with no housing or income support
o Difficulty navigating resources and services
o Lack of formal education and support to help youth stay in school
Criminal Justice
Involvement
o Limited access to jobs and housing after incarceration
o Systemic racial discrimination for African Americans who are incarcerated at higher rates and receive longer sentences than persons of other races
o Criminalization of substance use disorders
o Accumulation of court costs(with no address, courts bills are not received, leading to increased fees)
• Ending Community Homelessness Coalition (ECHO). October 2016. Focus Groups with Persons with Lived Experiences of homelessness and service providers.

Persons Experiencing HomelessnessRepresent a Diverse Population
6Ending Community Homelessness Coalition (ECHO)
• Categories not mutually exclusive.• Ending Community Homelessness Coalition (ECHO). Summary Report of Coordinated Assessment Surveys of 5,836
Households.” Homeless Management Information System (HMIS), 5 Dec. 2016.
Chronically Homeless
40%
13%Families with Children
Veterans
Unaccompanied Youth
3%
4%
Subpopulations
81% Single-headed HH
14% 2-3 persons HH
5% 4+ persons HH
Household (HH) SizeGender
38% Female
62% Male
.2% Transgender
Adults 25-44
Children 0-17
Adults 45-64
Youth 18-24
Adults + 65
37%
33%
21%
6%
3%
Age
37%

African Americans Face Large Disparities Across Systems
Ending Community Homelessness Coalition (ECHO) 7
Black/African American
County Population
Non-Hispanic White
Other
8%11%
42%
26%
49%
27%30% 33%
Hispanic or Latino
34%
42%
25%32%
• Ayres, Brittain, et al. “Travis County Snapshot from the American Community Survey.” Travis County Health & Human Services, Dec. 2016, www.traviscountytx.gov/health-human-services/research-planning/snapshot. Accessed Feb. 2017.
• US Census Bureau. “Poverty Status in the Past 12 Months.” 2011-2015 American Community Survey 5-Year Estimates, S1701.
• Ending Community Homelessness Coalition (ECHO). Summary Report of Coordinated Assessment Surveys of 5,836 Households. 5 Dec. 2016. Homeless Management Information System (HMIS), Austin.
• Vera Institute of Justice. "Incarceration Trends: Disparate Impacts: Race." Vera Institute of Justice. N.p., 15 Dec. 2015. Web. 23 Feb. 2017.
• Harris, Chris. (2017). Travis County Jail in 2015: Data Points to racism and longer confinement of African Americans. Retrieved from Grassroots Leadership website: https://grassrootsleadership.org/sites/default/files/reports/racist-jailing-report.pdf
9%3% 1%
20%
African Americans are incarcerated and experience poverty at significantly higher rates compared to their makeup in the general Travis County population and are
disproportionately represented in the homeless population. They also receive longer sentences in jail for the same offenses with comparable criminal histories than their
white counterparts.
Below Poverty Level Homeless Population Jail

Persons Experiencing HomelessnessFace Many Challenges
8Ending Community Homelessness Coalition (ECHO)
44%56%Have experienced
trauma or abuse
in their life
17%Report consuming drugs
and/or alcohol almost
everyday or everyday for
the past month
36%Report having legal stuff
going on that may result
in them being locked up
or having to pay fines
42%Of the homeless
population are African
American, despite the
fact that African
Americans only make up
8% of Travis County’s
population
67%Can’t access
employment/do not have earned income
29%Report having
experienced domestic
violence in their lifetime
Access healthcare
through an emergency
room or do not access
any healthcare
61%
• Categories not mutually exclusive.• Ending Community Homelessness Coalition (ECHO). “Summary Report of Coordinated Assessment Surveys of
5,836 Households.” Homeless Management Information System (HMIS), 5 Dec. 2016.
62%Report having no planned
activities that bring them
happiness or fulfillment
Report currently
experiencing mental
health issues
Persons experiencing homelessness often have many inter-related health, social and economic challenges that make it difficult to end homelessness on their own.

• The “sheltered homeless” in a given day includes those in transitional housing per PIT guidelines.
• The number of “newly homeless” or persons who become homeless for the first time is based on the System Performance Measure # 5, a measure from the U.S. Department of Housing and Urban Development.
• Ending Community Homelessness Coalition (ECHO). “Point in Time Count.” Jan. 2010 - 2017.
• Ending Community Homelessness Coalition (ECHO). “Newly Homeless System Users.” Homeless Management Information System (HMIS), 2017.
Persons counted experiencing homelessness in a given day
ShelteredUnsheltered
Persons known to have experienced homelessness in a given year
9
Literally Homeless Populationin Austin/Travis County
Ending Community Homelessness Coalition (ECHO)
2016 7,101
2015 7,054
6,1042014
6,2322013
2010
2,087
1,254
833
2011
2,362
1,358
1,004
2012
2,244
1,375
869
2013
2,090
1,325
765
2014
1,987
1,539
448
2015
1,832
1,165
667
2016
2,138
1,322
816
2017
2,036
1,202
834

• U.S. Census Bureau. “Demographic and Housing Estimates.” 2011-2015 American Community Survey 5-Year Estimates, DP05.
10Ending Community Homelessness Coalition (ECHO)
2010
979,712
2011
1,007,264
2012
1,034,842
2013
1,063,248
2014
1,092,810
2015
1,121,645
2.81%
2.74%
2.74%
2.78%
2.64%
Regional Growth and Affordability Crisis
Austin and Travis County are experiencing rapid population growth, leading to rising housing costs and an unprecedented demand for rental units, including Austin’s limited affordable housing. This creates more housing competition for those experiencing homelessness who may already have housing barriers, such as a criminal record, a history of substance use, un- or under-employment, poor credit history, and low or no income.
Stagnant Job Wages for Low Income Workers
Despite Austin’s rising housing costs, wages for low-income workers remain stagnant, making it more likely that low-income households with the weakest safety nets who are already struggling to balance life’s demands will fall into homelessness. For many, all it takes is an unforeseen financial crisis—a medical emergency or a car accident—coupled with a weak social support system, to push them over the edge from housing into homelessness.
Regional Factors Affecting the Homeless Population
Growth in Travis County has averaged 2.74% over the past 5 years, with an average growth of 28K people/year, creating more competition for the limited supply of
affordable rental housing units.

• Homeless Persons: HUD Continuum of Care Point-in-Time Homeless Population Count
• Population: Census Bureau-American Community Survey, DP05 5-year data-Population
• TX Pop: Census Bureau-American Community Survey, B01003 5-year estimates.
• National Alliance to End Homelessness. State of Homelessness in America. p. 11.
• HUD Exchange. "Homeless Populations and Subpopulations Reports."
11
The Rate of Homelessness Has Been Decreasing
Ending Community Homelessness Coalition (ECHO)
Even though the homeless population has remained relatively constant
in absolute numbers, when controlling for population growth,
over the past five years, one sees reduction in the rate of homelessness in
Travis County
0
10
20
30
2010 2011 2012 2013 2014 2015
20.6
23.521.7
19.7
16.3
20 19.8 19.318.2
17.7
Travis County rate of homeless persons per 10,000 residents in the general population
National rate of homeless persons per 10,000 residents in the general population
18.3
21.3
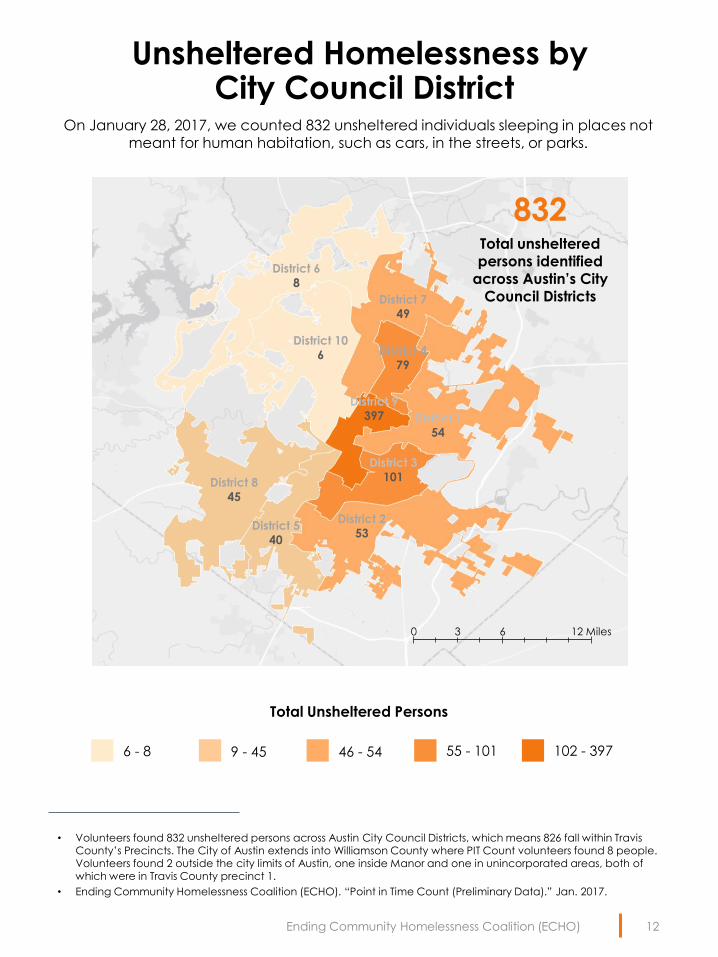
• Volunteers found 832 unsheltered persons across Austin City Council Districts, which means 826 fall within Travis County’s Precincts. The City of Austin extends into Williamson County where PIT Count volunteers found 8 people. Volunteers found 2 outside the city limits of Austin, one inside Manor and one in unincorporated areas, both of which were in Travis County precinct 1.
• Ending Community Homelessness Coalition (ECHO). “Point in Time Count (Preliminary Data).” Jan. 2017.
12
Unsheltered Homelessness byCity Council District
Ending Community Homelessness Coalition (ECHO)
District 8
45
0 3 6 12 Miles
102 - 39755 - 10146 - 549 - 456 - 8
District 2
53
District 3
101
District 5
40
District 1
54
District 9
397
District 10
6
District 6
8
District 7
49
District 4
79
Total Unsheltered Persons
Total unsheltered persons identified
across Austin’s City Council Districts
832
On January 28, 2017, we counted 832 unsheltered individuals sleeping in places not meant for human habitation, such as cars, in the streets, or parks.

• Ending Community Homelessness Coalition (ECHO). “Point in Time Count.” Jan. 2017.
13
Homelessness is Most Visibly Concentrated Downtown
Ending Community Homelessness Coalition (ECHO)
On January 28, 2017, 650 persons woke up homeless within ¼ mile of downtown
homeless resources: 472 stayed in shelters & 178 stayed in the streets
Unsheltered persons, sleeping in places not meant for human habitation
1 Block Radius (110 unsheltered persons)
Homeless Services Center
2 Block Radius (162 unsheltered persons)
¼ Mile Radius (178 unsheltered persons)
Total persons identified waking up homeless within
¼ mile of downtown homeless resources
650
0 0.05 0.1 0.2 Miles
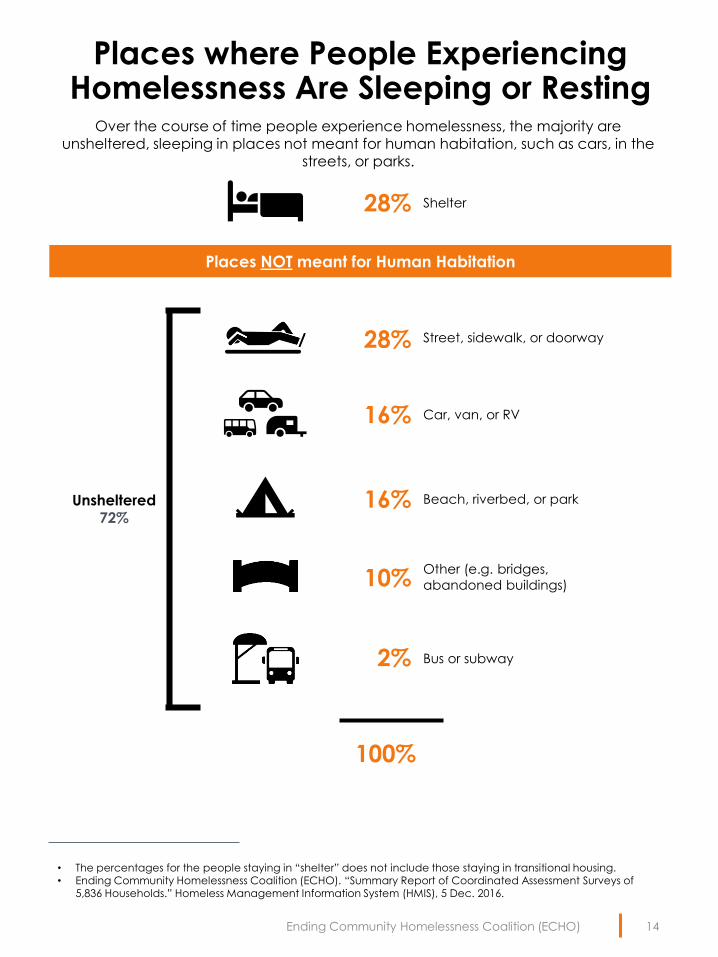
Places where People Experiencing Homelessness Are Sleeping or Resting
Beach, riverbed, or park16%
Shelter28%
Street, sidewalk, or doorway28%
• The percentages for the people staying in “shelter” does not include those staying in transitional housing. • Ending Community Homelessness Coalition (ECHO). “Summary Report of Coordinated Assessment Surveys of
5,836 Households.” Homeless Management Information System (HMIS), 5 Dec. 2016.
14
100%
Ending Community Homelessness Coalition (ECHO)
Places NOT meant for Human Habitation
Other (e.g. bridges,
abandoned buildings)10%
Bus or subway2%
Car, van, or RV16%
Unsheltered72%
Over the course of time people experience homelessness, the majority are unsheltered, sleeping in places not meant for human habitation, such as cars, in the
streets, or parks.

1 booking
@ $153
The Costly Cycle of Homelessness for Many
• Corporation for Supportive Housing. Social Innovation Fund Pay for Success Feasibility Report: ECHO Austin TravisCounty. Rep. N.p., Apr. 2016. Web. Mar. 2017.
15Ending Community Homelessness Coalition (ECHO)
Hospitals
Average Annual Costs for Top 250 High-Cost Homeless Users
of Public Crisis Services in Travis County
Crisis Center Cycle
Jail Booking $153
EMS Transport $14,000
Emergency
Room Visit$30,000
Inpatient
Hospital Stay$178,000
Jails
Shelters
A subset of the homeless population experiences complex health and social issues, frequently cycling between shelters, hospitals, and jails,
and disproportionately impacting public spending.
37 days @
$4,800/day
21 visits @
$1,400/visit
8 visits @
$876/transport
Average annual
total cost per
person
$222,000

Persons Experiencing HomelessnessHealthcare Access
How the Homeless Use Healthcare Services
• Categories not mutually exclusive.• Ending Community Homelessness Coalition (ECHO). Coordinated Assessment Surveys of 5,836 Households. 5
Dec. 2016. Homeless Management Information System (HMIS), Austin.
Report having been to the emergency room in
the past 6 months
64%Report having been
taken to the hospital in an ambulance in the
past 6 months
40%Report having been
hospitalized in the past 6 months
34%
Places the Homeless Report Going to When they’re not Feeling Well
VA
10%
Other
1%
Clinic
28%
Do not go for care
21%
Hospital
40%
16Ending Community Homelessness Coalition (ECHO)
A large majority of persons experiencing homelessness use hospitals or do not go for care at all when they are not feeling well

2Current Assets & Gaps

$12,972,367 Local
$2,812,173 State
$14,371,201 Federal
• HUD Exchange. FY 2016 Continuum of Care Competition Homeless Assistance Award Report.”
• City of Austin. Budget Analysis.
• TDHCA. 2016 Emergency Solutions Grants (“ESG”) Awards.
• Veterans Affairs. FY 2016 Supportive Services for Veteran Families (SSVF) Awards List.
• Family & Youth Services Bureau. “2016 Basic Center Program Grant Awards.”
• Travis County Health and Human Services & Veterans Service Research & Planning Division. Housing
Continuum FY 2016 Community Impact Report.
18
Current Yearly Federal, State, and Local Homelessness Funds
Ending Community Homelessness Coalition (ECHO)
Continuum of Care (CoC)
HACA VASH Subsidies
1115 Waiver
$12,187,696
HOPWA
ESG (TDHCA)
RHY
HHSP
City of Austin General Funds
Travis County General Funds $784,671
$508,796
$102,600
$546,844
$1,138,204
$1,396,675
$2,876,315
$5,686,658
$30,155,741 Total Yearly Funds
ESG (CoA)
SSVF
Travis County VASH Subsidies
Healthy Collaborative $2,303,377
$589,406
$573,752
$200,000

Front Steps (Individuals)
Green Doors
• Ending Community Homelessness Coalition (ECHO). 2017 Housing Inventory Count (HIC).
19
2017 Community Assets for Persons Experiencing Homelessness
Ending Community Homelessness Coalition (ECHO)
849 Emergency Shelter Beds
1,191 Permanent Supportive Housing Beds
460 Transitional Housing Beds
Housing Authority of the City of Austin
Austin Travis County Integral Care, ATCIC
Caritas
Foundation Communities
LifeWorks
Front Steps
621
219
176
80
54
25
16
Front Steps (Adult Men)
SafePlace (Domestic Violence Survivors)
Salvation Army (Families, Single Men,
Single Women)
Casa Marianella (Immigrants, Refugees)
A New Entry (Veterans)
LifeWorks (Youth)
302
234
106
92
36
59
SafePlace (DV Survivors)
Salvation Army (Families)
LifeWorks (Youth)
133
117
Recuperative
Care beds12
Hospice beds0
Foundation for the Homeless (Families)
20
Foundation Communities
5
32Green Doors (Veterans)
56
117
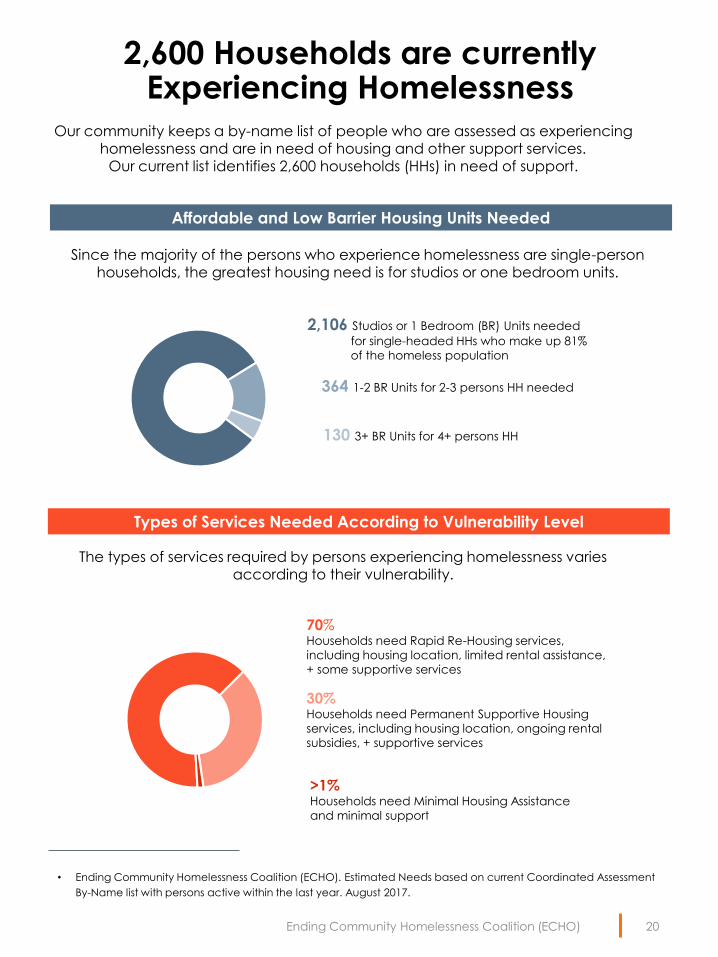
2,600 Households are currently Experiencing Homelessness
20Ending Community Homelessness Coalition (ECHO)
• Ending Community Homelessness Coalition (ECHO). Estimated Needs based on current Coordinated Assessment
By-Name list with persons active within the last year. August 2017.
130 3+ BR Units for 4+ persons HH
364 1-2 BR Units for 2-3 persons HH needed
2,106 Studios or 1 Bedroom (BR) Units needed
for single-headed HHs who make up 81%
of the homeless population
70%Households need Rapid Re-Housing services,
including housing location, limited rental assistance,
+ some supportive services
>1%Households need Minimal Housing Assistance
and minimal support
30%Households need Permanent Supportive Housing
services, including housing location, ongoing rental
subsidies, + supportive services
Affordable and Low Barrier Housing Units Needed
Types of Services Needed According to Vulnerability Level
Since the majority of the persons who experience homelessness are single-person households, the greatest housing need is for studios or one bedroom units.
Our community keeps a by-name list of people who are assessed as experiencing homelessness and are in need of housing and other support services.
Our current list identifies 2,600 households (HHs) in need of support.
The types of services required by persons experiencing homelessness varies according to their vulnerability.

Estimated Gap in Yearly Investments to End Homelessness
in Austin/Travis County
• Current investments include local, state and federal investments.
21Ending Community Homelessness Coalition (ECHO)
Annual Public
Investment
Current
Investments
$30 Million
Gap:
$30 Million
Despite our current investments, we project a gap of $30 million on average of additional yearly investments needed to create a response system at an
appropriate scale for current and projected needs over time. Refer to Austin’s Action Plan on Ending Homelessness for more details on the investments gap.

22
Ending Homelessness:Reaching Functional Zero
Ending Community Homelessness Coalition (ECHO)
Current
System
Desired
System
Persons Experiencing
Homelessness
Inflow
Outflow
Target
• Reduce inflow of newly homeless through targeted prevention
• Reduce inflow of persons returning to Homelessness
• Reduced length of time each person remains homeless
• Increased exits to housing so outflows equals inflow
Inflow > Outflow
Inflow = Outflow
Length of time persons
remain homeless
Ending homelessness does not mean individuals and families will never again
experience homelessness. Instead, it means that we as a community will
have a systematic response that can address immediate needs, quickly
connect people to housing and provide services to ensure long-term stability.
.
Exits to
Housing
Outflow
Length of time
persons remain
homeless
Exits to
Housing
Inflow

4Vision + Strategies

Our Vision for Everyone
Ending Community Homelessness Coalition (ECHO) 24
Transportation
Schools
Parks + Playgrounds
Health
Community +
Civic Participation
Jobs
Grocery Stores
Housing
Our vision is that persons who experience homelessness quickly move into stable and permanent housing, are connected to positive communities, and also have access
to all the services and opportunities they need to live fulfilling lives.

25Ending Community Homelessness Coalition (ECHO)
System Components to Ending Homelessness in Austin/Travis County
Ending homelessness does not mean individuals and families will never again experience
homelessness. Instead, it means that we as a community will have a systematic response
that can address immediate needs, quickly connect people to housing and provide
services to ensure long-term stability. Our community has developed five elements that
together will work to end homelessness through a system’s approach. These system
elements are described on Austin’s Action Plan to End Homelessness.
1. OUTREACH & SHELTER
3. HOUSING &
SUPPORT SERVICES
4. EFFECTIVE
SYSTEM RESPONSE
2. ADDRESSING DISPARITIES
5. COMMUNITY COMMITMENT

26Ending Community Homelessness Coalition (ECHO)
Our System to Prevent + End Homelessness
• Refer to the Glossary section of the document for explanations of different terms.
Identification &
System Entry Points
Street Outreach
Service Providers
Health Institutions
Schools
Police/Prisons/Jail
Child Welfare System
Temporary
Emergency Placement Shelter or Transitional
Housing
Financial Assistance
+ Supportive Services
(Permanent Supportive
Housing or Rapid Re-
Housing)
OutcomesHousing Stability
Health
Recovery
Employment
Life Stability
Coordinated
Assessment
Prevention
Services
Self-resolve
Diversion
OutcomesHousing Stability
Our ultimate goals are to prevent homelessness whenever possible and quickly help people get back into housing, minimizing the length of their homelessness. This flow
chart provides a broad overview of different paths to permanent housing.

Addressing Homelessness Downtown
27Ending Community Homelessness Coalition (ECHO)
Austin’s homelessness population is most visibly concentrated downtown: on a given night 650 persons wake homeless downtown, 472 persons sleep at the ARCH and the Salvation Army while 178 persons sleep in the surrounding streets.
Many homeless services are
clustered down
Reasons for Downtown Concentration
Problems of Downtown Concentration
Strategies that Together will Reduce Homelessness Downtown + Beyond
Not enough housing and
service resources to assist the
7,000+ persons who
experience homelessness
every year
There is activity in the area
day and night
Cheap street drugs like K2
readily available to homeless
population without enough
access to treatment
Downtown hotels and
businesses are exposed to
trespassing, panhandling,
and alcohol and drug use,
impacting customers
Homelessness is criminalized
in the forms of trespassing
and possession of
substances, creating more
housing barriers
S T R A T E G I E S R E S U L T S
Outreach. Expand outreach resources to connect to all
unsheltered persons with available resources.
• Increased persons
connected to
permanent housing,
jobs, appropriate
healthcare and other
support services
• Increased public
health and
safety for all
Shelters + Navigation Services. Increase temporary shelter
beds & housing navigation services throughout the city,
alleviating the pressure at the ARCH and other downtown
service providers
Addressing Disparities. Address housing barriers such as
criminal histories.
Housing + Services. Increase rental assistance and support
services (e.g. case management, employment +
substance use treatment).
Effective System. Ensure all strategies connect persons to
housing, ending their homelessness. Align stakeholders’
vision, streamline coordination and collaboration and
track community progress.

Addressing Housing Barriers
• Barriers identified per interviews with housing placement staff working to find housing for persons experiencing homelessness.
28Ending Community Homelessness Coalition (ECHO)
If a person has recent
misdemeanor charges,
he/she may be ineligible for
rent We negotiate more tolerant
criminal screening policies at
propertiesIf a person has any felony
charges, he/she may be
ineligible for rent
If a person has low or no
income, he/she may be
ineligible for rent, even if a
benefit program covers
income
We offer a risk mitigation fund
to landlords to provide them
with financial security
Some landlords may not
accept housing choice
vouchers
We streamline the process for
landlords who are open to
accepting vouchers, and
educate others who are
unfamiliar with the voucher
program
If a person lacks proper
documentation
(birth certificates, state IDs,
social security cards), he/she
cannot apply for housing or find
employment
We work tirelessly to help the
people we serve acquire those
documents
If a person has any
outstanding rental or utility
debt, bankruptcy, he/she
may be ineligible for rent
We offer financial assistance to
settle the debts
Criminal Background Discrimination
Income Source Discrimination
Lack of Documentation
Persons experiencing homelessness often face one or more of the housing barriers
described below, making it difficult to end homelessness on their own. Our system helps them overcome those barriers to find housing through the following strategies.

6995
Days
• Ending Community Homelessness Coalition (ECHO). “Point in Time Count (Preliminary data).” Jan. 2017.
• Ending Community Homelessness Coalition (ECHO). “Coordinated Assessment Surveys of 5,836 Households.” Homeless Management Information System (HMIS), 5 Dec. 2016.
• Roman, Nan P, and Phyllis Wolfe. “Web of Failure: The Relationship Between Foster Care and Homelessness.” National Alliance to End Homelessness, 16 Aug. 2006, www.endhomelessness.org/library/entry/web-of-failure-the-relationship-between-foster-care-and-homelessness. Accessed 15 Mar. 2017.
29
Success: Ending Veteran Homelessness + Housing More Youth
Ending Community Homelessness Coalition (ECHO)
Veteran Successes, 2015 - 2017
Youth Successes, 2016 - 2017
2011 2012 2013 2014 2015
Veteran Housing Rate Improved Days to Housing for
Veterans Decreased
388
231188177
Veterans Experiencing
Homelessness in a Given
Day Decreased
2014 2015
238
Days
7%12%
2016 2017
During the 100 Day
Challenge, Austin
housed 62 youth,
surpassing its goal of 50
44% of youth who moved
into housing during 100 Day
Challenge had a history of
foster care. Studies show
youth with a history of foster
care are disproportionately
represented in homelessness
Awarded to Austin in
Jan. 2017 to become
a demonstration site
to end youth
homelessness
$5.2 MBefore the
Challenge
During the Challenge
3 youth
housed/30
days
18 youth
housed/30
days
44%
Focusing on subpopulations in Austin/Travis County led to a dramatic reduction in the numbers of veterans and youth experiencing homelessness.
90
Days
2016 -present

ReferencesAyres, Brittain, Tara Carmean, Tonya Pennie. “Travis County Snapshot from the American
Community Survey 2015.” (7). 2016, December. < https://www.traviscountytx.gov/images/health_human_services/Docs/Travis_County_Snapshot_from_the_2014_ACS.pdf>.
City of Austin. "A Demographic Snapshot of Austin." Experience Austin. 12 February 2016.
Ending Community Homelessness Coalition (ECHO).
• 2016 Housing Inventory Count (HIC).
• Coordinated Assessment By Name List. 13 January 2017.
• Coordinated Assessment Surveys of 5,836 households. 5 Dec 2016.
• Official Point in Time Count. January 2017.
• VI-SPDAT Summary Report. 7 Dec 2016.
• City of Austin, HUD Continuum of Care, Travis County, and TDHCA. Funding Analysis. February 2017.
• Ending Community Homelessness Coalition (ECHO), Central Health, Travis County Justice Planning. Pay for Success Initiative Analysis of the Main Users of Crisis Systems. 30 December 2015.
• Interviews. Housing Placement staff, service providers, field staff, and persons experiencing homelessness.
National Alliance to End Homelessness. State of Homelessness in America. p. 11.
Office of Disease Prevention and Health Promotion. “Social Determinants of Health.” Accessed 2016, November 17. <https://www.healthypeople.gov/2020/topics-objectives/topic/social-determinants-of-health>.
Texas Education Agency. 2015-2016 School Year Number of Homeless Students. 19 January 2017.
Travis County. "2016 Travis County Snapshot from the American Community Survey 2015.“
U.S. Census Bureau. American Community Survey. "5-Year Estimates: Austin Geography, Population DP05.“
U.S. Census Bureau. American Community Survey. B01003 5-year estimates.
U.S. Census Bureau. American Community Survey. DP05 5-year data-Population.
U.S. Census Bureau. American Community Survey. Travis County Geography. 2015 Demographic and Housing 5-Year Estimates.
U.S. Department of Housing and Urban Development. System Performance Measure # 5.
U.S. Department of Housing and Urban Development Exchange. "Homeless Populations and Subpopulations Reports."
United States Interagency Council on Homelessness. Opening Doors. 2010 June 22.
World Health Organization. “Health Impact Assessment: The determinants of health.” 2016, November 18. <http://www.who.int/hia/evidence/doh/en/>.
30Ending Community Homelessness Coalition (ECHO)

Questions or Comments?
For questions or for more information, please contact Ann Howard, ECHO’s Executive
Director at [email protected] or Mariana Salazar, ECHO’s Director of Research
and Evaluation at [email protected].