Home Structure Fires
146
HOME STRUCTURE FIRES Marty Ahrens April 2013 National Fire Protection Association Fire Analysis and Research Division
-
Upload
roselyn-mendoza -
Category
Documents
-
view
43 -
download
1
description
Residential Fire
Transcript of Home Structure Fires
HOME STRUCTURE FIRES
Marty Ahrens April 2013
National Fire Protection Association Fire Analysis and Research Division
HOME STRUCTURE FIRES
Marty Ahrens April 2013
National Fire Protection Association Fire Analysis and Research Division
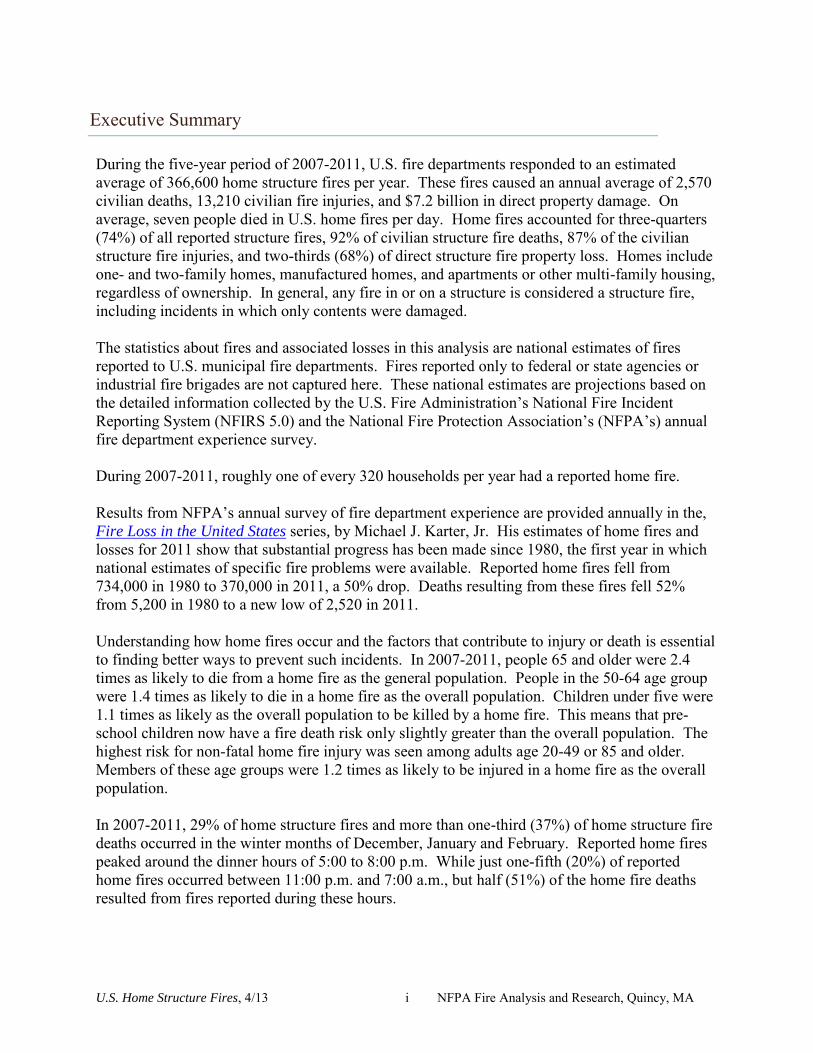
i Abstract NFPA estimates that U.S. fire departments responded to an average of 366,600 home structure fires per year during the five-year-period of 2007-2011. These fires caused an estimated average of 2,570 civilian deaths, 13,210 civilian injuries, and $7.2 billion in direct property damage per year. Almost three-quarters (71%) of the reported home structure fires and 84% of the home fire deaths occurred in one- or two-family homes, including manufactured homes. The remainder occurred in apartments or other multi-family housing. Cooking equipment is the leading cause of home structure fires and non-fatal home fire injuries. Smoking materials are still the leading cause of home fire deaths. Half of all home fire deaths result from incidents reported between 11:00 p.m. and 7:00 a.m. One-quarter (25%) of all home fire deaths were caused by fires that started in the bedroom; another quarter (24%) resulted from fires originating in the living room, family room, or den; and 16% were caused by fires starting in the kitchen. Three out of five home fire deaths resulted from fires in which no smoke alarms were present or in which smoke alarms were present but did not operate. Compared to other age groups, older adults were more likely to be killed by a home fire. These estimates are based on data from the U.S. Fire Administration’s (USFA’s) National Fire Incident Reporting System (NFIRS) and the National Fire Protection Association’s (NFPA’s) annual fire department experience survey. Keywords: fire statistics, home fires, residential fires, apartment fires, dwelling fires, multi-family housing Acknowledgements The National Fire Protection Association thanks all the fire departments and state fire authorities who participate in the National Fire Incident Reporting System (NFIRS) and the annual NFPA fire experience survey. These firefighters are the original sources of the detailed data that make this analysis possible. Their contributions allow us to estimate the size of the fire problem. We are also grateful to the U.S. Fire Administration for its work in developing, coordinating, and maintaining NFIRS. For more information about the National Fire Protection Association, visit www.nfpa.org or call 617-770-3000. To learn more about the One-Stop Data Shop go to www.nfpa.org/osds or call 617-984-7443.
Copies of this analysis are available from:
National Fire Protection Association One-Stop Data Shop 1 Batterymarch Park Quincy, MA 02169-7471 www.nfpa.org e-mail: [email protected] phone: 617-984-7443
NFPA No. USS12G-01
Copyright © 2013, National Fire Protection Association, Quincy, MA
U.S. Home Structure Fires, 4/13 i NFPA Fire Analysis and Research, Quincy, MA
Executive Summary
During the five-year period of 2007-2011, U.S. fire departments responded to an estimated average of 366,600 home structure fires per year. These fires caused an annual average of 2,570 civilian deaths, 13,210 civilian fire injuries, and $7.2 billion in direct property damage. On average, seven people died in U.S. home fires per day. Home fires accounted for three-quarters (74%) of all reported structure fires, 92% of civilian structure fire deaths, 87% of the civilian structure fire injuries, and two-thirds (68%) of direct structure fire property loss. Homes include one- and two-family homes, manufactured homes, and apartments or other multi-family housing, regardless of ownership. In general, any fire in or on a structure is considered a structure fire, including incidents in which only contents were damaged. The statistics about fires and associated losses in this analysis are national estimates of fires reported to U.S. municipal fire departments. Fires reported only to federal or state agencies or industrial fire brigades are not captured here. These national estimates are projections based on the detailed information collected by the U.S. Fire Administration’s National Fire Incident Reporting System (NFIRS 5.0) and the National Fire Protection Association’s (NFPA’s) annual fire department experience survey. During 2007-2011, roughly one of every 320 households per year had a reported home fire. Results from NFPA’s annual survey of fire department experience are provided annually in the, Fire Loss in the United States series, by Michael J. Karter, Jr. His estimates of home fires and losses for 2011 show that substantial progress has been made since 1980, the first year in which national estimates of specific fire problems were available. Reported home fires fell from 734,000 in 1980 to 370,000 in 2011, a 50% drop. Deaths resulting from these fires fell 52% from 5,200 in 1980 to a new low of 2,520 in 2011. Understanding how home fires occur and the factors that contribute to injury or death is essential to finding better ways to prevent such incidents. In 2007-2011, people 65 and older were 2.4 times as likely to die from a home fire as the general population. People in the 50-64 age group were 1.4 times as likely to die in a home fire as the overall population. Children under five were 1.1 times as likely as the overall population to be killed by a home fire. This means that pre-school children now have a fire death risk only slightly greater than the overall population. The highest risk for non-fatal home fire injury was seen among adults age 20-49 or 85 and older. Members of these age groups were 1.2 times as likely to be injured in a home fire as the overall population. In 2007-2011, 29% of home structure fires and more than one-third (37%) of home structure fire deaths occurred in the winter months of December, January and February. Reported home fires peaked around the dinner hours of 5:00 to 8:00 p.m. While just one-fifth (20%) of reported home fires occurred between 11:00 p.m. and 7:00 a.m., but half (51%) of the home fire deaths resulted from fires reported during these hours.
U.S. Home Structure Fires, 4/13 ii NFPA Fire Analysis and Research, Quincy, MA
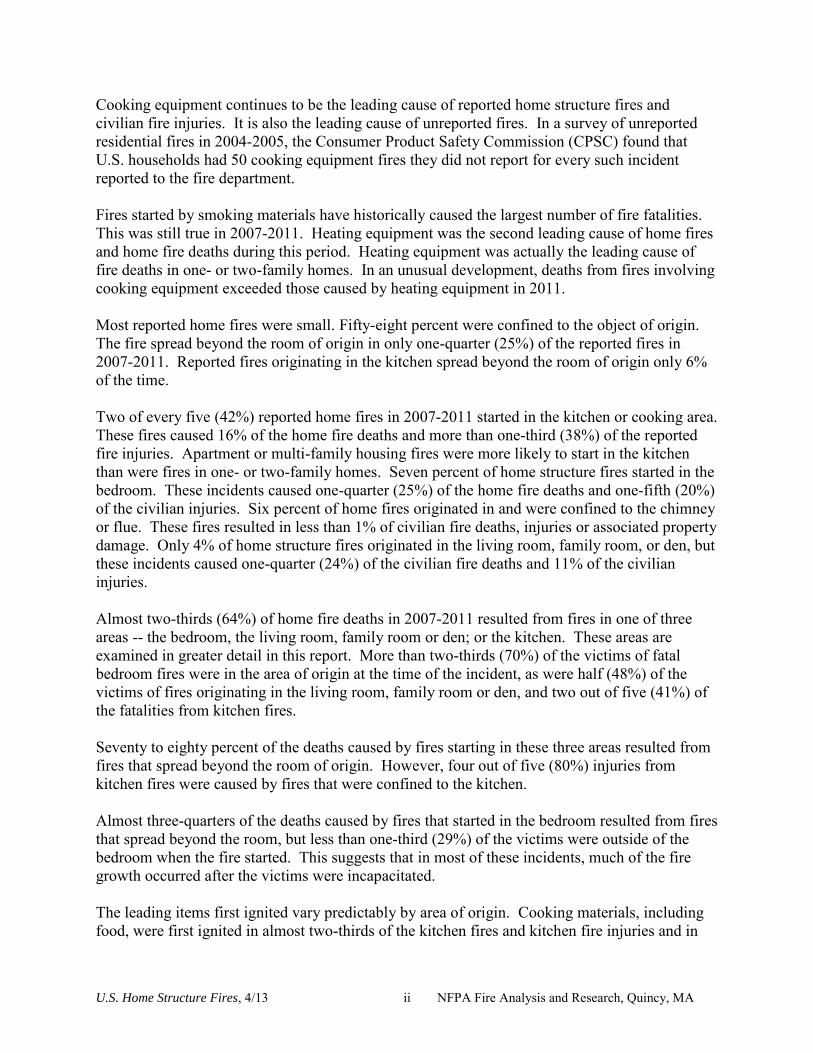
Cooking equipment continues to be the leading cause of reported home structure fires and civilian fire injuries. It is also the leading cause of unreported fires. In a survey of unreported residential fires in 2004-2005, the Consumer Product Safety Commission (CPSC) found that U.S. households had 50 cooking equipment fires they did not report for every such incident reported to the fire department. Fires started by smoking materials have historically caused the largest number of fire fatalities. This was still true in 2007-2011. Heating equipment was the second leading cause of home fires and home fire deaths during this period. Heating equipment was actually the leading cause of fire deaths in one- or two-family homes. In an unusual development, deaths from fires involving cooking equipment exceeded those caused by heating equipment in 2011. Most reported home fires were small. Fifty-eight percent were confined to the object of origin. The fire spread beyond the room of origin in only one-quarter (25%) of the reported fires in 2007-2011. Reported fires originating in the kitchen spread beyond the room of origin only 6% of the time. Two of every five (42%) reported home fires in 2007-2011 started in the kitchen or cooking area. These fires caused 16% of the home fire deaths and more than one-third (38%) of the reported fire injuries. Apartment or multi-family housing fires were more likely to start in the kitchen than were fires in one- or two-family homes. Seven percent of home structure fires started in the bedroom. These incidents caused one-quarter (25%) of the home fire deaths and one-fifth (20%) of the civilian injuries. Six percent of home fires originated in and were confined to the chimney or flue. These fires resulted in less than 1% of civilian fire deaths, injuries or associated property damage. Only 4% of home structure fires originated in the living room, family room, or den, but these incidents caused one-quarter (24%) of the civilian fire deaths and 11% of the civilian injuries. Almost two-thirds (64%) of home fire deaths in 2007-2011 resulted from fires in one of three areas -- the bedroom, the living room, family room or den; or the kitchen. These areas are examined in greater detail in this report. More than two-thirds (70%) of the victims of fatal bedroom fires were in the area of origin at the time of the incident, as were half (48%) of the victims of fires originating in the living room, family room or den, and two out of five (41%) of the fatalities from kitchen fires. Seventy to eighty percent of the deaths caused by fires starting in these three areas resulted from fires that spread beyond the room of origin. However, four out of five (80%) injuries from kitchen fires were caused by fires that were confined to the kitchen. Almost three-quarters of the deaths caused by fires that started in the bedroom resulted from fires that spread beyond the room, but less than one-third (29%) of the victims were outside of the bedroom when the fire started. This suggests that in most of these incidents, much of the fire growth occurred after the victims were incapacitated. The leading items first ignited vary predictably by area of origin. Cooking materials, including food, were first ignited in almost two-thirds of the kitchen fires and kitchen fire injuries and in
U.S. Home Structure Fires, 4/13 iii NFPA Fire Analysis and Research, Quincy, MA
one-third of kitchen fire deaths. Upholstered furniture was the item first ignited in one of every five fires starting in a living room, family room or den, and in almost half of the associated deaths. Mattresses or bedding were first ignited in almost one-third of the fires originating in the bedroom and almost half of the associated deaths and injuries. Some overlap does occur. Upholstered furniture was first ignited in 6% of fire deaths resulting from fires starting in the bedroom. Mattresses or bedding were first ignited in 5% of the deaths from fires starting in the living room. More progress has been made in some areas than in others. Historically, the largest number of fire deaths resulted from fires starting in living rooms, family rooms, or dens. The difference between the three leading areas of origin for home fire deaths has shrunk over time, with deaths from fires starting in bedrooms now sometimes exceeding the number resulting from fires starting in living rooms, family rooms or dens. Compared to home fire deaths in 1980-1984, the average number of deaths in 2007-2011 resulting from fires starting in the living room, family room, or den fell 68%; deaths from fires beginning in the bedroom fell 47%; and deaths from kitchen fires dropped 38%.
The two leading items in home fire deaths remain upholstered furniture, first ignited in 18% of home fire deaths in 2007-2011, and mattresses and bedding, first ignited in 13% of the deaths. It is encouraging that the average number of deaths from home fires beginning with upholstered furniture was 63% lower than the 1980-1984 average, while deaths from fires starting with mattresses or bedding were down 57% from the earlier period. The annual average death toll from fires started by smoking materials was 66% lower in 2007-2011 than it was in 1980-1984, while deaths from fires started by small open flames (lighters, candles, or matches) were down 56% compared to the earlier years. The death toll from fires started by some type of operating equipment was 45% lower in the more recent period than in 1980-1984. Almost all home fires and associated losses result from fires in homes that are normally occupied. In recent years, the poor economy has led to an increase in housing units that are temporarily vacant or vacant year round. While 11% of housing units were vacant year-round in 2007-2011, only 6% of home structure fires occurred in vacant properties. Vacant properties do pose some special concerns. Half (50%) of the fires in vacant homes were intentionally set, compared to only 8% of home structure fires overall. Fire spread beyond the building of origin in 10% of vacant home fires compared to only 3% of home fires overall. Considerable progress has been made but more is left to be done. Equipment and other product redesign, such as the “fire-safe” cigarette which was designed to stop burning if not actively smoked, or automatic shut-offs on heating equipment, cooking equipment, or irons can mitigate human error and improve safety. Such changes may be the most effective and inexpensive approach to fire prevention. The CPSC issues safety standards and recalls of unsafe consumer products. Properly installed and maintained fire protection equipment can prevent most fire deaths. A smoke alarm was present in almost three-quarters of reported home fires, substantially less than
U.S. Home Structure Fires, 4/13 iv NFPA Fire Analysis and Research, Quincy, MA
the 96% of homes with smoke alarms that were reported surveys done for NFPA in the past few years. However, three out of five home fire deaths resulted from fires in which no smoke alarm was present (37%) or at least one alarm was present but did not operate (23%). Forty percent of home fire deaths resulted from fires with operating smoke alarms. Only a minority of homes have interconnected smoke alarms. When smoke alarms are interconnected, all alarms will sound when one is activated, enabling the warning to sound throughout the home. People who are in the room of fire origin may be intimately involved with ignition. Their clothing or the furniture they are sitting in or lying on may catch fire. Traditional means of fire protection may not save them. Even if they are not intimately involved, being in the room where the fire starts dramatically reduces the time they would have to escape. Home fire sprinklers can control a fire until help arrives even when the occupants are unable to act. In his 2012 report, U.S. Experience with Sprinklers, John R. Hall, Jr. of NFPA noted that fire sprinklers were present in only 6% of reported home fires in 2006-2010. The death rate per 1,000 reported home fires was 83% lower when wet pipe sprinkler systems were present compared to reported home fires without any automatic extinguishing systems. For more information on how sprinklers can help, see firesprinklerinitiative.org. Additional safety information on the topics discussed can be found at NFPA’s website, nfpa.org. All of NFPA’s codes and standards can be viewed at nfpa.org/freeaccess.
U.S. Home Structure Fires, 4/13 v NFPA Fire Analysis and Research, Quincy, MA
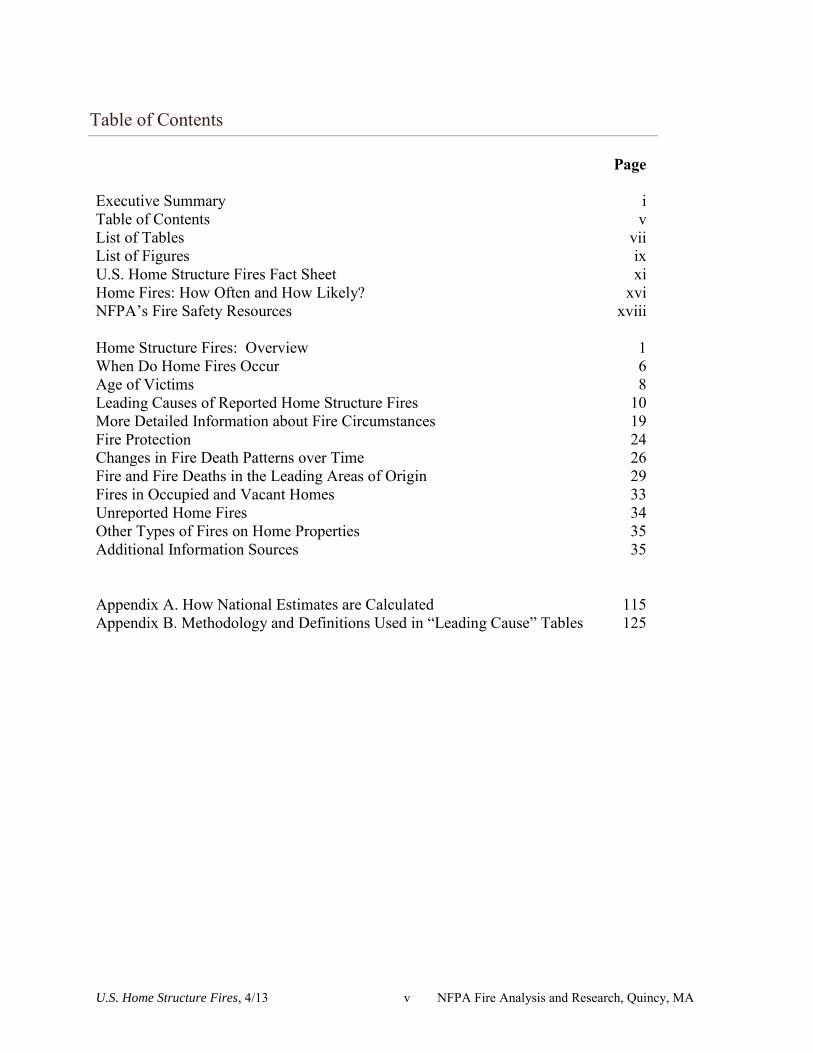
Table of Contents
Page Executive Summary i Table of Contents v List of Tables vii List of Figures ix U.S. Home Structure Fires Fact Sheet xi Home Fires: How Often and How Likely? xvi NFPA’s Fire Safety Resources xviii Home Structure Fires: Overview 1 When Do Home Fires Occur 6 Age of Victims 8 Leading Causes of Reported Home Structure Fires 10 More Detailed Information about Fire Circumstances 19 Fire Protection 24 Changes in Fire Death Patterns over Time 26 Fire and Fire Deaths in the Leading Areas of Origin 29 Fires in Occupied and Vacant Homes 33 Unreported Home Fires 34 Other Types of Fires on Home Properties 35 Additional Information Sources 35 Appendix A. How National Estimates are Calculated 115 Appendix B. Methodology and Definitions Used in “Leading Cause” Tables 125

U.S. Home Structure Fires, 4/13 vi NFPA Fire Analysis and Research, Quincy, MA
U.S. Home Structure Fires, 4/13 vii NFPA Fire Analysis and Research, Quincy, MA
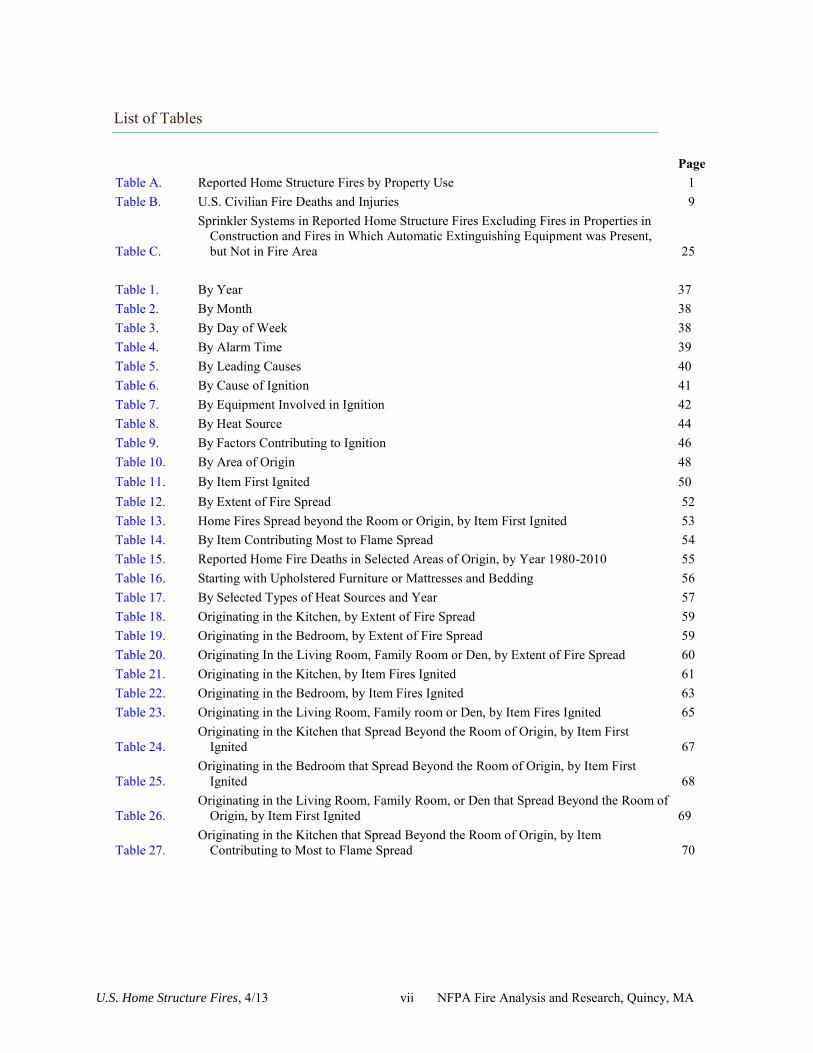
List of Tables
Page Table A. Reported Home Structure Fires by Property Use 1 Table B. U.S. Civilian Fire Deaths and Injuries 9
Table C.
Sprinkler Systems in Reported Home Structure Fires Excluding Fires in Properties in Construction and Fires in Which Automatic Extinguishing Equipment was Present, but Not in Fire Area 25
Table 1. By Year 37 Table 2. By Month 38 Table 3. By Day of Week 38 Table 4. By Alarm Time 39 Table 5. By Leading Causes 40 Table 6. By Cause of Ignition 41 Table 7. By Equipment Involved in Ignition 42 Table 8. By Heat Source 44 Table 9. By Factors Contributing to Ignition 46 Table 10. By Area of Origin 48 Table 11. By Item First Ignited 50 Table 12. By Extent of Fire Spread 52 Table 13. Home Fires Spread beyond the Room or Origin, by Item First Ignited 53 Table 14. By Item Contributing Most to Flame Spread 54 Table 15. Reported Home Fire Deaths in Selected Areas of Origin, by Year 1980-2010 55 Table 16. Starting with Upholstered Furniture or Mattresses and Bedding 56 Table 17. By Selected Types of Heat Sources and Year 57 Table 18. Originating in the Kitchen, by Extent of Fire Spread 59 Table 19. Originating in the Bedroom, by Extent of Fire Spread 59 Table 20. Originating In the Living Room, Family Room or Den, by Extent of Fire Spread 60 Table 21. Originating in the Kitchen, by Item Fires Ignited 61 Table 22. Originating in the Bedroom, by Item Fires Ignited 63 Table 23. Originating in the Living Room, Family room or Den, by Item Fires Ignited 65
Table 24. Originating in the Kitchen that Spread Beyond the Room of Origin, by Item First
Ignited 67
Table 25. Originating in the Bedroom that Spread Beyond the Room of Origin, by Item First
Ignited 68
Table 26. Originating in the Living Room, Family Room, or Den that Spread Beyond the Room of
Origin, by Item First Ignited 69
Table 27. Originating in the Kitchen that Spread Beyond the Room of Origin, by Item
Contributing to Most to Flame Spread 70
U.S. Home Structure Fires, 4/13 viii NFPA Fire Analysis and Research, Quincy, MA
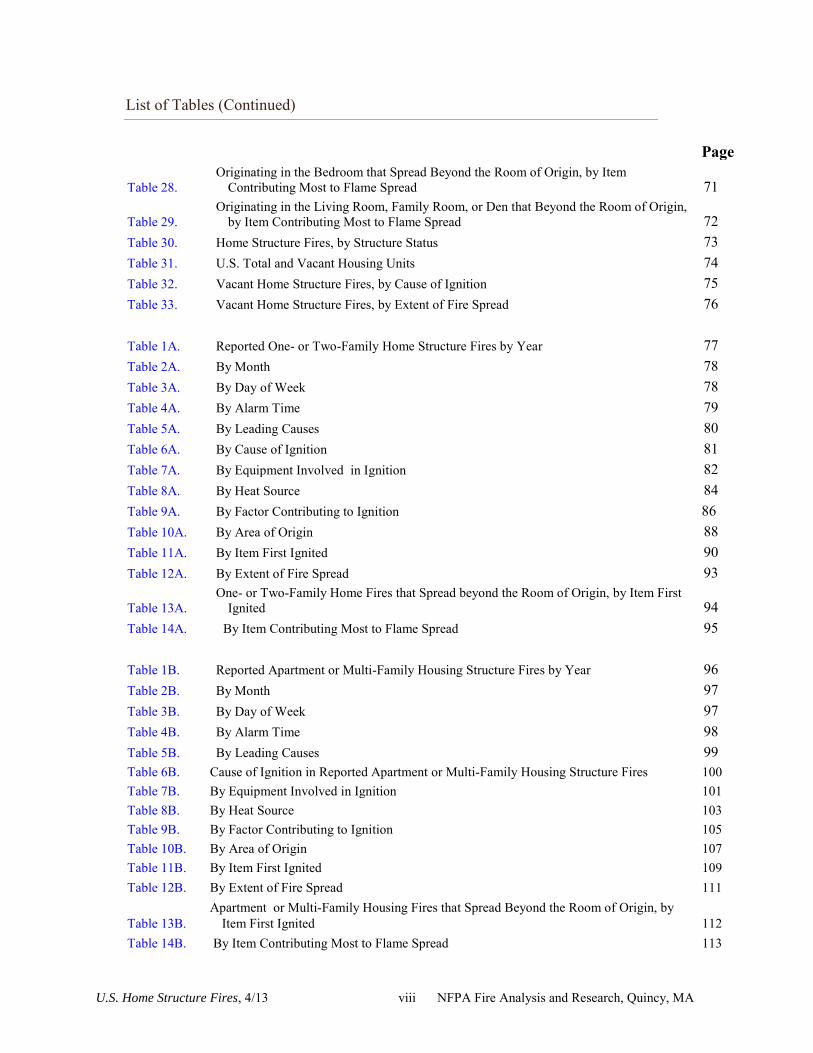
List of Tables (Continued)
Page
Table 28. Originating in the Bedroom that Spread Beyond the Room of Origin, by Item
Contributing Most to Flame Spread 71
Table 29. Originating in the Living Room, Family Room, or Den that Beyond the Room of Origin,
by Item Contributing Most to Flame Spread 72 Table 30. Home Structure Fires, by Structure Status 73 Table 31. U.S. Total and Vacant Housing Units 74 Table 32. Vacant Home Structure Fires, by Cause of Ignition 75 Table 33. Vacant Home Structure Fires, by Extent of Fire Spread 76 Table 1A. Reported One- or Two-Family Home Structure Fires by Year 77 Table 2A. By Month 78 Table 3A. By Day of Week 78 Table 4A. By Alarm Time 79 Table 5A. By Leading Causes 80 Table 6A. By Cause of Ignition 81 Table 7A. By Equipment Involved in Ignition 82 Table 8A. By Heat Source 84 Table 9A. By Factor Contributing to Ignition 86 Table 10A. By Area of Origin 88 Table 11A. By Item First Ignited 90 Table 12A. By Extent of Fire Spread 93
Table 13A. One- or Two-Family Home Fires that Spread beyond the Room of Origin, by Item First
Ignited 94 Table 14A. By Item Contributing Most to Flame Spread 95 Table 1B. Reported Apartment or Multi-Family Housing Structure Fires by Year 96 Table 2B. By Month 97 Table 3B. By Day of Week 97 Table 4B. By Alarm Time 98 Table 5B. By Leading Causes 99 Table 6B. Cause of Ignition in Reported Apartment or Multi-Family Housing Structure Fires 100 Table 7B. By Equipment Involved in Ignition 101 Table 8B. By Heat Source 103 Table 9B. By Factor Contributing to Ignition 105 Table 10B. By Area of Origin 107 Table 11B. By Item First Ignited 109 Table 12B. By Extent of Fire Spread 111
Table 13B. Apartment or Multi-Family Housing Fires that Spread Beyond the Room of Origin, by
Item First Ignited 112 Table 14B. By Item Contributing Most to Flame Spread 113
U.S. Home Structure Fires, 4/13 ix NFPA Fire Analysis and Research, Quincy, MA
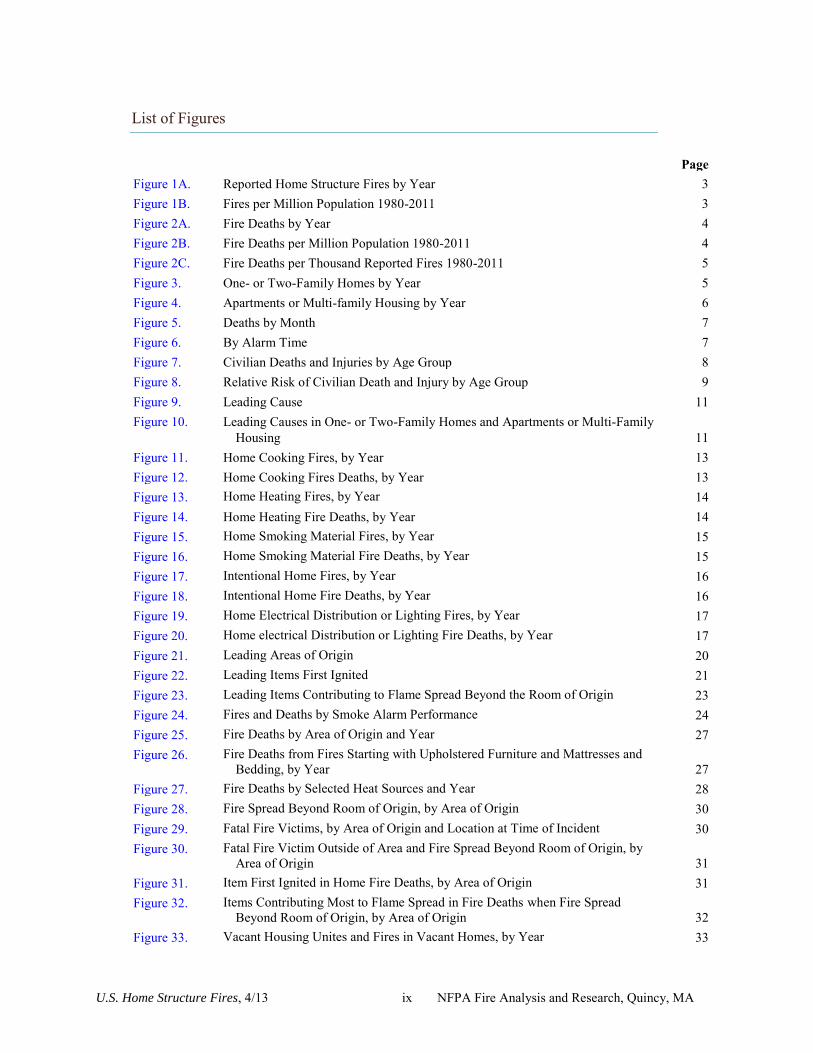
List of Figures
Page Figure 1A. Reported Home Structure Fires by Year 3 Figure 1B. Fires per Million Population 1980-2011 3 Figure 2A. Fire Deaths by Year 4 Figure 2B. Fire Deaths per Million Population 1980-2011 4 Figure 2C. Fire Deaths per Thousand Reported Fires 1980-2011 5 Figure 3. One- or Two-Family Homes by Year 5 Figure 4. Apartments or Multi-family Housing by Year 6 Figure 5. Deaths by Month 7 Figure 6. By Alarm Time 7 Figure 7. Civilian Deaths and Injuries by Age Group 8 Figure 8. Relative Risk of Civilian Death and Injury by Age Group 9 Figure 9. Leading Cause 11 Figure 10. Leading Causes in One- or Two-Family Homes and Apartments or Multi-Family
Housing 11 Figure 11. Home Cooking Fires, by Year 13 Figure 12. Home Cooking Fires Deaths, by Year 13 Figure 13. Home Heating Fires, by Year 14 Figure 14. Home Heating Fire Deaths, by Year 14 Figure 15. Home Smoking Material Fires, by Year 15 Figure 16. Home Smoking Material Fire Deaths, by Year 15 Figure 17. Intentional Home Fires, by Year 16 Figure 18. Intentional Home Fire Deaths, by Year 16 Figure 19. Home Electrical Distribution or Lighting Fires, by Year 17 Figure 20. Home electrical Distribution or Lighting Fire Deaths, by Year 17 Figure 21. Leading Areas of Origin 20 Figure 22. Leading Items First Ignited 21 Figure 23. Leading Items Contributing to Flame Spread Beyond the Room of Origin 23 Figure 24. Fires and Deaths by Smoke Alarm Performance 24 Figure 25. Fire Deaths by Area of Origin and Year 27 Figure 26. Fire Deaths from Fires Starting with Upholstered Furniture and Mattresses and
Bedding, by Year 27 Figure 27. Fire Deaths by Selected Heat Sources and Year 28 Figure 28. Fire Spread Beyond Room of Origin, by Area of Origin 30 Figure 29. Fatal Fire Victims, by Area of Origin and Location at Time of Incident 30 Figure 30. Fatal Fire Victim Outside of Area and Fire Spread Beyond Room of Origin, by
Area of Origin 31 Figure 31. Item First Ignited in Home Fire Deaths, by Area of Origin 31 Figure 32. Items Contributing Most to Flame Spread in Fire Deaths when Fire Spread
Beyond Room of Origin, by Area of Origin 32 Figure 33. Vacant Housing Unites and Fires in Vacant Homes, by Year 33

U.S. Home Structure Fires, 4/13 x NFPA Fire Analysis and Research, Quincy, MA
Fire Analysis and Research
U.S. Home Structure Fires, 4/13 xi NFPA Fire Analysis and Research, Quincy, MA
U.S. Home Structure Fires Fact Sheet
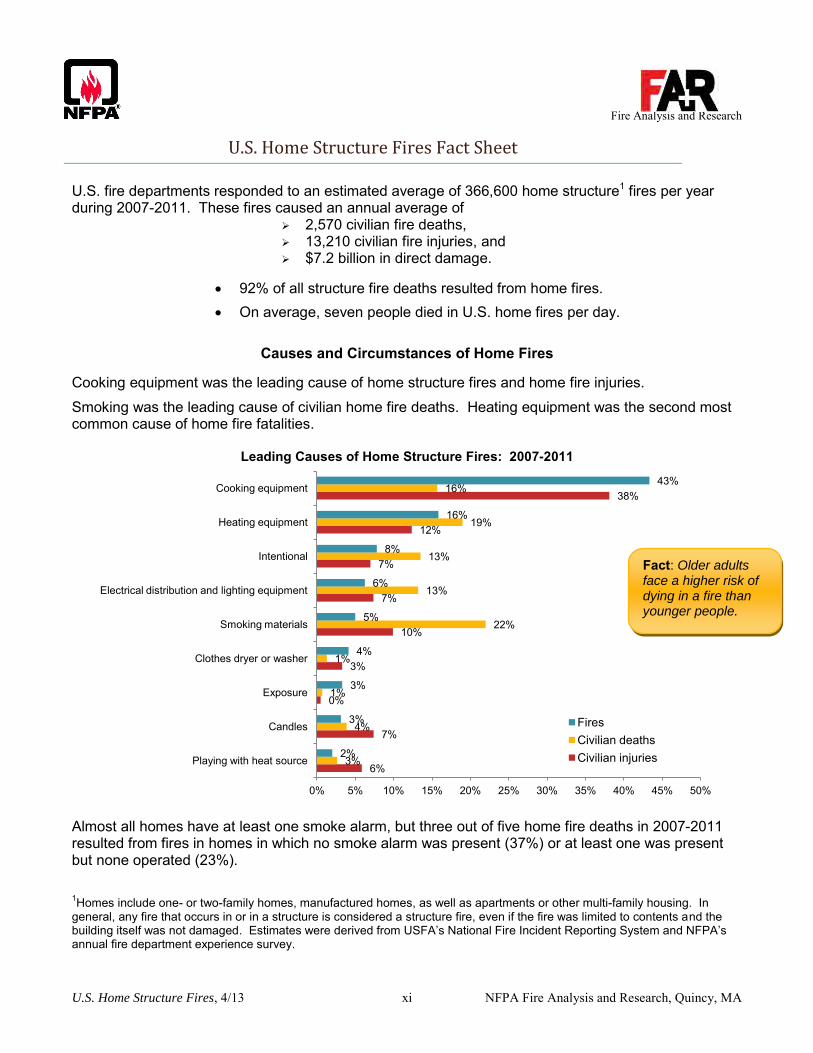
U.S. fire departments responded to an estimated average of 366,600 home structure1 fires per year during 2007-2011. These fires caused an annual average of
2,570 civilian fire deaths, 13,210 civilian fire injuries, and $7.2 billion in direct damage.
92% of all structure fire deaths resulted from home fires.
On average, seven people died in U.S. home fires per day.
Causes and Circumstances of Home Fires Cooking equipment was the leading cause of home structure fires and home fire injuries.
Smoking was the leading cause of civilian home fire deaths. Heating equipment was the second most common cause of home fire fatalities.
Leading Causes of Home Structure Fires: 2007-2011
Almost all homes have at least one smoke alarm, but three out of five home fire deaths in 2007-2011 resulted from fires in homes in which no smoke alarm was present (37%) or at least one was present but none operated (23%).
1Homes include one- or two-family homes, manufactured homes, as well as apartments or other multi-family housing. In general, any fire that occurs in or in a structure is considered a structure fire, even if the fire was limited to contents and the building itself was not damaged. Estimates were derived from USFA’s National Fire Incident Reporting System and NFPA’s annual fire department experience survey.
6%
7%
0%
3%
10%
7%
7%
12%
38%
3%
4%
1%
1%
22%
13%
13%
19%
16%
2%
3%
3%
4%
5%
6%
8%
16%
43%
0% 5% 10% 15% 20% 25% 30% 35% 40% 45% 50%
Playing with heat source
Candles
Exposure
Clothes dryer or washer
Smoking materials
Electrical distribution and lighting equipment
Intentional
Heating equipment
Cooking equipment
Fires Civilian deaths Civilian injuries
Fact: Older adults face a higher risk of dying in a fire than younger people.
U.S. Home Structure Fires, 4/13 xv NFPA Fire Analysis and Research, Quincy, MA
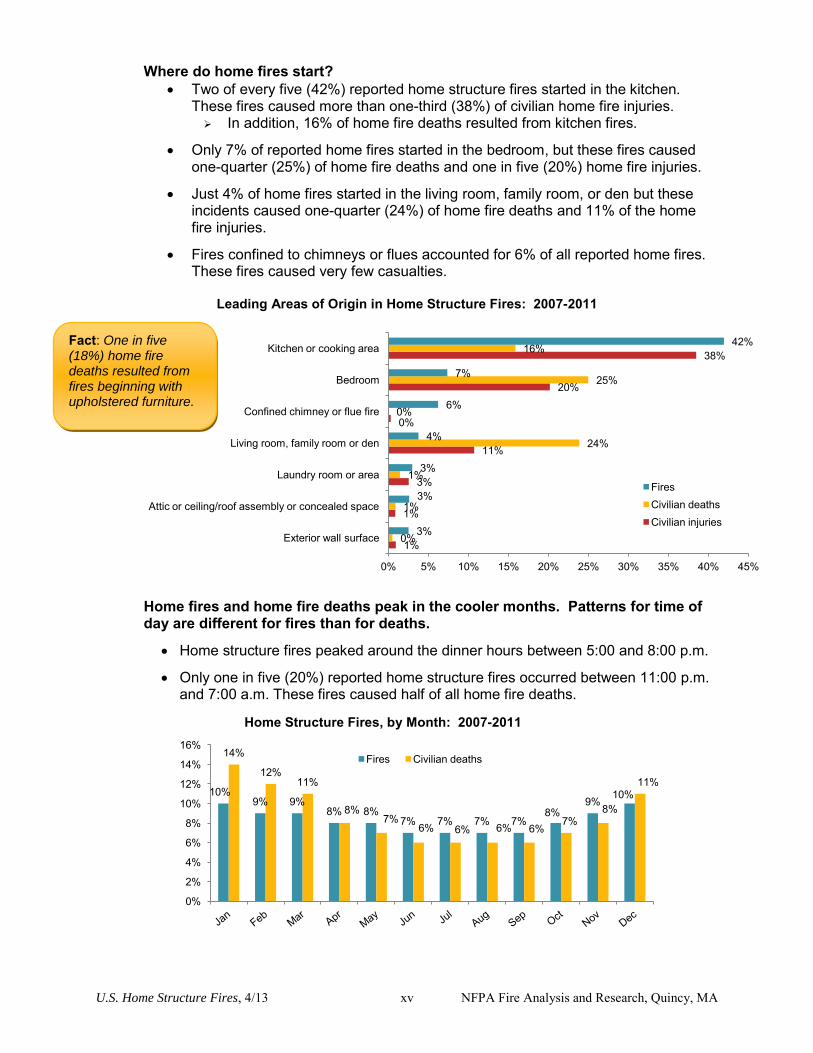
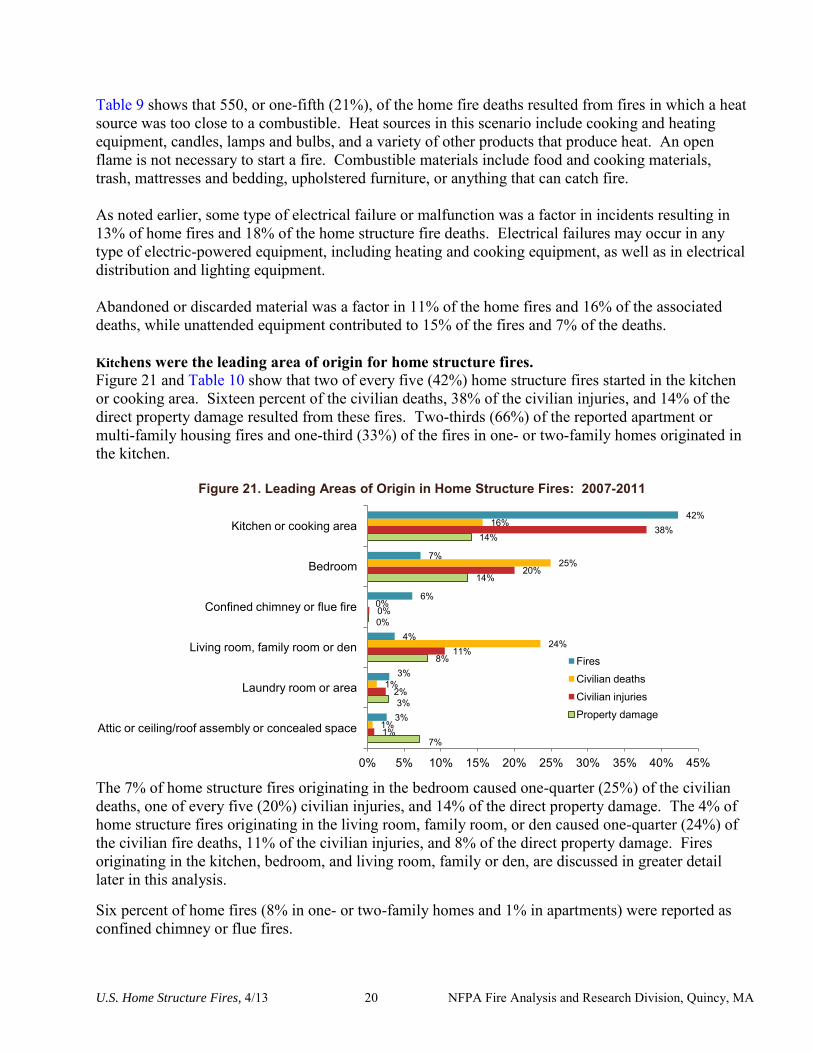
Where do home fires start? Two of every five (42%) reported home structure fires started in the kitchen.
These fires caused more than one-third (38%) of civilian home fire injuries. In addition, 16% of home fire deaths resulted from kitchen fires.
Only 7% of reported home fires started in the bedroom, but these fires caused one-quarter (25%) of home fire deaths and one in five (20%) home fire injuries.
Just 4% of home fires started in the living room, family room, or den but these incidents caused one-quarter (24%) of home fire deaths and 11% of the home fire injuries.
Fires confined to chimneys or flues accounted for 6% of all reported home fires. These fires caused very few casualties.
Leading Areas of Origin in Home Structure Fires: 2007-2011
Home fires and home fire deaths peak in the cooler months. Patterns for time of day are different for fires than for deaths.
Home structure fires peaked around the dinner hours between 5:00 and 8:00 p.m.
Only one in five (20%) reported home structure fires occurred between 11:00 p.m. and 7:00 a.m. These fires caused half of all home fire deaths.
Home Structure Fires, by Month: 2007-2011
1%
1%
3%
11%
0%
20%
38%
0%
1%
1%
24%
0%
25%
16%
3%
3%
3%
4%
6%
7%
42%
0% 5% 10% 15% 20% 25% 30% 35% 40% 45%
Exterior wall surface
Attic or ceiling/roof assembly or concealed space
Laundry room or area
Living room, family room or den
Confined chimney or flue fire
Bedroom
Kitchen or cooking area
Fires Civilian deaths Civilian injuries
10% 9% 9%
8% 8% 7% 7% 7% 7%
8% 9%
10%
14%
12% 11%
8% 7%
6% 6% 6% 6% 7%
8%
11%
0%
2%
4%
6%
8%
10%
12%
14%
16% Fires Civilian deaths
Fact: One in five (18%) home fire deaths resulted from fires beginning with upholstered furniture.
U.S. Home Structure Fires, 4/13 xvi NFPA Fire Analysis and Research, Quincy, MA
Home Fires: How Often and How Likely?
Sometimes it is easier to think of the statistics in terms of time. The statistics below are based on home structure fires reported during 2007-2011.
Reported home fires by time
On average, U.S. fire departments responded to an average of 1,000 home structure fires every day. This translates to 42 home fires every hour or one reported home fire every 86 seconds.
Home fires killed an average of seven people per day.
A civilian (non-firefighter) home fire injury was reported every 40 minutes.
Home fires caused roughly $228 in damage every second.
The odds of a reported fire
According to the U.S Census Bureau, in 2009 (the mid-point of this period), the U.S. had roughly 307 million residents living in roughly 117 million households. That means that, on average during this period,
● Roughly one of 840 people had a reported home fire each year.
● Roughly one of every 320 households had a reported home fire each year.
● On average, one of every 119,000 U.S. residents died in a home fire per year.
Fires handled without the fire department
The Consumer Product Safety Commission’s (CPSC’s) 2004-2005 Residential Fire Survey found that U.S. households experience an average of 7.4 million home fires per year. Roughly 130,000 injuries or symptoms, usually minor, resulted from these fires. The fire department was called to only 3% of these fires.
Including unreported fires, one in 40 people has a home fire each year, as does one in 15 households. This means that over an average lifetime, an individual’s household will experience five fires.

U.S. Home Structure Fires, 4/13 xvii NFPA Fire Analysis and Research Division, Quincy, MA
U.S. Home Structure Fires, 4/13 xviii NFPA Fire Analysis and Research Division, Quincy, MA
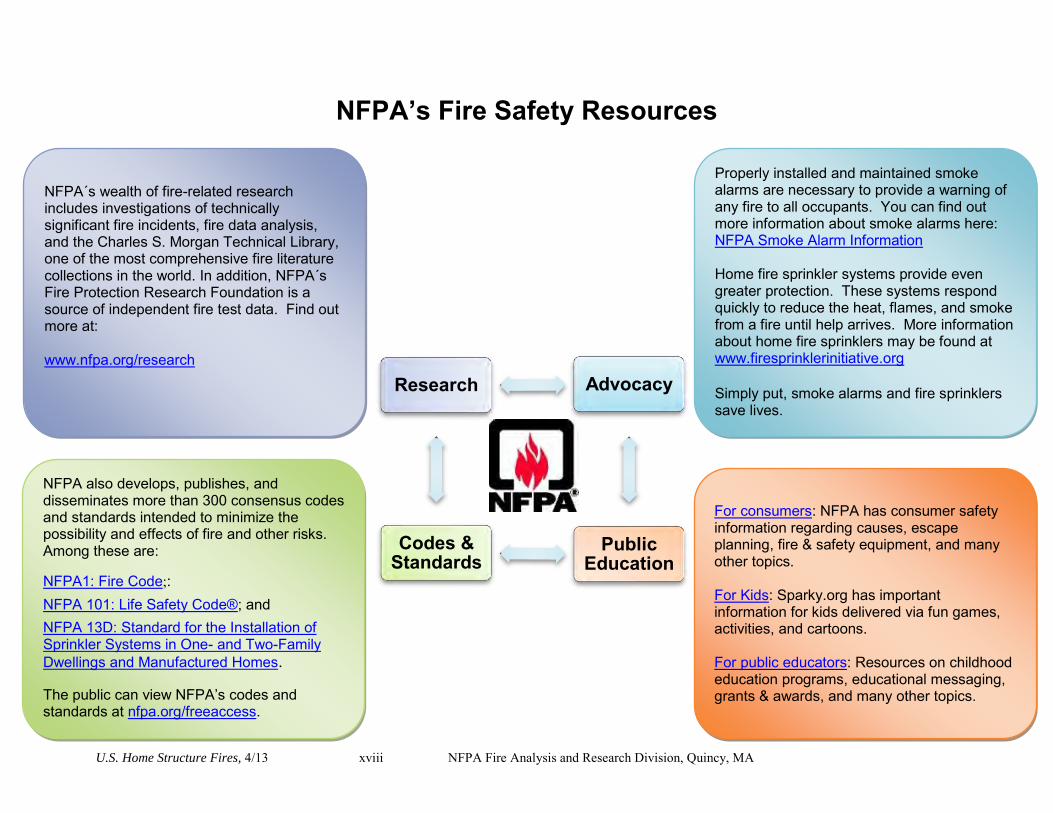
NFPA’s Fire Safety Resources
Advocacy
Public Education
Codes & Standards
Research
Properly installed and maintained smoke alarms are necessary to provide a warning of any fire to all occupants. You can find out more information about smoke alarms here: NFPA Smoke Alarm Information Home fire sprinkler systems provide even greater protection. These systems respond quickly to reduce the heat, flames, and smoke from a fire until help arrives. More information about home fire sprinklers may be found at www.firesprinklerinitiative.org Simply put, smoke alarms and fire sprinklers save lives.
For consumers: NFPA has consumer safety information regarding causes, escape planning, fire & safety equipment, and many other topics. For Kids: Sparky.org has important information for kids delivered via fun games, activities, and cartoons. For public educators: Resources on childhood education programs, educational messaging, grants & awards, and many other topics.
NFPA also develops, publishes, and disseminates more than 300 consensus codes and standards intended to minimize the possibility and effects of fire and other risks. Among these are: NFPA1: Fire Code;:
NFPA 101: Life Safety Code®; and
NFPA 13D: Standard for the Installation of Sprinkler Systems in One- and Two-Family Dwellings and Manufactured Homes. The public can view NFPA’s codes and standards at nfpa.org/freeaccess.
NFPA´s wealth of fire-related research includes investigations of technically significant fire incidents, fire data analysis, and the Charles S. Morgan Technical Library, one of the most comprehensive fire literature collections in the world. In addition, NFPA´s Fire Protection Research Foundation is a source of independent fire test data. Find out more at: www.nfpa.org/research

U.S. Home Structure Fires, 4/13 xix NFPA Fire Analysis and Research Division, Quincy, MA
U.S. Home Structure Fires, 4/13 1 NFPA Fire Analysis and Research Division, Quincy, MA
Home Structure Fires: Overview
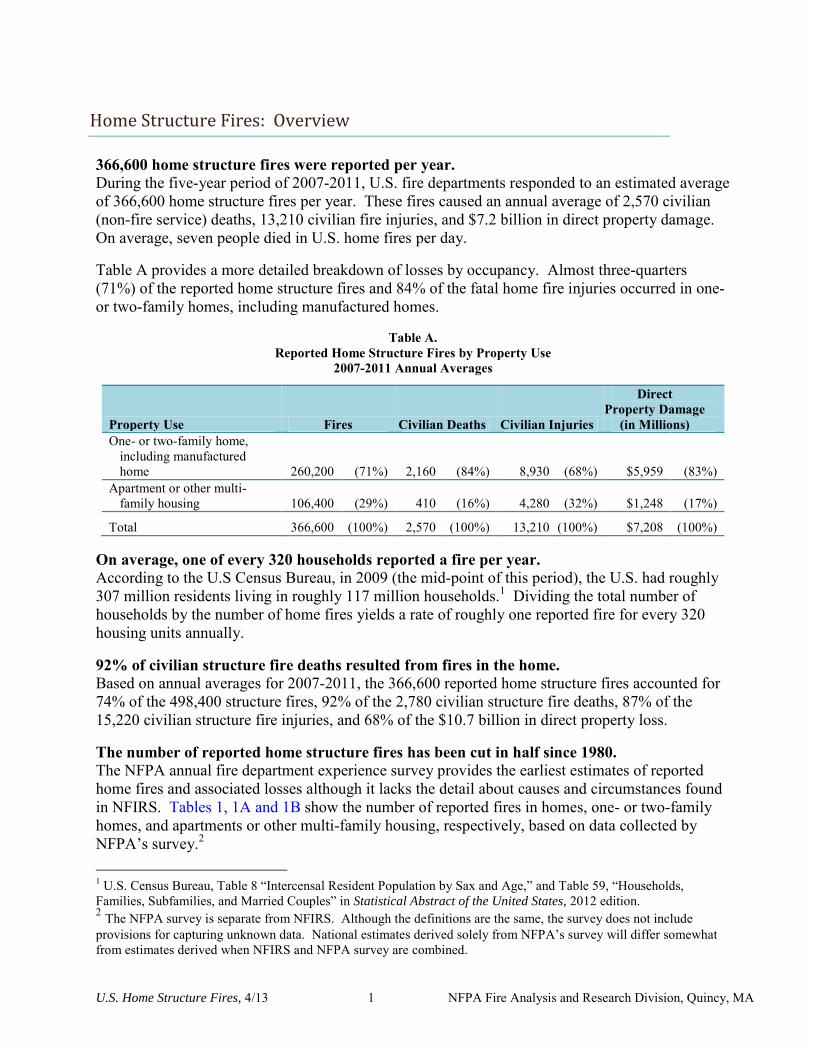
366,600 home structure fires were reported per year. During the five-year period of 2007-2011, U.S. fire departments responded to an estimated average of 366,600 home structure fires per year. These fires caused an annual average of 2,570 civilian (non-fire service) deaths, 13,210 civilian fire injuries, and $7.2 billion in direct property damage. On average, seven people died in U.S. home fires per day. Table A provides a more detailed breakdown of losses by occupancy. Almost three-quarters (71%) of the reported home structure fires and 84% of the fatal home fire injuries occurred in one- or two-family homes, including manufactured homes.
Table A. Reported Home Structure Fires by Property Use
2007-2011 Annual Averages
Property Use Fires Civilian Deaths Civilian Injuries
Direct Property Damage
(in Millions) One- or two-family home,
including manufactured home 260,200 (71%) 2,160 (84%) 8,930 (68%) $5,959 (83%)
Apartment or other multi-family housing 106,400 (29%) 410 (16%) 4,280 (32%) $1,248 (17%)
Total 366,600 (100%) 2,570 (100%) 13,210 (100%) $7,208 (100%) On average, one of every 320 households reported a fire per year. According to the U.S Census Bureau, in 2009 (the mid-point of this period), the U.S. had roughly 307 million residents living in roughly 117 million households.1 Dividing the total number of households by the number of home fires yields a rate of roughly one reported fire for every 320 housing units annually. 92% of civilian structure fire deaths resulted from fires in the home. Based on annual averages for 2007-2011, the 366,600 reported home structure fires accounted for 74% of the 498,400 structure fires, 92% of the 2,780 civilian structure fire deaths, 87% of the 15,220 civilian structure fire injuries, and 68% of the $10.7 billion in direct property loss. The number of reported home structure fires has been cut in half since 1980. The NFPA annual fire department experience survey provides the earliest estimates of reported home fires and associated losses although it lacks the detail about causes and circumstances found in NFIRS. Tables 1, 1A and 1B show the number of reported fires in homes, one- or two-family homes, and apartments or other multi-family housing, respectively, based on data collected by NFPA’s survey.2
1 U.S. Census Bureau, Table 8 “Intercensal Resident Population by Sax and Age,” and Table 59, “Households, Families, Subfamilies, and Married Couples” in Statistical Abstract of the United States, 2012 edition. 2 The NFPA survey is separate from NFIRS. Although the definitions are the same, the survey does not include provisions for capturing unknown data. National estimates derived solely from NFPA’s survey will differ somewhat from estimates derived when NFIRS and NFPA survey are combined.
U.S. Home Structure Fires, 4/13 2 NFPA Fire Analysis and Research Division, Quincy, MA
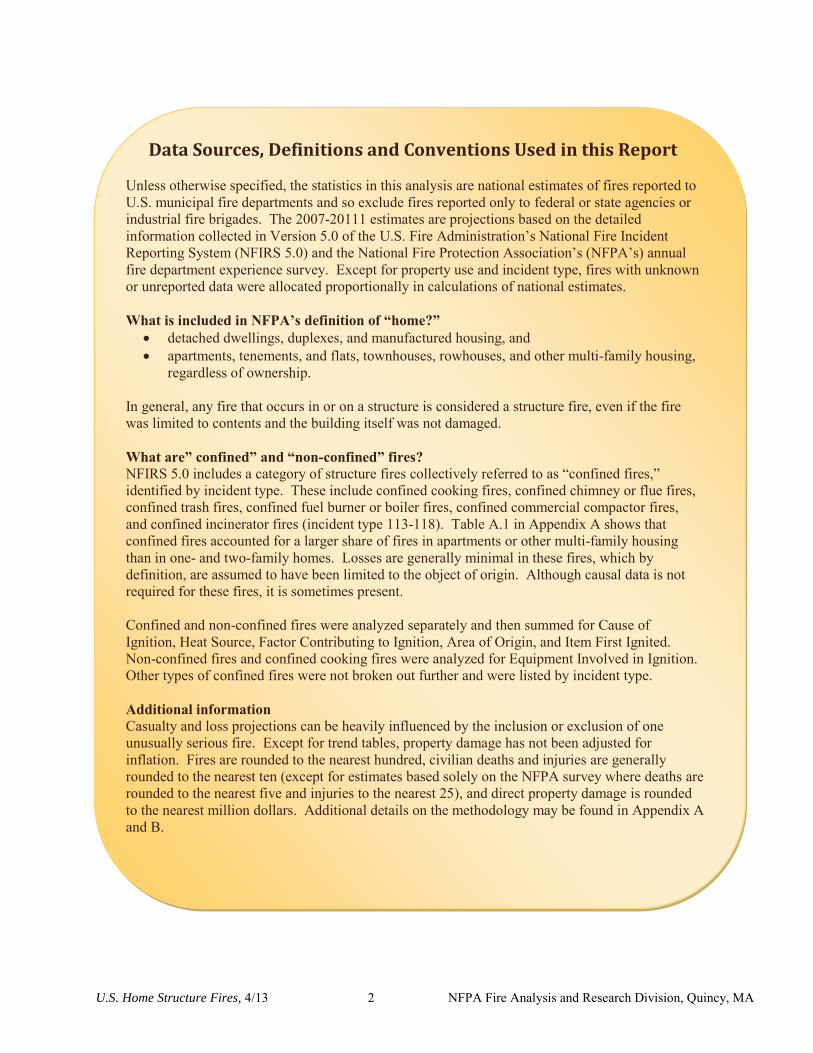
Data Sources, Definitions and Conventions Used in this Report
Unless otherwise specified, the statistics in this analysis are national estimates of fires reported to U.S. municipal fire departments and so exclude fires reported only to federal or state agencies or industrial fire brigades. The 2007-20111 estimates are projections based on the detailed information collected in Version 5.0 of the U.S. Fire Administration’s National Fire Incident Reporting System (NFIRS 5.0) and the National Fire Protection Association’s (NFPA’s) annual fire department experience survey. Except for property use and incident type, fires with unknown or unreported data were allocated proportionally in calculations of national estimates. What is included in NFPA’s definition of “home?”
detached dwellings, duplexes, and manufactured housing, and apartments, tenements, and flats, townhouses, rowhouses, and other multi-family housing,
regardless of ownership. In general, any fire that occurs in or on a structure is considered a structure fire, even if the fire was limited to contents and the building itself was not damaged. What are” confined” and “non-confined” fires? NFIRS 5.0 includes a category of structure fires collectively referred to as “confined fires,” identified by incident type. These include confined cooking fires, confined chimney or flue fires, confined trash fires, confined fuel burner or boiler fires, confined commercial compactor fires, and confined incinerator fires (incident type 113-118). Table A.1 in Appendix A shows that confined fires accounted for a larger share of fires in apartments or other multi-family housing than in one- and two-family homes. Losses are generally minimal in these fires, which by definition, are assumed to have been limited to the object of origin. Although causal data is not required for these fires, it is sometimes present. Confined and non-confined fires were analyzed separately and then summed for Cause of Ignition, Heat Source, Factor Contributing to Ignition, Area of Origin, and Item First Ignited. Non-confined fires and confined cooking fires were analyzed for Equipment Involved in Ignition. Other types of confined fires were not broken out further and were listed by incident type. Additional information Casualty and loss projections can be heavily influenced by the inclusion or exclusion of one unusually serious fire. Except for trend tables, property damage has not been adjusted for inflation. Fires are rounded to the nearest hundred, civilian deaths and injuries are generally rounded to the nearest ten (except for estimates based solely on the NFPA survey where deaths are rounded to the nearest five and injuries to the nearest 25), and direct property damage is rounded to the nearest million dollars. Additional details on the methodology may be found in Appendix A and B.
U.S. Home Structure Fires, 4/13 3 NFPA Fire Analysis and Research Division, Quincy, MA
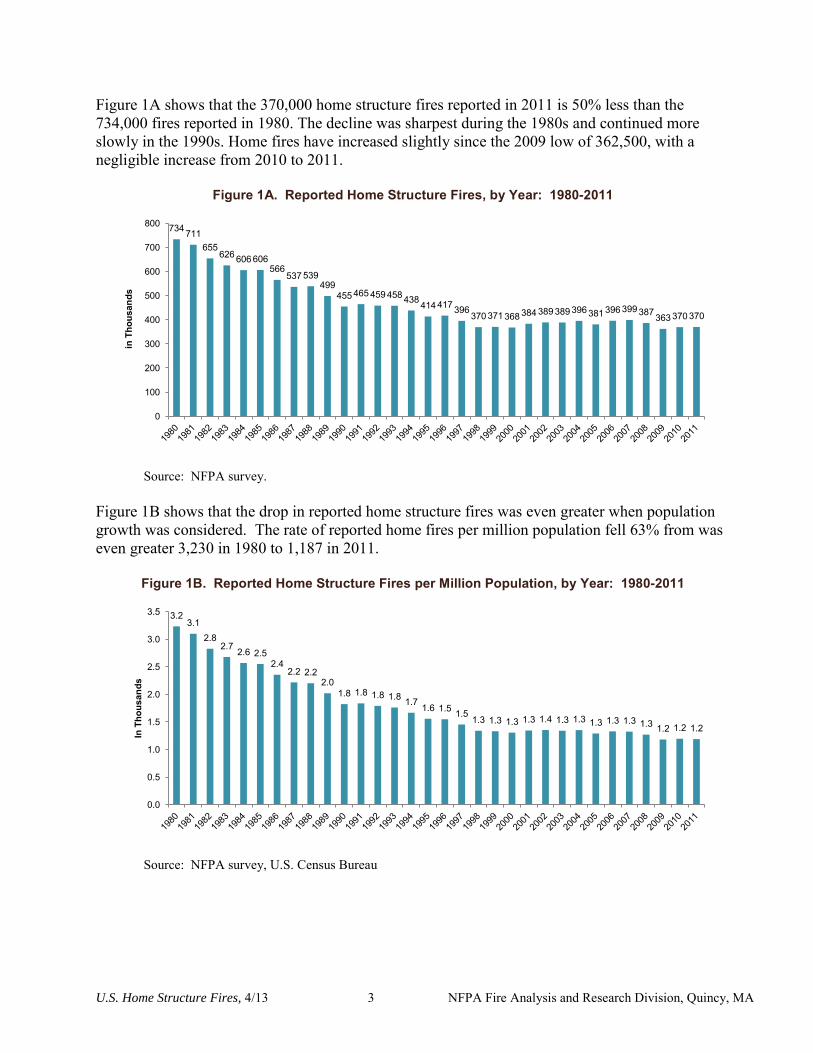
Figure 1A shows that the 370,000 home structure fires reported in 2011 is 50% less than the 734,000 fires reported in 1980. The decline was sharpest during the 1980s and continued more slowly in the 1990s. Home fires have increased slightly since the 2009 low of 362,500, with a negligible increase from 2010 to 2011.
Figure 1A. Reported Home Structure Fires, by Year: 1980-2011
Source: NFPA survey.
Figure 1B shows that the drop in reported home structure fires was even greater when population growth was considered. The rate of reported home fires per million population fell 63% from was even greater 3,230 in 1980 to 1,187 in 2011.
Figure 1B. Reported Home Structure Fires per Million Population, by Year: 1980-2011
Source: NFPA survey, U.S. Census Bureau
734 711 655
626 606 606 566
537 539 499
455 465 459 458 438 414 417 396 370 371 368 384 389 389 396 381 396 399 387 363 370 370
0
100
200
300
400
500
600
700
800
in T
hous
ands
3.2 3.1
2.8 2.7 2.6 2.5
2.4 2.2 2.2
2.0 1.8 1.8 1.8 1.8 1.7 1.6 1.5 1.5 1.3 1.3 1.3 1.3 1.4 1.3 1.3 1.3 1.3 1.3 1.3 1.2 1.2 1.2
0.0
0.5
1.0
1.5
2.0
2.5
3.0
3.5
In T
hous
ands
U.S. Home Structure Fires, 4/13 4 NFPA Fire Analysis and Research Division, Quincy, MA
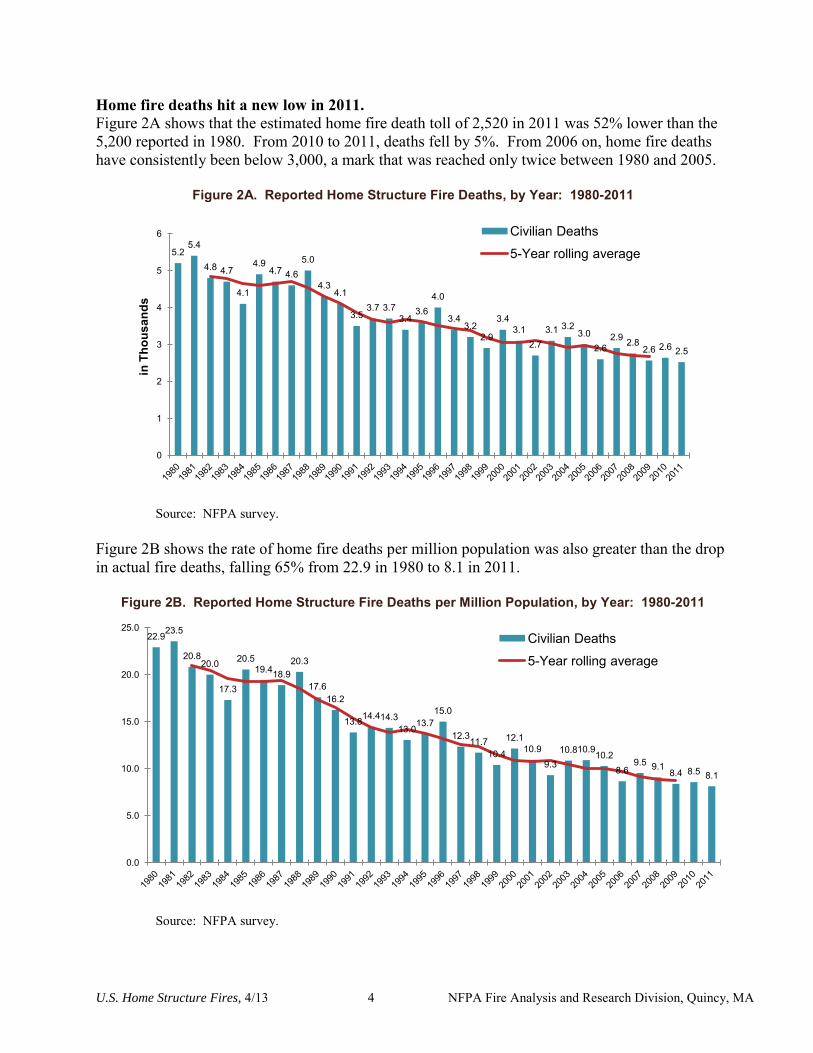
Home fire deaths hit a new low in 2011. Figure 2A shows that the estimated home fire death toll of 2,520 in 2011 was 52% lower than the 5,200 reported in 1980. From 2010 to 2011, deaths fell by 5%. From 2006 on, home fire deaths have consistently been below 3,000, a mark that was reached only twice between 1980 and 2005.
Figure 2A. Reported Home Structure Fire Deaths, by Year: 1980-2011
Source: NFPA survey.
Figure 2B shows the rate of home fire deaths per million population was also greater than the drop in actual fire deaths, falling 65% from 22.9 in 1980 to 8.1 in 2011.
Figure 2B. Reported Home Structure Fire Deaths per Million Population, by Year: 1980-2011
Source: NFPA survey.
5.2 5.4
4.8 4.7
4.1
4.9 4.7 4.6
5.0
4.3 4.1
3.5 3.7 3.7
3.4 3.6
4.0
3.4 3.2
2.9
3.4 3.1
2.7 3.1 3.2
3.0 2.6
2.9 2.8 2.6 2.6 2.5
0
1
2
3
4
5
6
in T
hous
ands
Civilian Deaths
5-Year rolling average
22.9 23.5
20.8 20.0
17.3
20.5 19.4 18.9
20.3
17.6 16.2
13.8 14.4 14.3 13.0 13.7
15.0
12.3 11.7 10.4
12.1 10.9
9.3 10.8 10.9 10.2
8.6 9.5 9.1
8.4 8.5 8.1
0.0
5.0
10.0
15.0
20.0
25.0 Civilian Deaths
5-Year rolling average
U.S. Home Structure Fires, 4/13 5 NFPA Fire Analysis and Research Division, Quincy, MA
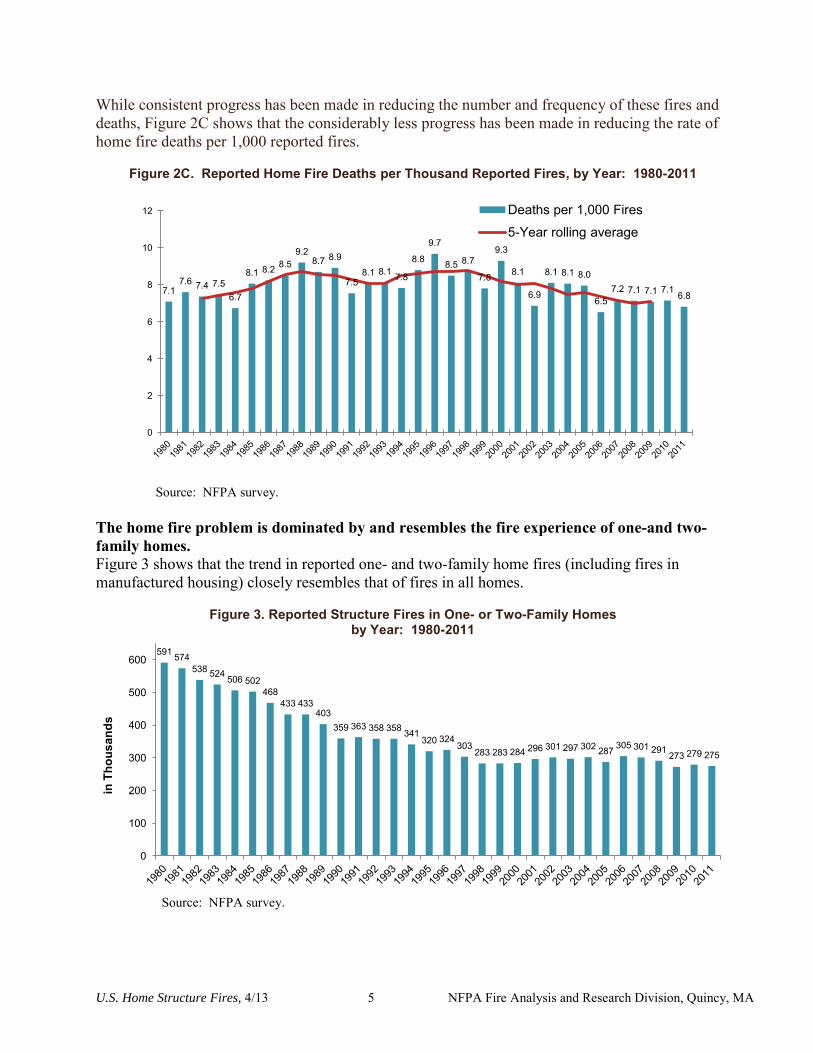
While consistent progress has been made in reducing the number and frequency of these fires and deaths, Figure 2C shows that the considerably less progress has been made in reducing the rate of home fire deaths per 1,000 reported fires.
Figure 2C. Reported Home Fire Deaths per Thousand Reported Fires, by Year: 1980-2011
Source: NFPA survey.
The home fire problem is dominated by and resembles the fire experience of one-and two-family homes. Figure 3 shows that the trend in reported one- and two-family home fires (including fires in manufactured housing) closely resembles that of fires in all homes.
Figure 3. Reported Structure Fires in One- or Two-Family Homes
by Year: 1980-2011
Source: NFPA survey.
7.1 7.6 7.4 7.5
6.7
8.1 8.2 8.5 9.2
8.7 8.9
7.5 8.1 8.1 7.8
8.8
9.7
8.5 8.7
7.8
9.3
8.1
6.9
8.1 8.1 8.0
6.5 7.2 7.1 7.1 7.1 6.8
0
2
4
6
8
10
12 Deaths per 1,000 Fires
5-Year rolling average
591 574 538 524 506 502
468 433 433
403 359 363 358 358 341
320 324 303
283 283 284 296 301 297 302 287 305 301 291 273 279 275
0
100
200
300
400
500
600
in T
hous
ands
U.S. Home Structure Fires, 4/13 6 NFPA Fire Analysis and Research Division, Quincy, MA
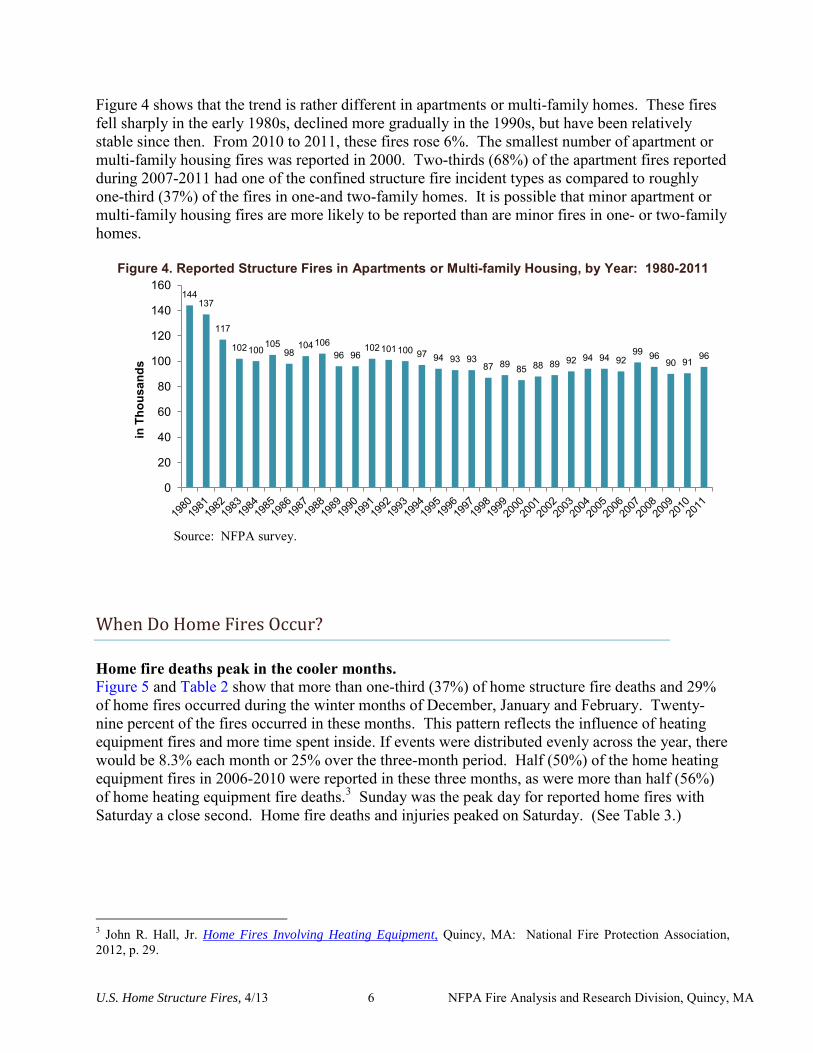
Figure 4 shows that the trend is rather different in apartments or multi-family homes. These fires fell sharply in the early 1980s, declined more gradually in the 1990s, but have been relatively stable since then. From 2010 to 2011, these fires rose 6%. The smallest number of apartment or multi-family housing fires was reported in 2000. Two-thirds (68%) of the apartment fires reported during 2007-2011 had one of the confined structure fire incident types as compared to roughly one-third (37%) of the fires in one-and two-family homes. It is possible that minor apartment or multi-family housing fires are more likely to be reported than are minor fires in one- or two-family homes.
Figure 4. Reported Structure Fires in Apartments or Multi-family Housing, by Year: 1980-2011
Source: NFPA survey.
When Do Home Fires Occur?
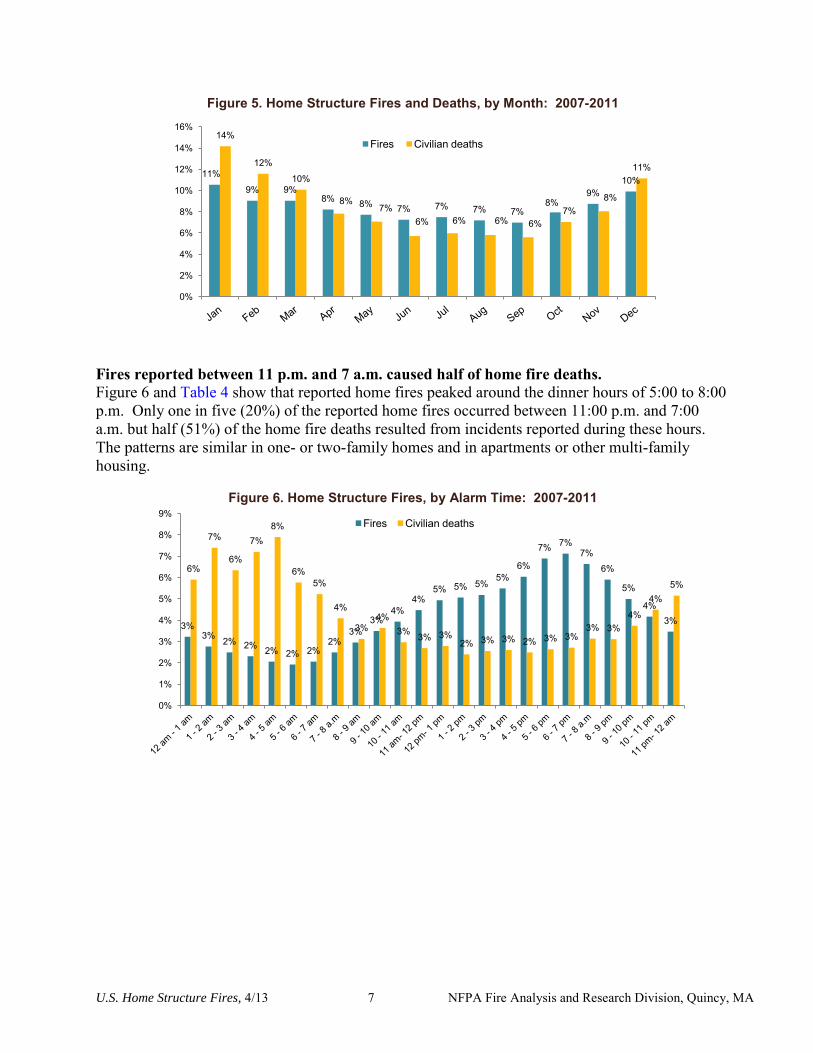
Home fire deaths peak in the cooler months. Figure 5 and Table 2 show that more than one-third (37%) of home structure fire deaths and 29% of home fires occurred during the winter months of December, January and February. Twenty-nine percent of the fires occurred in these months. This pattern reflects the influence of heating equipment fires and more time spent inside. If events were distributed evenly across the year, there would be 8.3% each month or 25% over the three-month period. Half (50%) of the home heating equipment fires in 2006-2010 were reported in these three months, as were more than half (56%) of home heating equipment fire deaths.3 Sunday was the peak day for reported home fires with Saturday a close second. Home fire deaths and injuries peaked on Saturday. (See Table 3.)
3 John R. Hall, Jr. Home Fires Involving Heating Equipment, Quincy, MA: National Fire Protection Association, 2012, p. 29.
144 137
117
102 100 105
98 104 106
96 96 102 101 100 97 94 93 93
87 89 85 88 89 92 94 94 92 99 96
90 91 96
0
20
40
60
80
100
120
140
160
in T
hous
ands
U.S. Home Structure Fires, 4/13 7 NFPA Fire Analysis and Research Division, Quincy, MA
Figure 5. Home Structure Fires and Deaths, by Month: 2007-2011
Fires reported between 11 p.m. and 7 a.m. caused half of home fire deaths. Figure 6 and Table 4 show that reported home fires peaked around the dinner hours of 5:00 to 8:00 p.m. Only one in five (20%) of the reported home fires occurred between 11:00 p.m. and 7:00 a.m. but half (51%) of the home fire deaths resulted from incidents reported during these hours. The patterns are similar in one- or two-family homes and in apartments or other multi-family housing.
Figure 6. Home Structure Fires, by Alarm Time: 2007-2011
11%
9% 9% 8% 8% 7% 7% 7% 7%
8% 9%
10%
14%
12%
10%
8% 7%
6% 6% 6% 6% 7%
8%
11%
0%
2%
4%
6%
8%
10%
12%
14%
16%
Fires Civilian deaths
3% 3% 2% 2% 2% 2% 2%
2% 3%
3% 4%
4% 5% 5% 5%
5% 6%
7% 7% 7%
6%
5%
4% 3%
6%
7%
6%
7% 8%
6% 5%
4%
3% 4%
3% 3% 3% 2% 3% 3% 2% 3% 3%
3% 3% 4%
4% 5%
0%
1%
2%
3%
4%
5%
6%
7%
8%
9% Fires Civilian deaths
U.S. Home Structure Fires, 4/13 8 NFPA Fire Analysis and Research Division, Quincy, MA
Ages of Victims
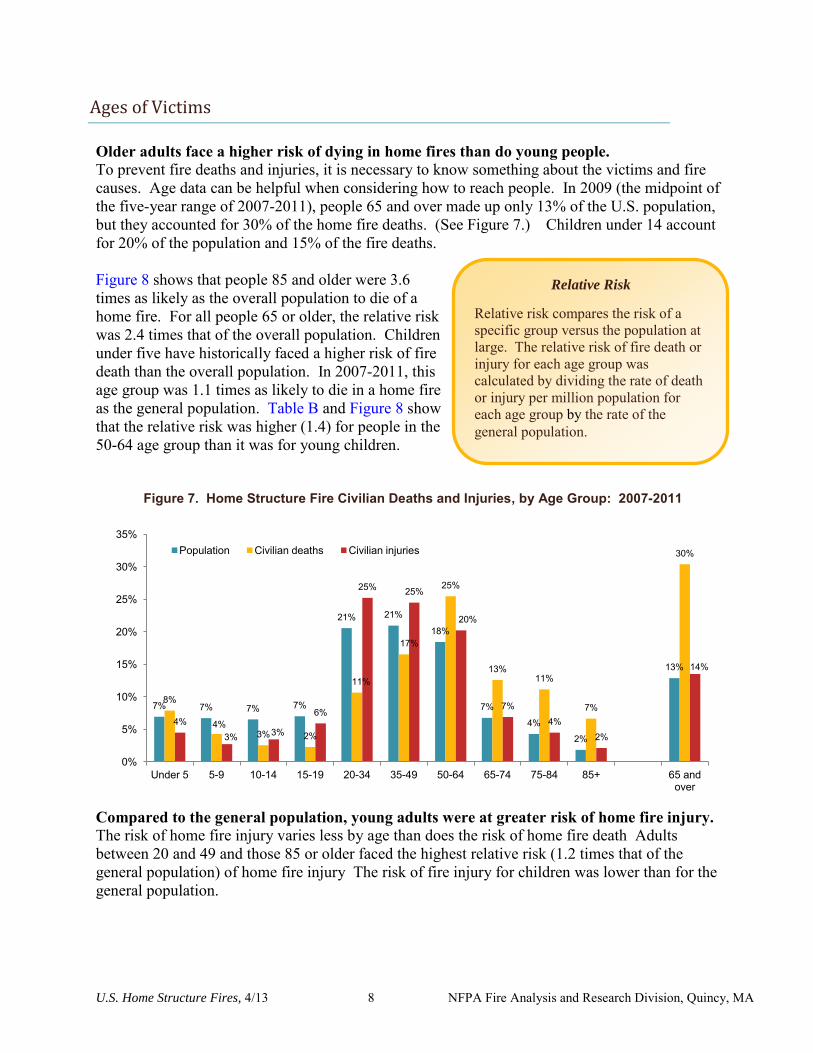
Older adults face a higher risk of dying in home fires than do young people. To prevent fire deaths and injuries, it is necessary to know something about the victims and fire causes. Age data can be helpful when considering how to reach people. In 2009 (the midpoint of the five-year range of 2007-2011), people 65 and over made up only 13% of the U.S. population, but they accounted for 30% of the home fire deaths. (See Figure 7.) Children under 14 account for 20% of the population and 15% of the fire deaths. Figure 8 shows that people 85 and older were 3.6 times as likely as the overall population to die of a home fire. For all people 65 or older, the relative risk was 2.4 times that of the overall population. Children under five have historically faced a higher risk of fire death than the overall population. In 2007-2011, this age group was 1.1 times as likely to die in a home fire as the general population. Table B and Figure 8 show that the relative risk was higher (1.4) for people in the 50-64 age group than it was for young children.
Figure 7. Home Structure Fire Civilian Deaths and Injuries, by Age Group: 2007-2011
Compared to the general population, young adults were at greater risk of home fire injury. The risk of home fire injury varies less by age than does the risk of home fire death Adults between 20 and 49 and those 85 or older faced the highest relative risk (1.2 times that of the general population) of home fire injury The risk of fire injury for children was lower than for the general population.
7% 7% 7% 7%
21% 21%
18%
7%
4%
2%
13%
8%
4% 3% 2%
11%
17%
25%
13% 11%
7%
30%
4% 3% 3%
6%
25% 25%
20%
7%
4% 2%
14%
0%
5%
10%
15%
20%
25%
30%
35%
Under 5 5-9 10-14 15-19 20-34 35-49 50-64 65-74 75-84 85+ 65 and over
Population Civilian deaths Civilian injuries
Relative Risk Relative risk compares the risk of a specific group versus the population at large. The relative risk of fire death or injury for each age group was calculated by dividing the rate of death or injury per million population for each age group by the rate of the general population.
U.S. Home Structure Fires, 4/13 9 NFPA Fire Analysis and Research Division, Quincy, MA
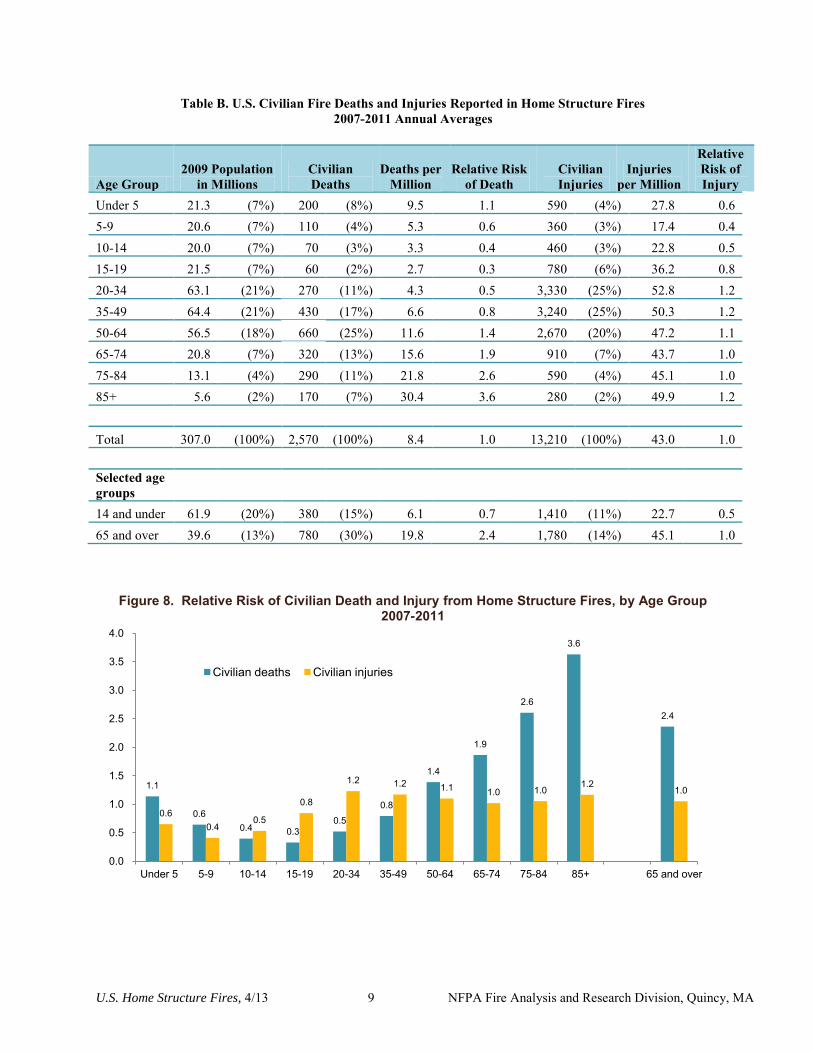
Table B. U.S. Civilian Fire Deaths and Injuries Reported in Home Structure Fires 2007-2011 Annual Averages
Age Group 2009 Population
in Millions Civilian Deaths
Deaths per Million
Relative Risk of Death
Civilian Injuries
Injuries per Million
Relative Risk of Injury
Under 5 21.3 (7%) 200 (8%) 9.5 1.1 590 (4%) 27.8 0.6 5-9 20.6 (7%) 110 (4%) 5.3 0.6 360 (3%) 17.4 0.4 10-14 20.0 (7%) 70 (3%) 3.3 0.4 460 (3%) 22.8 0.5 15-19 21.5 (7%) 60 (2%) 2.7 0.3 780 (6%) 36.2 0.8 20-34 63.1 (21%) 270 (11%) 4.3 0.5 3,330 (25%) 52.8 1.2 35-49 64.4 (21%) 430 (17%) 6.6 0.8 3,240 (25%) 50.3 1.2 50-64 56.5 (18%) 660 (25%) 11.6 1.4 2,670 (20%) 47.2 1.1 65-74 20.8 (7%) 320 (13%) 15.6 1.9 910 (7%) 43.7 1.0 75-84 13.1 (4%) 290 (11%) 21.8 2.6 590 (4%) 45.1 1.0 85+ 5.6 (2%) 170 (7%) 30.4 3.6 280 (2%) 49.9 1.2
Total 307.0 (100%) 2,570 (100%) 8.4 1.0 13,210 (100%) 43.0 1.0
Selected age groups
14 and under 61.9 (20%) 380 (15%) 6.1 0.7 1,410 (11%) 22.7 0.5 65 and over 39.6 (13%) 780 (30%) 19.8 2.4 1,780 (14%) 45.1 1.0
Figure 8. Relative Risk of Civilian Death and Injury from Home Structure Fires, by Age Group 2007-2011
1.1
0.6 0.4 0.3
0.5
0.8
1.4
1.9
2.6
3.6
2.4
0.6 0.4
0.5
0.8
1.2 1.2 1.1 1.0 1.0 1.2
1.0
0.0
0.5
1.0
1.5
2.0
2.5
3.0
3.5
4.0
Under 5 5-9 10-14 15-19 20-34 35-49 50-64 65-74 75-84 85+ 65 and over
Civilian deaths Civilian injuries
U.S. Home Structure Fires, 4/13 10 NFPA Fire Analysis and Research Division, Quincy, MA
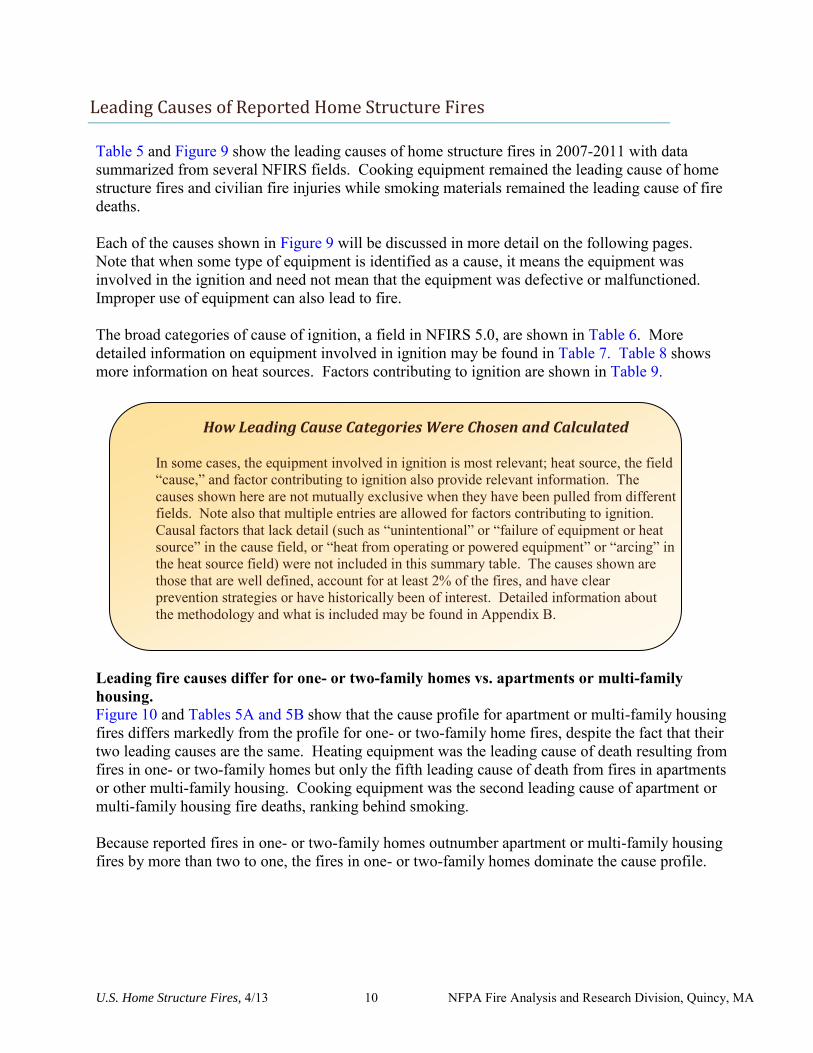
Leading Causes of Reported Home Structure Fires
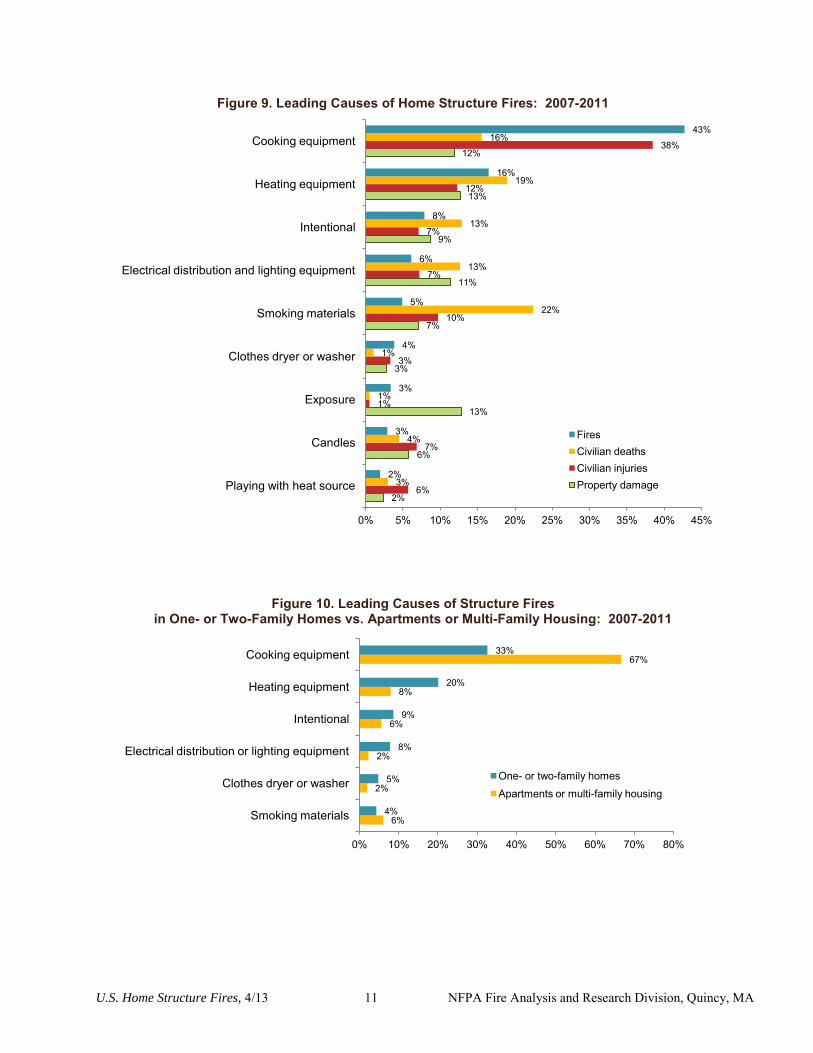
Table 5 and Figure 9 show the leading causes of home structure fires in 2007-2011 with data summarized from several NFIRS fields. Cooking equipment remained the leading cause of home structure fires and civilian fire injuries while smoking materials remained the leading cause of fire deaths. Each of the causes shown in Figure 9 will be discussed in more detail on the following pages. Note that when some type of equipment is identified as a cause, it means the equipment was involved in the ignition and need not mean that the equipment was defective or malfunctioned. Improper use of equipment can also lead to fire. The broad categories of cause of ignition, a field in NFIRS 5.0, are shown in Table 6. More detailed information on equipment involved in ignition may be found in Table 7. Table 8 shows more information on heat sources. Factors contributing to ignition are shown in Table 9.
How Leading Cause Categories Were Chosen and Calculated In some cases, the equipment involved in ignition is most relevant; heat source, the field “cause,” and factor contributing to ignition also provide relevant information. The causes shown here are not mutually exclusive when they have been pulled from different fields. Note also that multiple entries are allowed for factors contributing to ignition. Causal factors that lack detail (such as “unintentional” or “failure of equipment or heat source” in the cause field, or “heat from operating or powered equipment” or “arcing” in the heat source field) were not included in this summary table. The causes shown are those that are well defined, account for at least 2% of the fires, and have clear prevention strategies or have historically been of interest. Detailed information about the methodology and what is included may be found in Appendix B.
Leading fire causes differ for one- or two-family homes vs. apartments or multi-family housing. Figure 10 and Tables 5A and 5B show that the cause profile for apartment or multi-family housing fires differs markedly from the profile for one- or two-family home fires, despite the fact that their two leading causes are the same. Heating equipment was the leading cause of death resulting from fires in one- or two-family homes but only the fifth leading cause of death from fires in apartments or other multi-family housing. Cooking equipment was the second leading cause of apartment or multi-family housing fire deaths, ranking behind smoking. Because reported fires in one- or two-family homes outnumber apartment or multi-family housing fires by more than two to one, the fires in one- or two-family homes dominate the cause profile.
U.S. Home Structure Fires, 4/13 11 NFPA Fire Analysis and Research Division, Quincy, MA
Figure 9. Leading Causes of Home Structure Fires: 2007-2011
Figure 10. Leading Causes of Structure Fires in One- or Two-Family Homes vs. Apartments or Multi-Family Housing: 2007-2011
2%
6%
13%
3%
7%
11%
9%
13%
12%
6%
7%
1%
3%
10%
7%
7%
12%
38%
3%
4%
1%
1%
22%
13%
13%
19%
16%
2%
3%
3%
4%
5%
6%
8%
16%
43%
0% 5% 10% 15% 20% 25% 30% 35% 40% 45%
Playing with heat source
Candles
Exposure
Clothes dryer or washer
Smoking materials
Electrical distribution and lighting equipment
Intentional
Heating equipment
Cooking equipment
Fires Civilian deaths Civilian injuries Property damage
6%
2%
2%
6%
8%
67%
4%
5%
8%
9%
20%
33%
0% 10% 20% 30% 40% 50% 60% 70% 80%
Smoking materials
Clothes dryer or washer
Electrical distribution or lighting equipment
Intentional
Heating equipment
Cooking equipment
One- or two-family homes
Apartments or multi-family housing
U.S. Home Structure Fires, 4/13 12 NFPA Fire Analysis and Research Division, Quincy, MA
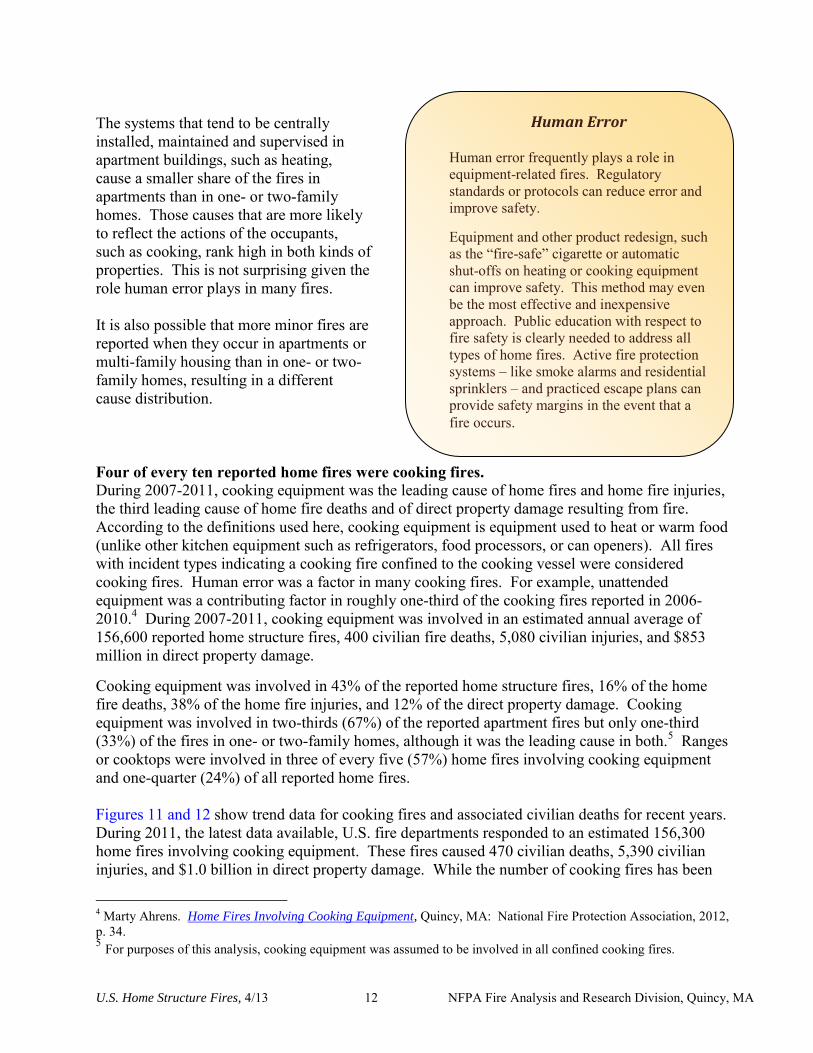
The systems that tend to be centrally installed, maintained and supervised in apartment buildings, such as heating, cause a smaller share of the fires in apartments than in one- or two-family homes. Those causes that are more likely to reflect the actions of the occupants, such as cooking, rank high in both kinds of properties. This is not surprising given the role human error plays in many fires. It is also possible that more minor fires are reported when they occur in apartments or multi-family housing than in one- or two-family homes, resulting in a different cause distribution. Four of every ten reported home fires were cooking fires. During 2007-2011, cooking equipment was the leading cause of home fires and home fire injuries, the third leading cause of home fire deaths and of direct property damage resulting from fire. According to the definitions used here, cooking equipment is equipment used to heat or warm food (unlike other kitchen equipment such as refrigerators, food processors, or can openers). All fires with incident types indicating a cooking fire confined to the cooking vessel were considered cooking fires. Human error was a factor in many cooking fires. For example, unattended equipment was a contributing factor in roughly one-third of the cooking fires reported in 2006-2010.4 During 2007-2011, cooking equipment was involved in an estimated annual average of 156,600 reported home structure fires, 400 civilian fire deaths, 5,080 civilian injuries, and $853 million in direct property damage. Cooking equipment was involved in 43% of the reported home structure fires, 16% of the home fire deaths, 38% of the home fire injuries, and 12% of the direct property damage. Cooking equipment was involved in two-thirds (67%) of the reported apartment fires but only one-third (33%) of the fires in one- or two-family homes, although it was the leading cause in both.5 Ranges or cooktops were involved in three of every five (57%) home fires involving cooking equipment and one-quarter (24%) of all reported home fires. Figures 11 and 12 show trend data for cooking fires and associated civilian deaths for recent years. During 2011, the latest data available, U.S. fire departments responded to an estimated 156,300 home fires involving cooking equipment. These fires caused 470 civilian deaths, 5,390 civilian injuries, and $1.0 billion in direct property damage. While the number of cooking fires has been
4 Marty Ahrens. Home Fires Involving Cooking Equipment, Quincy, MA: National Fire Protection Association, 2012, p. 34. 5 For purposes of this analysis, cooking equipment was assumed to be involved in all confined cooking fires.
Human Error Human error frequently plays a role in equipment-related fires. Regulatory standards or protocols can reduce error and improve safety. Equipment and other product redesign, such as the “fire-safe” cigarette or automatic shut-offs on heating or cooking equipment can improve safety. This method may even be the most effective and inexpensive approach. Public education with respect to fire safety is clearly needed to address all types of home fires. Active fire protection systems – like smoke alarms and residential sprinklers – and practiced escape plans can provide safety margins in the event that a fire occurs.
U.S. Home Structure Fires, 4/13 13 NFPA Fire Analysis and Research Division, Quincy, MA
fairly consistent, fire death estimates were more volatile. Cooking ranked second among causes of fire deaths in 2011, ahead of heating equipment. Although it is too soon to know if this will be a trend, it does bear watching. Figure 11. Home Cooking Fires, by Year
Figure 12. Home Cooking Fire Deaths, by Year
The 2004-2005 CPSC’s Residential Fire Survey asked about all fires, including incidents that were not attended by the fire service.6 The authors estimated that U.S. households experienced a total of 7.4 million fires per year, including 7.2 million that were not attended by the fire service. Cooking appliances were involved in 4.8 million home fires, including 4.7 million incidents that the fire department did not attend. One of every 22 occupied households had a cooking fire. The survey found that cooking equipment was involved in roughly two-thirds of home fire incidents, including 64% of the total and 65% of fires that the fire department did not attend. The overwhelming majority of cooking equipment fires (50 to one) did not have the fire department in attendance. The results closely mirror our own finding that cooking equipment was involved in two-thirds of reported apartment fires. Additional information about reported home cooking fires may be found in NFPA’s report, Home Fires Involving Cooking Equipment, by Marty Ahrens. Working together, the U.S. Fire Administration and NFPA produced a 2006 study, Behavioral Mitigation of Cooking Fires. This study includes a more comprehensive literature review about cooking fires, cooking fire safety, and non-fire cooking burns. An educational PowerPoint presentation and several short videos are available at nfpa.org/cooking. Heating equipment was involved in one of every five home fire deaths. Heating equipment is considered the cause of a fire when the equipment provided the heat to start the fire, even if the equipment itself was working properly. Home heating equipment includes central heating units, portable and stationary space heaters, fireplaces, chimneys, and heat transfer systems, as well as some devices not used to heat living spaces, most notably hot water heaters. During 2007-2011, heating equipment was involved in the ignition of an estimated annual average of 60,400 reported home structure fires that resulted in an average of 490 civilian fire deaths, 1,620 civilian injuries, and $913 million in direct property damage per year.
6 Michael A. Greene and Craig Andres. 2004-2005 National Sample Survey of Unreported Residential Fires. U.S. Consumer Product Safety Commission, July 2009, pp. 102, 127-133. Online at http://www.cpsc.gov/library/foia/foia09/os/UnreportedResidentialFires.pdf .
151 147 160 158 158 154 156 156
0
50
100
150
200
2004 2005 2006 2007 2008 2009 2010 2011
In T
hous
ands
620
500
360 420 400
300
420 470
0
150
300
450
600
750
2004 2005 2006 2007 2008 2009 2010 2011
U.S. Home Structure Fires, 4/13 14 NFPA Fire Analysis and Research Division, Quincy, MA
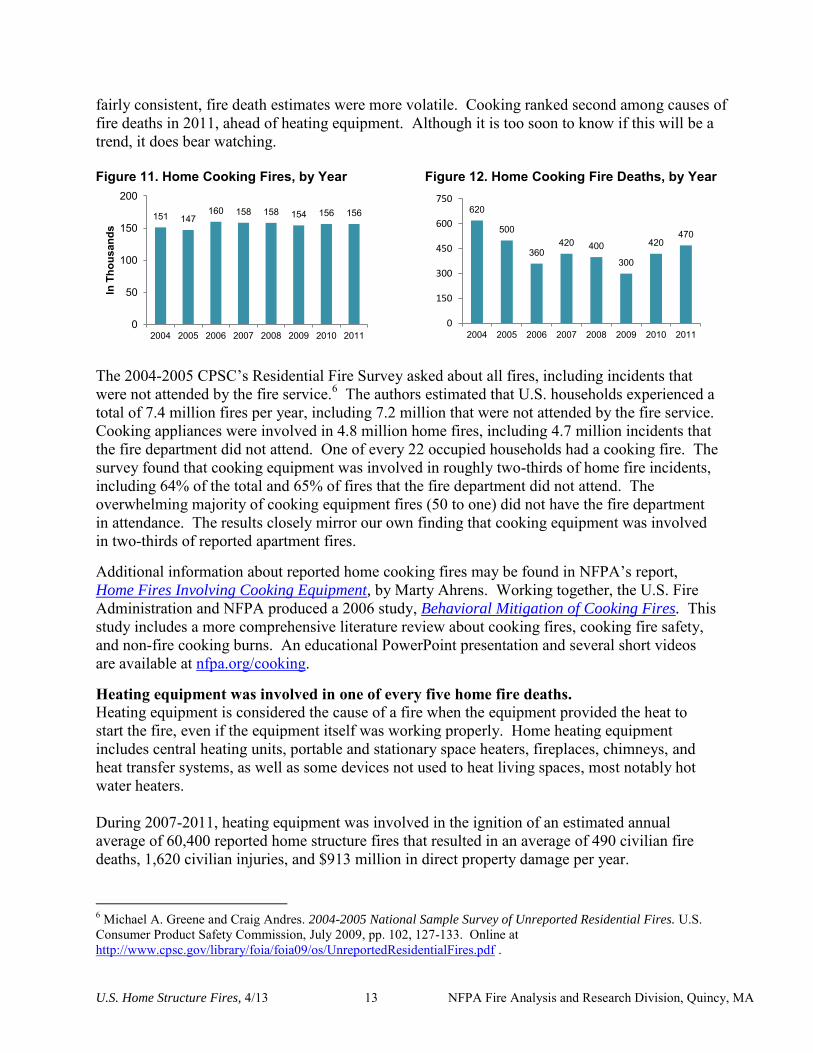
Heating equipment was involved in 16% of the reported home structure fires, 19% of the home fire deaths, 12% of the home fire injuries, and 13% of the direct property damage. Overall, heating equipment ranked second in all four loss measures. Space heaters, including portable heaters and those that are permanently installed, were involved in four of every five home heating fire deaths and in 15% of overall home fire deaths. Heating equipment was involved in 20% of the fires in one- or two-family homes but only 8% of the apartment fires. Almost one-quarter (22%) of the fatal fire injuries occurring in one- or two-family homes resulted from fires involving heating equipment compared to only 7% of the apartment or multi-family home fire deaths. For purposes of this analysis, all confined chimney or flue fires and confined fuel burner or boiler fires are considered heating equipment fires. Figure 13 shows that home heating fires hit consecutive new lows from 2009 through 2011. Deaths have also been on a downward trend. Heating equipment was involved in an estimated 53,600 reported home fires in 2011, resulting in 400 civilian fire deaths, 1,540 civilian fire injuries, and $893 million in direct property damage. In 2011, fewer people died as a result of heating fires than of cooking fires, reversing the usual pattern. Figure 13. Home Heating Fires, by Year
Figure 14. Home Heating Fire Deaths, by Year
Additional information about specific types of home heating equipment may be found in NFPA’s report, Home Fires Involving Heating Equipment, by John R. Hall, Jr. His analysis also provides more details on the equipment involved in the confined heating equipment fires. Additional safety information may be found at nfpa.org/heating. Smoking materials caused 22% of home fire deaths in 2007-2011. Smoking materials have historically been the leading cause of home fire deaths. The pattern held true in this analysis. During 2007-2011, smoking materials were the heat source in an annual average of 17,900 reported home structure fires, 580 civilian fire deaths, 1,280 civilian fire injuries, and $509 million in direct property damage.7
7 A proportional share of fires with heat sources from unclassified open flame or smoking materials are included in the candle and smoking material estimates.
70 65 64 66 66
59 57 54
0
20
40
60
80
2004 2005 2006 2007 2008 2009 2010 2011
In T
ho
usa
nd
s
670 730
540 580
480 480 490 400
0
200
400
600
800
2004 2005 2006 2007 2008 2009 2010 2011
U.S. Home Structure Fires, 4/13 15 NFPA Fire Analysis and Research Division, Quincy, MA
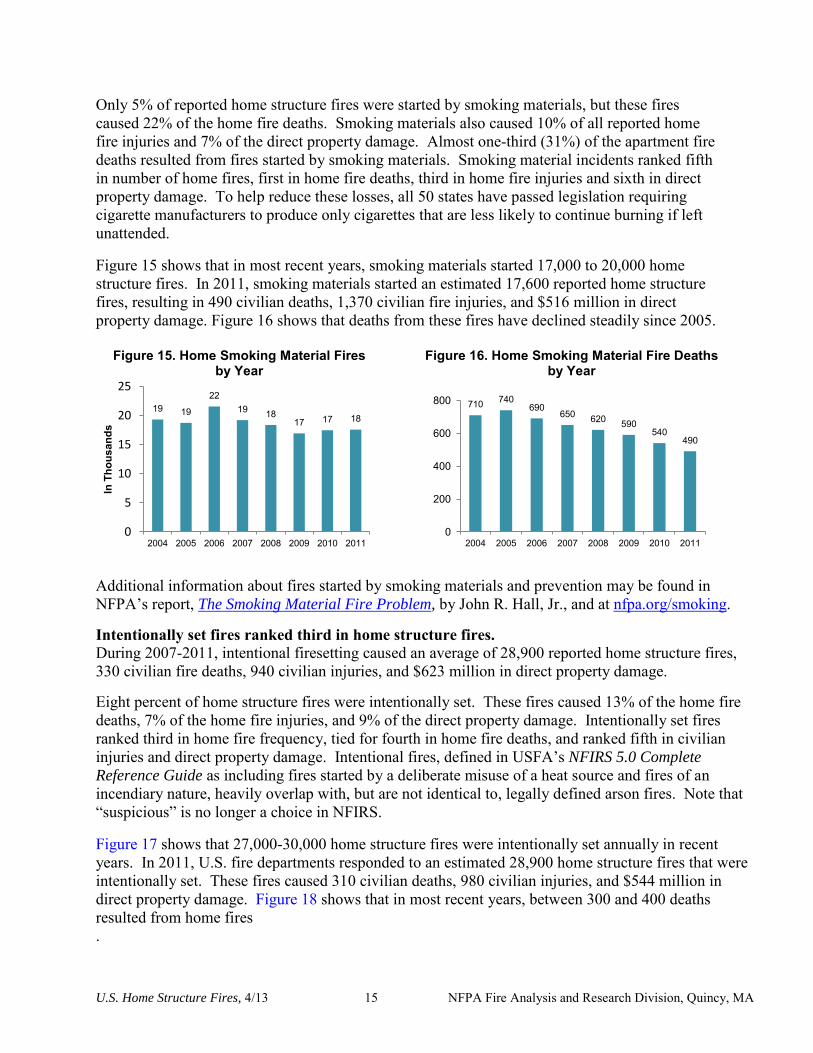
Only 5% of reported home structure fires were started by smoking materials, but these fires caused 22% of the home fire deaths. Smoking materials also caused 10% of all reported home fire injuries and 7% of the direct property damage. Almost one-third (31%) of the apartment fire deaths resulted from fires started by smoking materials. Smoking material incidents ranked fifth in number of home fires, first in home fire deaths, third in home fire injuries and sixth in direct property damage. To help reduce these losses, all 50 states have passed legislation requiring cigarette manufacturers to produce only cigarettes that are less likely to continue burning if left unattended. Figure 15 shows that in most recent years, smoking materials started 17,000 to 20,000 home structure fires. In 2011, smoking materials started an estimated 17,600 reported home structure fires, resulting in 490 civilian deaths, 1,370 civilian fire injuries, and $516 million in direct property damage. Figure 16 shows that deaths from these fires have declined steadily since 2005.
Figure 15. Home Smoking Material Fires by Year
Figure 16. Home Smoking Material Fire Deaths by Year
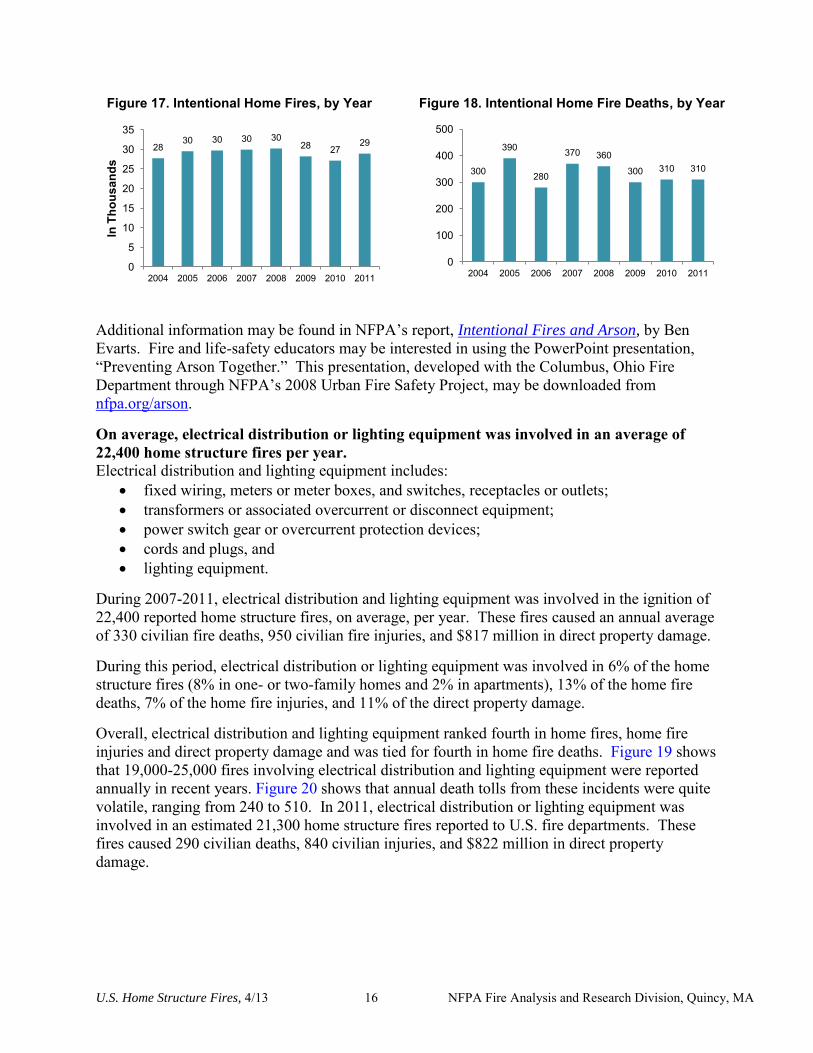
Additional information about fires started by smoking materials and prevention may be found in NFPA’s report, The Smoking Material Fire Problem, by John R. Hall, Jr., and at nfpa.org/smoking. Intentionally set fires ranked third in home structure fires. During 2007-2011, intentional firesetting caused an average of 28,900 reported home structure fires, 330 civilian fire deaths, 940 civilian injuries, and $623 million in direct property damage. Eight percent of home structure fires were intentionally set. These fires caused 13% of the home fire deaths, 7% of the home fire injuries, and 9% of the direct property damage. Intentionally set fires ranked third in home fire frequency, tied for fourth in home fire deaths, and ranked fifth in civilian injuries and direct property damage. Intentional fires, defined in USFA’s NFIRS 5.0 Complete
Reference Guide as including fires started by a deliberate misuse of a heat source and fires of an incendiary nature, heavily overlap with, but are not identical to, legally defined arson fires. Note that “suspicious” is no longer a choice in NFIRS. Figure 17 shows that 27,000-30,000 home structure fires were intentionally set annually in recent years. In 2011, U.S. fire departments responded to an estimated 28,900 home structure fires that were intentionally set. These fires caused 310 civilian deaths, 980 civilian injuries, and $544 million in direct property damage. Figure 18 shows that in most recent years, between 300 and 400 deaths resulted from home fires .
19 19
22 19 18
17 17 18
0
5
10
15
20
25
2004 2005 2006 2007 2008 2009 2010 2011
In T
hous
ands
710 740 690
650 620 590 540
490
0
200
400
600
800
2004 2005 2006 2007 2008 2009 2010 2011
U.S. Home Structure Fires, 4/13 16 NFPA Fire Analysis and Research Division, Quincy, MA
Figure 17. Intentional Home Fires, by Year
Figure 18. Intentional Home Fire Deaths, by Year
Additional information may be found in NFPA’s report, Intentional Fires and Arson, by Ben Evarts. Fire and life-safety educators may be interested in using the PowerPoint presentation, “Preventing Arson Together.” This presentation, developed with the Columbus, Ohio Fire Department through NFPA’s 2008 Urban Fire Safety Project, may be downloaded from nfpa.org/arson. On average, electrical distribution or lighting equipment was involved in an average of 22,400 home structure fires per year. Electrical distribution and lighting equipment includes:
fixed wiring, meters or meter boxes, and switches, receptacles or outlets; transformers or associated overcurrent or disconnect equipment; power switch gear or overcurrent protection devices; cords and plugs, and lighting equipment.
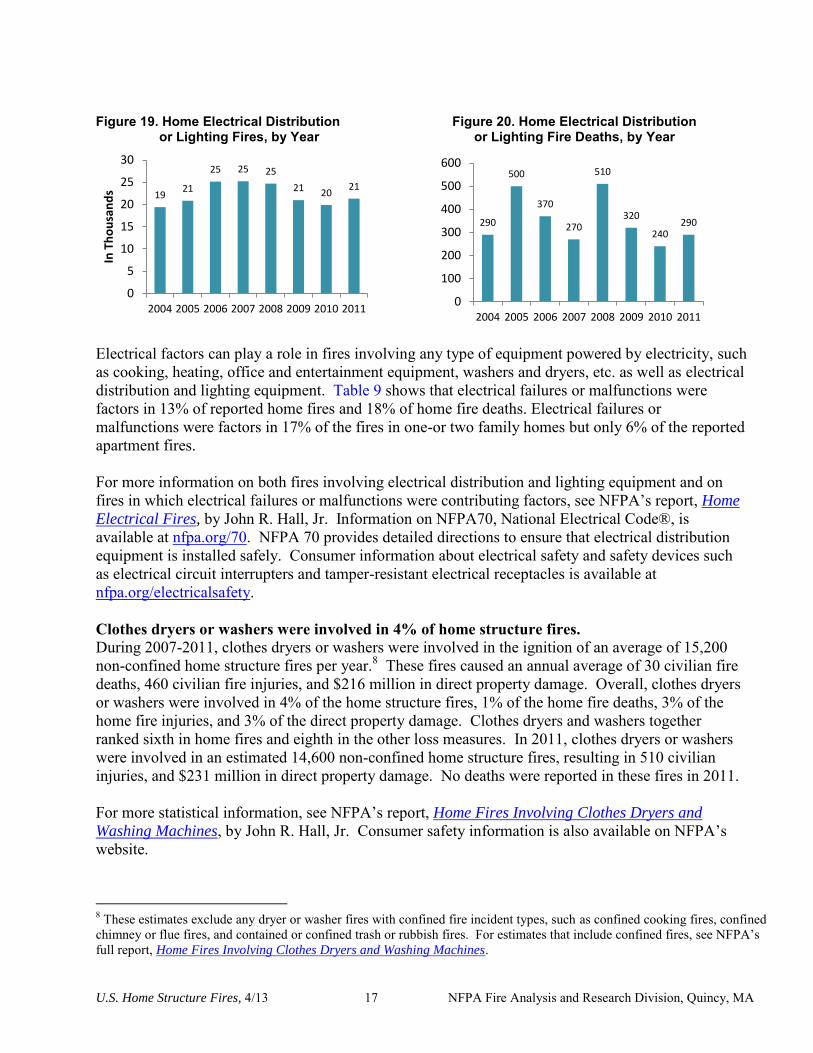
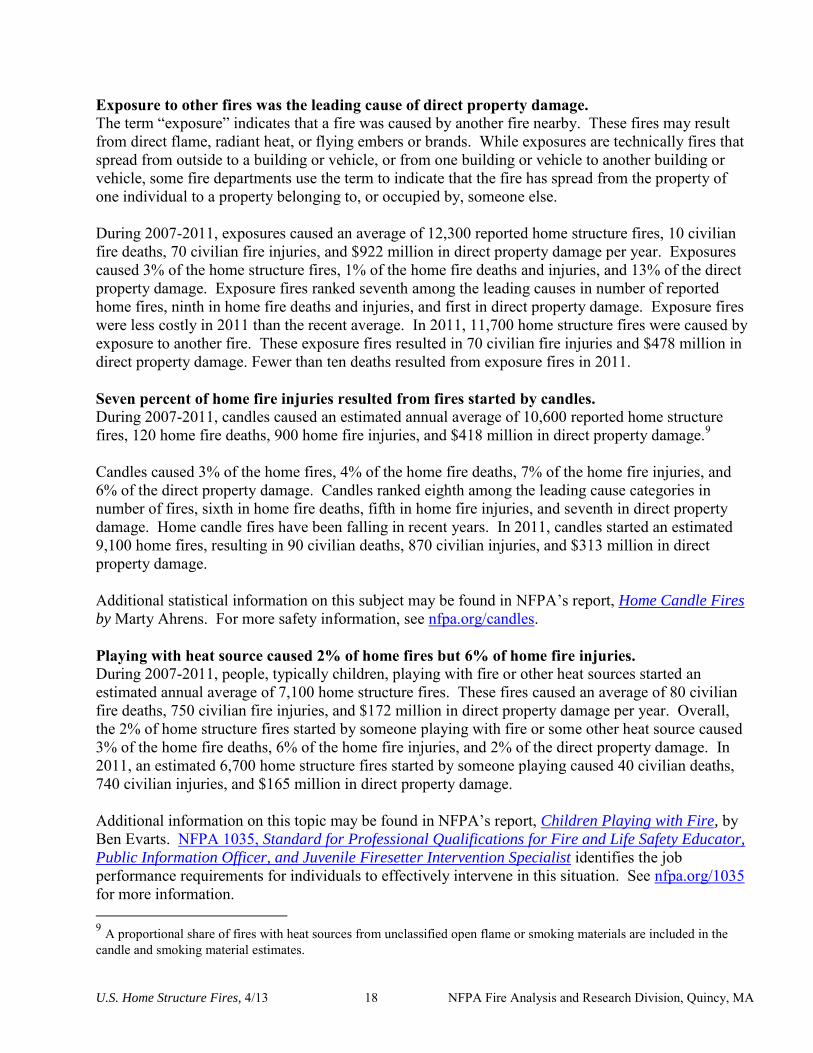
During 2007-2011, electrical distribution and lighting equipment was involved in the ignition of 22,400 reported home structure fires, on average, per year. These fires caused an annual average of 330 civilian fire deaths, 950 civilian fire injuries, and $817 million in direct property damage. During this period, electrical distribution or lighting equipment was involved in 6% of the home structure fires (8% in one- or two-family homes and 2% in apartments), 13% of the home fire deaths, 7% of the home fire injuries, and 11% of the direct property damage. Overall, electrical distribution and lighting equipment ranked fourth in home fires, home fire injuries and direct property damage and was tied for fourth in home fire deaths. Figure 19 shows that 19,000-25,000 fires involving electrical distribution and lighting equipment were reported annually in recent years. Figure 20 shows that annual death tolls from these incidents were quite volatile, ranging from 240 to 510. In 2011, electrical distribution or lighting equipment was involved in an estimated 21,300 home structure fires reported to U.S. fire departments. These fires caused 290 civilian deaths, 840 civilian injuries, and $822 million in direct property damage.
28 30 30 30 30
28 27 29
0
5
10
15
20
25
30
35
2004 2005 2006 2007 2008 2009 2010 2011
In T
hous
ands
300
390
280
370 360
300 310 310
0
100
200
300
400
500
2004 2005 2006 2007 2008 2009 2010 2011
U.S. Home Structure Fires, 4/13 17 NFPA Fire Analysis and Research Division, Quincy, MA
Figure 19. Home Electrical Distribution or Lighting Fires, by Year
Figure 20. Home Electrical Distribution or Lighting Fire Deaths, by Year
Electrical factors can play a role in fires involving any type of equipment powered by electricity, such as cooking, heating, office and entertainment equipment, washers and dryers, etc. as well as electrical distribution and lighting equipment. Table 9 shows that electrical failures or malfunctions were factors in 13% of reported home fires and 18% of home fire deaths. Electrical failures or malfunctions were factors in 17% of the fires in one-or two family homes but only 6% of the reported apartment fires. For more information on both fires involving electrical distribution and lighting equipment and on fires in which electrical failures or malfunctions were contributing factors, see NFPA’s report, Home
Electrical Fires, by John R. Hall, Jr. Information on NFPA70, National Electrical Code®, is available at nfpa.org/70. NFPA 70 provides detailed directions to ensure that electrical distribution equipment is installed safely. Consumer information about electrical safety and safety devices such as electrical circuit interrupters and tamper-resistant electrical receptacles is available at nfpa.org/electricalsafety. Clothes dryers or washers were involved in 4% of home structure fires. During 2007-2011, clothes dryers or washers were involved in the ignition of an average of 15,200 non-confined home structure fires per year.8 These fires caused an annual average of 30 civilian fire deaths, 460 civilian fire injuries, and $216 million in direct property damage. Overall, clothes dryers or washers were involved in 4% of the home structure fires, 1% of the home fire deaths, 3% of the home fire injuries, and 3% of the direct property damage. Clothes dryers and washers together ranked sixth in home fires and eighth in the other loss measures. In 2011, clothes dryers or washers were involved in an estimated 14,600 non-confined home structure fires, resulting in 510 civilian injuries, and $231 million in direct property damage. No deaths were reported in these fires in 2011. For more statistical information, see NFPA’s report, Home Fires Involving Clothes Dryers and
Washing Machines, by John R. Hall, Jr. Consumer safety information is also available on NFPA’s website.
8 These estimates exclude any dryer or washer fires with confined fire incident types, such as confined cooking fires, confined chimney or flue fires, and contained or confined trash or rubbish fires. For estimates that include confined fires, see NFPA’s full report, Home Fires Involving Clothes Dryers and Washing Machines.
19 21
25 25 25
21 20 21
0
5
10
15
20
25
30
2004 2005 2006 2007 2008 2009 2010 2011
In T
ho
usa
nd
s
290
500
370
270
510
320
240 290
0
100
200
300
400
500
600
2004 2005 2006 2007 2008 2009 2010 2011
U.S. Home Structure Fires, 4/13 18 NFPA Fire Analysis and Research Division, Quincy, MA
Exposure to other fires was the leading cause of direct property damage. The term “exposure” indicates that a fire was caused by another fire nearby. These fires may result from direct flame, radiant heat, or flying embers or brands. While exposures are technically fires that spread from outside to a building or vehicle, or from one building or vehicle to another building or vehicle, some fire departments use the term to indicate that the fire has spread from the property of one individual to a property belonging to, or occupied by, someone else. During 2007-2011, exposures caused an average of 12,300 reported home structure fires, 10 civilian fire deaths, 70 civilian fire injuries, and $922 million in direct property damage per year. Exposures caused 3% of the home structure fires, 1% of the home fire deaths and injuries, and 13% of the direct property damage. Exposure fires ranked seventh among the leading causes in number of reported home fires, ninth in home fire deaths and injuries, and first in direct property damage. Exposure fires were less costly in 2011 than the recent average. In 2011, 11,700 home structure fires were caused by exposure to another fire. These exposure fires resulted in 70 civilian fire injuries and $478 million in direct property damage. Fewer than ten deaths resulted from exposure fires in 2011. Seven percent of home fire injuries resulted from fires started by candles. During 2007-2011, candles caused an estimated annual average of 10,600 reported home structure fires, 120 home fire deaths, 900 home fire injuries, and $418 million in direct property damage.9 Candles caused 3% of the home fires, 4% of the home fire deaths, 7% of the home fire injuries, and 6% of the direct property damage. Candles ranked eighth among the leading cause categories in number of fires, sixth in home fire deaths, fifth in home fire injuries, and seventh in direct property damage. Home candle fires have been falling in recent years. In 2011, candles started an estimated 9,100 home fires, resulting in 90 civilian deaths, 870 civilian injuries, and $313 million in direct property damage. Additional statistical information on this subject may be found in NFPA’s report, Home Candle Fires
by Marty Ahrens. For more safety information, see nfpa.org/candles. Playing with heat source caused 2% of home fires but 6% of home fire injuries. During 2007-2011, people, typically children, playing with fire or other heat sources started an estimated annual average of 7,100 home structure fires. These fires caused an average of 80 civilian fire deaths, 750 civilian fire injuries, and $172 million in direct property damage per year. Overall, the 2% of home structure fires started by someone playing with fire or some other heat source caused 3% of the home fire deaths, 6% of the home fire injuries, and 2% of the direct property damage. In 2011, an estimated 6,700 home structure fires started by someone playing caused 40 civilian deaths, 740 civilian injuries, and $165 million in direct property damage. Additional information on this topic may be found in NFPA’s report, Children Playing with Fire, by Ben Evarts. NFPA 1035, Standard for Professional Qualifications for Fire and Life Safety Educator,
Public Information Officer, and Juvenile Firesetter Intervention Specialist identifies the job performance requirements for individuals to effectively intervene in this situation. See nfpa.org/1035 for more information. 9 A proportional share of fires with heat sources from unclassified open flame or smoking materials are included in the candle and smoking material estimates.
U.S. Home Structure Fires, 4/13 19 NFPA Fire Analysis and Research Division, Quincy, MA
More Detailed Information about Fire Circumstances
The previous section focused on major cause scenarios. This analysis also includes more detailed information based on several NFIRS data elements including equipment involved in ignition, heat source, factor contributing to ignition, area of fire origin, item first ignited, extent of fire spread, smoke alarms and automatic suppression systems. The more detailed information in this section may be used in a variety of fire prevention strategies. Oxygen administration equipment was involved in 3% of home fire deaths. Although most of the equipment involved in ignition shown in Table 7 was already discussed, oxygen administration equipment has not yet been mentioned. While this equipment was involved in less than 1% of reported home fires, it was involved in 80, or 3%, of the home fire deaths per year. Although the equipment involved in ignition field in NFIRS is intended to document the equipment that provided the heat of ignition, fire departments are sometimes using the field to document fires in which medical oxygen was a factor. On average, one of every three reported fires involving oxygen administration equipment resulted in a death. Most fires and burns involving home medical oxygen are not reported to the fire department. In 2003-2006, U.S. emergency rooms saw an average of 1,190 people who had been burned in incidents involving home medical oxygen.10 The majority of these fires, fire deaths, and burn injuries involved smoking. Home fires started by some type of operating equipment caused 40% of home fire deaths. A variety of flammability standards focus on preventing ignition by smoking materials or small open flames. Less attention has been paid to scenarios involving equipment. Table 8 shows that some type of operating equipment was the heat source in an average of 1,020, or 40%, of the home structure fire deaths per year. Heat from operating equipment started an average of 194,500, or 53%, of all reported home fires annually. Operating equipment heat sources include:
Radiated or conducted heat from operating equipment (73,600 fires and 340 deaths per year), Arcing (34,300 fires and 320 deaths per year); Sparks, embers or flames from operating equipment (23,300 fires and 130 deaths annually);
and Unclassified heat from powered equipment (63,300 fires and 220 deaths per year).
Table 8 also shows that small open flames from candles, lighters or matches were the heat sources in an average of 350, or 14%, of the deaths per year and 29,600, or 8%, of the fires. In one of every five fire deaths, the fire started when something that could catch fire was too close to a heat source. Factors contributing to ignition provide information on how the heat source and/or equipment involved actually started the fire. Multiple entries are allowed. Percentages were calculated based on the number of fires, not the entries, so sums will exceed 100%.
10 Marty Ahrens. Fires and Burns Involving Home Medical Oxygen, Quincy, MA: NFPA, 2008.
U.S. Home Structure Fires, 4/13 20 NFPA Fire Analysis and Research Division, Quincy, MA
Table 9 shows that 550, or one-fifth (21%), of the home fire deaths resulted from fires in which a heat source was too close to a combustible. Heat sources in this scenario include cooking and heating equipment, candles, lamps and bulbs, and a variety of other products that produce heat. An open flame is not necessary to start a fire. Combustible materials include food and cooking materials, trash, mattresses and bedding, upholstered furniture, or anything that can catch fire. As noted earlier, some type of electrical failure or malfunction was a factor in incidents resulting in 13% of home fires and 18% of the home structure fire deaths. Electrical failures may occur in any type of electric-powered equipment, including heating and cooking equipment, as well as in electrical distribution and lighting equipment. Abandoned or discarded material was a factor in 11% of the home fires and 16% of the associated deaths, while unattended equipment contributed to 15% of the fires and 7% of the deaths. Kitchens were the leading area of origin for home structure fires. Figure 21 and Table 10 show that two of every five (42%) home structure fires started in the kitchen or cooking area. Sixteen percent of the civilian deaths, 38% of the civilian injuries, and 14% of the direct property damage resulted from these fires. Two-thirds (66%) of the reported apartment or multi-family housing fires and one-third (33%) of the fires in one- or two-family homes originated in the kitchen.
Figure 21. Leading Areas of Origin in Home Structure Fires: 2007-2011
The 7% of home structure fires originating in the bedroom caused one-quarter (25%) of the civilian deaths, one of every five (20%) civilian injuries, and 14% of the direct property damage. The 4% of home structure fires originating in the living room, family room, or den caused one-quarter (24%) of the civilian fire deaths, 11% of the civilian injuries, and 8% of the direct property damage. Fires originating in the kitchen, bedroom, and living room, family or den, are discussed in greater detail later in this analysis. Six percent of home fires (8% in one- or two-family homes and 1% in apartments) were reported as confined chimney or flue fires.
7%
3%
8%
0%
14%
14%
1%
2%
11%
0%
20%
38%
1%
1%
24%
0%
25%
16%
3%
3%
4%
6%
7%
42%
0% 5% 10% 15% 20% 25% 30% 35% 40% 45%
Attic or ceiling/roof assembly or concealed space
Laundry room or area
Living room, family room or den
Confined chimney or flue fire
Bedroom
Kitchen or cooking area
Fires Civilian deaths
Civilian injuries Property damage
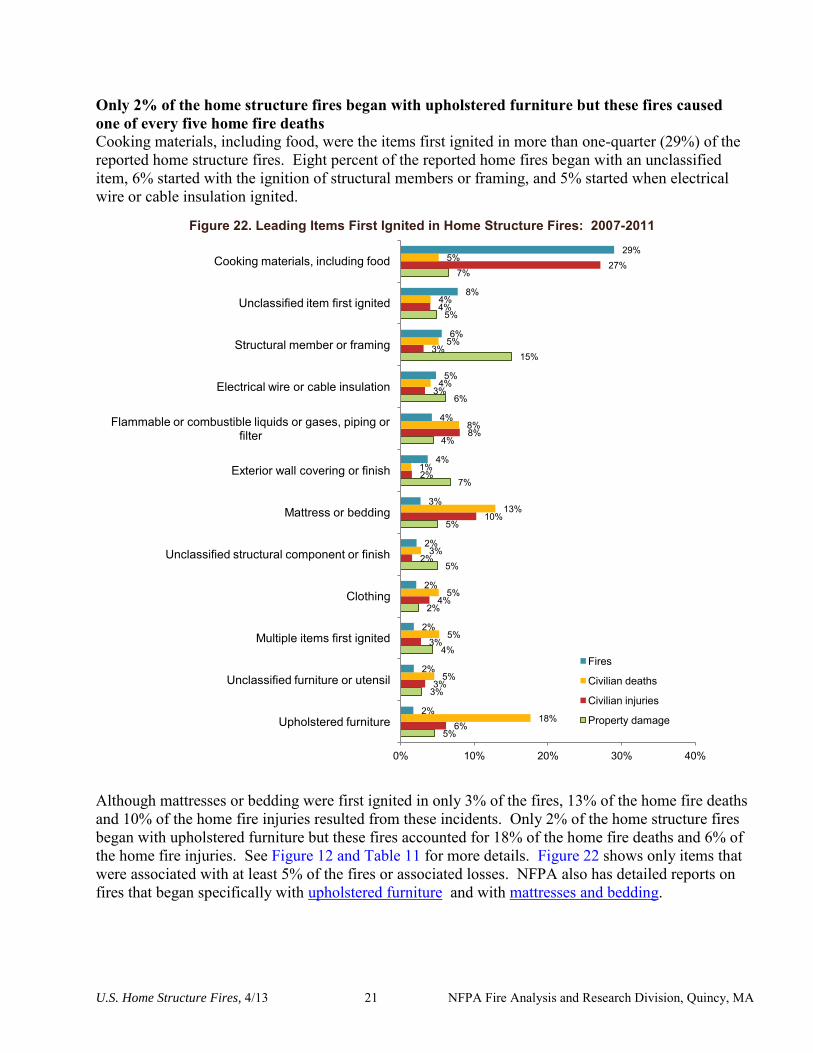
U.S. Home Structure Fires, 4/13 21 NFPA Fire Analysis and Research Division, Quincy, MA
Only 2% of the home structure fires began with upholstered furniture but these fires caused one of every five home fire deaths Cooking materials, including food, were the items first ignited in more than one-quarter (29%) of the reported home structure fires. Eight percent of the reported home fires began with an unclassified item, 6% started with the ignition of structural members or framing, and 5% started when electrical wire or cable insulation ignited.
Figure 22. Leading Items First Ignited in Home Structure Fires: 2007-2011
Although mattresses or bedding were first ignited in only 3% of the fires, 13% of the home fire deaths and 10% of the home fire injuries resulted from these incidents. Only 2% of the home structure fires began with upholstered furniture but these fires accounted for 18% of the home fire deaths and 6% of the home fire injuries. See Figure 12 and Table 11 for more details. Figure 22 shows only items that were associated with at least 5% of the fires or associated losses. NFPA also has detailed reports on fires that began specifically with upholstered furniture and with mattresses and bedding.
5%
3%
4%
2%
5%
5%
7%
4%
6%
15%
5%
7%
6%
3%
3%
4%
2%
10%
2%
8%
3%
3%
4%
27%
18%
5%
5%
5%
3%
13%
1%
8%
4%
5%
4%
5%
2%
2%
2%
2%
2%
3%
4%
4%
5%
6%
8%
29%
0% 10% 20% 30% 40%
Upholstered furniture
Unclassified furniture or utensil
Multiple items first ignited
Clothing
Unclassified structural component or finish
Mattress or bedding
Exterior wall covering or finish
Flammable or combustible liquids or gases, piping or filter
Electrical wire or cable insulation
Structural member or framing
Unclassified item first ignited
Cooking materials, including food
Fires
Civilian deaths
Civilian injuries
Property damage
U.S. Home Structure Fires, 4/13 22 NFPA Fire Analysis and Research Division, Quincy, MA
Fire spread beyond the room of origin in only one-quarter of the fires. Almost half (46%) of the reported home fires (more than one-third [37%] in one- or two-family homes and two-thirds [68%] in apartments) were confined or contained fires identified by NFIRS incident type. As discussed earlier, Version 5.0 of NFIRS requires less detail about fires confined to a cooking vessel, chimney or flues, incinerators or compactors, or fuel burners or boilers; and contained or confined trash or rubbish fires in or on structures with no flame damage to the structure or other contents. In addition to the 46% of home fires with incident types indicating contained or confined fires, Table 12 shows that the fire did not spread beyond the object of origin in another 12% of reported home structure fires. Only 25% spread beyond the room of origin. Four out of five (80%) of home fire deaths resulted from fires that extended beyond the room of origin. This scenario was more common in one- and two-family homes, where 84% of the fire deaths resulted from fires extending beyond the room of origin compared to 63% of the fire deaths in apartments. In fires that spread beyond the room of origin, structural members or framing were the most common item first ignited. Table 13 shows that structural members or framing were first ignited in 15% of the fires that spread beyond the room of origin, exterior wall covering or finish was first ignited in 11%, and electrical cable or wire insulation was first ignited in 6%. For fire deaths resulting from these fires, the three most common items were the same as for overall fire deaths: upholstered furniture (16%), mattresses or bedding (11%), and flammable or combustible liquids, gases or associated piping or filters (9%). Flame spread is more difficult to categorize for fires that do not start in conventional rooms. This is especially true for fires that start in concealed spaces or in or on exterior areas. Caution should be used when considering estimates about fires originating in these areas or with items commonly found in these areas. The item contributing most to flame spread in fires beyond the room of origin is shown in Table 14 and Figure 23. A structural member or framing was the main contributor to flame spread beyond the room of origin in one-quarter (26%) of these fires and 17% of the deaths. An unclassified structural component or finish contributed most to spread in 12% of the fires and 13% of the deaths. Exterior wall covering or finish contributed to fire spread in 11% of the fires and 3% of the deaths. Interior wall covering contributed in 6% of the fires and 10% of the deaths; upholstered furniture in 4% of the fires and 14% of the deaths.
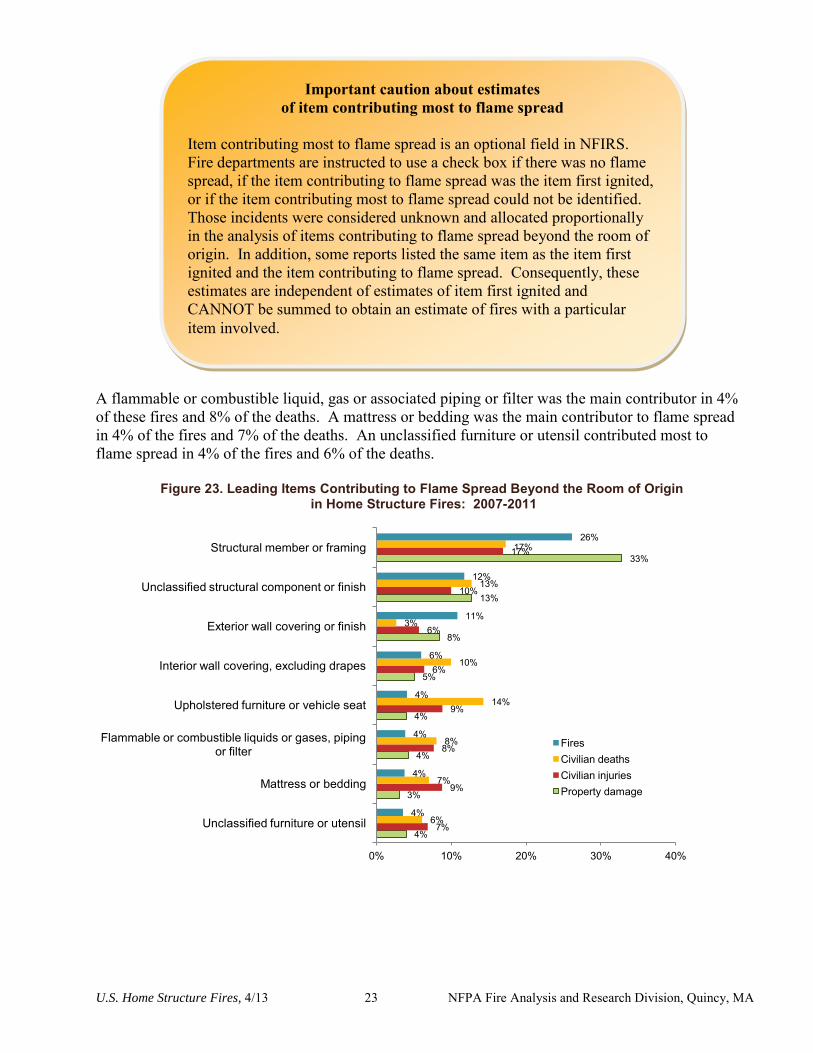
U.S. Home Structure Fires, 4/13 23 NFPA Fire Analysis and Research Division, Quincy, MA
A flammable or combustible liquid, gas or associated piping or filter was the main contributor in 4% of these fires and 8% of the deaths. A mattress or bedding was the main contributor to flame spread in 4% of the fires and 7% of the deaths. An unclassified furniture or utensil contributed most to flame spread in 4% of the fires and 6% of the deaths.
Figure 23. Leading Items Contributing to Flame Spread Beyond the Room of Origin in Home Structure Fires: 2007-2011
4%
3%
4%
4%
5%
8%
13%
33%
7%
9%
8%
9%
6%
6%
10%
17%
6%
7%
8%
14%
10%
3%
13%
17%
4%
4%
4%
4%
6%
11%
12%
26%
0% 10% 20% 30% 40%
Unclassified furniture or utensil
Mattress or bedding
Flammable or combustible liquids or gases, piping or filter
Upholstered furniture or vehicle seat
Interior wall covering, excluding drapes
Exterior wall covering or finish
Unclassified structural component or finish
Structural member or framing
Fires Civilian deaths Civilian injuries Property damage
Important caution about estimates of item contributing most to flame spread
Item contributing most to flame spread is an optional field in NFIRS. Fire departments are instructed to use a check box if there was no flame spread, if the item contributing to flame spread was the item first ignited, or if the item contributing most to flame spread could not be identified. Those incidents were considered unknown and allocated proportionally in the analysis of items contributing to flame spread beyond the room of origin. In addition, some reports listed the same item as the item first ignited and the item contributing to flame spread. Consequently, these estimates are independent of estimates of item first ignited and CANNOT be summed to obtain an estimate of fires with a particular item involved.
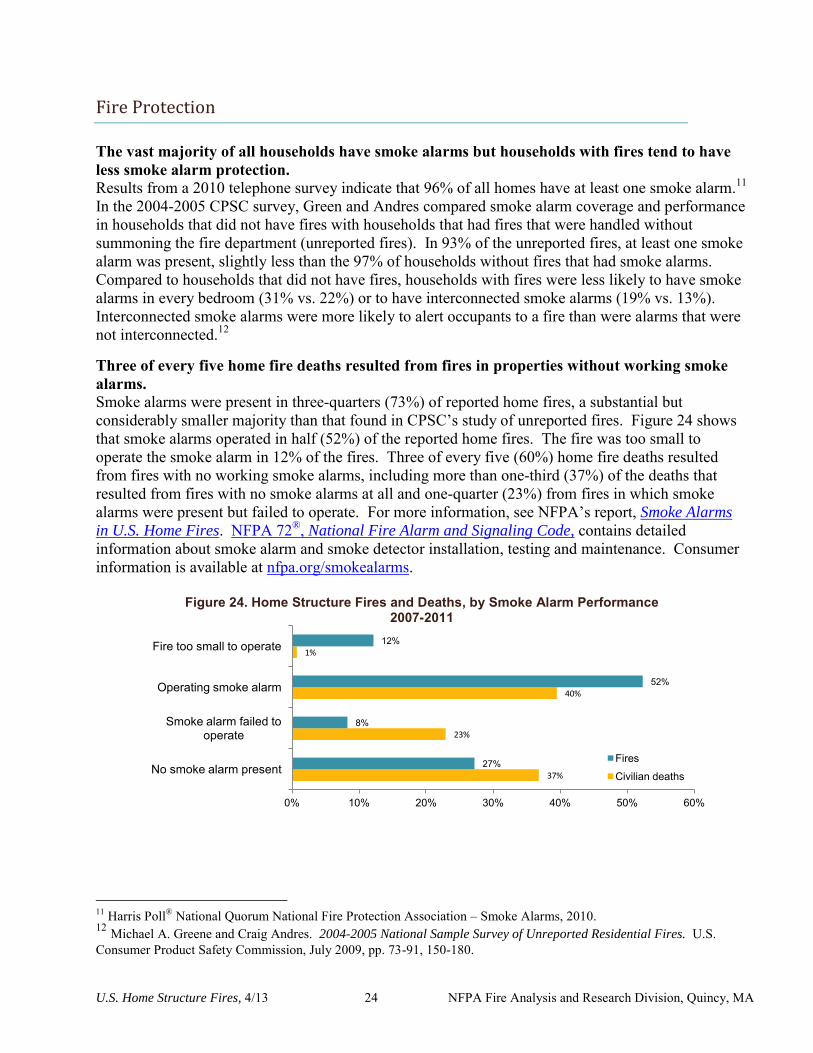
U.S. Home Structure Fires, 4/13 24 NFPA Fire Analysis and Research Division, Quincy, MA
Fire Protection
The vast majority of all households have smoke alarms but households with fires tend to have less smoke alarm protection. Results from a 2010 telephone survey indicate that 96% of all homes have at least one smoke alarm.11 In the 2004-2005 CPSC survey, Green and Andres compared smoke alarm coverage and performance in households that did not have fires with households that had fires that were handled without summoning the fire department (unreported fires). In 93% of the unreported fires, at least one smoke alarm was present, slightly less than the 97% of households without fires that had smoke alarms. Compared to households that did not have fires, households with fires were less likely to have smoke alarms in every bedroom (31% vs. 22%) or to have interconnected smoke alarms (19% vs. 13%). Interconnected smoke alarms were more likely to alert occupants to a fire than were alarms that were not interconnected.12 Three of every five home fire deaths resulted from fires in properties without working smoke alarms. Smoke alarms were present in three-quarters (73%) of reported home fires, a substantial but considerably smaller majority than that found in CPSC’s study of unreported fires. Figure 24 shows that smoke alarms operated in half (52%) of the reported home fires. The fire was too small to operate the smoke alarm in 12% of the fires. Three of every five (60%) home fire deaths resulted from fires with no working smoke alarms, including more than one-third (37%) of the deaths that resulted from fires with no smoke alarms at all and one-quarter (23%) from fires in which smoke alarms were present but failed to operate. For more information, see NFPA’s report, Smoke Alarms
in U.S. Home Fires. NFPA 72®, National Fire Alarm and Signaling Code, contains detailed information about smoke alarm and smoke detector installation, testing and maintenance. Consumer information is available at nfpa.org/smokealarms.
Figure 24. Home Structure Fires and Deaths, by Smoke Alarm Performance 2007-2011
11 Harris Poll® National Quorum National Fire Protection Association – Smoke Alarms, 2010. 12 Michael A. Greene and Craig Andres. 2004-2005 National Sample Survey of Unreported Residential Fires. U.S. Consumer Product Safety Commission, July 2009, pp. 73-91, 150-180.
37%
23%
40%
1%
27%
8%
52%
12%
0% 10% 20% 30% 40% 50% 60%
No smoke alarm present
Smoke alarm failed to operate
Operating smoke alarm
Fire too small to operate
Fires
Civilian deaths
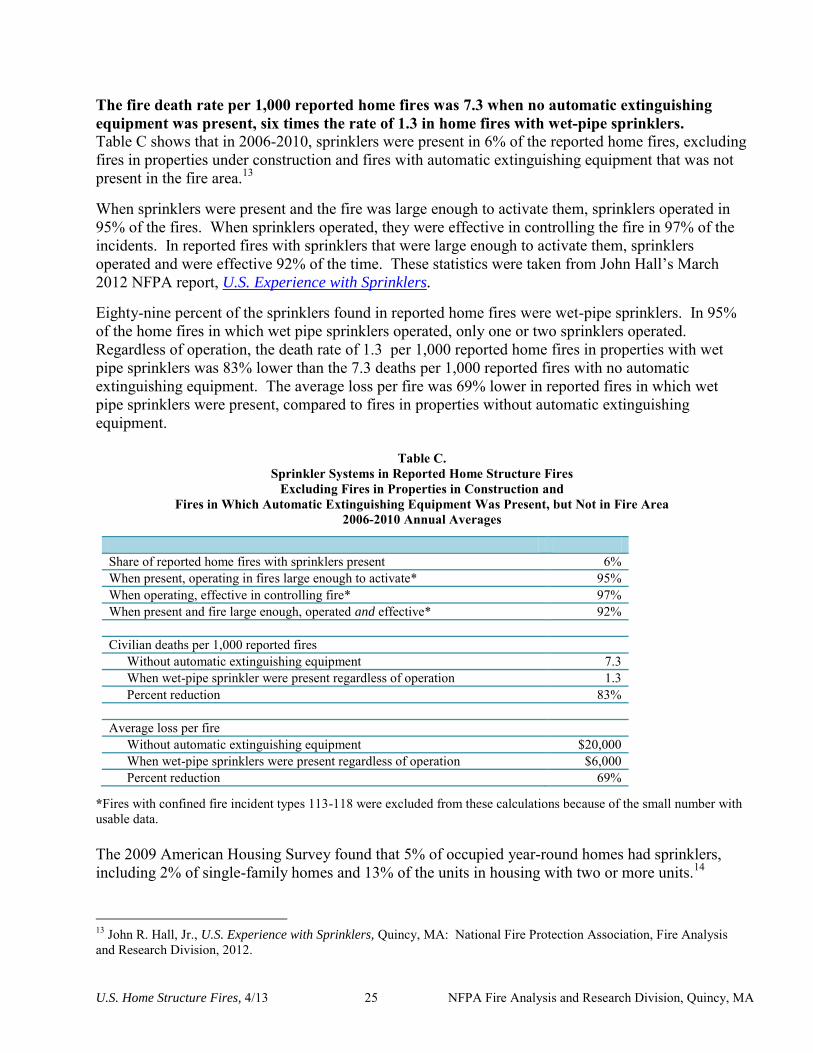
U.S. Home Structure Fires, 4/13 25 NFPA Fire Analysis and Research Division, Quincy, MA
The fire death rate per 1,000 reported home fires was 7.3 when no automatic extinguishing equipment was present, six times the rate of 1.3 in home fires with wet-pipe sprinklers. Table C shows that in 2006-2010, sprinklers were present in 6% of the reported home fires, excluding fires in properties under construction and fires with automatic extinguishing equipment that was not present in the fire area.13 When sprinklers were present and the fire was large enough to activate them, sprinklers operated in 95% of the fires. When sprinklers operated, they were effective in controlling the fire in 97% of the incidents. In reported fires with sprinklers that were large enough to activate them, sprinklers operated and were effective 92% of the time. These statistics were taken from John Hall’s March 2012 NFPA report, U.S. Experience with Sprinklers. Eighty-nine percent of the sprinklers found in reported home fires were wet-pipe sprinklers. In 95% of the home fires in which wet pipe sprinklers operated, only one or two sprinklers operated. Regardless of operation, the death rate of 1.3 per 1,000 reported home fires in properties with wet pipe sprinklers was 83% lower than the 7.3 deaths per 1,000 reported fires with no automatic extinguishing equipment. The average loss per fire was 69% lower in reported fires in which wet pipe sprinklers were present, compared to fires in properties without automatic extinguishing equipment.
Table C. Sprinkler Systems in Reported Home Structure Fires
Excluding Fires in Properties in Construction and Fires in Which Automatic Extinguishing Equipment Was Present, but Not in Fire Area
2006-2010 Annual Averages
Share of reported home fires with sprinklers present 6% When present, operating in fires large enough to activate* 95% When operating, effective in controlling fire* 97% When present and fire large enough, operated and effective* 92% Civilian deaths per 1,000 reported fires Without automatic extinguishing equipment 7.3 When wet-pipe sprinkler were present regardless of operation 1.3 Percent reduction 83% Average loss per fire Without automatic extinguishing equipment $20,000 When wet-pipe sprinklers were present regardless of operation $6,000 Percent reduction 69%
*Fires with confined fire incident types 113-118 were excluded from these calculations because of the small number with usable data. The 2009 American Housing Survey found that 5% of occupied year-round homes had sprinklers, including 2% of single-family homes and 13% of the units in housing with two or more units.14
13 John R. Hall, Jr., U.S. Experience with Sprinklers, Quincy, MA: National Fire Protection Association, Fire Analysis and Research Division, 2012.
U.S. Home Structure Fires, 4/13 26 NFPA Fire Analysis and Research Division, Quincy, MA
Fire Sprinkler Initiative is working to get sprinklers in more homes Fire sprinklers are found in a small minority of homes despite their demonstrated ability to save lives. One- and two-family homes are much less likely to have this protection than apartments. The Fire Sprinkler Initiative is working to bring sprinklers into all new homes, including one- or two-family homes and apartments or multi-family homes. See www.firesprinklerinitiative.org.
NFPA 13, Standard for the Installation of Sprinkler Systems, NFPA 13D, Standard for the
Installation of Sprinkler Systems in One- and Two-Family Dwellings and Manufactured Homes, and NFPA 13R, Standard for the Installation of Sprinkler Systems in Residential Occupancies up to and
Including Four Stories in Height, provide detailed information about these systems.
Changes in Fire Death Patterns over Time
Over the years, a variety of strategies have been employed to reduce the number of fire deaths. Flammability standards for upholstered furniture, mattresses and bedding, and other products reduce the likelihood that these items will be ignited or sustain buring. Automatic shut-offs in portable heaters activate if the device is tipped over. Other types of equipment, such as irons and coffee makers, will automatically shut off after a period of time. Arc fault circuit interrupters can prevent an electrical fault from causing a fire. Smoke alarms provide early warning of fire, allowing more time for escape. Automatic sprinklers can control a fire and limit its spread before the fire department arrives. This section compares trends in a few major fire death scenarios. Averages are shown for two five-year periods: 1980-1984, the earliest years of national data available, and 2007-2011, the latest data available. Due to the instability of estimates for 1999-2001, the transition years to NFIRS 5.0, estimates for these years are not shown in the graphs but are included in the tables.15 Deaths from fires originating in living rooms, family rooms, or dens fell more sharply than deaths from fires starting in bedrooms and kitchens. Table 15 and Figure 25 show that the differences between the three leading areas of origin for home fire deaths have shrunk over time. Deaths from fires starting in bedrooms now sometimes exceed the number resulting from fires starting in living rooms, families or dens.
14 American Housing Survey 2009, U.S. Department of Commerce and U.S. Department of Housing and Urban Development, September 20101, Table 2-4, and a special analysis by the survey report authors “Units in Structure by Selected Characteristics—Occupied Units (Safety Equipment).” 15 The total death estimates shown in Tables 15-18 were derived from the NFIRS and the NFPA survey together and consequently differ slightly from the estimates shown in Table 1 that are derived solely from the NFPA survey.
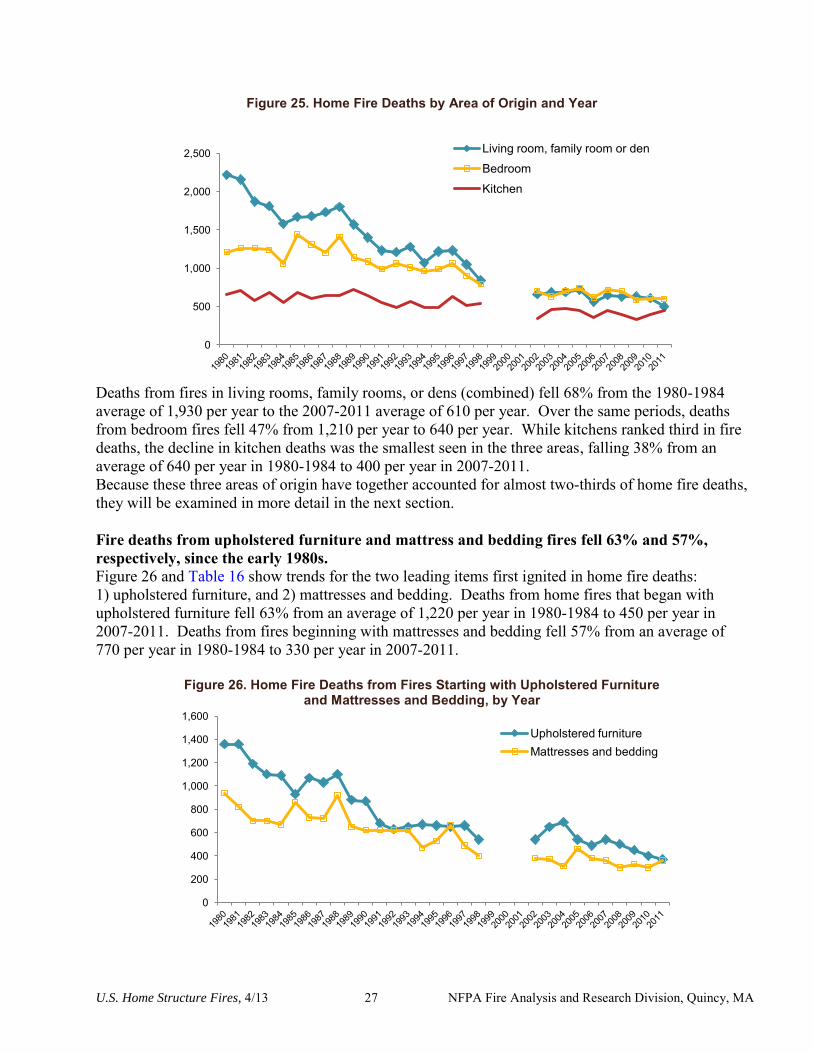
U.S. Home Structure Fires, 4/13 27 NFPA Fire Analysis and Research Division, Quincy, MA
Figure 25. Home Fire Deaths by Area of Origin and Year
Deaths from fires in living rooms, family rooms, or dens (combined) fell 68% from the 1980-1984 average of 1,930 per year to the 2007-2011 average of 610 per year. Over the same periods, deaths from bedroom fires fell 47% from 1,210 per year to 640 per year. While kitchens ranked third in fire deaths, the decline in kitchen deaths was the smallest seen in the three areas, falling 38% from an average of 640 per year in 1980-1984 to 400 per year in 2007-2011. Because these three areas of origin have together accounted for almost two-thirds of home fire deaths, they will be examined in more detail in the next section. Fire deaths from upholstered furniture and mattress and bedding fires fell 63% and 57%, respectively, since the early 1980s. Figure 26 and Table 16 show trends for the two leading items first ignited in home fire deaths: 1) upholstered furniture, and 2) mattresses and bedding. Deaths from home fires that began with upholstered furniture fell 63% from an average of 1,220 per year in 1980-1984 to 450 per year in 2007-2011. Deaths from fires beginning with mattresses and bedding fell 57% from an average of 770 per year in 1980-1984 to 330 per year in 2007-2011.
Figure 26. Home Fire Deaths from Fires Starting with Upholstered Furniture and Mattresses and Bedding, by Year
0
500
1,000
1,500
2,000
2,500 Living room, family room or den
Bedroom
Kitchen
0
200
400
600
800
1,000
1,200
1,400
1,600 Upholstered furniture Mattresses and bedding
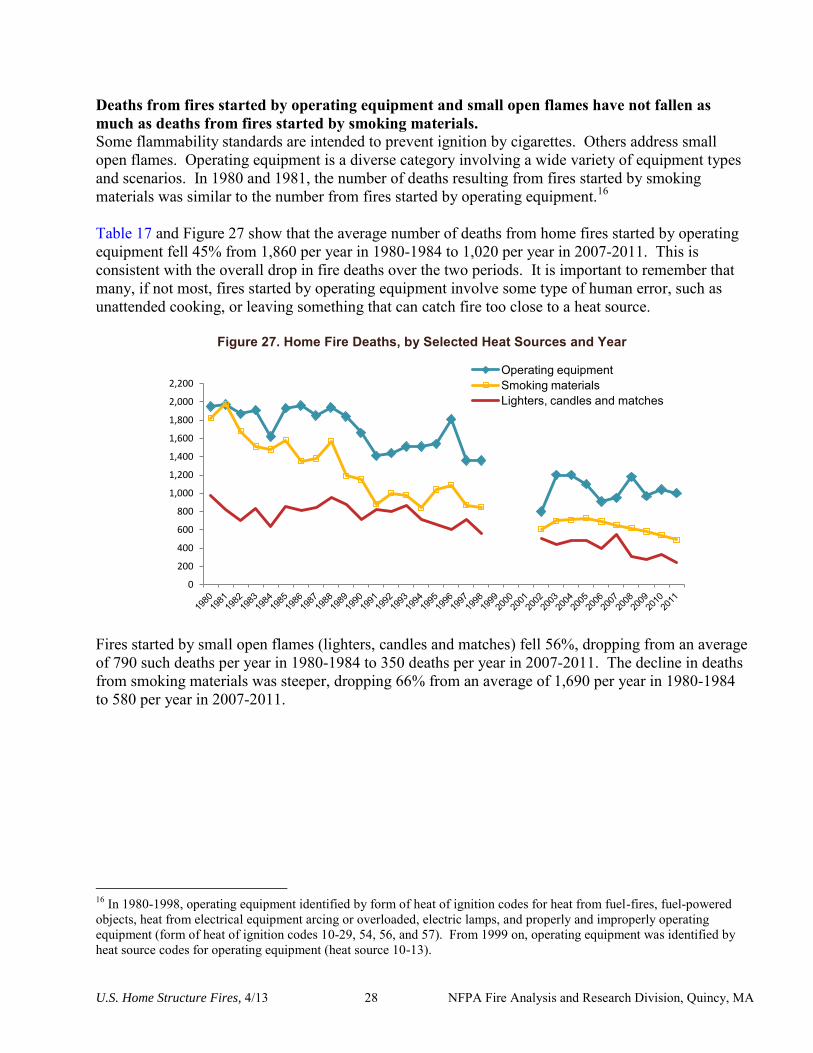
U.S. Home Structure Fires, 4/13 28 NFPA Fire Analysis and Research Division, Quincy, MA
Deaths from fires started by operating equipment and small open flames have not fallen as much as deaths from fires started by smoking materials. Some flammability standards are intended to prevent ignition by cigarettes. Others address small open flames. Operating equipment is a diverse category involving a wide variety of equipment types and scenarios. In 1980 and 1981, the number of deaths resulting from fires started by smoking materials was similar to the number from fires started by operating equipment.16 Table 17 and Figure 27 show that the average number of deaths from home fires started by operating equipment fell 45% from 1,860 per year in 1980-1984 to 1,020 per year in 2007-2011. This is consistent with the overall drop in fire deaths over the two periods. It is important to remember that many, if not most, fires started by operating equipment involve some type of human error, such as unattended cooking, or leaving something that can catch fire too close to a heat source.
Figure 27. Home Fire Deaths, by Selected Heat Sources and Year
Fires started by small open flames (lighters, candles and matches) fell 56%, dropping from an average of 790 such deaths per year in 1980-1984 to 350 deaths per year in 2007-2011. The decline in deaths from smoking materials was steeper, dropping 66% from an average of 1,690 per year in 1980-1984 to 580 per year in 2007-2011.
16 In 1980-1998, operating equipment identified by form of heat of ignition codes for heat from fuel-fires, fuel-powered objects, heat from electrical equipment arcing or overloaded, electric lamps, and properly and improperly operating equipment (form of heat of ignition codes 10-29, 54, 56, and 57). From 1999 on, operating equipment was identified by heat source codes for operating equipment (heat source 10-13).
0
200
400
600
800
1,000
1,200
1,400
1,600
1,800
2,000
2,200 Operating equipment Smoking materials Lighters, candles and matches
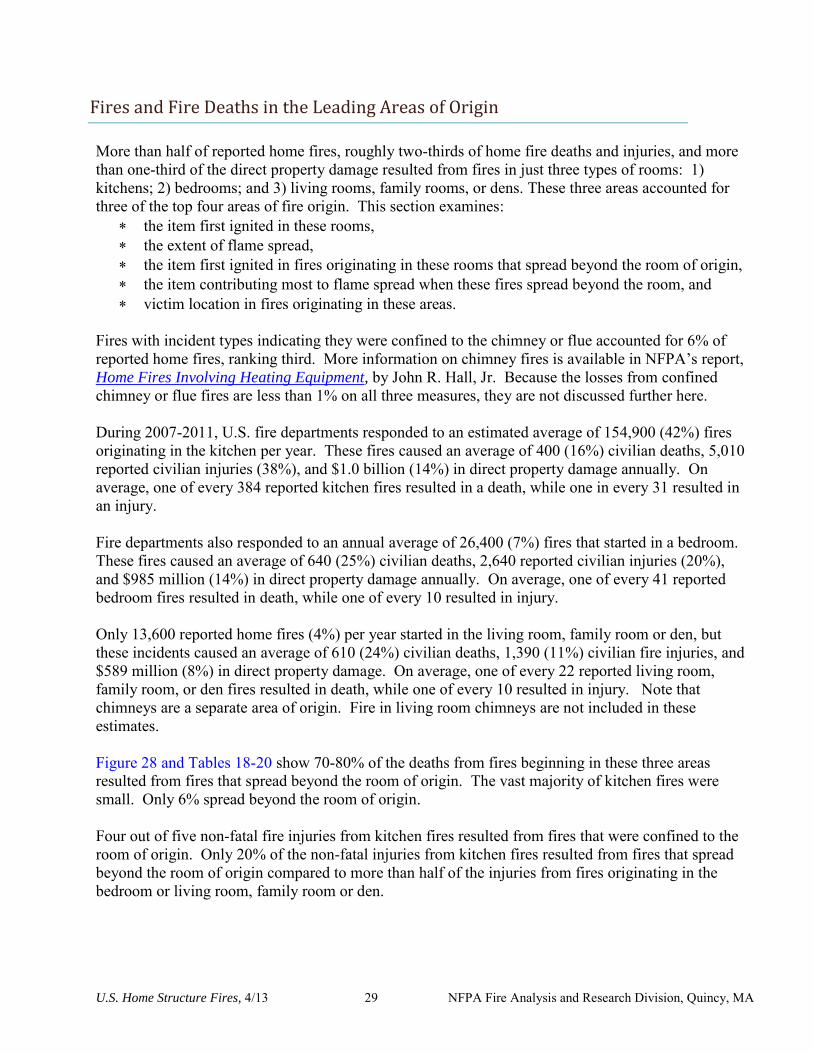
U.S. Home Structure Fires, 4/13 29 NFPA Fire Analysis and Research Division, Quincy, MA
Fires and Fire Deaths in the Leading Areas of Origin
More than half of reported home fires, roughly two-thirds of home fire deaths and injuries, and more than one-third of the direct property damage resulted from fires in just three types of rooms: 1) kitchens; 2) bedrooms; and 3) living rooms, family rooms, or dens. These three areas accounted for three of the top four areas of fire origin. This section examines:
the item first ignited in these rooms, the extent of flame spread, the item first ignited in fires originating in these rooms that spread beyond the room of origin, the item contributing most to flame spread when these fires spread beyond the room, and victim location in fires originating in these areas.
Fires with incident types indicating they were confined to the chimney or flue accounted for 6% of reported home fires, ranking third. More information on chimney fires is available in NFPA’s report, Home Fires Involving Heating Equipment, by John R. Hall, Jr. Because the losses from confined chimney or flue fires are less than 1% on all three measures, they are not discussed further here. During 2007-2011, U.S. fire departments responded to an estimated average of 154,900 (42%) fires originating in the kitchen per year. These fires caused an average of 400 (16%) civilian deaths, 5,010 reported civilian injuries (38%), and $1.0 billion (14%) in direct property damage annually. On average, one of every 384 reported kitchen fires resulted in a death, while one in every 31 resulted in an injury. Fire departments also responded to an annual average of 26,400 (7%) fires that started in a bedroom. These fires caused an average of 640 (25%) civilian deaths, 2,640 reported civilian injuries (20%), and $985 million (14%) in direct property damage annually. On average, one of every 41 reported bedroom fires resulted in death, while one of every 10 resulted in injury. Only 13,600 reported home fires (4%) per year started in the living room, family room or den, but these incidents caused an average of 610 (24%) civilian deaths, 1,390 (11%) civilian fire injuries, and $589 million (8%) in direct property damage. On average, one of every 22 reported living room, family room, or den fires resulted in death, while one of every 10 resulted in injury. Note that chimneys are a separate area of origin. Fire in living room chimneys are not included in these estimates. Figure 28 and Tables 18-20 show 70-80% of the deaths from fires beginning in these three areas resulted from fires that spread beyond the room of origin. The vast majority of kitchen fires were small. Only 6% spread beyond the room of origin. Four out of five non-fatal fire injuries from kitchen fires resulted from fires that were confined to the room of origin. Only 20% of the non-fatal injuries from kitchen fires resulted from fires that spread beyond the room of origin compared to more than half of the injuries from fires originating in the bedroom or living room, family room or den.
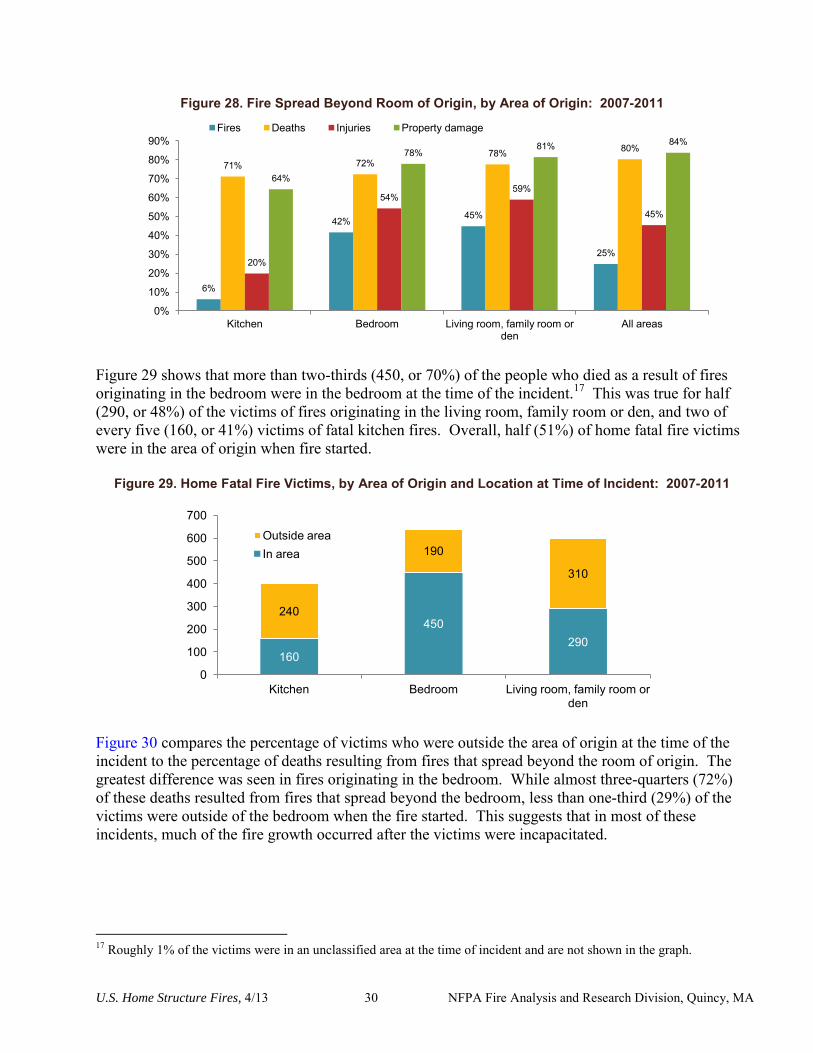
U.S. Home Structure Fires, 4/13 30 NFPA Fire Analysis and Research Division, Quincy, MA
Figure 28. Fire Spread Beyond Room of Origin, by Area of Origin: 2007-2011
Figure 29 shows that more than two-thirds (450, or 70%) of the people who died as a result of fires originating in the bedroom were in the bedroom at the time of the incident.17 This was true for half (290, or 48%) of the victims of fires originating in the living room, family room or den, and two of every five (160, or 41%) victims of fatal kitchen fires. Overall, half (51%) of home fatal fire victims were in the area of origin when fire started.
Figure 29. Home Fatal Fire Victims, by Area of Origin and Location at Time of Incident: 2007-2011
Figure 30 compares the percentage of victims who were outside the area of origin at the time of the incident to the percentage of deaths resulting from fires that spread beyond the room of origin. The greatest difference was seen in fires originating in the bedroom. While almost three-quarters (72%) of these deaths resulted from fires that spread beyond the bedroom, less than one-third (29%) of the victims were outside of the bedroom when the fire started. This suggests that in most of these incidents, much of the fire growth occurred after the victims were incapacitated.
17 Roughly 1% of the victims were in an unclassified area at the time of incident and are not shown in the graph.
6%
42% 45%
25%
71% 72% 78% 80%
20%
54% 59%
45%
64%
78% 81% 84%
0%
10%
20%
30%
40%
50%
60%
70%
80%
90%
Kitchen Bedroom Living room, family room or den
All areas
Fires Deaths Injuries Property damage
160
450 290
240
190
310
0
100
200
300
400
500
600
700
Kitchen Bedroom Living room, family room or den
Outside area In area
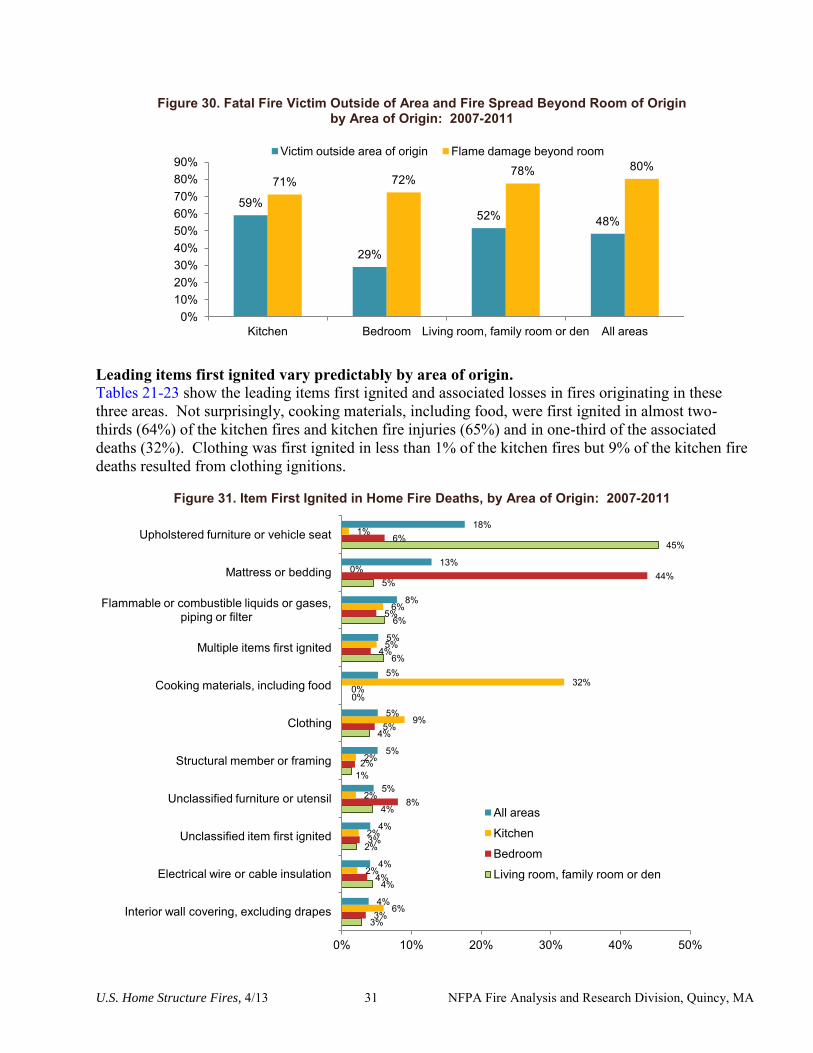
U.S. Home Structure Fires, 4/13 31 NFPA Fire Analysis and Research Division, Quincy, MA
Figure 30. Fatal Fire Victim Outside of Area and Fire Spread Beyond Room of Origin by Area of Origin: 2007-2011
Leading items first ignited vary predictably by area of origin. Tables 21-23 show the leading items first ignited and associated losses in fires originating in these three areas. Not surprisingly, cooking materials, including food, were first ignited in almost two-thirds (64%) of the kitchen fires and kitchen fire injuries (65%) and in one-third of the associated deaths (32%). Clothing was first ignited in less than 1% of the kitchen fires but 9% of the kitchen fire deaths resulted from clothing ignitions.
Figure 31. Item First Ignited in Home Fire Deaths, by Area of Origin: 2007-2011
59%
29%
52% 48%
71% 72% 78% 80%
0% 10% 20% 30% 40% 50% 60% 70% 80% 90%
Kitchen Bedroom Living room, family room or den All areas
Victim outside area of origin Flame damage beyond room
3%
4%
2%
4%
1%
4%
0%
6%
6%
5%
45%
3%
4%
3%
8%
2%
5%
0%
4%
5%
44%
6%
6%
2%
2%
2%
2%
9%
32%
5%
6%
0%
1%
4%
4%
4%
5%
5%
5%
5%
5%
8%
13%
18%
0% 10% 20% 30% 40% 50%
Interior wall covering, excluding drapes
Electrical wire or cable insulation
Unclassified item first ignited
Unclassified furniture or utensil
Structural member or framing
Clothing
Cooking materials, including food
Multiple items first ignited
Flammable or combustible liquids or gases, piping or filter
Mattress or bedding
Upholstered furniture or vehicle seat
All areas
Kitchen
Bedroom
Living room, family room or den
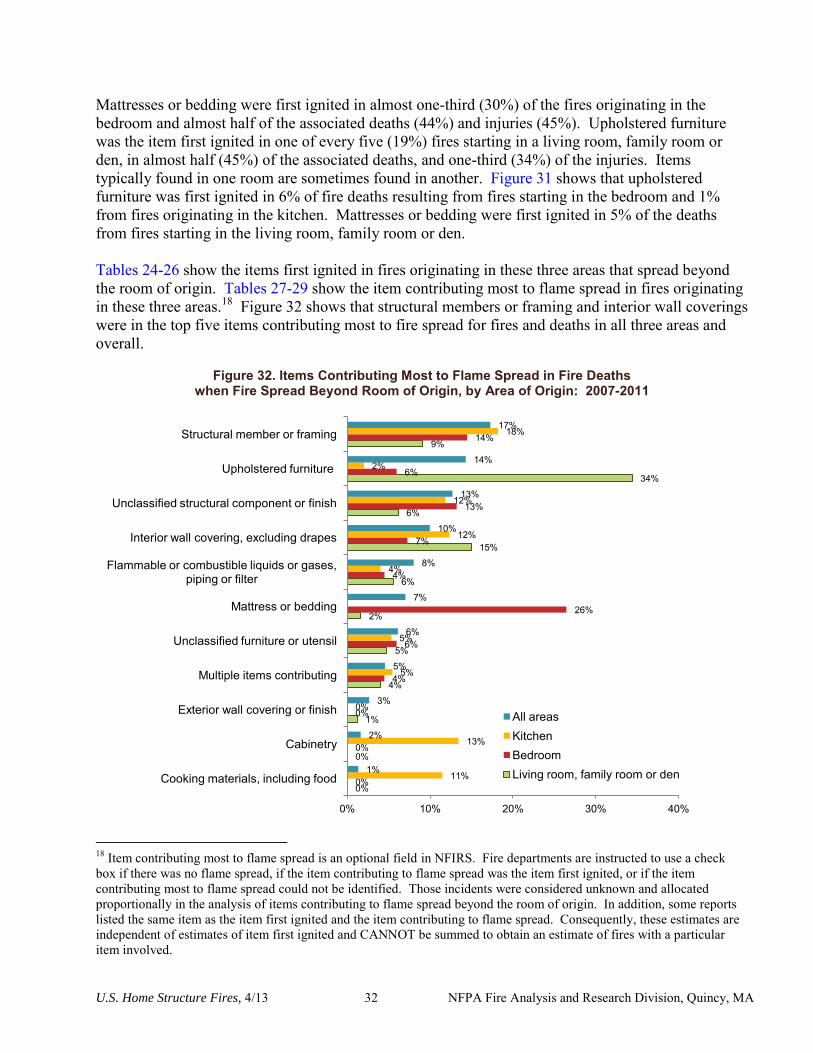
U.S. Home Structure Fires, 4/13 32 NFPA Fire Analysis and Research Division, Quincy, MA
Mattresses or bedding were first ignited in almost one-third (30%) of the fires originating in the bedroom and almost half of the associated deaths (44%) and injuries (45%). Upholstered furniture was the item first ignited in one of every five (19%) fires starting in a living room, family room or den, in almost half (45%) of the associated deaths, and one-third (34%) of the injuries. Items typically found in one room are sometimes found in another. Figure 31 shows that upholstered furniture was first ignited in 6% of fire deaths resulting from fires starting in the bedroom and 1% from fires originating in the kitchen. Mattresses or bedding were first ignited in 5% of the deaths from fires starting in the living room, family room or den. Tables 24-26 show the items first ignited in fires originating in these three areas that spread beyond the room of origin. Tables 27-29 show the item contributing most to flame spread in fires originating in these three areas.18 Figure 32 shows that structural members or framing and interior wall coverings were in the top five items contributing most to fire spread for fires and deaths in all three areas and overall.
Figure 32. Items Contributing Most to Flame Spread in Fire Deaths when Fire Spread Beyond Room of Origin, by Area of Origin: 2007-2011
18 Item contributing most to flame spread is an optional field in NFIRS. Fire departments are instructed to use a check box if there was no flame spread, if the item contributing to flame spread was the item first ignited, or if the item contributing most to flame spread could not be identified. Those incidents were considered unknown and allocated proportionally in the analysis of items contributing to flame spread beyond the room of origin. In addition, some reports listed the same item as the item first ignited and the item contributing to flame spread. Consequently, these estimates are independent of estimates of item first ignited and CANNOT be summed to obtain an estimate of fires with a particular item involved.
0%
0%
1%
4%
5%
2%
6%
15%
6%
34%
9%
0%
0%
0%
4%
6%
26%
4%
7%
13%
6%
14%
11%
13%
0%
5%
5%
4%
12%
12%
2%
18%
1%
2%
3%
5%
6%
7%
8%
10%
13%
14%
17%
0% 10% 20% 30% 40%
Cooking materials, including food
Cabinetry
Exterior wall covering or finish
Multiple items contributing
Unclassified furniture or utensil
Mattress or bedding
Flammable or combustible liquids or gases, piping or filter
Interior wall covering, excluding drapes
Unclassified structural component or finish
Upholstered furniture
Structural member or framing
All areas Kitchen Bedroom Living room, family room or den
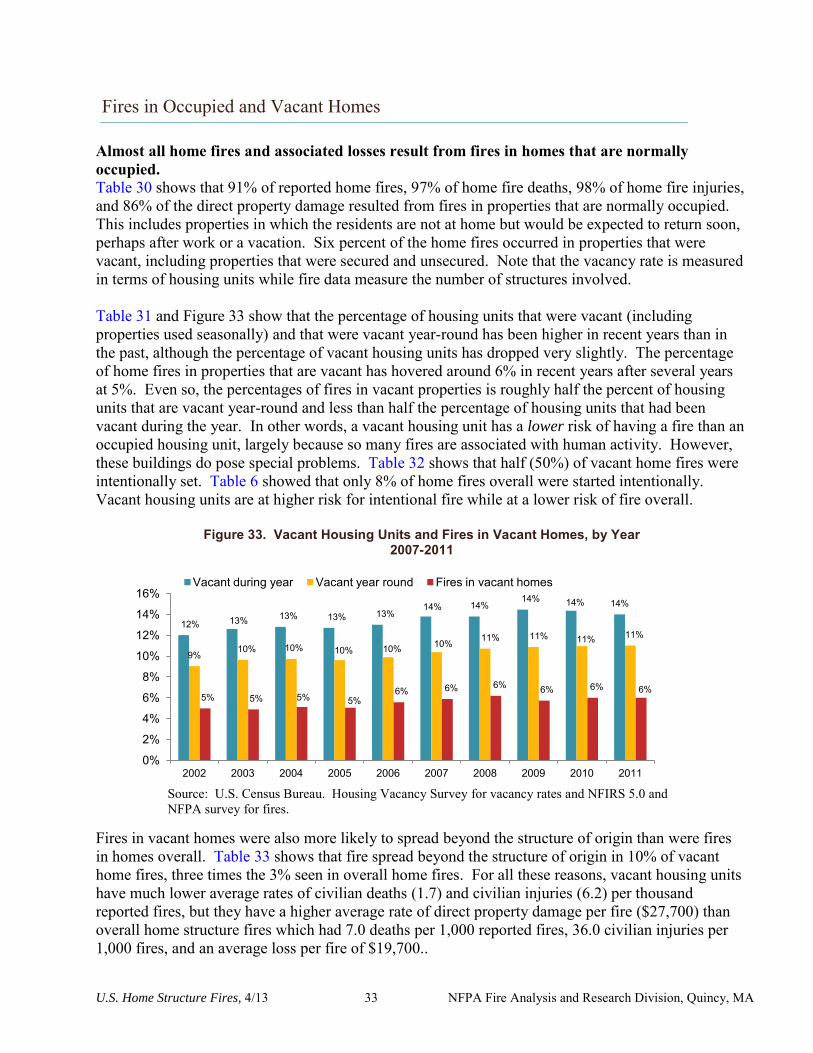
U.S. Home Structure Fires, 4/13 33 NFPA Fire Analysis and Research Division, Quincy, MA
Fires in Occupied and Vacant Homes
Almost all home fires and associated losses result from fires in homes that are normally occupied. Table 30 shows that 91% of reported home fires, 97% of home fire deaths, 98% of home fire injuries, and 86% of the direct property damage resulted from fires in properties that are normally occupied. This includes properties in which the residents are not at home but would be expected to return soon, perhaps after work or a vacation. Six percent of the home fires occurred in properties that were vacant, including properties that were secured and unsecured. Note that the vacancy rate is measured in terms of housing units while fire data measure the number of structures involved. Table 31 and Figure 33 show that the percentage of housing units that were vacant (including properties used seasonally) and that were vacant year-round has been higher in recent years than in the past, although the percentage of vacant housing units has dropped very slightly. The percentage of home fires in properties that are vacant has hovered around 6% in recent years after several years at 5%. Even so, the percentages of fires in vacant properties is roughly half the percent of housing units that are vacant year-round and less than half the percentage of housing units that had been vacant during the year. In other words, a vacant housing unit has a lower risk of having a fire than an occupied housing unit, largely because so many fires are associated with human activity. However, these buildings do pose special problems. Table 32 shows that half (50%) of vacant home fires were intentionally set. Table 6 showed that only 8% of home fires overall were started intentionally. Vacant housing units are at higher risk for intentional fire while at a lower risk of fire overall.
Figure 33. Vacant Housing Units and Fires in Vacant Homes, by Year 2007-2011
Source: U.S. Census Bureau. Housing Vacancy Survey for vacancy rates and NFIRS 5.0 and NFPA survey for fires.
Fires in vacant homes were also more likely to spread beyond the structure of origin than were fires in homes overall. Table 33 shows that fire spread beyond the structure of origin in 10% of vacant home fires, three times the 3% seen in overall home fires. For all these reasons, vacant housing units have much lower average rates of civilian deaths (1.7) and civilian injuries (6.2) per thousand reported fires, but they have a higher average rate of direct property damage per fire ($27,700) than overall home structure fires which had 7.0 deaths per 1,000 reported fires, 36.0 civilian injuries per 1,000 fires, and an average loss per fire of $19,700..
12% 13% 13% 13% 13% 14% 14%
14% 14% 14%
9% 10% 10% 10% 10% 10% 11% 11% 11% 11%
5% 5% 5% 5% 6% 6% 6% 6% 6% 6%
0%
2%
4%
6%
8%
10%
12%
14%
16%
2002 2003 2004 2005 2006 2007 2008 2009 2010 2011
Vacant during year Vacant year round Fires in vacant homes
U.S. Home Structure Fires, 4/13 34 NFPA Fire Analysis and Research Division, Quincy, MA
Unreported Home Fires
U.S. households handle more than 7 million fires a year without calling the fire department. Most of this analysis has focused on fires that were reported to the fire department. However, the vast majority of fires are handled without fire department assistance. In a telephone survey done for the CPSC in 2004-2005, respondents were asked about “any incident, large or small, that resulted in unwanted flames or smoke, and could have caused damage to life or property if left unchecked.19 Their findings revealed that in 2004-2005:
U.S. households experienced an average of 7.4 million fires per year. In 7.2 million household fires per year, the fire department did not attend. These fires caused
an estimated 130,000 injuries or illnesses. Serious injuries at unattended fires were very rare. Three-quarters of those injured received no medical attention and one-quarter received first aid at the scene. Three-quarters of the injuries or illnesses from unattended fires involved burns.
18% of the fires self-extinguished; 78% of fires were put out by a household member using a variety of methods, tools or materials, including: water, shutting off power, smothering, removing the fuel from the heat source, and fire extinguishers.
The combined estimates of unreported and reported fires, one of every 15 households experienced a fire. This translates to 6.6 fires per 100 households. The rate for unattended fires only was 6.3 per 100 households.
Cooking equipment was involved in almost two-thirds (64%) of all fires with 50 unattended fires for every incident attended by the fire service.
Households that experienced any fire, including those without fire department attendance, were more likely to rent than own their home, to have more people in the household, to have occupants who smoke, and to have someone living in the household under 18 but no one over 65.
Three-quarters (76%) of all households had fire extinguishers. Extinguishers were used in 5% of the fires. When an extinguisher was used, it put out the fire completely in half of the cases and minimized the fire but did not completely put it out in almost one-quarter of the fires. In roughly one-fifth of the fires, an extinguisher was used to little or no effect.
19 Michael A. Greene and Craig Andres. 2004-2005 National Sample Survey of Unreported Residential Fires, U.S. Consumer Product Safety Commission, July 2009.
U.S. Home Structure Fires, 4/13 35 NFPA Fire Analysis and Research Division, Quincy, MA
Other Types of Fires on Home Properties
133,500 outside and other fires per year, on average, were reported at homes. During 2007-2011, an estimated annual average of 133,500 outside and other fires on home properties caused an average of 20 deaths, 300 civilian injuries, and $66 million in direct property damage per year. An average of 13,900 vehicle fires reported on these properties (without structural involvement) caused an average of 10 civilian deaths, 140 civilian injuries, and $65 million in direct property damage per year. An NFPA analysis of brush, grass and forest fires handled by local fire departments found that in 2004-2008, 31,700, or 9% of the total such incidents occurred on properties coded as one-or two-family homes. An additional 3,200 occurred at apartments or multi-family dwellings.20 NFPA’s Firewise program provides information about how people can protect their homes and communities from these types of fires. See www.firewise.org/. Detached residential garages were not captured in this report. NFIRS 5.0 has a separate property use code detached residential garages. While most of these fires probably occurred on home properties, some may have been associated with other types of residential properties. In 2007-2011, fire departments responded to an estimated average of 4,700 detached residential garage fires, resulting in an average of 10 civilian deaths, 90 civilian injuries, and $82 million in direct property damage annually.
Additional Information Sources
NFPA offers more information. Three chapters found in the 20th edition of the NFPA Fire Protection Handbook, “One- or Two-Family Dwellings” by James K. Lathrop, “Manufactured Housing” by Kirsten M. Paoletti, and “Apartment Buildings” by Kenneth Bush, describe some of the special fire safety concerns for these properties. NFPA offers a wide variety of statistical information at www.nfpa.org/osds. Members may download a number of related reports. Manufactured Home Fires, by John R. Hall, Jr., focuses specifically on these homes and examines the impact of the 1976 federal standards and fire risks relative to other types of dwellings. Characteristics of Home Fire Victims, by Jennifer D. Flynn, examines factors such as relative risk, leading causes, and victim activities, conditions and characteristics by age and gender among civilians who were injured or killed in home fires. The report also shows a breakdown of victim ages for the major fire causes. NFPA also offers reports on a wide variety of equipment involved in home fires. The Safety Information tab on NFPA’s home page leads to information for consumers, children and life safety educators. NFPA’s codes and standards may be viewed without charge at nfpa.org/freeaccess. 20 Marty Ahrens. Brush, Grass and Forest Fires, Quincy, MA: National Fire Protection Association, 2010, p. 22. .
U.S. Home Structure Fires, 4/13 36 NFPA Fire Analysis and Research Division, Quincy, MA
Find out about CPSC’s product recalls. The Consumer Product Safety Commission (CPSC) is the federal body with primary regulatory authority for the safety of most household products. In some cases, the Commission issues mandatory standards products must meet. They can also order the recall of products that have been determined to be unsafe. The CPSC has established a publicly available database about consumer product safety information at http://www.saferproducts.gov/. This database includes recalls and reports that have been submitted about unsafe products. Public safety officials, other government agencies, child service providers, and members of the public may report incidents involving unsafe products. Details are requested about the product involved, date of incident, the manufacturer or private labeler, any illness, injury or death and treatment received, any threat of injury or death, photographs and other detailed documentation. People who report asked if they are willing to allow the report to be published in the database and whether they are willing to provide their name and contact information to the manufacturer or private labeler. Contact information must be provided with the initial report for a report to be included in the public database. Businesses are given an opportunity to review the report and submit a comment to the database about the incident. Recall information may also be accessed at this site. CPSC staff review all reports although they cannot investigate every report received. Other organizations can also review information about products to assess needs for new standards or safety information.
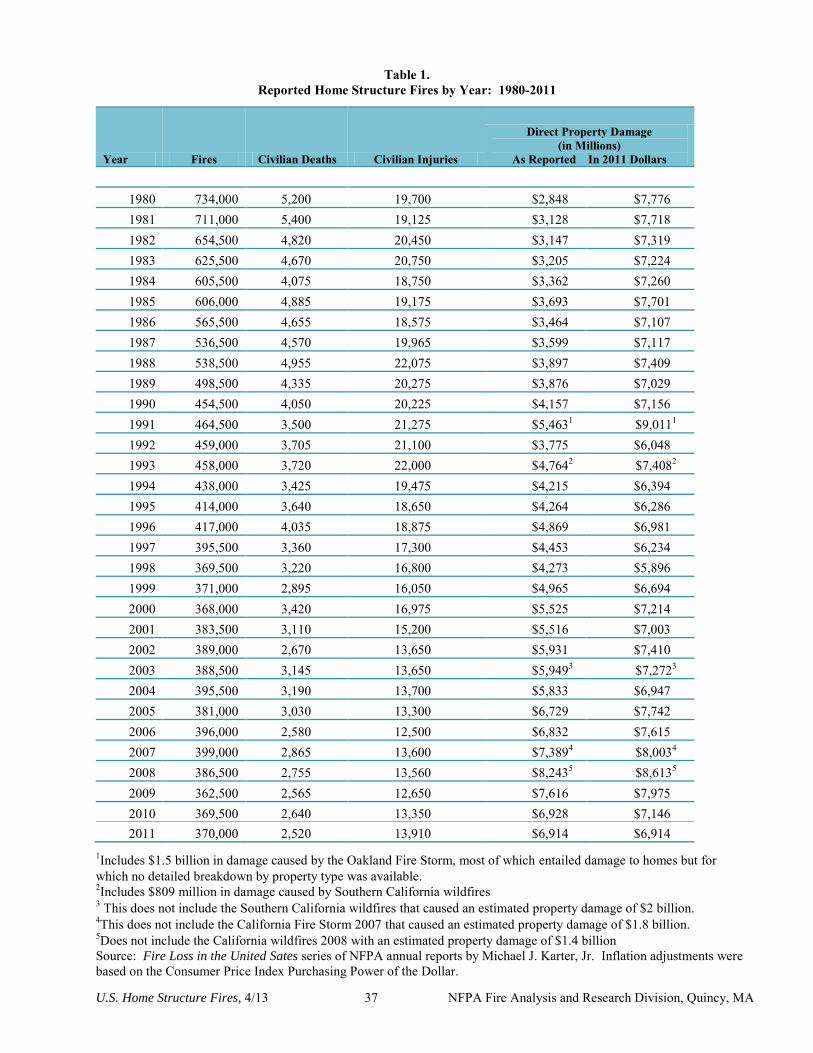
U.S. Home Structure Fires, 4/13 37 NFPA Fire Analysis and Research Division, Quincy, MA
Table 1. Reported Home Structure Fires by Year: 1980-2011
Year Fires Civilian Deaths Civilian Injuries
Direct Property Damage (in Millions)
As Reported In 2011 Dollars
1980 734,000 5,200 19,700 $2,848 $7,776 1981 711,000 5,400 19,125 $3,128 $7,718 1982 654,500 4,820 20,450 $3,147 $7,319 1983 625,500 4,670 20,750 $3,205 $7,224 1984 605,500 4,075 18,750 $3,362 $7,260 1985 606,000 4,885 19,175 $3,693 $7,701 1986 565,500 4,655 18,575 $3,464 $7,107 1987 536,500 4,570 19,965 $3,599 $7,117 1988 538,500 4,955 22,075 $3,897 $7,409 1989 498,500 4,335 20,275 $3,876 $7,029 1990 454,500 4,050 20,225 $4,157 $7,156 1991 464,500 3,500 21,275 $5,4631 $9,0111 1992 459,000 3,705 21,100 $3,775 $6,048 1993 458,000 3,720 22,000 $4,7642 $7,4082 1994 438,000 3,425 19,475 $4,215 $6,394 1995 414,000 3,640 18,650 $4,264 $6,286 1996 417,000 4,035 18,875 $4,869 $6,981 1997 395,500 3,360 17,300 $4,453 $6,234 1998 369,500 3,220 16,800 $4,273 $5,896 1999 371,000 2,895 16,050 $4,965 $6,694 2000 368,000 3,420 16,975 $5,525 $7,214 2001 383,500 3,110 15,200 $5,516 $7,003 2002 389,000 2,670 13,650 $5,931 $7,410 2003 388,500 3,145 13,650 $5,9493 $7,2723 2004 395,500 3,190 13,700 $5,833 $6,947 2005 381,000 3,030 13,300 $6,729 $7,742 2006 396,000 2,580 12,500 $6,832 $7,615 2007 399,000 2,865 13,600 $7,3894 $8,0034 2008 386,500 2,755 13,560 $8,2435 $8,6135 2009 362,500 2,565 12,650 $7,616 $7,975 2010 369,500 2,640 13,350 $6,928 $7,146 2011 370,000 2,520 13,910 $6,914 $6,914
1Includes $1.5 billion in damage caused by the Oakland Fire Storm, most of which entailed damage to homes but for which no detailed breakdown by property type was available. 2Includes $809 million in damage caused by Southern California wildfires 3 This does not include the Southern California wildfires that caused an estimated property damage of $2 billion. 4This does not include the California Fire Storm 2007 that caused an estimated property damage of $1.8 billion. 5Does not include the California wildfires 2008 with an estimated property damage of $1.4 billion
Source: Fire Loss in the United Sates series of NFPA annual reports by Michael J. Karter, Jr. Inflation adjustments were based on the Consumer Price Index Purchasing Power of the Dollar.
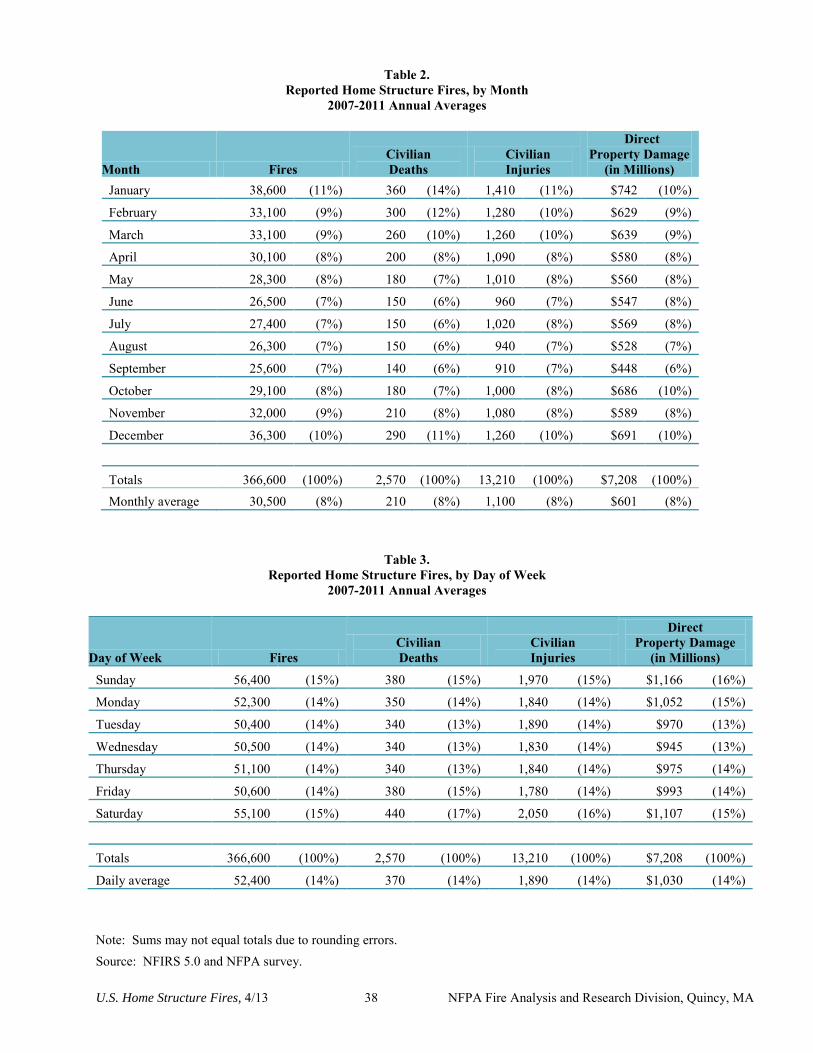
U.S. Home Structure Fires, 4/13 38 NFPA Fire Analysis and Research Division, Quincy, MA
Table 2. Reported Home Structure Fires, by Month
2007-2011 Annual Averages
Month Fires Civilian Deaths
Civilian Injuries
Direct Property Damage
(in Millions) January 38,600 (11%) 360 (14%) 1,410 (11%) $742 (10%)
February 33,100 (9%) 300 (12%) 1,280 (10%) $629 (9%)
March 33,100 (9%) 260 (10%) 1,260 (10%) $639 (9%)
April 30,100 (8%) 200 (8%) 1,090 (8%) $580 (8%)
May 28,300 (8%) 180 (7%) 1,010 (8%) $560 (8%)
June 26,500 (7%) 150 (6%) 960 (7%) $547 (8%)
July 27,400 (7%) 150 (6%) 1,020 (8%) $569 (8%)
August 26,300 (7%) 150 (6%) 940 (7%) $528 (7%)
September 25,600 (7%) 140 (6%) 910 (7%) $448 (6%)
October 29,100 (8%) 180 (7%) 1,000 (8%) $686 (10%)
November 32,000 (9%) 210 (8%) 1,080 (8%) $589 (8%)
December 36,300 (10%) 290 (11%) 1,260 (10%) $691 (10%)
Totals 366,600 (100%) 2,570 (100%) 13,210 (100%) $7,208 (100%) Monthly average 30,500 (8%) 210 (8%) 1,100 (8%) $601 (8%)
Table 3. Reported Home Structure Fires, by Day of Week
2007-2011 Annual Averages
Day of Week Fires Civilian Deaths
Civilian Injuries
Direct Property Damage
(in Millions)
Sunday 56,400 (15%) 380 (15%) 1,970 (15%) $1,166 (16%)
Monday 52,300 (14%) 350 (14%) 1,840 (14%) $1,052 (15%)
Tuesday 50,400 (14%) 340 (13%) 1,890 (14%) $970 (13%)
Wednesday 50,500 (14%) 340 (13%) 1,830 (14%) $945 (13%)
Thursday 51,100 (14%) 340 (13%) 1,840 (14%) $975 (14%)
Friday 50,600 (14%) 380 (15%) 1,780 (14%) $993 (14%)
Saturday 55,100 (15%) 440 (17%) 2,050 (16%) $1,107 (15%)
Totals 366,600 (100%) 2,570 (100%) 13,210 (100%) $7,208 (100%)
Daily average 52,400 (14%) 370 (14%) 1,890 (14%) $1,030 (14%)
Note: Sums may not equal totals due to rounding errors.
Source: NFIRS 5.0 and NFPA survey.
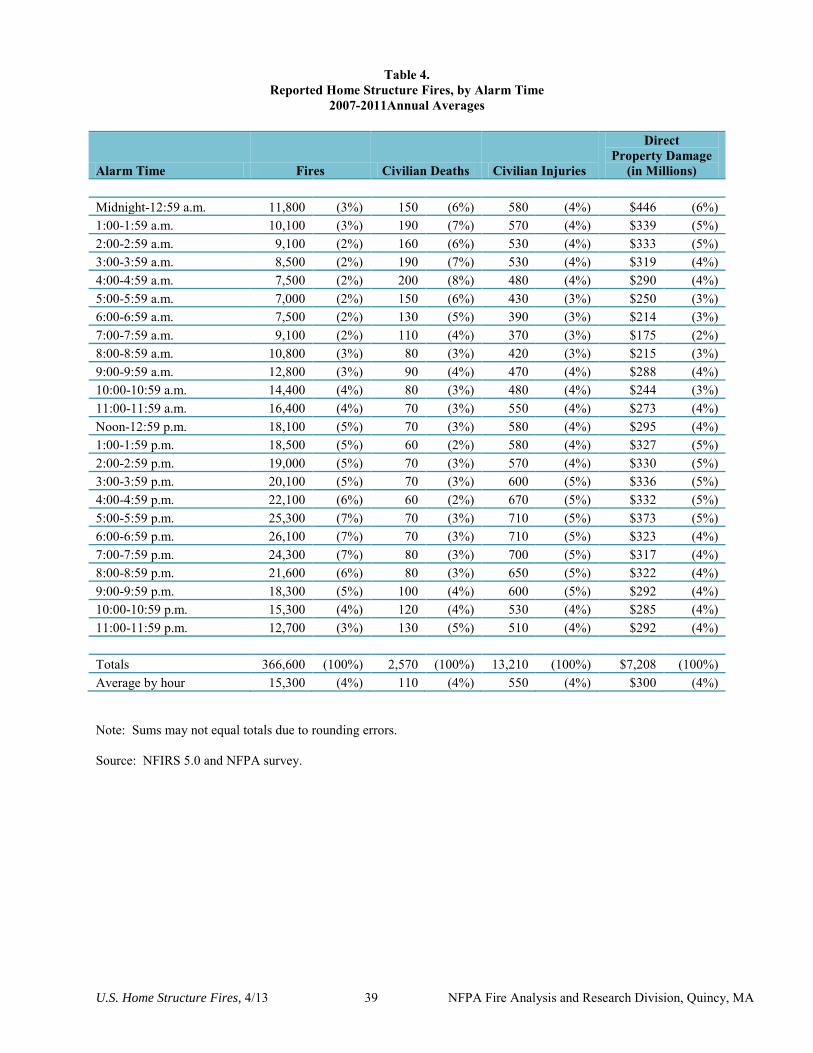
U.S. Home Structure Fires, 4/13 39 NFPA Fire Analysis and Research Division, Quincy, MA
Table 4. Reported Home Structure Fires, by Alarm Time
2007-2011Annual Averages
Alarm Time Fires Civilian Deaths Civilian Injuries
Direct Property Damage
(in Millions)
Midnight-12:59 a.m. 11,800 (3%) 150 (6%) 580 (4%) $446 (6%) 1:00-1:59 a.m. 10,100 (3%) 190 (7%) 570 (4%) $339 (5%) 2:00-2:59 a.m. 9,100 (2%) 160 (6%) 530 (4%) $333 (5%) 3:00-3:59 a.m. 8,500 (2%) 190 (7%) 530 (4%) $319 (4%) 4:00-4:59 a.m. 7,500 (2%) 200 (8%) 480 (4%) $290 (4%) 5:00-5:59 a.m. 7,000 (2%) 150 (6%) 430 (3%) $250 (3%) 6:00-6:59 a.m. 7,500 (2%) 130 (5%) 390 (3%) $214 (3%) 7:00-7:59 a.m. 9,100 (2%) 110 (4%) 370 (3%) $175 (2%) 8:00-8:59 a.m. 10,800 (3%) 80 (3%) 420 (3%) $215 (3%) 9:00-9:59 a.m. 12,800 (3%) 90 (4%) 470 (4%) $288 (4%) 10:00-10:59 a.m. 14,400 (4%) 80 (3%) 480 (4%) $244 (3%) 11:00-11:59 a.m. 16,400 (4%) 70 (3%) 550 (4%) $273 (4%) Noon-12:59 p.m. 18,100 (5%) 70 (3%) 580 (4%) $295 (4%) 1:00-1:59 p.m. 18,500 (5%) 60 (2%) 580 (4%) $327 (5%) 2:00-2:59 p.m. 19,000 (5%) 70 (3%) 570 (4%) $330 (5%) 3:00-3:59 p.m. 20,100 (5%) 70 (3%) 600 (5%) $336 (5%) 4:00-4:59 p.m. 22,100 (6%) 60 (2%) 670 (5%) $332 (5%) 5:00-5:59 p.m. 25,300 (7%) 70 (3%) 710 (5%) $373 (5%) 6:00-6:59 p.m. 26,100 (7%) 70 (3%) 710 (5%) $323 (4%) 7:00-7:59 p.m. 24,300 (7%) 80 (3%) 700 (5%) $317 (4%) 8:00-8:59 p.m. 21,600 (6%) 80 (3%) 650 (5%) $322 (4%) 9:00-9:59 p.m. 18,300 (5%) 100 (4%) 600 (5%) $292 (4%) 10:00-10:59 p.m. 15,300 (4%) 120 (4%) 530 (4%) $285 (4%) 11:00-11:59 p.m. 12,700 (3%) 130 (5%) 510 (4%) $292 (4%)
Totals 366,600 (100%) 2,570 (100%) 13,210 (100%) $7,208 (100%) Average by hour 15,300 (4%) 110 (4%) 550 (4%) $300 (4%)
Note: Sums may not equal totals due to rounding errors. Source: NFIRS 5.0 and NFPA survey.
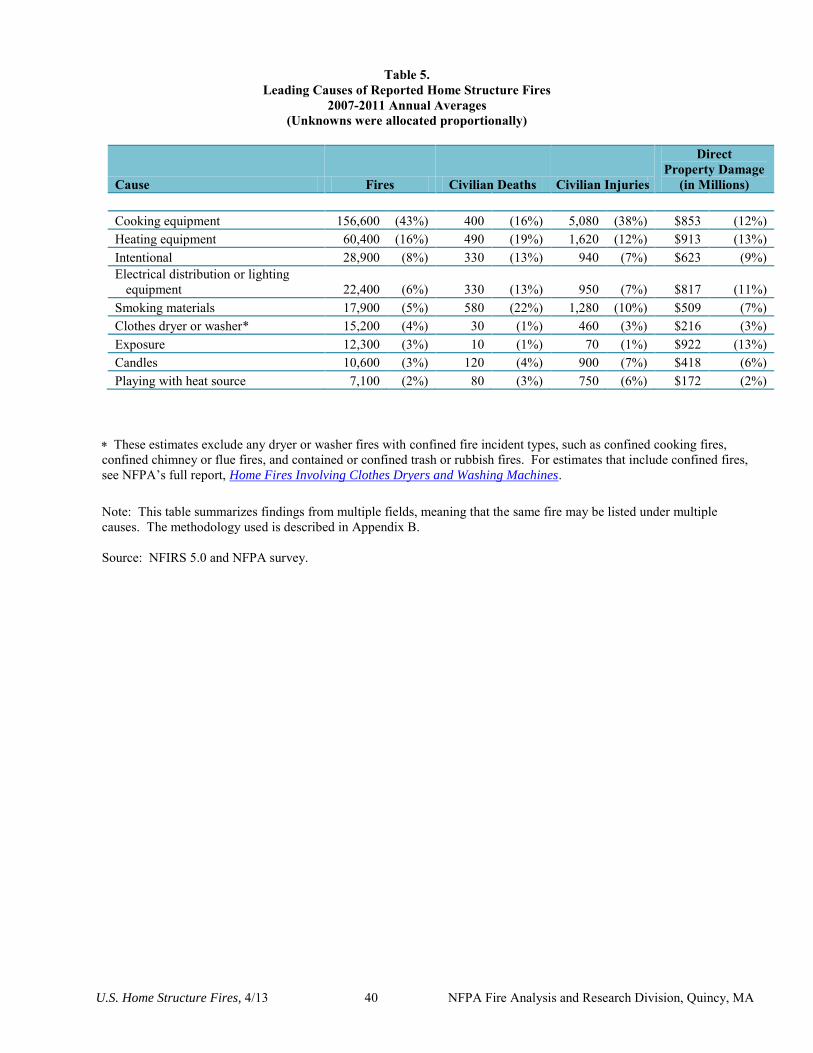
U.S. Home Structure Fires, 4/13 40 NFPA Fire Analysis and Research Division, Quincy, MA
Table 5. Leading Causes of Reported Home Structure Fires
2007-2011 Annual Averages (Unknowns were allocated proportionally)
Cause Fires Civilian Deaths Civilian Injuries
Direct Property Damage
(in Millions)
Cooking equipment 156,600 (43%) 400 (16%) 5,080 (38%) $853 (12%) Heating equipment 60,400 (16%) 490 (19%) 1,620 (12%) $913 (13%) Intentional 28,900 (8%) 330 (13%) 940 (7%) $623 (9%) Electrical distribution or lighting
equipment 22,400 (6%) 330 (13%) 950 (7%) $817 (11%) Smoking materials 17,900 (5%) 580 (22%) 1,280 (10%) $509 (7%) Clothes dryer or washer* 15,200 (4%) 30 (1%) 460 (3%) $216 (3%) Exposure 12,300 (3%) 10 (1%) 70 (1%) $922 (13%) Candles 10,600 (3%) 120 (4%) 900 (7%) $418 (6%) Playing with heat source 7,100 (2%) 80 (3%) 750 (6%) $172 (2%)
These estimates exclude any dryer or washer fires with confined fire incident types, such as confined cooking fires, confined chimney or flue fires, and contained or confined trash or rubbish fires. For estimates that include confined fires, see NFPA’s full report, Home Fires Involving Clothes Dryers and Washing Machines.
Note: This table summarizes findings from multiple fields, meaning that the same fire may be listed under multiple causes. The methodology used is described in Appendix B. Source: NFIRS 5.0 and NFPA survey.
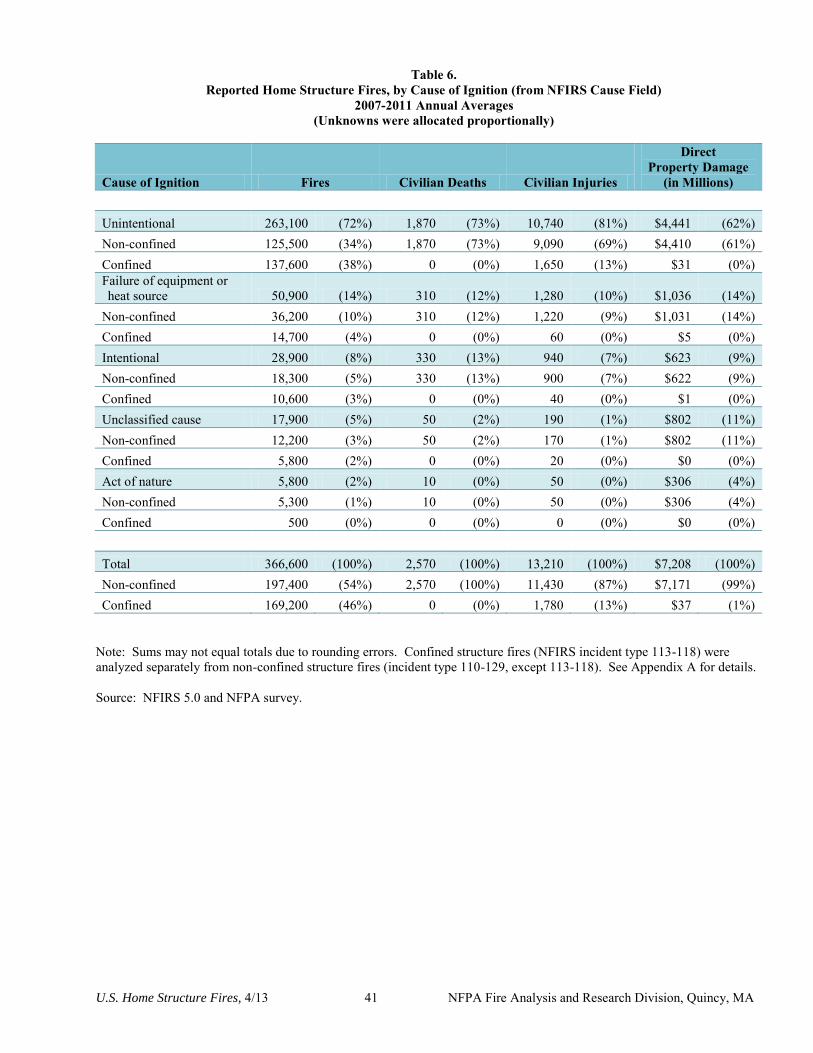
U.S. Home Structure Fires, 4/13 41 NFPA Fire Analysis and Research Division, Quincy, MA
Table 6. Reported Home Structure Fires, by Cause of Ignition (from NFIRS Cause Field)
2007-2011 Annual Averages (Unknowns were allocated proportionally)
Cause of Ignition Fires Civilian Deaths Civilian Injuries
Direct Property Damage
(in Millions)
Unintentional 263,100 (72%) 1,870 (73%) 10,740 (81%) $4,441 (62%) Non-confined 125,500 (34%) 1,870 (73%) 9,090 (69%) $4,410 (61%) Confined 137,600 (38%) 0 (0%) 1,650 (13%) $31 (0%) Failure of equipment or heat source 50,900 (14%) 310 (12%) 1,280 (10%) $1,036 (14%)
Non-confined 36,200 (10%) 310 (12%) 1,220 (9%) $1,031 (14%) Confined 14,700 (4%) 0 (0%) 60 (0%) $5 (0%) Intentional 28,900 (8%) 330 (13%) 940 (7%) $623 (9%) Non-confined 18,300 (5%) 330 (13%) 900 (7%) $622 (9%) Confined 10,600 (3%) 0 (0%) 40 (0%) $1 (0%) Unclassified cause 17,900 (5%) 50 (2%) 190 (1%) $802 (11%) Non-confined 12,200 (3%) 50 (2%) 170 (1%) $802 (11%) Confined 5,800 (2%) 0 (0%) 20 (0%) $0 (0%) Act of nature 5,800 (2%) 10 (0%) 50 (0%) $306 (4%) Non-confined 5,300 (1%) 10 (0%) 50 (0%) $306 (4%) Confined 500 (0%) 0 (0%) 0 (0%) $0 (0%)
Total 366,600 (100%) 2,570 (100%) 13,210 (100%) $7,208 (100%) Non-confined 197,400 (54%) 2,570 (100%) 11,430 (87%) $7,171 (99%) Confined 169,200 (46%) 0 (0%) 1,780 (13%) $37 (1%)
Note: Sums may not equal totals due to rounding errors. Confined structure fires (NFIRS incident type 113-118) were analyzed separately from non-confined structure fires (incident type 110-129, except 113-118). See Appendix A for details. Source: NFIRS 5.0 and NFPA survey.
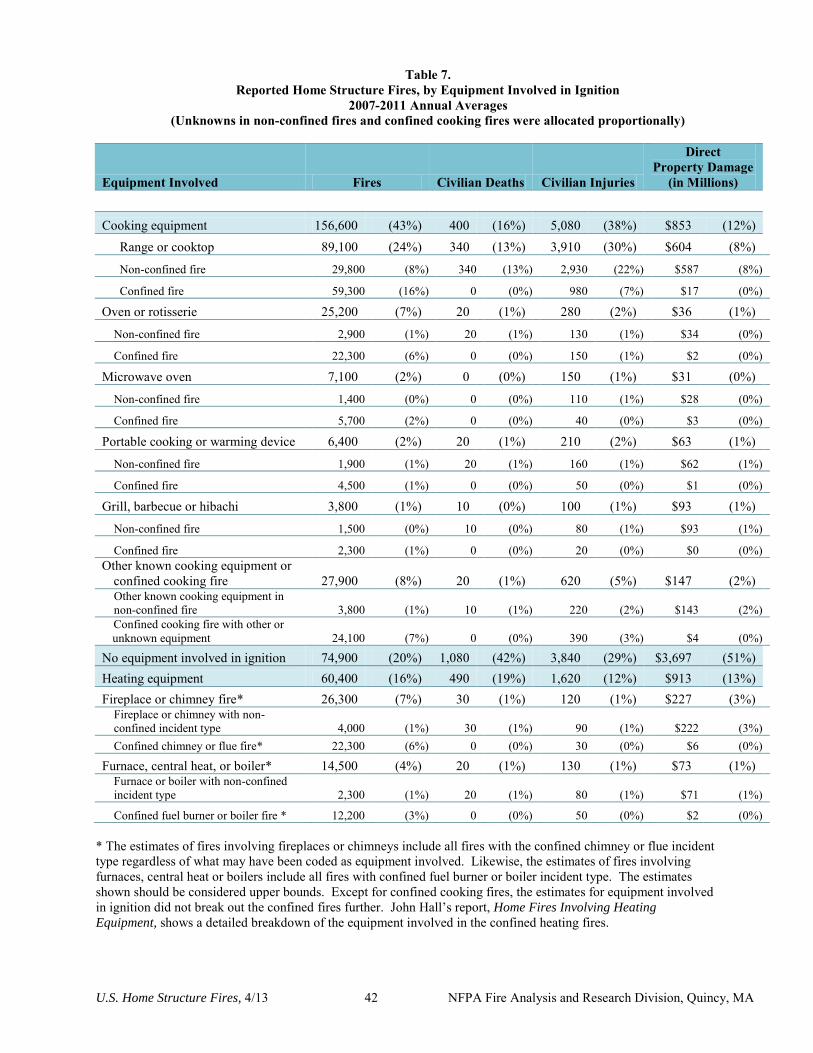
U.S. Home Structure Fires, 4/13 42 NFPA Fire Analysis and Research Division, Quincy, MA
Table 7. Reported Home Structure Fires, by Equipment Involved in Ignition
2007-2011 Annual Averages (Unknowns in non-confined fires and confined cooking fires were allocated proportionally)
Equipment Involved Fires Civilian Deaths Civilian Injuries
Direct Property Damage
(in Millions)
Cooking equipment 156,600 (43%) 400 (16%) 5,080 (38%) $853 (12%) Range or cooktop 89,100 (24%) 340 (13%) 3,910 (30%) $604 (8%)
Non-confined fire 29,800 (8%) 340 (13%) 2,930 (22%) $587 (8%)
Confined fire 59,300 (16%) 0 (0%) 980 (7%) $17 (0%)
Oven or rotisserie 25,200 (7%) 20 (1%) 280 (2%) $36 (1%)
Non-confined fire 2,900 (1%) 20 (1%) 130 (1%) $34 (0%)
Confined fire 22,300 (6%) 0 (0%) 150 (1%) $2 (0%)
Microwave oven 7,100 (2%) 0 (0%) 150 (1%) $31 (0%)
Non-confined fire 1,400 (0%) 0 (0%) 110 (1%) $28 (0%)
Confined fire 5,700 (2%) 0 (0%) 40 (0%) $3 (0%)
Portable cooking or warming device 6,400 (2%) 20 (1%) 210 (2%) $63 (1%)
Non-confined fire 1,900 (1%) 20 (1%) 160 (1%) $62 (1%)
Confined fire 4,500 (1%) 0 (0%) 50 (0%) $1 (0%)
Grill, barbecue or hibachi 3,800 (1%) 10 (0%) 100 (1%) $93 (1%)
Non-confined fire 1,500 (0%) 10 (0%) 80 (1%) $93 (1%)
Confined fire 2,300 (1%) 0 (0%) 20 (0%) $0 (0%) Other known cooking equipment or
confined cooking fire 27,900 (8%) 20 (1%) 620 (5%) $147 (2%) Other known cooking equipment in non-confined fire 3,800 (1%) 10 (1%) 220 (2%) $143 (2%) Confined cooking fire with other or unknown equipment 24,100 (7%) 0 (0%) 390 (3%) $4 (0%)
No equipment involved in ignition 74,900 (20%) 1,080 (42%) 3,840 (29%) $3,697 (51%) Heating equipment 60,400 (16%) 490 (19%) 1,620 (12%) $913 (13%) Fireplace or chimney fire* 26,300 (7%) 30 (1%) 120 (1%) $227 (3%)
Fireplace or chimney with non-confined incident type 4,000 (1%) 30 (1%) 90 (1%) $222 (3%) Confined chimney or flue fire* 22,300 (6%) 0 (0%) 30 (0%) $6 (0%)
Furnace, central heat, or boiler* 14,500 (4%) 20 (1%) 130 (1%) $73 (1%) Furnace or boiler with non-confined incident type 2,300 (1%) 20 (1%) 80 (1%) $71 (1%)
Confined fuel burner or boiler fire * 12,200 (3%) 0 (0%) 50 (0%) $2 (0%) * The estimates of fires involving fireplaces or chimneys include all fires with the confined chimney or flue incident type regardless of what may have been coded as equipment involved. Likewise, the estimates of fires involving furnaces, central heat or boilers include all fires with confined fuel burner or boiler incident type. The estimates shown should be considered upper bounds. Except for confined cooking fires, the estimates for equipment involved in ignition did not break out the confined fires further. John Hall’s report, Home Fires Involving Heating
Equipment, shows a detailed breakdown of the equipment involved in the confined heating fires.
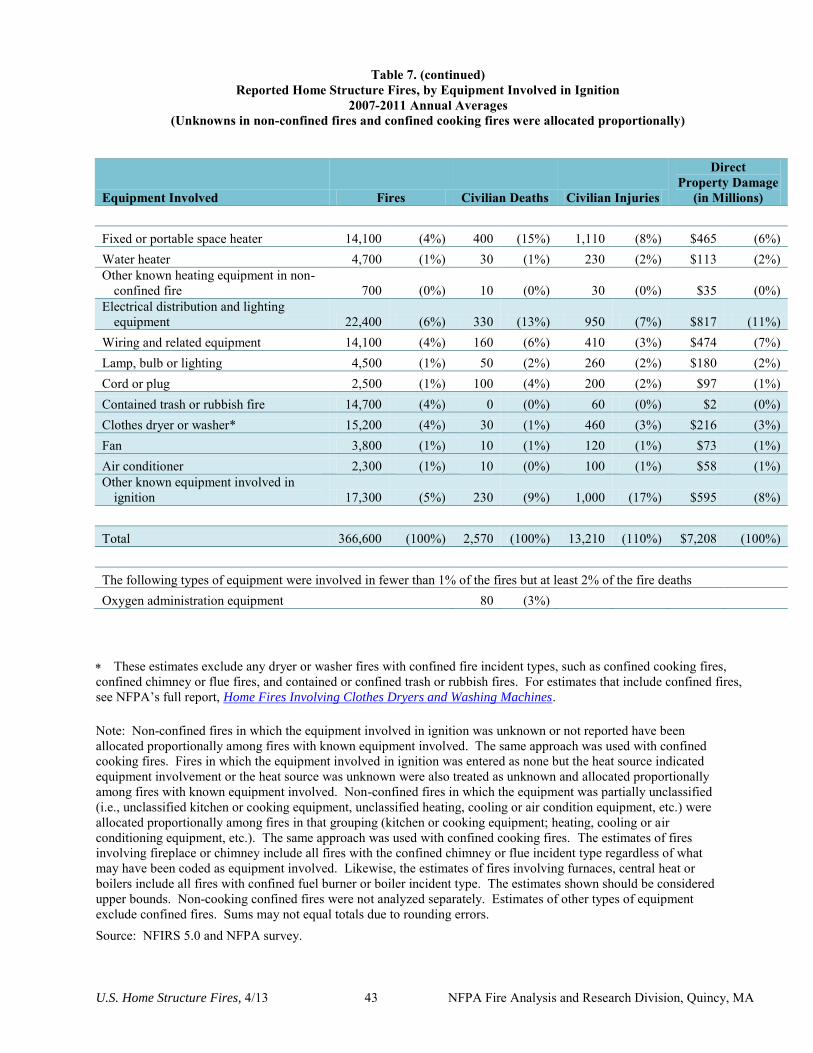
U.S. Home Structure Fires, 4/13 43 NFPA Fire Analysis and Research Division, Quincy, MA
Table 7. (continued) Reported Home Structure Fires, by Equipment Involved in Ignition
2007-2011 Annual Averages (Unknowns in non-confined fires and confined cooking fires were allocated proportionally)
Equipment Involved Fires Civilian Deaths Civilian Injuries
Direct Property Damage
(in Millions)
Fixed or portable space heater 14,100 (4%) 400 (15%) 1,110 (8%) $465 (6%) Water heater 4,700 (1%) 30 (1%) 230 (2%) $113 (2%) Other known heating equipment in non-
confined fire 700 (0%) 10 (0%) 30 (0%) $35 (0%) Electrical distribution and lighting
equipment 22,400 (6%) 330 (13%) 950 (7%) $817 (11%) Wiring and related equipment 14,100 (4%) 160 (6%) 410 (3%) $474 (7%) Lamp, bulb or lighting 4,500 (1%) 50 (2%) 260 (2%) $180 (2%) Cord or plug 2,500 (1%) 100 (4%) 200 (2%) $97 (1%) Contained trash or rubbish fire 14,700 (4%) 0 (0%) 60 (0%) $2 (0%) Clothes dryer or washer* 15,200 (4%) 30 (1%) 460 (3%) $216 (3%) Fan 3,800 (1%) 10 (1%) 120 (1%) $73 (1%) Air conditioner 2,300 (1%) 10 (0%) 100 (1%) $58 (1%) Other known equipment involved in
ignition 17,300 (5%) 230 (9%) 1,000 (17%) $595 (8%)
Total 366,600 (100%) 2,570 (100%) 13,210 (110%) $7,208 (100%)
The following types of equipment were involved in fewer than 1% of the fires but at least 2% of the fire deaths Oxygen administration equipment 80 (3%)
These estimates exclude any dryer or washer fires with confined fire incident types, such as confined cooking fires, confined chimney or flue fires, and contained or confined trash or rubbish fires. For estimates that include confined fires, see NFPA’s full report, Home Fires Involving Clothes Dryers and Washing Machines.
Note: Non-confined fires in which the equipment involved in ignition was unknown or not reported have been allocated proportionally among fires with known equipment involved. The same approach was used with confined cooking fires. Fires in which the equipment involved in ignition was entered as none but the heat source indicated equipment involvement or the heat source was unknown were also treated as unknown and allocated proportionally among fires with known equipment involved. Non-confined fires in which the equipment was partially unclassified (i.e., unclassified kitchen or cooking equipment, unclassified heating, cooling or air condition equipment, etc.) were allocated proportionally among fires in that grouping (kitchen or cooking equipment; heating, cooling or air conditioning equipment, etc.). The same approach was used with confined cooking fires. The estimates of fires involving fireplace or chimney include all fires with the confined chimney or flue incident type regardless of what may have been coded as equipment involved. Likewise, the estimates of fires involving furnaces, central heat or boilers include all fires with confined fuel burner or boiler incident type. The estimates shown should be considered upper bounds. Non-cooking confined fires were not analyzed separately. Estimates of other types of equipment exclude confined fires. Sums may not equal totals due to rounding errors.
Source: NFIRS 5.0 and NFPA survey.
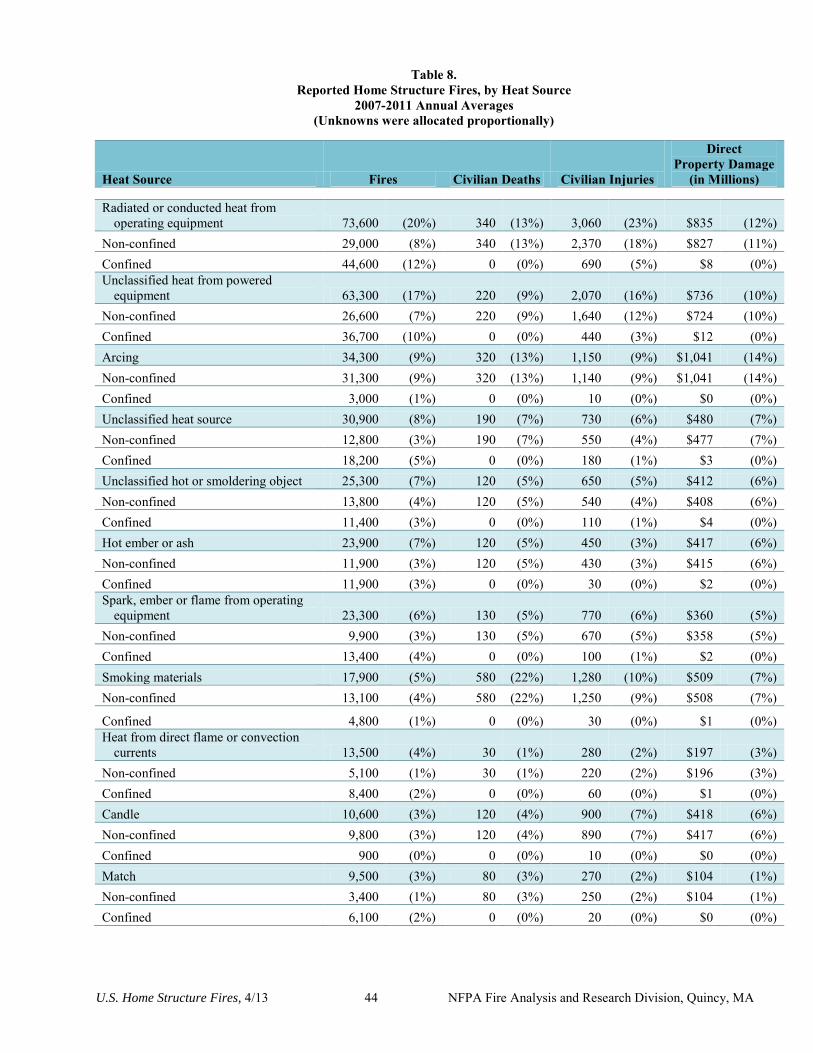
U.S. Home Structure Fires, 4/13 44 NFPA Fire Analysis and Research Division, Quincy, MA
Table 8. Reported Home Structure Fires, by Heat Source
2007-2011 Annual Averages (Unknowns were allocated proportionally)
Heat Source Fires Civilian Deaths Civilian Injuries
Direct Property Damage
(in Millions)
Radiated or conducted heat from operating equipment 73,600 (20%) 340 (13%) 3,060 (23%) $835 (12%)
Non-confined 29,000 (8%) 340 (13%) 2,370 (18%) $827 (11%) Confined 44,600 (12%) 0 (0%) 690 (5%) $8 (0%) Unclassified heat from powered
equipment 63,300 (17%) 220 (9%) 2,070 (16%) $736 (10%) Non-confined 26,600 (7%) 220 (9%) 1,640 (12%) $724 (10%) Confined 36,700 (10%) 0 (0%) 440 (3%) $12 (0%) Arcing 34,300 (9%) 320 (13%) 1,150 (9%) $1,041 (14%) Non-confined 31,300 (9%) 320 (13%) 1,140 (9%) $1,041 (14%) Confined 3,000 (1%) 0 (0%) 10 (0%) $0 (0%) Unclassified heat source 30,900 (8%) 190 (7%) 730 (6%) $480 (7%) Non-confined 12,800 (3%) 190 (7%) 550 (4%) $477 (7%) Confined 18,200 (5%) 0 (0%) 180 (1%) $3 (0%) Unclassified hot or smoldering object 25,300 (7%) 120 (5%) 650 (5%) $412 (6%) Non-confined 13,800 (4%) 120 (5%) 540 (4%) $408 (6%) Confined 11,400 (3%) 0 (0%) 110 (1%) $4 (0%) Hot ember or ash 23,900 (7%) 120 (5%) 450 (3%) $417 (6%) Non-confined 11,900 (3%) 120 (5%) 430 (3%) $415 (6%) Confined 11,900 (3%) 0 (0%) 30 (0%) $2 (0%) Spark, ember or flame from operating
equipment 23,300 (6%) 130 (5%) 770 (6%) $360 (5%) Non-confined 9,900 (3%) 130 (5%) 670 (5%) $358 (5%) Confined 13,400 (4%) 0 (0%) 100 (1%) $2 (0%) Smoking materials 17,900 (5%) 580 (22%) 1,280 (10%) $509 (7%) Non-confined 13,100 (4%) 580 (22%) 1,250 (9%) $508 (7%)
Confined 4,800 (1%) 0 (0%) 30 (0%) $1 (0%) Heat from direct flame or convection
currents 13,500 (4%) 30 (1%) 280 (2%) $197 (3%) Non-confined 5,100 (1%) 30 (1%) 220 (2%) $196 (3%) Confined 8,400 (2%) 0 (0%) 60 (0%) $1 (0%) Candle 10,600 (3%) 120 (4%) 900 (7%) $418 (6%) Non-confined 9,800 (3%) 120 (4%) 890 (7%) $417 (6%) Confined 900 (0%) 0 (0%) 10 (0%) $0 (0%) Match 9,500 (3%) 80 (3%) 270 (2%) $104 (1%) Non-confined 3,400 (1%) 80 (3%) 250 (2%) $104 (1%) Confined 6,100 (2%) 0 (0%) 20 (0%) $0 (0%)
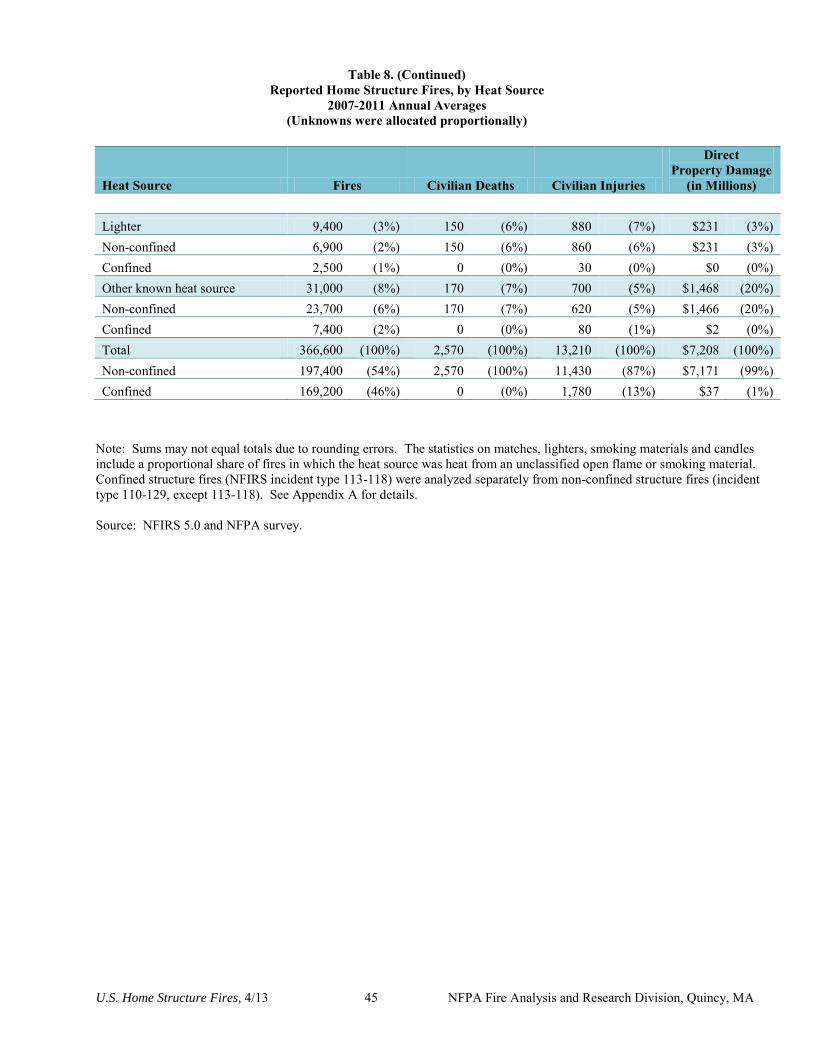
U.S. Home Structure Fires, 4/13 45 NFPA Fire Analysis and Research Division, Quincy, MA
Table 8. (Continued) Reported Home Structure Fires, by Heat Source
2007-2011 Annual Averages (Unknowns were allocated proportionally)
Heat Source Fires Civilian Deaths Civilian Injuries
Direct Property Damage
(in Millions)
Lighter 9,400 (3%) 150 (6%) 880 (7%) $231 (3%) Non-confined 6,900 (2%) 150 (6%) 860 (6%) $231 (3%) Confined 2,500 (1%) 0 (0%) 30 (0%) $0 (0%) Other known heat source 31,000 (8%) 170 (7%) 700 (5%) $1,468 (20%) Non-confined 23,700 (6%) 170 (7%) 620 (5%) $1,466 (20%) Confined 7,400 (2%) 0 (0%) 80 (1%) $2 (0%) Total 366,600 (100%) 2,570 (100%) 13,210 (100%) $7,208 (100%) Non-confined 197,400 (54%) 2,570 (100%) 11,430 (87%) $7,171 (99%) Confined 169,200 (46%) 0 (0%) 1,780 (13%) $37 (1%)
Note: Sums may not equal totals due to rounding errors. The statistics on matches, lighters, smoking materials and candles include a proportional share of fires in which the heat source was heat from an unclassified open flame or smoking material. Confined structure fires (NFIRS incident type 113-118) were analyzed separately from non-confined structure fires (incident type 110-129, except 113-118). See Appendix A for details. Source: NFIRS 5.0 and NFPA survey.
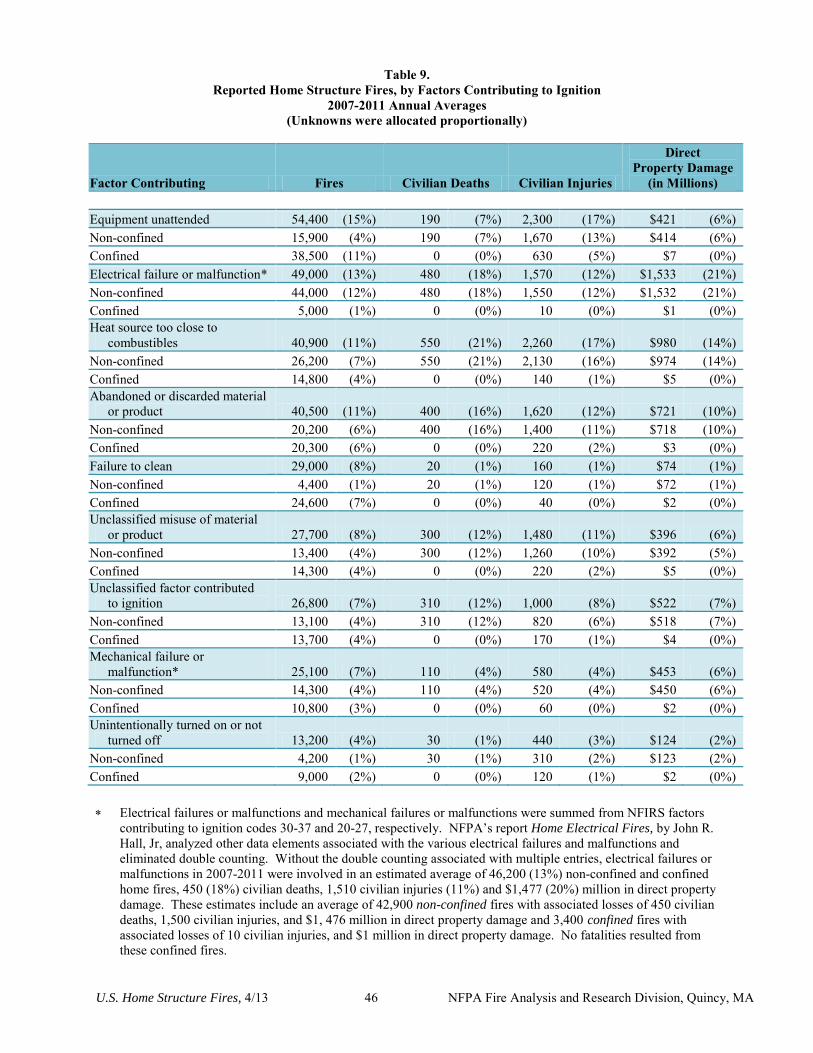
U.S. Home Structure Fires, 4/13 46 NFPA Fire Analysis and Research Division, Quincy, MA
Table 9. Reported Home Structure Fires, by Factors Contributing to Ignition
2007-2011 Annual Averages (Unknowns were allocated proportionally)
Factor Contributing Fires Civilian Deaths Civilian Injuries
Direct Property Damage
(in Millions)
Equipment unattended 54,400 (15%) 190 (7%) 2,300 (17%) $421 (6%) Non-confined 15,900 (4%) 190 (7%) 1,670 (13%) $414 (6%) Confined 38,500 (11%) 0 (0%) 630 (5%) $7 (0%) Electrical failure or malfunction* 49,000 (13%) 480 (18%) 1,570 (12%) $1,533 (21%) Non-confined 44,000 (12%) 480 (18%) 1,550 (12%) $1,532 (21%) Confined 5,000 (1%) 0 (0%) 10 (0%) $1 (0%) Heat source too close to
combustibles 40,900 (11%) 550 (21%) 2,260 (17%) $980 (14%) Non-confined 26,200 (7%) 550 (21%) 2,130 (16%) $974 (14%) Confined 14,800 (4%) 0 (0%) 140 (1%) $5 (0%) Abandoned or discarded material
or product 40,500 (11%) 400 (16%) 1,620 (12%) $721 (10%) Non-confined 20,200 (6%) 400 (16%) 1,400 (11%) $718 (10%) Confined 20,300 (6%) 0 (0%) 220 (2%) $3 (0%) Failure to clean 29,000 (8%) 20 (1%) 160 (1%) $74 (1%) Non-confined 4,400 (1%) 20 (1%) 120 (1%) $72 (1%) Confined 24,600 (7%) 0 (0%) 40 (0%) $2 (0%) Unclassified misuse of material
or product 27,700 (8%) 300 (12%) 1,480 (11%) $396 (6%) Non-confined 13,400 (4%) 300 (12%) 1,260 (10%) $392 (5%) Confined 14,300 (4%) 0 (0%) 220 (2%) $5 (0%) Unclassified factor contributed
to ignition 26,800 (7%) 310 (12%) 1,000 (8%) $522 (7%) Non-confined 13,100 (4%) 310 (12%) 820 (6%) $518 (7%) Confined 13,700 (4%) 0 (0%) 170 (1%) $4 (0%) Mechanical failure or
malfunction* 25,100 (7%) 110 (4%) 580 (4%) $453 (6%) Non-confined 14,300 (4%) 110 (4%) 520 (4%) $450 (6%) Confined 10,800 (3%) 0 (0%) 60 (0%) $2 (0%) Unintentionally turned on or not
turned off 13,200 (4%) 30 (1%) 440 (3%) $124 (2%) Non-confined 4,200 (1%) 30 (1%) 310 (2%) $123 (2%) Confined 9,000 (2%) 0 (0%) 120 (1%) $2 (0%) Electrical failures or malfunctions and mechanical failures or malfunctions were summed from NFIRS factors
contributing to ignition codes 30-37 and 20-27, respectively. NFPA’s report Home Electrical Fires, by John R. Hall, Jr, analyzed other data elements associated with the various electrical failures and malfunctions and eliminated double counting. Without the double counting associated with multiple entries, electrical failures or malfunctions in 2007-2011 were involved in an estimated average of 46,200 (13%) non-confined and confined home fires, 450 (18%) civilian deaths, 1,510 civilian injuries (11%) and $1,477 (20%) million in direct property damage. These estimates include an average of 42,900 non-confined fires with associated losses of 450 civilian deaths, 1,500 civilian injuries, and $1, 476 million in direct property damage and 3,400 confined fires with associated losses of 10 civilian injuries, and $1 million in direct property damage. No fatalities resulted from these confined fires.
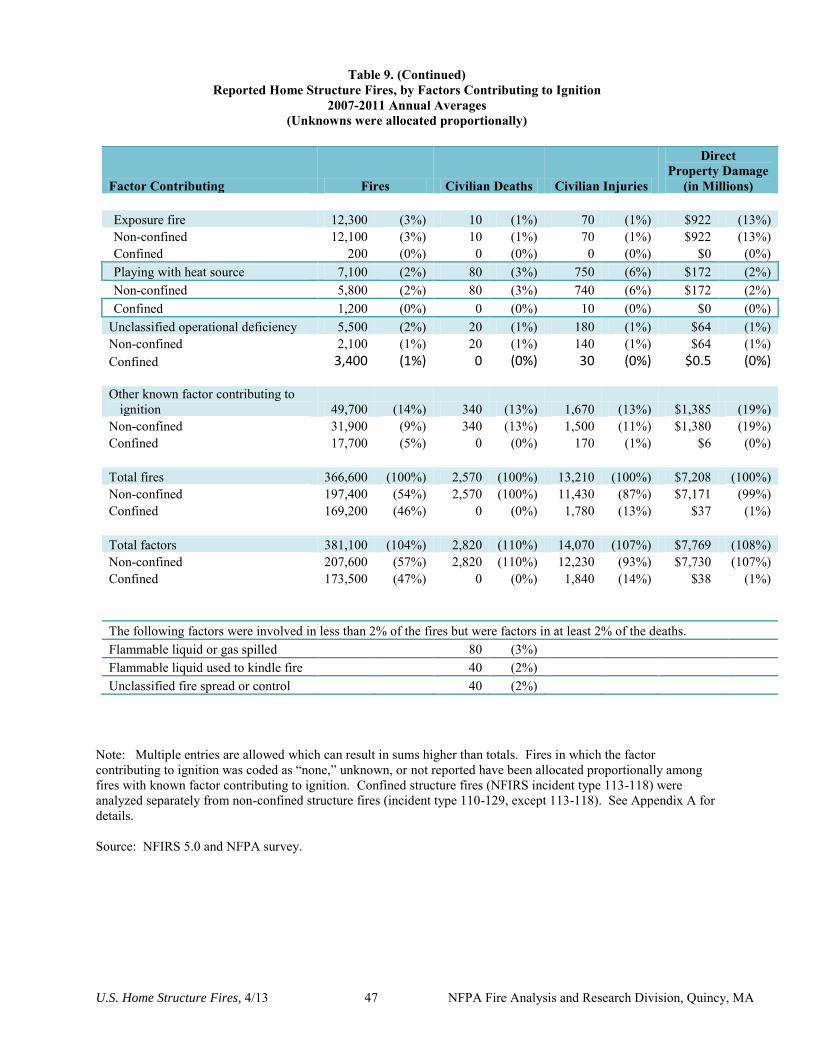
U.S. Home Structure Fires, 4/13 47 NFPA Fire Analysis and Research Division, Quincy, MA
Table 9. (Continued) Reported Home Structure Fires, by Factors Contributing to Ignition
2007-2011 Annual Averages (Unknowns were allocated proportionally)
Factor Contributing Fires Civilian Deaths Civilian Injuries
Direct Property Damage
(in Millions)
Exposure fire 12,300 (3%) 10 (1%) 70 (1%) $922 (13%) Non-confined 12,100 (3%) 10 (1%) 70 (1%) $922 (13%) Confined 200 (0%) 0 (0%) 0 (0%) $0 (0%) Playing with heat source 7,100 (2%) 80 (3%) 750 (6%) $172 (2%) Non-confined 5,800 (2%) 80 (3%) 740 (6%) $172 (2%) Confined 1,200 (0%) 0 (0%) 10 (0%) $0 (0%)
Unclassified operational deficiency 5,500 (2%) 20 (1%) 180 (1%) $64 (1%) Non-confined 2,100 (1%) 20 (1%) 140 (1%) $64 (1%) Confined 3,400 (1%) 0 (0%) 30 (0%) $0.5 (0%)
Other known factor contributing to ignition 49,700 (14%) 340 (13%) 1,670 (13%) $1,385 (19%)
Non-confined 31,900 (9%) 340 (13%) 1,500 (11%) $1,380 (19%) Confined 17,700 (5%) 0 (0%) 170 (1%) $6 (0%)
Total fires 366,600 (100%) 2,570 (100%) 13,210 (100%) $7,208 (100%) Non-confined 197,400 (54%) 2,570 (100%) 11,430 (87%) $7,171 (99%) Confined 169,200 (46%) 0 (0%) 1,780 (13%) $37 (1%)
Total factors 381,100 (104%) 2,820 (110%) 14,070 (107%) $7,769 (108%) Non-confined 207,600 (57%) 2,820 (110%) 12,230 (93%) $7,730 (107%) Confined 173,500 (47%) 0 (0%) 1,840 (14%) $38 (1%)
The following factors were involved in less than 2% of the fires but were factors in at least 2% of the deaths.
Flammable liquid or gas spilled
80 (3%) Flammable liquid used to kindle fire
40 (2%)
Unclassified fire spread or control 40 (2%)
Note: Multiple entries are allowed which can result in sums higher than totals. Fires in which the factor contributing to ignition was coded as “none,” unknown, or not reported have been allocated proportionally among fires with known factor contributing to ignition. Confined structure fires (NFIRS incident type 113-118) were analyzed separately from non-confined structure fires (incident type 110-129, except 113-118). See Appendix A for details. Source: NFIRS 5.0 and NFPA survey.
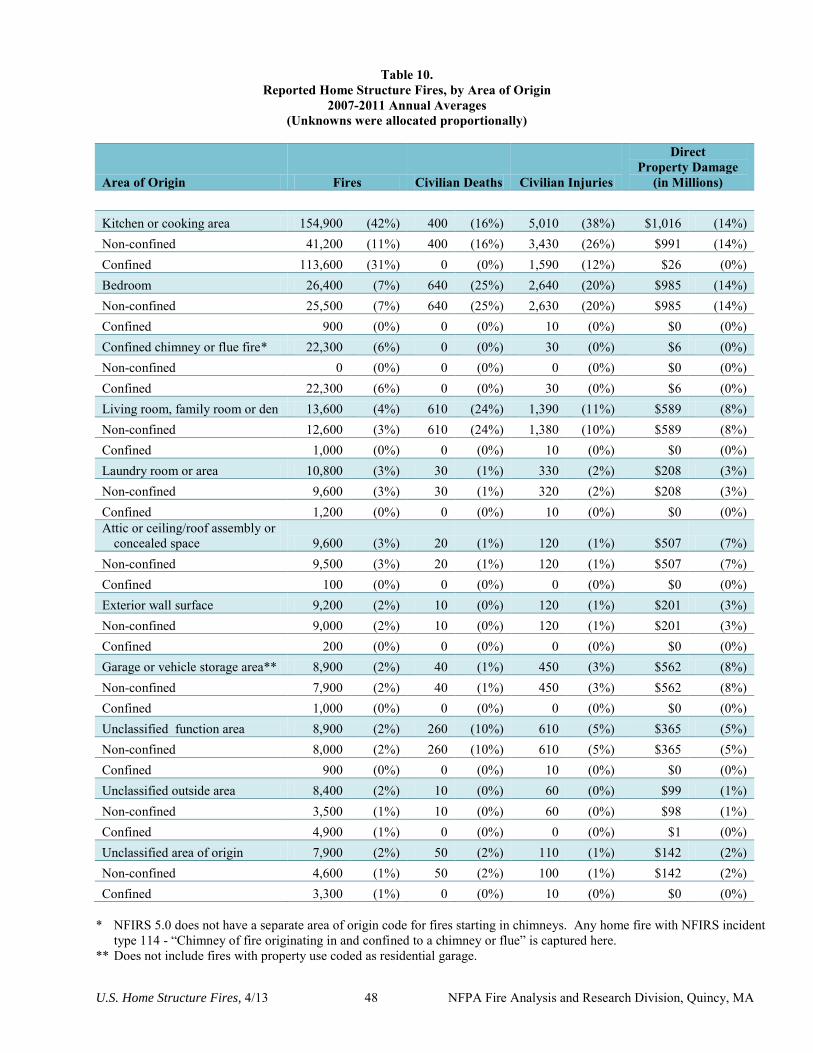
U.S. Home Structure Fires, 4/13 48 NFPA Fire Analysis and Research Division, Quincy, MA
Table 10. Reported Home Structure Fires, by Area of Origin
2007-2011 Annual Averages (Unknowns were allocated proportionally)
Area of Origin Fires Civilian Deaths Civilian Injuries
Direct Property Damage
(in Millions)
Kitchen or cooking area 154,900 (42%) 400 (16%) 5,010 (38%) $1,016 (14%) Non-confined 41,200 (11%) 400 (16%) 3,430 (26%) $991 (14%) Confined 113,600 (31%) 0 (0%) 1,590 (12%) $26 (0%) Bedroom 26,400 (7%) 640 (25%) 2,640 (20%) $985 (14%) Non-confined 25,500 (7%) 640 (25%) 2,630 (20%) $985 (14%) Confined 900 (0%) 0 (0%) 10 (0%) $0 (0%) Confined chimney or flue fire* 22,300 (6%) 0 (0%) 30 (0%) $6 (0%) Non-confined 0 (0%) 0 (0%) 0 (0%) $0 (0%) Confined 22,300 (6%) 0 (0%) 30 (0%) $6 (0%) Living room, family room or den 13,600 (4%) 610 (24%) 1,390 (11%) $589 (8%) Non-confined 12,600 (3%) 610 (24%) 1,380 (10%) $589 (8%) Confined 1,000 (0%) 0 (0%) 10 (0%) $0 (0%) Laundry room or area 10,800 (3%) 30 (1%) 330 (2%) $208 (3%) Non-confined 9,600 (3%) 30 (1%) 320 (2%) $208 (3%) Confined 1,200 (0%) 0 (0%) 10 (0%) $0 (0%) Attic or ceiling/roof assembly or
concealed space 9,600 (3%) 20 (1%) 120 (1%) $507 (7%) Non-confined 9,500 (3%) 20 (1%) 120 (1%) $507 (7%) Confined 100 (0%) 0 (0%) 0 (0%) $0 (0%) Exterior wall surface 9,200 (2%) 10 (0%) 120 (1%) $201 (3%) Non-confined 9,000 (2%) 10 (0%) 120 (1%) $201 (3%) Confined 200 (0%) 0 (0%) 0 (0%) $0 (0%) Garage or vehicle storage area** 8,900 (2%) 40 (1%) 450 (3%) $562 (8%) Non-confined 7,900 (2%) 40 (1%) 450 (3%) $562 (8%) Confined 1,000 (0%) 0 (0%) 0 (0%) $0 (0%) Unclassified function area 8,900 (2%) 260 (10%) 610 (5%) $365 (5%) Non-confined 8,000 (2%) 260 (10%) 610 (5%) $365 (5%) Confined 900 (0%) 0 (0%) 10 (0%) $0 (0%) Unclassified outside area 8,400 (2%) 10 (0%) 60 (0%) $99 (1%) Non-confined 3,500 (1%) 10 (0%) 60 (0%) $98 (1%) Confined 4,900 (1%) 0 (0%) 0 (0%) $1 (0%) Unclassified area of origin 7,900 (2%) 50 (2%) 110 (1%) $142 (2%) Non-confined 4,600 (1%) 50 (2%) 100 (1%) $142 (2%) Confined 3,300 (1%) 0 (0%) 10 (0%) $0 (0%)
* NFIRS 5.0 does not have a separate area of origin code for fires starting in chimneys. Any home fire with NFIRS incident
type 114 - “Chimney of fire originating in and confined to a chimney or flue” is captured here. ** Does not include fires with property use coded as residential garage.
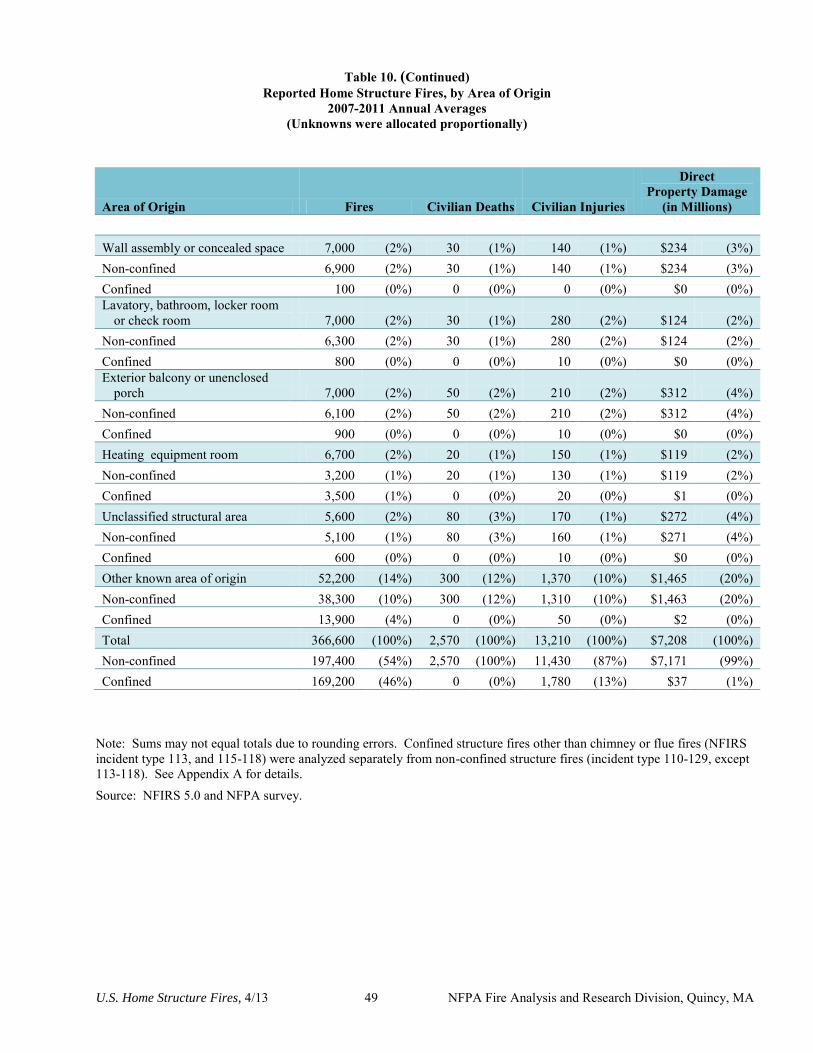
U.S. Home Structure Fires, 4/13 49 NFPA Fire Analysis and Research Division, Quincy, MA
Table 10. (Continued) Reported Home Structure Fires, by Area of Origin
2007-2011 Annual Averages (Unknowns were allocated proportionally)
Area of Origin Fires Civilian Deaths Civilian Injuries
Direct Property Damage
(in Millions)
Wall assembly or concealed space 7,000 (2%) 30 (1%) 140 (1%) $234 (3%) Non-confined 6,900 (2%) 30 (1%) 140 (1%) $234 (3%) Confined 100 (0%) 0 (0%) 0 (0%) $0 (0%) Lavatory, bathroom, locker room
or check room 7,000 (2%) 30 (1%) 280 (2%) $124 (2%) Non-confined 6,300 (2%) 30 (1%) 280 (2%) $124 (2%) Confined 800 (0%) 0 (0%) 10 (0%) $0 (0%) Exterior balcony or unenclosed
porch 7,000 (2%) 50 (2%) 210 (2%) $312 (4%) Non-confined 6,100 (2%) 50 (2%) 210 (2%) $312 (4%) Confined 900 (0%) 0 (0%) 10 (0%) $0 (0%) Heating equipment room 6,700 (2%) 20 (1%) 150 (1%) $119 (2%) Non-confined 3,200 (1%) 20 (1%) 130 (1%) $119 (2%) Confined 3,500 (1%) 0 (0%) 20 (0%) $1 (0%) Unclassified structural area 5,600 (2%) 80 (3%) 170 (1%) $272 (4%) Non-confined 5,100 (1%) 80 (3%) 160 (1%) $271 (4%) Confined 600 (0%) 0 (0%) 10 (0%) $0 (0%) Other known area of origin 52,200 (14%) 300 (12%) 1,370 (10%) $1,465 (20%) Non-confined 38,300 (10%) 300 (12%) 1,310 (10%) $1,463 (20%) Confined 13,900 (4%) 0 (0%) 50 (0%) $2 (0%) Total 366,600 (100%) 2,570 (100%) 13,210 (100%) $7,208 (100%) Non-confined 197,400 (54%) 2,570 (100%) 11,430 (87%) $7,171 (99%) Confined 169,200 (46%) 0 (0%) 1,780 (13%) $37 (1%)
Note: Sums may not equal totals due to rounding errors. Confined structure fires other than chimney or flue fires (NFIRS incident type 113, and 115-118) were analyzed separately from non-confined structure fires (incident type 110-129, except 113-118). See Appendix A for details.
Source: NFIRS 5.0 and NFPA survey.
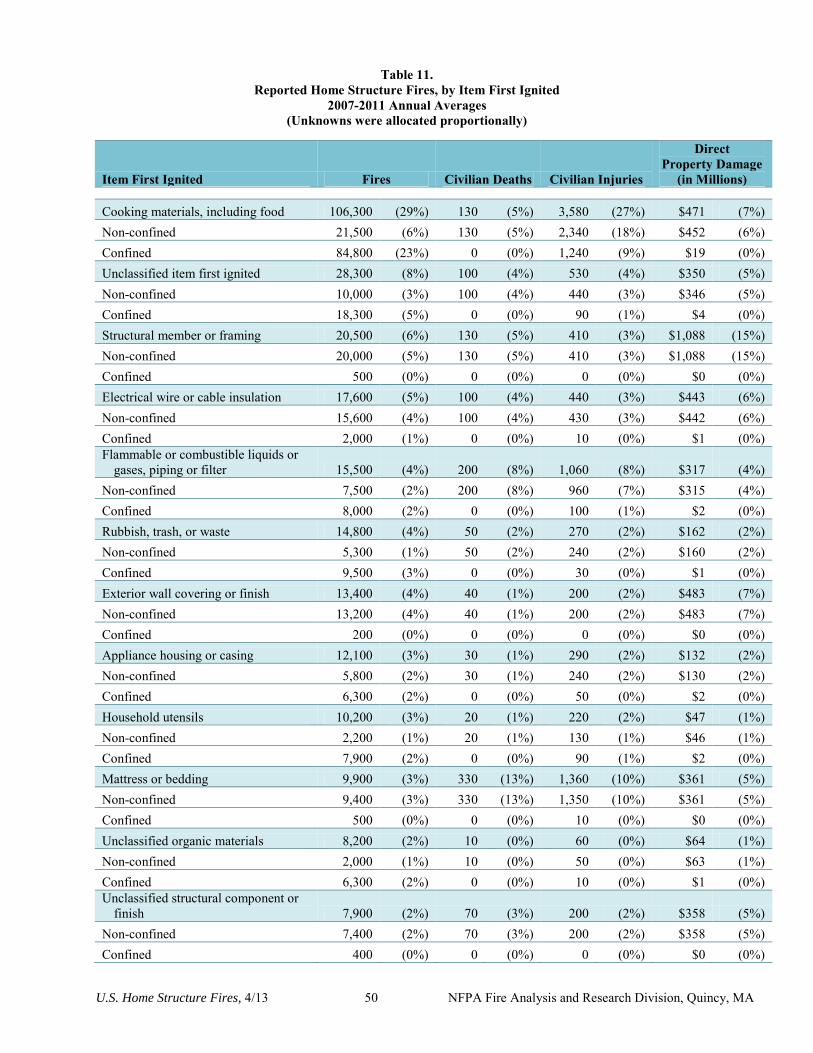
U.S. Home Structure Fires, 4/13 50 NFPA Fire Analysis and Research Division, Quincy, MA
Table 11. Reported Home Structure Fires, by Item First Ignited
2007-2011 Annual Averages (Unknowns were allocated proportionally)
Item First Ignited Fires Civilian Deaths Civilian Injuries
Direct Property Damage
(in Millions)
Cooking materials, including food 106,300 (29%) 130 (5%) 3,580 (27%) $471 (7%) Non-confined 21,500 (6%) 130 (5%) 2,340 (18%) $452 (6%) Confined 84,800 (23%) 0 (0%) 1,240 (9%) $19 (0%) Unclassified item first ignited 28,300 (8%) 100 (4%) 530 (4%) $350 (5%) Non-confined 10,000 (3%) 100 (4%) 440 (3%) $346 (5%) Confined 18,300 (5%) 0 (0%) 90 (1%) $4 (0%) Structural member or framing 20,500 (6%) 130 (5%) 410 (3%) $1,088 (15%) Non-confined 20,000 (5%) 130 (5%) 410 (3%) $1,088 (15%) Confined 500 (0%) 0 (0%) 0 (0%) $0 (0%) Electrical wire or cable insulation 17,600 (5%) 100 (4%) 440 (3%) $443 (6%) Non-confined 15,600 (4%) 100 (4%) 430 (3%) $442 (6%) Confined 2,000 (1%) 0 (0%) 10 (0%) $1 (0%) Flammable or combustible liquids or
gases, piping or filter 15,500 (4%) 200 (8%) 1,060 (8%) $317 (4%) Non-confined 7,500 (2%) 200 (8%) 960 (7%) $315 (4%) Confined 8,000 (2%) 0 (0%) 100 (1%) $2 (0%) Rubbish, trash, or waste 14,800 (4%) 50 (2%) 270 (2%) $162 (2%) Non-confined 5,300 (1%) 50 (2%) 240 (2%) $160 (2%) Confined 9,500 (3%) 0 (0%) 30 (0%) $1 (0%) Exterior wall covering or finish 13,400 (4%) 40 (1%) 200 (2%) $483 (7%) Non-confined 13,200 (4%) 40 (1%) 200 (2%) $483 (7%) Confined 200 (0%) 0 (0%) 0 (0%) $0 (0%) Appliance housing or casing 12,100 (3%) 30 (1%) 290 (2%) $132 (2%) Non-confined 5,800 (2%) 30 (1%) 240 (2%) $130 (2%) Confined 6,300 (2%) 0 (0%) 50 (0%) $2 (0%) Household utensils 10,200 (3%) 20 (1%) 220 (2%) $47 (1%) Non-confined 2,200 (1%) 20 (1%) 130 (1%) $46 (1%) Confined 7,900 (2%) 0 (0%) 90 (1%) $2 (0%) Mattress or bedding 9,900 (3%) 330 (13%) 1,360 (10%) $361 (5%) Non-confined 9,400 (3%) 330 (13%) 1,350 (10%) $361 (5%) Confined 500 (0%) 0 (0%) 10 (0%) $0 (0%) Unclassified organic materials 8,200 (2%) 10 (0%) 60 (0%) $64 (1%) Non-confined 2,000 (1%) 10 (0%) 50 (0%) $63 (1%) Confined 6,300 (2%) 0 (0%) 10 (0%) $1 (0%) Unclassified structural component or
finish 7,900 (2%) 70 (3%) 200 (2%) $358 (5%) Non-confined 7,400 (2%) 70 (3%) 200 (2%) $358 (5%) Confined 400 (0%) 0 (0%) 0 (0%) $0 (0%)
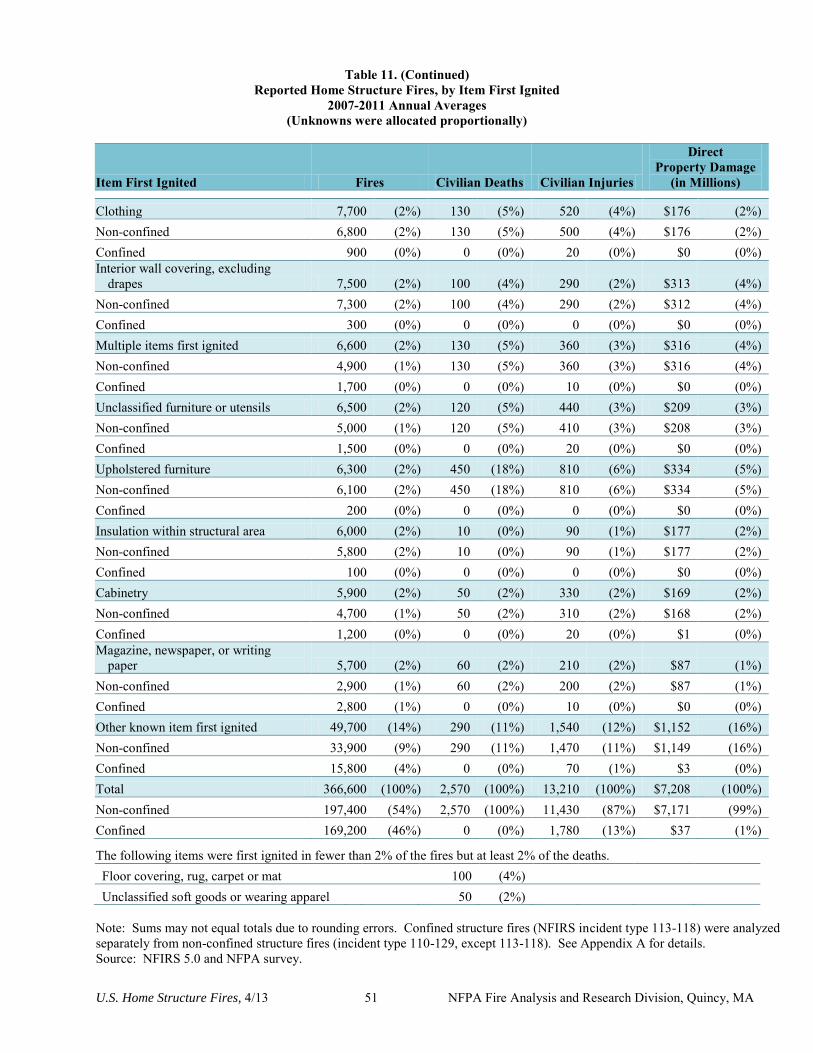
U.S. Home Structure Fires, 4/13 51 NFPA Fire Analysis and Research Division, Quincy, MA
Table 11. (Continued) Reported Home Structure Fires, by Item First Ignited
2007-2011 Annual Averages (Unknowns were allocated proportionally)
Item First Ignited Fires Civilian Deaths Civilian Injuries
Direct Property Damage
(in Millions)
Clothing 7,700 (2%) 130 (5%) 520 (4%) $176 (2%) Non-confined 6,800 (2%) 130 (5%) 500 (4%) $176 (2%) Confined 900 (0%) 0 (0%) 20 (0%) $0 (0%) Interior wall covering, excluding
drapes 7,500 (2%) 100 (4%) 290 (2%) $313 (4%) Non-confined 7,300 (2%) 100 (4%) 290 (2%) $312 (4%) Confined 300 (0%) 0 (0%) 0 (0%) $0 (0%) Multiple items first ignited 6,600 (2%) 130 (5%) 360 (3%) $316 (4%) Non-confined 4,900 (1%) 130 (5%) 360 (3%) $316 (4%) Confined 1,700 (0%) 0 (0%) 10 (0%) $0 (0%) Unclassified furniture or utensils 6,500 (2%) 120 (5%) 440 (3%) $209 (3%) Non-confined 5,000 (1%) 120 (5%) 410 (3%) $208 (3%) Confined 1,500 (0%) 0 (0%) 20 (0%) $0 (0%) Upholstered furniture 6,300 (2%) 450 (18%) 810 (6%) $334 (5%) Non-confined 6,100 (2%) 450 (18%) 810 (6%) $334 (5%) Confined 200 (0%) 0 (0%) 0 (0%) $0 (0%) Insulation within structural area 6,000 (2%) 10 (0%) 90 (1%) $177 (2%) Non-confined 5,800 (2%) 10 (0%) 90 (1%) $177 (2%) Confined 100 (0%) 0 (0%) 0 (0%) $0 (0%) Cabinetry 5,900 (2%) 50 (2%) 330 (2%) $169 (2%) Non-confined 4,700 (1%) 50 (2%) 310 (2%) $168 (2%) Confined 1,200 (0%) 0 (0%) 20 (0%) $1 (0%) Magazine, newspaper, or writing
paper 5,700 (2%) 60 (2%) 210 (2%) $87 (1%) Non-confined 2,900 (1%) 60 (2%) 200 (2%) $87 (1%) Confined 2,800 (1%) 0 (0%) 10 (0%) $0 (0%) Other known item first ignited 49,700 (14%) 290 (11%) 1,540 (12%) $1,152 (16%) Non-confined 33,900 (9%) 290 (11%) 1,470 (11%) $1,149 (16%) Confined 15,800 (4%) 0 (0%) 70 (1%) $3 (0%) Total 366,600 (100%) 2,570 (100%) 13,210 (100%) $7,208 (100%) Non-confined 197,400 (54%) 2,570 (100%) 11,430 (87%) $7,171 (99%) Confined 169,200 (46%) 0 (0%) 1,780 (13%) $37 (1%)
The following items were first ignited in fewer than 2% of the fires but at least 2% of the deaths. Floor covering, rug, carpet or mat
100 (4%)
Unclassified soft goods or wearing apparel 50 (2%) Note: Sums may not equal totals due to rounding errors. Confined structure fires (NFIRS incident type 113-118) were analyzed separately from non-confined structure fires (incident type 110-129, except 113-118). See Appendix A for details. Source: NFIRS 5.0 and NFPA survey.
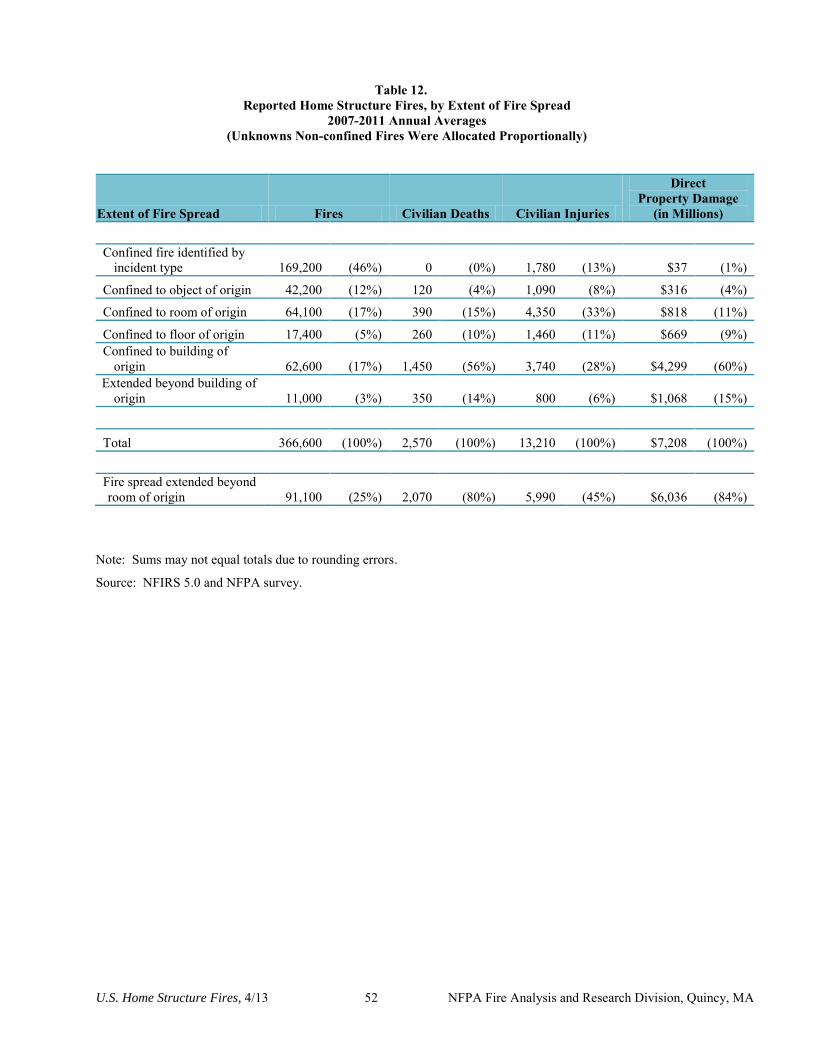
U.S. Home Structure Fires, 4/13 52 NFPA Fire Analysis and Research Division, Quincy, MA
Table 12.
Reported Home Structure Fires, by Extent of Fire Spread 2007-2011 Annual Averages
(Unknowns Non-confined Fires Were Allocated Proportionally)
Extent of Fire Spread Fires Civilian Deaths Civilian Injuries
Direct Property Damage
(in Millions) Confined fire identified by
incident type 169,200 (46%) 0 (0%) 1,780 (13%) $37 (1%)
Confined to object of origin 42,200 (12%) 120 (4%) 1,090 (8%) $316 (4%)
Confined to room of origin 64,100 (17%) 390 (15%) 4,350 (33%) $818 (11%)
Confined to floor of origin 17,400 (5%) 260 (10%) 1,460 (11%) $669 (9%) Confined to building of
origin 62,600 (17%) 1,450 (56%) 3,740 (28%) $4,299 (60%) Extended beyond building of
origin 11,000 (3%) 350 (14%) 800 (6%) $1,068 (15%)
Total 366,600 (100%) 2,570 (100%) 13,210 (100%) $7,208 (100%)
Fire spread extended beyond room of origin 91,100 (25%) 2,070 (80%) 5,990 (45%) $6,036 (84%)
Note: Sums may not equal totals due to rounding errors.
Source: NFIRS 5.0 and NFPA survey.
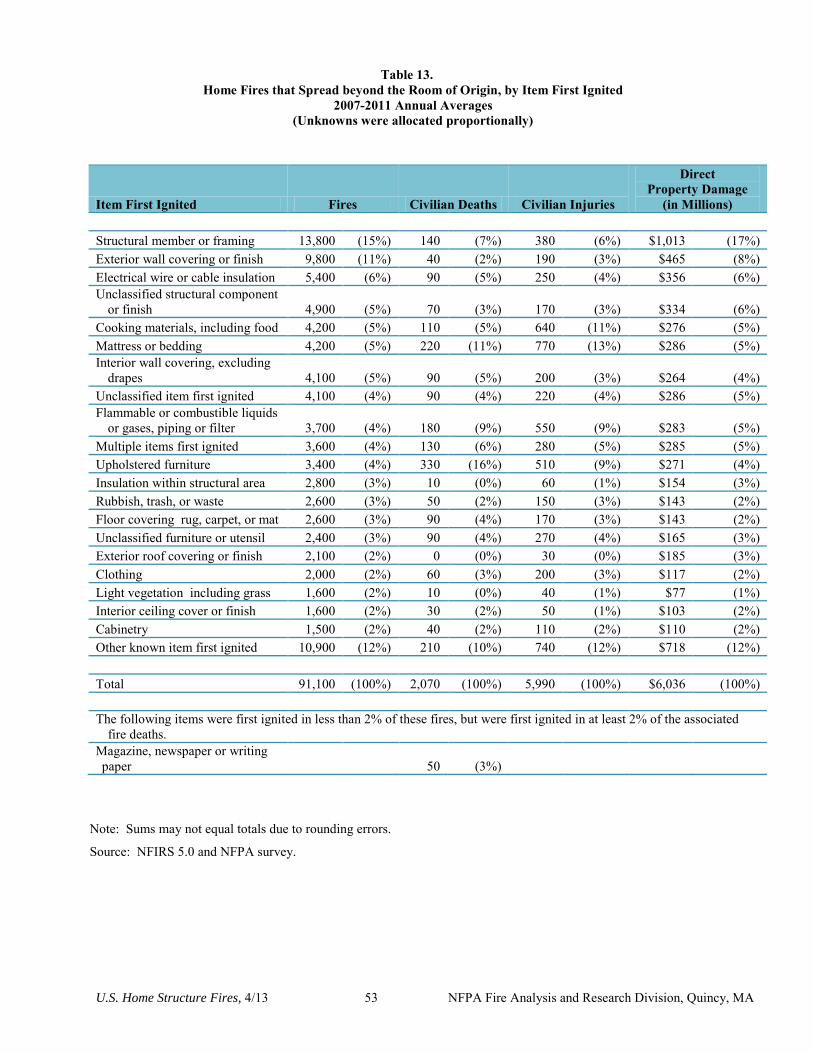
U.S. Home Structure Fires, 4/13 53 NFPA Fire Analysis and Research Division, Quincy, MA
Table 13. Home Fires that Spread beyond the Room of Origin, by Item First Ignited
2007-2011 Annual Averages (Unknowns were allocated proportionally)
Item First Ignited Fires Civilian Deaths Civilian Injuries
Direct Property Damage
(in Millions)
Structural member or framing 13,800 (15%) 140 (7%) 380 (6%) $1,013 (17%) Exterior wall covering or finish 9,800 (11%) 40 (2%) 190 (3%) $465 (8%) Electrical wire or cable insulation 5,400 (6%) 90 (5%) 250 (4%) $356 (6%) Unclassified structural component
or finish 4,900 (5%) 70 (3%) 170 (3%) $334 (6%) Cooking materials, including food 4,200 (5%) 110 (5%) 640 (11%) $276 (5%) Mattress or bedding 4,200 (5%) 220 (11%) 770 (13%) $286 (5%) Interior wall covering, excluding
drapes 4,100 (5%) 90 (5%) 200 (3%) $264 (4%) Unclassified item first ignited 4,100 (4%) 90 (4%) 220 (4%) $286 (5%) Flammable or combustible liquids
or gases, piping or filter 3,700 (4%) 180 (9%) 550 (9%) $283 (5%) Multiple items first ignited 3,600 (4%) 130 (6%) 280 (5%) $285 (5%) Upholstered furniture 3,400 (4%) 330 (16%) 510 (9%) $271 (4%) Insulation within structural area 2,800 (3%) 10 (0%) 60 (1%) $154 (3%) Rubbish, trash, or waste 2,600 (3%) 50 (2%) 150 (3%) $143 (2%) Floor covering rug, carpet, or mat 2,600 (3%) 90 (4%) 170 (3%) $143 (2%) Unclassified furniture or utensil 2,400 (3%) 90 (4%) 270 (4%) $165 (3%) Exterior roof covering or finish 2,100 (2%) 0 (0%) 30 (0%) $185 (3%) Clothing 2,000 (2%) 60 (3%) 200 (3%) $117 (2%) Light vegetation including grass 1,600 (2%) 10 (0%) 40 (1%) $77 (1%) Interior ceiling cover or finish 1,600 (2%) 30 (2%) 50 (1%) $103 (2%) Cabinetry 1,500 (2%) 40 (2%) 110 (2%) $110 (2%) Other known item first ignited 10,900 (12%) 210 (10%) 740 (12%) $718 (12%)
Total 91,100 (100%) 2,070 (100%) 5,990 (100%) $6,036 (100%)
The following items were first ignited in less than 2% of these fires, but were first ignited in at least 2% of the associated fire deaths.
Magazine, newspaper or writing paper
50 (3%)
Note: Sums may not equal totals due to rounding errors.
Source: NFIRS 5.0 and NFPA survey.
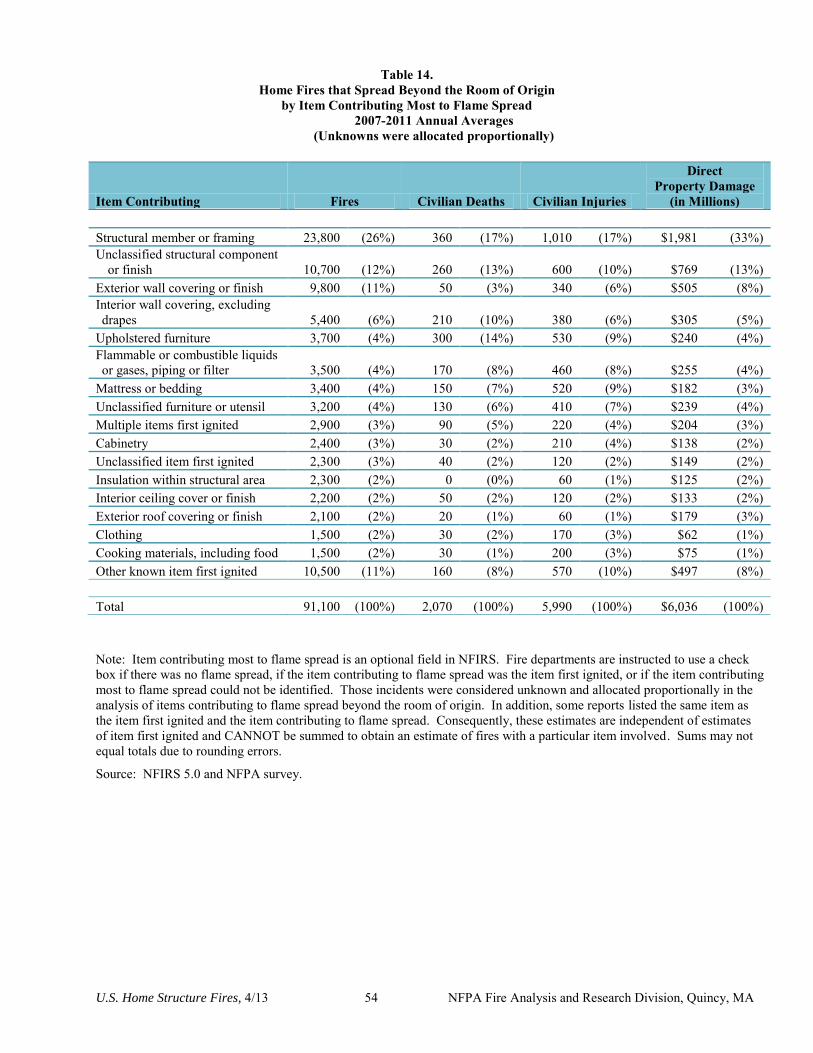
U.S. Home Structure Fires, 4/13 54 NFPA Fire Analysis and Research Division, Quincy, MA
Table 14. Home Fires that Spread Beyond the Room of Origin
by Item Contributing Most to Flame Spread 2007-2011 Annual Averages
(Unknowns were allocated proportionally)
Item Contributing Fires Civilian Deaths Civilian Injuries
Direct Property Damage
(in Millions)
Structural member or framing 23,800 (26%) 360 (17%) 1,010 (17%) $1,981 (33%) Unclassified structural component
or finish 10,700 (12%) 260 (13%) 600 (10%) $769 (13%) Exterior wall covering or finish 9,800 (11%) 50 (3%) 340 (6%) $505 (8%) Interior wall covering, excluding drapes 5,400 (6%) 210 (10%) 380 (6%) $305 (5%)
Upholstered furniture 3,700 (4%) 300 (14%) 530 (9%) $240 (4%) Flammable or combustible liquids or gases, piping or filter 3,500 (4%) 170 (8%) 460 (8%) $255 (4%)
Mattress or bedding 3,400 (4%) 150 (7%) 520 (9%) $182 (3%) Unclassified furniture or utensil 3,200 (4%) 130 (6%) 410 (7%) $239 (4%) Multiple items first ignited 2,900 (3%) 90 (5%) 220 (4%) $204 (3%) Cabinetry 2,400 (3%) 30 (2%) 210 (4%) $138 (2%) Unclassified item first ignited 2,300 (3%) 40 (2%) 120 (2%) $149 (2%) Insulation within structural area 2,300 (2%) 0 (0%) 60 (1%) $125 (2%) Interior ceiling cover or finish 2,200 (2%) 50 (2%) 120 (2%) $133 (2%) Exterior roof covering or finish 2,100 (2%) 20 (1%) 60 (1%) $179 (3%) Clothing 1,500 (2%) 30 (2%) 170 (3%) $62 (1%) Cooking materials, including food 1,500 (2%) 30 (1%) 200 (3%) $75 (1%) Other known item first ignited 10,500 (11%) 160 (8%) 570 (10%) $497 (8%)
Total 91,100 (100%) 2,070 (100%) 5,990 (100%) $6,036 (100%)
Note: Item contributing most to flame spread is an optional field in NFIRS. Fire departments are instructed to use a check box if there was no flame spread, if the item contributing to flame spread was the item first ignited, or if the item contributing most to flame spread could not be identified. Those incidents were considered unknown and allocated proportionally in the analysis of items contributing to flame spread beyond the room of origin. In addition, some reports listed the same item as the item first ignited and the item contributing to flame spread. Consequently, these estimates are independent of estimates of item first ignited and CANNOT be summed to obtain an estimate of fires with a particular item involved. Sums may not equal totals due to rounding errors.
Source: NFIRS 5.0 and NFPA survey.
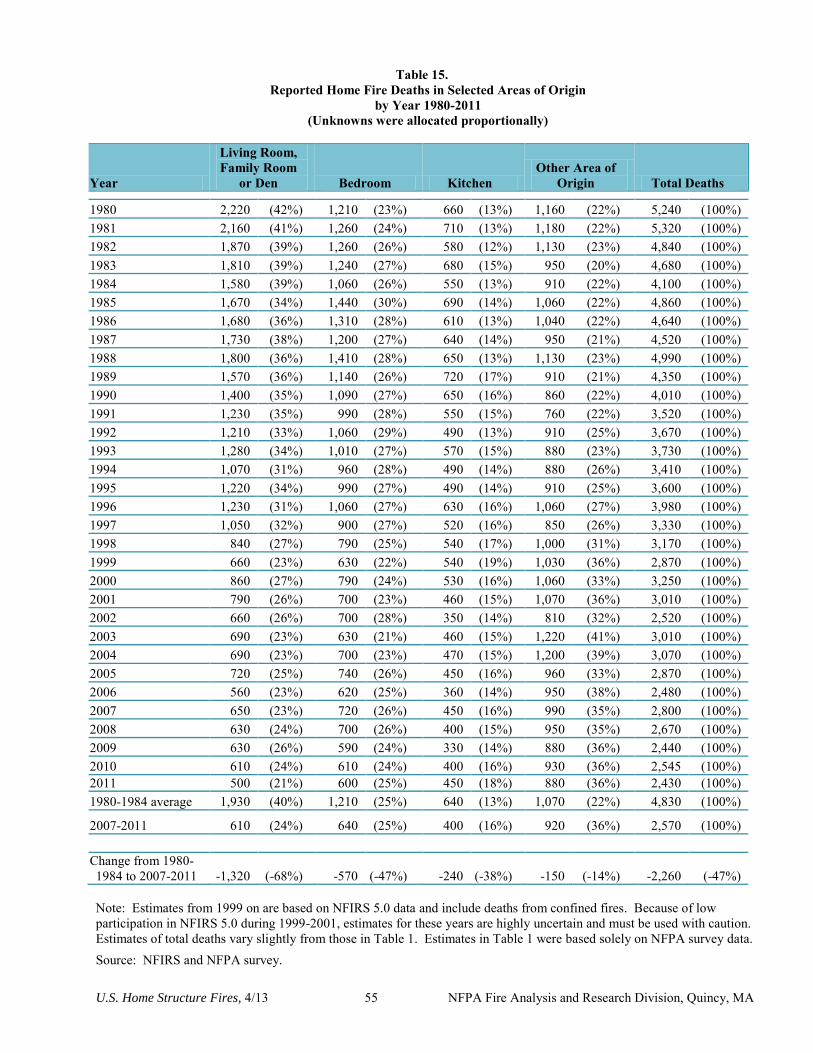
U.S. Home Structure Fires, 4/13 55 NFPA Fire Analysis and Research Division, Quincy, MA
Table 15. Reported Home Fire Deaths in Selected Areas of Origin
by Year 1980-2011 (Unknowns were allocated proportionally)
Year
Living Room, Family Room
or Den Bedroom Kitchen Other Area of
Origin Total Deaths
1980 2,220 (42%) 1,210 (23%) 660 (13%) 1,160 (22%) 5,240 (100%) 1981 2,160 (41%) 1,260 (24%) 710 (13%) 1,180 (22%) 5,320 (100%) 1982 1,870 (39%) 1,260 (26%) 580 (12%) 1,130 (23%) 4,840 (100%) 1983 1,810 (39%) 1,240 (27%) 680 (15%) 950 (20%) 4,680 (100%) 1984 1,580 (39%) 1,060 (26%) 550 (13%) 910 (22%) 4,100 (100%) 1985 1,670 (34%) 1,440 (30%) 690 (14%) 1,060 (22%) 4,860 (100%) 1986 1,680 (36%) 1,310 (28%) 610 (13%) 1,040 (22%) 4,640 (100%) 1987 1,730 (38%) 1,200 (27%) 640 (14%) 950 (21%) 4,520 (100%) 1988 1,800 (36%) 1,410 (28%) 650 (13%) 1,130 (23%) 4,990 (100%) 1989 1,570 (36%) 1,140 (26%) 720 (17%) 910 (21%) 4,350 (100%) 1990 1,400 (35%) 1,090 (27%) 650 (16%) 860 (22%) 4,010 (100%) 1991 1,230 (35%) 990 (28%) 550 (15%) 760 (22%) 3,520 (100%) 1992 1,210 (33%) 1,060 (29%) 490 (13%) 910 (25%) 3,670 (100%) 1993 1,280 (34%) 1,010 (27%) 570 (15%) 880 (23%) 3,730 (100%) 1994 1,070 (31%) 960 (28%) 490 (14%) 880 (26%) 3,410 (100%) 1995 1,220 (34%) 990 (27%) 490 (14%) 910 (25%) 3,600 (100%) 1996 1,230 (31%) 1,060 (27%) 630 (16%) 1,060 (27%) 3,980 (100%) 1997 1,050 (32%) 900 (27%) 520 (16%) 850 (26%) 3,330 (100%) 1998 840 (27%) 790 (25%) 540 (17%) 1,000 (31%) 3,170 (100%) 1999 660 (23%) 630 (22%) 540 (19%) 1,030 (36%) 2,870 (100%) 2000 860 (27%) 790 (24%) 530 (16%) 1,060 (33%) 3,250 (100%) 2001 790 (26%) 700 (23%) 460 (15%) 1,070 (36%) 3,010 (100%) 2002 660 (26%) 700 (28%) 350 (14%) 810 (32%) 2,520 (100%) 2003 690 (23%) 630 (21%) 460 (15%) 1,220 (41%) 3,010 (100%) 2004 690 (23%) 700 (23%) 470 (15%) 1,200 (39%) 3,070 (100%) 2005 720 (25%) 740 (26%) 450 (16%) 960 (33%) 2,870 (100%) 2006 560 (23%) 620 (25%) 360 (14%) 950 (38%) 2,480 (100%) 2007 650 (23%) 720 (26%) 450 (16%) 990 (35%) 2,800 (100%) 2008 630 (24%) 700 (26%) 400 (15%) 950 (35%) 2,670 (100%) 2009 630 (26%) 590 (24%) 330 (14%) 880 (36%) 2,440 (100%) 2010 610 (24%) 610 (24%) 400 (16%) 930 (36%) 2,545 (100%) 2011 500 (21%) 600 (25%) 450 (18%) 880 (36%) 2,430 (100%) 1980-1984 average 1,930 (40%) 1,210 (25%) 640 (13%) 1,070 (22%) 4,830 (100%)
2007-2011 610 (24%) 640 (25%) 400 (16%) 920 (36%) 2,570 (100%)
Change from 1980-1984 to 2007-2011 -1,320 (-68%) -570 (-47%) -240 (-38%) -150 (-14%) -2,260 (-47%) Note: Estimates from 1999 on are based on NFIRS 5.0 data and include deaths from confined fires. Because of low participation in NFIRS 5.0 during 1999-2001, estimates for these years are highly uncertain and must be used with caution. Estimates of total deaths vary slightly from those in Table 1. Estimates in Table 1 were based solely on NFPA survey data.
Source: NFIRS and NFPA survey.
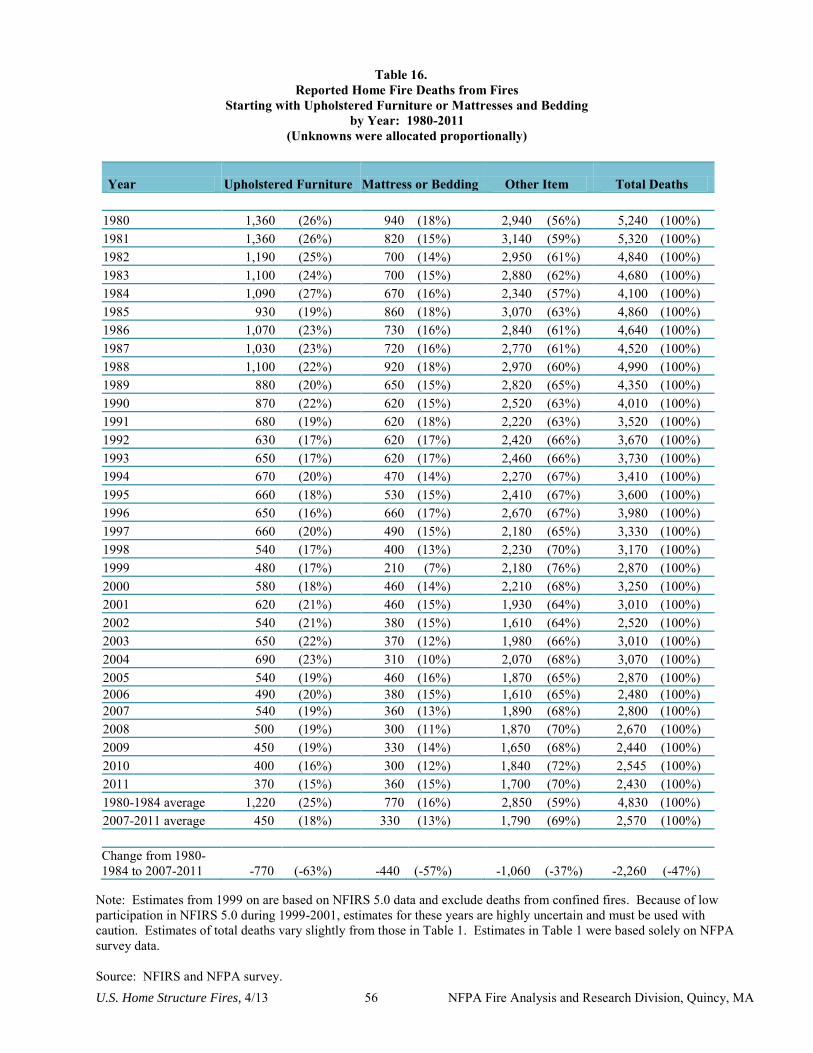
U.S. Home Structure Fires, 4/13 56 NFPA Fire Analysis and Research Division, Quincy, MA
Table 16. Reported Home Fire Deaths from Fires
Starting with Upholstered Furniture or Mattresses and Bedding by Year: 1980-2011
(Unknowns were allocated proportionally)
Year Upholstered Furniture Mattress or Bedding Other Item Total Deaths
1980 1,360 (26%) 940 (18%) 2,940 (56%) 5,240 (100%) 1981 1,360 (26%) 820 (15%) 3,140 (59%) 5,320 (100%) 1982 1,190 (25%) 700 (14%) 2,950 (61%) 4,840 (100%) 1983 1,100 (24%) 700 (15%) 2,880 (62%) 4,680 (100%) 1984 1,090 (27%) 670 (16%) 2,340 (57%) 4,100 (100%) 1985 930 (19%) 860 (18%) 3,070 (63%) 4,860 (100%) 1986 1,070 (23%) 730 (16%) 2,840 (61%) 4,640 (100%) 1987 1,030 (23%) 720 (16%) 2,770 (61%) 4,520 (100%) 1988 1,100 (22%) 920 (18%) 2,970 (60%) 4,990 (100%) 1989 880 (20%) 650 (15%) 2,820 (65%) 4,350 (100%) 1990 870 (22%) 620 (15%) 2,520 (63%) 4,010 (100%) 1991 680 (19%) 620 (18%) 2,220 (63%) 3,520 (100%) 1992 630 (17%) 620 (17%) 2,420 (66%) 3,670 (100%) 1993 650 (17%) 620 (17%) 2,460 (66%) 3,730 (100%) 1994 670 (20%) 470 (14%) 2,270 (67%) 3,410 (100%) 1995 660 (18%) 530 (15%) 2,410 (67%) 3,600 (100%) 1996 650 (16%) 660 (17%) 2,670 (67%) 3,980 (100%) 1997 660 (20%) 490 (15%) 2,180 (65%) 3,330 (100%) 1998 540 (17%) 400 (13%) 2,230 (70%) 3,170 (100%) 1999 480 (17%) 210 (7%) 2,180 (76%) 2,870 (100%) 2000 580 (18%) 460 (14%) 2,210 (68%) 3,250 (100%) 2001 620 (21%) 460 (15%) 1,930 (64%) 3,010 (100%) 2002 540 (21%) 380 (15%) 1,610 (64%) 2,520 (100%) 2003 650 (22%) 370 (12%) 1,980 (66%) 3,010 (100%) 2004 690 (23%) 310 (10%) 2,070 (68%) 3,070 (100%) 2005 540 (19%) 460 (16%) 1,870 (65%) 2,870 (100%) 2006 490 (20%) 380 (15%) 1,610 (65%) 2,480 (100%) 2007 540 (19%) 360 (13%) 1,890 (68%) 2,800 (100%) 2008 500 (19%) 300 (11%) 1,870 (70%) 2,670 (100%) 2009 450 (19%) 330 (14%) 1,650 (68%) 2,440 (100%) 2010 400 (16%) 300 (12%) 1,840 (72%) 2,545 (100%) 2011 370 (15%) 360 (15%) 1,700 (70%) 2,430 (100%) 1980-1984 average 1,220 (25%) 770 (16%) 2,850 (59%) 4,830 (100%) 2007-2011 average 450 (18%) 330 (13%) 1,790 (69%) 2,570 (100%)
Change from 1980-1984 to 2007-2011 -770 (-63%) -440 (-57%) -1,060 (-37%) -2,260 (-47%)
Note: Estimates from 1999 on are based on NFIRS 5.0 data and exclude deaths from confined fires. Because of low participation in NFIRS 5.0 during 1999-2001, estimates for these years are highly uncertain and must be used with caution. Estimates of total deaths vary slightly from those in Table 1. Estimates in Table 1 were based solely on NFPA survey data. Source: NFIRS and NFPA survey.
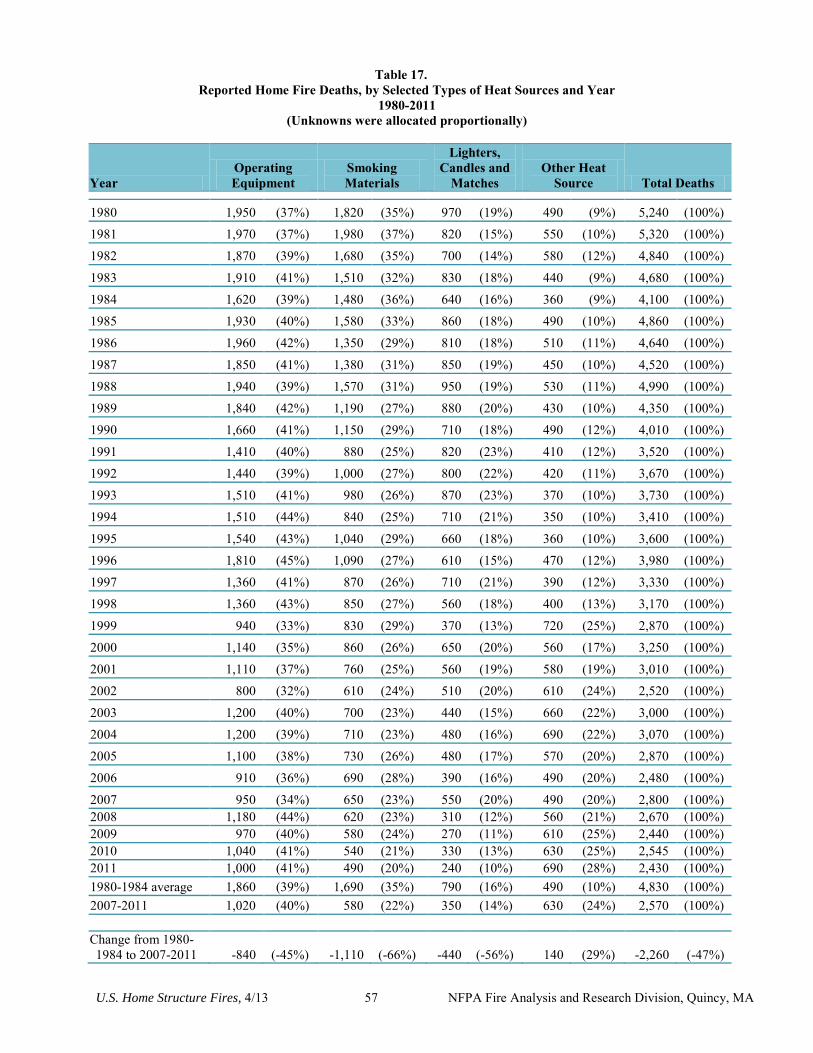
U.S. Home Structure Fires, 4/13 57 NFPA Fire Analysis and Research Division, Quincy, MA
Table 17. Reported Home Fire Deaths, by Selected Types of Heat Sources and Year
1980-2011 (Unknowns were allocated proportionally)
Year Operating Equipment
Smoking Materials
Lighters, Candles and
Matches Other Heat
Source Total Deaths
1980 1,950 (37%) 1,820 (35%) 970 (19%) 490 (9%) 5,240 (100%) 1981 1,970 (37%) 1,980 (37%) 820 (15%) 550 (10%) 5,320 (100%) 1982 1,870 (39%) 1,680 (35%) 700 (14%) 580 (12%) 4,840 (100%)
1983 1,910 (41%) 1,510 (32%) 830 (18%) 440 (9%) 4,680 (100%) 1984 1,620 (39%) 1,480 (36%) 640 (16%) 360 (9%) 4,100 (100%) 1985 1,930 (40%) 1,580 (33%) 860 (18%) 490 (10%) 4,860 (100%) 1986 1,960 (42%) 1,350 (29%) 810 (18%) 510 (11%) 4,640 (100%)
1987 1,850 (41%) 1,380 (31%) 850 (19%) 450 (10%) 4,520 (100%) 1988 1,940 (39%) 1,570 (31%) 950 (19%) 530 (11%) 4,990 (100%) 1989 1,840 (42%) 1,190 (27%) 880 (20%) 430 (10%) 4,350 (100%) 1990 1,660 (41%) 1,150 (29%) 710 (18%) 490 (12%) 4,010 (100%)
1991 1,410 (40%) 880 (25%) 820 (23%) 410 (12%) 3,520 (100%) 1992 1,440 (39%) 1,000 (27%) 800 (22%) 420 (11%) 3,670 (100%) 1993 1,510 (41%) 980 (26%) 870 (23%) 370 (10%) 3,730 (100%) 1994 1,510 (44%) 840 (25%) 710 (21%) 350 (10%) 3,410 (100%)
1995 1,540 (43%) 1,040 (29%) 660 (18%) 360 (10%) 3,600 (100%) 1996 1,810 (45%) 1,090 (27%) 610 (15%) 470 (12%) 3,980 (100%) 1997 1,360 (41%) 870 (26%) 710 (21%) 390 (12%) 3,330 (100%) 1998 1,360 (43%) 850 (27%) 560 (18%) 400 (13%) 3,170 (100%)
1999 940 (33%) 830 (29%) 370 (13%) 720 (25%) 2,870 (100%) 2000 1,140 (35%) 860 (26%) 650 (20%) 560 (17%) 3,250 (100%) 2001 1,110 (37%) 760 (25%) 560 (19%) 580 (19%) 3,010 (100%) 2002 800 (32%) 610 (24%) 510 (20%) 610 (24%) 2,520 (100%)
2003 1,200 (40%) 700 (23%) 440 (15%) 660 (22%) 3,000 (100%) 2004 1,200 (39%) 710 (23%) 480 (16%) 690 (22%) 3,070 (100%) 2005 1,100 (38%) 730 (26%) 480 (17%) 570 (20%) 2,870 (100%) 2006 910 (36%) 690 (28%) 390 (16%) 490 (20%) 2,480 (100%)
2007 950 (34%) 650 (23%) 550 (20%) 490 (20%) 2,800 (100%) 2008 1,180 (44%) 620 (23%) 310 (12%) 560 (21%) 2,670 (100%) 2009 970 (40%) 580 (24%) 270 (11%) 610 (25%) 2,440 (100%) 2010 1,040 (41%) 540 (21%) 330 (13%) 630 (25%) 2,545 (100%) 2011 1,000 (41%) 490 (20%) 240 (10%) 690 (28%) 2,430 (100%) 1980-1984 average 1,860 (39%) 1,690 (35%) 790 (16%) 490 (10%) 4,830 (100%) 2007-2011 1,020 (40%) 580 (22%) 350 (14%) 630 (24%) 2,570 (100%)
Change from 1980-1984 to 2007-2011 -840 (-45%) -1,110 (-66%) -440 (-56%) 140 (29%) -2,260 (-47%)
U.S. Home Structure Fires, 4/13 58 NFPA Fire Analysis and Research Division, Quincy, MA
Table 17. (Continued) Reported Home Fire Deaths, by Selected Types of Heat Sources and Year
1980-2011 Note: Estimates from 1999 on are based on NFIRS 5.0 data and exclude deaths from confined fires. Because of low participation in NFIRS 5.0 during 1999-2001, estimates for these years must be used with caution. In 1980-1998, operating equipment identified by form of heat of ignition codes for heat from fuel-fires, fuel-powered objects, heat from electrical equipment arcing or overloaded, electric lamps, and properly and improperly operating equipment (form of heat of ignition codes 10-29, 54, 56, and 57). Beginning in 1999, operating equipment was identified by heat source codes for operating equipment (heat source 10-13). The 1980-1998 estimates of lighter, candles, and matches include proportional shares of deaths from fires in which the form of heat of ignition was an unknown-type of open flame. Estimates for open flame and smoking material beginning in 1999 include a proportional share of deaths in which the heat source was an unclassified open flame or smoking material. Estimates of total deaths vary slightly from those in Table 1. Estimates in Table 1 were based solely on NFPA survey data. Source: NFIRS and NFPA survey.
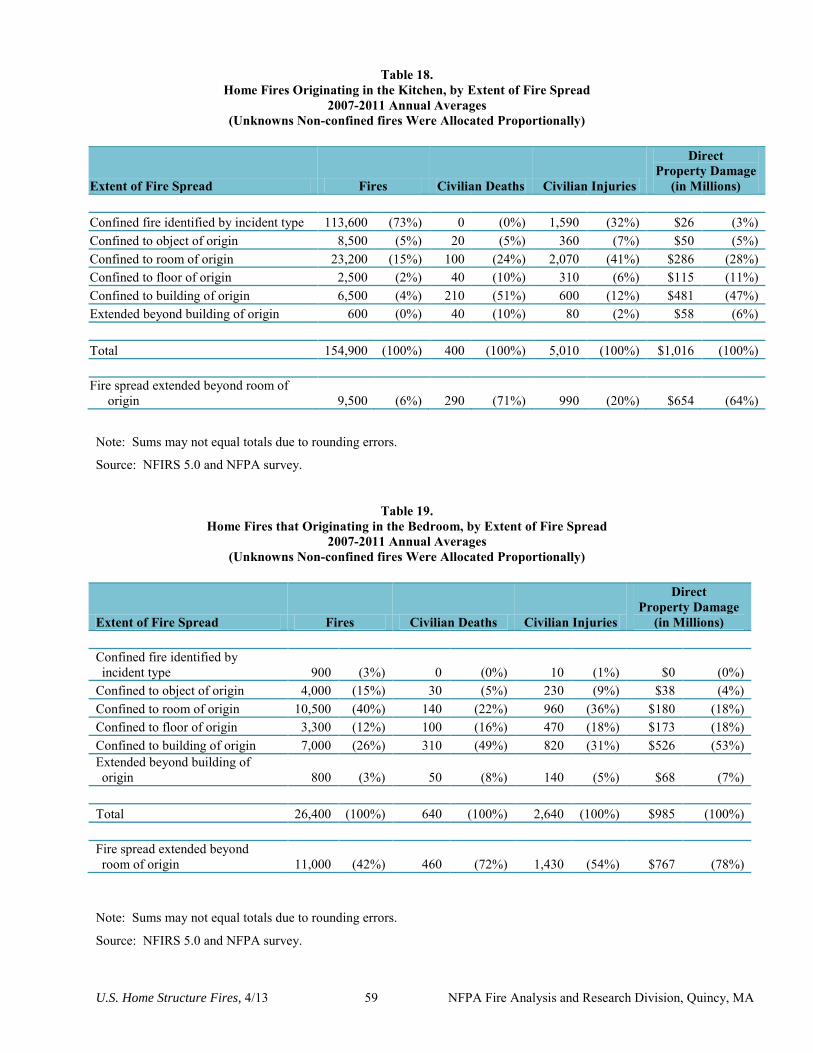
U.S. Home Structure Fires, 4/13 59 NFPA Fire Analysis and Research Division, Quincy, MA
Table 18. Home Fires Originating in the Kitchen, by Extent of Fire Spread
2007-2011 Annual Averages (Unknowns Non-confined fires Were Allocated Proportionally)
Extent of Fire Spread Fires Civilian Deaths Civilian Injuries
Direct Property Damage
(in Millions)
Confined fire identified by incident type 113,600 (73%) 0 (0%) 1,590 (32%) $26 (3%) Confined to object of origin 8,500 (5%) 20 (5%) 360 (7%) $50 (5%) Confined to room of origin 23,200 (15%) 100 (24%) 2,070 (41%) $286 (28%) Confined to floor of origin 2,500 (2%) 40 (10%) 310 (6%) $115 (11%) Confined to building of origin 6,500 (4%) 210 (51%) 600 (12%) $481 (47%) Extended beyond building of origin 600 (0%) 40 (10%) 80 (2%) $58 (6%)
Total 154,900 (100%) 400 (100%) 5,010 (100%) $1,016 (100%)
Fire spread extended beyond room of origin 9,500 (6%) 290 (71%) 990 (20%) $654 (64%)
Note: Sums may not equal totals due to rounding errors.
Source: NFIRS 5.0 and NFPA survey.
Table 19. Home Fires that Originating in the Bedroom, by Extent of Fire Spread
2007-2011 Annual Averages (Unknowns Non-confined fires Were Allocated Proportionally)
Extent of Fire Spread Fires Civilian Deaths Civilian Injuries
Direct Property Damage
(in Millions)
Confined fire identified by incident type 900 (3%) 0 (0%) 10 (1%) $0 (0%)
Confined to object of origin 4,000 (15%) 30 (5%) 230 (9%) $38 (4%) Confined to room of origin 10,500 (40%) 140 (22%) 960 (36%) $180 (18%) Confined to floor of origin 3,300 (12%) 100 (16%) 470 (18%) $173 (18%) Confined to building of origin 7,000 (26%) 310 (49%) 820 (31%) $526 (53%) Extended beyond building of origin 800 (3%) 50 (8%) 140 (5%) $68 (7%)
Total 26,400 (100%) 640 (100%) 2,640 (100%) $985 (100%)
Fire spread extended beyond room of origin 11,000 (42%) 460 (72%) 1,430 (54%) $767 (78%)
Note: Sums may not equal totals due to rounding errors.
Source: NFIRS 5.0 and NFPA survey.
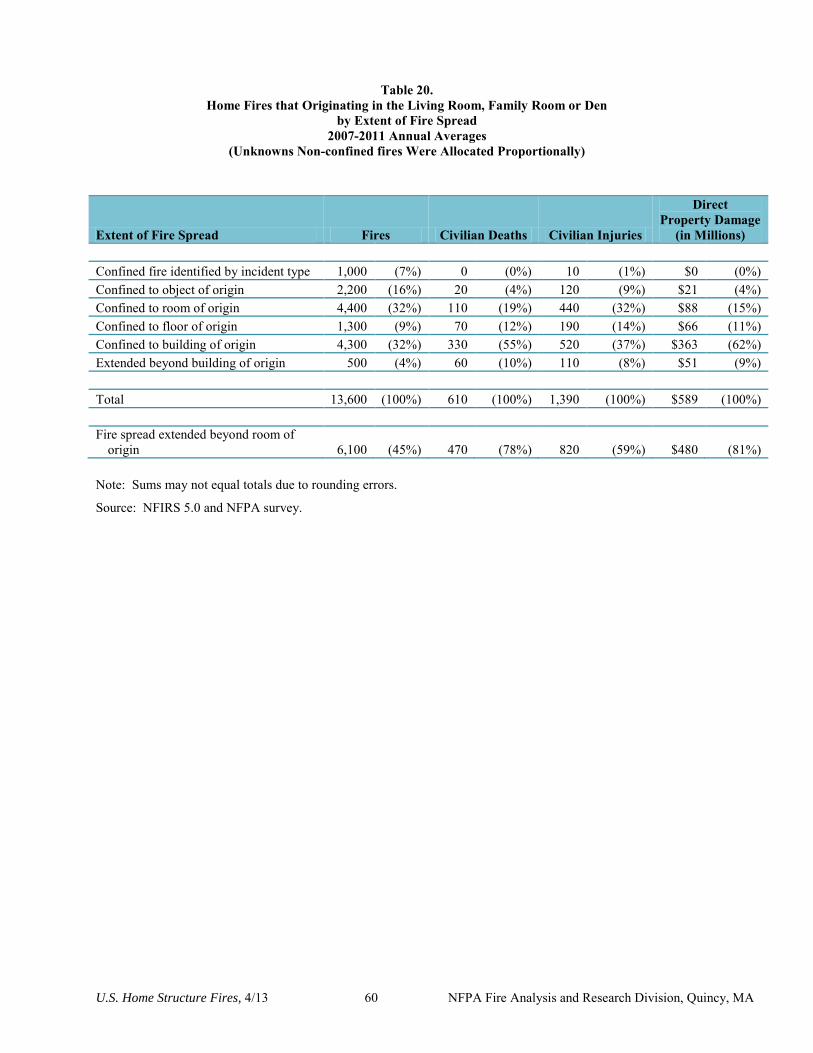
U.S. Home Structure Fires, 4/13 60 NFPA Fire Analysis and Research Division, Quincy, MA
Table 20.
Home Fires that Originating in the Living Room, Family Room or Den by Extent of Fire Spread
2007-2011 Annual Averages (Unknowns Non-confined fires Were Allocated Proportionally)
Extent of Fire Spread Fires Civilian Deaths Civilian Injuries
Direct Property Damage
(in Millions)
Confined fire identified by incident type 1,000 (7%) 0 (0%) 10 (1%) $0 (0%) Confined to object of origin 2,200 (16%) 20 (4%) 120 (9%) $21 (4%) Confined to room of origin 4,400 (32%) 110 (19%) 440 (32%) $88 (15%) Confined to floor of origin 1,300 (9%) 70 (12%) 190 (14%) $66 (11%) Confined to building of origin 4,300 (32%) 330 (55%) 520 (37%) $363 (62%) Extended beyond building of origin 500 (4%) 60 (10%) 110 (8%) $51 (9%)
Total 13,600 (100%) 610 (100%) 1,390 (100%) $589 (100%)
Fire spread extended beyond room of origin 6,100 (45%) 470 (78%) 820 (59%) $480 (81%)
Note: Sums may not equal totals due to rounding errors.
Source: NFIRS 5.0 and NFPA survey.
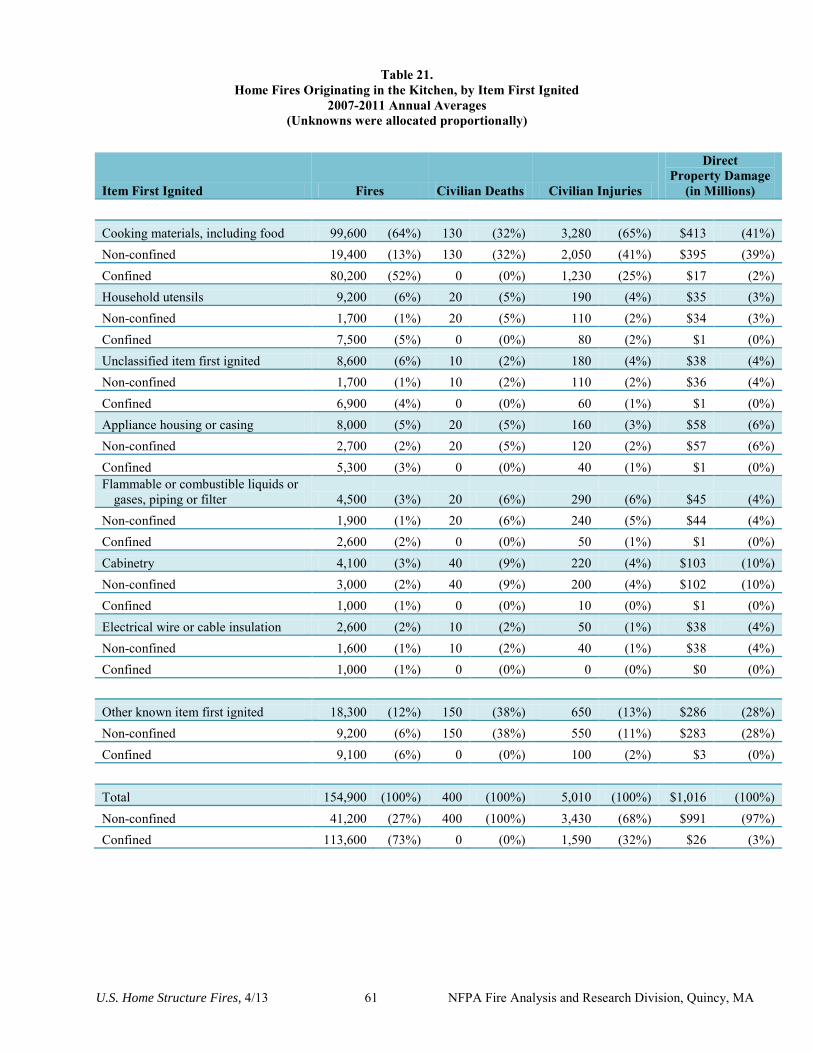
U.S. Home Structure Fires, 4/13 61 NFPA Fire Analysis and Research Division, Quincy, MA
Table 21. Home Fires Originating in the Kitchen, by Item First Ignited
2007-2011 Annual Averages (Unknowns were allocated proportionally)
Item First Ignited Fires Civilian Deaths Civilian Injuries
Direct Property Damage
(in Millions)
Cooking materials, including food 99,600 (64%) 130 (32%) 3,280 (65%) $413 (41%) Non-confined 19,400 (13%) 130 (32%) 2,050 (41%) $395 (39%) Confined 80,200 (52%) 0 (0%) 1,230 (25%) $17 (2%) Household utensils 9,200 (6%) 20 (5%) 190 (4%) $35 (3%) Non-confined 1,700 (1%) 20 (5%) 110 (2%) $34 (3%) Confined 7,500 (5%) 0 (0%) 80 (2%) $1 (0%) Unclassified item first ignited 8,600 (6%) 10 (2%) 180 (4%) $38 (4%) Non-confined 1,700 (1%) 10 (2%) 110 (2%) $36 (4%) Confined 6,900 (4%) 0 (0%) 60 (1%) $1 (0%) Appliance housing or casing 8,000 (5%) 20 (5%) 160 (3%) $58 (6%) Non-confined 2,700 (2%) 20 (5%) 120 (2%) $57 (6%) Confined 5,300 (3%) 0 (0%) 40 (1%) $1 (0%) Flammable or combustible liquids or
gases, piping or filter 4,500 (3%) 20 (6%) 290 (6%) $45 (4%) Non-confined 1,900 (1%) 20 (6%) 240 (5%) $44 (4%) Confined 2,600 (2%) 0 (0%) 50 (1%) $1 (0%) Cabinetry 4,100 (3%) 40 (9%) 220 (4%) $103 (10%) Non-confined 3,000 (2%) 40 (9%) 200 (4%) $102 (10%) Confined 1,000 (1%) 0 (0%) 10 (0%) $1 (0%) Electrical wire or cable insulation 2,600 (2%) 10 (2%) 50 (1%) $38 (4%) Non-confined 1,600 (1%) 10 (2%) 40 (1%) $38 (4%) Confined 1,000 (1%) 0 (0%) 0 (0%) $0 (0%)
Other known item first ignited 18,300 (12%) 150 (38%) 650 (13%) $286 (28%) Non-confined 9,200 (6%) 150 (38%) 550 (11%) $283 (28%) Confined 9,100 (6%) 0 (0%) 100 (2%) $3 (0%)
Total 154,900 (100%) 400 (100%) 5,010 (100%) $1,016 (100%) Non-confined 41,200 (27%) 400 (100%) 3,430 (68%) $991 (97%) Confined 113,600 (73%) 0 (0%) 1,590 (32%) $26 (3%)
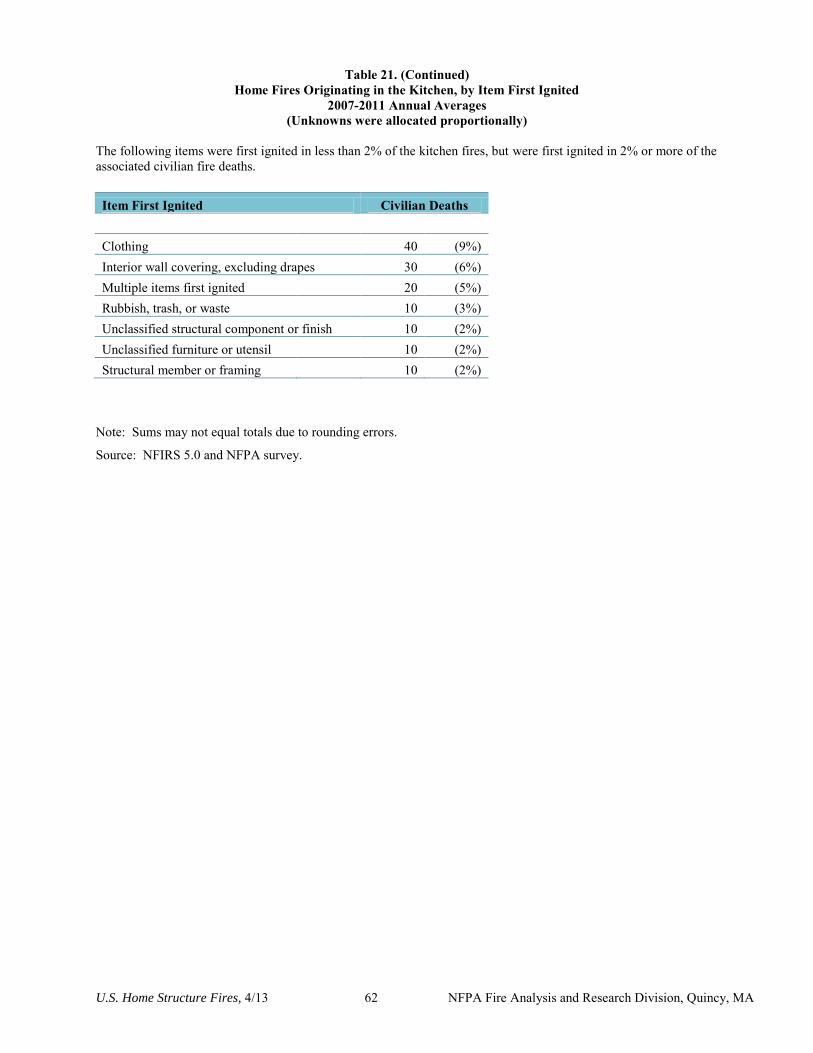
U.S. Home Structure Fires, 4/13 62 NFPA Fire Analysis and Research Division, Quincy, MA
Table 21. (Continued) Home Fires Originating in the Kitchen, by Item First Ignited
2007-2011 Annual Averages (Unknowns were allocated proportionally)
The following items were first ignited in less than 2% of the kitchen fires, but were first ignited in 2% or more of the associated civilian fire deaths. Item First Ignited Civilian Deaths
Clothing
40 (9%) Interior wall covering, excluding drapes 30 (6%) Multiple items first ignited
20 (5%)
Rubbish, trash, or waste
10 (3%) Unclassified structural component or finish 10 (2%) Unclassified furniture or utensil
10 (2%)
Structural member or framing
10 (2%) Note: Sums may not equal totals due to rounding errors.
Source: NFIRS 5.0 and NFPA survey.
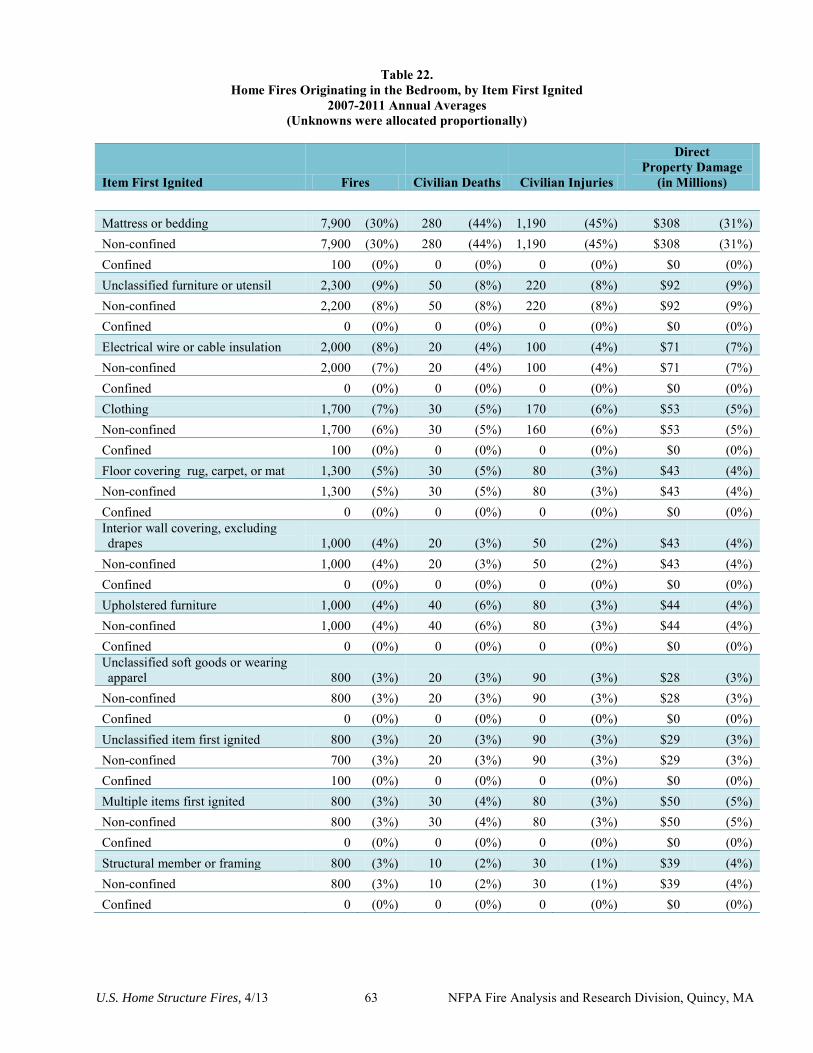
U.S. Home Structure Fires, 4/13 63 NFPA Fire Analysis and Research Division, Quincy, MA
Table 22. Home Fires Originating in the Bedroom, by Item First Ignited
2007-2011 Annual Averages (Unknowns were allocated proportionally)
Item First Ignited Fires Civilian Deaths Civilian Injuries
Direct Property Damage
(in Millions)
Mattress or bedding 7,900 (30%) 280 (44%) 1,190 (45%) $308 (31%) Non-confined 7,900 (30%) 280 (44%) 1,190 (45%) $308 (31%) Confined 100 (0%) 0 (0%) 0 (0%) $0 (0%) Unclassified furniture or utensil 2,300 (9%) 50 (8%) 220 (8%) $92 (9%) Non-confined 2,200 (8%) 50 (8%) 220 (8%) $92 (9%) Confined 0 (0%) 0 (0%) 0 (0%) $0 (0%) Electrical wire or cable insulation 2,000 (8%) 20 (4%) 100 (4%) $71 (7%) Non-confined 2,000 (7%) 20 (4%) 100 (4%) $71 (7%) Confined 0 (0%) 0 (0%) 0 (0%) $0 (0%) Clothing 1,700 (7%) 30 (5%) 170 (6%) $53 (5%) Non-confined 1,700 (6%) 30 (5%) 160 (6%) $53 (5%) Confined 100 (0%) 0 (0%) 0 (0%) $0 (0%) Floor covering rug, carpet, or mat 1,300 (5%) 30 (5%) 80 (3%) $43 (4%) Non-confined 1,300 (5%) 30 (5%) 80 (3%) $43 (4%) Confined 0 (0%) 0 (0%) 0 (0%) $0 (0%) Interior wall covering, excluding drapes 1,000 (4%) 20 (3%) 50 (2%) $43 (4%)
Non-confined 1,000 (4%) 20 (3%) 50 (2%) $43 (4%) Confined 0 (0%) 0 (0%) 0 (0%) $0 (0%) Upholstered furniture 1,000 (4%) 40 (6%) 80 (3%) $44 (4%) Non-confined 1,000 (4%) 40 (6%) 80 (3%) $44 (4%) Confined 0 (0%) 0 (0%) 0 (0%) $0 (0%) Unclassified soft goods or wearing apparel 800 (3%) 20 (3%) 90 (3%) $28 (3%)
Non-confined 800 (3%) 20 (3%) 90 (3%) $28 (3%) Confined 0 (0%) 0 (0%) 0 (0%) $0 (0%) Unclassified item first ignited 800 (3%) 20 (3%) 90 (3%) $29 (3%) Non-confined 700 (3%) 20 (3%) 90 (3%) $29 (3%) Confined 100 (0%) 0 (0%) 0 (0%) $0 (0%) Multiple items first ignited 800 (3%) 30 (4%) 80 (3%) $50 (5%) Non-confined 800 (3%) 30 (4%) 80 (3%) $50 (5%) Confined 0 (0%) 0 (0%) 0 (0%) $0 (0%) Structural member or framing 800 (3%) 10 (2%) 30 (1%) $39 (4%) Non-confined 800 (3%) 10 (2%) 30 (1%) $39 (4%) Confined 0 (0%) 0 (0%) 0 (0%) $0 (0%)
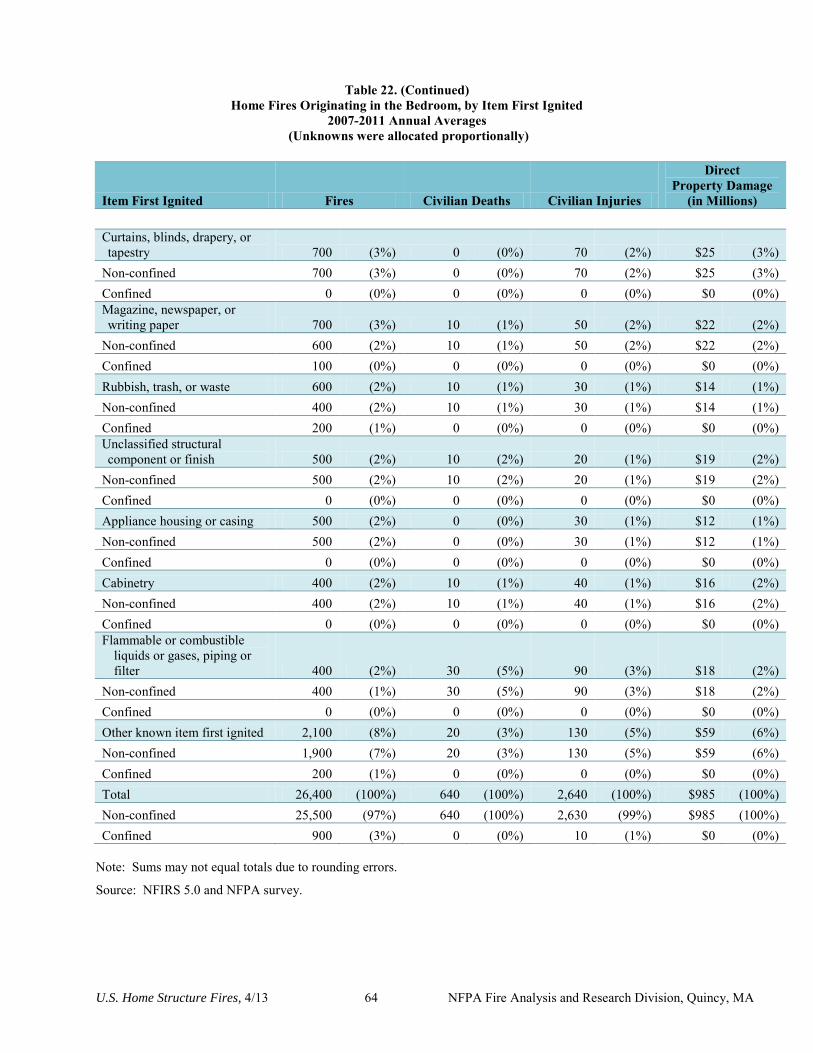
U.S. Home Structure Fires, 4/13 64 NFPA Fire Analysis and Research Division, Quincy, MA
Table 22. (Continued)
Home Fires Originating in the Bedroom, by Item First Ignited 2007-2011 Annual Averages
(Unknowns were allocated proportionally)
Item First Ignited Fires Civilian Deaths Civilian Injuries
Direct Property Damage
(in Millions)
Curtains, blinds, drapery, or tapestry 700 (3%) 0 (0%) 70 (2%) $25 (3%)
Non-confined 700 (3%) 0 (0%) 70 (2%) $25 (3%) Confined 0 (0%) 0 (0%) 0 (0%) $0 (0%) Magazine, newspaper, or writing paper 700 (3%) 10 (1%) 50 (2%) $22 (2%)
Non-confined 600 (2%) 10 (1%) 50 (2%) $22 (2%) Confined 100 (0%) 0 (0%) 0 (0%) $0 (0%) Rubbish, trash, or waste 600 (2%) 10 (1%) 30 (1%) $14 (1%) Non-confined 400 (2%) 10 (1%) 30 (1%) $14 (1%) Confined 200 (1%) 0 (0%) 0 (0%) $0 (0%) Unclassified structural component or finish 500 (2%) 10 (2%) 20 (1%) $19 (2%)
Non-confined 500 (2%) 10 (2%) 20 (1%) $19 (2%) Confined 0 (0%) 0 (0%) 0 (0%) $0 (0%) Appliance housing or casing 500 (2%) 0 (0%) 30 (1%) $12 (1%) Non-confined 500 (2%) 0 (0%) 30 (1%) $12 (1%) Confined 0 (0%) 0 (0%) 0 (0%) $0 (0%) Cabinetry 400 (2%) 10 (1%) 40 (1%) $16 (2%) Non-confined 400 (2%) 10 (1%) 40 (1%) $16 (2%) Confined 0 (0%) 0 (0%) 0 (0%) $0 (0%) Flammable or combustible
liquids or gases, piping or filter 400 (2%) 30 (5%) 90 (3%) $18 (2%)
Non-confined 400 (1%) 30 (5%) 90 (3%) $18 (2%) Confined 0 (0%) 0 (0%) 0 (0%) $0 (0%) Other known item first ignited 2,100 (8%) 20 (3%) 130 (5%) $59 (6%) Non-confined 1,900 (7%) 20 (3%) 130 (5%) $59 (6%) Confined 200 (1%) 0 (0%) 0 (0%) $0 (0%) Total 26,400 (100%) 640 (100%) 2,640 (100%) $985 (100%) Non-confined 25,500 (97%) 640 (100%) 2,630 (99%) $985 (100%) Confined 900 (3%) 0 (0%) 10 (1%) $0 (0%)
Note: Sums may not equal totals due to rounding errors.
Source: NFIRS 5.0 and NFPA survey.
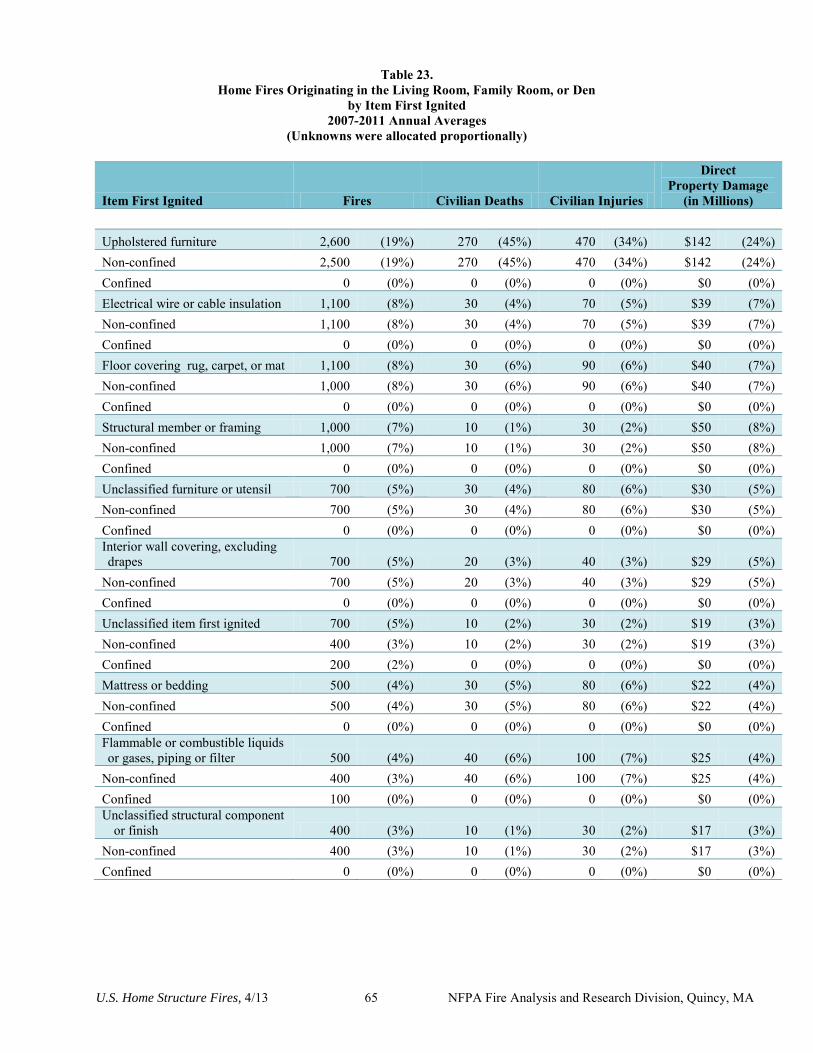
U.S. Home Structure Fires, 4/13 65 NFPA Fire Analysis and Research Division, Quincy, MA
Table 23. Home Fires Originating in the Living Room, Family Room, or Den
by Item First Ignited 2007-2011 Annual Averages
(Unknowns were allocated proportionally)
Item First Ignited Fires Civilian Deaths Civilian Injuries
Direct Property Damage
(in Millions)
Upholstered furniture 2,600 (19%) 270 (45%) 470 (34%) $142 (24%) Non-confined 2,500 (19%) 270 (45%) 470 (34%) $142 (24%) Confined 0 (0%) 0 (0%) 0 (0%) $0 (0%) Electrical wire or cable insulation 1,100 (8%) 30 (4%) 70 (5%) $39 (7%) Non-confined 1,100 (8%) 30 (4%) 70 (5%) $39 (7%) Confined 0 (0%) 0 (0%) 0 (0%) $0 (0%) Floor covering rug, carpet, or mat 1,100 (8%) 30 (6%) 90 (6%) $40 (7%) Non-confined 1,000 (8%) 30 (6%) 90 (6%) $40 (7%) Confined 0 (0%) 0 (0%) 0 (0%) $0 (0%) Structural member or framing 1,000 (7%) 10 (1%) 30 (2%) $50 (8%) Non-confined 1,000 (7%) 10 (1%) 30 (2%) $50 (8%) Confined 0 (0%) 0 (0%) 0 (0%) $0 (0%) Unclassified furniture or utensil 700 (5%) 30 (4%) 80 (6%) $30 (5%) Non-confined 700 (5%) 30 (4%) 80 (6%) $30 (5%) Confined 0 (0%) 0 (0%) 0 (0%) $0 (0%) Interior wall covering, excluding drapes 700 (5%) 20 (3%) 40 (3%) $29 (5%)
Non-confined 700 (5%) 20 (3%) 40 (3%) $29 (5%) Confined 0 (0%) 0 (0%) 0 (0%) $0 (0%) Unclassified item first ignited 700 (5%) 10 (2%) 30 (2%) $19 (3%) Non-confined 400 (3%) 10 (2%) 30 (2%) $19 (3%) Confined 200 (2%) 0 (0%) 0 (0%) $0 (0%) Mattress or bedding 500 (4%) 30 (5%) 80 (6%) $22 (4%) Non-confined 500 (4%) 30 (5%) 80 (6%) $22 (4%) Confined 0 (0%) 0 (0%) 0 (0%) $0 (0%) Flammable or combustible liquids or gases, piping or filter 500 (4%) 40 (6%) 100 (7%) $25 (4%)
Non-confined 400 (3%) 40 (6%) 100 (7%) $25 (4%) Confined 100 (0%) 0 (0%) 0 (0%) $0 (0%) Unclassified structural component
or finish 400 (3%) 10 (1%) 30 (2%) $17 (3%) Non-confined 400 (3%) 10 (1%) 30 (2%) $17 (3%) Confined 0 (0%) 0 (0%) 0 (0%) $0 (0%)
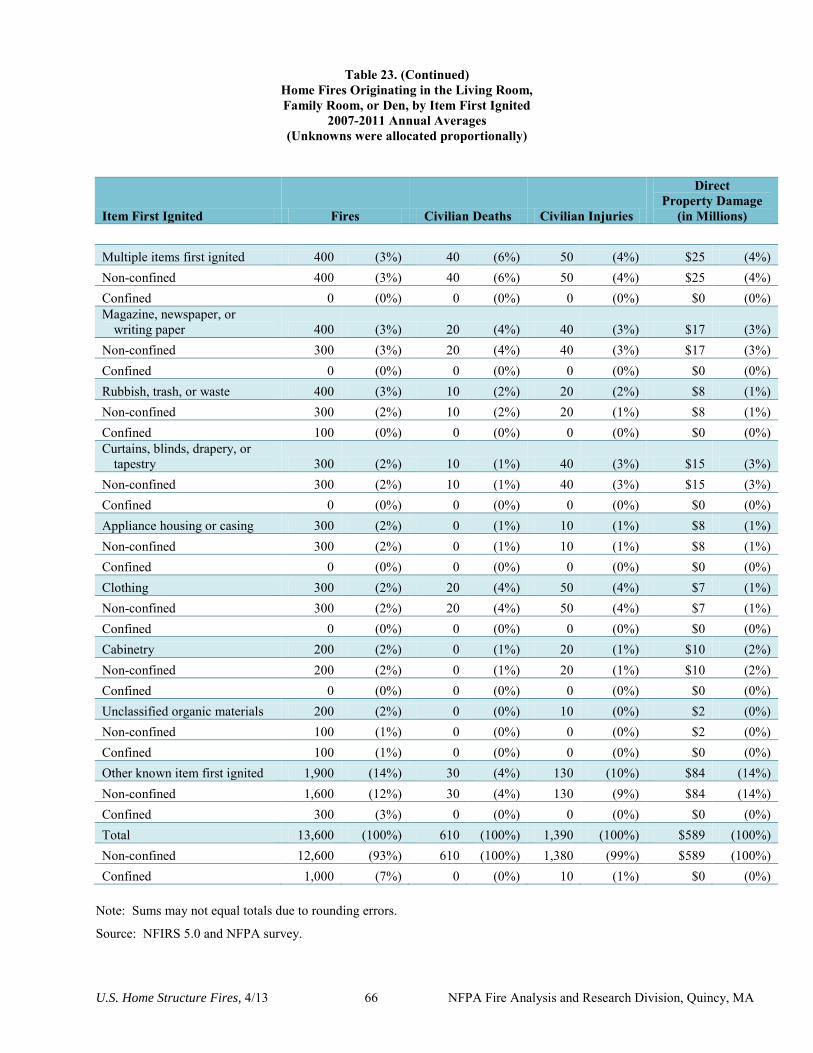
U.S. Home Structure Fires, 4/13 66 NFPA Fire Analysis and Research Division, Quincy, MA
Table 23. (Continued) Home Fires Originating in the Living Room, Family Room, or Den, by Item First Ignited
2007-2011 Annual Averages (Unknowns were allocated proportionally)
Item First Ignited Fires Civilian Deaths Civilian Injuries
Direct Property Damage
(in Millions)
Multiple items first ignited 400 (3%) 40 (6%) 50 (4%) $25 (4%) Non-confined 400 (3%) 40 (6%) 50 (4%) $25 (4%) Confined 0 (0%) 0 (0%) 0 (0%) $0 (0%) Magazine, newspaper, or
writing paper 400 (3%) 20 (4%) 40 (3%) $17 (3%) Non-confined 300 (3%) 20 (4%) 40 (3%) $17 (3%) Confined 0 (0%) 0 (0%) 0 (0%) $0 (0%) Rubbish, trash, or waste 400 (3%) 10 (2%) 20 (2%) $8 (1%) Non-confined 300 (2%) 10 (2%) 20 (1%) $8 (1%) Confined 100 (0%) 0 (0%) 0 (0%) $0 (0%) Curtains, blinds, drapery, or
tapestry 300 (2%) 10 (1%) 40 (3%) $15 (3%) Non-confined 300 (2%) 10 (1%) 40 (3%) $15 (3%) Confined 0 (0%) 0 (0%) 0 (0%) $0 (0%) Appliance housing or casing 300 (2%) 0 (1%) 10 (1%) $8 (1%) Non-confined 300 (2%) 0 (1%) 10 (1%) $8 (1%) Confined 0 (0%) 0 (0%) 0 (0%) $0 (0%) Clothing 300 (2%) 20 (4%) 50 (4%) $7 (1%) Non-confined 300 (2%) 20 (4%) 50 (4%) $7 (1%) Confined 0 (0%) 0 (0%) 0 (0%) $0 (0%) Cabinetry 200 (2%) 0 (1%) 20 (1%) $10 (2%) Non-confined 200 (2%) 0 (1%) 20 (1%) $10 (2%) Confined 0 (0%) 0 (0%) 0 (0%) $0 (0%) Unclassified organic materials 200 (2%) 0 (0%) 10 (0%) $2 (0%) Non-confined 100 (1%) 0 (0%) 0 (0%) $2 (0%) Confined 100 (1%) 0 (0%) 0 (0%) $0 (0%) Other known item first ignited 1,900 (14%) 30 (4%) 130 (10%) $84 (14%) Non-confined 1,600 (12%) 30 (4%) 130 (9%) $84 (14%) Confined 300 (3%) 0 (0%) 0 (0%) $0 (0%) Total 13,600 (100%) 610 (100%) 1,390 (100%) $589 (100%) Non-confined 12,600 (93%) 610 (100%) 1,380 (99%) $589 (100%) Confined 1,000 (7%) 0 (0%) 10 (1%) $0 (0%)
Note: Sums may not equal totals due to rounding errors.
Source: NFIRS 5.0 and NFPA survey.
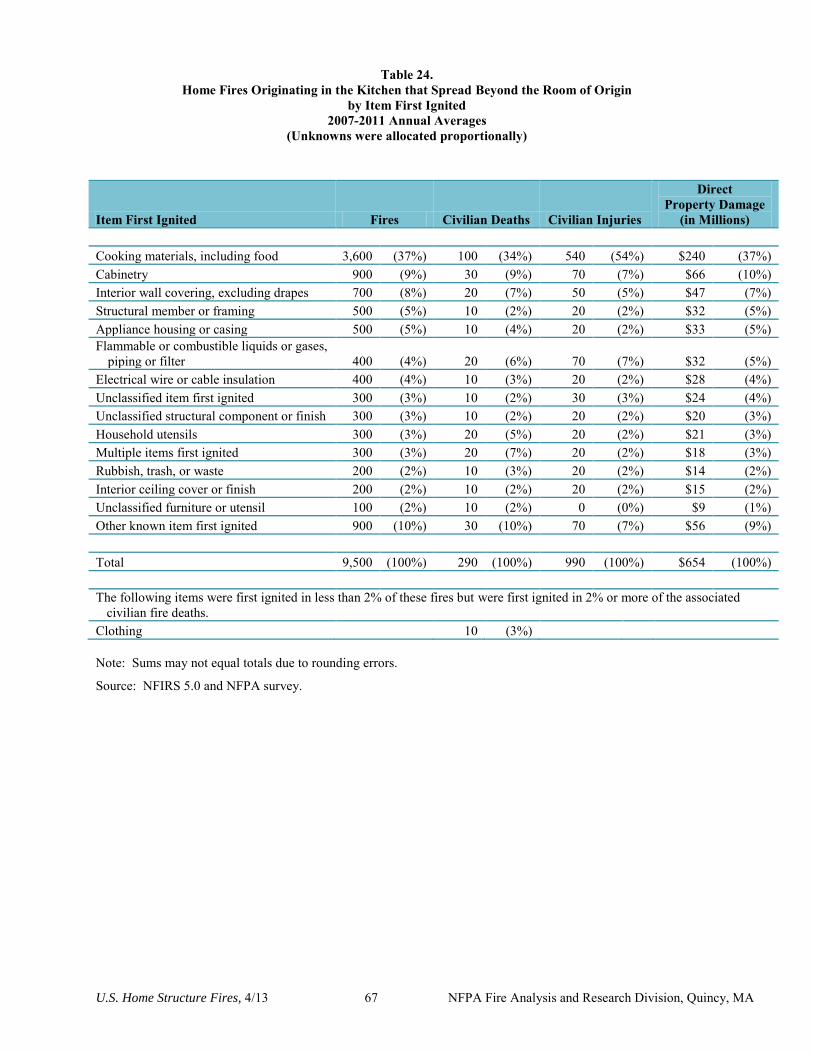
U.S. Home Structure Fires, 4/13 67 NFPA Fire Analysis and Research Division, Quincy, MA
Table 24. Home Fires Originating in the Kitchen that Spread Beyond the Room of Origin
by Item First Ignited 2007-2011 Annual Averages
(Unknowns were allocated proportionally)
Item First Ignited Fires Civilian Deaths Civilian Injuries
Direct Property Damage
(in Millions)
Cooking materials, including food 3,600 (37%) 100 (34%) 540 (54%) $240 (37%) Cabinetry 900 (9%) 30 (9%) 70 (7%) $66 (10%) Interior wall covering, excluding drapes 700 (8%) 20 (7%) 50 (5%) $47 (7%) Structural member or framing 500 (5%) 10 (2%) 20 (2%) $32 (5%) Appliance housing or casing 500 (5%) 10 (4%) 20 (2%) $33 (5%) Flammable or combustible liquids or gases,
piping or filter 400 (4%) 20 (6%) 70 (7%) $32 (5%) Electrical wire or cable insulation 400 (4%) 10 (3%) 20 (2%) $28 (4%) Unclassified item first ignited 300 (3%) 10 (2%) 30 (3%) $24 (4%) Unclassified structural component or finish 300 (3%) 10 (2%) 20 (2%) $20 (3%) Household utensils 300 (3%) 20 (5%) 20 (2%) $21 (3%) Multiple items first ignited 300 (3%) 20 (7%) 20 (2%) $18 (3%) Rubbish, trash, or waste 200 (2%) 10 (3%) 20 (2%) $14 (2%) Interior ceiling cover or finish 200 (2%) 10 (2%) 20 (2%) $15 (2%) Unclassified furniture or utensil 100 (2%) 10 (2%) 0 (0%) $9 (1%) Other known item first ignited 900 (10%) 30 (10%) 70 (7%) $56 (9%)
Total 9,500 (100%) 290 (100%) 990 (100%) $654 (100%)
The following items were first ignited in less than 2% of these fires but were first ignited in 2% or more of the associated civilian fire deaths.
Clothing
10 (3%)
Note: Sums may not equal totals due to rounding errors.
Source: NFIRS 5.0 and NFPA survey.
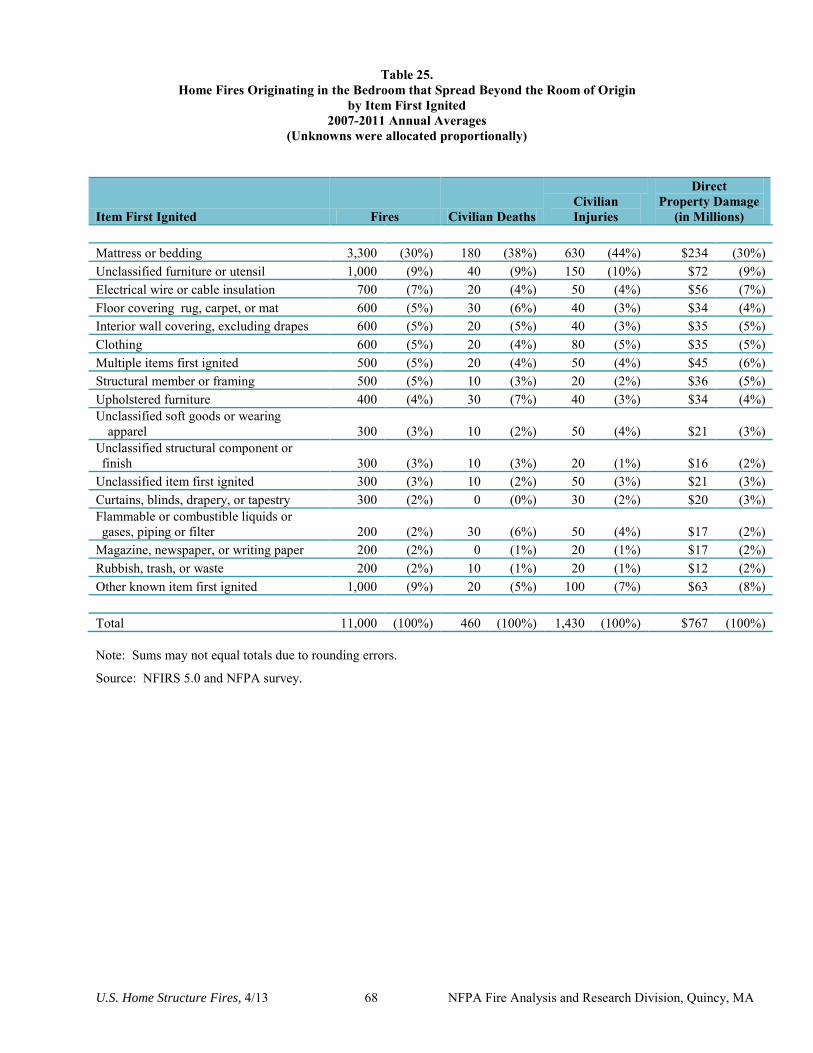
U.S. Home Structure Fires, 4/13 68 NFPA Fire Analysis and Research Division, Quincy, MA
Table 25. Home Fires Originating in the Bedroom that Spread Beyond the Room of Origin
by Item First Ignited 2007-2011 Annual Averages
(Unknowns were allocated proportionally)
Item First Ignited Fires Civilian Deaths Civilian Injuries
Direct Property Damage
(in Millions)
Mattress or bedding 3,300 (30%) 180 (38%) 630 (44%) $234 (30%) Unclassified furniture or utensil 1,000 (9%) 40 (9%) 150 (10%) $72 (9%) Electrical wire or cable insulation 700 (7%) 20 (4%) 50 (4%) $56 (7%) Floor covering rug, carpet, or mat 600 (5%) 30 (6%) 40 (3%) $34 (4%) Interior wall covering, excluding drapes 600 (5%) 20 (5%) 40 (3%) $35 (5%) Clothing 600 (5%) 20 (4%) 80 (5%) $35 (5%) Multiple items first ignited 500 (5%) 20 (4%) 50 (4%) $45 (6%) Structural member or framing 500 (5%) 10 (3%) 20 (2%) $36 (5%) Upholstered furniture 400 (4%) 30 (7%) 40 (3%) $34 (4%) Unclassified soft goods or wearing
apparel 300 (3%) 10 (2%) 50 (4%) $21 (3%) Unclassified structural component or finish 300 (3%) 10 (3%) 20 (1%) $16 (2%)
Unclassified item first ignited 300 (3%) 10 (2%) 50 (3%) $21 (3%) Curtains, blinds, drapery, or tapestry 300 (2%) 0 (0%) 30 (2%) $20 (3%) Flammable or combustible liquids or gases, piping or filter 200 (2%) 30 (6%) 50 (4%) $17 (2%)
Magazine, newspaper, or writing paper 200 (2%) 0 (1%) 20 (1%) $17 (2%) Rubbish, trash, or waste 200 (2%) 10 (1%) 20 (1%) $12 (2%) Other known item first ignited 1,000 (9%) 20 (5%) 100 (7%) $63 (8%)
Total 11,000 (100%) 460 (100%) 1,430 (100%) $767 (100%) Note: Sums may not equal totals due to rounding errors.
Source: NFIRS 5.0 and NFPA survey.
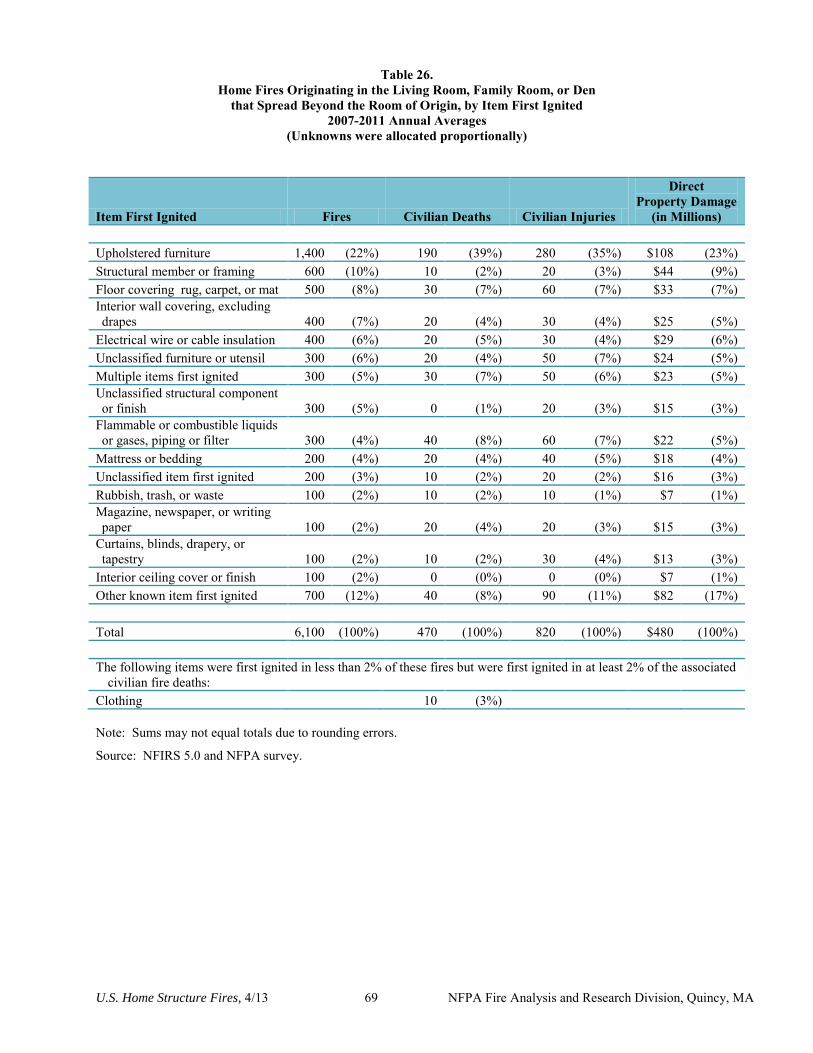
U.S. Home Structure Fires, 4/13 69 NFPA Fire Analysis and Research Division, Quincy, MA
Table 26. Home Fires Originating in the Living Room, Family Room, or Den
that Spread Beyond the Room of Origin, by Item First Ignited 2007-2011 Annual Averages
(Unknowns were allocated proportionally)
Item First Ignited Fires Civilian Deaths Civilian Injuries
Direct Property Damage
(in Millions)
Upholstered furniture 1,400 (22%) 190 (39%) 280 (35%) $108 (23%) Structural member or framing 600 (10%) 10 (2%) 20 (3%) $44 (9%) Floor covering rug, carpet, or mat 500 (8%) 30 (7%) 60 (7%) $33 (7%) Interior wall covering, excluding drapes 400 (7%) 20 (4%) 30 (4%) $25 (5%)
Electrical wire or cable insulation 400 (6%) 20 (5%) 30 (4%) $29 (6%) Unclassified furniture or utensil 300 (6%) 20 (4%) 50 (7%) $24 (5%) Multiple items first ignited 300 (5%) 30 (7%) 50 (6%) $23 (5%) Unclassified structural component or finish 300 (5%) 0 (1%) 20 (3%) $15 (3%)
Flammable or combustible liquids or gases, piping or filter 300 (4%) 40 (8%) 60 (7%) $22 (5%)
Mattress or bedding 200 (4%) 20 (4%) 40 (5%) $18 (4%) Unclassified item first ignited 200 (3%) 10 (2%) 20 (2%) $16 (3%) Rubbish, trash, or waste 100 (2%) 10 (2%) 10 (1%) $7 (1%) Magazine, newspaper, or writing paper 100 (2%) 20 (4%) 20 (3%) $15 (3%)
Curtains, blinds, drapery, or tapestry 100 (2%) 10 (2%) 30 (4%) $13 (3%)
Interior ceiling cover or finish 100 (2%) 0 (0%) 0 (0%) $7 (1%) Other known item first ignited 700 (12%) 40 (8%) 90 (11%) $82 (17%)
Total 6,100 (100%) 470 (100%) 820 (100%) $480 (100%)
The following items were first ignited in less than 2% of these fires but were first ignited in at least 2% of the associated civilian fire deaths:
Clothing
10 (3%)
Note: Sums may not equal totals due to rounding errors.
Source: NFIRS 5.0 and NFPA survey.
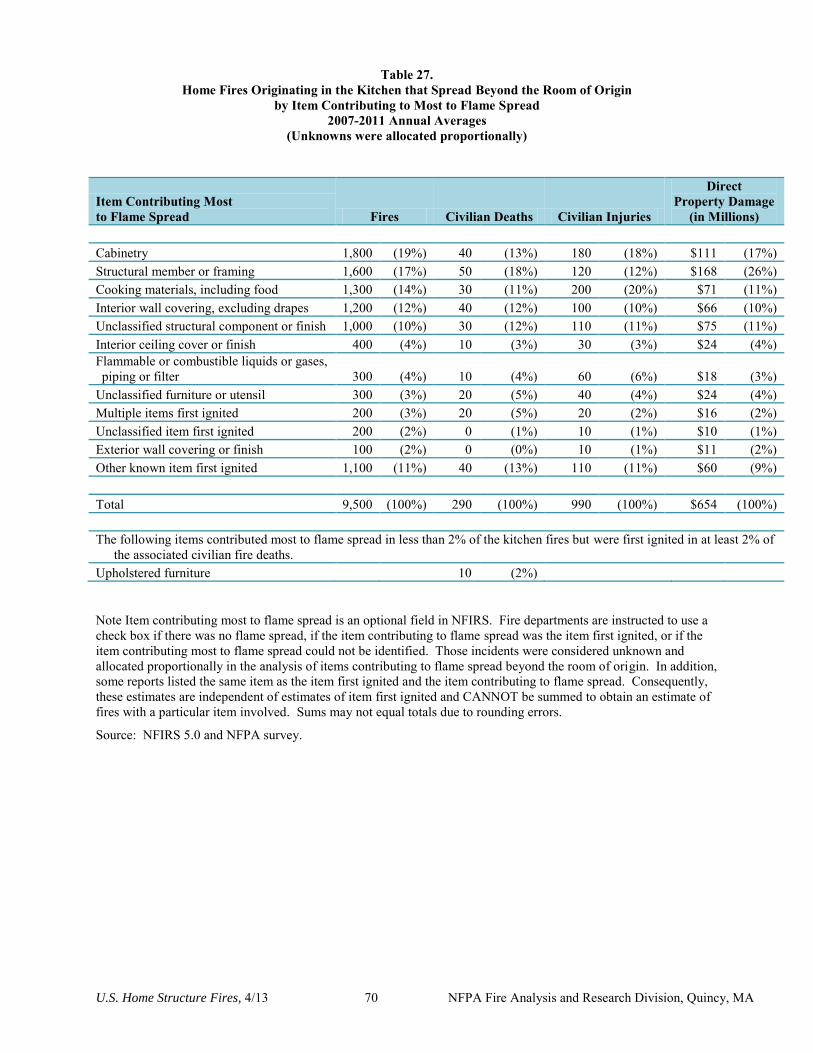
U.S. Home Structure Fires, 4/13 70 NFPA Fire Analysis and Research Division, Quincy, MA
Table 27. Home Fires Originating in the Kitchen that Spread Beyond the Room of Origin
by Item Contributing to Most to Flame Spread 2007-2011 Annual Averages
(Unknowns were allocated proportionally)
Item Contributing Most to Flame Spread Fires Civilian Deaths Civilian Injuries
Direct Property Damage
(in Millions)
Cabinetry 1,800 (19%) 40 (13%) 180 (18%) $111 (17%) Structural member or framing 1,600 (17%) 50 (18%) 120 (12%) $168 (26%) Cooking materials, including food 1,300 (14%) 30 (11%) 200 (20%) $71 (11%) Interior wall covering, excluding drapes 1,200 (12%) 40 (12%) 100 (10%) $66 (10%) Unclassified structural component or finish 1,000 (10%) 30 (12%) 110 (11%) $75 (11%) Interior ceiling cover or finish 400 (4%) 10 (3%) 30 (3%) $24 (4%) Flammable or combustible liquids or gases, piping or filter 300 (4%) 10 (4%) 60 (6%) $18 (3%)
Unclassified furniture or utensil 300 (3%) 20 (5%) 40 (4%) $24 (4%) Multiple items first ignited 200 (3%) 20 (5%) 20 (2%) $16 (2%) Unclassified item first ignited 200 (2%) 0 (1%) 10 (1%) $10 (1%) Exterior wall covering or finish 100 (2%) 0 (0%) 10 (1%) $11 (2%) Other known item first ignited 1,100 (11%) 40 (13%) 110 (11%) $60 (9%)
Total 9,500 (100%) 290 (100%) 990 (100%) $654 (100%)
The following items contributed most to flame spread in less than 2% of the kitchen fires but were first ignited in at least 2% of the associated civilian fire deaths.
Upholstered furniture
10 (2%)
Note Item contributing most to flame spread is an optional field in NFIRS. Fire departments are instructed to use a check box if there was no flame spread, if the item contributing to flame spread was the item first ignited, or if the item contributing most to flame spread could not be identified. Those incidents were considered unknown and allocated proportionally in the analysis of items contributing to flame spread beyond the room of origin. In addition, some reports listed the same item as the item first ignited and the item contributing to flame spread. Consequently, these estimates are independent of estimates of item first ignited and CANNOT be summed to obtain an estimate of fires with a particular item involved. Sums may not equal totals due to rounding errors.
Source: NFIRS 5.0 and NFPA survey.
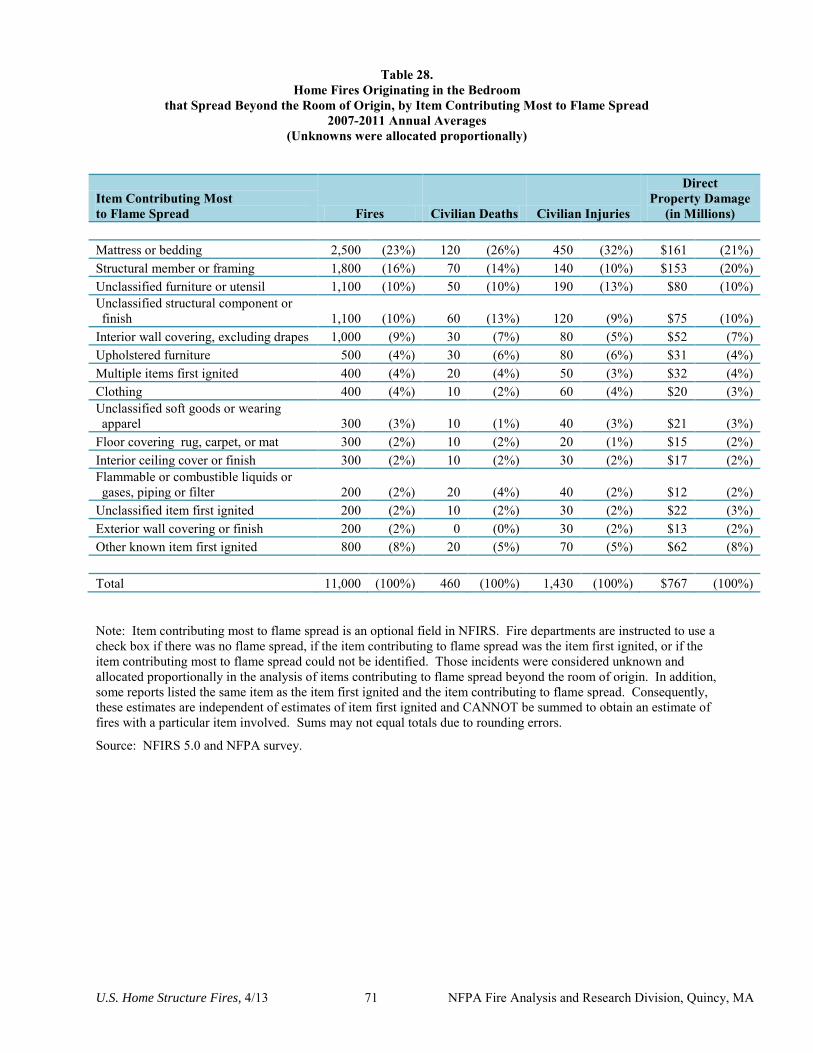
U.S. Home Structure Fires, 4/13 71 NFPA Fire Analysis and Research Division, Quincy, MA
Table 28. Home Fires Originating in the Bedroom
that Spread Beyond the Room of Origin, by Item Contributing Most to Flame Spread 2007-2011 Annual Averages
(Unknowns were allocated proportionally)
Item Contributing Most to Flame Spread Fires Civilian Deaths Civilian Injuries
Direct Property Damage
(in Millions)
Mattress or bedding 2,500 (23%) 120 (26%) 450 (32%) $161 (21%) Structural member or framing 1,800 (16%) 70 (14%) 140 (10%) $153 (20%) Unclassified furniture or utensil 1,100 (10%) 50 (10%) 190 (13%) $80 (10%) Unclassified structural component or finish 1,100 (10%) 60 (13%) 120 (9%) $75 (10%)
Interior wall covering, excluding drapes 1,000 (9%) 30 (7%) 80 (5%) $52 (7%) Upholstered furniture 500 (4%) 30 (6%) 80 (6%) $31 (4%) Multiple items first ignited 400 (4%) 20 (4%) 50 (3%) $32 (4%) Clothing 400 (4%) 10 (2%) 60 (4%) $20 (3%) Unclassified soft goods or wearing apparel 300 (3%) 10 (1%) 40 (3%) $21 (3%)
Floor covering rug, carpet, or mat 300 (2%) 10 (2%) 20 (1%) $15 (2%) Interior ceiling cover or finish 300 (2%) 10 (2%) 30 (2%) $17 (2%) Flammable or combustible liquids or gases, piping or filter 200 (2%) 20 (4%) 40 (2%) $12 (2%)
Unclassified item first ignited 200 (2%) 10 (2%) 30 (2%) $22 (3%) Exterior wall covering or finish 200 (2%) 0 (0%) 30 (2%) $13 (2%) Other known item first ignited 800 (8%) 20 (5%) 70 (5%) $62 (8%)
Total 11,000 (100%) 460 (100%) 1,430 (100%) $767 (100%) Note: Item contributing most to flame spread is an optional field in NFIRS. Fire departments are instructed to use a check box if there was no flame spread, if the item contributing to flame spread was the item first ignited, or if the item contributing most to flame spread could not be identified. Those incidents were considered unknown and allocated proportionally in the analysis of items contributing to flame spread beyond the room of origin. In addition, some reports listed the same item as the item first ignited and the item contributing to flame spread. Consequently, these estimates are independent of estimates of item first ignited and CANNOT be summed to obtain an estimate of fires with a particular item involved. Sums may not equal totals due to rounding errors.
Source: NFIRS 5.0 and NFPA survey.

U.S. Home Structure Fires, 4/13 72 NFPA Fire Analysis and Research Division, Quincy, MA
Table 29. Home Fires Originating in the Living Room, Family Room, or Den that
Spread Beyond the Room of Origin, by Item Contributing Most to Flame Spread 2007-2011 Annual Averages
(Unknowns were allocated proportionally)
Item Contributing Most to Flame Spread Fires Civilian Deaths Civilian Injuries
Direct Property Damage
(in Millions)
Upholstered furniture 1,300 (22%) 160 (34%) 250 (31%) $101 (21%) Structural member or framing 1,200 (20%) 40 (9%) 100 (12%) $104 (22%) Unclassified structural component or finish 600 (10%) 30 (6%) 80 (10%) $39 (8%)
Interior wall covering, excluding drapes 600 (9%) 70 (15%) 50 (6%) $34 (7%)
Unclassified furniture or utensil 400 (6%) 20 (5%) 60 (8%) $35 (7%) Multiple items first ignited 300 (4%) 20 (4%) 50 (6%) $20 (4%) Floor covering rug, carpet, or mat 200 (4%) 20 (3%) 20 (2%) $10 (2%) Flammable or combustible liquids or gases, piping or filter 200 (4%) 30 (6%) 50 (6%) $15 (3%)
Interior ceiling cover or finish 200 (3%) 10 (2%) 20 (3%) $12 (2%) Mattress or bedding 100 (2%) 10 (2%) 20 (3%) $8 (2%) Unclassified item first ignited 100 (2%) 10 (1%) 20 (2%) $11 (2%) Fence or pole 100 (2%) 0 (0%) 0 (0%) $2 (0%) Exterior wall covering or finish 100 (2%) 10 (1%) 10 (1%) $9 (2%) Other known item first ignited 700 (11%) 50 (12%) 80 (10%) $81 (17%)
Total 6,100 (100%) 470 (100%) 820 (100%) $481 (100%)
The following items contributed to flame spread in less than 2% of these fires but contributed most to flame spread in 2% or more of the associated civilian fire deaths.
Magazine, newspaper or writing paper
10 (2%) Rubbish, trash or waste
10 (2%)
Note Item contributing most to flame spread is an optional field in NFIRS. Fire departments are instructed to use a check box if there was no flame spread, if the item contributing to flame spread was the item first ignited, or if the item contributing most to flame spread could not be identified. Those incidents were considered unknown and allocated proportionally in the analysis of items contributing to flame spread beyond the room of origin. In addition, some reports listed the same item as the item first ignited and the item contributing to flame spread. Consequently, these estimates are independent of estimates of item first ignited and CANNOT be summed to obtain an estimate of fires with a particular item involved. Sums may not equal totals due to rounding errors.
Source: NFIRS 5.0 and NFPA survey.
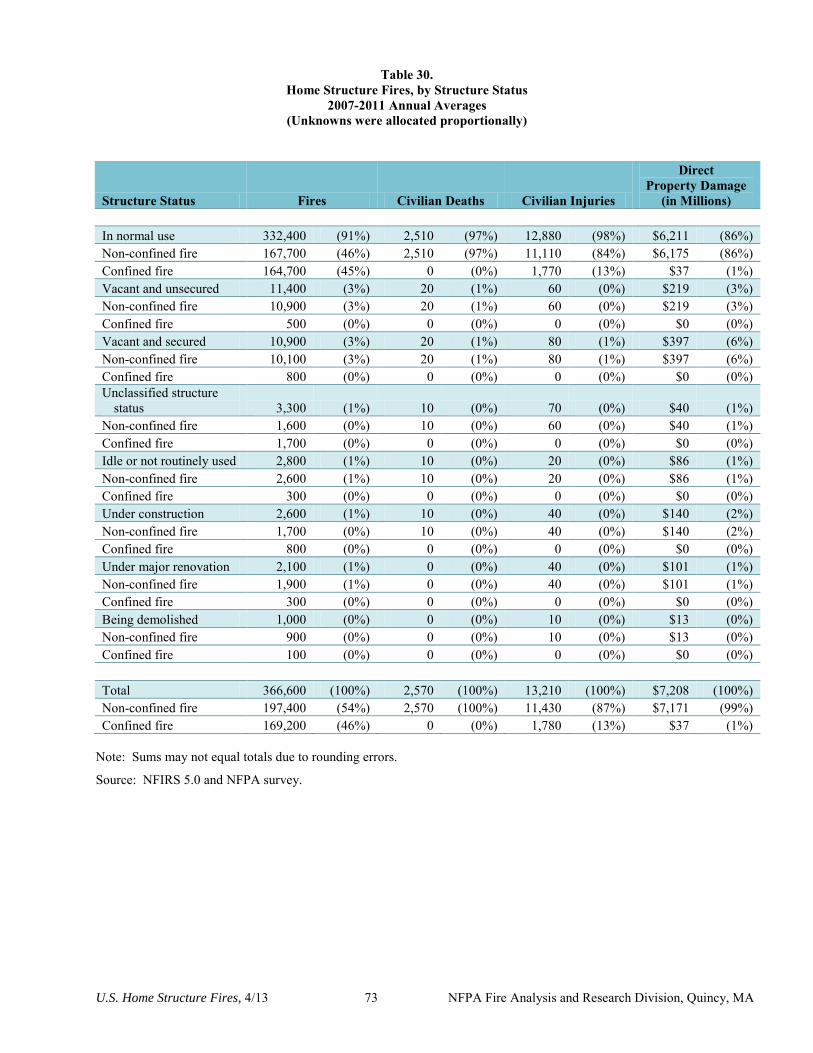
U.S. Home Structure Fires, 4/13 73 NFPA Fire Analysis and Research Division, Quincy, MA
Table 30. Home Structure Fires, by Structure Status
2007-2011 Annual Averages (Unknowns were allocated proportionally)
Structure Status Fires Civilian Deaths Civilian Injuries
Direct Property Damage
(in Millions)
In normal use 332,400 (91%) 2,510 (97%) 12,880 (98%) $6,211 (86%) Non-confined fire 167,700 (46%) 2,510 (97%) 11,110 (84%) $6,175 (86%) Confined fire 164,700 (45%) 0 (0%) 1,770 (13%) $37 (1%) Vacant and unsecured 11,400 (3%) 20 (1%) 60 (0%) $219 (3%) Non-confined fire 10,900 (3%) 20 (1%) 60 (0%) $219 (3%) Confined fire 500 (0%) 0 (0%) 0 (0%) $0 (0%) Vacant and secured 10,900 (3%) 20 (1%) 80 (1%) $397 (6%) Non-confined fire 10,100 (3%) 20 (1%) 80 (1%) $397 (6%) Confined fire 800 (0%) 0 (0%) 0 (0%) $0 (0%) Unclassified structure
status 3,300 (1%) 10 (0%) 70 (0%) $40 (1%) Non-confined fire 1,600 (0%) 10 (0%) 60 (0%) $40 (1%) Confined fire 1,700 (0%) 0 (0%) 0 (0%) $0 (0%) Idle or not routinely used 2,800 (1%) 10 (0%) 20 (0%) $86 (1%) Non-confined fire 2,600 (1%) 10 (0%) 20 (0%) $86 (1%) Confined fire 300 (0%) 0 (0%) 0 (0%) $0 (0%) Under construction 2,600 (1%) 10 (0%) 40 (0%) $140 (2%) Non-confined fire 1,700 (0%) 10 (0%) 40 (0%) $140 (2%) Confined fire 800 (0%) 0 (0%) 0 (0%) $0 (0%) Under major renovation 2,100 (1%) 0 (0%) 40 (0%) $101 (1%) Non-confined fire 1,900 (1%) 0 (0%) 40 (0%) $101 (1%) Confined fire 300 (0%) 0 (0%) 0 (0%) $0 (0%) Being demolished 1,000 (0%) 0 (0%) 10 (0%) $13 (0%) Non-confined fire 900 (0%) 0 (0%) 10 (0%) $13 (0%) Confined fire 100 (0%) 0 (0%) 0 (0%) $0 (0%)
Total 366,600 (100%) 2,570 (100%) 13,210 (100%) $7,208 (100%) Non-confined fire 197,400 (54%) 2,570 (100%) 11,430 (87%) $7,171 (99%) Confined fire 169,200 (46%) 0 (0%) 1,780 (13%) $37 (1%)
Note: Sums may not equal totals due to rounding errors.
Source: NFIRS 5.0 and NFPA survey.
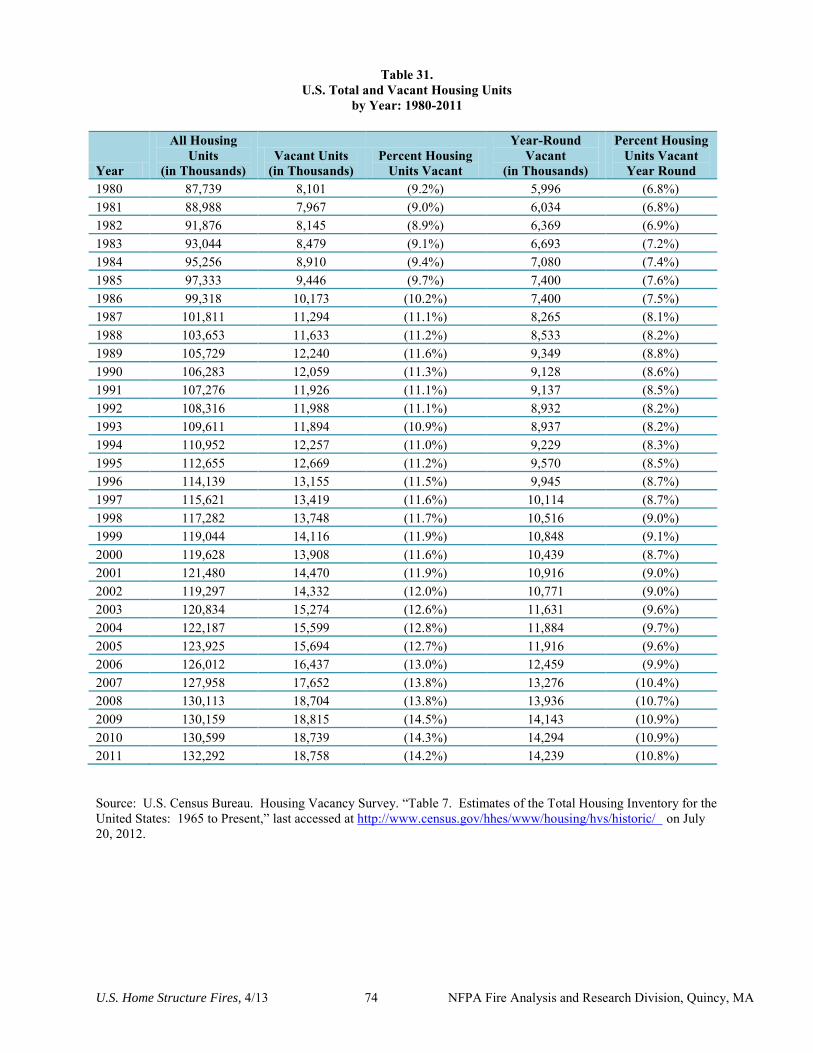
U.S. Home Structure Fires, 4/13 74 NFPA Fire Analysis and Research Division, Quincy, MA
Table 31. U.S. Total and Vacant Housing Units
by Year: 1980-2011
Year
All Housing Units
(in Thousands) Vacant Units
(in Thousands) Percent Housing
Units Vacant
Year-Round Vacant
(in Thousands)
Percent Housing Units Vacant Year Round
1980 87,739 8,101 (9.2%) 5,996 (6.8%) 1981 88,988 7,967 (9.0%) 6,034 (6.8%) 1982 91,876 8,145 (8.9%) 6,369 (6.9%) 1983 93,044 8,479 (9.1%) 6,693 (7.2%) 1984 95,256 8,910 (9.4%) 7,080 (7.4%) 1985 97,333 9,446 (9.7%) 7,400 (7.6%) 1986 99,318 10,173 (10.2%) 7,400 (7.5%) 1987 101,811 11,294 (11.1%) 8,265 (8.1%) 1988 103,653 11,633 (11.2%) 8,533 (8.2%) 1989 105,729 12,240 (11.6%) 9,349 (8.8%) 1990 106,283 12,059 (11.3%) 9,128 (8.6%) 1991 107,276 11,926 (11.1%) 9,137 (8.5%) 1992 108,316 11,988 (11.1%) 8,932 (8.2%) 1993 109,611 11,894 (10.9%) 8,937 (8.2%) 1994 110,952 12,257 (11.0%) 9,229 (8.3%) 1995 112,655 12,669 (11.2%) 9,570 (8.5%) 1996 114,139 13,155 (11.5%) 9,945 (8.7%) 1997 115,621 13,419 (11.6%) 10,114 (8.7%) 1998 117,282 13,748 (11.7%) 10,516 (9.0%) 1999 119,044 14,116 (11.9%) 10,848 (9.1%) 2000 119,628 13,908 (11.6%) 10,439 (8.7%) 2001 121,480 14,470 (11.9%) 10,916 (9.0%) 2002 119,297 14,332 (12.0%) 10,771 (9.0%) 2003 120,834 15,274 (12.6%) 11,631 (9.6%) 2004 122,187 15,599 (12.8%) 11,884 (9.7%) 2005 123,925 15,694 (12.7%) 11,916 (9.6%) 2006 126,012 16,437 (13.0%) 12,459 (9.9%) 2007 127,958 17,652 (13.8%) 13,276 (10.4%) 2008 130,113 18,704 (13.8%) 13,936 (10.7%) 2009 130,159 18,815 (14.5%) 14,143 (10.9%) 2010 130,599 18,739 (14.3%) 14,294 (10.9%) 2011 132,292 18,758 (14.2%) 14,239 (10.8%) Source: U.S. Census Bureau. Housing Vacancy Survey. “Table 7. Estimates of the Total Housing Inventory for the United States: 1965 to Present,” last accessed at http://www.census.gov/hhes/www/housing/hvs/historic/ on July 20, 2012.
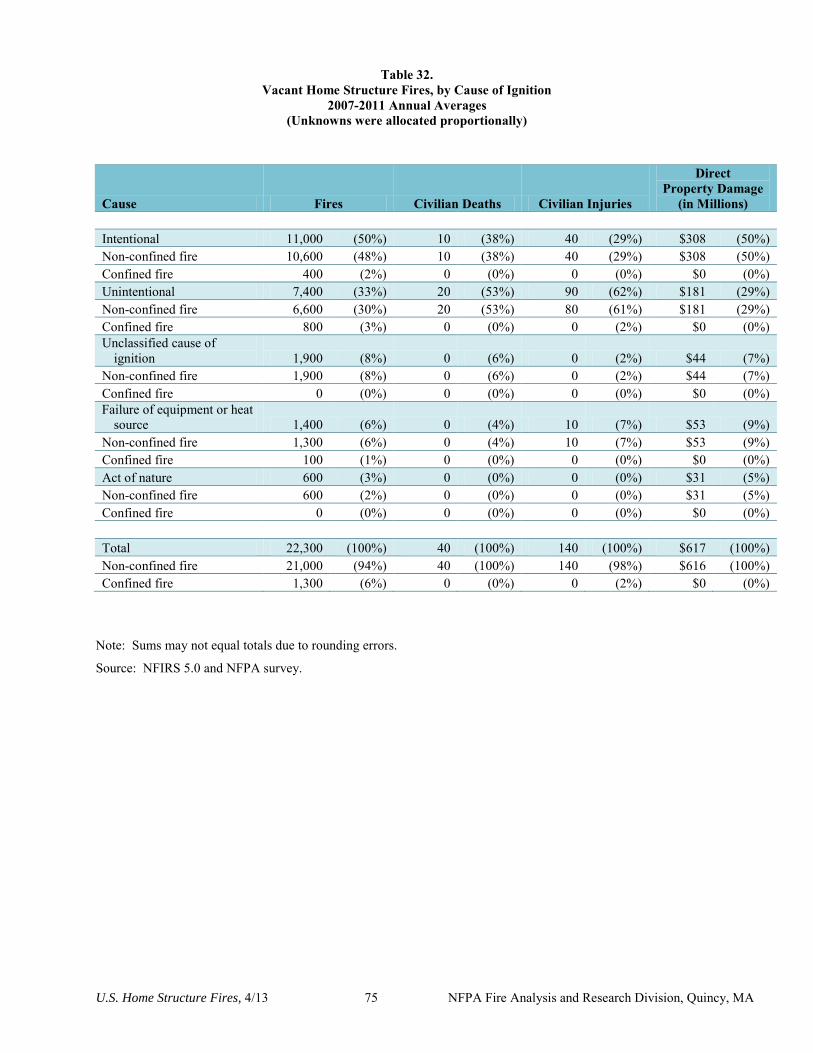
U.S. Home Structure Fires, 4/13 75 NFPA Fire Analysis and Research Division, Quincy, MA
Table 32. Vacant Home Structure Fires, by Cause of Ignition
2007-2011 Annual Averages (Unknowns were allocated proportionally)
Cause Fires Civilian Deaths Civilian Injuries
Direct Property Damage
(in Millions)
Intentional 11,000 (50%) 10 (38%) 40 (29%) $308 (50%) Non-confined fire 10,600 (48%) 10 (38%) 40 (29%) $308 (50%) Confined fire 400 (2%) 0 (0%) 0 (0%) $0 (0%) Unintentional 7,400 (33%) 20 (53%) 90 (62%) $181 (29%) Non-confined fire 6,600 (30%) 20 (53%) 80 (61%) $181 (29%) Confined fire 800 (3%) 0 (0%) 0 (2%) $0 (0%) Unclassified cause of
ignition 1,900 (8%) 0 (6%) 0 (2%) $44 (7%) Non-confined fire 1,900 (8%) 0 (6%) 0 (2%) $44 (7%) Confined fire 0 (0%) 0 (0%) 0 (0%) $0 (0%) Failure of equipment or heat
source 1,400 (6%) 0 (4%) 10 (7%) $53 (9%) Non-confined fire 1,300 (6%) 0 (4%) 10 (7%) $53 (9%) Confined fire 100 (1%) 0 (0%) 0 (0%) $0 (0%) Act of nature 600 (3%) 0 (0%) 0 (0%) $31 (5%) Non-confined fire 600 (2%) 0 (0%) 0 (0%) $31 (5%) Confined fire 0 (0%) 0 (0%) 0 (0%) $0 (0%)
Total 22,300 (100%) 40 (100%) 140 (100%) $617 (100%) Non-confined fire 21,000 (94%) 40 (100%) 140 (98%) $616 (100%) Confined fire 1,300 (6%) 0 (0%) 0 (2%) $0 (0%)
Note: Sums may not equal totals due to rounding errors.
Source: NFIRS 5.0 and NFPA survey.
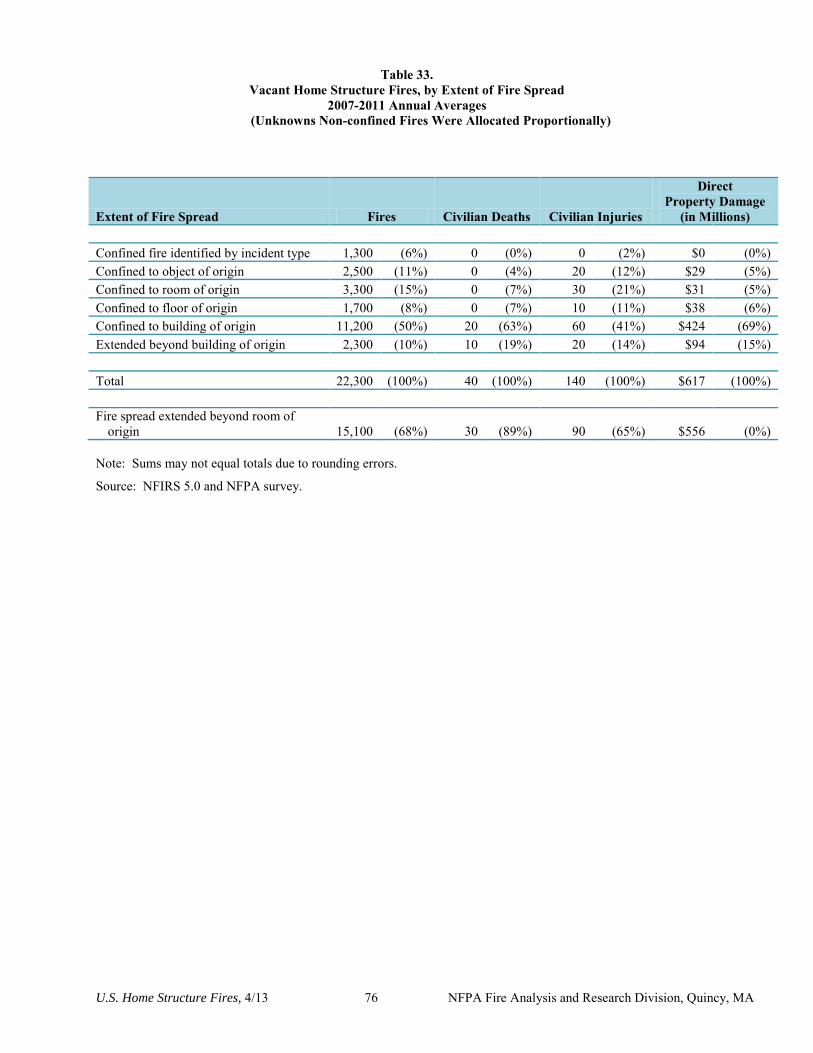
U.S. Home Structure Fires, 4/13 76 NFPA Fire Analysis and Research Division, Quincy, MA
Table 33. Vacant Home Structure Fires, by Extent of Fire Spread
2007-2011 Annual Averages (Unknowns Non-confined Fires Were Allocated Proportionally)
Extent of Fire Spread Fires Civilian Deaths Civilian Injuries
Direct Property Damage
(in Millions)
Confined fire identified by incident type 1,300 (6%) 0 (0%) 0 (2%) $0 (0%) Confined to object of origin 2,500 (11%) 0 (4%) 20 (12%) $29 (5%) Confined to room of origin 3,300 (15%) 0 (7%) 30 (21%) $31 (5%) Confined to floor of origin 1,700 (8%) 0 (7%) 10 (11%) $38 (6%) Confined to building of origin 11,200 (50%) 20 (63%) 60 (41%) $424 (69%) Extended beyond building of origin 2,300 (10%) 10 (19%) 20 (14%) $94 (15%)
Total 22,300 (100%) 40 (100%) 140 (100%) $617 (100%)
Fire spread extended beyond room of origin 15,100 (68%) 30 (89%) 90 (65%) $556 (0%)
Note: Sums may not equal totals due to rounding errors.
Source: NFIRS 5.0 and NFPA survey.

U.S. Home Structure Fires, 4/13 77 NFPA Fire Analysis and Research Division, Quincy, MA
Table 1A. Reported One- or Two-Family Home Structure Fires
by Year: 1980-2011
Year Fires Civilian Deaths
Civilian Injuries
Direct Property Damage
(in Millions) As Reported In 2011 Dollars
1980 590,500 4,175 16,100 $2,447 $6,681
1981 574,000 4,430 14,875 $2,713 $6,694
1982 538,000 3,960 15,750 $2,794 $6,498
1983 523,500 3,825 16,450 $2,792 $6,293
1984 506,000 3,290 15,100 $2,945 $6,360
1985 501,500 4,020 15,250 $3,217 $6,709
1986 468,000 4,005 14,650 $2,992 $6,139
1987 433,000 3,780 15,200 $3,078 $6,087
1988 432,500 4,125 17,125 $3,349 $6,367
1989 402,500 3,545 15,225 $3,335 $6,048
1990 359,000 3,370 15,250 $3,534 $6,083
1991 363,000 2,905 15,600 $3,354 $5,532
1992 358,000 3,160 15,275 $3,178 $5,092
1993 358,000 3,035 15,700 $4,111 $6,393
1994 341,000 2,785 14,000 $3,537 $5,365
1995 320,000 3,035 13,450 $3,615 $5,329
1996 324,000 3,470 13,700 $4,121 $5,908
1997 302,500 2,700 12,300 $3,735 $5,229
1998 283,000 2,775 11,800 $3,642 $5,025
1999 282,500 2,375 11,550 $4,123 $5,559
2000 283,500 2,920 12,575 $4,639 $6,057
2001 295,500 2,650 11,400 $4,652 $5,906
2002 300,500 2,280 9,950 $5,005 $6,253
2003 297,000 2,735 10,000 $5,052 $6,176
2004 301,500 2,680 10,500 $4,948 $5,893
2005 287,000 2,570 10,300 $5,781 $6,651
2006 304,500 2,155 8,800 $5,936 $6,616
2007 300,500 2,350 9,650 $6,225 $6,743
2008 291,000 2,365 9,185 $6,892 $7,202
2009 272,500 2,100 9,300 $6,391 $6,693
2010 279,000 2,200 9,400 $5,895 $6,080
2011 274,500 2,105 9,485 $5,746 $5,746
Source: Fire Loss in the United Sates series of NFPA annual reports by Michael J. Karter, Jr. Inflation adjustments were based on the Consumer Price Index Purchasing Power of the Dollar.

U.S. Home Structure Fires, 4/13 78 NFPA Fire Analysis and Research Division, Quincy, MA
Table 2A. Reported One- or Two-Family Home Structure Fires, by Month
2007-2011 Annual Averages
Month Fires Civilian Deaths
Civilian Injuries
Direct Property Damage
(in Millions) January 28,800 (11%) 310 (14%) 1,000 (11%) $621 (10%)
February 24,200 (9%) 250 (12%) 850 (10%) $514 (9%)
March 23,600 (9%) 220 (10%) 860 (10%) $527 (9%)
April 21,200 (8%) 170 (8%) 740 (8%) $467 (8%)
May 19,400 (7%) 150 (7%) 660 (7%) $452 (8%)
June 18,600 (7%) 120 (5%) 620 (7%) $442 (7%)
July 19,300 (7%) 130 (6%) 670 (7%) $462 (8%)
August 18,300 (7%) 130 (6%) 640 (7%) $430 (7%)
September 17,400 (7%) 120 (6%) 600 (7%) $378 (6%)
October 20,200 (8%) 150 (7%) 660 (7%) $585 (10%)
November 22,600 (9%) 180 (8%) 760 (9%) $501 (8%)
December 26,500 (10%) 240 (11%) 870 (10%) $581 (10%)
Total 260,200 (100%) 2,160 (100%) 8,930 (100%) $5,959 (100%)
Monthly average 21,700 (8%) 180 (8%) 740 (8%) $497 (8%)
Table 3A. Reported One- or Two-Family Home Structure Fires, by Day of Week
2007-2011 Annual Averages
Day of Week Fires Civilian Deaths
Civilian Injuries
Direct Property Damage
(in Millions)
Sunday 39,400 (15%) 320 (15%) 1,300 (15%) $995 (17%)
Monday 37,500 (14%) 310 (14%) 1,260 (14%) $862 (14%)
Tuesday 36,100 (14%) 280 (13%) 1,310 (15%) $779 (13%)
Wednesday 36,000 (14%) 290 (13%) 1,250 (14%) $791 (13%)
Thursday 36,500 (14%) 290 (13%) 1,210 (14%) $795 (13%)
Friday 36,100 (14%) 320 (15%) 1,210 (14%) $823 (14%)
Saturday 38,600 (15%) 360 (17%) 1,390 (16%) $914 (15%)
Total 260,200 (100%) 2,160 (100%) 8,930 (100%) $5,959 (100%)
Average by Day 37,200 (14%) 310 (14%) 1,280 (14%) $851 (14%)
Note: Sums may not equal totals due to rounding errors. Source: NFIRS 5.0 and NFPA survey.
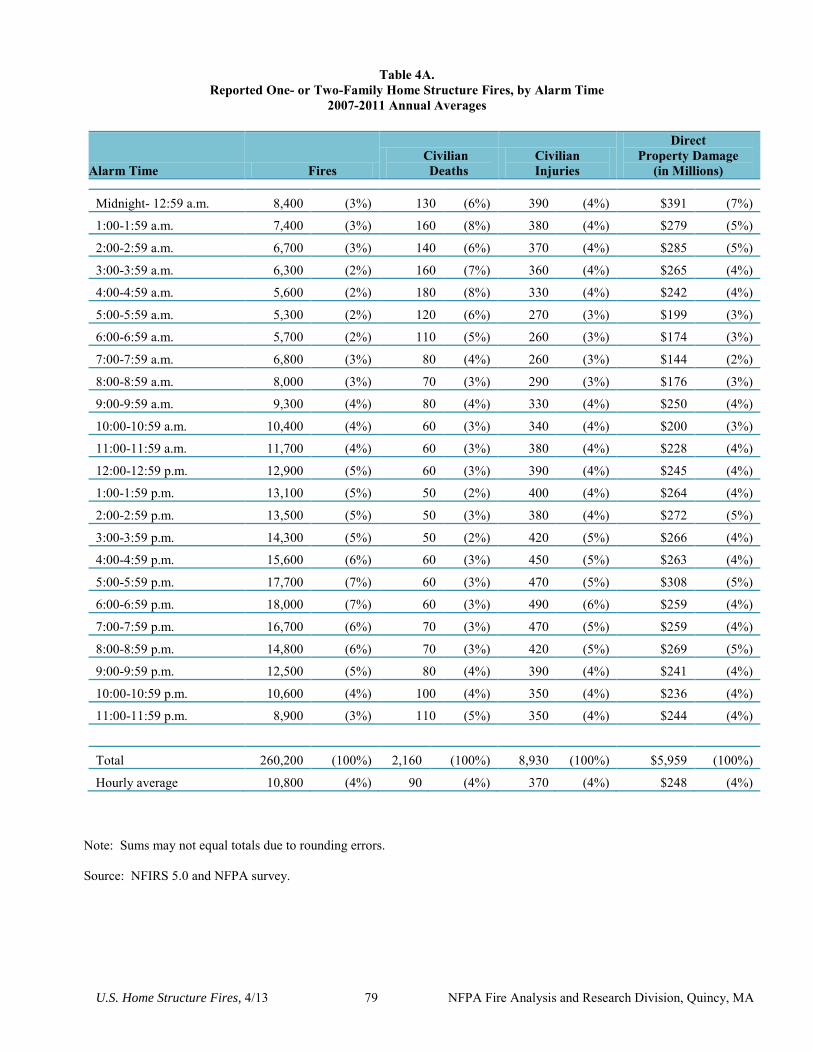
U.S. Home Structure Fires, 4/13 79 NFPA Fire Analysis and Research Division, Quincy, MA
Table 4A. Reported One- or Two-Family Home Structure Fires, by Alarm Time
2007-2011 Annual Averages
Alarm Time Fires Civilian Deaths
Civilian Injuries
Direct Property Damage
(in Millions)
Midnight- 12:59 a.m. 8,400 (3%) 130 (6%) 390 (4%) $391 (7%)
1:00-1:59 a.m. 7,400 (3%) 160 (8%) 380 (4%) $279 (5%)
2:00-2:59 a.m. 6,700 (3%) 140 (6%) 370 (4%) $285 (5%)
3:00-3:59 a.m. 6,300 (2%) 160 (7%) 360 (4%) $265 (4%)
4:00-4:59 a.m. 5,600 (2%) 180 (8%) 330 (4%) $242 (4%)
5:00-5:59 a.m. 5,300 (2%) 120 (6%) 270 (3%) $199 (3%)
6:00-6:59 a.m. 5,700 (2%) 110 (5%) 260 (3%) $174 (3%)
7:00-7:59 a.m. 6,800 (3%) 80 (4%) 260 (3%) $144 (2%)
8:00-8:59 a.m. 8,000 (3%) 70 (3%) 290 (3%) $176 (3%)
9:00-9:59 a.m. 9,300 (4%) 80 (4%) 330 (4%) $250 (4%)
10:00-10:59 a.m. 10,400 (4%) 60 (3%) 340 (4%) $200 (3%)
11:00-11:59 a.m. 11,700 (4%) 60 (3%) 380 (4%) $228 (4%)
12:00-12:59 p.m. 12,900 (5%) 60 (3%) 390 (4%) $245 (4%)
1:00-1:59 p.m. 13,100 (5%) 50 (2%) 400 (4%) $264 (4%)
2:00-2:59 p.m. 13,500 (5%) 50 (3%) 380 (4%) $272 (5%)
3:00-3:59 p.m. 14,300 (5%) 50 (2%) 420 (5%) $266 (4%)
4:00-4:59 p.m. 15,600 (6%) 60 (3%) 450 (5%) $263 (4%)
5:00-5:59 p.m. 17,700 (7%) 60 (3%) 470 (5%) $308 (5%)
6:00-6:59 p.m. 18,000 (7%) 60 (3%) 490 (6%) $259 (4%)
7:00-7:59 p.m. 16,700 (6%) 70 (3%) 470 (5%) $259 (4%)
8:00-8:59 p.m. 14,800 (6%) 70 (3%) 420 (5%) $269 (5%)
9:00-9:59 p.m. 12,500 (5%) 80 (4%) 390 (4%) $241 (4%)
10:00-10:59 p.m. 10,600 (4%) 100 (4%) 350 (4%) $236 (4%)
11:00-11:59 p.m. 8,900 (3%) 110 (5%) 350 (4%) $244 (4%)
Total 260,200 (100%) 2,160 (100%) 8,930 (100%) $5,959 (100%)
Hourly average 10,800 (4%) 90 (4%) 370 (4%) $248 (4%)
Note: Sums may not equal totals due to rounding errors. Source: NFIRS 5.0 and NFPA survey.
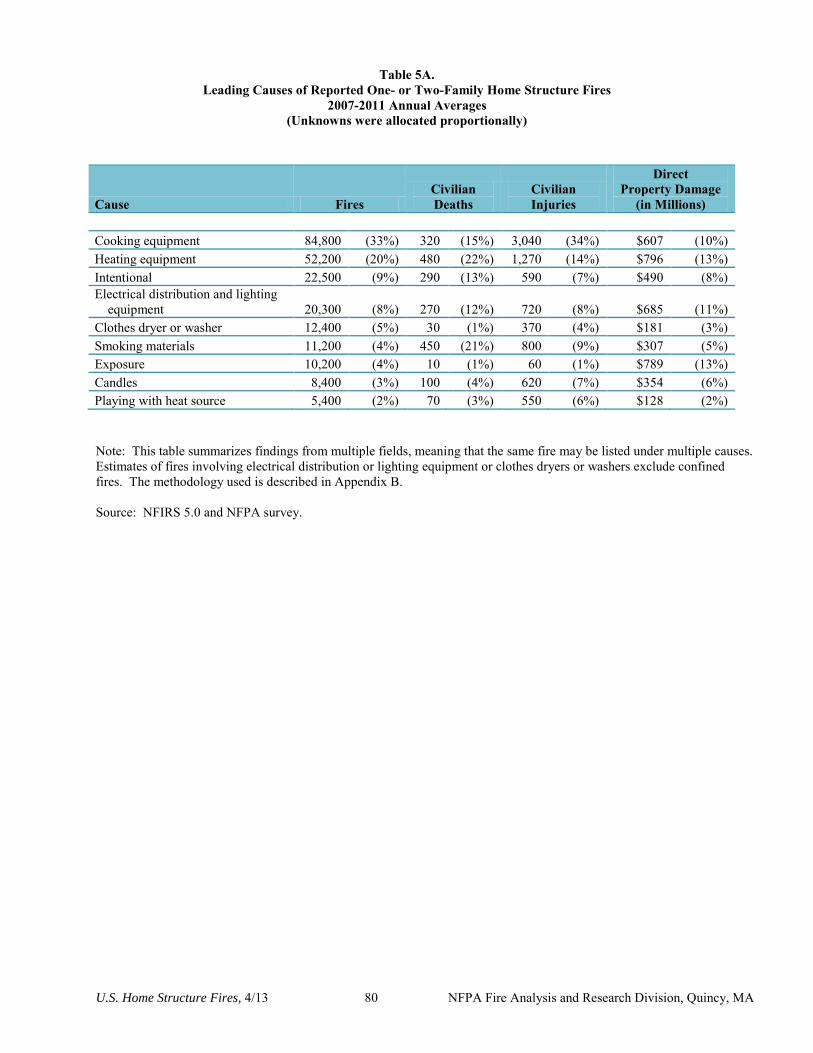
U.S. Home Structure Fires, 4/13 80 NFPA Fire Analysis and Research Division, Quincy, MA
Table 5A. Leading Causes of Reported One- or Two-Family Home Structure Fires
2007-2011 Annual Averages (Unknowns were allocated proportionally)
Cause Fires Civilian Deaths
Civilian Injuries
Direct Property Damage
(in Millions)
Cooking equipment 84,800 (33%) 320 (15%) 3,040 (34%) $607 (10%) Heating equipment 52,200 (20%) 480 (22%) 1,270 (14%) $796 (13%) Intentional 22,500 (9%) 290 (13%) 590 (7%) $490 (8%) Electrical distribution and lighting
equipment 20,300 (8%) 270 (12%) 720 (8%) $685 (11%) Clothes dryer or washer 12,400 (5%) 30 (1%) 370 (4%) $181 (3%) Smoking materials 11,200 (4%) 450 (21%) 800 (9%) $307 (5%) Exposure 10,200 (4%) 10 (1%) 60 (1%) $789 (13%) Candles 8,400 (3%) 100 (4%) 620 (7%) $354 (6%) Playing with heat source 5,400 (2%) 70 (3%) 550 (6%) $128 (2%)
Note: This table summarizes findings from multiple fields, meaning that the same fire may be listed under multiple causes. Estimates of fires involving electrical distribution or lighting equipment or clothes dryers or washers exclude confined fires. The methodology used is described in Appendix B. Source: NFIRS 5.0 and NFPA survey.
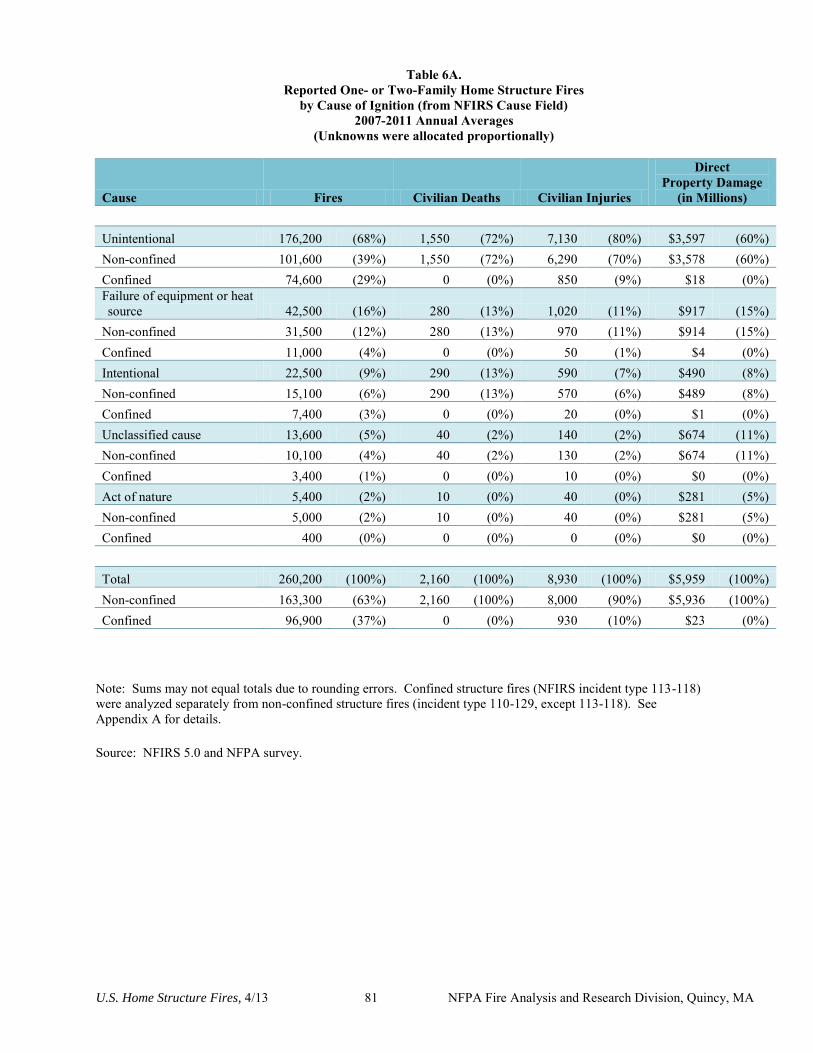
U.S. Home Structure Fires, 4/13 81 NFPA Fire Analysis and Research Division, Quincy, MA
Table 6A. Reported One- or Two-Family Home Structure Fires
by Cause of Ignition (from NFIRS Cause Field) 2007-2011 Annual Averages
(Unknowns were allocated proportionally)
Cause Fires Civilian Deaths Civilian Injuries
Direct Property Damage
(in Millions)
Unintentional 176,200 (68%) 1,550 (72%) 7,130 (80%) $3,597 (60%) Non-confined 101,600 (39%) 1,550 (72%) 6,290 (70%) $3,578 (60%) Confined 74,600 (29%) 0 (0%) 850 (9%) $18 (0%) Failure of equipment or heat source 42,500 (16%) 280 (13%) 1,020 (11%) $917 (15%)
Non-confined 31,500 (12%) 280 (13%) 970 (11%) $914 (15%) Confined 11,000 (4%) 0 (0%) 50 (1%) $4 (0%) Intentional 22,500 (9%) 290 (13%) 590 (7%) $490 (8%) Non-confined 15,100 (6%) 290 (13%) 570 (6%) $489 (8%) Confined 7,400 (3%) 0 (0%) 20 (0%) $1 (0%) Unclassified cause 13,600 (5%) 40 (2%) 140 (2%) $674 (11%) Non-confined 10,100 (4%) 40 (2%) 130 (2%) $674 (11%) Confined 3,400 (1%) 0 (0%) 10 (0%) $0 (0%) Act of nature 5,400 (2%) 10 (0%) 40 (0%) $281 (5%) Non-confined 5,000 (2%) 10 (0%) 40 (0%) $281 (5%) Confined 400 (0%) 0 (0%) 0 (0%) $0 (0%)
Total 260,200 (100%) 2,160 (100%) 8,930 (100%) $5,959 (100%) Non-confined 163,300 (63%) 2,160 (100%) 8,000 (90%) $5,936 (100%) Confined 96,900 (37%) 0 (0%) 930 (10%) $23 (0%)
Note: Sums may not equal totals due to rounding errors. Confined structure fires (NFIRS incident type 113-118) were analyzed separately from non-confined structure fires (incident type 110-129, except 113-118). See Appendix A for details. Source: NFIRS 5.0 and NFPA survey.
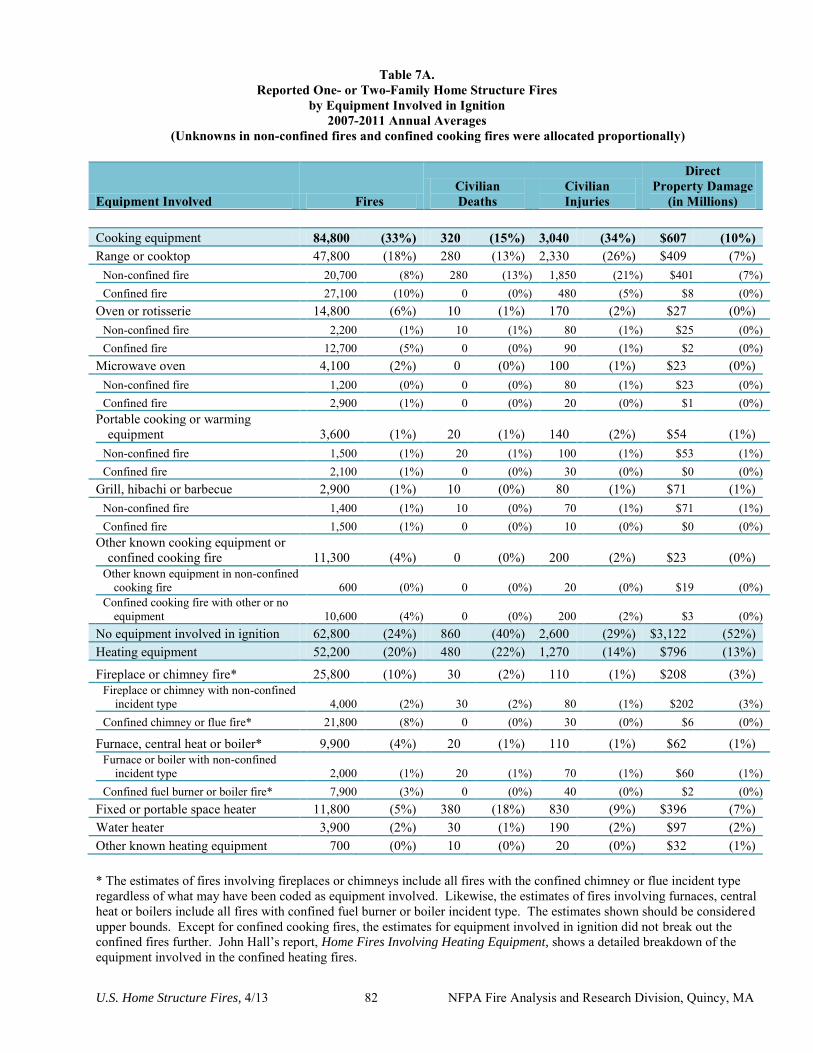
U.S. Home Structure Fires, 4/13 82 NFPA Fire Analysis and Research Division, Quincy, MA
Table 7A. Reported One- or Two-Family Home Structure Fires
by Equipment Involved in Ignition 2007-2011 Annual Averages
(Unknowns in non-confined fires and confined cooking fires were allocated proportionally)
Equipment Involved Fires Civilian Deaths
Civilian Injuries
Direct Property Damage
(in Millions)
Cooking equipment 84,800 (33%) 320 (15%) 3,040 (34%) $607 (10%) Range or cooktop 47,800 (18%) 280 (13%) 2,330 (26%) $409 (7%)
Non-confined fire 20,700 (8%) 280 (13%) 1,850 (21%) $401 (7%) Confined fire 27,100 (10%) 0 (0%) 480 (5%) $8 (0%)
Oven or rotisserie 14,800 (6%) 10 (1%) 170 (2%) $27 (0%) Non-confined fire 2,200 (1%) 10 (1%) 80 (1%) $25 (0%) Confined fire 12,700 (5%) 0 (0%) 90 (1%) $2 (0%)
Microwave oven 4,100 (2%) 0 (0%) 100 (1%) $23 (0%) Non-confined fire 1,200 (0%) 0 (0%) 80 (1%) $23 (0%) Confined fire 2,900 (1%) 0 (0%) 20 (0%) $1 (0%)
Portable cooking or warming equipment 3,600 (1%) 20 (1%) 140 (2%) $54 (1%)
Non-confined fire 1,500 (1%) 20 (1%) 100 (1%) $53 (1%) Confined fire 2,100 (1%) 0 (0%) 30 (0%) $0 (0%)
Grill, hibachi or barbecue 2,900 (1%) 10 (0%) 80 (1%) $71 (1%) Non-confined fire 1,400 (1%) 10 (0%) 70 (1%) $71 (1%) Confined fire 1,500 (1%) 0 (0%) 10 (0%) $0 (0%)
Other known cooking equipment or confined cooking fire 11,300 (4%) 0 (0%) 200 (2%) $23 (0%)
Other known equipment in non-confined cooking fire 600 (0%) 0 (0%) 20 (0%) $19 (0%)
Confined cooking fire with other or no equipment 10,600 (4%) 0 (0%) 200 (2%) $3 (0%)
No equipment involved in ignition 62,800 (24%) 860 (40%) 2,600 (29%) $3,122 (52%) Heating equipment 52,200 (20%) 480 (22%) 1,270 (14%) $796 (13%)
Fireplace or chimney fire* 25,800 (10%) 30 (2%) 110 (1%) $208 (3%) Fireplace or chimney with non-confined
incident type 4,000 (2%) 30 (2%) 80 (1%) $202 (3%) Confined chimney or flue fire* 21,800 (8%) 0 (0%) 30 (0%) $6 (0%)
Furnace, central heat or boiler* 9,900 (4%) 20 (1%) 110 (1%) $62 (1%) Furnace or boiler with non-confined
incident type 2,000 (1%) 20 (1%) 70 (1%) $60 (1%) Confined fuel burner or boiler fire* 7,900 (3%) 0 (0%) 40 (0%) $2 (0%)
Fixed or portable space heater 11,800 (5%) 380 (18%) 830 (9%) $396 (7%) Water heater 3,900 (2%) 30 (1%) 190 (2%) $97 (2%) Other known heating equipment 700 (0%) 10 (0%) 20 (0%) $32 (1%) * The estimates of fires involving fireplaces or chimneys include all fires with the confined chimney or flue incident type regardless of what may have been coded as equipment involved. Likewise, the estimates of fires involving furnaces, central heat or boilers include all fires with confined fuel burner or boiler incident type. The estimates shown should be considered upper bounds. Except for confined cooking fires, the estimates for equipment involved in ignition did not break out the confined fires further. John Hall’s report, Home Fires Involving Heating Equipment, shows a detailed breakdown of the equipment involved in the confined heating fires.
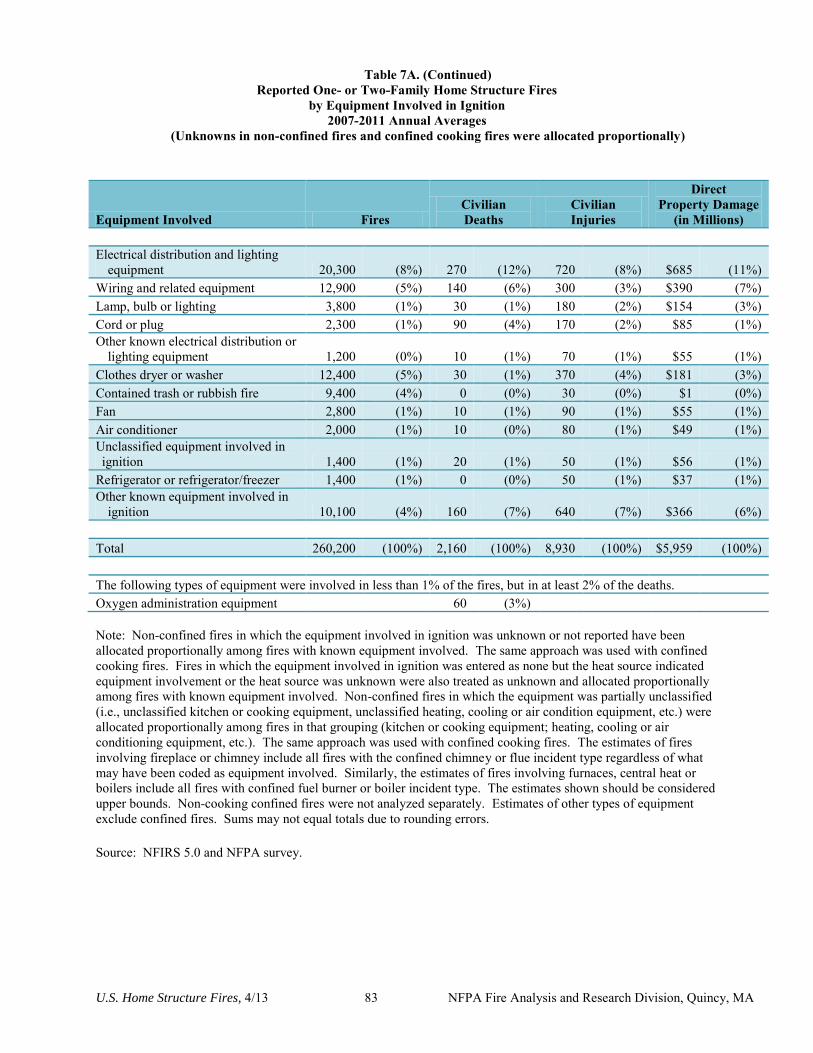
U.S. Home Structure Fires, 4/13 83 NFPA Fire Analysis and Research Division, Quincy, MA
Table 7A. (Continued) Reported One- or Two-Family Home Structure Fires
by Equipment Involved in Ignition 2007-2011 Annual Averages
(Unknowns in non-confined fires and confined cooking fires were allocated proportionally)
Equipment Involved Fires Civilian Deaths
Civilian Injuries
Direct Property Damage
(in Millions)
Electrical distribution and lighting equipment 20,300 (8%) 270 (12%) 720 (8%) $685 (11%)
Wiring and related equipment 12,900 (5%) 140 (6%) 300 (3%) $390 (7%) Lamp, bulb or lighting 3,800 (1%) 30 (1%) 180 (2%) $154 (3%) Cord or plug 2,300 (1%) 90 (4%) 170 (2%) $85 (1%) Other known electrical distribution or
lighting equipment 1,200 (0%) 10 (1%) 70 (1%) $55 (1%) Clothes dryer or washer 12,400 (5%) 30 (1%) 370 (4%) $181 (3%) Contained trash or rubbish fire 9,400 (4%) 0 (0%) 30 (0%) $1 (0%) Fan 2,800 (1%) 10 (1%) 90 (1%) $55 (1%) Air conditioner 2,000 (1%) 10 (0%) 80 (1%) $49 (1%) Unclassified equipment involved in ignition 1,400 (1%) 20 (1%) 50 (1%) $56 (1%)
Refrigerator or refrigerator/freezer 1,400 (1%) 0 (0%) 50 (1%) $37 (1%) Other known equipment involved in
ignition 10,100 (4%) 160 (7%) 640 (7%) $366 (6%)
Total 260,200 (100%) 2,160 (100%) 8,930 (100%) $5,959 (100%)
The following types of equipment were involved in less than 1% of the fires, but in at least 2% of the deaths. Oxygen administration equipment
60 (3%)
Note: Non-confined fires in which the equipment involved in ignition was unknown or not reported have been allocated proportionally among fires with known equipment involved. The same approach was used with confined cooking fires. Fires in which the equipment involved in ignition was entered as none but the heat source indicated equipment involvement or the heat source was unknown were also treated as unknown and allocated proportionally among fires with known equipment involved. Non-confined fires in which the equipment was partially unclassified (i.e., unclassified kitchen or cooking equipment, unclassified heating, cooling or air condition equipment, etc.) were allocated proportionally among fires in that grouping (kitchen or cooking equipment; heating, cooling or air conditioning equipment, etc.). The same approach was used with confined cooking fires. The estimates of fires involving fireplace or chimney include all fires with the confined chimney or flue incident type regardless of what may have been coded as equipment involved. Similarly, the estimates of fires involving furnaces, central heat or boilers include all fires with confined fuel burner or boiler incident type. The estimates shown should be considered upper bounds. Non-cooking confined fires were not analyzed separately. Estimates of other types of equipment exclude confined fires. Sums may not equal totals due to rounding errors.
Source: NFIRS 5.0 and NFPA survey.
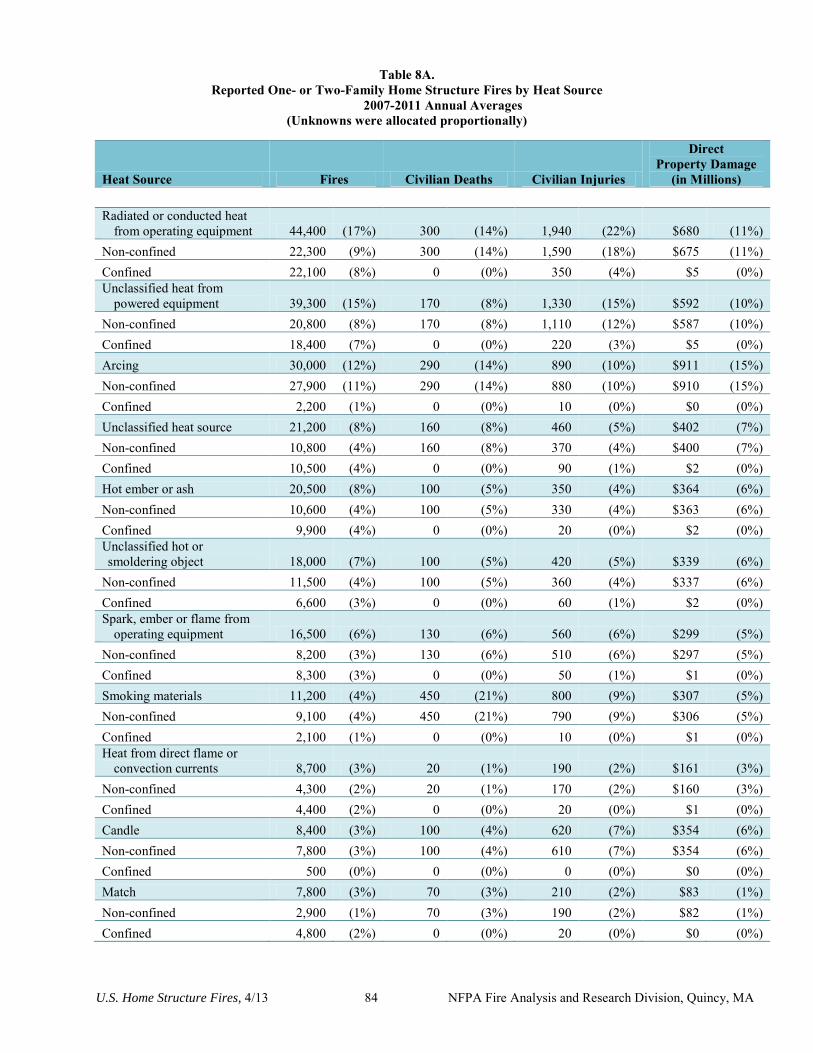
U.S. Home Structure Fires, 4/13 84 NFPA Fire Analysis and Research Division, Quincy, MA
Table 8A. Reported One- or Two-Family Home Structure Fires by Heat Source
2007-2011 Annual Averages (Unknowns were allocated proportionally)
Heat Source Fires Civilian Deaths Civilian Injuries
Direct Property Damage
(in Millions)
Radiated or conducted heat from operating equipment 44,400 (17%) 300 (14%) 1,940 (22%) $680 (11%)
Non-confined 22,300 (9%) 300 (14%) 1,590 (18%) $675 (11%) Confined 22,100 (8%) 0 (0%) 350 (4%) $5 (0%) Unclassified heat from
powered equipment 39,300 (15%) 170 (8%) 1,330 (15%) $592 (10%) Non-confined 20,800 (8%) 170 (8%) 1,110 (12%) $587 (10%) Confined 18,400 (7%) 0 (0%) 220 (3%) $5 (0%) Arcing 30,000 (12%) 290 (14%) 890 (10%) $911 (15%) Non-confined 27,900 (11%) 290 (14%) 880 (10%) $910 (15%) Confined 2,200 (1%) 0 (0%) 10 (0%) $0 (0%) Unclassified heat source 21,200 (8%) 160 (8%) 460 (5%) $402 (7%) Non-confined 10,800 (4%) 160 (8%) 370 (4%) $400 (7%) Confined 10,500 (4%) 0 (0%) 90 (1%) $2 (0%) Hot ember or ash 20,500 (8%) 100 (5%) 350 (4%) $364 (6%) Non-confined 10,600 (4%) 100 (5%) 330 (4%) $363 (6%) Confined 9,900 (4%) 0 (0%) 20 (0%) $2 (0%) Unclassified hot or smoldering object 18,000 (7%) 100 (5%) 420 (5%) $339 (6%)
Non-confined 11,500 (4%) 100 (5%) 360 (4%) $337 (6%) Confined 6,600 (3%) 0 (0%) 60 (1%) $2 (0%) Spark, ember or flame from
operating equipment 16,500 (6%) 130 (6%) 560 (6%) $299 (5%) Non-confined 8,200 (3%) 130 (6%) 510 (6%) $297 (5%) Confined 8,300 (3%) 0 (0%) 50 (1%) $1 (0%) Smoking materials 11,200 (4%) 450 (21%) 800 (9%) $307 (5%) Non-confined 9,100 (4%) 450 (21%) 790 (9%) $306 (5%) Confined 2,100 (1%) 0 (0%) 10 (0%) $1 (0%) Heat from direct flame or
convection currents 8,700 (3%) 20 (1%) 190 (2%) $161 (3%) Non-confined 4,300 (2%) 20 (1%) 170 (2%) $160 (3%) Confined 4,400 (2%) 0 (0%) 20 (0%) $1 (0%) Candle 8,400 (3%) 100 (4%) 620 (7%) $354 (6%) Non-confined 7,800 (3%) 100 (4%) 610 (7%) $354 (6%) Confined 500 (0%) 0 (0%) 0 (0%) $0 (0%) Match 7,800 (3%) 70 (3%) 210 (2%) $83 (1%) Non-confined 2,900 (1%) 70 (3%) 190 (2%) $82 (1%) Confined 4,800 (2%) 0 (0%) 20 (0%) $0 (0%)
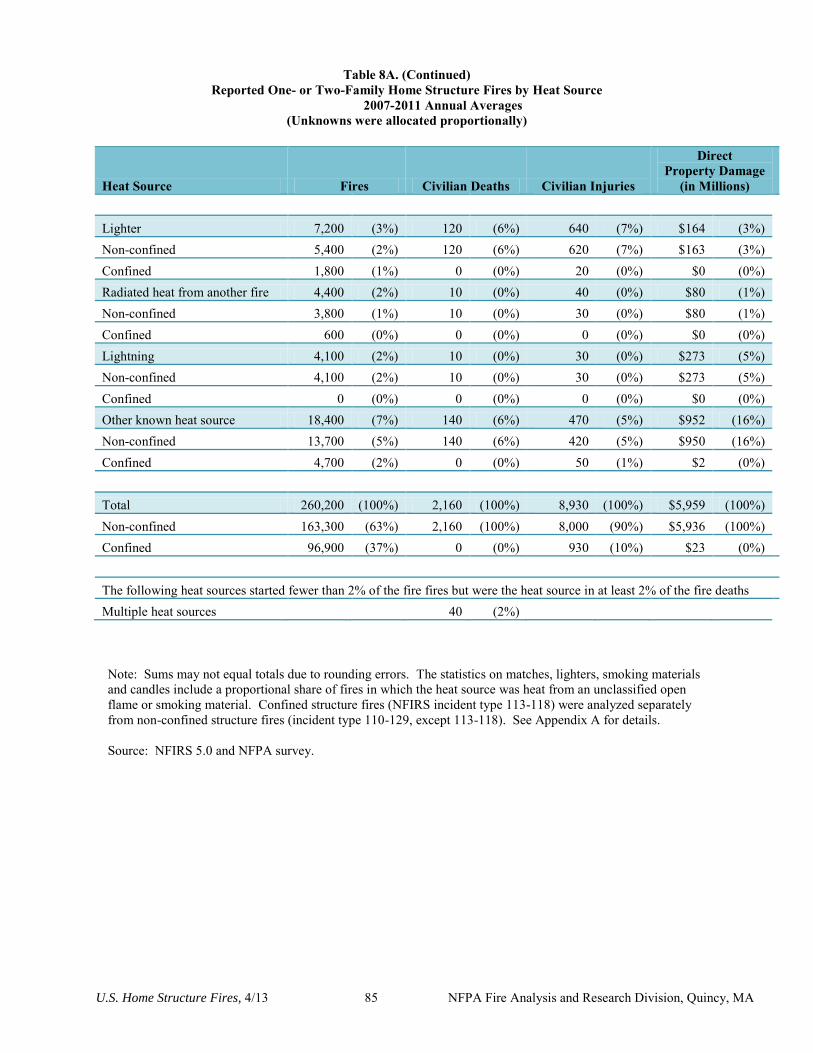
U.S. Home Structure Fires, 4/13 85 NFPA Fire Analysis and Research Division, Quincy, MA
Table 8A. (Continued) Reported One- or Two-Family Home Structure Fires by Heat Source
2007-2011 Annual Averages (Unknowns were allocated proportionally)
Heat Source Fires Civilian Deaths Civilian Injuries
Direct Property Damage
(in Millions)
Lighter 7,200 (3%) 120 (6%) 640 (7%) $164 (3%) Non-confined 5,400 (2%) 120 (6%) 620 (7%) $163 (3%) Confined 1,800 (1%) 0 (0%) 20 (0%) $0 (0%) Radiated heat from another fire 4,400 (2%) 10 (0%) 40 (0%) $80 (1%) Non-confined 3,800 (1%) 10 (0%) 30 (0%) $80 (1%) Confined 600 (0%) 0 (0%) 0 (0%) $0 (0%) Lightning 4,100 (2%) 10 (0%) 30 (0%) $273 (5%) Non-confined 4,100 (2%) 10 (0%) 30 (0%) $273 (5%) Confined 0 (0%) 0 (0%) 0 (0%) $0 (0%) Other known heat source 18,400 (7%) 140 (6%) 470 (5%) $952 (16%) Non-confined 13,700 (5%) 140 (6%) 420 (5%) $950 (16%) Confined 4,700 (2%) 0 (0%) 50 (1%) $2 (0%)
Total 260,200 (100%) 2,160 (100%) 8,930 (100%) $5,959 (100%) Non-confined 163,300 (63%) 2,160 (100%) 8,000 (90%) $5,936 (100%) Confined 96,900 (37%) 0 (0%) 930 (10%) $23 (0%)
The following heat sources started fewer than 2% of the fire fires but were the heat source in at least 2% of the fire deaths Multiple heat sources
40 (2%)
Note: Sums may not equal totals due to rounding errors. The statistics on matches, lighters, smoking materials and candles include a proportional share of fires in which the heat source was heat from an unclassified open flame or smoking material. Confined structure fires (NFIRS incident type 113-118) were analyzed separately from non-confined structure fires (incident type 110-129, except 113-118). See Appendix A for details.
Source: NFIRS 5.0 and NFPA survey.

U.S. Home Structure Fires, 4/13 86 NFPA Fire Analysis and Research Division, Quincy, MA
Table 9A. Reported One- or Two-Family Home Structure Fires
by Factor Contributing to Ignition 2007-2011 Annual Averages
(Unknowns were allocated proportionally)
Factor Contributing Fires Civilian Deaths Civilian Injuries
Direct Property Damage
(in Millions)
Electrical failure or malfunction 43,000 (17%) 430 (20%) 1,220 (14%) $1,355 (23%) Non-confined 39,400 (15%) 430 (20%) 1,220 (14%) $1,354 (23%) Confined 3,600 (1%) 0 (0%) 10 (0%) $1 (0%) Heat source too close to combustibles 28,500 (11%) 450 (21%) 1,570 (18%) $799 (13%) Non-confined 21,300 (8%) 450 (21%) 1,500 (17%) $797 (13%) Confined 7,100 (3%) 0 (0%) 70 (1%) $2 (0%) Equipment unattended 27,600 (11%) 150 (7%) 1,330 (15%) $312 (5%) Non-confined 11,100 (4%) 150 (7%) 1,050 (12%) $308 (5%) Confined 16,500 (6%) 0 (0%) 280 (3%) $4 (0%) Failure to clean 24,000 (9%) 20 (1%) 120 (1%) $70 (1%) Non-confined 3,800 (1%) 20 (1%) 100 (1%) $67 (1%) Confined 20,200 (8%) 0 (0%) 30 (0%) $2 (0%) Abandoned or discarded material or
product 23,500 (9%) 310 (14%) 1,000 (11%) $490 (8%) Non-confined 14,500 (6%) 310 (14%) 910 (10%) $488 (8%) Confined 8,900 (3%) 0 (0%) 100 (1%) $2 (0%) Mechanical failure or malfunction 20,600 (8%) 110 (5%) 490 (5%) $410 (7%) Non-confined 12,500 (5%) 110 (5%) 430 (5%) $407 (7%) Confined 8,100 (3%) 0 (0%) 60 (1%) $2 (0%) Unclassified factor contributed to
ignition 19,100 (7%) 250 (12%) 660 (7%) $424 (7%) Non-confined 10,800 (4%) 250 (12%) 560 (6%) $422 (7%) Confined 8,200 (3%) 0 (0%) 100 (1%) $2 (0%) Unclassified misuse of material or
product 17,200 (7%) 240 (11%) 910 (10%) $278 (5%) Non-confined 9,900 (4%) 240 (11%) 800 (9%) $275 (5%) Confined 7,300 (3%) 0 (0%) 120 (1%) $2 (0%) Exposure fire 10,200 (4%) 10 (1%) 60 (1%) $789 (13%) Non-confined 10,100 (4%) 10 (1%) 60 (1%) $789 (13%) Confined 100 (0%) 0 (0%) 0 (0%) $0 (0%) Unintentionally turned on, not turned
off 7,400 (3%) 20 (1%) 260 (3%) $99 (2%) Non-confined 3,100 (1%) 20 (1%) 190 (2%) $98 (2%) Confined 4,300 (2%) 0 (0%) 70 (1%) $1 (0%)
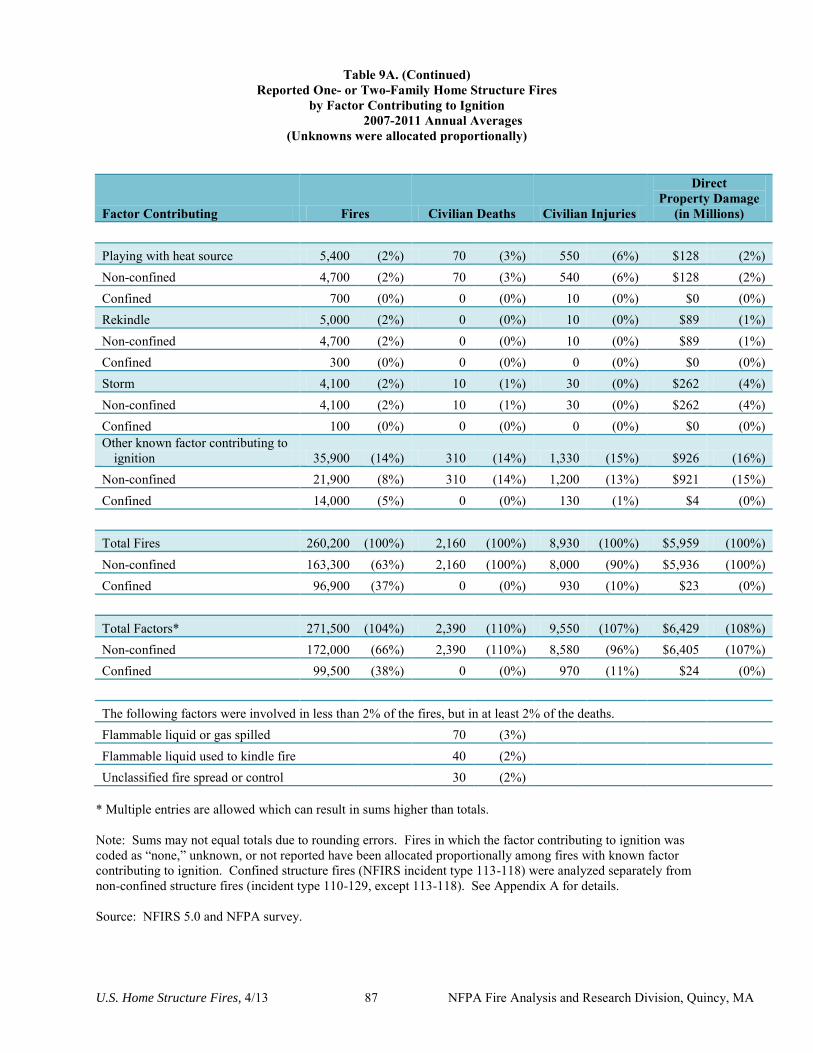
U.S. Home Structure Fires, 4/13 87 NFPA Fire Analysis and Research Division, Quincy, MA
Table 9A. (Continued) Reported One- or Two-Family Home Structure Fires
by Factor Contributing to Ignition 2007-2011 Annual Averages
(Unknowns were allocated proportionally)
Factor Contributing Fires Civilian Deaths Civilian Injuries
Direct Property Damage
(in Millions)
Playing with heat source 5,400 (2%) 70 (3%) 550 (6%) $128 (2%) Non-confined 4,700 (2%) 70 (3%) 540 (6%) $128 (2%) Confined 700 (0%) 0 (0%) 10 (0%) $0 (0%) Rekindle 5,000 (2%) 0 (0%) 10 (0%) $89 (1%) Non-confined 4,700 (2%) 0 (0%) 10 (0%) $89 (1%) Confined 300 (0%) 0 (0%) 0 (0%) $0 (0%) Storm 4,100 (2%) 10 (1%) 30 (0%) $262 (4%) Non-confined 4,100 (2%) 10 (1%) 30 (0%) $262 (4%) Confined 100 (0%) 0 (0%) 0 (0%) $0 (0%) Other known factor contributing to
ignition 35,900 (14%) 310 (14%) 1,330 (15%) $926 (16%) Non-confined 21,900 (8%) 310 (14%) 1,200 (13%) $921 (15%) Confined 14,000 (5%) 0 (0%) 130 (1%) $4 (0%)
Total Fires 260,200 (100%) 2,160 (100%) 8,930 (100%) $5,959 (100%) Non-confined 163,300 (63%) 2,160 (100%) 8,000 (90%) $5,936 (100%) Confined 96,900 (37%) 0 (0%) 930 (10%) $23 (0%)
Total Factors* 271,500 (104%) 2,390 (110%) 9,550 (107%) $6,429 (108%) Non-confined 172,000 (66%) 2,390 (110%) 8,580 (96%) $6,405 (107%) Confined 99,500 (38%) 0 (0%) 970 (11%) $24 (0%)
The following factors were involved in less than 2% of the fires, but in at least 2% of the deaths. Flammable liquid or gas spilled
70 (3%)
Flammable liquid used to kindle fire
40 (2%) Unclassified fire spread or control
30 (2%)
* Multiple entries are allowed which can result in sums higher than totals. Note: Sums may not equal totals due to rounding errors. Fires in which the factor contributing to ignition was coded as “none,” unknown, or not reported have been allocated proportionally among fires with known factor contributing to ignition. Confined structure fires (NFIRS incident type 113-118) were analyzed separately from non-confined structure fires (incident type 110-129, except 113-118). See Appendix A for details. Source: NFIRS 5.0 and NFPA survey.
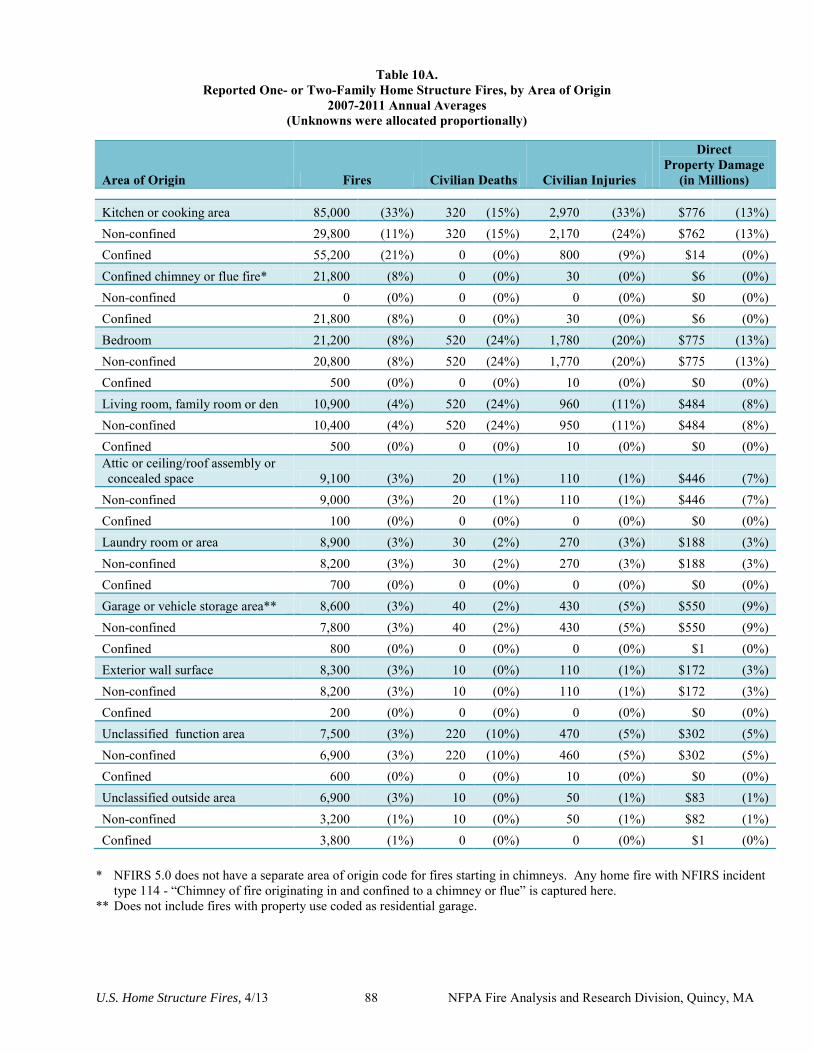
U.S. Home Structure Fires, 4/13 88 NFPA Fire Analysis and Research Division, Quincy, MA
Table 10A. Reported One- or Two-Family Home Structure Fires, by Area of Origin
2007-2011 Annual Averages (Unknowns were allocated proportionally)
Area of Origin Fires Civilian Deaths Civilian Injuries
Direct Property Damage
(in Millions)
Kitchen or cooking area 85,000 (33%) 320 (15%) 2,970 (33%) $776 (13%) Non-confined 29,800 (11%) 320 (15%) 2,170 (24%) $762 (13%) Confined 55,200 (21%) 0 (0%) 800 (9%) $14 (0%) Confined chimney or flue fire* 21,800 (8%) 0 (0%) 30 (0%) $6 (0%) Non-confined 0 (0%) 0 (0%) 0 (0%) $0 (0%) Confined 21,800 (8%) 0 (0%) 30 (0%) $6 (0%) Bedroom 21,200 (8%) 520 (24%) 1,780 (20%) $775 (13%) Non-confined 20,800 (8%) 520 (24%) 1,770 (20%) $775 (13%) Confined 500 (0%) 0 (0%) 10 (0%) $0 (0%) Living room, family room or den 10,900 (4%) 520 (24%) 960 (11%) $484 (8%) Non-confined 10,400 (4%) 520 (24%) 950 (11%) $484 (8%) Confined 500 (0%) 0 (0%) 10 (0%) $0 (0%) Attic or ceiling/roof assembly or concealed space 9,100 (3%) 20 (1%) 110 (1%) $446 (7%)
Non-confined 9,000 (3%) 20 (1%) 110 (1%) $446 (7%) Confined 100 (0%) 0 (0%) 0 (0%) $0 (0%) Laundry room or area 8,900 (3%) 30 (2%) 270 (3%) $188 (3%) Non-confined 8,200 (3%) 30 (2%) 270 (3%) $188 (3%) Confined 700 (0%) 0 (0%) 0 (0%) $0 (0%) Garage or vehicle storage area** 8,600 (3%) 40 (2%) 430 (5%) $550 (9%) Non-confined 7,800 (3%) 40 (2%) 430 (5%) $550 (9%) Confined 800 (0%) 0 (0%) 0 (0%) $1 (0%) Exterior wall surface 8,300 (3%) 10 (0%) 110 (1%) $172 (3%) Non-confined 8,200 (3%) 10 (0%) 110 (1%) $172 (3%) Confined 200 (0%) 0 (0%) 0 (0%) $0 (0%) Unclassified function area 7,500 (3%) 220 (10%) 470 (5%) $302 (5%) Non-confined 6,900 (3%) 220 (10%) 460 (5%) $302 (5%) Confined 600 (0%) 0 (0%) 10 (0%) $0 (0%) Unclassified outside area 6,900 (3%) 10 (0%) 50 (1%) $83 (1%) Non-confined 3,200 (1%) 10 (0%) 50 (1%) $82 (1%) Confined 3,800 (1%) 0 (0%) 0 (0%) $1 (0%)
* NFIRS 5.0 does not have a separate area of origin code for fires starting in chimneys. Any home fire with NFIRS incident type 114 - “Chimney of fire originating in and confined to a chimney or flue” is captured here.
** Does not include fires with property use coded as residential garage.
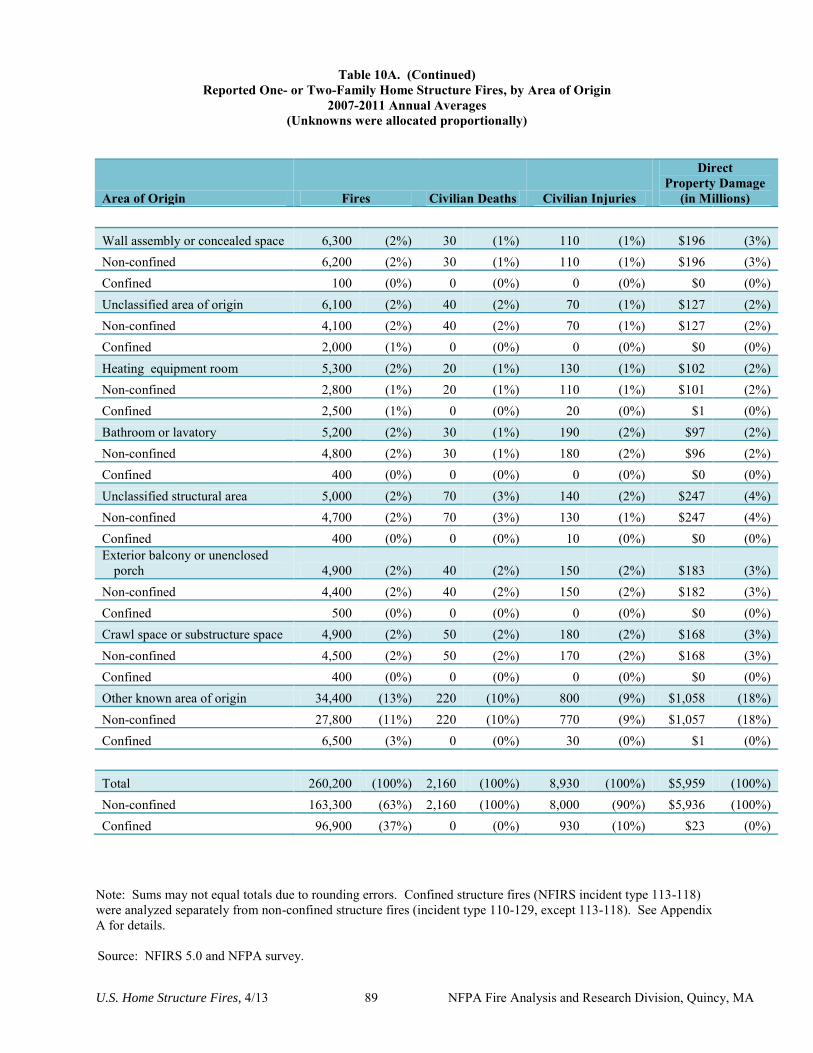
U.S. Home Structure Fires, 4/13 89 NFPA Fire Analysis and Research Division, Quincy, MA
Table 10A. (Continued) Reported One- or Two-Family Home Structure Fires, by Area of Origin
2007-2011 Annual Averages (Unknowns were allocated proportionally)
Area of Origin Fires Civilian Deaths Civilian Injuries
Direct Property Damage
(in Millions)
Wall assembly or concealed space 6,300 (2%) 30 (1%) 110 (1%) $196 (3%) Non-confined 6,200 (2%) 30 (1%) 110 (1%) $196 (3%) Confined 100 (0%) 0 (0%) 0 (0%) $0 (0%) Unclassified area of origin 6,100 (2%) 40 (2%) 70 (1%) $127 (2%) Non-confined 4,100 (2%) 40 (2%) 70 (1%) $127 (2%) Confined 2,000 (1%) 0 (0%) 0 (0%) $0 (0%) Heating equipment room 5,300 (2%) 20 (1%) 130 (1%) $102 (2%) Non-confined 2,800 (1%) 20 (1%) 110 (1%) $101 (2%) Confined 2,500 (1%) 0 (0%) 20 (0%) $1 (0%) Bathroom or lavatory 5,200 (2%) 30 (1%) 190 (2%) $97 (2%) Non-confined 4,800 (2%) 30 (1%) 180 (2%) $96 (2%) Confined 400 (0%) 0 (0%) 0 (0%) $0 (0%) Unclassified structural area 5,000 (2%) 70 (3%) 140 (2%) $247 (4%) Non-confined 4,700 (2%) 70 (3%) 130 (1%) $247 (4%) Confined 400 (0%) 0 (0%) 10 (0%) $0 (0%) Exterior balcony or unenclosed
porch 4,900 (2%) 40 (2%) 150 (2%) $183 (3%) Non-confined 4,400 (2%) 40 (2%) 150 (2%) $182 (3%) Confined 500 (0%) 0 (0%) 0 (0%) $0 (0%) Crawl space or substructure space 4,900 (2%) 50 (2%) 180 (2%) $168 (3%) Non-confined 4,500 (2%) 50 (2%) 170 (2%) $168 (3%) Confined 400 (0%) 0 (0%) 0 (0%) $0 (0%) Other known area of origin 34,400 (13%) 220 (10%) 800 (9%) $1,058 (18%) Non-confined 27,800 (11%) 220 (10%) 770 (9%) $1,057 (18%) Confined 6,500 (3%) 0 (0%) 30 (0%) $1 (0%)
Total 260,200 (100%) 2,160 (100%) 8,930 (100%) $5,959 (100%) Non-confined 163,300 (63%) 2,160 (100%) 8,000 (90%) $5,936 (100%) Confined 96,900 (37%) 0 (0%) 930 (10%) $23 (0%)
Note: Sums may not equal totals due to rounding errors. Confined structure fires (NFIRS incident type 113-118) were analyzed separately from non-confined structure fires (incident type 110-129, except 113-118). See Appendix A for details. Source: NFIRS 5.0 and NFPA survey.
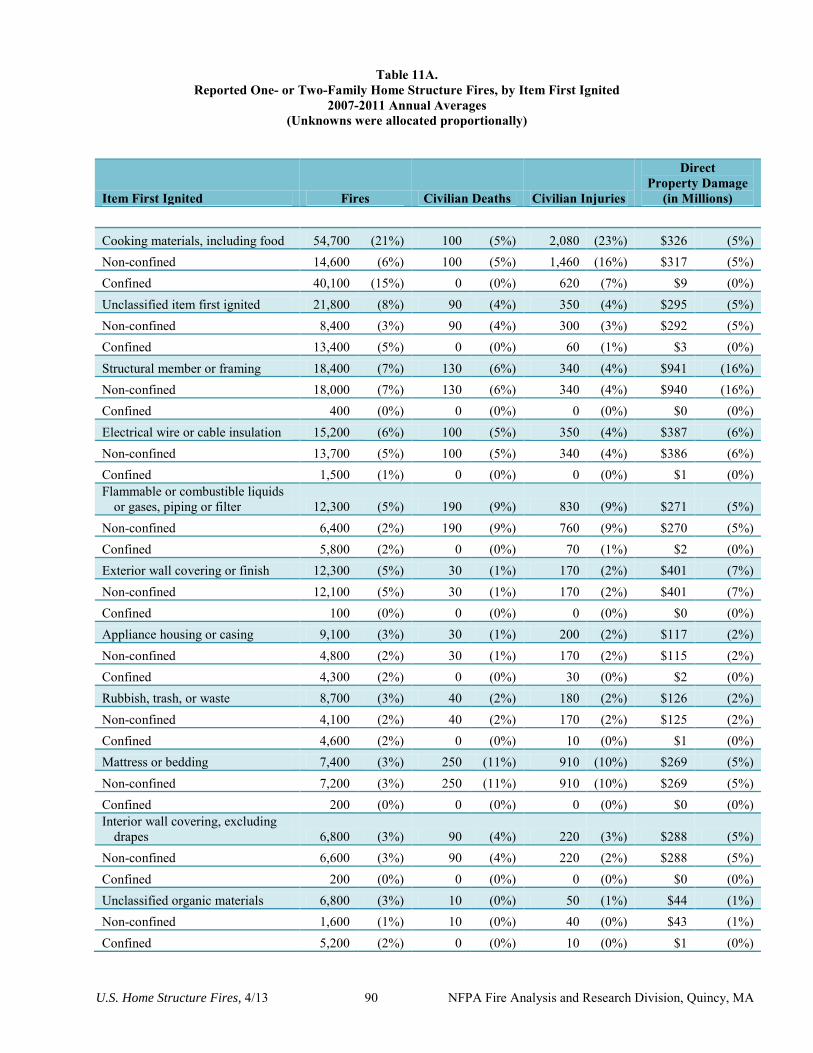
U.S. Home Structure Fires, 4/13 90 NFPA Fire Analysis and Research Division, Quincy, MA
Table 11A. Reported One- or Two-Family Home Structure Fires, by Item First Ignited
2007-2011 Annual Averages (Unknowns were allocated proportionally)
Item First Ignited Fires Civilian Deaths Civilian Injuries
Direct Property Damage
(in Millions)
Cooking materials, including food 54,700 (21%) 100 (5%) 2,080 (23%) $326 (5%) Non-confined 14,600 (6%) 100 (5%) 1,460 (16%) $317 (5%) Confined 40,100 (15%) 0 (0%) 620 (7%) $9 (0%) Unclassified item first ignited 21,800 (8%) 90 (4%) 350 (4%) $295 (5%) Non-confined 8,400 (3%) 90 (4%) 300 (3%) $292 (5%) Confined 13,400 (5%) 0 (0%) 60 (1%) $3 (0%) Structural member or framing 18,400 (7%) 130 (6%) 340 (4%) $941 (16%) Non-confined 18,000 (7%) 130 (6%) 340 (4%) $940 (16%) Confined 400 (0%) 0 (0%) 0 (0%) $0 (0%) Electrical wire or cable insulation 15,200 (6%) 100 (5%) 350 (4%) $387 (6%) Non-confined 13,700 (5%) 100 (5%) 340 (4%) $386 (6%) Confined 1,500 (1%) 0 (0%) 0 (0%) $1 (0%) Flammable or combustible liquids
or gases, piping or filter 12,300 (5%) 190 (9%) 830 (9%) $271 (5%) Non-confined 6,400 (2%) 190 (9%) 760 (9%) $270 (5%) Confined 5,800 (2%) 0 (0%) 70 (1%) $2 (0%) Exterior wall covering or finish 12,300 (5%) 30 (1%) 170 (2%) $401 (7%) Non-confined 12,100 (5%) 30 (1%) 170 (2%) $401 (7%) Confined 100 (0%) 0 (0%) 0 (0%) $0 (0%) Appliance housing or casing 9,100 (3%) 30 (1%) 200 (2%) $117 (2%) Non-confined 4,800 (2%) 30 (1%) 170 (2%) $115 (2%) Confined 4,300 (2%) 0 (0%) 30 (0%) $2 (0%) Rubbish, trash, or waste 8,700 (3%) 40 (2%) 180 (2%) $126 (2%) Non-confined 4,100 (2%) 40 (2%) 170 (2%) $125 (2%) Confined 4,600 (2%) 0 (0%) 10 (0%) $1 (0%) Mattress or bedding 7,400 (3%) 250 (11%) 910 (10%) $269 (5%) Non-confined 7,200 (3%) 250 (11%) 910 (10%) $269 (5%) Confined 200 (0%) 0 (0%) 0 (0%) $0 (0%) Interior wall covering, excluding
drapes 6,800 (3%) 90 (4%) 220 (3%) $288 (5%) Non-confined 6,600 (3%) 90 (4%) 220 (2%) $288 (5%) Confined 200 (0%) 0 (0%) 0 (0%) $0 (0%) Unclassified organic materials 6,800 (3%) 10 (0%) 50 (1%) $44 (1%) Non-confined 1,600 (1%) 10 (0%) 40 (0%) $43 (1%) Confined 5,200 (2%) 0 (0%) 10 (0%) $1 (0%)
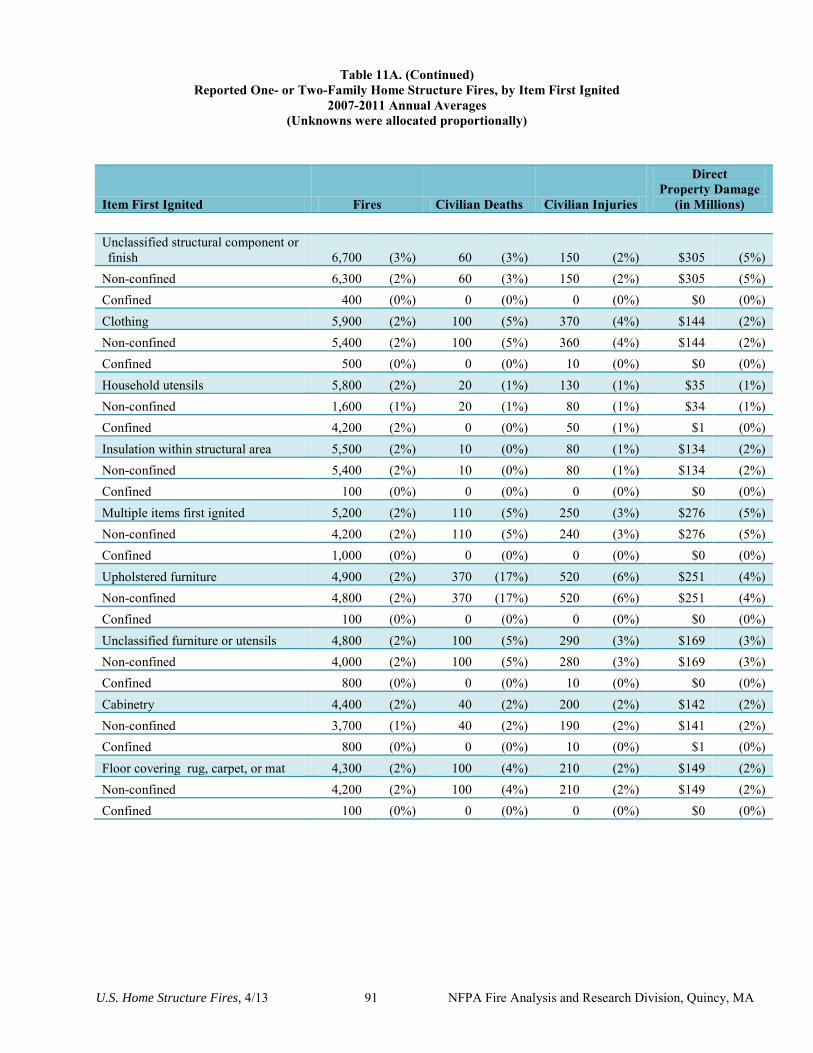
U.S. Home Structure Fires, 4/13 91 NFPA Fire Analysis and Research Division, Quincy, MA
Table 11A. (Continued) Reported One- or Two-Family Home Structure Fires, by Item First Ignited
2007-2011 Annual Averages (Unknowns were allocated proportionally)
Item First Ignited Fires Civilian Deaths Civilian Injuries
Direct Property Damage
(in Millions)
Unclassified structural component or finish 6,700 (3%) 60 (3%) 150 (2%) $305 (5%)
Non-confined 6,300 (2%) 60 (3%) 150 (2%) $305 (5%) Confined 400 (0%) 0 (0%) 0 (0%) $0 (0%) Clothing 5,900 (2%) 100 (5%) 370 (4%) $144 (2%) Non-confined 5,400 (2%) 100 (5%) 360 (4%) $144 (2%) Confined 500 (0%) 0 (0%) 10 (0%) $0 (0%) Household utensils 5,800 (2%) 20 (1%) 130 (1%) $35 (1%) Non-confined 1,600 (1%) 20 (1%) 80 (1%) $34 (1%) Confined 4,200 (2%) 0 (0%) 50 (1%) $1 (0%) Insulation within structural area 5,500 (2%) 10 (0%) 80 (1%) $134 (2%) Non-confined 5,400 (2%) 10 (0%) 80 (1%) $134 (2%) Confined 100 (0%) 0 (0%) 0 (0%) $0 (0%) Multiple items first ignited 5,200 (2%) 110 (5%) 250 (3%) $276 (5%) Non-confined 4,200 (2%) 110 (5%) 240 (3%) $276 (5%) Confined 1,000 (0%) 0 (0%) 0 (0%) $0 (0%) Upholstered furniture 4,900 (2%) 370 (17%) 520 (6%) $251 (4%) Non-confined 4,800 (2%) 370 (17%) 520 (6%) $251 (4%) Confined 100 (0%) 0 (0%) 0 (0%) $0 (0%) Unclassified furniture or utensils 4,800 (2%) 100 (5%) 290 (3%) $169 (3%) Non-confined 4,000 (2%) 100 (5%) 280 (3%) $169 (3%) Confined 800 (0%) 0 (0%) 10 (0%) $0 (0%) Cabinetry 4,400 (2%) 40 (2%) 200 (2%) $142 (2%) Non-confined 3,700 (1%) 40 (2%) 190 (2%) $141 (2%) Confined 800 (0%) 0 (0%) 10 (0%) $1 (0%) Floor covering rug, carpet, or mat 4,300 (2%) 100 (4%) 210 (2%) $149 (2%) Non-confined 4,200 (2%) 100 (4%) 210 (2%) $149 (2%) Confined 100 (0%) 0 (0%) 0 (0%) $0 (0%)
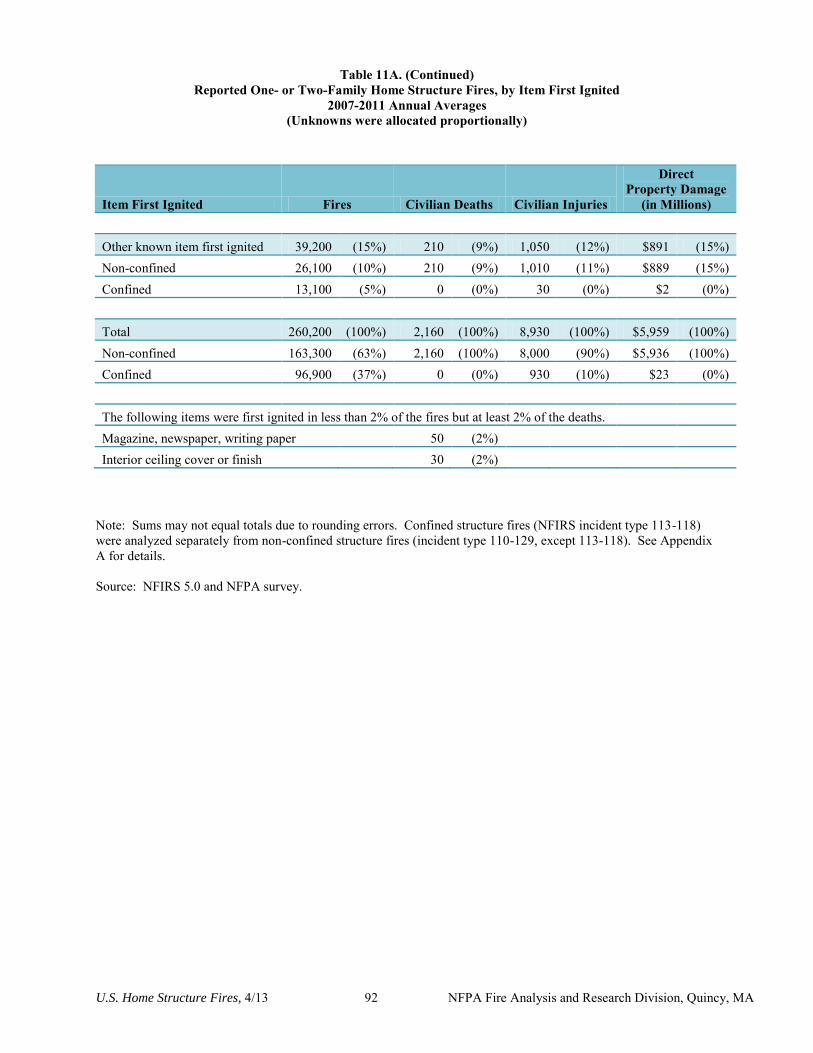
U.S. Home Structure Fires, 4/13 92 NFPA Fire Analysis and Research Division, Quincy, MA
Table 11A. (Continued) Reported One- or Two-Family Home Structure Fires, by Item First Ignited
2007-2011 Annual Averages (Unknowns were allocated proportionally)
Item First Ignited Fires Civilian Deaths Civilian Injuries
Direct Property Damage
(in Millions)
Other known item first ignited 39,200 (15%) 210 (9%) 1,050 (12%) $891 (15%) Non-confined 26,100 (10%) 210 (9%) 1,010 (11%) $889 (15%) Confined 13,100 (5%) 0 (0%) 30 (0%) $2 (0%)
Total 260,200 (100%) 2,160 (100%) 8,930 (100%) $5,959 (100%) Non-confined 163,300 (63%) 2,160 (100%) 8,000 (90%) $5,936 (100%) Confined 96,900 (37%) 0 (0%) 930 (10%) $23 (0%)
The following items were first ignited in less than 2% of the fires but at least 2% of the deaths. Magazine, newspaper, writing paper 50 (2%)
Interior ceiling cover or finish
30 (2%)
Note: Sums may not equal totals due to rounding errors. Confined structure fires (NFIRS incident type 113-118) were analyzed separately from non-confined structure fires (incident type 110-129, except 113-118). See Appendix A for details. Source: NFIRS 5.0 and NFPA survey.
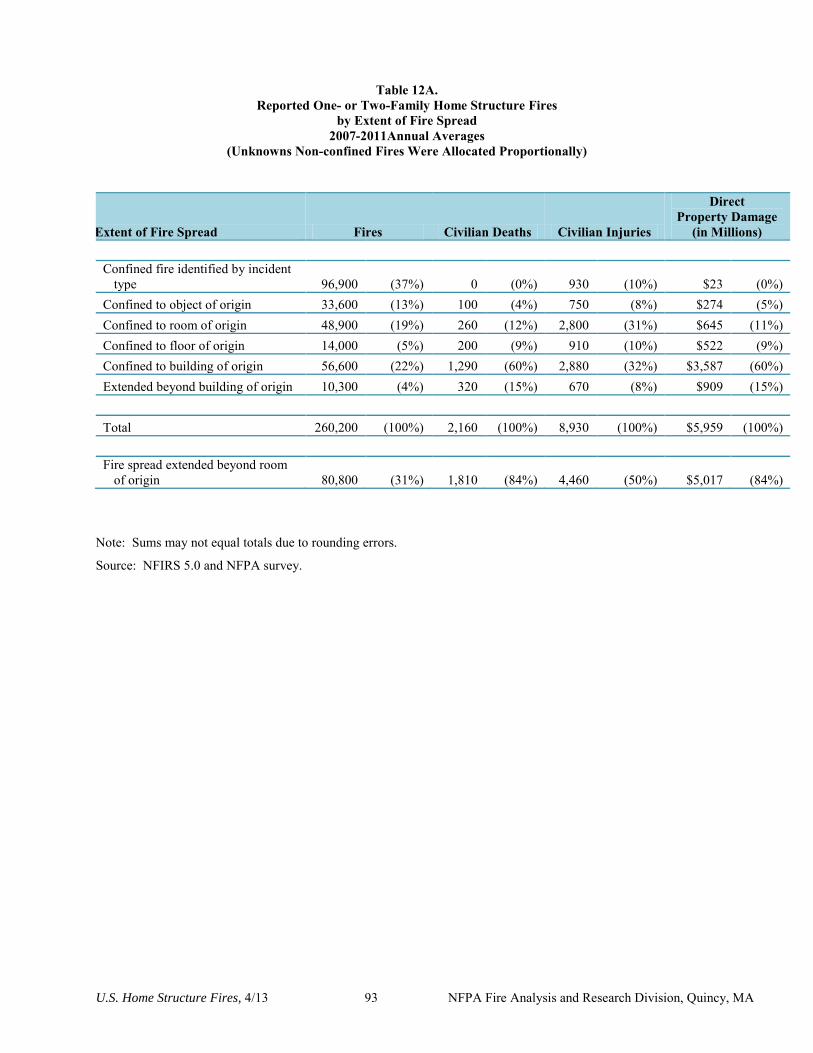
U.S. Home Structure Fires, 4/13 93 NFPA Fire Analysis and Research Division, Quincy, MA
Table 12A.
Reported One- or Two-Family Home Structure Fires by Extent of Fire Spread
2007-2011Annual Averages (Unknowns Non-confined Fires Were Allocated Proportionally)
Extent of Fire Spread Fires Civilian Deaths Civilian Injuries
Direct Property Damage
(in Millions) Confined fire identified by incident
type 96,900 (37%) 0 (0%) 930 (10%) $23 (0%) Confined to object of origin 33,600 (13%) 100 (4%) 750 (8%) $274 (5%) Confined to room of origin 48,900 (19%) 260 (12%) 2,800 (31%) $645 (11%) Confined to floor of origin 14,000 (5%) 200 (9%) 910 (10%) $522 (9%) Confined to building of origin 56,600 (22%) 1,290 (60%) 2,880 (32%) $3,587 (60%) Extended beyond building of origin 10,300 (4%) 320 (15%) 670 (8%) $909 (15%) Total 260,200 (100%) 2,160 (100%) 8,930 (100%) $5,959 (100%) Fire spread extended beyond room
of origin 80,800 (31%) 1,810 (84%) 4,460 (50%) $5,017 (84%)
Note: Sums may not equal totals due to rounding errors.
Source: NFIRS 5.0 and NFPA survey.
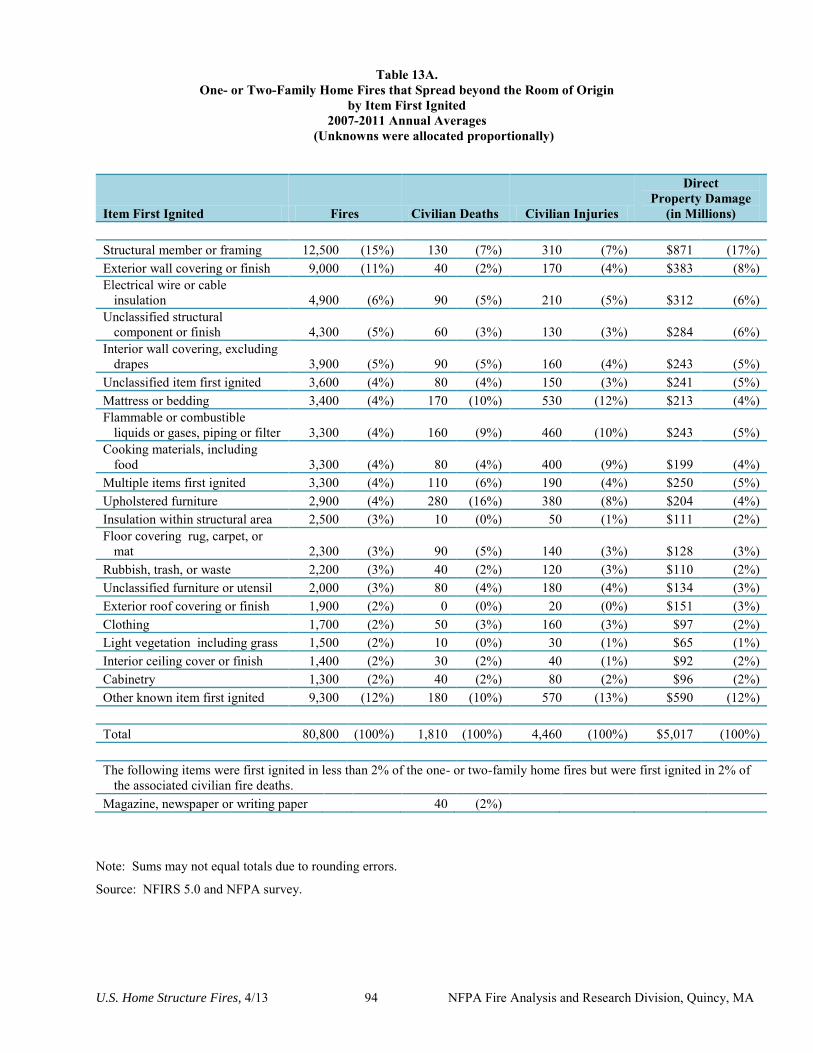
U.S. Home Structure Fires, 4/13 94 NFPA Fire Analysis and Research Division, Quincy, MA
Table 13A. One- or Two-Family Home Fires that Spread beyond the Room of Origin
by Item First Ignited 2007-2011 Annual Averages
(Unknowns were allocated proportionally)
Item First Ignited Fires Civilian Deaths Civilian Injuries
Direct Property Damage
(in Millions)
Structural member or framing 12,500 (15%) 130 (7%) 310 (7%) $871 (17%) Exterior wall covering or finish 9,000 (11%) 40 (2%) 170 (4%) $383 (8%) Electrical wire or cable
insulation 4,900 (6%) 90 (5%) 210 (5%) $312 (6%) Unclassified structural
component or finish 4,300 (5%) 60 (3%) 130 (3%) $284 (6%) Interior wall covering, excluding
drapes 3,900 (5%) 90 (5%) 160 (4%) $243 (5%) Unclassified item first ignited 3,600 (4%) 80 (4%) 150 (3%) $241 (5%) Mattress or bedding 3,400 (4%) 170 (10%) 530 (12%) $213 (4%) Flammable or combustible
liquids or gases, piping or filter 3,300 (4%) 160 (9%) 460 (10%) $243 (5%) Cooking materials, including
food 3,300 (4%) 80 (4%) 400 (9%) $199 (4%) Multiple items first ignited 3,300 (4%) 110 (6%) 190 (4%) $250 (5%) Upholstered furniture 2,900 (4%) 280 (16%) 380 (8%) $204 (4%) Insulation within structural area 2,500 (3%) 10 (0%) 50 (1%) $111 (2%) Floor covering rug, carpet, or
mat 2,300 (3%) 90 (5%) 140 (3%) $128 (3%) Rubbish, trash, or waste 2,200 (3%) 40 (2%) 120 (3%) $110 (2%) Unclassified furniture or utensil 2,000 (3%) 80 (4%) 180 (4%) $134 (3%) Exterior roof covering or finish 1,900 (2%) 0 (0%) 20 (0%) $151 (3%) Clothing 1,700 (2%) 50 (3%) 160 (3%) $97 (2%) Light vegetation including grass 1,500 (2%) 10 (0%) 30 (1%) $65 (1%) Interior ceiling cover or finish 1,400 (2%) 30 (2%) 40 (1%) $92 (2%) Cabinetry 1,300 (2%) 40 (2%) 80 (2%) $96 (2%) Other known item first ignited 9,300 (12%) 180 (10%) 570 (13%) $590 (12%)
Total 80,800 (100%) 1,810 (100%) 4,460 (100%) $5,017 (100%)
The following items were first ignited in less than 2% of the one- or two-family home fires but were first ignited in 2% of the associated civilian fire deaths.
Magazine, newspaper or writing paper
40 (2%)
Note: Sums may not equal totals due to rounding errors.
Source: NFIRS 5.0 and NFPA survey.
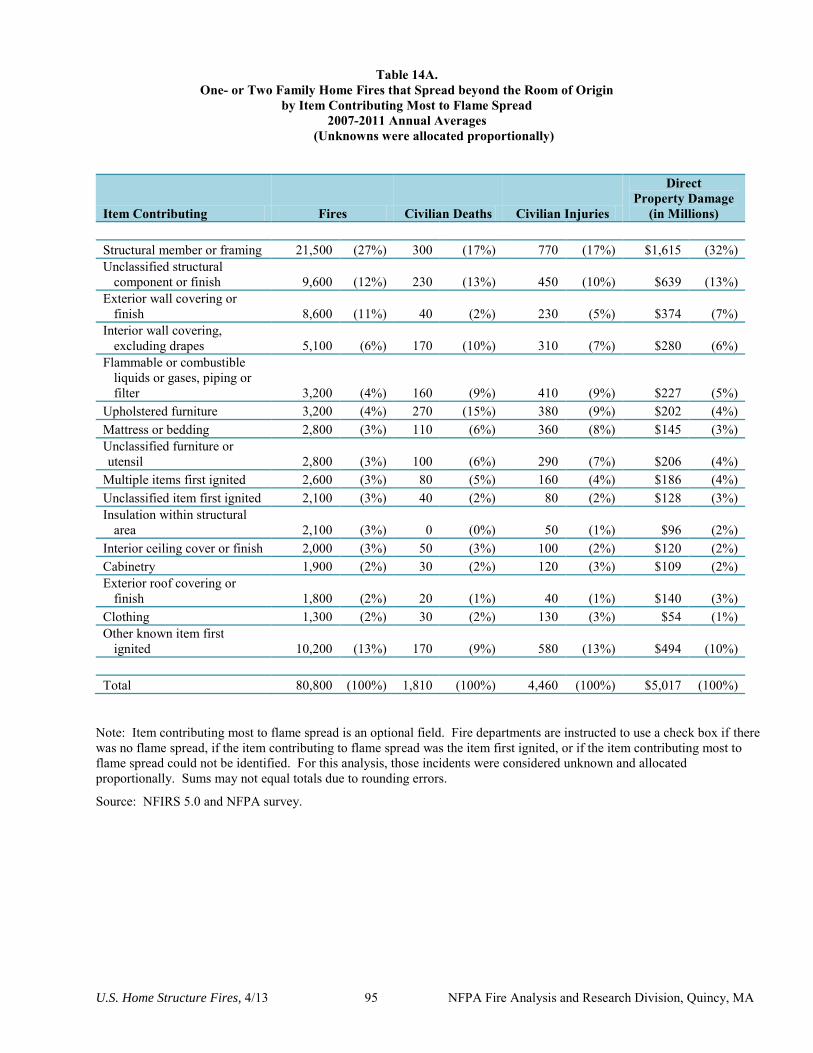
U.S. Home Structure Fires, 4/13 95 NFPA Fire Analysis and Research Division, Quincy, MA
Table 14A. One- or Two Family Home Fires that Spread beyond the Room of Origin
by Item Contributing Most to Flame Spread 2007-2011 Annual Averages
(Unknowns were allocated proportionally)
Item Contributing Fires Civilian Deaths Civilian Injuries
Direct Property Damage
(in Millions)
Structural member or framing 21,500 (27%) 300 (17%) 770 (17%) $1,615 (32%) Unclassified structural
component or finish 9,600 (12%) 230 (13%) 450 (10%) $639 (13%) Exterior wall covering or
finish 8,600 (11%) 40 (2%) 230 (5%) $374 (7%) Interior wall covering,
excluding drapes 5,100 (6%) 170 (10%) 310 (7%) $280 (6%) Flammable or combustible
liquids or gases, piping or filter 3,200 (4%) 160 (9%) 410 (9%) $227 (5%)
Upholstered furniture 3,200 (4%) 270 (15%) 380 (9%) $202 (4%) Mattress or bedding 2,800 (3%) 110 (6%) 360 (8%) $145 (3%) Unclassified furniture or utensil 2,800 (3%) 100 (6%) 290 (7%) $206 (4%)
Multiple items first ignited 2,600 (3%) 80 (5%) 160 (4%) $186 (4%) Unclassified item first ignited 2,100 (3%) 40 (2%) 80 (2%) $128 (3%) Insulation within structural
area 2,100 (3%) 0 (0%) 50 (1%) $96 (2%) Interior ceiling cover or finish 2,000 (3%) 50 (3%) 100 (2%) $120 (2%) Cabinetry 1,900 (2%) 30 (2%) 120 (3%) $109 (2%) Exterior roof covering or
finish 1,800 (2%) 20 (1%) 40 (1%) $140 (3%) Clothing 1,300 (2%) 30 (2%) 130 (3%) $54 (1%) Other known item first
ignited 10,200 (13%) 170 (9%) 580 (13%) $494 (10%)
Total 80,800 (100%) 1,810 (100%) 4,460 (100%) $5,017 (100%) Note: Item contributing most to flame spread is an optional field. Fire departments are instructed to use a check box if there was no flame spread, if the item contributing to flame spread was the item first ignited, or if the item contributing most to flame spread could not be identified. For this analysis, those incidents were considered unknown and allocated proportionally. Sums may not equal totals due to rounding errors.
Source: NFIRS 5.0 and NFPA survey.
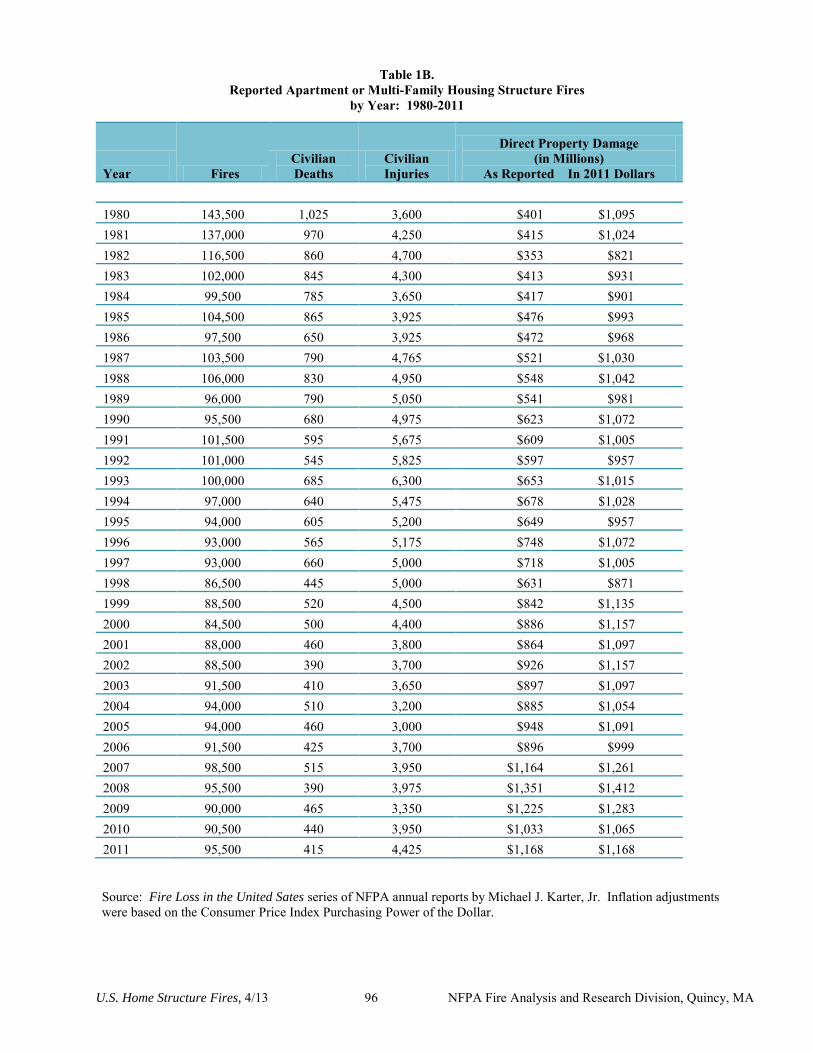
U.S. Home Structure Fires, 4/13 96 NFPA Fire Analysis and Research Division, Quincy, MA
Table 1B. Reported Apartment or Multi-Family Housing Structure Fires
by Year: 1980-2011
Year Fires
Civilian Deaths
Civilian Injuries
Direct Property Damage (in Millions)
As Reported In 2011 Dollars 1980 143,500 1,025 3,600 $401 $1,095 1981 137,000 970 4,250 $415 $1,024 1982 116,500 860 4,700 $353 $821 1983 102,000 845 4,300 $413 $931 1984 99,500 785 3,650 $417 $901 1985 104,500 865 3,925 $476 $993 1986 97,500 650 3,925 $472 $968 1987 103,500 790 4,765 $521 $1,030 1988 106,000 830 4,950 $548 $1,042 1989 96,000 790 5,050 $541 $981 1990 95,500 680 4,975 $623 $1,072 1991 101,500 595 5,675 $609 $1,005 1992 101,000 545 5,825 $597 $957 1993 100,000 685 6,300 $653 $1,015 1994 97,000 640 5,475 $678 $1,028 1995 94,000 605 5,200 $649 $957 1996 93,000 565 5,175 $748 $1,072 1997 93,000 660 5,000 $718 $1,005 1998 86,500 445 5,000 $631 $871 1999 88,500 520 4,500 $842 $1,135 2000 84,500 500 4,400 $886 $1,157 2001 88,000 460 3,800 $864 $1,097 2002 88,500 390 3,700 $926 $1,157 2003 91,500 410 3,650 $897 $1,097 2004 94,000 510 3,200 $885 $1,054 2005 94,000 460 3,000 $948 $1,091 2006 91,500 425 3,700 $896 $999 2007 98,500 515 3,950 $1,164 $1,261 2008 95,500 390 3,975 $1,351 $1,412 2009 90,000 465 3,350 $1,225 $1,283 2010 90,500 440 3,950 $1,033 $1,065 2011 95,500 415 4,425 $1,168 $1,168 Source: Fire Loss in the United Sates series of NFPA annual reports by Michael J. Karter, Jr. Inflation adjustments were based on the Consumer Price Index Purchasing Power of the Dollar.
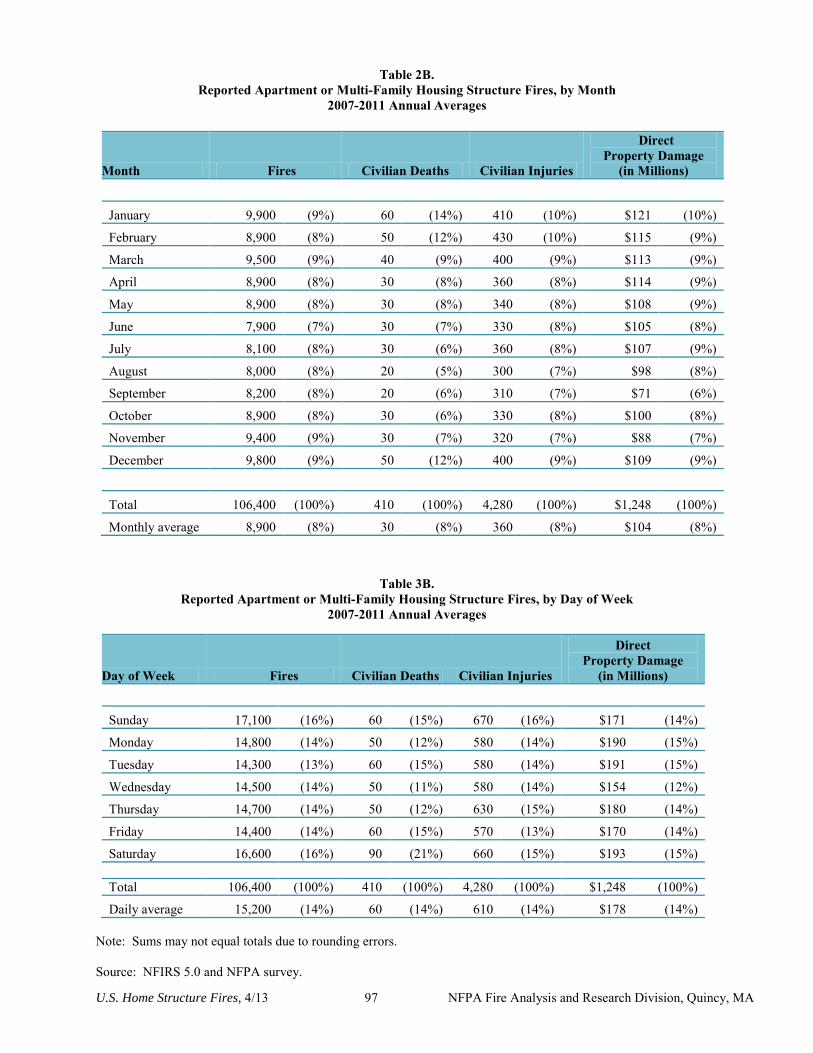
U.S. Home Structure Fires, 4/13 97 NFPA Fire Analysis and Research Division, Quincy, MA
Table 2B. Reported Apartment or Multi-Family Housing Structure Fires, by Month
2007-2011 Annual Averages
Month Fires Civilian Deaths Civilian Injuries
Direct Property Damage
(in Millions)
January 9,900 (9%) 60 (14%) 410 (10%) $121 (10%)
February 8,900 (8%) 50 (12%) 430 (10%) $115 (9%)
March 9,500 (9%) 40 (9%) 400 (9%) $113 (9%)
April 8,900 (8%) 30 (8%) 360 (8%) $114 (9%)
May 8,900 (8%) 30 (8%) 340 (8%) $108 (9%)
June 7,900 (7%) 30 (7%) 330 (8%) $105 (8%)
July 8,100 (8%) 30 (6%) 360 (8%) $107 (9%)
August 8,000 (8%) 20 (5%) 300 (7%) $98 (8%)
September 8,200 (8%) 20 (6%) 310 (7%) $71 (6%)
October 8,900 (8%) 30 (6%) 330 (8%) $100 (8%)
November 9,400 (9%) 30 (7%) 320 (7%) $88 (7%)
December 9,800 (9%) 50 (12%) 400 (9%) $109 (9%)
Total 106,400 (100%) 410 (100%) 4,280 (100%) $1,248 (100%)
Monthly average 8,900 (8%) 30 (8%) 360 (8%) $104 (8%)
Table 3B. Reported Apartment or Multi-Family Housing Structure Fires, by Day of Week
2007-2011 Annual Averages
Day of Week Fires Civilian Deaths Civilian Injuries
Direct Property Damage
(in Millions)
Sunday 17,100 (16%) 60 (15%) 670 (16%) $171 (14%)
Monday 14,800 (14%) 50 (12%) 580 (14%) $190 (15%)
Tuesday 14,300 (13%) 60 (15%) 580 (14%) $191 (15%)
Wednesday 14,500 (14%) 50 (11%) 580 (14%) $154 (12%)
Thursday 14,700 (14%) 50 (12%) 630 (15%) $180 (14%)
Friday 14,400 (14%) 60 (15%) 570 (13%) $170 (14%)
Saturday 16,600 (16%) 90 (21%) 660 (15%) $193 (15%) Total 106,400 (100%) 410 (100%) 4,280 (100%) $1,248 (100%)
Daily average 15,200 (14%) 60 (14%) 610 (14%) $178 (14%)
Note: Sums may not equal totals due to rounding errors. Source: NFIRS 5.0 and NFPA survey.
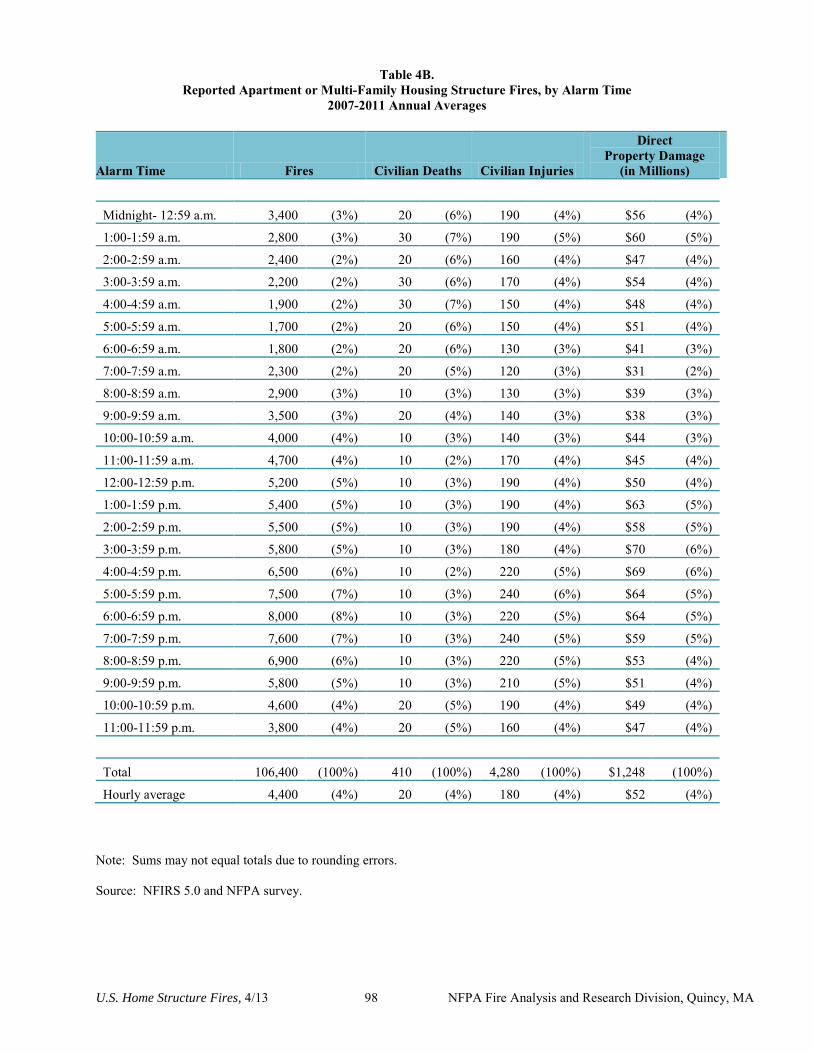
U.S. Home Structure Fires, 4/13 98 NFPA Fire Analysis and Research Division, Quincy, MA
Table 4B. Reported Apartment or Multi-Family Housing Structure Fires, by Alarm Time
2007-2011 Annual Averages
Alarm Time Fires Civilian Deaths Civilian Injuries
Direct Property Damage
(in Millions)
Midnight- 12:59 a.m. 3,400 (3%) 20 (6%) 190 (4%) $56 (4%)
1:00-1:59 a.m. 2,800 (3%) 30 (7%) 190 (5%) $60 (5%)
2:00-2:59 a.m. 2,400 (2%) 20 (6%) 160 (4%) $47 (4%)
3:00-3:59 a.m. 2,200 (2%) 30 (6%) 170 (4%) $54 (4%)
4:00-4:59 a.m. 1,900 (2%) 30 (7%) 150 (4%) $48 (4%)
5:00-5:59 a.m. 1,700 (2%) 20 (6%) 150 (4%) $51 (4%)
6:00-6:59 a.m. 1,800 (2%) 20 (6%) 130 (3%) $41 (3%)
7:00-7:59 a.m. 2,300 (2%) 20 (5%) 120 (3%) $31 (2%)
8:00-8:59 a.m. 2,900 (3%) 10 (3%) 130 (3%) $39 (3%)
9:00-9:59 a.m. 3,500 (3%) 20 (4%) 140 (3%) $38 (3%)
10:00-10:59 a.m. 4,000 (4%) 10 (3%) 140 (3%) $44 (3%)
11:00-11:59 a.m. 4,700 (4%) 10 (2%) 170 (4%) $45 (4%)
12:00-12:59 p.m. 5,200 (5%) 10 (3%) 190 (4%) $50 (4%)
1:00-1:59 p.m. 5,400 (5%) 10 (3%) 190 (4%) $63 (5%)
2:00-2:59 p.m. 5,500 (5%) 10 (3%) 190 (4%) $58 (5%)
3:00-3:59 p.m. 5,800 (5%) 10 (3%) 180 (4%) $70 (6%)
4:00-4:59 p.m. 6,500 (6%) 10 (2%) 220 (5%) $69 (6%)
5:00-5:59 p.m. 7,500 (7%) 10 (3%) 240 (6%) $64 (5%)
6:00-6:59 p.m. 8,000 (8%) 10 (3%) 220 (5%) $64 (5%)
7:00-7:59 p.m. 7,600 (7%) 10 (3%) 240 (5%) $59 (5%)
8:00-8:59 p.m. 6,900 (6%) 10 (3%) 220 (5%) $53 (4%)
9:00-9:59 p.m. 5,800 (5%) 10 (3%) 210 (5%) $51 (4%)
10:00-10:59 p.m. 4,600 (4%) 20 (5%) 190 (4%) $49 (4%)
11:00-11:59 p.m. 3,800 (4%) 20 (5%) 160 (4%) $47 (4%)
Total 106,400 (100%) 410 (100%) 4,280 (100%) $1,248 (100%)
Hourly average 4,400 (4%) 20 (4%) 180 (4%) $52 (4%)
Note: Sums may not equal totals due to rounding errors. Source: NFIRS 5.0 and NFPA survey.
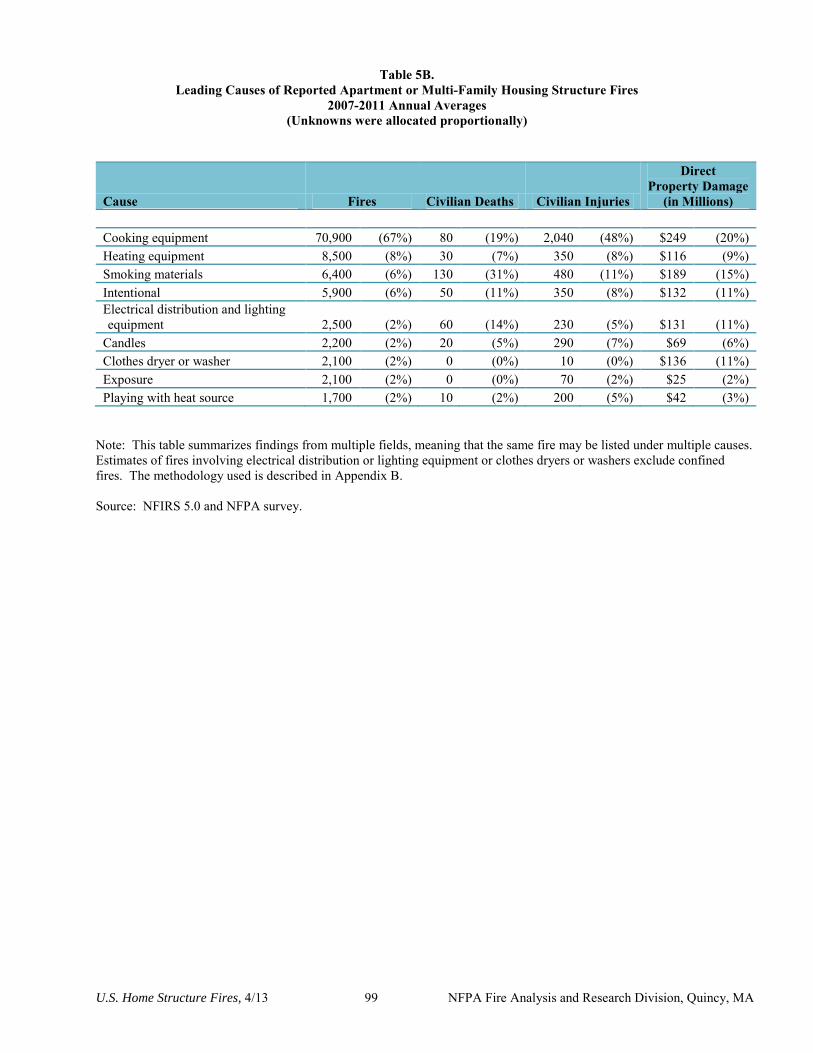
U.S. Home Structure Fires, 4/13 99 NFPA Fire Analysis and Research Division, Quincy, MA
Table 5B. Leading Causes of Reported Apartment or Multi-Family Housing Structure Fires
2007-2011 Annual Averages (Unknowns were allocated proportionally)
Cause Fires Civilian Deaths Civilian Injuries
Direct Property Damage
(in Millions)
Cooking equipment 70,900 (67%) 80 (19%) 2,040 (48%) $249 (20%) Heating equipment 8,500 (8%) 30 (7%) 350 (8%) $116 (9%) Smoking materials 6,400 (6%) 130 (31%) 480 (11%) $189 (15%) Intentional 5,900 (6%) 50 (11%) 350 (8%) $132 (11%) Electrical distribution and lighting equipment 2,500 (2%) 60 (14%) 230 (5%) $131 (11%)
Candles 2,200 (2%) 20 (5%) 290 (7%) $69 (6%) Clothes dryer or washer 2,100 (2%) 0 (0%) 10 (0%) $136 (11%) Exposure 2,100 (2%) 0 (0%) 70 (2%) $25 (2%) Playing with heat source 1,700 (2%) 10 (2%) 200 (5%) $42 (3%)
Note: This table summarizes findings from multiple fields, meaning that the same fire may be listed under multiple causes. Estimates of fires involving electrical distribution or lighting equipment or clothes dryers or washers exclude confined fires. The methodology used is described in Appendix B. Source: NFIRS 5.0 and NFPA survey.
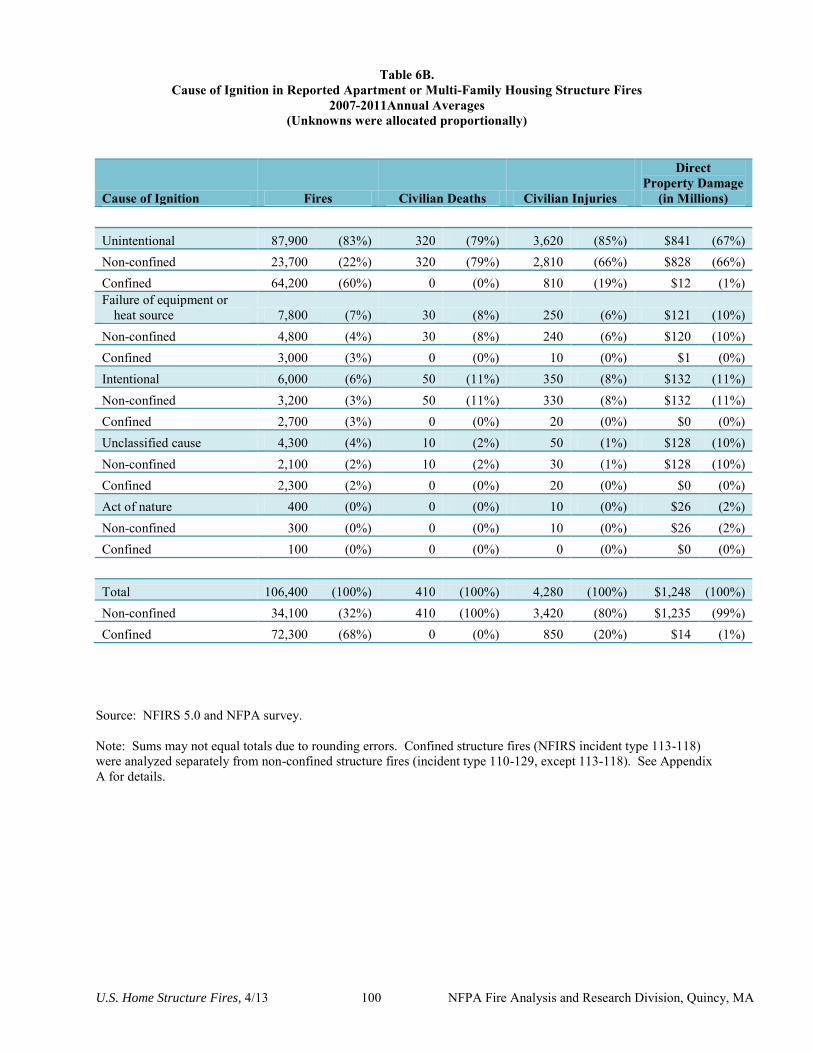
U.S. Home Structure Fires, 4/13 100 NFPA Fire Analysis and Research Division, Quincy, MA
Table 6B. Cause of Ignition in Reported Apartment or Multi-Family Housing Structure Fires
2007-2011Annual Averages (Unknowns were allocated proportionally)
Cause of Ignition Fires Civilian Deaths Civilian Injuries
Direct Property Damage
(in Millions)
Unintentional 87,900 (83%) 320 (79%) 3,620 (85%) $841 (67%) Non-confined 23,700 (22%) 320 (79%) 2,810 (66%) $828 (66%) Confined 64,200 (60%) 0 (0%) 810 (19%) $12 (1%) Failure of equipment or
heat source 7,800 (7%) 30 (8%) 250 (6%) $121 (10%) Non-confined 4,800 (4%) 30 (8%) 240 (6%) $120 (10%) Confined 3,000 (3%) 0 (0%) 10 (0%) $1 (0%) Intentional 6,000 (6%) 50 (11%) 350 (8%) $132 (11%) Non-confined 3,200 (3%) 50 (11%) 330 (8%) $132 (11%) Confined 2,700 (3%) 0 (0%) 20 (0%) $0 (0%) Unclassified cause 4,300 (4%) 10 (2%) 50 (1%) $128 (10%) Non-confined 2,100 (2%) 10 (2%) 30 (1%) $128 (10%) Confined 2,300 (2%) 0 (0%) 20 (0%) $0 (0%) Act of nature 400 (0%) 0 (0%) 10 (0%) $26 (2%) Non-confined 300 (0%) 0 (0%) 10 (0%) $26 (2%) Confined 100 (0%) 0 (0%) 0 (0%) $0 (0%)
Total 106,400 (100%) 410 (100%) 4,280 (100%) $1,248 (100%) Non-confined 34,100 (32%) 410 (100%) 3,420 (80%) $1,235 (99%) Confined 72,300 (68%) 0 (0%) 850 (20%) $14 (1%)
Source: NFIRS 5.0 and NFPA survey. Note: Sums may not equal totals due to rounding errors. Confined structure fires (NFIRS incident type 113-118) were analyzed separately from non-confined structure fires (incident type 110-129, except 113-118). See Appendix A for details.
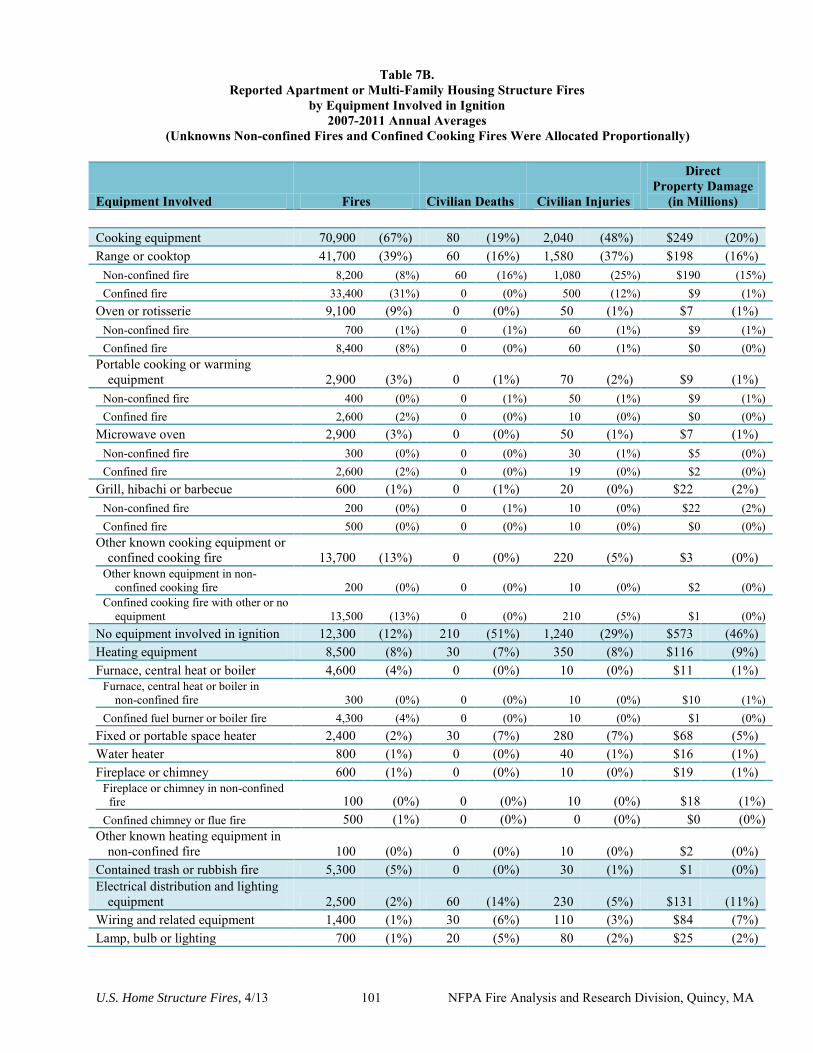
U.S. Home Structure Fires, 4/13 101 NFPA Fire Analysis and Research Division, Quincy, MA
Table 7B. Reported Apartment or Multi-Family Housing Structure Fires
by Equipment Involved in Ignition 2007-2011 Annual Averages
(Unknowns Non-confined Fires and Confined Cooking Fires Were Allocated Proportionally)
Equipment Involved Fires Civilian Deaths Civilian Injuries
Direct Property Damage
(in Millions)
Cooking equipment 70,900 (67%) 80 (19%) 2,040 (48%) $249 (20%) Range or cooktop 41,700 (39%) 60 (16%) 1,580 (37%) $198 (16%)
Non-confined fire 8,200 (8%) 60 (16%) 1,080 (25%) $190 (15%) Confined fire 33,400 (31%) 0 (0%) 500 (12%) $9 (1%)
Oven or rotisserie 9,100 (9%) 0 (0%) 50 (1%) $7 (1%) Non-confined fire 700 (1%) 0 (1%) 60 (1%) $9 (1%) Confined fire 8,400 (8%) 0 (0%) 60 (1%) $0 (0%)
Portable cooking or warming equipment 2,900 (3%) 0 (1%) 70 (2%) $9 (1%)
Non-confined fire 400 (0%) 0 (1%) 50 (1%) $9 (1%) Confined fire 2,600 (2%) 0 (0%) 10 (0%) $0 (0%)
Microwave oven 2,900 (3%) 0 (0%) 50 (1%) $7 (1%) Non-confined fire 300 (0%) 0 (0%) 30 (1%) $5 (0%) Confined fire 2,600 (2%) 0 (0%) 19 (0%) $2 (0%)
Grill, hibachi or barbecue 600 (1%) 0 (1%) 20 (0%) $22 (2%) Non-confined fire 200 (0%) 0 (1%) 10 (0%) $22 (2%) Confined fire 500 (0%) 0 (0%) 10 (0%) $0 (0%)
Other known cooking equipment or confined cooking fire 13,700 (13%) 0 (0%) 220 (5%) $3 (0%)
Other known equipment in non-confined cooking fire 200 (0%) 0 (0%) 10 (0%) $2 (0%)
Confined cooking fire with other or no equipment 13,500 (13%) 0 (0%) 210 (5%) $1 (0%)
No equipment involved in ignition 12,300 (12%) 210 (51%) 1,240 (29%) $573 (46%) Heating equipment 8,500 (8%) 30 (7%) 350 (8%) $116 (9%) Furnace, central heat or boiler 4,600 (4%) 0 (0%) 10 (0%) $11 (1%)
Furnace, central heat or boiler in non-confined fire 300 (0%) 0 (0%) 10 (0%) $10 (1%)
Confined fuel burner or boiler fire 4,300 (4%) 0 (0%) 10 (0%) $1 (0%) Fixed or portable space heater 2,400 (2%) 30 (7%) 280 (7%) $68 (5%) Water heater 800 (1%) 0 (0%) 40 (1%) $16 (1%) Fireplace or chimney 600 (1%) 0 (0%) 10 (0%) $19 (1%)
Fireplace or chimney in non-confined fire 100 (0%) 0 (0%) 10 (0%) $18 (1%)
Confined chimney or flue fire 500 (1%) 0 (0%) 0 (0%) $0 (0%) Other known heating equipment in
non-confined fire 100 (0%) 0 (0%) 10 (0%) $2 (0%) Contained trash or rubbish fire 5,300 (5%) 0 (0%) 30 (1%) $1 (0%) Electrical distribution and lighting
equipment 2,500 (2%) 60 (14%) 230 (5%) $131 (11%) Wiring and related equipment 1,400 (1%) 30 (6%) 110 (3%) $84 (7%) Lamp, bulb or lighting 700 (1%) 20 (5%) 80 (2%) $25 (2%)
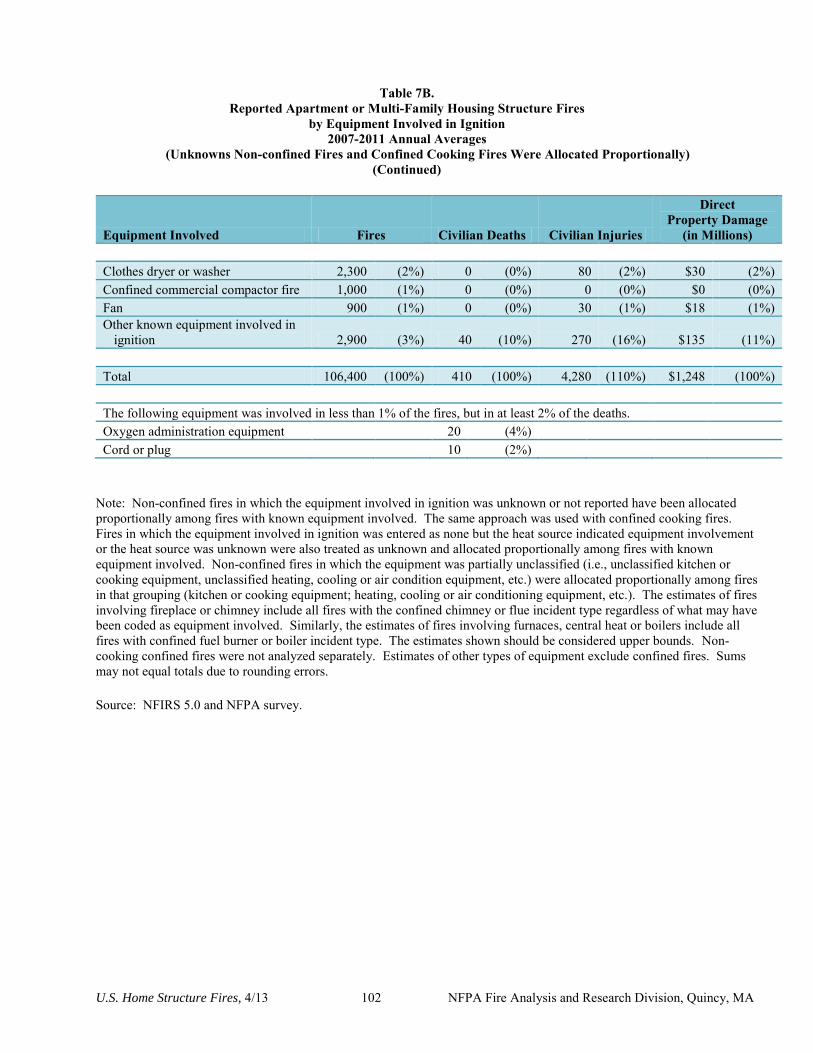
U.S. Home Structure Fires, 4/13 102 NFPA Fire Analysis and Research Division, Quincy, MA
Table 7B.
Reported Apartment or Multi-Family Housing Structure Fires by Equipment Involved in Ignition
2007-2011 Annual Averages (Unknowns Non-confined Fires and Confined Cooking Fires Were Allocated Proportionally)
(Continued)
Equipment Involved Fires Civilian Deaths Civilian Injuries
Direct Property Damage
(in Millions)
Clothes dryer or washer 2,300 (2%) 0 (0%) 80 (2%) $30 (2%) Confined commercial compactor fire 1,000 (1%) 0 (0%) 0 (0%) $0 (0%) Fan 900 (1%) 0 (0%) 30 (1%) $18 (1%) Other known equipment involved in
ignition 2,900 (3%) 40 (10%) 270 (16%) $135 (11%)
Total 106,400 (100%) 410 (100%) 4,280 (110%) $1,248 (100%)
The following equipment was involved in less than 1% of the fires, but in at least 2% of the deaths. Oxygen administration equipment
20 (4%)
Cord or plug
10 (2%)
Note: Non-confined fires in which the equipment involved in ignition was unknown or not reported have been allocated proportionally among fires with known equipment involved. The same approach was used with confined cooking fires. Fires in which the equipment involved in ignition was entered as none but the heat source indicated equipment involvement or the heat source was unknown were also treated as unknown and allocated proportionally among fires with known equipment involved. Non-confined fires in which the equipment was partially unclassified (i.e., unclassified kitchen or cooking equipment, unclassified heating, cooling or air condition equipment, etc.) were allocated proportionally among fires in that grouping (kitchen or cooking equipment; heating, cooling or air conditioning equipment, etc.). The estimates of fires involving fireplace or chimney include all fires with the confined chimney or flue incident type regardless of what may have been coded as equipment involved. Similarly, the estimates of fires involving furnaces, central heat or boilers include all fires with confined fuel burner or boiler incident type. The estimates shown should be considered upper bounds. Non-cooking confined fires were not analyzed separately. Estimates of other types of equipment exclude confined fires. Sums may not equal totals due to rounding errors.
Source: NFIRS 5.0 and NFPA survey.
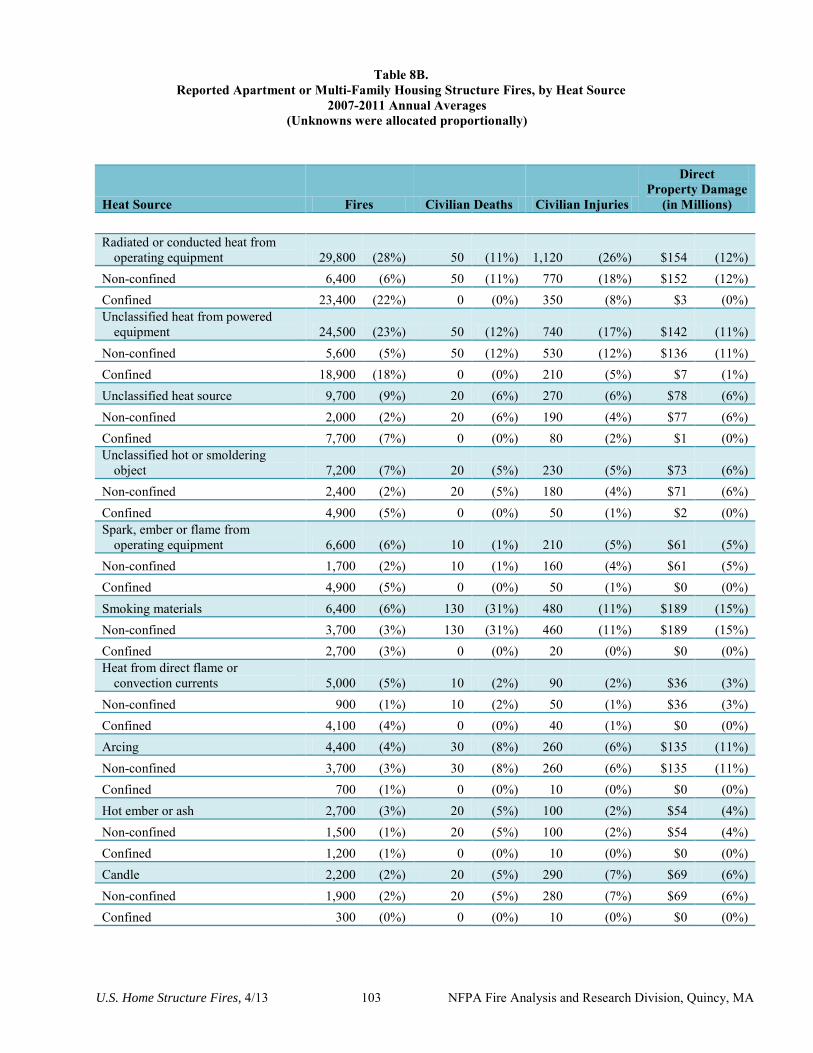
U.S. Home Structure Fires, 4/13 103 NFPA Fire Analysis and Research Division, Quincy, MA
Table 8B. Reported Apartment or Multi-Family Housing Structure Fires, by Heat Source
2007-2011 Annual Averages (Unknowns were allocated proportionally)
Heat Source Fires Civilian Deaths Civilian Injuries
Direct Property Damage
(in Millions)
Radiated or conducted heat from operating equipment 29,800 (28%) 50 (11%) 1,120 (26%) $154 (12%)
Non-confined 6,400 (6%) 50 (11%) 770 (18%) $152 (12%) Confined 23,400 (22%) 0 (0%) 350 (8%) $3 (0%) Unclassified heat from powered
equipment 24,500 (23%) 50 (12%) 740 (17%) $142 (11%) Non-confined 5,600 (5%) 50 (12%) 530 (12%) $136 (11%) Confined 18,900 (18%) 0 (0%) 210 (5%) $7 (1%) Unclassified heat source 9,700 (9%) 20 (6%) 270 (6%) $78 (6%) Non-confined 2,000 (2%) 20 (6%) 190 (4%) $77 (6%) Confined 7,700 (7%) 0 (0%) 80 (2%) $1 (0%) Unclassified hot or smoldering
object 7,200 (7%) 20 (5%) 230 (5%) $73 (6%) Non-confined 2,400 (2%) 20 (5%) 180 (4%) $71 (6%) Confined 4,900 (5%) 0 (0%) 50 (1%) $2 (0%) Spark, ember or flame from
operating equipment 6,600 (6%) 10 (1%) 210 (5%) $61 (5%) Non-confined 1,700 (2%) 10 (1%) 160 (4%) $61 (5%) Confined 4,900 (5%) 0 (0%) 50 (1%) $0 (0%) Smoking materials 6,400 (6%) 130 (31%) 480 (11%) $189 (15%) Non-confined 3,700 (3%) 130 (31%) 460 (11%) $189 (15%) Confined 2,700 (3%) 0 (0%) 20 (0%) $0 (0%) Heat from direct flame or
convection currents 5,000 (5%) 10 (2%) 90 (2%) $36 (3%) Non-confined 900 (1%) 10 (2%) 50 (1%) $36 (3%) Confined 4,100 (4%) 0 (0%) 40 (1%) $0 (0%) Arcing 4,400 (4%) 30 (8%) 260 (6%) $135 (11%) Non-confined 3,700 (3%) 30 (8%) 260 (6%) $135 (11%) Confined 700 (1%) 0 (0%) 10 (0%) $0 (0%) Hot ember or ash 2,700 (3%) 20 (5%) 100 (2%) $54 (4%) Non-confined 1,500 (1%) 20 (5%) 100 (2%) $54 (4%) Confined 1,200 (1%) 0 (0%) 10 (0%) $0 (0%) Candle 2,200 (2%) 20 (5%) 290 (7%) $69 (6%) Non-confined 1,900 (2%) 20 (5%) 280 (7%) $69 (6%) Confined 300 (0%) 0 (0%) 10 (0%) $0 (0%)
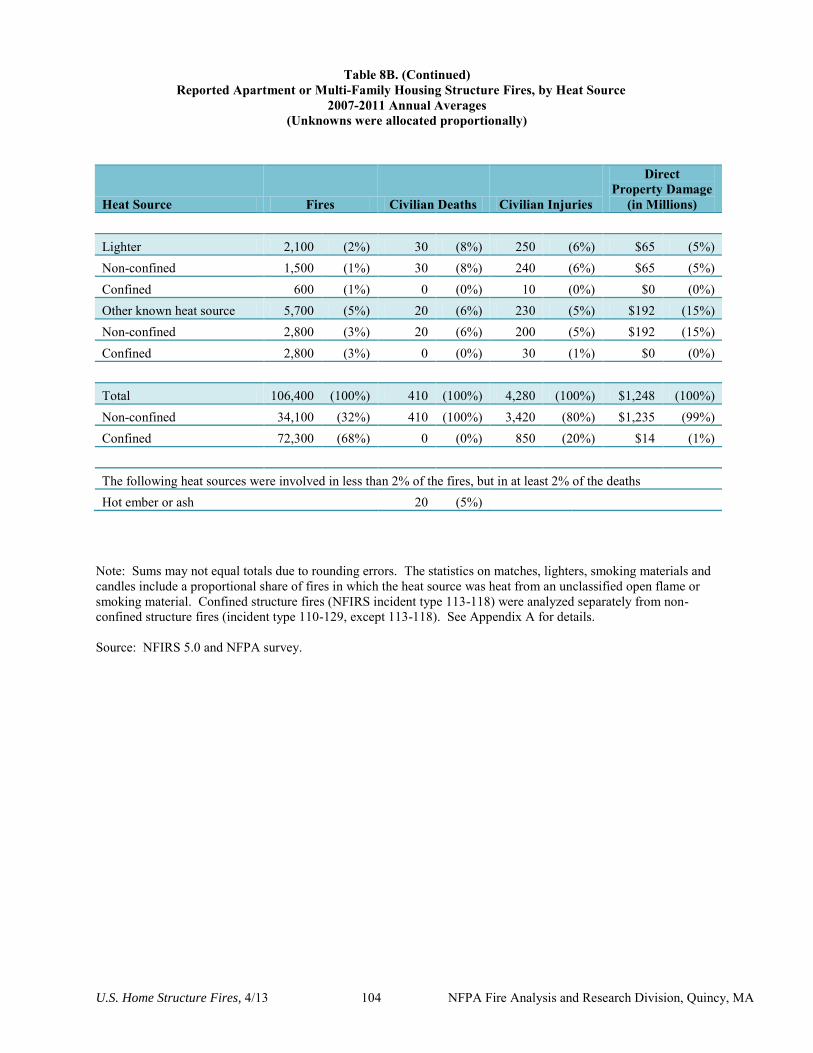
U.S. Home Structure Fires, 4/13 104 NFPA Fire Analysis and Research Division, Quincy, MA
Table 8B. (Continued) Reported Apartment or Multi-Family Housing Structure Fires, by Heat Source
2007-2011 Annual Averages (Unknowns were allocated proportionally)
Heat Source Fires Civilian Deaths Civilian Injuries
Direct Property Damage
(in Millions)
Lighter 2,100 (2%) 30 (8%) 250 (6%) $65 (5%) Non-confined 1,500 (1%) 30 (8%) 240 (6%) $65 (5%) Confined 600 (1%) 0 (0%) 10 (0%) $0 (0%) Other known heat source 5,700 (5%) 20 (6%) 230 (5%) $192 (15%) Non-confined 2,800 (3%) 20 (6%) 200 (5%) $192 (15%) Confined 2,800 (3%) 0 (0%) 30 (1%) $0 (0%)
Total 106,400 (100%) 410 (100%) 4,280 (100%) $1,248 (100%) Non-confined 34,100 (32%) 410 (100%) 3,420 (80%) $1,235 (99%) Confined 72,300 (68%) 0 (0%) 850 (20%) $14 (1%)
The following heat sources were involved in less than 2% of the fires, but in at least 2% of the deaths Hot ember or ash 20 (5%)
Note: Sums may not equal totals due to rounding errors. The statistics on matches, lighters, smoking materials and candles include a proportional share of fires in which the heat source was heat from an unclassified open flame or smoking material. Confined structure fires (NFIRS incident type 113-118) were analyzed separately from non-confined structure fires (incident type 110-129, except 113-118). See Appendix A for details.
Source: NFIRS 5.0 and NFPA survey.
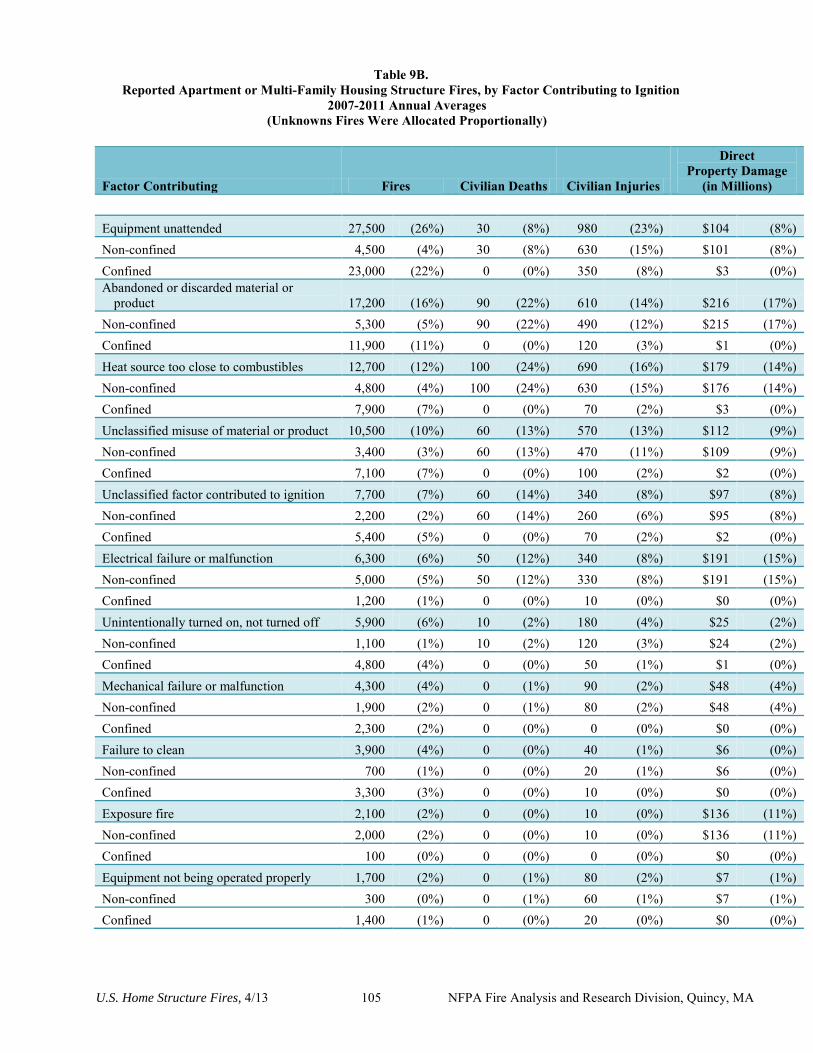
U.S. Home Structure Fires, 4/13 105 NFPA Fire Analysis and Research Division, Quincy, MA
Table 9B. Reported Apartment or Multi-Family Housing Structure Fires, by Factor Contributing to Ignition
2007-2011 Annual Averages (Unknowns Fires Were Allocated Proportionally)
Factor Contributing Fires Civilian Deaths Civilian Injuries
Direct Property Damage
(in Millions)
Equipment unattended 27,500 (26%) 30 (8%) 980 (23%) $104 (8%) Non-confined 4,500 (4%) 30 (8%) 630 (15%) $101 (8%) Confined 23,000 (22%) 0 (0%) 350 (8%) $3 (0%) Abandoned or discarded material or
product 17,200 (16%) 90 (22%) 610 (14%) $216 (17%) Non-confined 5,300 (5%) 90 (22%) 490 (12%) $215 (17%) Confined 11,900 (11%) 0 (0%) 120 (3%) $1 (0%) Heat source too close to combustibles 12,700 (12%) 100 (24%) 690 (16%) $179 (14%) Non-confined 4,800 (4%) 100 (24%) 630 (15%) $176 (14%) Confined 7,900 (7%) 0 (0%) 70 (2%) $3 (0%) Unclassified misuse of material or product 10,500 (10%) 60 (13%) 570 (13%) $112 (9%) Non-confined 3,400 (3%) 60 (13%) 470 (11%) $109 (9%) Confined 7,100 (7%) 0 (0%) 100 (2%) $2 (0%) Unclassified factor contributed to ignition 7,700 (7%) 60 (14%) 340 (8%) $97 (8%) Non-confined 2,200 (2%) 60 (14%) 260 (6%) $95 (8%) Confined 5,400 (5%) 0 (0%) 70 (2%) $2 (0%) Electrical failure or malfunction 6,300 (6%) 50 (12%) 340 (8%) $191 (15%) Non-confined 5,000 (5%) 50 (12%) 330 (8%) $191 (15%) Confined 1,200 (1%) 0 (0%) 10 (0%) $0 (0%) Unintentionally turned on, not turned off 5,900 (6%) 10 (2%) 180 (4%) $25 (2%) Non-confined 1,100 (1%) 10 (2%) 120 (3%) $24 (2%) Confined 4,800 (4%) 0 (0%) 50 (1%) $1 (0%) Mechanical failure or malfunction 4,300 (4%) 0 (1%) 90 (2%) $48 (4%) Non-confined 1,900 (2%) 0 (1%) 80 (2%) $48 (4%) Confined 2,300 (2%) 0 (0%) 0 (0%) $0 (0%) Failure to clean 3,900 (4%) 0 (0%) 40 (1%) $6 (0%) Non-confined 700 (1%) 0 (0%) 20 (1%) $6 (0%) Confined 3,300 (3%) 0 (0%) 10 (0%) $0 (0%) Exposure fire 2,100 (2%) 0 (0%) 10 (0%) $136 (11%) Non-confined 2,000 (2%) 0 (0%) 10 (0%) $136 (11%) Confined 100 (0%) 0 (0%) 0 (0%) $0 (0%) Equipment not being operated properly 1,700 (2%) 0 (1%) 80 (2%) $7 (1%) Non-confined 300 (0%) 0 (1%) 60 (1%) $7 (1%) Confined 1,400 (1%) 0 (0%) 20 (0%) $0 (0%)
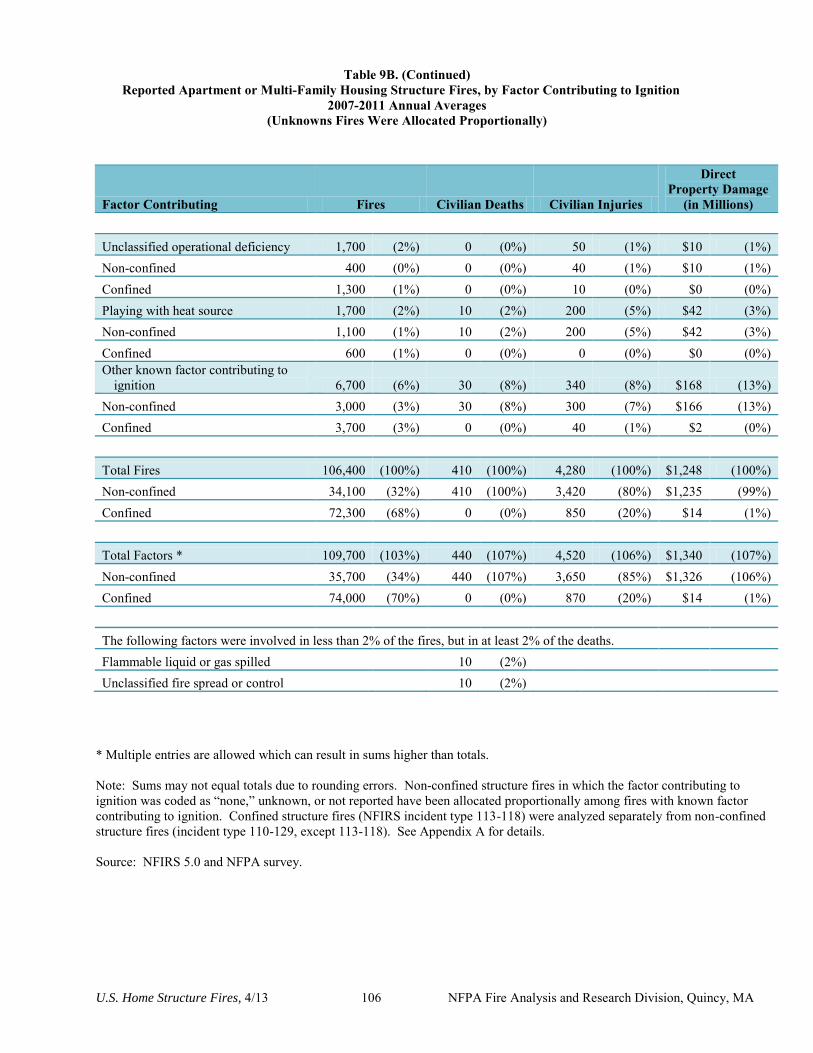
U.S. Home Structure Fires, 4/13 106 NFPA Fire Analysis and Research Division, Quincy, MA
Table 9B. (Continued) Reported Apartment or Multi-Family Housing Structure Fires, by Factor Contributing to Ignition
2007-2011 Annual Averages (Unknowns Fires Were Allocated Proportionally)
Factor Contributing Fires Civilian Deaths Civilian Injuries
Direct Property Damage
(in Millions)
Unclassified operational deficiency 1,700 (2%) 0 (0%) 50 (1%) $10 (1%) Non-confined 400 (0%) 0 (0%) 40 (1%) $10 (1%) Confined 1,300 (1%) 0 (0%) 10 (0%) $0 (0%) Playing with heat source 1,700 (2%) 10 (2%) 200 (5%) $42 (3%) Non-confined 1,100 (1%) 10 (2%) 200 (5%) $42 (3%) Confined 600 (1%) 0 (0%) 0 (0%) $0 (0%) Other known factor contributing to
ignition 6,700 (6%) 30 (8%) 340 (8%) $168 (13%) Non-confined 3,000 (3%) 30 (8%) 300 (7%) $166 (13%) Confined 3,700 (3%) 0 (0%) 40 (1%) $2 (0%)
Total Fires 106,400 (100%) 410 (100%) 4,280 (100%) $1,248 (100%) Non-confined 34,100 (32%) 410 (100%) 3,420 (80%) $1,235 (99%) Confined 72,300 (68%) 0 (0%) 850 (20%) $14 (1%)
Total Factors * 109,700 (103%) 440 (107%) 4,520 (106%) $1,340 (107%) Non-confined 35,700 (34%) 440 (107%) 3,650 (85%) $1,326 (106%) Confined 74,000 (70%) 0 (0%) 870 (20%) $14 (1%)
The following factors were involved in less than 2% of the fires, but in at least 2% of the deaths. Flammable liquid or gas spilled
10 (2%)
Unclassified fire spread or control
10 (2%)
* Multiple entries are allowed which can result in sums higher than totals. Note: Sums may not equal totals due to rounding errors. Non-confined structure fires in which the factor contributing to ignition was coded as “none,” unknown, or not reported have been allocated proportionally among fires with known factor contributing to ignition. Confined structure fires (NFIRS incident type 113-118) were analyzed separately from non-confined structure fires (incident type 110-129, except 113-118). See Appendix A for details. Source: NFIRS 5.0 and NFPA survey.
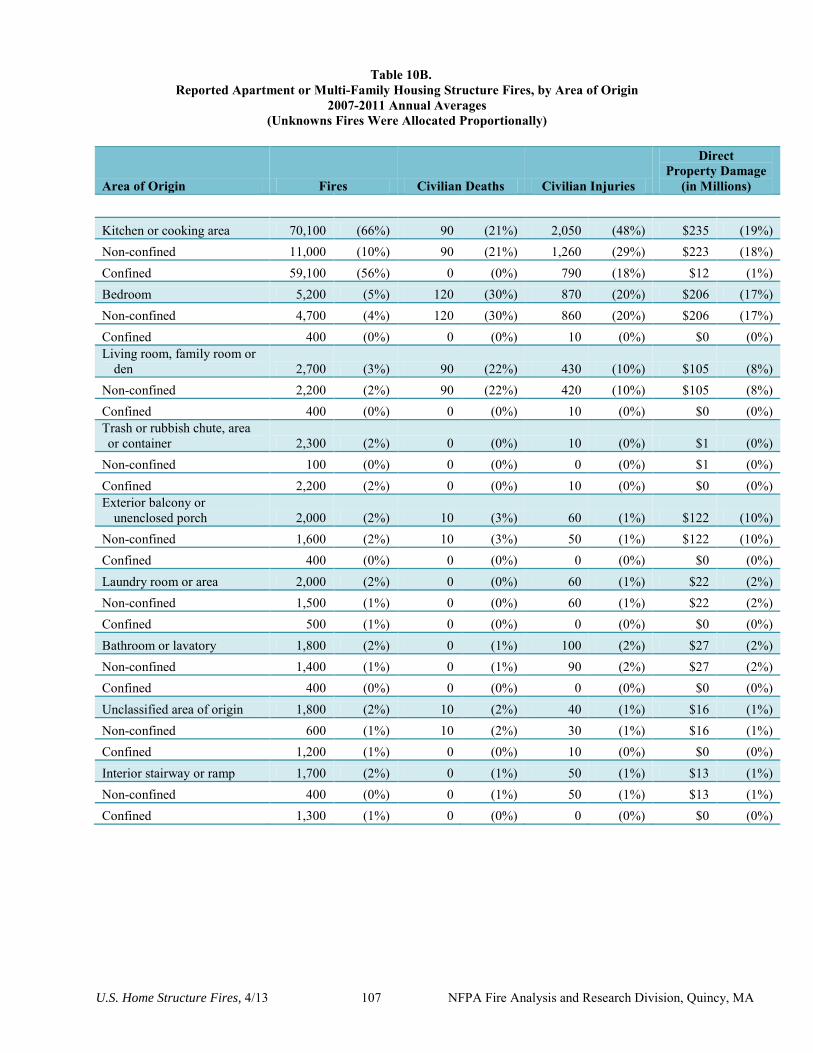
U.S. Home Structure Fires, 4/13 107 NFPA Fire Analysis and Research Division, Quincy, MA
Table 10B. Reported Apartment or Multi-Family Housing Structure Fires, by Area of Origin
2007-2011 Annual Averages (Unknowns Fires Were Allocated Proportionally)
Area of Origin Fires Civilian Deaths Civilian Injuries
Direct Property Damage
(in Millions)
Kitchen or cooking area 70,100 (66%) 90 (21%) 2,050 (48%) $235 (19%) Non-confined 11,000 (10%) 90 (21%) 1,260 (29%) $223 (18%) Confined 59,100 (56%) 0 (0%) 790 (18%) $12 (1%) Bedroom 5,200 (5%) 120 (30%) 870 (20%) $206 (17%) Non-confined 4,700 (4%) 120 (30%) 860 (20%) $206 (17%) Confined 400 (0%) 0 (0%) 10 (0%) $0 (0%) Living room, family room or
den 2,700 (3%) 90 (22%) 430 (10%) $105 (8%) Non-confined 2,200 (2%) 90 (22%) 420 (10%) $105 (8%) Confined 400 (0%) 0 (0%) 10 (0%) $0 (0%) Trash or rubbish chute, area or container 2,300 (2%) 0 (0%) 10 (0%) $1 (0%)
Non-confined 100 (0%) 0 (0%) 0 (0%) $1 (0%) Confined 2,200 (2%) 0 (0%) 10 (0%) $0 (0%) Exterior balcony or
unenclosed porch 2,000 (2%) 10 (3%) 60 (1%) $122 (10%) Non-confined 1,600 (2%) 10 (3%) 50 (1%) $122 (10%) Confined 400 (0%) 0 (0%) 0 (0%) $0 (0%) Laundry room or area 2,000 (2%) 0 (0%) 60 (1%) $22 (2%) Non-confined 1,500 (1%) 0 (0%) 60 (1%) $22 (2%) Confined 500 (1%) 0 (0%) 0 (0%) $0 (0%) Bathroom or lavatory 1,800 (2%) 0 (1%) 100 (2%) $27 (2%) Non-confined 1,400 (1%) 0 (1%) 90 (2%) $27 (2%) Confined 400 (0%) 0 (0%) 0 (0%) $0 (0%) Unclassified area of origin 1,800 (2%) 10 (2%) 40 (1%) $16 (1%) Non-confined 600 (1%) 10 (2%) 30 (1%) $16 (1%) Confined 1,200 (1%) 0 (0%) 10 (0%) $0 (0%) Interior stairway or ramp 1,700 (2%) 0 (1%) 50 (1%) $13 (1%) Non-confined 400 (0%) 0 (1%) 50 (1%) $13 (1%) Confined 1,300 (1%) 0 (0%) 0 (0%) $0 (0%)
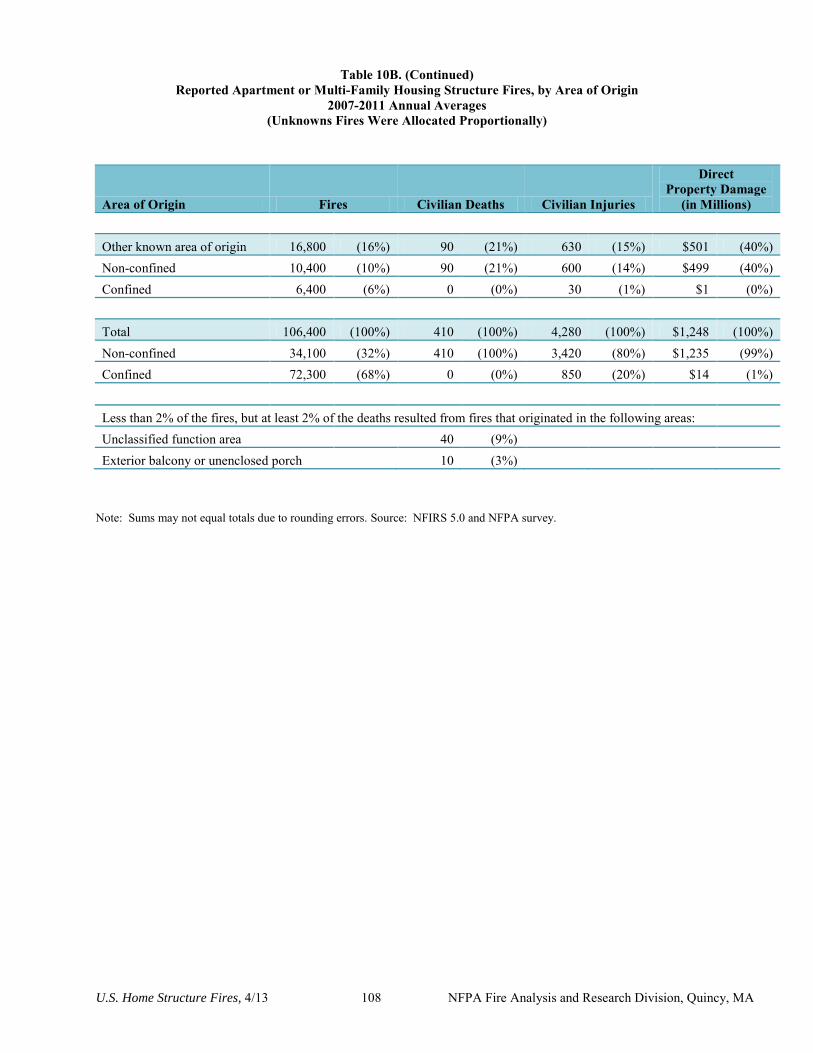
U.S. Home Structure Fires, 4/13 108 NFPA Fire Analysis and Research Division, Quincy, MA
Table 10B. (Continued) Reported Apartment or Multi-Family Housing Structure Fires, by Area of Origin
2007-2011 Annual Averages (Unknowns Fires Were Allocated Proportionally)
Area of Origin Fires Civilian Deaths Civilian Injuries
Direct Property Damage
(in Millions)
Other known area of origin 16,800 (16%) 90 (21%) 630 (15%) $501 (40%) Non-confined 10,400 (10%) 90 (21%) 600 (14%) $499 (40%) Confined 6,400 (6%) 0 (0%) 30 (1%) $1 (0%)
Total 106,400 (100%) 410 (100%) 4,280 (100%) $1,248 (100%) Non-confined 34,100 (32%) 410 (100%) 3,420 (80%) $1,235 (99%) Confined 72,300 (68%) 0 (0%) 850 (20%) $14 (1%)
Less than 2% of the fires, but at least 2% of the deaths resulted from fires that originated in the following areas: Unclassified function area
40 (9%)
Exterior balcony or unenclosed porch 10 (3%)
Note: Sums may not equal totals due to rounding errors. Source: NFIRS 5.0 and NFPA survey.
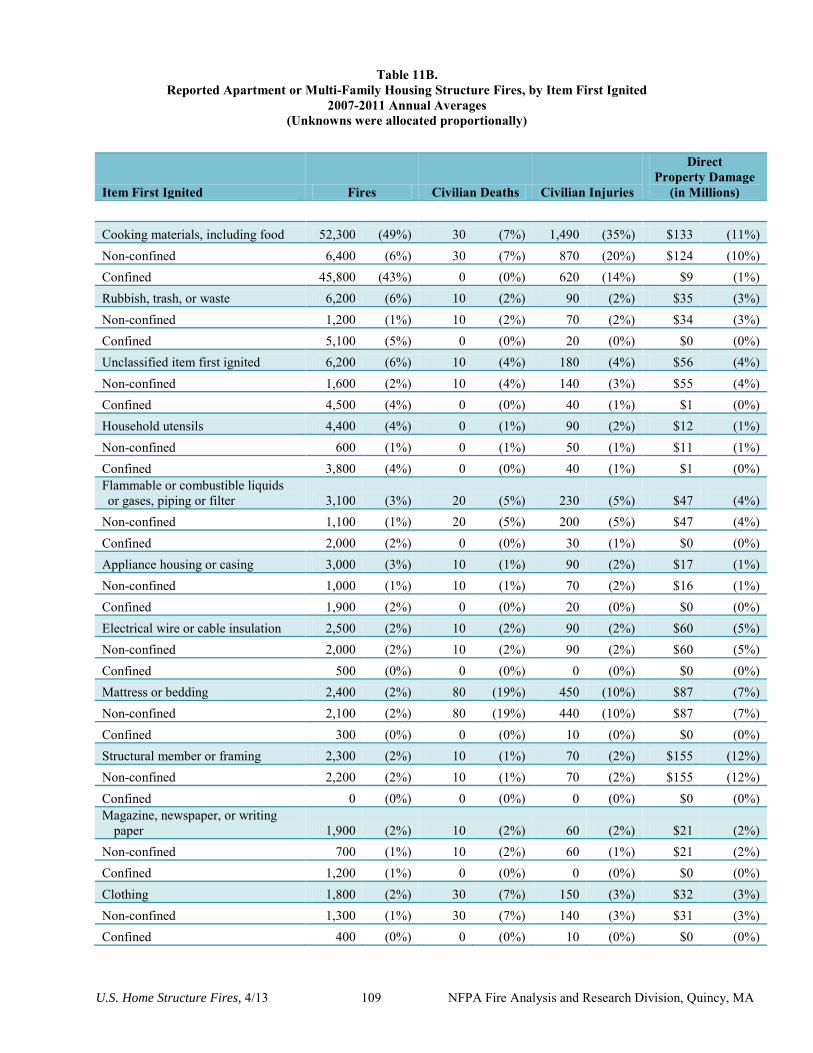
U.S. Home Structure Fires, 4/13 109 NFPA Fire Analysis and Research Division, Quincy, MA
Table 11B. Reported Apartment or Multi-Family Housing Structure Fires, by Item First Ignited
2007-2011 Annual Averages (Unknowns were allocated proportionally)
Item First Ignited Fires Civilian Deaths Civilian Injuries
Direct Property Damage
(in Millions)
Cooking materials, including food 52,300 (49%) 30 (7%) 1,490 (35%) $133 (11%) Non-confined 6,400 (6%) 30 (7%) 870 (20%) $124 (10%) Confined 45,800 (43%) 0 (0%) 620 (14%) $9 (1%) Rubbish, trash, or waste 6,200 (6%) 10 (2%) 90 (2%) $35 (3%) Non-confined 1,200 (1%) 10 (2%) 70 (2%) $34 (3%) Confined 5,100 (5%) 0 (0%) 20 (0%) $0 (0%) Unclassified item first ignited 6,200 (6%) 10 (4%) 180 (4%) $56 (4%) Non-confined 1,600 (2%) 10 (4%) 140 (3%) $55 (4%) Confined 4,500 (4%) 0 (0%) 40 (1%) $1 (0%) Household utensils 4,400 (4%) 0 (1%) 90 (2%) $12 (1%) Non-confined 600 (1%) 0 (1%) 50 (1%) $11 (1%) Confined 3,800 (4%) 0 (0%) 40 (1%) $1 (0%) Flammable or combustible liquids or gases, piping or filter 3,100 (3%) 20 (5%) 230 (5%) $47 (4%)
Non-confined 1,100 (1%) 20 (5%) 200 (5%) $47 (4%) Confined 2,000 (2%) 0 (0%) 30 (1%) $0 (0%) Appliance housing or casing 3,000 (3%) 10 (1%) 90 (2%) $17 (1%) Non-confined 1,000 (1%) 10 (1%) 70 (2%) $16 (1%) Confined 1,900 (2%) 0 (0%) 20 (0%) $0 (0%) Electrical wire or cable insulation 2,500 (2%) 10 (2%) 90 (2%) $60 (5%) Non-confined 2,000 (2%) 10 (2%) 90 (2%) $60 (5%) Confined 500 (0%) 0 (0%) 0 (0%) $0 (0%) Mattress or bedding 2,400 (2%) 80 (19%) 450 (10%) $87 (7%) Non-confined 2,100 (2%) 80 (19%) 440 (10%) $87 (7%) Confined 300 (0%) 0 (0%) 10 (0%) $0 (0%) Structural member or framing 2,300 (2%) 10 (1%) 70 (2%) $155 (12%) Non-confined 2,200 (2%) 10 (1%) 70 (2%) $155 (12%) Confined 0 (0%) 0 (0%) 0 (0%) $0 (0%) Magazine, newspaper, or writing
paper 1,900 (2%) 10 (2%) 60 (2%) $21 (2%) Non-confined 700 (1%) 10 (2%) 60 (1%) $21 (2%) Confined 1,200 (1%) 0 (0%) 0 (0%) $0 (0%) Clothing 1,800 (2%) 30 (7%) 150 (3%) $32 (3%) Non-confined 1,300 (1%) 30 (7%) 140 (3%) $31 (3%) Confined 400 (0%) 0 (0%) 10 (0%) $0 (0%)
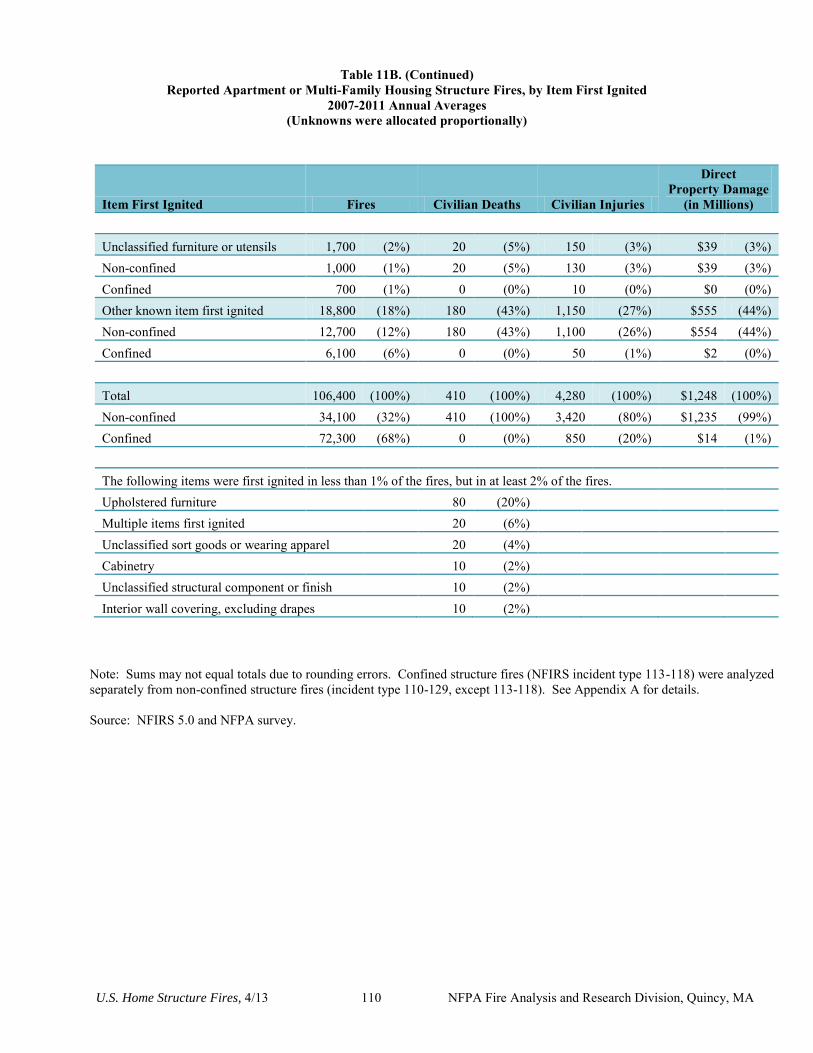
U.S. Home Structure Fires, 4/13 110 NFPA Fire Analysis and Research Division, Quincy, MA
Table 11B. (Continued) Reported Apartment or Multi-Family Housing Structure Fires, by Item First Ignited
2007-2011 Annual Averages (Unknowns were allocated proportionally)
Item First Ignited Fires Civilian Deaths Civilian Injuries
Direct Property Damage
(in Millions)
Unclassified furniture or utensils 1,700 (2%) 20 (5%) 150 (3%) $39 (3%) Non-confined 1,000 (1%) 20 (5%) 130 (3%) $39 (3%) Confined 700 (1%) 0 (0%) 10 (0%) $0 (0%) Other known item first ignited 18,800 (18%) 180 (43%) 1,150 (27%) $555 (44%) Non-confined 12,700 (12%) 180 (43%) 1,100 (26%) $554 (44%) Confined 6,100 (6%) 0 (0%) 50 (1%) $2 (0%)
Total 106,400 (100%) 410 (100%) 4,280 (100%) $1,248 (100%) Non-confined 34,100 (32%) 410 (100%) 3,420 (80%) $1,235 (99%) Confined 72,300 (68%) 0 (0%) 850 (20%) $14 (1%)
The following items were first ignited in less than 1% of the fires, but in at least 2% of the fires. Upholstered furniture
80 (20%)
Multiple items first ignited
20 (6%) Unclassified sort goods or wearing apparel 20 (4%) Cabinetry
10 (2%)
Unclassified structural component or finish 10 (2%) Interior wall covering, excluding drapes 10 (2%)
Note: Sums may not equal totals due to rounding errors. Confined structure fires (NFIRS incident type 113-118) were analyzed separately from non-confined structure fires (incident type 110-129, except 113-118). See Appendix A for details. Source: NFIRS 5.0 and NFPA survey.
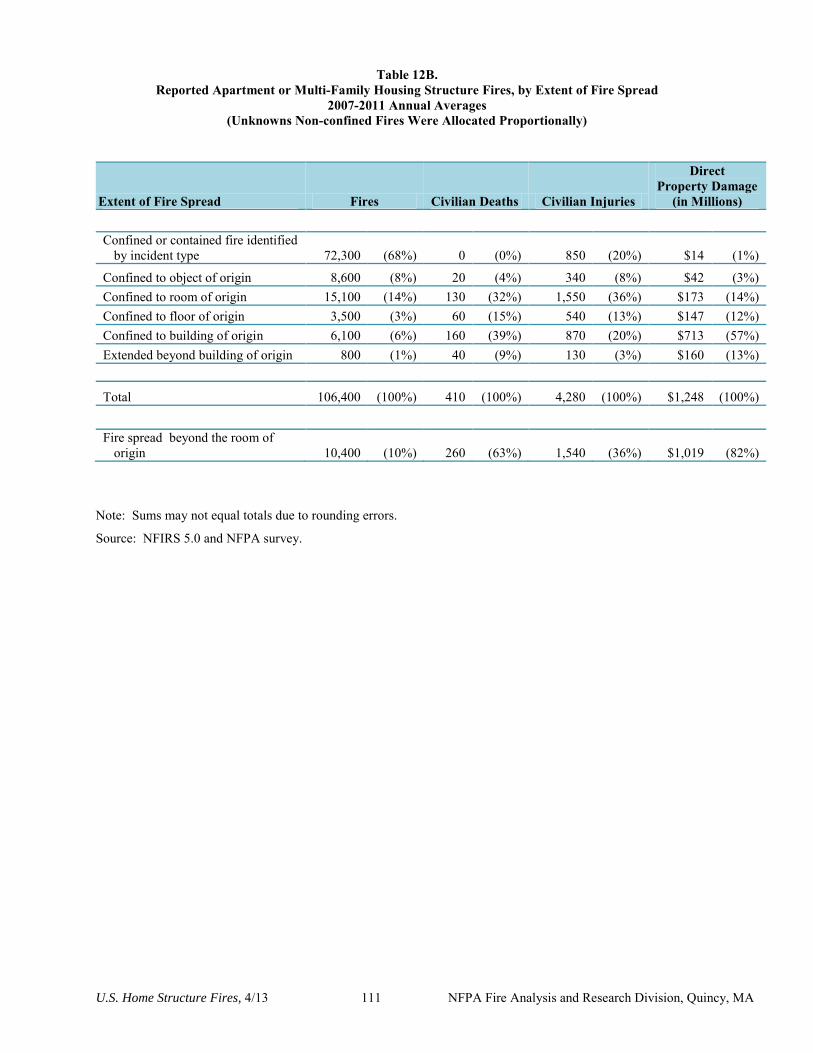
U.S. Home Structure Fires, 4/13 111 NFPA Fire Analysis and Research Division, Quincy, MA
Table 12B. Reported Apartment or Multi-Family Housing Structure Fires, by Extent of Fire Spread
2007-2011 Annual Averages (Unknowns Non-confined Fires Were Allocated Proportionally)
Extent of Fire Spread Fires Civilian Deaths Civilian Injuries
Direct Property Damage
(in Millions)
Confined or contained fire identified
by incident type 72,300 (68%) 0 (0%) 850 (20%) $14 (1%)
Confined to object of origin 8,600 (8%) 20 (4%) 340 (8%) $42 (3%) Confined to room of origin 15,100 (14%) 130 (32%) 1,550 (36%) $173 (14%) Confined to floor of origin 3,500 (3%) 60 (15%) 540 (13%) $147 (12%) Confined to building of origin 6,100 (6%) 160 (39%) 870 (20%) $713 (57%) Extended beyond building of origin 800 (1%) 40 (9%) 130 (3%) $160 (13%)
Total 106,400 (100%) 410 (100%) 4,280 (100%) $1,248 (100%)
Fire spread beyond the room of
origin 10,400 (10%) 260 (63%) 1,540 (36%) $1,019 (82%) Note: Sums may not equal totals due to rounding errors.
Source: NFIRS 5.0 and NFPA survey.
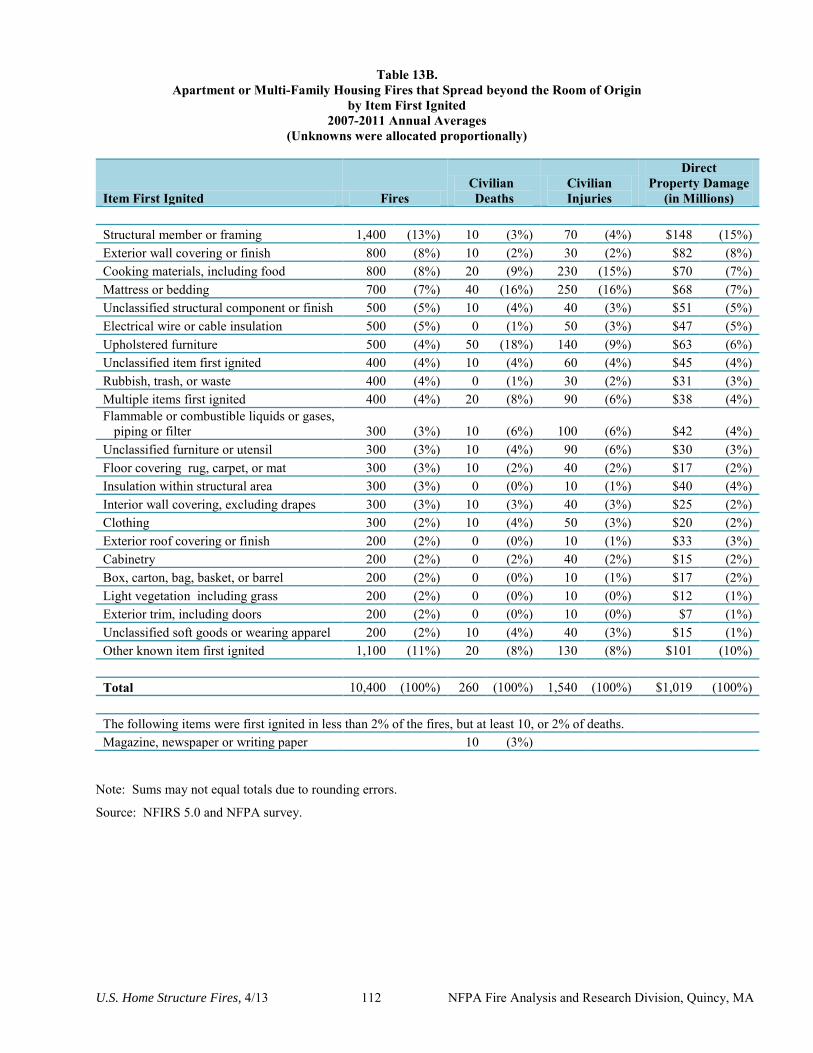
U.S. Home Structure Fires, 4/13 112 NFPA Fire Analysis and Research Division, Quincy, MA
Table 13B. Apartment or Multi-Family Housing Fires that Spread beyond the Room of Origin
by Item First Ignited 2007-2011 Annual Averages
(Unknowns were allocated proportionally)
Item First Ignited Fires Civilian Deaths
Civilian Injuries
Direct Property Damage
(in Millions)
Structural member or framing 1,400 (13%) 10 (3%) 70 (4%) $148 (15%) Exterior wall covering or finish 800 (8%) 10 (2%) 30 (2%) $82 (8%) Cooking materials, including food 800 (8%) 20 (9%) 230 (15%) $70 (7%) Mattress or bedding 700 (7%) 40 (16%) 250 (16%) $68 (7%) Unclassified structural component or finish 500 (5%) 10 (4%) 40 (3%) $51 (5%) Electrical wire or cable insulation 500 (5%) 0 (1%) 50 (3%) $47 (5%) Upholstered furniture 500 (4%) 50 (18%) 140 (9%) $63 (6%) Unclassified item first ignited 400 (4%) 10 (4%) 60 (4%) $45 (4%) Rubbish, trash, or waste 400 (4%) 0 (1%) 30 (2%) $31 (3%) Multiple items first ignited 400 (4%) 20 (8%) 90 (6%) $38 (4%) Flammable or combustible liquids or gases,
piping or filter 300 (3%) 10 (6%) 100 (6%) $42 (4%) Unclassified furniture or utensil 300 (3%) 10 (4%) 90 (6%) $30 (3%) Floor covering rug, carpet, or mat 300 (3%) 10 (2%) 40 (2%) $17 (2%) Insulation within structural area 300 (3%) 0 (0%) 10 (1%) $40 (4%) Interior wall covering, excluding drapes 300 (3%) 10 (3%) 40 (3%) $25 (2%) Clothing 300 (2%) 10 (4%) 50 (3%) $20 (2%) Exterior roof covering or finish 200 (2%) 0 (0%) 10 (1%) $33 (3%) Cabinetry 200 (2%) 0 (2%) 40 (2%) $15 (2%) Box, carton, bag, basket, or barrel 200 (2%) 0 (0%) 10 (1%) $17 (2%) Light vegetation including grass 200 (2%) 0 (0%) 10 (0%) $12 (1%) Exterior trim, including doors 200 (2%) 0 (0%) 10 (0%) $7 (1%) Unclassified soft goods or wearing apparel 200 (2%) 10 (4%) 40 (3%) $15 (1%) Other known item first ignited 1,100 (11%) 20 (8%) 130 (8%) $101 (10%)
Total 10,400 (100%) 260 (100%) 1,540 (100%) $1,019 (100%)
The following items were first ignited in less than 2% of the fires, but at least 10, or 2% of deaths. Magazine, newspaper or writing paper
10 (3%)
Note: Sums may not equal totals due to rounding errors.
Source: NFIRS 5.0 and NFPA survey.
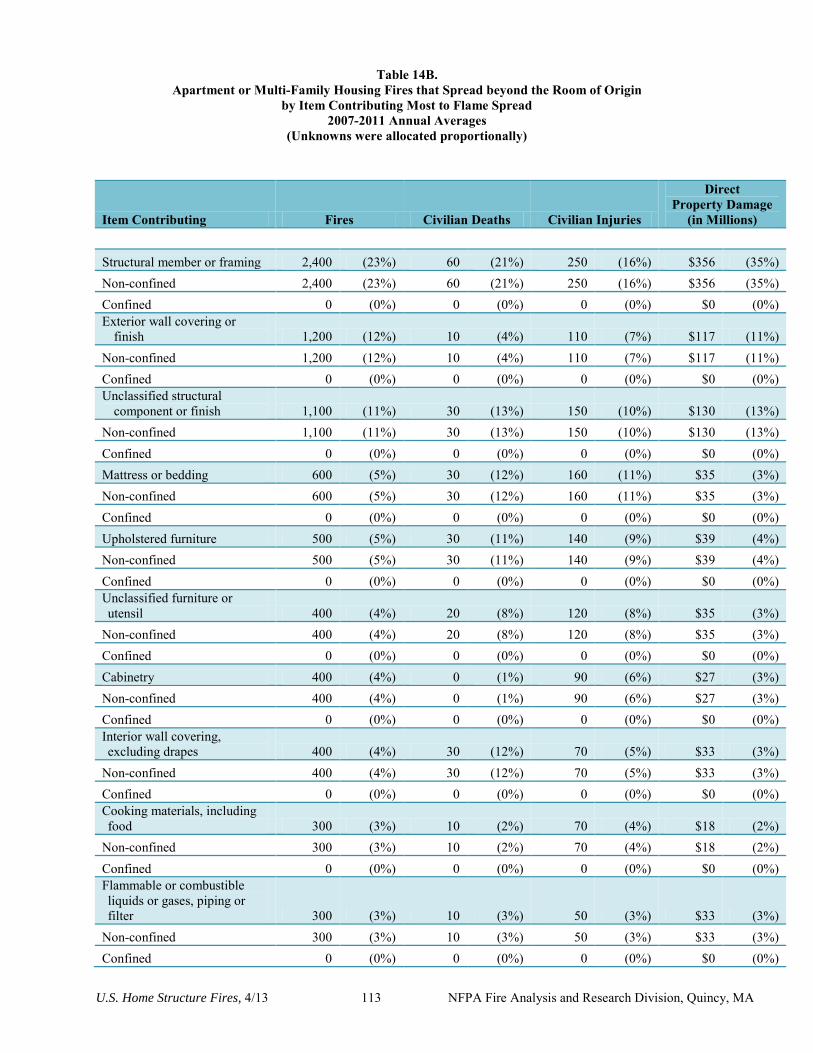
U.S. Home Structure Fires, 4/13 113 NFPA Fire Analysis and Research Division, Quincy, MA
Table 14B. Apartment or Multi-Family Housing Fires that Spread beyond the Room of Origin
by Item Contributing Most to Flame Spread 2007-2011 Annual Averages
(Unknowns were allocated proportionally)
Item Contributing Fires Civilian Deaths Civilian Injuries
Direct Property Damage
(in Millions)
Structural member or framing 2,400 (23%) 60 (21%) 250 (16%) $356 (35%) Non-confined 2,400 (23%) 60 (21%) 250 (16%) $356 (35%) Confined 0 (0%) 0 (0%) 0 (0%) $0 (0%) Exterior wall covering or
finish 1,200 (12%) 10 (4%) 110 (7%) $117 (11%) Non-confined 1,200 (12%) 10 (4%) 110 (7%) $117 (11%) Confined 0 (0%) 0 (0%) 0 (0%) $0 (0%) Unclassified structural
component or finish 1,100 (11%) 30 (13%) 150 (10%) $130 (13%) Non-confined 1,100 (11%) 30 (13%) 150 (10%) $130 (13%) Confined 0 (0%) 0 (0%) 0 (0%) $0 (0%) Mattress or bedding 600 (5%) 30 (12%) 160 (11%) $35 (3%) Non-confined 600 (5%) 30 (12%) 160 (11%) $35 (3%) Confined 0 (0%) 0 (0%) 0 (0%) $0 (0%) Upholstered furniture 500 (5%) 30 (11%) 140 (9%) $39 (4%) Non-confined 500 (5%) 30 (11%) 140 (9%) $39 (4%) Confined 0 (0%) 0 (0%) 0 (0%) $0 (0%) Unclassified furniture or utensil 400 (4%) 20 (8%) 120 (8%) $35 (3%)
Non-confined 400 (4%) 20 (8%) 120 (8%) $35 (3%) Confined 0 (0%) 0 (0%) 0 (0%) $0 (0%) Cabinetry 400 (4%) 0 (1%) 90 (6%) $27 (3%) Non-confined 400 (4%) 0 (1%) 90 (6%) $27 (3%) Confined 0 (0%) 0 (0%) 0 (0%) $0 (0%) Interior wall covering, excluding drapes 400 (4%) 30 (12%) 70 (5%) $33 (3%)
Non-confined 400 (4%) 30 (12%) 70 (5%) $33 (3%) Confined 0 (0%) 0 (0%) 0 (0%) $0 (0%) Cooking materials, including food 300 (3%) 10 (2%) 70 (4%) $18 (2%)
Non-confined 300 (3%) 10 (2%) 70 (4%) $18 (2%) Confined 0 (0%) 0 (0%) 0 (0%) $0 (0%) Flammable or combustible liquids or gases, piping or filter 300 (3%) 10 (3%) 50 (3%) $33 (3%)
Non-confined 300 (3%) 10 (3%) 50 (3%) $33 (3%) Confined 0 (0%) 0 (0%) 0 (0%) $0 (0%)
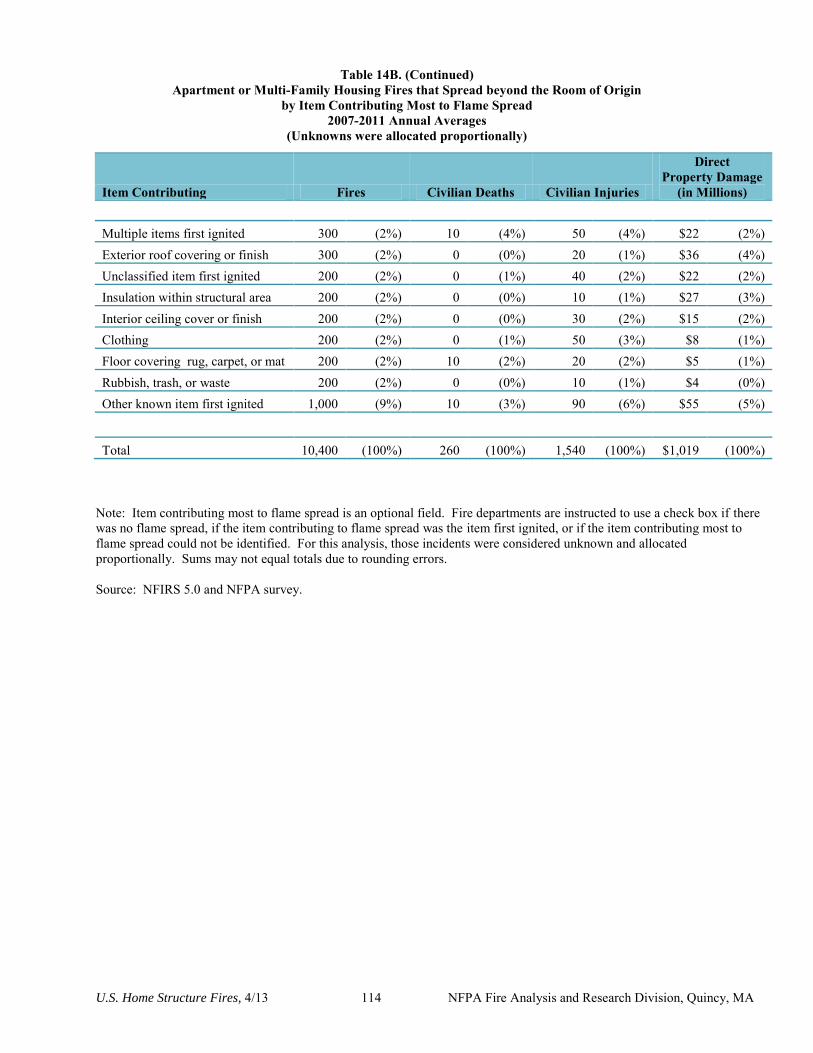
U.S. Home Structure Fires, 4/13 114 NFPA Fire Analysis and Research Division, Quincy, MA
Table 14B. (Continued) Apartment or Multi-Family Housing Fires that Spread beyond the Room of Origin
by Item Contributing Most to Flame Spread 2007-2011 Annual Averages
(Unknowns were allocated proportionally)
Item Contributing Fires Civilian Deaths Civilian Injuries
Direct Property Damage
(in Millions)
Multiple items first ignited 300 (2%) 10 (4%) 50 (4%) $22 (2%) Exterior roof covering or finish 300 (2%) 0 (0%) 20 (1%) $36 (4%) Unclassified item first ignited 200 (2%) 0 (1%) 40 (2%) $22 (2%) Insulation within structural area 200 (2%) 0 (0%) 10 (1%) $27 (3%) Interior ceiling cover or finish 200 (2%) 0 (0%) 30 (2%) $15 (2%) Clothing 200 (2%) 0 (1%) 50 (3%) $8 (1%) Floor covering rug, carpet, or mat 200 (2%) 10 (2%) 20 (2%) $5 (1%) Rubbish, trash, or waste 200 (2%) 0 (0%) 10 (1%) $4 (0%) Other known item first ignited 1,000 (9%) 10 (3%) 90 (6%) $55 (5%)
Total 10,400 (100%) 260 (100%) 1,540 (100%) $1,019 (100%)
Note: Item contributing most to flame spread is an optional field. Fire departments are instructed to use a check box if there was no flame spread, if the item contributing to flame spread was the item first ignited, or if the item contributing most to flame spread could not be identified. For this analysis, those incidents were considered unknown and allocated proportionally. Sums may not equal totals due to rounding errors. Source: NFIRS 5.0 and NFPA survey.
U.S. Home Structure Fires, 4/13 115 NFPA Fire Analysis and Research Division, Quincy, MA
Appendix A. How National Estimates Statistics Are Calculated
The statistics in this analysis are estimates derived from the U.S. Fire Administration’s (USFA’s) National Fire Incident Reporting System (NFIRS) and the National Fire Protection Association’s (NFPA’s) annual survey of U.S. fire departments. NFIRS is a voluntary system through which participating fire departments report detailed factors about the fires to which they respond. Roughly two-thirds of U.S. fire departments participate, although not all of these departments provide data every year. Fires reported to federal or state fire departments or industrial fire brigades are not included in these estimates. NFIRS provides the most detailed incident information of any national database not limited to large fires. NFIRS is the only database capable of addressing national patterns for fires of all sizes by specific property use and specific fire cause. NFIRS also captures information on the extent of flame spread, and automatic detection and suppression equipment. For more information about NFIRS visit www.nfirs.fema.gov/. Copies of the paper forms may be downloaded from www.nfirs.fema.gov/documentation/design/NFIRS_Paper_Forms_2012.pdf. NFIRS has a wide variety of data elements and codes. Many code choices describe several conditions. These cannot be broken down further. For example, area of origin code 83 captures fires starting in vehicle engine areas, running gear areas or wheel areas. It is not possible to tell the portion of each from the coded data. Methodology may change slightly from year to year. NFPA is continually examining its methodology to provide the best possible answers to specific questions. From time to time, changes are made to methodologies or groupings. Earlier editions
of the same report may have used different methodologies to produce the same analysis, meaning
that the estimates are not directly comparable from year to year. Readers should use the latest report available and contact us if clarification is needed. NFPA’s fire department experience survey provides estimates of the big picture. Each year, NFPA conducts an annual survey of fire departments which enables us to capture a summary of fire department experience on a larger scale. Surveys are sent to all municipal departments protecting populations of 50,000 or more and a random sample, stratified by community size, of the smaller departments. Typically, a total of roughly 3,000 surveys are returned, representing about one of every ten U.S. municipal fire departments serving about one third of the U.S. population. The survey is stratified by size of population protected to reduce the uncertainty of the final estimate. Small rural communities have fewer people protected per department and are less likely to respond to the survey. A larger number must be surveyed to obtain an adequate sample of those departments. (NFPA also makes follow-up calls to a sample of the smaller fire departments that do not respond, to confirm that those that did respond are truly representative of fire departments their size.) On the other hand, large city departments are so few in number and protect such a large proportion of the total U.S. population that it makes sense to survey all of them. Most respond, resulting in excellent precision for their part of the final estimate. The survey includes the following information: (1) the total number of fire incidents, civilian deaths, and civilian injuries, and the total estimated property damage (in dollars), for each of the
U.S. Home Structure Fires, 4/13 116 NFPA Fire Analysis and Research Division, Quincy, MA
major property use classes defined in NFIRS; (2) the number of on-duty firefighter injuries, by type of duty and nature of illness; 3) the number and nature of non-fire incidents; and (4) information on the type of community protected (e.g., county versus township versus city) and the size of the population protected, which is used in the statistical formula for projecting national totals from sample results. The results of the survey are published in the annual report Fire Loss in the United States. To download a free copy of the report, visit http://www.nfpa.org/assets/files/PDF/OS.fireloss.pdf. Projecting NFIRS to National Estimates As noted, NFIRS is a voluntary reporting system. Different states and jurisdictions have different reporting requirements and practices. Participation rates in NFIRS are not necessarily uniform across regions and community sizes, both factors correlated with frequency and severity of fires. This means NFIRS may be susceptible to systematic biases. No one at present can quantify the size of these deviations from the ideal, representative sample. But there is enough reason for concern so that a second database -- the NFPA survey -- is needed to project NFIRS to national estimates and to project different parts of NFIRS separately. This multiple calibration approach makes use of the annual NFPA survey where its statistical design advantages are strongest. Scaling ratios are obtained by comparing NFPA’s projected totals of residential structure fires, non-residential structure fires, vehicle fires, and outside and other fires, and associated civilian deaths, civilian injuries, and direct property damage with comparable totals in NFIRS. Estimates of specific fire problems and circumstances are obtained by multiplying the NFIRS data by the scaling ratios. Reports for incidents in which mutual aid was given are excluded from NFPA’s analyses. Analysts at the NFPA, the USFA and the Consumer Product Safety Commission developed the analytical rules used in analyzing data from the two data sets. "The National Estimates Approach to U.S. Fire Statistics," by John R. Hall, Jr. and Beatrice Harwood, provides a more detailed explanation of national estimates. Version 5.0 of NFIRS, first introduced in 1999, used a different coding structure for many data elements, added some property use codes, and dropped others. The essentials of the approach described by Hall and Harwood are still used, but some modifications have been necessary to accommodate the changes in NFIRS 5.0. Figure A.1 shows the percentage of fires originally collected in the NFIRS 5.0 system. Each year’s release version of NFIRS data also includes data collected in older versions of NFIRS that were converted to NFIRS 5.0 codes.
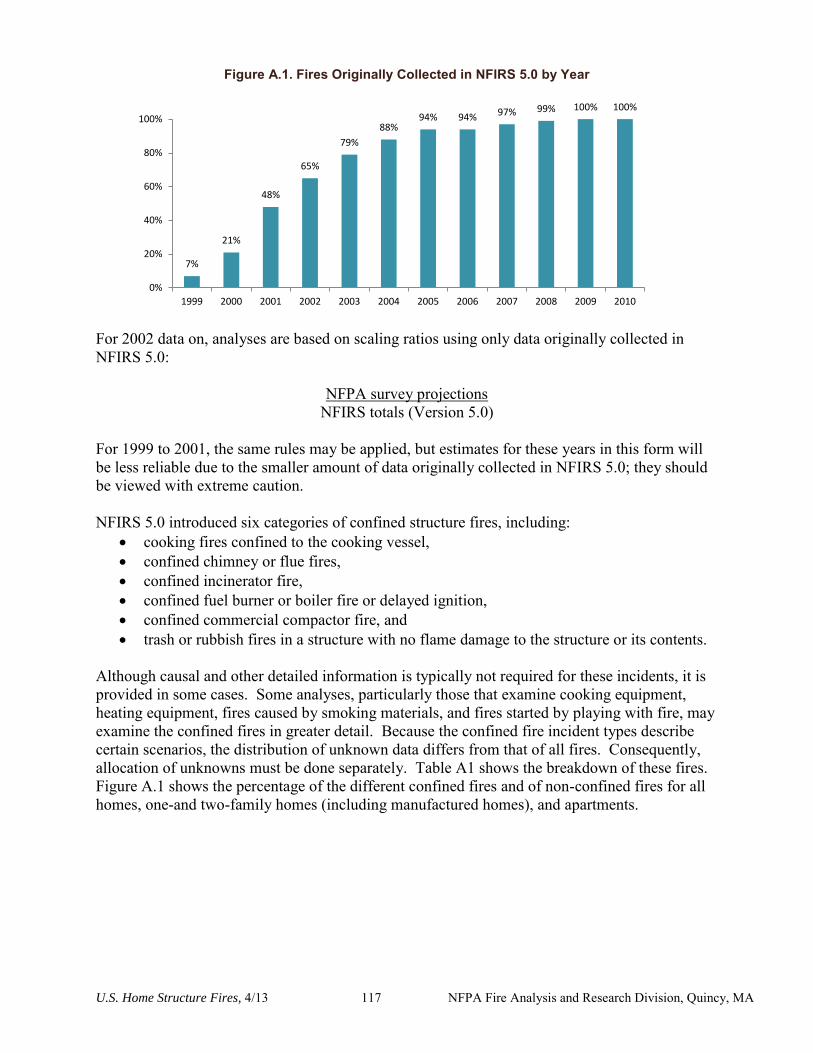
U.S. Home Structure Fires, 4/13 117 NFPA Fire Analysis and Research Division, Quincy, MA
Figure A.1. Fires Originally Collected in NFIRS 5.0 by Year
For 2002 data on, analyses are based on scaling ratios using only data originally collected in NFIRS 5.0:
NFPA survey projections NFIRS totals (Version 5.0)
For 1999 to 2001, the same rules may be applied, but estimates for these years in this form will be less reliable due to the smaller amount of data originally collected in NFIRS 5.0; they should be viewed with extreme caution. NFIRS 5.0 introduced six categories of confined structure fires, including:
cooking fires confined to the cooking vessel, confined chimney or flue fires, confined incinerator fire, confined fuel burner or boiler fire or delayed ignition, confined commercial compactor fire, and trash or rubbish fires in a structure with no flame damage to the structure or its contents.
Although causal and other detailed information is typically not required for these incidents, it is provided in some cases. Some analyses, particularly those that examine cooking equipment, heating equipment, fires caused by smoking materials, and fires started by playing with fire, may examine the confined fires in greater detail. Because the confined fire incident types describe certain scenarios, the distribution of unknown data differs from that of all fires. Consequently, allocation of unknowns must be done separately. Table A1 shows the breakdown of these fires. Figure A.1 shows the percentage of the different confined fires and of non-confined fires for all homes, one-and two-family homes (including manufactured homes), and apartments.
7%
21%
48%
65%
79%
88% 94% 94% 97% 99% 100% 100%
0%
20%
40%
60%
80%
100%
1999 2000 2001 2002 2003 2004 2005 2006 2007 2008 2009 2010
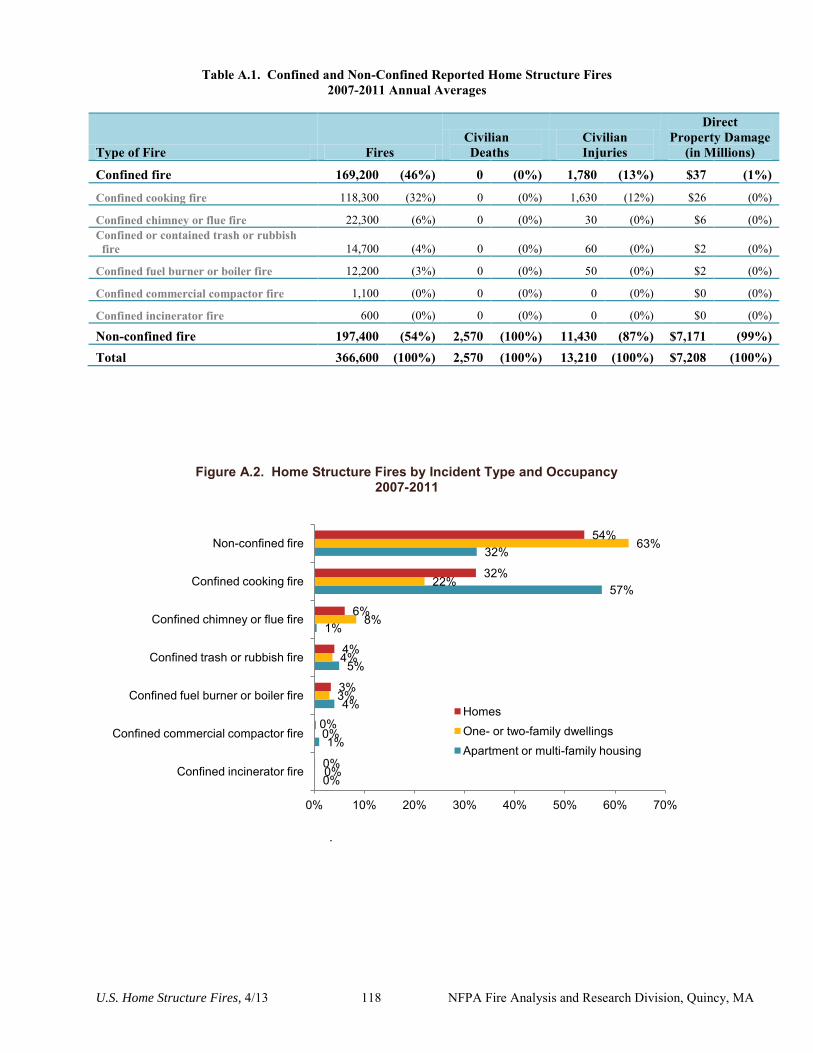
U.S. Home Structure Fires, 4/13 118 NFPA Fire Analysis and Research Division, Quincy, MA
Table A.1. Confined and Non-Confined Reported Home Structure Fires 2007-2011 Annual Averages
Type of Fire Fires Civilian Deaths
Civilian Injuries
Direct Property Damage
(in Millions)
Confined fire 169,200 (46%) 0 (0%) 1,780 (13%) $37 (1%)
Confined cooking fire 118,300 (32%) 0 (0%) 1,630 (12%) $26 (0%)
Confined chimney or flue fire 22,300 (6%) 0 (0%) 30 (0%) $6 (0%) Confined or contained trash or rubbish
fire 14,700 (4%) 0 (0%) 60 (0%) $2 (0%)
Confined fuel burner or boiler fire 12,200 (3%) 0 (0%) 50 (0%) $2 (0%)
Confined commercial compactor fire 1,100 (0%) 0 (0%) 0 (0%) $0 (0%)
Confined incinerator fire 600 (0%) 0 (0%) 0 (0%) $0 (0%)
Non-confined fire 197,400 (54%) 2,570 (100%) 11,430 (87%) $7,171 (99%) Total 366,600 (100%) 2,570 (100%) 13,210 (100%) $7,208 (100%)
Figure A.2. Home Structure Fires by Incident Type and Occupancy 2007-2011
.
0%
1%
4%
5%
1%
57%
32%
0%
0%
3%
4%
8%
22%
63%
0%
0%
3%
4%
6%
32%
54%
0% 10% 20% 30% 40% 50% 60% 70%
Confined incinerator fire
Confined commercial compactor fire
Confined fuel burner or boiler fire
Confined trash or rubbish fire
Confined chimney or flue fire
Confined cooking fire
Non-confined fire
Homes One- or two-family dwellings Apartment or multi-family housing
U.S. Home Structure Fires, 4/13 119 NFPA Fire Analysis and Research Division, Quincy, MA
Some analyses of structure fires show only non-confined fires. In these tables, percentages shown are of non-confined structure fires rather than alls structure fires. This approach has the advantage of showing the frequency of specific factors in fire causes, but the disadvantage of possibly overstating the percentage of factors that are seldom seen in the confined fire incident types and of understating the factors specifically associated with the confined fire incident types. Other analyses include entries for confined fire incident types in the causal tables and show percentages based on total structure fires. In these cases, the confined fire incident type is treated as a general causal factor. For most fields other than Property Use and Incident Type, NFPA allocates unknown data proportionally among known data. This approach assumes that if the missing data were known, it would be distributed in the same manner as the known data. NFPA makes additional adjustments to several fields. Casualty and loss projections can be heavily influenced by the
inclusion or exclusion of unusually serious fire.
In the formulas that follow, the term “all fires” refers to all fires in NFIRS on the dimension studied. The percentages of fires with known or unknown data are provided for non-confined fires and associated losses, and for confined fires only. Cause of Ignition: This field is used chiefly to identify intentional fires. “Unintentional” in this field is a specific entry and does not include other fires that were not intentionally set: failure of equipment or heat source, act of nature, or “other” (unclassified).” The last should be used for exposures but has been used for other situations as well. Fires that were coded as under investigation and those that were coded as undetermined after investigation were treated as unknown. For non-confined home structure fires, the cause was known in 70% of the fires, 43% of the civilian deaths, 68% of the civilian injuries, and 57% of the direct property damage. For confined fires, the cause was known in 17% of the fires. Factor Contributing to Ignition: In this field, the code “none” is treated as an unknown and allocated proportionally. For Human Factor Contributing to Ignition, NFPA enters a code for “not reported” when no factors are recorded. “Not reported” is treated as an unknown, but the code “none” is treated as a known code and not allocated. Multiple entries are allowed in both of these fields. Percentages are calculated on the total number of fires, not entries, resulting in sums greater than 100%. Although Factor Contributing to Ignition is only required when the cause of ignition was coded as: 2) unintentional, 3) failure of equipment or heat source; or 4) act of nature, data is often present when not required. Consequently, any fire in which no factor contributing to ignition was entered was treated as unknown. In some analyses, all entries in the category of mechanical failure, malfunction (factor contributing to ignition 20-29) are combined and shown as one entry, “mechanical failure or malfunction.” This category includes:
21. Automatic control failure; 22. Manual control failure; 23. Leak or break. Includes leaks or breaks from containers or pipes. Excludes operational
deficiencies and spill mishaps; 25. Worn out; 26. Backfire. Excludes fires originating as a result of hot catalytic converters; 27. Improper fuel used; Includes the use of gasoline in a kerosene heater and the like; and 20. Mechanical failure or malfunction, other.
U.S. Home Structure Fires, 4/13 120 NFPA Fire Analysis and Research Division, Quincy, MA
Entries in “electrical failure, malfunction” (factor contributing to ignition 30-39) may also be combined into one entry, “electrical failure or malfunction.” This category includes:
31. Water-caused short circuit arc; 32. Short-circuit arc from mechanical damage; 33. Short-circuit arc from defective or worn insulation; 34. Unspecified short circuit arc; 35. Arc from faulty contact or broken connector, including broken power lines and loose
connections; 36. Arc or spark from operating equipment, switch, or electric fence; 37. Fluorescent light ballast; and 30. Electrical failure or malfunction, other.
The factor contributing to ignition was coded as none, undetermined or left blank in 47% of the non-confined home structure fires, 66% of the associated deaths, 45% of the associated injuries, 55% of the associated direct property damage and 89% of the confined fires.
Type of Material First Ignited (TMI). This field is required only if the Item First Ignited falls within the code range of 00-69. NFPA has created a new code “not required” for this field that is applied when Item First Ignited is in code 70-99 (organic materials, including cooking materials and vegetation, and general materials, such as electrical wire, cable insulation, transformers, tires, books, newspaper, dust, rubbish, etc..) and TMI is blank. The ratio for allocation of unknown data is:
(All fires – TMI Not required) (All fires – TMI Not Required – Undetermined – Blank)
Heat Source. In NFIRS 5.0, one grouping of codes encompasses various types of open flames and smoking materials. In the past, these had been two separate groupings. A new code was added to NFIRS 5.0, which is code 60: “Heat from open flame or smoking material, other.” NFPA treats this code as a partial unknown and allocates it proportionally across the codes in the 61-69 range, shown below.
61. Cigarette; 62. Pipe or cigar; 63. Heat from undetermined smoking material; 64. Match; 65. Lighter: cigarette lighter, cigar lighter; 66. Candle; 67 Warning or road flare, fuse; 68. Backfire from internal combustion engine. Excludes flames and sparks from an exhaust
system, (11); and 69. Flame/torch used for lighting. Includes gas light and gas-/liquid-fueled lantern.
In addition to the conventional allocation of missing and undetermined fires, NFPA multiplies fires with codes in the 61-69 range by
All fires in range 60-69 All fires in range 61-69
The downside of this approach is that heat sources that are truly a different type of open flame or
U.S. Home Structure Fires, 4/13 121 NFPA Fire Analysis and Research Division, Quincy, MA
smoking material are erroneously assigned to other categories. The grouping “smoking materials” includes codes 61-63 (cigarettes, pipes or cigars, and heat from undetermined smoking material, with a proportional share of the code 60s and true unknown data. In non-confined home structure fires, code 60: “heat from open flame or smoking material, other” was entered for 3% of the fires, as well as civilian deaths and injuries and direct property damage. The heat source was undetermined in 34% of the non-confined home structure fires, 57% of the civilian deaths, 31% of the civilian injuries, and 46% of the direct property damage. The heat source was known in 17% of the confined fires, including 1% with heat source code 60. Equipment Involved in Ignition (EII). NFIRS 5.0 originally defined EII as the piece of equipment that provided the principal heat source to cause ignition if the equipment malfunctioned or was used improperly. In 2006, the definition was modified to “the piece of equipment that provided the principal heat source to cause ignition.” However, much of the data predates the change. Individuals who have already been trained with the older definition may not change their practices. To compensate, NFPA treats fires in which EII = NNN and heat source is not in the range of 40-99 as an additional unknown. To allocate unknown data for EII, the known data is multiplied by
All fires (All fires – blank – undetermined – [fires in which EII =NNN and heat source <>40-99])
In addition, the partially unclassified codes for broad equipment groupings (i.e., code 100 - heating, ventilation, and air conditioning, other; code 200 - electrical distribution, lighting and power transfer, other; etc.) were allocated proportionally across the individual code choices in their respective broad groupings (heating, ventilation, and air conditioning; electrical distribution, lighting and power transfer, other; etc.). Equipment that is totally unclassified is not allocated further. This approach has the same downside as the allocation of heat source 60 described above. Equipment that is truly different is erroneously assigned to other categories. In some analyses, various types of equipment are grouped together.
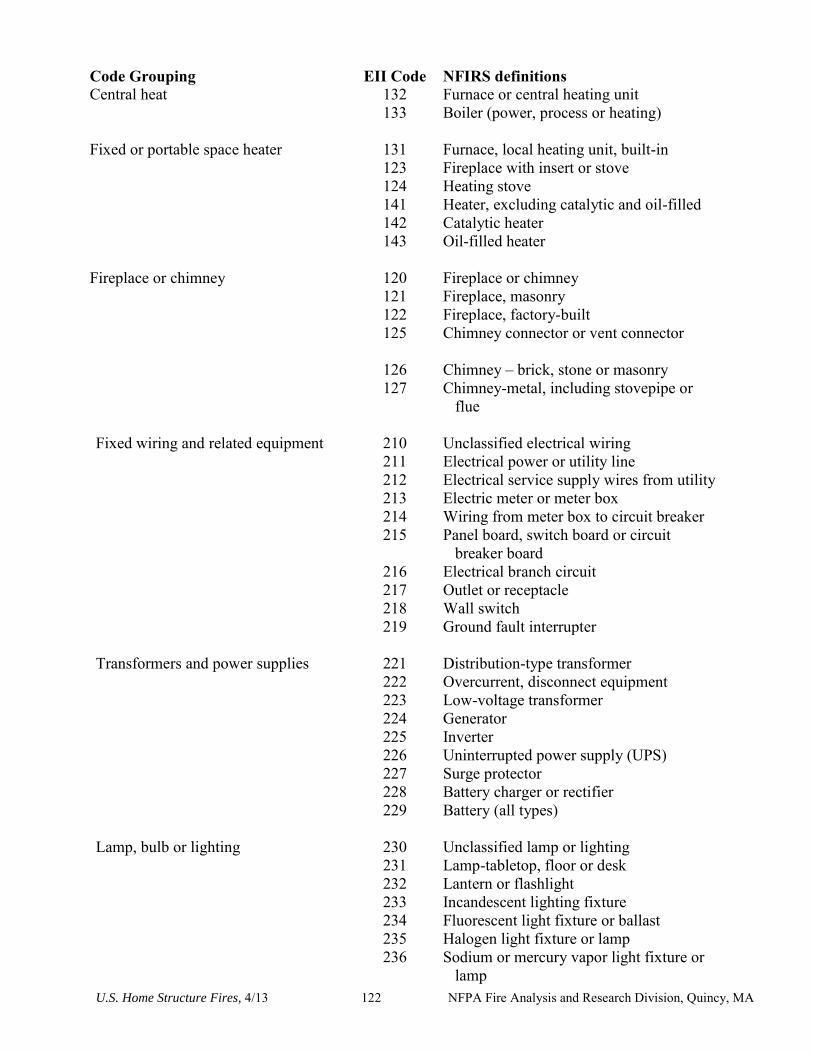
U.S. Home Structure Fires, 4/13 122 NFPA Fire Analysis and Research Division, Quincy, MA
Code Grouping EII Code NFIRS definitions Central heat 132 Furnace or central heating unit 133 Boiler (power, process or heating) Fixed or portable space heater 131 Furnace, local heating unit, built-in 123 Fireplace with insert or stove 124 Heating stove 141 Heater, excluding catalytic and oil-filled 142 Catalytic heater 143 Oil-filled heater Fireplace or chimney 120 Fireplace or chimney 121 Fireplace, masonry 122 Fireplace, factory-built 125 Chimney connector or vent connector 126 Chimney – brick, stone or masonry 127 Chimney-metal, including stovepipe or
flue Fixed wiring and related equipment 210 Unclassified electrical wiring 211 Electrical power or utility line 212 Electrical service supply wires from utility 213 Electric meter or meter box 214 Wiring from meter box to circuit breaker 215 Panel board, switch board or circuit
breaker board 216 Electrical branch circuit 217 Outlet or receptacle 218 Wall switch 219 Ground fault interrupter Transformers and power supplies 221 Distribution-type transformer 222 Overcurrent, disconnect equipment 223 Low-voltage transformer 224 Generator 225 Inverter 226 Uninterrupted power supply (UPS) 227 Surge protector 228 Battery charger or rectifier 229 Battery (all types) Lamp, bulb or lighting 230 Unclassified lamp or lighting 231 Lamp-tabletop, floor or desk 232 Lantern or flashlight 233 Incandescent lighting fixture 234 Fluorescent light fixture or ballast 235 Halogen light fixture or lamp 236 Sodium or mercury vapor light fixture or
lamp
U.S. Home Structure Fires, 4/13 123 NFPA Fire Analysis and Research Division, Quincy, MA
Code Grouping EII Code NFIRS definitions 237 Work or trouble light 238 Light bulb 241 Nightlight 242 Decorative lights – line voltage 243 Decorative or landscape lighting – low
voltage 244 Sign Cord or plug 260 Unclassified cord or plug 261 Power cord or plug, detachable from
appliance 262 Power cord or plug- permanently attached 263 Extension cord Torch, burner or soldering iron 331 Welding torch 332 Cutting torch 333 Burner, including Bunsen burners 334 Soldering equipment Portable cooking or warming equipment
631 Coffee maker or teapot
632 Food warmer or hot plate 633 Kettle 634 Popcorn popper 635 Pressure cooker or canner 636 Slow cooker 637 Toaster, toaster oven, counter-top broiler 638 Waffle iron, griddle 639 Wok, frying pan, skillet 641 Breadmaking machine The equipment involved in ignition was undetermined, not reported, or coded as no equipment with a heat source code outside the range of 40-99 (non-equipment related heat sources) in 77% of the non-confined fires, 83% of the associated deaths, 70% of the injuries, 78% of the direct property damage, and in 94% of confined cooking equipment fires. Area of Origin. Two areas of origin: bedroom for more than five people (code 21) and bedroom for less than five people (code 22) are combined and shown as simply “bedroom.” Chimney is no longer a valid area of origin code for non-confined fires. The area of origin was unknown or not reported in 12% of non-confined home structure fires, 20% of associated deaths, 6% of associated injuries, and 19% of the direct property damage. It was also unknown in 85% of confined fires excluding those confined to the chimney or flue which were all assumed to have begun in the chimney or flue. Item First Ignited. In most analyses, mattress and pillows (item first ignited 31) and bedding, blankets, sheets, and comforters (item first ignited 32) are combined and shown as “mattresses and bedding.” In many analyses, wearing apparel not on a person (code 34) and wearing apparel on a person (code 35) are combined and shown as “clothing.” In some analyses, flammable and combustible liquids and gases, piping and filters (item first ignited 60-69) are combined and
U.S. Home Structure Fires, 4/13 124 NFPA Fire Analysis and Research Division, Quincy, MA
shown together. The item first ignited was undetermined or unreported in 34% of the non-confined structure fires, 57% of the associated deaths, 31% of the associated injuries, 49% of the direct property damage, and in 84% of the confined home fires. Extent of Fire Spread. All structure fires with incident types indicating a confined fire were shown separately and are assumed to be confined to the object of origin. Fires that spread beyond the room of origin were calculated by summing fires with damage: a) confined to the floor of origin (code 3), b) confined to the building of origin (code 4), and c) extending beyond building of origin (code 5). The extent of fire spread was unknown or not reported in 5% of non-confined home structure fires, 2% of associated deaths, 1% of associated injuries, and 2% of the direct property damage. Item Contributing Most to Flame Spread. The query was restricted to non-confined fires with fire spread extending beyond the room of origin. Rules for item first ignited apply. This is an optional field. Fire departments are also instructed to use a check box if there was no flame spread, if the item contributing to flame spread was the item first ignited, or if the item contributing most to flame spread could not be identified. The item contributing most to flame spread was undetermined or unreported in 72% of the non-confined structure fires that extended beyond the room of origin, 72% of the associated deaths, 61% of the associated injuries, and 66% of the direct property damage. Structure Status. Properties should be considered occupied and operating when it is customarily in use even if no one is present at the time the fire occurs. Two codes, vacant and secured (code 5) and vacant and unsecured (code 6) were summed to identify fires in vacant buildings. For non-confined home structure fires, structure status was known in 94% of the fires, 97% of the civilian deaths, 98% of civilian injuries, and 96% of the direct property damage. For confined fires, structure status was known in 6% of the fires. Rounding and percentages. The data shown are estimates and generally rounded. An entry of zero may be a true zero or it may mean that the value rounds to zero. Percentages are calculated from unrounded values. It is quite possible to have a percentage entry of up to 100% even if the rounded number entry is zero. The same rounded value may account for a slightly different percentage share. Because percentages are expressed in integers and not carried out to several decimal places, percentages that appear identical may be associated with slightly different values. In this analysis, when estimates were derived solely from the NFPA survey, fires were rounded to the nearest 500, civilian deaths were rounded to the nearest five, civilian injuries were rounded to the nearest 25, and direct property damage was rounded to the nearest million dollars. For estimates derived from NFIRS and the NFPA survey, fires were rounded to the nearest hundred, civilian deaths and injuries were rounded to the nearest ten, and direct property damage was rounded to the nearest million dollars. Inflation. Property damage estimates are not adjusted for inflation unless so indicated. In this analysis, inflation adjusted damage estimates are provided in Table 1, 1A and 1B.
U.S. Home Structure Fires, 4/13 125 NFPA Fire Analysis and Research Division, Quincy, MA
Appendix B. Methodology and Definitions Used in “Leading Cause” Tables The cause table reflects relevant causal factors that accounted for at least 2% of the fires in a given occupancy. Only those causes that seemed to describe a scenario are included. Because the causal factors are taken from different fields, some double counting is possible. Percentages are calculated against the total number of structure fires, including both confined and non-confined fires. Bear in mind that every fire has at least three “causes” in the sense that it could have been prevented by changing behavior, heat source, or ignitability of first fuel, the last an aspect not reflected in any of the major cause categories. For example, several of the cause categories in this system refer to types of equipment (cooking, heating, electrical distribution and lighting, clothes dryers and washers, torches). However, the problem may be not with the equipment but with the way it is used. The details in national estimates are derived from the U.S. Fire Administration’s National Fire Incident Reporting System (NFIRS). This methodology is based on the coding system used in Version 5.0 of NFIRS. The NFIRS 5.0 Reference Guide, containing all of the codes, can be downloaded from http://www.nfirs.fema.gov/documentation/reference/. Cooking equipment and heating equipment are calculated by summing fires identified by equipment involved in ignition and relevant confined fires. Confined fires will be shown if they account for at least 2% of the incidents. Confined cooking fires (cooking fires involving the contents of a cooking vessel without fire extension beyond the vessel) are identified by NFIRS incident type 113. Confined heating equipment fires include confined chimney or flue fires (incident type 114) and confined fuel burner or boiler fires (incident type 116). The latter includes delayed ignitions and incidents where flames caused no damage outside the fire box. The two types of confined heating fires may be combined or listed separately, depending on the numbers involved. Intentional fires are identified by fires with a “1” (intentional) in the field “cause.” The estimate includes a proportional share of fires in which the cause was undetermined after investigation, under investigation, or not reported. All fires with intentional causes are included in this category regardless of the age of the person involved. Earlier versions of NFIRS included ignition factor codes for incendiary and suspicious. Intentional fires were deliberately set; they may or may not be incendiary in a legal sense. No age restriction is applied. Fires caused by playing with heat source (typically matches or lighters) are identified by code 19 in the field “factor contributing to ignition.” Fires in which the factor contribution to ignition was undetermined (UU), entered as none (NN) or left blank are considered unknown and allocated proportionally. Because factor contributing to ignition is not required for intentional fires, the unknown share, by these definitions, is somewhat larger than it should be. The heat source field is used to identify fires started by: smoking materials (cigarette, code 61; pipe or cigar, code 62; and heat from undetermined smoking material, code 63); candles (code 66), lightning (code 73); and spontaneous combustion or chemical reaction (code 72). Fires started by heat from unclassified open flame or smoking materials (code 60) are allocated proportionally among the “other open flame or smoking material” codes (codes 61-69) in an allocation of partial unknown data. This includes smoking materials and candles. This approach
U.S. Home Structure Fires, 4/13 126 NFPA Fire Analysis and Research Division, Quincy, MA
results in any true unclassified smoking or open flame heat sources such as incense being inappropriately allocated. However, in many fires, this code was used as an unknown. The equipment involved in ignition field is used to find several cause categories. This category includes equipment that functioned properly and equipment that malfunctioned.
Cooking equipment Non-confined fire refers to equipment used to cook, heat or warm food (codes 620-649 and 654). Fire in which ranges, ovens or microwave ovens, food warming appliances, fixed or portable cooking appliances, deep fat fryers, open fired charcoal or gas grills, grease hoods or ducts, or other cooking appliances) were involved in the ignition are said to be caused by cooking equipment. Food preparation devices that do not involve heating, such as can openers or food processors, are not included here. As noted in Appendix A, a proportional share of unclassified kitchen and cooking equipment (code 600) is included here. Heating equipment Non-confined fire (codes 120-199) includes central heat, portable and fixed heaters (including wood stoves), fireplaces, chimneys, hot water heaters, and heat transfer equipment such as hot air ducts or hot water pipes. Heat pumps are not included. As noted in Appendix A, a proportional share of unclassified heating, ventilation and air condition equipment (code 100) is included here. Electrical distribution and lighting equipment (codes 200-299) include: fixed wiring; transformers; associated overcurrent or disconnect equipment such as fuses or circuit breakers; meters; meter boxes; power switch gear; switches, receptacles and outlets; light fixtures, lamps, bulbs or lighting; signs; cords and plugs; generators, transformers, inverters, batteries and battery charges. Torch, burner or soldering iron (codes 331-334) includes welding torches, cutting torches, Bunsen burners, plumber furnaces, blowtorches, and soldering equipment. As noted in Appendix A, a proportional share of shop tools and industrial equipment (code 300) is included here. Clothes dryer or washer (codes 811, 813 and 814) includes clothes dryers alone, washer and dryer combinations within one frame, and washing machines for clothes. As noted in Appendix A, a proportional share of unclassified personal and household equipment (code 800) is included here. Electronic, office or entertainment equipment (codes 700-799) includes: computers and related equipment; calculators and adding machines; telephones or answering machines; copiers; fax machines; paper shredders; typewriters; postage meters; other office equipment; musical instruments; stereo systems and/or components; televisions and cable TV converter boxes,, cameras, excluding professional television studio cameras, video equipment and other electronic equipment. Older versions of NFIRS had a code for electronic equipment that included radar, X-rays, computers, telephones, and transmitter equipment. Shop tools and industrial equipment excluding torches, burners or soldering irons (codes 300-330, 335-399) includes power tools; painting equipment; compressors; atomizing equipment; pumps; wet/dry vacuums; hoists, lifts or cranes; powered jacking equipment; water or gas drilling equipment; unclassified hydraulic equipment; heat-treating equipment; incinerators, industrial furnaces, ovens or kilns; pumps; compressors; internal combustion
U.S. Home Structure Fires, 4/13 127 NFPA Fire Analysis and Research Division, Quincy, MA
engines; conveyors; printing presses; casting, molding; or forging equipment; heat treating equipment; tar kettles; working or shaping machines; coating machines; chemical process equipment; waste recovery equipment; power transfer equipment; power takeoff; powered valves; bearings or brakes; picking, carding or weaving machines; testing equipment; gas regulators; separate motors; non-vehicular internal combustion engines; and unclassified shop tools and industrial equipment. As noted in Appendix A, a proportional share of shop tools and industrial equipment (code 300) is included here. Medical equipment (codes 410-419) includes: dental, medical or other powered bed, chair or wheelchair; dental equipment; dialysis equipment; medical monitoring and imaging equipment; oxygen administration equipment; radiological equipment; medical sterilizers, therapeutic equipment and unclassified medical equipment. As noted in Appendix A, a proportional share of commercial and medical equipment (code 400) is included here.
Mobile property (vehicle) describes fires in which some type of mobile property was involved in ignition, regardless of whether the mobile property itself burned (mobile property involved codes 2 and 3). Exposures are fires that are caused by the spread of or from another fire. These were identified by factor contributing to ignition code 71. This code is automatically applied when the exposure number is greater than zero.