Home range size and movement patterns of female...
20
Department of Ecology Grimsö Wildlife Research Station Home range size and movement patterns of female lynx (Lynx lynx) during the yearly survey period in reindeer husbandry area Johanna Andreasson Master’s thesis Grimsö 2015 Independent project/Degree project / SLU, Department of Ecology 2015:1
Transcript of Home range size and movement patterns of female...
Department of Ecology Grimsö Wildlife Research Station
Home range size and movement patterns of female lynx (Lynx lynx) during the yearly survey period in reindeer husbandry area
Johanna Andreasson
Master’s thesis Grimsö 2015 Independent project/Degree project / SLU, Department of Ecology 2015:1

2
Home range size and movement patterns of female lynx (Lynx lynx) during the yearly survey period in reindeer husbandry area
Johanna Andreasson
Supervisor: Jenny Mattisson, SLU, Department of Ecology, Grimsö and NINA, Trondheim, Norway
Assistant supervisor: Henrik Andrén, SLU, Department of Ecology, Grimsö Examiner: Camilla Wikenros, SLU, Department of Ecology, Grimsö
Credits: 30 HEC Level: A1E Course title: Independent project in Biology Course code: EX0319 Place of publication: Grimsö Year of publication: 2015 Title of series: Independent project/Degree project / SLU, Department of Ecology Part no: 2015:1 Online publication: http://stud.epsilon.slu.se Keywords: Lynx, movement pattern, home range size, survey methods
Sveriges lantbruksuniversitet Swedish University of Agricultural Sciences
Faculty of Natural Resources and Agricultural Sciences
Department of Ecology
Grimsö Wildlife Research Station

3
Abstract To estimate the number of lynx (Lynx lynx) within the reindeer husbandry area, an annual survey takes place between 10 January – 28/29 February every year. To distinguish between family groups in the survey, a distance criteria of 25 km is used. Depending on lynx movement pattern, i.e. the distance a lynx travels during a certain period, the distance criteria may over- or underestimate the lynx population size and therefore influence the outcome of the survey. The survey overlaps with the start of the lynx mating season, thus there is a possibility that the mating season has an affect on lynx home range size and movement pattern, with risks of affecting the annual survey. Habitat may also affect the movement pattern of lynx, since it may differ in aspects such as prey abundance and thereby possibly affect home range size. The aim of this study was to identify if mating season or type of habitat may impact lynx spatial pattern, and whether the distance criteria are a reliable method to use in the survey. The data used in this study was collected from 20 female lynx fitted with GPS-collars within the reindeer husbandry area in Sweden. Home range sizes during the survey period varied greatly between individuals (105-1521 km2, average 486 km2). There was no significant difference in weekly home range size or in movement pattern within the study period. These results indicate that female lynx do not change their spatial pattern during the survey period. There was no significant correlation between habitat and lynx home range size or movement pattern. Cumulative home ranges were compared with the distance criteria. After 7 weeks, the average cumulative home range was larger than the distance criteria. When the maximum length of the cumulative home ranges was compared with the distance criteria, the distance criteria were exceeded after 4 weeks. Within a survey period of 7 weeks, 69 % of the lynx had moved over larger distances than 25 km. These results show that the distance criteria need to be reevaluated.

4
Introduction In the early 1800s, the Eurasian lynx (Lynx lynx) was widespread over Sweden except in the northern parts of the country. Due to hunting, numbers rapidly declined, and by the time the state bounties were removed in 1912, there were only a couple of hundred individuals left. Lynx were protected in 1927 and in 1943 hunting was allowed once again. In the 1980s the lynx population was estimated to about 200-700 individuals (Jonsson 1983, Liberg 1998). The low abundance was probably caused by hunting as well as the outbreak of sarcoptic mange (Sarcoptes scabiei var. canis) in red foxes (Vulpes vulpes), which also came to infect the lynx population. Therefore, lynx were protected again in the southern parts of Sweden in 1986 and in 1991 in the entire country (Liberg 1998). Historically, lynx were hunted for their fur, but today hunting has increased mainly due to competition with human interest of land use, such as sheep- and reindeer (Rangifer tarandus) herding, as well as competition with prey, such as roe deer (Capreolus capreolus) hunting by humans (Jonsson 1983, Breitenmoser 1998, Linnell et al. 2001, Pedersen et al. 1999). During the last two decades lynx have increased in numbers and expanded into new areas (Jonsson 1983, Liberg 1998, SOU 2007:89, Andrén et al. 2010). In the middle of the 1900s, the lynx population started to expand to the northern parts of Sweden. While prey abundance was low in the rest of the country, the north held a large semi-domestic reindeer population, which served well as prey for lynx (Jonsson 1983). The reindeer husbandry area covers approximately 50 % of Sweden and is located in the central and northern parts of the country. Today, this area holds a large population of lynx, which has the reindeer as their main prey (Pedersen et al. 1999, Mattisson et al. 2011). The indigenous Sami people are practicing an old tradition of reindeer herding. The reindeers are free-ranging over large areas and are therefore vulnerable to predation. Every year, reindeer owners experience losses due to the presence of lynx, which causes great economic costs for the reindeer industry and raises a controversial conflict between reindeer herding and carnivore conservation (Prop. 2000/01:57, SOU 2007:89, Pedersen et al. 1999, Linnell et al. 2001, Hobbs et al. 2012). In 2010 the cost of compensation of reindeer losses due to lynx depredation was approximately US$ 3.4 million (Swedish Environmental Protection Agency). The lynx population in Sweden peaked in year 2000 with about 2000 individuals or 340 family groups i.e. adult females with dependent kittens. The population has since then decreased to 191 family groups in 2013 (Liberg and Andrén 2006, Andrén et al. 2010, Report Wildlife Damage Centre 2012/13). In year 2012, the Swedish government decided that the sustainable and viable number of lynx in Sweden would be to have a lynx population of at least 130-180 family groups, equivalent to 700-1 000 individuals (Prop 2012/13:191). To decrease lynx impact on the semi-domestic reindeer industry, the number of lynx within the reindeer husbandry area was reduced from 173 family groups in 1999 to 81 family groups in 2012-2013, by government controlled harvesting (Report Wildlife Damage Centre 2012/13, Liberg and Andrén 2006, Andrén et al. 2010). The numbers of lynx and their distribution within the reindeer husbandry area is controlled by hunting (Liberg and Andrén 2006, Prop. 2000/01:57) and the number of lynx to be harvested is set by the government with an annual quota (Linnell et al. 2001). To reduce the conflict between carnivore conservation and reindeer husbandry, the reindeer herding districts are compensated for their losses by the government (Prop. 2000/01:57, SOU 2007:89). For each lynx family group within a reindeer herding district, the compensation in 2007 was 200 000 SEK (SOU 2007:89).

5
Every year, a lynx survey of family groups takes place in Sweden. The survey takes place during the winter months and is based on snow tracking (NFS 2007:10). The aim of the survey is to estimate the number of family groups and lynx presence in time and space (NFS 2007:10). On the basis of the number of family groups, an estimation of the total population can be calculated. A family group is equivalent to about six individuals (Andrén et al. 2002). The number of family groups is especially important to establish within the reindeer husbandry area, as the reindeer owners are compensated for reindeer losses based on the number of reproductions of lynx i.e. the results of the survey serve as a basis in decisions about economic compensation. The survey also serves as a basis for decisions about hunting quotas. Thus, it is important that the survey counts are not over- or underestimated, but give a reliable estimate of the lynx population size and trends (NFS 2007:10, Andrén et al. 2002). To estimate the number of family groups in an area, different techniques are used. Some methods used are backtracking, observations and DNA analysis (from feces). In backtracking, the tracks are followed for at least 3 kilometers, to establish how many lynx have been walking there, and if the tracks belong to one or several family groups. If there are problems in distinguishing the number of family groups within a certain area, a distance criteria are used to separate different family groups from each other. If tracks and observations are within a distance of 25 kilometers within the survey period, they are assumed to belong to the same family group until proven otherwise (NFS 2007:10). The length of the main survey period changed in 2005. The earlier survey period was 5 weeks, and ranged between 10 January and 14 February (NFS 2002:15). In 2005, the survey period increased by two weeks, and now ranges from 10 January until 28/29 February (NFS 2004:17). It was prolonged due to time limitations in northern Sweden, where limited daylight during the weeks of survey did not allow for enough time to complete the survey (Ersson, L., county board, Norrbotten, personal communication). A problem that arises due to the prolonged survey is that lynx mating season usually starts towards the end of February or in March. This may cause confusion; two tracks following each other can be a single female lynx and a male lynx walking together, but will during the survey be counted as a family group (The Swedish lynx project, unpublished data). Due to the beginning of the mating season, lynx females are believed to move greater distances compared to earlier in the survey period. This can cause problems when using the distance criteria, which may then be undersized and as a result lynx population may be overestimated. In 2003, a cooperation between the Swedish Environmental Protection Agency, the county board administrations within the reindeer husbandry area (Norrbotten, Västerbotten and Jämtland) and The Swedish lynx project (Grimsö Wildlife Research Station) begun. Several female lynx with kittens were fitted with GPS collars to evaluate the survey methods. Female lynx were surveyed as usual, and the results were later compared with GPS data to see whether the results were the same, which it was in most cases. Lynx movement pattern and home range sizes have also been studied from this data (Andrén 2005, Mattisson and Andrén 2008). Further information about lynx home ranges as well as their movement pattern during the survey period has been requested by the county boards within the reindeer husbandry area. Since the survey period was increased with two weeks, it has been questioned whether female lynx move over larger areas during the end of the survey period, due to the beginning of the mating season. If that would be the case, the survey may be affected and also the results based on it. Another subject that has been discussed is whether habitat composition affects lynx movement pattern and home range sizes. Until recently, most research about lynx spatial pattern within the reindeer husbandry area has been focused on lynx living in areas above the

6
tree line (Pedersen et al. 1999, Linnell et al. 2001, Andrén et al. 2002, Linnell et al. 2007a). More information about lynx living in forestry areas is required to cover possible variation of lynx within the entire reindeer husbandry area. The aim of this study was to analyse home range size and movement patterns of female lynx with kittens during the survey period, 10 January – 28/29 February, as well as the first two weeks of March, to increase the knowledge of their spatial pattern during this period. The study also aims to identify whether female lynx move over larger areas towards the end of the survey period, and if habitat may affect their movement pattern or home range sizes. This knowledge will help improving the survey as well as evaluating its duration.
7
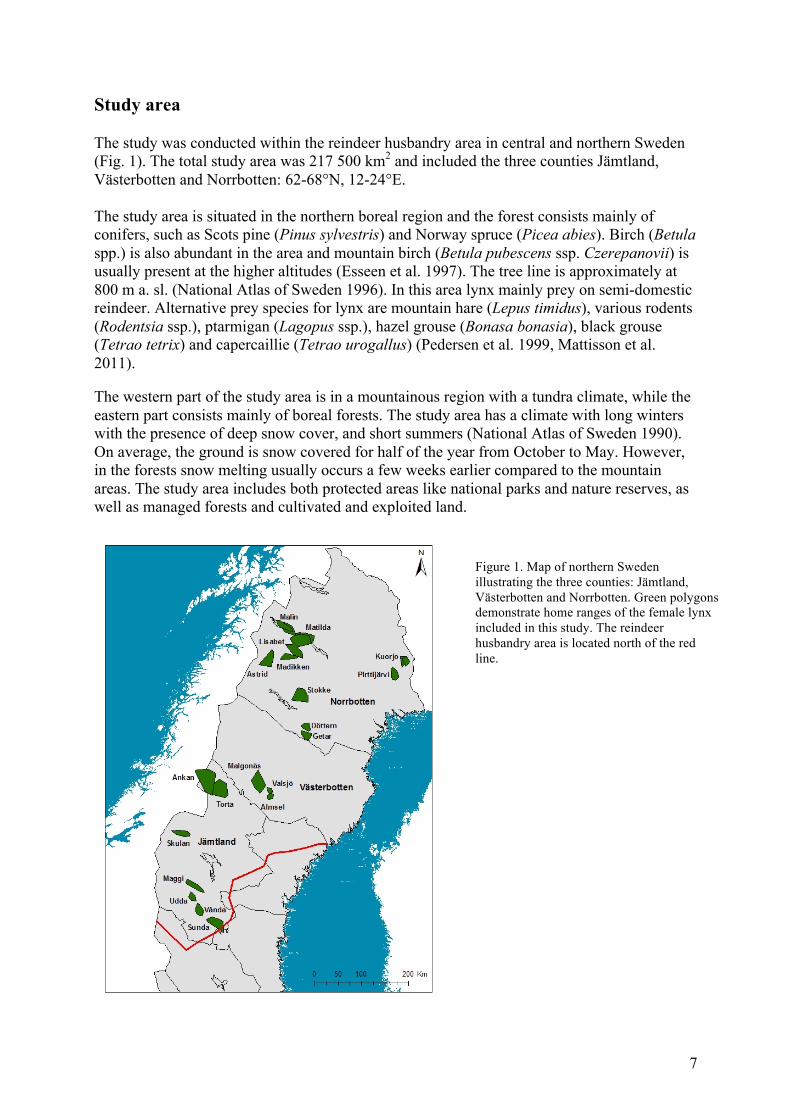
Study area The study was conducted within the reindeer husbandry area in central and northern Sweden (Fig. 1). The total study area was 217 500 km2 and included the three counties Jämtland, Västerbotten and Norrbotten: 62-68°N, 12-24°E. The study area is situated in the northern boreal region and the forest consists mainly of conifers, such as Scots pine (Pinus sylvestris) and Norway spruce (Picea abies). Birch (Betula spp.) is also abundant in the area and mountain birch (Betula pubescens ssp. Czerepanovii) is usually present at the higher altitudes (Esseen et al. 1997). The tree line is approximately at 800 m a. sl. (National Atlas of Sweden 1996). In this area lynx mainly prey on semi-domestic reindeer. Alternative prey species for lynx are mountain hare (Lepus timidus), various rodents (Rodentsia ssp.), ptarmigan (Lagopus ssp.), hazel grouse (Bonasa bonasia), black grouse (Tetrao tetrix) and capercaillie (Tetrao urogallus) (Pedersen et al. 1999, Mattisson et al. 2011). The western part of the study area is in a mountainous region with a tundra climate, while the eastern part consists mainly of boreal forests. The study area has a climate with long winters with the presence of deep snow cover, and short summers (National Atlas of Sweden 1990). On average, the ground is snow covered for half of the year from October to May. However, in the forests snow melting usually occurs a few weeks earlier compared to the mountain areas. The study area includes both protected areas like national parks and nature reserves, as well as managed forests and cultivated and exploited land.
Figure 1. Map of northern Sweden illustrating the three counties: Jämtland, Västerbotten and Norrbotten. Green polygons demonstrate home ranges of the female lynx included in this study. The reindeer husbandry area is located north of the red line.
8
Methods Capturing of female lynx and data transfer Female lynx were captured and immobilized during the winter months, by darting from helicopter or ground. A standardized dose of a chemical immobilization drug was used to immobilize the animals and while the animals were under anaesthesia, their body temperature was monitored by measuring their rectal temperature (Arnemo et al. 2007). Each lynx was fitted with a GPS radio collar (Televilt Posrec© 300). The GPS collar was programmed to obtain a location at intervals of three hours (03:00, 06:00, 09:00, 12:00, 15:00, 18:00, 21:00 and 24:00). All lynx had a microchip set in at the base of the right ear and five of the lynx in Norrbotten County also had an implant transmitter (Telonics Imp- 400 L). All lynx were weighed and measured and samples of blood, hair, feces and tissue were collected. After collar fitting and collecting of samples, the animals were injected with a reversal of the immobilization drug and released. Approval for captures was required from the animal ethical committee and the Swedish environmental protection agency. Data from GPS collared female lynx with kittens was collected between 2003 and 2007 within the study area. In Jämtland, seven female lynx were captured and fitted with GPS collars during 2004-2005, in Västerbotten, three lynx were collared during 2006, and in Norrbotten ten lynx were collared during 2003-2007. Three of the twenty lynx were recaptured and recollared the following year. Once the batteries were out of power, the GPS collar automatically released from the animals with a release mechanism. However, in some cases this mechanism did not function properly and the collars had to be collected by immobilizing the animal again, and manually take the collar off. Data was then collected and downloaded into a computer. Home range size Home range sizes of lynx were calculated using 100 % Minimum Convex Polygon (MCP) in the Animal Movement Extension in ArcGIS 9.1 (ESRI, Inc., Redlands, California). For each animal a total home range area was calculated for the period 10 January – 28 February, i.e. the survey period. In cases when a lynx was captured and collared after 10 January, the home range area was calculated from the first location obtained to 28 February. Weekly home ranges for each animal were also calculated starting from 11 January and ending 14 March (13 March in 2004, due to leap year). In total, 9 weeks were analysed. To have exact 7 days per week, 10 January was excluded from the analysis. In those cases where lynx were captured and collared later than 11 January, the first total week, i.e. when locations were obtained for all 7 days during that week, started to count for the weekly home range sizes. To have comparable data in the statistical analysis, no incomplete weeks were used. Cumulative home ranges were calculated between 11 January and 13/14 March. This started with week 1 (period 1), then week 1 – 2 (period 2), week 1 – 3 (period 3), continuing until week 1 – 9 (period 9). As mentioned above, if a lynx was captured and collared later than 11
January, the first total week started to count. From the cumulative home range sizes, the increase for every period was calculated for each individual.

9
The difference between weekly and cumulative home ranges is that weekly home ranges differ between weeks and get larger or smaller (Fig. 2a), while cumulative home ranges add new GPS locations to the existing ones for each period and can therefore never decrease (Fig. 2b). (a) (b) Figure 2. Illustrations of the methods used to estimate the total home range size (total HR) and weekly home ranges (a) and cumualtive home ranges (b), starting at period 3 until period 7 (week 3 until week 7), for a female lynx. The longest distance across the home range polygon was measured using the measure tool in ArcGIS 9.1 for every weekly cumulative home range. This distance across the home range was compared with the distance criteria used for separating different family groups during the annual survey period. Movement pattern ArcGIS 9.1 was used to calculate the distances between locations. The GPS collars were programmed to obtain a location every third hour for each animal. In those cases when locations were not obtained every third hour, the estimated distances between those locations were excluded from the analysis. Thus, only three hour intervals were used in the analyses of movement patterns, if not removed, the movement pattern would be influenced if some distances were based on two locations with e.g a six hour difference. The distances between locations analysis were divided into 9 weeks, ranging from 11 January – 13/14 March, same as for the analysis of weekly home range sizes. Habitat composition The habitat composition (forest, open land, lakes and rivers, wetlands and area above the tree line) within the total home ranges was estimated using a habitat map (Lantmäteriverket 2001. GSD – Översiktskartan) and ArcGIS 9.1. The habitat composition was used to analyse possible relationships between habitat composition and home range size, as well as movement patterns within the home range area.

10
Data analysis SPSS 14.0 (SPSS, Inc., Chicago, Illinois) was used to perform most of the statistical analysis. Home range data, movement patterns and habitat composition were analysed using General Linear Model (GLM). Week number and time of day were fixed factors, whereas the individual lynx year, i.e the GPS period, was a random factor. The total home range size in relation to the habitat composition (percentage of forest and area above the tree line) within the home ranges was compared using regression analysis in StatView 5.0.1 (SAS Institute, Eurodex Sales AB, Stockholm, Sweden).
11
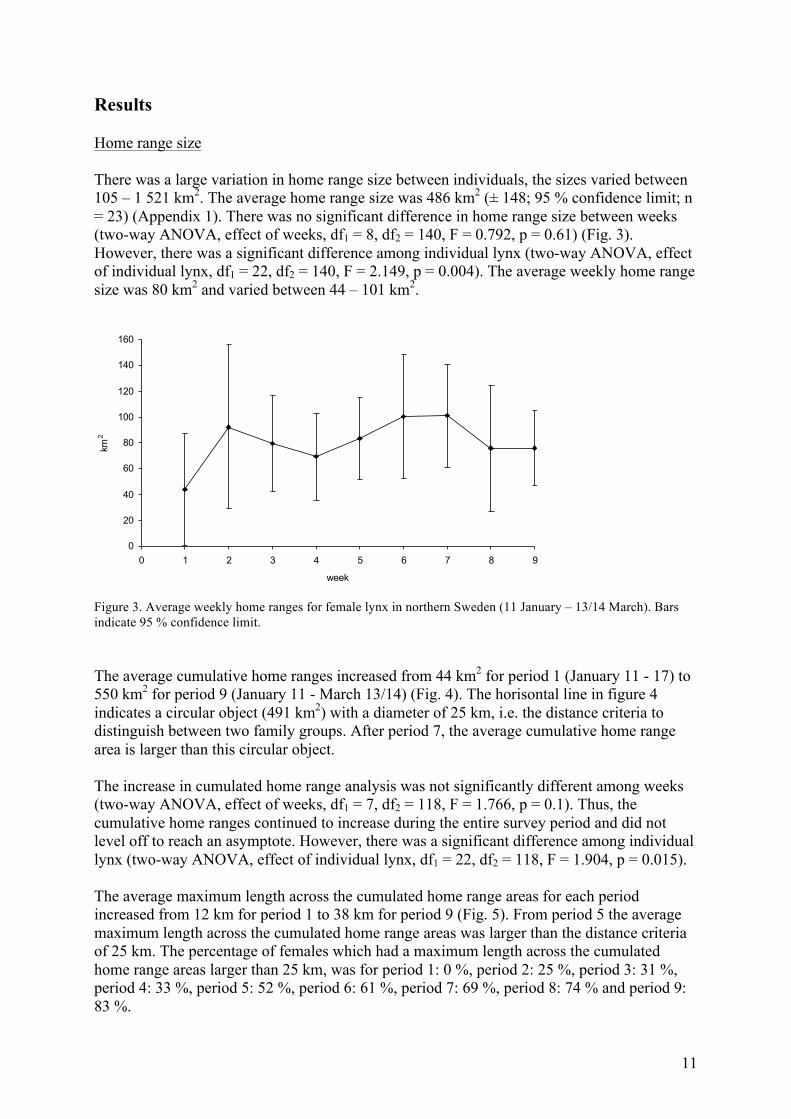
Results Home range size There was a large variation in home range size between individuals, the sizes varied between 105 – 1 521 km2. The average home range size was 486 km2 (± 148; 95 % confidence limit; n = 23) (Appendix 1). There was no significant difference in home range size between weeks (two-way ANOVA, effect of weeks, df1 = 8, df2 = 140, F = 0.792, p = 0.61) (Fig. 3). However, there was a significant difference among individual lynx (two-way ANOVA, effect of individual lynx, df1 = 22, df2 = 140, F = 2.149, p = 0.004). The average weekly home range size was 80 km2 and varied between 44 – 101 km2.
Figure 3. Average weekly home ranges for female lynx in northern Sweden (11 January – 13/14 March). Bars indicate 95 % confidence limit. The average cumulative home ranges increased from 44 km2 for period 1 (January 11 - 17) to 550 km2 for period 9 (January 11 - March 13/14) (Fig. 4). The horisontal line in figure 4 indicates a circular object (491 km2) with a diameter of 25 km, i.e. the distance criteria to distinguish between two family groups. After period 7, the average cumulative home range area is larger than this circular object. The increase in cumulated home range analysis was not significantly different among weeks (two-way ANOVA, effect of weeks, df1 = 7, df2 = 118, F = 1.766, p = 0.1). Thus, the cumulative home ranges continued to increase during the entire survey period and did not level off to reach an asymptote. However, there was a significant difference among individual lynx (two-way ANOVA, effect of individual lynx, df1 = 22, df2 = 118, F = 1.904, p = 0.015). The average maximum length across the cumulated home range areas for each period increased from 12 km for period 1 to 38 km for period 9 (Fig. 5). From period 5 the average maximum length across the cumulated home range areas was larger than the distance criteria of 25 km. The percentage of females which had a maximum length across the cumulated home range areas larger than 25 km, was for period 1: 0 %, period 2: 25 %, period 3: 31 %, period 4: 33 %, period 5: 52 %, period 6: 61 %, period 7: 69 %, period 8: 74 % and period 9: 83 %.
0
20
40
60
80
100
120
140
160
0 1 2 3 4 5 6 7 8 9
week
km 2

12
0
100
200
300
400
500
600
700
800
0 1 2 3 4 5 6 7 8 9
period
km 2
Figure 4. Average cumulated home ranges for female lynx in northern Sweden (11 January – 13/14 March). Horisontal line indicates the distance criteria as a circular object (491 km2) with a diameter of 25 km. Bars indicate 95 % confidence limit.
0
5
10
15
20
25
30
35
40
45
50
0 1 2 3 4 5 6 7 8 9
period
km
Figure 5. Average maximum length of the cumulated home ranges. Straight line indicates distance criteria (25 km). Bars indicate 95 % confidence limit.

13
Movement pattern The distance between two locations with 3 hours in between varied significantly depending on weeks (two-way ANOVA, effect of weeks, df1 = 8, df2 = 7431, F = 3.4, p = 0.001), time of day (two-way ANOVA, effect of time of day, df1 = 7, df2 = 7431, F = 63.4, p < 0.0001), and lynx individuals (two-way ANOVA, effect of individual lynx, df1 = 22, df2 = 7431, F = 3.9, p < 0.0001). It also varied significantly for home range sizes, meaning lynx with large home range sizes moved larger distances compared to lynx with small home range sizes (two-way ANOVA, effect of weeks and home range sizes, df1 = 1, df2 = 7431, F = 309, p < 0.0001). However, there was no significant change in the movement pattern depending on the time of day, as the weeks progressed (two-way ANOVA, interaction week * time of day, df1 = 56, df2 = 7431, F = 1.1, p = 0.2). Among the significant effects time of day explained the most (7 %), but 88 % of the variation in movement patterns could not be explained. The female lynx were most active during nights between 15.00 and 09.00, with highest activity between 18.00 and 24.00 (Fig. 6). The daily movement pattern did not change significantly from early January to mid-March.
0
200
400
600
800
1000
1200
1400
1600
0 3 6 9 12 15 18 21 24
hour of day
aver
age
dist
ance
(m)
.
w eek 1-3
w eek 4-6
w eek 7-9
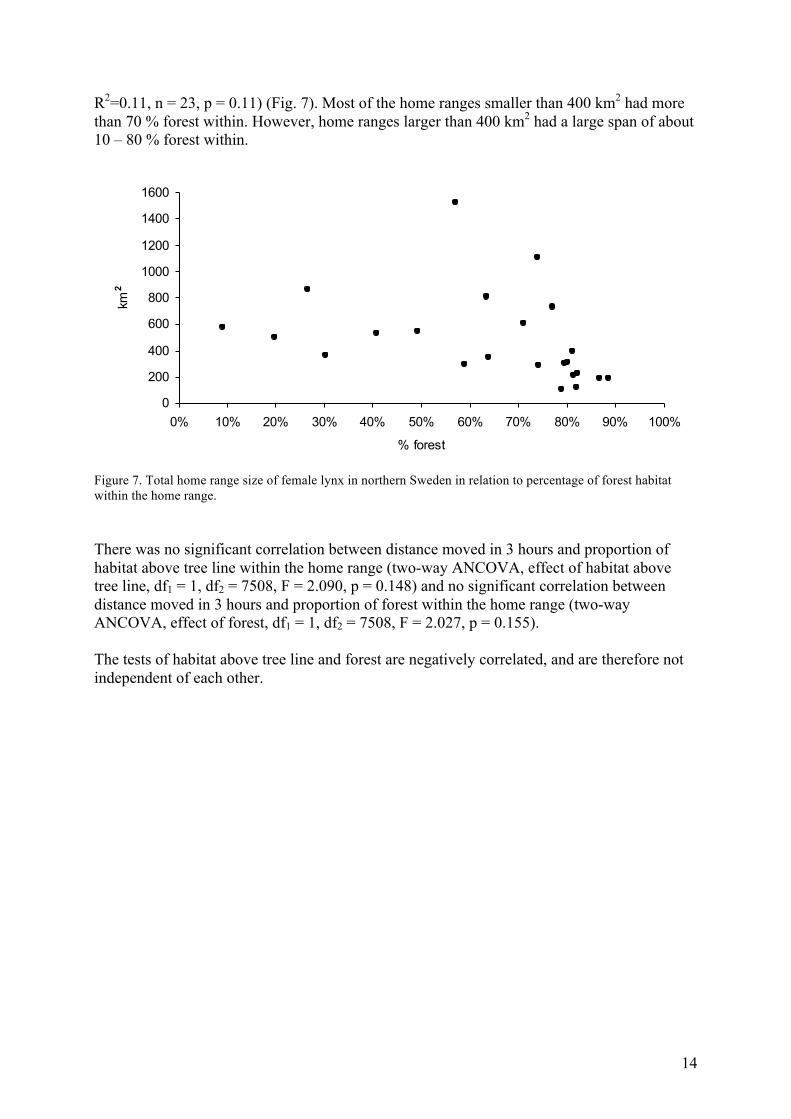
Figure 6. Movement pattern (distance travelled between two consecutive locations with 3 hours in between) of female lynx in northern Sweden during 3 periods of 3 weeks each. Bars indicate 95 % confidence limit. Habitat composition There was no significant correlation between total home range size and proportion of habitat above tree line within the home range (Linear regression, R2=0.12, n = 23, p = 0.11). However, the home range sizes that had less than 10 % of habitat composition above tree line, tended to have smaller home ranges (105 – 800 km2) than home ranges with more than 10 % above tree line (300 – 1 520 km2). Similarly, there was no significant correlation between total home range size and proportion of forest within the home range (Linear regression,
14
R2=0.11, n = 23, p = 0.11) (Fig. 7). Most of the home ranges smaller than 400 km2 had more than 70 % forest within. However, home ranges larger than 400 km2 had a large span of about 10 – 80 % forest within.
0
200
400
600
800
1000
1200
1400
1600
0% 10% 20% 30% 40% 50% 60% 70% 80% 90% 100%
% forest
km 2
Figure 7. Total home range size of female lynx in northern Sweden in relation to percentage of forest habitat within the home range. There was no significant correlation between distance moved in 3 hours and proportion of habitat above tree line within the home range (two-way ANCOVA, effect of habitat above tree line, df1 = 1, df2 = 7508, F = 2.090, p = 0.148) and no significant correlation between distance moved in 3 hours and proportion of forest within the home range (two-way ANCOVA, effect of forest, df1 = 1, df2 = 7508, F = 2.027, p = 0.155). The tests of habitat above tree line and forest are negatively correlated, and are therefore not independent of each other.
15
Discussion The estimated home range sizes varied greatly between individuals, the main reason for this may be prey abundance (Herfindal et al. 2005). Prey availability is an important factor influencing home range sizes and movement pattern: low prey abundance within the home range induces the lynx to move more frequently and over larger areas to find prey (Schmidt 2008). In a previous study, Mattisson and Andrén (2008), a female lynx was collared three years in a row and the results showed that her home range size varied greatly between years, even though she had not changed core area of use. Prey availability may differ between years, as well as between areas. This behaviour has also been noticed in Canadian lynx (Lynx canadensis), which often inhabit smaller home ranges during population peaks in the snowshoe hare (Lepus americanus) cycle (Slough and Mowat 1996). Another factor that may influence home range size estimations is the varying amount of data for different lynx individuals. Some lynx were fitted with GPS collars about 1-4 weeks later than others, and a larger amount of data influence estimated home range size and spatial movements increase (Burdett et al. 2007, Andrén et al. 2005, Merrill and Mech 2003). The choice of method can also affect the outcome of estimated home range sizes (Burdett et al. 2007). In this study 100 % Minimum Convex Polygon (MCP) was used, which is sensitive to temporary outliers. A few GPS locations can make the home range several square kilometers larger, as noticed in figure 2a, compared to for example the kernel estimators, which identifies the core area of the home range. While the kernel test may provide a more accurate home range considering the area of use of the animal, the MCP method was the most suited one for this study, since the maximum limits of the home range were of interest for comparison with the distance criteria. However, this method can affect the comparison of home range sizes between individuals, since some animals may be more prone of making temporary outliers. There was no significant difference between home range sizes of lynx living in boreal forests compared to lynx living above the tree line. There is a greater difference in home range size and movement pattern among individuals than among lynx living in different habitats, although there was a tendency that home ranges with a large percentage of forest were smaller. In the study of Mattisson and Andrén (2008), where data from the same GPS collared female lynx as in this study was used, but over a longer period (December – July), the median of home range sizes differed between habitats, lynx living in boreal forests tended to have smaller home ranges compared to lynx living in areas above the tree line. During autumn and early winter in the reindeer husbandry area, reindeer migrate to their winter ranges in the forested areas, which may result in a decrease of prey abundance, especially in areas above the tree line (Danell et al. 2006, Pedersen et al. 1999). Surviving on stray reindeer may force the lynx to increase their hunting frequency and home ranges in order to find sufficient amount of food. Weekly home range size of family groups in the reindeer husbandry area was relatively stable during the duration of the survey period and there was no trend in the analysis that home ranges were increasing or decreasing. The cumulated home ranges continued to increase over time and there was no indication for home range size to level off at some asymptote. However, the increase in home range size will slow down eventually, although during the nine weeks of this study, it did not reach that point. The daily movement pattern during the three different periods showed little variation, both daily and weekly. Female lynx were most active during nights, with the highest peak during 18.00-24.00, and least active during 09.00-15.00. Because of difference in daylight during the study period, one would expect a change in the diurnal rhythm, or an increased activity in the third period due to the mating season, but
16
this was not observed during these periods. These results shows that female lynx does not increase their home ranges or movement pattern in the beginning of the mating season, which is supported by a previous study of Canadian lynx, where the spatial movement of breeding females was resembling to the rest of the season (Burdett et al. 2007). While female lynx does not increase their spatial movements during mating season, male lynx usually does (Burdett et al. 2007), probably because females are more constrained to breeding and rearing kittens (Schmidt et al. 1999). The results indicate that the survey is not likely to be affected by the mating season. However, the increased number of weeks during the survey period may affect it. As time progress, home range sizes increase. Exactly when the survey takes place during the winter months seems to be less essential than the duration of it, particularly when considering the use of the distance criteria. However, there is an increasing risk of counting males and females walking together as a family group when survey overlaps with the mating season. When comparing the average cumulative home range analysis with the distance criteria, the distance criteria are acceptable up to seven weeks, i.e. the survey period. This is for the average lynx, which means there are lynx that have larger cumulative home ranges and in some cases the distance criteria will not be an accurate method to use when distinguishing between family groups. Also when considering the average maximum length of the cumulated periods, the distance criteria are inadequate already after the fourth period. Within the survey period of seven weeks, 69 % of the female lynx had moved over longer distances than the distance criteria. The distance criteria of 25 km were developed from data of estimated home range sizes of female lynx in northern Sweden when the VHF technique was used (Andrén 2005, Liberg and Andrén 2006). This technique gave fewer positions per animal; hence the estimated home ranges became smaller compared to more recent estimated home ranges where GPS technique has been used (Andrén 2005). The GPS technique used today gives much more information about the animal, compared to the VHF technique (Andrén 2005, Burdett et al. 2007, Merrill and Mech 2003). Because of the prolonged survey period and improved technique, the distance criteria need to be reevaluated to improve the estimation of number of family groups. This was recently done in a new study, where a distance criteria of 32 km were suggested for observations made during day 11-150 (Gervasi et al. 2013). For day 1-10, there would be a different distance criteria for each day, since the distances during these days are increasing before it reaches an asymptotic value after the tenth day. These distances are ranging from 13 km for the first day up to 30 km on the tenth day (Gervasi et al. 2013). In this study there was no significant difference between lynx living in different habitats, which mean the same distance criteria can be used within the entire reindeer husbandry area. However, there is a great variation between individuals and since the distance criteria are based on maximum distances it makes it prone to underestimation. Especially in high densities of lynx, the numbers of family groups are likely to be underestimated when using the distance criteria. When there are no neighbouring family groups, there is a success rate of 95 % when using the distance criteria, comparing to 70 % when there are two neighbouring family groups (Gervasi et al. 2013). However, the increase of the survey period has resulted in larger home range sizes, which increases the risk of overestimation of family groups in an area. As concluded above and accordingly to the results of this study, the distance criteria need to be changed into a higher value, since improved technique and a prolonged survey period has resulted in increased home range sizes. In the study of Gervasi et al. (2013) they recommend an increase in distance criteria from 25 km to 32 km and a different distance criteria for each of the first 10 days. This change would be an improvement compared to the distance criteria

17
of 25 km. However, as noted in this study, there is a great variation in home range sizes between lynx individuals and the fact that lynx movement pattern is irregular (Pedersen et al. 1999) causes problems when using a distance criteria. Since management of lynx, annual hunting quotas and economic compensation for reindeer losses are based on the number of family groups within an area, it is of great importance that the survey methods are correct and reliable. Therefore, the distance criteria should only be used under absolute exception as it is one of the main sources of error in the survey (Liberg and Andrén 2006). To distinguish between family groups, backtracking should always be a first option. Also, parameters like livestock depredation, age and sex structure of harvested lynx, structured snow-tracks surveys (transects used as an indicator of population trends), one-day censuses, camera traps and DNA-sampling could be used as complements to the survey (Gervasi et al. 2013, Linnell et al. 2007b). Acknowledgements I wish to thank my mentors Jenny Mattisson and Henrik Andrén, for all help and inputs they have given me with my thesis. I am also grateful to Kent Sköld from Grimsö Wildlife Research Station, Håkan Berglund, Christer Edsholm, Kjell Johansson and Per Wedholm from the county boards of Jämtland and Örebro, for giving me insight how the monitoring and survey techniques during the survey period of lynx operate. I also wish to thank Camilla Wikenros for the final comments on this report, Gustaf Samelius for helping me with ArcGIS and Sonny Kumar, Karin Axelsson and Ragnar Bergh for proof reading my report. And lastly to all my friends in “sunk-villan” for all laughs and support during the time of writing.

18
References Andrén H., Linell J.D.C., Liberg O., Ahlqvist P., Andersen R., Danell A., Franzén R., Kvam T., Odden J., and
Segerström P. (2002) Estimating total lynx Lynx lynx population size from censuses of family groups. Wildlife Biology 8: 299-306.
Andrén H. (2005) Lägesrapport 2005 – Utvärdering av avståndskriteriet vid lodjursinventering inom renskötselområdet. Report Grimsö Wildlife Research Station, Swedish University of Agricultural Sciences SLU. 15 pages.
Andrén H., Svensson L., Liberg O., Hensel H., Hobbs N.T., and Chapron G. (2010) Den svenska lodjurspopulationen 2009-2010 samt prognoser för 2011-2012. Report from Wildlife Damage Centre 2010-4, Grimsö Wildlife Research Station, SLU. 29 pages.
Arnemo J.M., Fahlman Å. (Editors), Ahlqvist P., Andersen R., Andrén H., Brunberg S., Landa A., Liberg O., Odden J., Persson J., Segerström P., and Swenson J.E. (2007) Biomedical Protocols for Free-ranging Brown Bears, Gray Wolves, Wolverines and Lynx. Norwegian School of Veterinary Science, Tromsö, Norway. 18 pages.
Breitenmoser U. (1998) Large predators in the Alps: the fall and rise of man´s competitors. Biological conservation 83: 279-289.
Burdett C.L., Moen R.A., Niemi G.J., and Mech L.D. (2007) Defining space use and movements of Canada Lynx with Global Positioning System Telemetry. Journal of Mammalogy 88: 457-467.
Danell A.C., Andrén H., Segerström P., and Franzén R. (2006) Space use by Eurasian lynx in relation to reindeer migration. Can. J. Zool. 84: 546-555.
Esseen P-A., Ehnström B., Ericson L., and Sjöberg K. (1997) Boreal forests. Ecological Bulletins 46: 16-47. Gervasi V., Odden J., Linnell J.D.C., Persson J., Andrén H., and Broseth H. (2013) Re-evaluation of distance
criteria for classification of lynx family groups in Scandinavia. NINA Report 965. 32 pages. Herfindal I., Linnell J.D.C., Odden J., Birkeland Nilsen E., and Andersen R. (2005) Prey density, environmental
productivity and home range size in the Eurasian lynx (Lynx lynx). Journal of Zoology 265: 63-71. Hobbs N.T, Andrén H., Persson J., Aronsson M., and Chapron G. (2012) Native predators reduce harvest of
reindeer by Sámi pastoralists. Ecological Applications 22 (5): 1640-1654. Jonsson S. (1983) Lodjur. Bokförlaget Natur och Kultur. 124 pages. Liberg O. (1998) Lodjuret – viltet, ekologin och människan. Svenska Jägarförbundet. Almqvist & Wiksell
Tryckeri. 95 pages. Liberg O., and Andrén H. (2006) The lynx population in Sweden 1994-2004. An evaluation of census data and
methods. Report Wildlife Damage Centre/Grimsö Wildlife Research Station, Swedish University of Agricultural Sciences SLU. 39 pages. ISBN 978-91-976324-0-9.
Linnell J.D.C., Andersen R., Andrén H., Liberg O., Odden J., and Moa P.F. (2001) Home range size and choice of management strategy for lynx in Scandinavia. Environmental Management Vol. 27, 6: 869-879.
Linnell J.D.C., Odden J., Andrén H., Liberg O., Andersen R., Moa P., Kwam T., Bröseth H., Segerström P., Ahlqvist P., Schmidt K., Jedrzejewski W., and Okarma H. (2007a) Distance rules for minimum counts of Eurasian lynx Lynx lynx family groups under different ecological conditions. Wildlife biology 13: 447-455.
Linnell J.D.C., Fiske P., Herfindal I., Odden J., Broseth H., and Andersen R. (2007b) An evaluation of structured snow-track surveys to monitor Eurasian lynx Lynx lynx populations. Wildlife Biology 13:456-466.
Mattisson J., and Andrén H. (2008) Förvaltningsmärkning av lodjur inom renskötselområdet – Lodjurens predation på ren, hemområden och aktivitetsmönster. Report Grimsö Wildlife Research Station, Swedish University of Agricultural Sciences SLU. 17 pages.
Mattisson J., Odden J., Nilsen E.B., Linnell J.D.C., Persson J., and Andrén H. (2011) Factors affecting Eurasian lynx kill rates on semi-domestic reindeer in northern Scandinavia: Can ecological research contribute to the development of a fair compensation system? Biological Conservation 144: 3009-3017.
Merrill S.B., and Mech L.D. (2003) The usefulness of GPS telemetry to study wolf circadian and social activity. Wildlife Society Bulletin 31 (4): 947-960.
National Atlas of Sweden (1990) Skogen. Bra böcker, Höganäs. National Atlas of Sweden (1996) Bra böcker, Höganäs. Naturvårdsverkets författningssamling (NFS 2002:15) Naturvårdsverkets föreskrifter och allmänna råd om
inventering samt bidrag och ersättning för rovdjursförekomst i samebyar. 20 pages. Naturvårdsverkets författningssamling (NFS 2004:17) Naturvårdsverkets föreskrifter och allmänna råd om
inventering samt bidrag och ersättning för rovdjursförekomst i samebyar. 29 pages. Naturvårdsverkets författningssamling (NFS 2007:10) Naturvårdsverkets föreskrifter och allmänna råd om
inventering av björn, varg, järv, lodjur och kungsörn. 26 pages. Pedersen V.A., Linell J.D.C., Andersen R., Andrén H., Lindén M., and Segerström P. (1999) Winter lynx Lynx
lynx predation on Semi-domestic reindeer Rangifer tarandus in Northern Sweden. Wildlife Biology 5: 203-211.

19
Regeringens proposition 2000/01:57. Sammanhållen rovdjurspolitik. Regeringens proposition 2012/13:191. En hållbar rovdjurspolitik. Rovdjuren och deras förvaltning. Betänkande av utredningen om de stora rovdjuren. Statens offentliga
utredningar. SOU 2007:89. 680 pages. Schmidt K. (1999) Variation in daily activity of the free-living Eurasian lynx (Lynx lynx) in Bialowieza Primeval
Forest, Poland. Journal of Zoology 249: 417-425. Schmidt K. (2008) Behavioural and spatial adaptation of the Eurasian lynx to a decline in prey availability. Acta
Theriologica 53: 1–16. Slough B.G., and Mowat G. (1996) Lynx population dynamics in an untrapped refugium. Journal of Wildlife
Management 60: 946-961. Wildlife Damage Centre (2006) Slutgiltiga resultat från inventeringar av lodjur i Sverige 2005/06. Report
Wildlife Damage Centre/Grimsö Wildlife Research Station. 12 pages. Wildlife Damage Centre (2013) Resultat från inventeringen av lodjur i Sverige vintern 2012/2013. Report
Wildlife Damage Centre/Grimsö Wildlife Research Station. 14 pages.

20
20
App
endi
x 1.
Year
Are
a Ly
nx
GPS
-per
iod
Hom
e ra
nge
size
(km
2 ) %
Abo
ve tr
ee li
ne
% F
ores
t %
Wet
land
%
Lak
es a
nd R
iver
s %
Ope
n la
nd
2003
N
orrb
otte
n
Mal
in*
31 J
an -
14 M
arch
36
7.3
26 %
30
%
0 %
43
%
0 %
2004
Jä
mtla
nd
Ank
an
10 J
an -
13 M
arch
1
520.
8 26
%
57 %
2
%
15 %
0
%
Jä
mtla
nd
Mag
gi
17 J
an -
13 M
arch
39
4.7
1 %
81
%
17 %
1
%
0 %
Jä
mtla
nd
Torta
16
Jan
- 13
Mar
ch
1 10
6.7
14 %
74
%
4 %
8
%
0 %
N
orrb
otte
n A
strid
09
Feb
- 13
Mar
ch
579.
4 83
%
9 %
0
%
8 %
0
%
N
orrb
otte
n M
atild
a*
10 J
an -
13 M
arch
86
1.2
60 %
26
%
2 %
10
%
1 %
N
orrb
otte
n Li
sabe
th
10 J
an -
13 M
arch
53
3.0
43 %
41
%
2 %
13
%
1 %
N
orrb
otte
n
Mal
in*
10 J
an -
13 M
arch
50
5.6
54 %
20
%
0 %
25
%
1 %
2005
Jä
mtla
nd
Sku
lan
13 J
an -
14 M
arch
34
7.7
4 %
64
%
5 %
26
%
2 %
Jä
mtla
nd
Sun
da
10 J
an -
14 M
arch
61
0.8
0 %
71
%
19 %
7
%
3 %
Jä
mtla
nd
Udd
a 10
Jan
- 14
Mar
ch
190.
2 0
%
88 %
11
%
1 %
0
%
Jä
mtla
nd
Vån
da
10 J
an -
14 M
arch
30
1.5
0 %
80
%
16 %
4
%
1 %
N
orrb
otte
n D
ötte
rn
21 J
an -
14 M
arch
22
6.3
3 %
82
%
10 %
6
%
0 %
N
orrb
otte
n G
etar
26
Jan
- 14
Mar
ch
291.
2 2
%
74 %
20
%
4 %
0
%
N
orrb
otte
n S
tokk
e 24
Jan
- 14
Mar
ch
728.
5 2
%
77 %
6
%
15 %
1
%
N
orrb
otte
n
Mat
ilda*
27
Jan
- 14
Mar
ch
550.
0 27
%
49 %
2
%
21 %
2
%
2006
V
äste
rbot
ten
Alm
sel
26 J
an -
14 M
arch
12
4.6
0 %
82
%
10 %
8
%
0 %
V
äste
rbot
ten
Mal
gonä
s 25
Jan
- 14
Mar
ch
807.
9 0
%
63 %
21
%
13 %
2
%
V
äste
rbot
ten
Val
sjö
27 J
an -
14 M
arch
10
4.9
0 %
79
%
16 %
4
%
1 %
N
orrb
otte
n K
uorjo
* 10
Jan
- 14
Mar
ch
194.
0 0
%
87 %
11
%
2 %
1
%
N
orrb
otte
n P
irttij
ärvi
10
Jan
- 14
Mar
ch
314.
8 0
%
80 %
18
%
2 %
0
%
N
orrb
otte
n M
adik
ken
09 F
eb -
14 M
arch
29
4.5
31 %
59
%
3 %
4
%
2 %
2007
N
orrb
otte
n K
uorjo
* 19
Jan
- 14
Mar
ch
213.
4 0
%
81 %
17
%
1 %
1
%
App
endi
x 1.
Yea
r of d
ata
colle
ctio
n, c
ount
y, ly
nx n
ame,
stu
dy p
erio
d, h
ome
rang
e si
ze a
nd h
abita
t com
posi
tion
for t
he d
iffer
ent f
emal
e ly
nx in
clud
ed in
this
stu
dy.
*Lyn
x th
at w
as c
aptu
red
and
colla
red
twic
e.