Home - Product Social Impact Assessment
42
Roundtable for Product Social Metrics
Transcript of Home - Product Social Impact Assessment
Roundtable for Product
Social Metrics
1
Implementation Guide Version 1.0 – August 2019
ContributorsRoundtable for Product Social Metrics:
BASF* Peter SalingDSM* Dave Morris, Alexandra FloreaArcelor Mittal Anne Laure Hettinger, Diana IndraneCorbion Diana Visser, Ana Morao, Elizabeth Musoke-Flores Nestlé Urs Schenker PRé Sustainability Mark GoedkoopSandalfon Sustainability Ilonka de BeerSteelcase Massimo CollottaSolvay Bruno Van Parys
* Founders of the Roundtable for Product Social Metrics
Literature referenceFor literature references please use:de Beer, I.M; Goedkoop, M.J.; Peter Saling; Dave Morris; Alexandra Florea; Anne Laure Hettinger; Diana Indrane; Diana Visser; Ana Morao; Elizabeth Musoke-Flores; Urs Schenker; Massimo Collotta; Bruno Van Parys; Product Social Metrics Implementation Guide, version 1.0, Amersfoort, August 2019
AcknowledgementsThe members of the Roundtable acknowledge RepRisk for the opportunity to receive a pilot license for a limited number of days that gave them the opportunity to try out the database for the purpose of product social impact assessment and we would like to thank SHDB, PSILCA, Maplecroft and Datamaran for the interesting demos and discussions.
CopyrightThis work is licensed under a Creative Commons Attribution-No Derivatives 4.0 International (CC BY-ND 4.0). This license allows for redistribution, commercial and non-commercial, as long as it is passed along unchanged
and in whole, with credit to the authors. DisclaimerThis Implementation Guide has been developed by PRé Consultants BV and the members of the Roundtable for Product Social Metrics. Neither PRé Consultants BV nor any of its employees, nor any of the members of the Roundtable for Product Social Metrics nor their respective employees, makes any warranty or assumes any legal liability or responsibility for inaccuracies that may exist in this Implementation Guide and for the use of this Implementation Guide. In order to support appropriate use of the Implementation Guide, a number of rules have been defined. No claims can be made that the results are based on this Implementation Guide if these rules are not followed.
2
Foreword by the members of the Roundtable
This Implementation Guide reflects the work that has been done by the Roundtable Members during Phase 6 of the Roundtable Project. We have been working on case studies, testing data tools and discussed how to come from ad-hoc case studies to full implementation of Product Social Metrics in the organization. For guid-ance in such an implementation journey a Capability Maturity Matrix was developed.
In 2018 the Handbook for Product Social Impact Assessment was revised and the new insights were applied in a number of case studies that are available on-line.
We learned from the experiences in the field of environmental LCA and from the experiences that were shared between
the members. Implementing Product Social Metrics is an on-going journey, where some are a little bit further ahead than others, but all can still learn from one- another. This implementation guide focuses on the first steps of implementation from doing the first case study to formalizing the learnings into the organisation.
Together we develop faster and more efficient!
We would like to wish the reader of this Implementation Guide a lot of success in implementing the social metrics in his or her own organization and welcome any suggestions or learnings that you would like to share.
Ad-hoc Formalised Measured Continuous Improvement
3
Executive Summary
Each organisation that wants to implement procedures and tools is faced with the challenge that a number of (internal) capabilities and procedures need to be developed. The Capability Maturity Matrix is a tool designed to keep track of this capability and procedure development.
Chapter 2 takes a look at the business case for implementing product social metrics, and approaches it from the potential business value generation and the cost effectiveness of moving from ad-hoc to stream-lined procedures and for instance re-using data from previous studies. For the value generation part, we especially focus on the intended applications of the Handbook: • Steering product portfolios• Guiding investment decisions• Steering engagement programs• Reporting the impact of company’s activities in the areas of the relevant SDGs
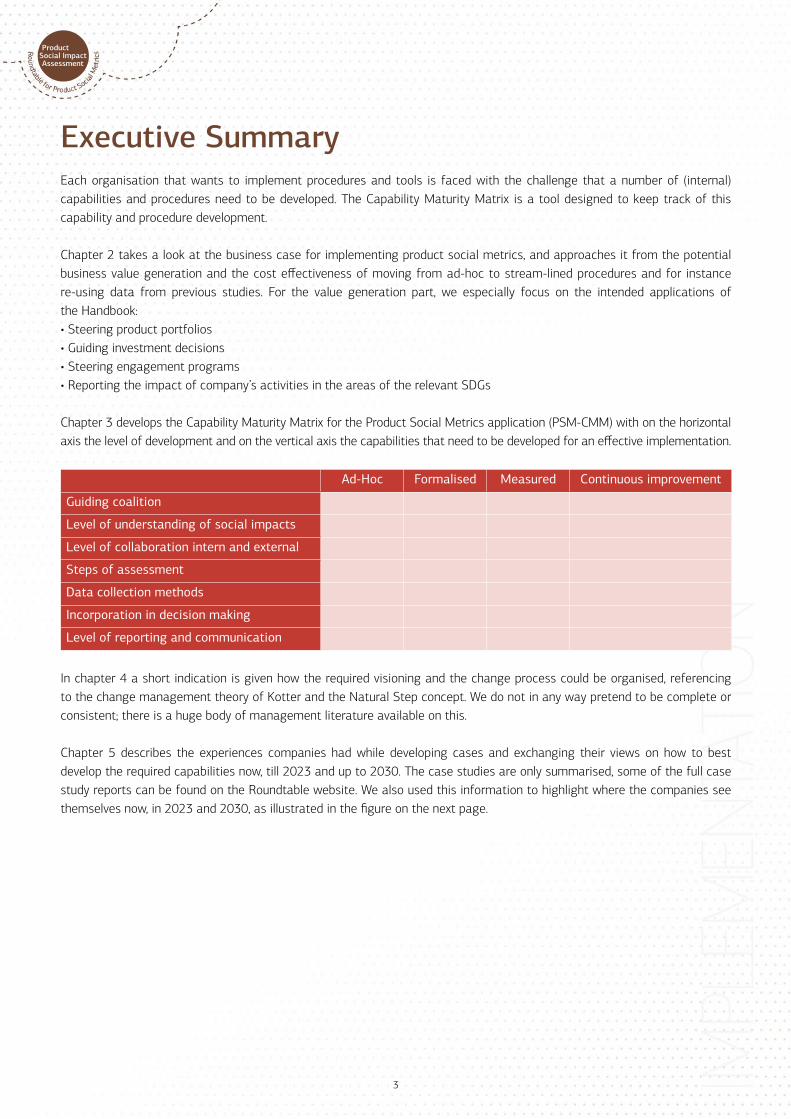
Chapter 3 develops the Capability Maturity Matrix for the Product Social Metrics application (PSM-CMM) with on the horizontal axis the level of development and on the vertical axis the capabilities that need to be developed for an effective implementation.
Ad-Hoc Formalised Measured Continuous improvement
Guiding coalition
Level of understanding of social impacts
Level of collaboration intern and external
Steps of assessment
Data collection methods
Incorporation in decision making
Level of reporting and communication
In chapter 4 a short indication is given how the required visioning and the change process could be organised, referencing to the change management theory of Kotter and the Natural Step concept. We do not in any way pretend to be complete or consistent; there is a huge body of management literature available on this.
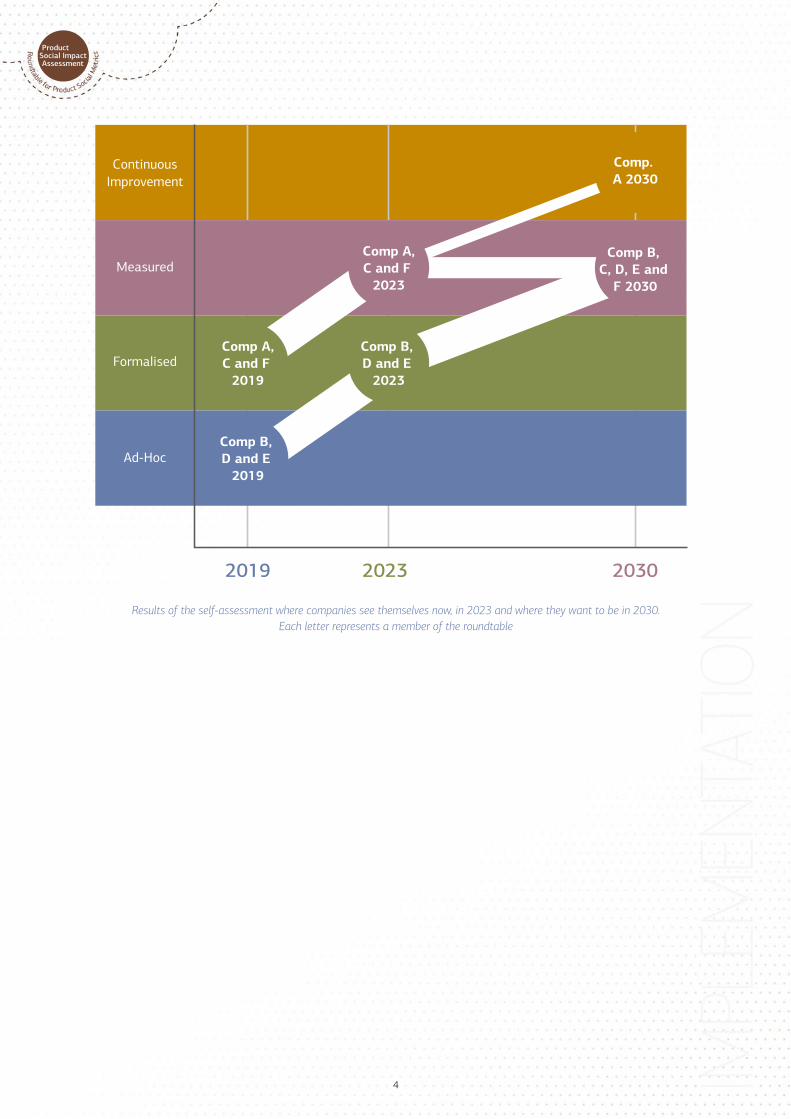
Chapter 5 describes the experiences companies had while developing cases and exchanging their views on how to best develop the required capabilities now, till 2023 and up to 2030. The case studies are only summarised, some of the full case study reports can be found on the Roundtable website. We also used this information to highlight where the companies see themselves now, in 2023 and 2030, as illustrated in the figure on the next page.
4
ContinuousImprovement
2019 2023
Ad-Hoc
Formalised
Measured
2030
Comp A,C and F
2023
Comp A,C and F
2019
Comp B, D and E
2019
Comp B, D and E
2023
Comp B, C, D, E and
F 2030
Comp. A 2030
Results of the self-assessment where companies see themselves now, in 2023 and where they want to be in 2030. Each letter represents a member of the roundtable
5
Glossary Approach Methodology to assess the social impact of a product along its life cycle.
Business to Business (B2B)
Describes the relationship and selling process of goods and services between businesses, for instance, between a manufacturer and ingredient supplier. Most B2B products are purchased by companies to be used in their own manufacturing process, producing goods and services to be sold on.
Business to Consumer (B2C)
Business or transactions conducted directly between a company and the consumers who are the end-users of its products or services.
Capability Signifies the capacity to perform a coordinated set of tasks, utilizing organizational resources to achieve a particular end result.
Capability Maturity Model
A formal architecture of the evolutionary stages leading to a desired level of competency in a particular area of operation, such as software engineering, or life cycle management. The Capability Maturity Model (CMM) is a service mark owned by Carnegie Mellon University, and was developed and is promoted by the Software Engineering Institute (SEI).
Functional unit Quantified performance of a product system for use as a reference unit (source: ISO 14040:2006 and 14044:2006).
Guidelines Set of recommendations that provide guidance on how to develop, implement or conduct an assessment in an effective and appropriate manner
Life cycle Consecutive and interlinked stages of a product system, from raw material acquisition or generation from natural resources to final disposal (ISO 14044:2006).
Life cycle assessment (LCA)
Compilation and evaluation of the inputs, outputs and the potential environmental impacts of a product system throughout its life cycle (ISO 14044:2006).
Materiality The quality of being relevant or significant.
(The) Natural Step
The Natural Step is an open source framework, which sets out system conditions for the sustainability conditions of human activities on Earth. Part of this Framework is “the backcasting from principles approach (“ABCD)”.
PARC Product-Application Region Combinations; a concept developed for portfolio analysis
Portfolio Sustainability Assessment (PSA)
Systematic review of the entire range of products and services, their application and the region they are sourced or marketed. The goal is to future-proof the portfolio adjust the product management and develop products that will generate much financial and societal value
Performance indicators
Quantitative and qualitative markers of performance for each of the social topics, e.g. number of working hours during weekends, minimum wage paid, etc.
Primary data Data from specific operations in the studied product’s life cycle that is measured.
Process Generic term for an activity somewhere in the value chain, without knowing the exact name of the company who performs this activity (see also supply chain actor)
Product Social Impact Assessment
Methodology to assess the social impacts of a product or a service on stakeholder groups throughout the life cycle of the product. Although it may be associated with the acronym social LCA, it does not prescribe full alignment with the recommendations of the ISO 14040 norm for life cycle assessment.
Reference scale Scale used to measure social performance of each social topic. All scales defined in the report have five levels, from -2 to +2.
6
Secondary data Process data that are not from specific processes in the studied product’s life cycle.
Service Intangible commodity equivalent to a product supplied by service industries, such as childcare, construction, entertainment and telecommunications. It does not refer to services such as warranties and service contracts associated with a tangible product.
Social impact Assessment of the potential positive or negative social performance of the product and some of its immediate effects on various stakeholders along its life cycle (workers, local communities, smallholders, users).
Social topics Social areas related to stakeholder groups that should be measured and assessed, for example, working hours, community engagement, child labour, etc.
Stakeholder groups
Groups on which the product has an impact along its life cycle, such as workers, consumers, local communities and small scale entrepreneurs.
Supply chain actor Identifiable company or group of small-scale entrepreneurs with known name and location
Sustainable Development Goals (SDGs)
On September 25th, 2015, countries adopted a set of goals to end poverty, protect the planet and ensure prosperity for all as part of a new sustainable development agenda. Each goal has specific targets to be achieved over the next 15 years.
User The end-users of the final product or service in a personal or professional (previously referred to as Consumer)
Workers People who are paid to perform work related to the product or service, i.e. in the supply chain, manufacturing, retail or end-of-life processes. It includes formal workers (i.e. employees with formal contracts, including temporary and part-time workers), workers employed through agencies or contractors, informal workers (i.e. workers without formal contracts), apprentices and trainees, migrant workers and homeworkers.
Acronyms AoP Area of Protection CE Circular EconomyCSR Corporate Social ResponsibilityKPI Key Performance IndicatorISEAL International Social and Environmental Accreditation and LabelingLCM-CMM Life Cycle Management Capability Maturity ModelLCA Life Cycle AssessmentGRI Global Reporting InitiativeNGO Non-Governmental OrganizationOECD Organisation for Economic Co-operation and DevelopmentPARC Product-Area-Region CombinationPSA Portfolio Sustainability AssessmentPSIA Product Social Impact AssessmentPSM Product Social MetricsPSM-CMM Product Social Metrics Capability Maturity ModelSDG Sustainable Development GoalS-LCA Social Life Cycle AssessmentTNS The Natural StepUNEP United Nations Environmental ProgramWBCSD World Business Council for Sustainable DevelopmentWHO World Health OrganizationSETAC Society for Environmental Toxicology and ChemistrySMETA Sedex Members Ethical Trade Audit

7
CONTENTS FOREWORD BY THE MEMBERS OF THE ROUNDTABLE 2
EXECUTIVE SUMMARY 3
1 INTRODUCTION 8 1.1 Purpose of this Implementation Guide 8 1.2 Capability Maturity Matrix 9 1.3 Assumed point of departure 10 1.4 How to read this Implementation Guide 11
2 BUSINESS VALUE 12 2.1 Factors that influence the costs 12 2.2 Generic value drivers for social impact assessment 13 2.3 Realising business value through the application of the Handbook. 15 2.4 Presenting the business value in a convincing way. 19
3 PRODUCT SOCIAL METRICS –CAPABILITY MATURITY MATRIX (PSM-CMM) 20 3.1 Levels of development in the maturity matrix 20 3.2 The PSM-CMM in detail 22
4 THE CAPABILITY MATURITY IMPLEMENTATION PROCESS 23 4.1 Kotter: Change management model 23 4.2 Self-assessment by the use of The Natural Step ABCD Framework 25
5 LEARNINGS FROM THE CASE STUDIES AND CMM 28 5.1 Short overview of the cases and main learnings 28 5.2 The current and future state of capability development at the member companies 32 5.3 The link with value creation 38 5.4 How companies assess themselves 39
6 CONCLUSIONS AND OUTLOOK 40

8
1 Introduction 1.1 Purpose of this Implementation Guide
From 2013 to 2019 a group of proactive companies collaborated in a roundtable format to build consensus around the question of how should assess the positive and negative social impacts along the lifecycle of a product or service1 should be assessed.
Figure 1.1 Timeline representation of the development of the Handbook
A key reason for the joint development of the product social metrics was the generally felt need to develop a consensus on the methodology, as companies do not want to compete on methodologies but on results. This conviction was at the basis of the Product Social Metrics Roundtable. The members therefore shared insights and developed consensus on the methodology. The latest version of the Handbook was published in 2018. Since then the members have been applying this new Handbook on a number of cases to test the usability of the Handbook and, especially whether, the proposed tools and procedures to identify and assess hotspots really work.While making case studies is a good way to test and learn; ultimately the vision of the companies is that the next challenge is to implement product social metrics in efficient and effective procedures. According to the 2016-2017 mission statement the intended application area for such metrics are in:• Steering product portfolios• Guiding investment decisions• Steering engagement programs• Reporting the impact of company’s activities in the areas of the relevant SDGs2
In order to fulfil this mission, we developed this implementation guide outlining how to develop the necessary Organisational Capability Maturity for integrating product social metrics in the organisation and value chain.
1 For a brief history of the project see https://product-social-impact-assessment.com/roundtable-for-product-social-metrics/2 Since the formulation of this mission a separate project has started to focus on the linkages between product social metrics and the SDGs.
As this is an on-going project the current implementation guide will not focus very much on this 4th application area, See also https://www.lifecycleinitiative.org/activities/key-programme-areas/technical-policy-advice/linking-un-sdgs-to-life-cycle-impact-pathway-frameworks/
Beginning of Roundtable
Handbook v1
External reviewTest cases
Handbook v2
Published Handbook v3
Added a new stakeholder group:
small- scale entrepreneurs Evaluated data tools
Accelerated acceptance
Handbook 2018 and Methodology
Report
Implementation Guide
Updated methodology tested on cases
Testing of data tools
Method tested on cases Toolkit
for communication designed
2013 2014 2016 2017 2018 20192015
9
1.2 Capability Maturity Matrix
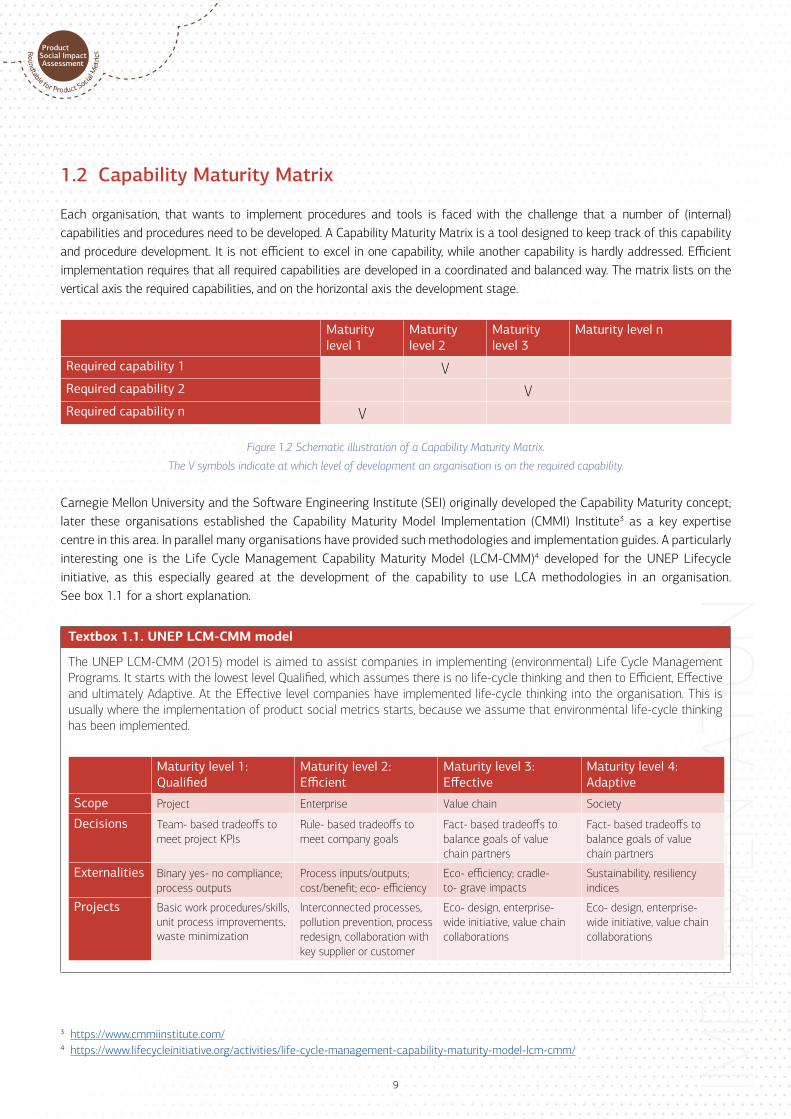
Each organisation, that wants to implement procedures and tools is faced with the challenge that a number of (internal) capabilities and procedures need to be developed. A Capability Maturity Matrix is a tool designed to keep track of this capability and procedure development. It is not efficient to excel in one capability, while another capability is hardly addressed. Efficient implementation requires that all required capabilities are developed in a coordinated and balanced way. The matrix lists on the vertical axis the required capabilities, and on the horizontal axis the development stage.
Maturity level 1
Maturity level 2
Maturity level 3
Maturity level n
Required capability 1 VRequired capability 2 VRequired capability n V
Figure 1.2 Schematic illustration of a Capability Maturity Matrix.
The V symbols indicate at which level of development an organisation is on the required capability.
Carnegie Mellon University and the Software Engineering Institute (SEI) originally developed the Capability Maturity concept; later these organisations established the Capability Maturity Model Implementation (CMMI) Institute3 as a key expertise centre in this area. In parallel many organisations have provided such methodologies and implementation guides. A particularly interesting one is the Life Cycle Management Capability Maturity Model (LCM-CMM)4 developed for the UNEP Lifecycle initiative, as this especially geared at the development of the capability to use LCA methodologies in an organisation. See box 1.1 for a short explanation.
Textbox 1.1. UNEP LCM-CMM model
The UNEP LCM-CMM (2015) model is aimed to assist companies in implementing (environmental) Life Cycle Management Programs. It starts with the lowest level Qualified, which assumes there is no life-cycle thinking and then to Efficient, Effective and ultimately Adaptive. At the Effective level companies have implemented life-cycle thinking into the organisation. This is usually where the implementation of product social metrics starts, because we assume that environmental life-cycle thinking has been implemented.
Maturity level 1: Qualified
Maturity level 2: Efficient
Maturity level 3: Effective
Maturity level 4: Adaptive
Scope Project Enterprise Value chain Society
Decisions Team- based tradeoffs to meet project KPIs
Rule- based tradeoffs to meet company goals
Fact- based tradeoffs to balance goals of value chain partners
Fact- based tradeoffs to balance goals of value chain partners
Externalities Binary yes- no compliance; process outputs
Process inputs/outputs; cost/benefit; eco- efficiency
Eco- efficiency; cradle- to- grave impacts
Sustainability, resiliency indices
Projects Basic work procedures/skills, unit process improvements, waste minimization
Interconnected processes, pollution prevention, process redesign, collaboration with key supplier or customer
Eco- design, enterprise- wide initiative, value chain collaborations
Eco- design, enterprise- wide initiative, value chain collaborations
3 https://www.cmmiinstitute.com/4 https://www.lifecycleinitiative.org/activities/life-cycle-management-capability-maturity-model-lcm-cmm/
10
1.3 Assumed point of departure
Starting point of the maturity process for social product metrics is that capabilities and procedures in the field of environmental LCA already are implemented in an effective way. When the UNEP LCM-CMM (see Textbox 1.1) is taken as a reference, we assume that companies start at the level of “Effective”. In this context we can argue that implementing the PSIA method helps companies to develop from the “Effective” to the “Adaptive” level; especially for the metrics capability.
While this UNEP-LCM CMM model is a very useful tool we have chosen to develop a more specific Capability Maturity Matrix for product social metrics (PSM-CMM). One of the motivations for this is, that there are some basic differences between environmental and social assessments, see textbox below. This means that although a company has successfully implemented procedures to efficiently apply environmental LCA; they will need to rethink and reformulate some of the roles, procedures, data tools and skills, when implementing social LCA or as we call it, product social metrics.
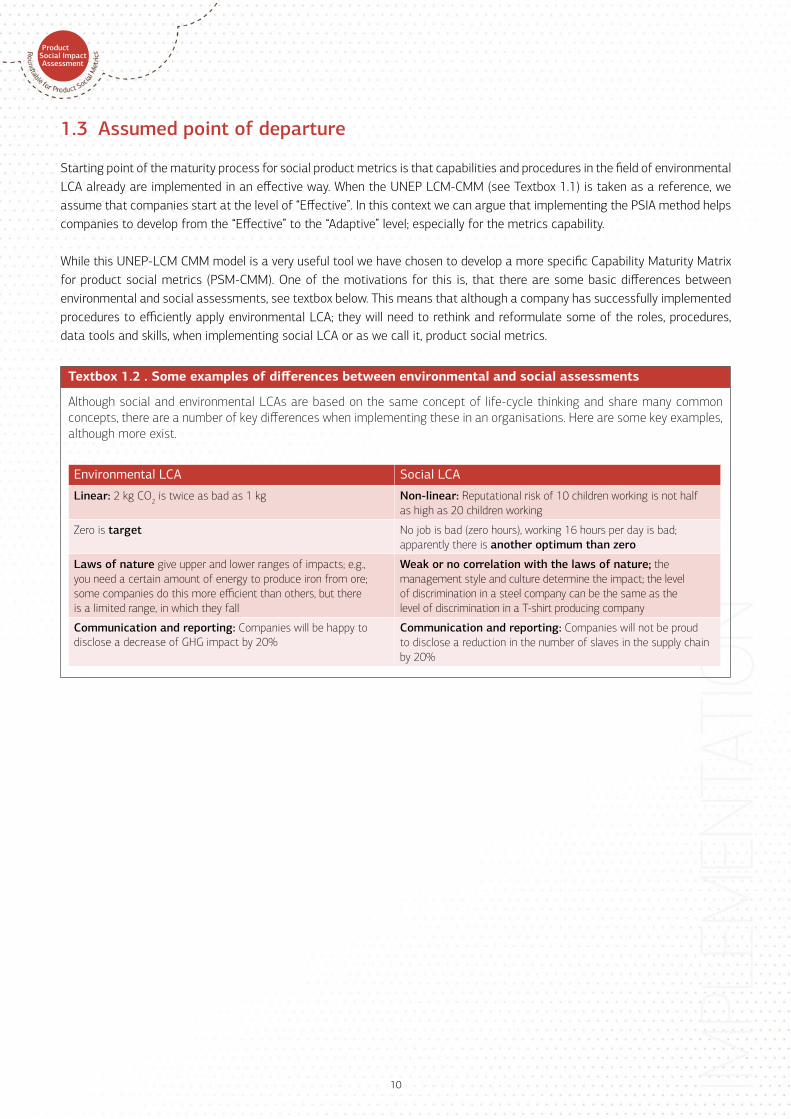
Textbox 1.2 . Some examples of differences between environmental and social assessments
Although social and environmental LCAs are based on the same concept of life-cycle thinking and share many common concepts, there are a number of key differences when implementing these in an organisations. Here are some key examples, although more exist.
Environmental LCA Social LCA
Linear: 2 kg CO2 is twice as bad as 1 kg Non-linear: Reputational risk of 10 children working is not half as high as 20 children working
Zero is target No job is bad (zero hours), working 16 hours per day is bad; apparently there is another optimum than zero
Laws of nature give upper and lower ranges of impacts; e.g., you need a certain amount of energy to produce iron from ore; some companies do this more efficient than others, but there is a limited range, in which they fall
Weak or no correlation with the laws of nature; the management style and culture determine the impact; the level of discrimination in a steel company can be the same as the level of discrimination in a T-shirt producing company
Communication and reporting: Companies will be happy to disclose a decrease of GHG impact by 20%
Communication and reporting: Companies will not be proud to disclose a reduction in the number of slaves in the supply chain by 20%
11
1.4 How to read this Implementation Guide
The intended audience for this implementation guide is the person or small team of people, who are charged with creating and monitoring the required capabilities, procedures and dataflow to support the use of product social metrics. Often, when a company starts with product social metrics this is undertaken by the (environmental) LCA department or expert. When the company develops in maturity also other departments are engaged and involved and the audience for this guide is broadened to other Human Resources, Procurement, CSR and strategy functions. This is later described in the capability development as the “guiding coalition”.
Chapter 2 provides guidance on how to develop a convincing business case for the implementation efforts; this cannot be a standard business value pitch as the business value can be very different from company to company. Chapter 3 develops the concept of Capability Maturity in the context of Product Social metrics as a tool to measure the progress of the capability maturity and to plan ahead for next steps. Chapter 4 provides some ideas how a change and visioning process could be organised. Chapter 5 provides a quick overview of the main findings and challenges when applying the new Handbook in a case study. This chapter also describes how the current members assess their own maturity now and how they have set their ambitions. Please note that these were the results of thought exercises, and not formally approved by the management.The final chapter 6 provides an outlook on how we see the further development of the Implementation Guide.
Please note the Implementation Guide is meant to be used by people who have a good understanding of the Handbook for Product Social Impact Assessment Product Social Metrics Handbook, and preferably by people who have been participating in a case study or training.

12
2 Business Value
A business case exists, if the value of an action is higher than the cost. Below the different views on value are explored, and these can be very different from company to company. The cost side of applying PSM assessments are highly linked to the efficiency of the internal procedures. Therefore, when the experience grows more and more data and assessments can be reused and therefore the costs of the assessments are reduced substantially.
2.1 Factors that influence the costs
Currently, most companies work on an ad-hoc basis only on cases and as a result there are no streamlined procedures, the access to data needs to be organised and experimented with etc. and the methodology is not yet adapted to the company and the value chain. Therefore, the first assessments are usually the most expensive and time-intensive. For PSM there are however a number of elements that can be streamlined per company or business unit, and do not need to be repeated for every assessment:
1. Standardised Materiality Assessment: The Handbook advises to link the materiality assessment to the more generic materiality approach often already existing in a company. This means for an efficient implementation it is important to develop the materiality matrix for PSM on a company, business unit or product category5 level.
2. Well-defined Communication Context: a company approach, probably best aligned with the environmental LCA communication policy can be set on a company level and it is likely that for the internal audiences, the way the information is used in decision support etc., is very similar to traditional LCA approaches.
3. Efficient access and re-use of data: Collecting social metrics data is prone to be inefficient on an ad-hoc basis; this is also the generic and unsurprising finding from the cases presented in chapter 4. Companies need to get acquainted with the data tools and to experiment with these. Very large cost savings are likely to be possible if the company uses one or more licenses from data tools, and it may well be worth the effort to find out if such licenses are already available in other departments of the company or are of interest to other departments as well. Once this is done it is likely that for most business units and especially per product category the assessment of the supply chain will be very similar for future studies in that area. So it is important to determine how to best organize the in-sights, data and earlier assessments, so they can be re-used in any further study. Once this is done, each new study needs to focus on specific new materials processes, end of life scenarios or impacts on the user as appropriate, while much data collected in earlier assessment can be re-used. Examples of such solutions are for instance the SupplyShift tool6, and the Together for Sustainability Initiative7 in the Chemical industry etc.
4. Dividing tasks, responsibilities and opening of communication channels: PSM will need a high level of collaboration between different entities in the organization. Purchasing will probably be best positioned to understand and provide information on suppliers; HR will likely know much about the position of workers; the LCA department will have very useful insights in supply chains and Business development and Marketing and Communications will be interested in assessing the value for users in the early phases of product development. Creating a clear structure and procedures around PSM is probably the most challenging task in developing an efficient implementation.
Organizing these and other elements in an efficient way is key to developing the cost saving, and thus optimizing the cost side of the business case for implementing PSM fully in the organization.
5 People familiar with the WBCSD PARC concept, see textbox 2.1, could replace Product category with PARC; for now we use the term product category.
6 www.supplyshift.com7 https://tfs-initiative.com/

13
We can learn from history how environmental LCA started and developed in companies8, see Textbox 2.1 below.
Textbox 2.1. Learnings from the implementation of environmental life cycle assessments in companies.
Inspired by the book Life Cycle Assessment in Industry and Business.
Paulo Frankl and Frieder Rubik nicely described how the adoption of environmental life cycle assessment developed. The book is based on interviews with 20 companies in the late nineties, from which it became clear that the first LCA studies in almost all companies were inefficient, badly organised, and almost always far above the planned budget. It also brought to light that it was often very unclear who was responsible for what and who was charged to do what. At the end, Frankl and Rubik describe the moment of crisis: the results are finally there, and they are not what people expected, so is it a bad tool as it gives a wrong answer, or is such an unexpected answer really valuable?
The interviews also showed a very bright side. Once this first LCA was done and the concept had survived the “moment of crisis” it became clear that the first LCA had delivered a huge amount of data and insights that could be re-used for any following LCA in the same business sector (usually a business sector has the same supply chain for many products.). The interviews also revealed that from then on, roles and responsibilities were assigned, and now, two decades later, most companies have streamlined their LCA work, developed their own internal databases and procedures; have chosen the most relevant methodology choices etc. All this has led to low costs per assessment.
2.2 Generic value drivers for social impact assessment
On the other side of the cost there is the benefit of doing an assessment and obtaining more information on the social impacts of the products of the company. This business value can be described on two levels:1. The general benefit of taking into account social issues in business decisions2. The specific benefits of applying the Handbook; this is described in the next section
In the Social and Human Capital Protocol9 the following five different generic drivers for assessing social impacts are defined;1. Obtain or maintain license to operate2. Improve the business- enabling environment3. Optimize human resources management4. Strengthen value chains5. Encourage product and service growth and innovation
The first two ones mentioned above are more risk oriented while the last ones are more directed towards creating opportunities and value for the business. We asked the members what the most important value drivers for their specific companies are, and this provided a mixed picture. The main differences can be described as follows: 1. Start from a risk-based approach: the first aim in this case is to maintain the license to operate and to identify risks in the
supply chain. The value in this case focuses on the value of avoiding risks and costs potentially arising from these risks, such as lawsuits and loss of reputation. Focus is on assessing whether there are issues in the supply chain that are infringing local or international regulations. Ultimately this supports driver number 2, e.g., improving the business enabling environment.
2. Driver 5, encouraging product and service growth, aims to show evidence for product benefits in the social domain. This can be benefits for users of products; e.g., the use of a lighter material for ropes have a benefit for workers that need to work daily with these products. Positive value can be a higher customer interest and loyalty. This also supports driver 4, strengthening the value chain customer and supplier loyalty.
3. Within the group of members of the Roundtable driver 3 (optimize human resources management) seems less relevant, but this could be due to the fact that the representatives partaking in the Roundtable are not representatives of HR departments and mainly have a background in environmental LCAs (where HR is not a relevant partner) or maybe they just do not have much interaction with HR departments.
8 Frankl, Paolo, Rubik Frider; Life Cycle Assessment in Industry and Business, 2000. 9 Social & Human Capital Protocol, Social & Human Capital Coalition, February 2019

14
The PSIA Framework can be used for the assessment independent of the different drivers mentioned above, as it combines the risk and value-based approaches. When risks are assessed the focus will be mainly on the value chain and the important stakeholders are small-scale entrepreneurs, workers and communities. When the focus is on value creation companies usually start with assessment of the value in the use-phase, but value can also be generated in the value chain through collaboration and mutual beneficial training schemes and for instance ensuring small-scale entrepreneurs can make a livelihood in future, so they will continue to supply high quality products.
Textbox 2.2 gives an illustration of how value can be created by the measurement and reporting of social and environmental impacts and driving new product development and product growth.
Textbox 2.2 Creating corporate value with well-implemented metrics
Our member company DSM explicitly states how they see the business value generated from understanding and addressing sustainability issues. Their key concept is Purpose-Led, Performance Driven; this highlights a number of “must win battles” in the sustainability areas, such as the climate catastrophe, the Hunger/Obesity problem and the over-use of resources. By focussing on innovations to develop solutions, significant business growth can be achieved, as illustrated with the figure below:
This ambition can only be realised if the organisation is very competent and efficient in understanding these megatrends, and translating this into attractive proposals to their clients. This is where the implementation of metrics comes in.
The key DSM sustainability drivers are represented by their “purpose-led, performance driven” strategy and their sustainability portfolio steering Brighter Living Solutions, which is measured based on a product life cycle approach, for both social and environmental impacts.
Source: the illustrations come from a slide set retrieved on July 9th from https://www.dsm.com/corporate/sustainability.html

15
10 Framework for Portfolio Sustainability (PSA), WBCSD, October 201711 Social Life Cycle Metrics for Chemical Products, WBCSD, November 2016
2.3 Realising business value through the application of the Handbook.
As mentioned in the first chapter, the intended applications of the Handbook are:• Steering product portfolios• Guiding investment decisions• Steering engagement programs• Reporting the impact of company`s activities in the areas of the relevant SDGs
Below we will focus on the specific business value of such applications. Note that these benefits can be different per company.
Marketing
n Customer supportn Product communication
Strategy
n Choice of technologyn Investment decisions
Politics and Advocacy
n Political debates n Stakeholder dialogues
Procurement
n Choice of supply chainsn Risk assessment
Ecology
Economy
SocialSEEbalance® is the BASF comprehensive approach to assess the social, environmental and economic aspects of products or processes covering the entire life cycle.
Fig 2.1 Application areas of BASF SEEbalance® method for Life Cycle Assessments
2.3.1 Portfolio analysisEspecially for companies with a broad portfolio of products and markets, it is very useful to screen the portfolio and distinguish various categories, like a category of products that contribute highly to a more sustainable future, products that seem to have negative contributions and one or more classes in between. In a recent study by the WBCSD a valuable guidance document has been developed. When the members of the RT defined the mission and the application areas of social metrics in Phase 4 (see paragraph 1.1.) one of the application areas defined was steering product portfolios. In October 2017 the WBCSD published the report “Framework for Portfolio Sustainability Assessments (PSA)”10. This report builds on the report from 2016: ‘Social Life Cycle Metrics for Chemical Products”11, which has quite some overlaps with the Handbook version 3.0.
It is important to realise this is not only about products, but about the application context of a product and the region the product is used in. The term PARC (Product Application Region Combination) is used to describe this. For instance supplying simple mobile phones in rural developing areas can have a significant contribution to education and economic development, selling very simple and easy to use phones to elderly people in developed countries, may also have a benefit. This positive impact may be much less, when very fashionable phones with build-in obsolescence are sold to young people in developed countries.
The 2017 PSA Framework of the WBCSD makes the following suggestion when using this PARC concept:The definition of a PARC is very similar when compared to classical marketing segmentation approaches. Companies are advised to strive to align PARC segmentations as much as possible with existing segmentations (e.g. used in manufacturing, marketing and sales) to maximize relevance of outcomes for internal stakeholders and reduce the efforts required to gather data on PARCs.

16
The suggested assessment approaches, include the use of social metrics as defined in the Handbook or the 2016 WBCSD guide, stakeholder signals and the performance of the PARC. As an example the suggestion is given to categories the PARCs in three or 5 categories. This is illustrated in figure 2.2.
Figure 2.2 A possible way to classify PARCs in 3 to 5 classes
2.3.2 Reporting against the SDGsMany companies have aligned or are now aligning their sustainability strategies against a self-selected subset of the 17 sustainable development goals (SDGs). The main motivation is that if the SDGs will be realised around 2030, markets will undergo big changes and many new markets will open, while others will disappear. This alignment is also a strong motivator for the portfolio analysis described above, understanding the PARCs that can thrive in these markets, and adapt or drop PARCs that risk being in the declining markets.
An analysis of the potential business value of aligning to the SDGs was recently described under a UNEP Life Cycle Initiative project12. From this report, we quote two illustrative examples, but the report13 has more.
Together with the Global Reporting Initiative (GRI) and the UN Global Compact, WBCSD initiated The Business and Sustainable Development Commission, a two-year project that finished its work in January 2018.
12 https://www.lifecycleinitiative.org/activities/key-programme-areas/technical-policy-advice/linking-un-sdgs-to-life-cycle-impact-pathway-frameworks/
13 Making SDG relevant for Business, Weidema B P, Goedkoop M.J. Mieras E (2018) https://lca-net.com/publications/show/making-the-sdgs-relevant-to-business/

17
14 Better Business Better World, Business & Sustainable Development Commission, January 201715 CEO Guide tot the Sustainable Development Goals, WBCSD, March 2017
Its most important outcome was the “Better Business, Better World, Business & Sustainable Development Commission report”14 that finds that achieving the SDGs could unlock 12 trillion dollars per year in terms of business value and 380 million jobs. LInking the business themes (figure 2.3) to the SDGs the biggest contributions would come from mobility systems, new health care solutions, energy efficiency and clean energy.
Figure 2.3 illustrating potential new market opportunities
The second example for the business value is illustrated in “The CEO Guide to the Sustainable Development Goals”15. This report is the result of contributions from a number of CEOs in the WBCSD membership. it is a very clearly structured and convincing document that highlights the business benefits of using the SDGs as guidance in strategy development.
Quote: “The SDGs provide us with a new lens through which to translate global needs and ambitions into business solutions. These solutions will enable companies to better manage their risks, anticipate consumer demand, build positions in growth markets, secure access to needed resources and strengthen their supply chains, while moving the world towards the delivery of the SDGs.”
The report proposes 4 pillars along which the implications of the SDGs need to be understood, see the figure 2.4 on the next page. The report stresses the need to develop suitable metrics, and there is a strong suggestion to express impacts in terms of monetary values. However, the specific way to do this is not described; there is only a reference on how to do this for climate risk.
18
Figure 2.4 the four pillars on which the value of the SDGs should be understood
So while these examples hint at a very high potential business value, it is less clear how sustainability departments should report against the SDGs as the SDGs and underlying KPIs are typically defined for governments.
The aforementioned UNEP Lifecycle initiative project is aiming to address this in a new handbook with guidance. One of the use cases of this handbook is to connect existing social and environmental LCA results to an SDG in a screening way. Table 2.1 illustrates the results of an hypothetical SDG. It directly connects to the 5-point scale used in the PSIA Handbook:1. Environmental or social impact results that can be seen as significantly contribution are usually on the +2 level. Sometimes
on the +1 and even the 0 level16.2. Environmental or social impact results must be interpreted, as a “showstopper” if the impact is so detrimental that, there can
be no real contribution, but rather a negative contribution to the goal. This is usually on the -2 and sometimes on the -1 level.3. Environmental or social impact results that can be seen as influencing, but the influence is not strong enough to be
counted as a beneficial or detrimental contribution. This is represented by the scores that are neither a contributor nor a showstopper; this can include the range from -2 to +2.
Note that the UNEP report will also contain a fully quantified analysis on how environmental or social impact results are connected to the SDGs.
Table 2.1 Illustration of the way the final results can be summarised
2.3.3 Guiding investment decisionsThis has two sides, internal investment decisions and external:• External investors, banks and shareholders and for instance pension funds have become very aware that the sustainability
performance of a company has a very high influence on the future value of an investment or the share price. This prompts them to set requirements and conditions before they invest. Being able to show that the company has the metrics to understand its current and future impacts is becoming a valuable asset. There are many examples and studies by financial organisations, World Bank and OECD. Recently the EU published17 a draft “taxonomy” to identify investments that do and do not contribute to sustainability and it announced that policies will be developed to support the investments that are contributing.
16 in some SDG targets it is mentioned that being compliant can be seen as supporting a target; this is not the case in SDG 2 and 3 17 https://ec.europa.eu/info/publications/180524-proposal-sustainable-finance_en 18 https://www.value-balancing.com/
19
19 https://www.nestle.com/csv/global-initiatives/global-youth-initiative
• Internal investment decisions: Influenced by the external developments, the national policy context and for instance the results of portfolio assessments, investment decisions will need to include social impact assessments.
It is not easy to elaborate on this as the investments are strongly linked to the position of the company in the supply chain, the business sector etc. However, the bottom line is that on the long run society will no longer accept that profits can be made in private and costs (externalities) will be paid by society. This is also an important driver behind the development of impact valuation methodologies. These aim to make the externalities visible in a quantified way. A recent announced OECD linked “Value Balancing Alliance”18 aims to develop a widely accepted metric for impact valuation. Linking the Handbook to such metrics is also high on the agenda for the next phase of the Roundtable.
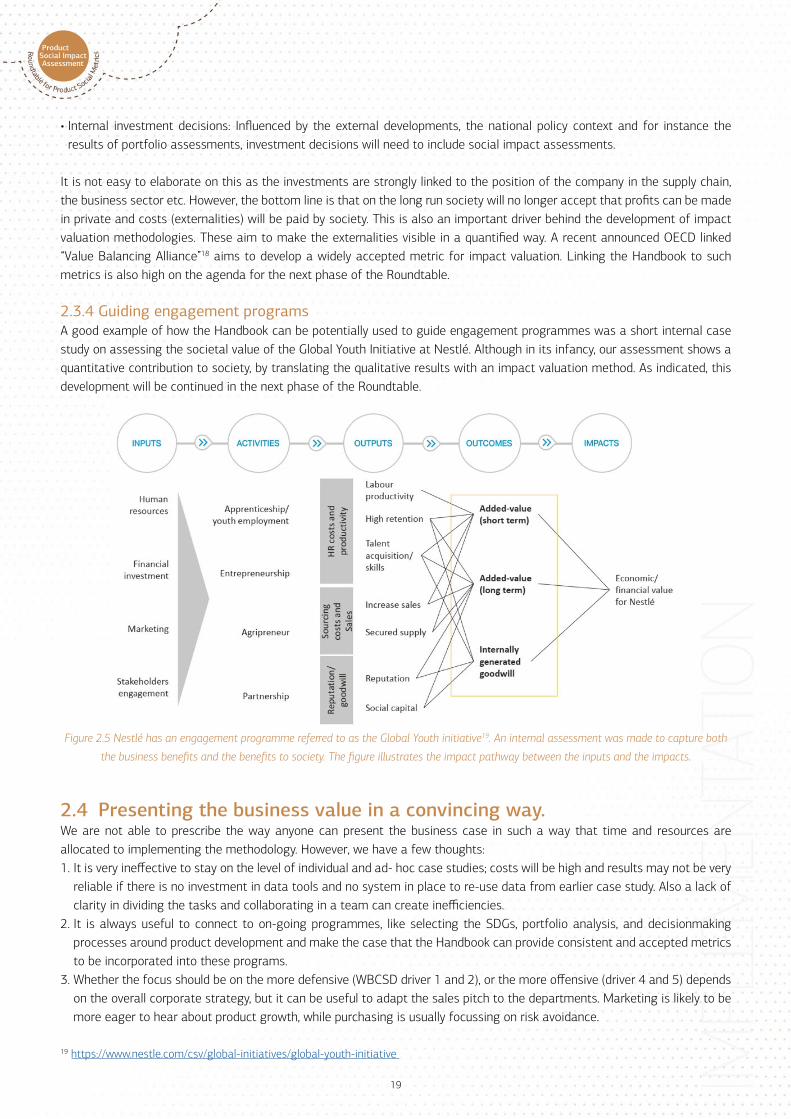
2.3.4 Guiding engagement programsA good example of how the Handbook can be potentially used to guide engagement programmes was a short internal case study on assessing the societal value of the Global Youth Initiative at Nestlé. Although in its infancy, our assessment shows a quantitative contribution to society, by translating the qualitative results with an impact valuation method. As indicated, this development will be continued in the next phase of the Roundtable.
Figure 2.5 Nestlé has an engagement programme referred to as the Global Youth initiative19. An internal assessment was made to capture both
the business benefits and the benefits to society. The figure illustrates the impact pathway between the inputs and the impacts.
2.4 Presenting the business value in a convincing way. We are not able to prescribe the way anyone can present the business case in such a way that time and resources are allocated to implementing the methodology. However, we have a few thoughts:1. It is very ineffective to stay on the level of individual and ad- hoc case studies; costs will be high and results may not be very
reliable if there is no investment in data tools and no system in place to re-use data from earlier case study. Also a lack of clarity in dividing the tasks and collaborating in a team can create inefficiencies.
2. It is always useful to connect to on-going programmes, like selecting the SDGs, portfolio analysis, and decisionmaking processes around product development and make the case that the Handbook can provide consistent and accepted metrics to be incorporated into these programs.
3. Whether the focus should be on the more defensive (WBCSD driver 1 and 2), or the more offensive (driver 4 and 5) depends on the overall corporate strategy, but it can be useful to adapt the sales pitch to the departments. Marketing is likely to be more eager to hear about product growth, while purchasing is usually focussing on risk avoidance.

20
3 Product Social Metrics –Capability Maturity Matrix (PSM-CMM)
The aim of this chapter is to present a matrix that can be used for measuring the various stages of the Capability Maturity framework. Understanding where a company is, provides useful insight that help to lead companies through the implementation journey. In the next chapter we will describe some approaches for change management, as implementation needs changes in an organisation.
Based on the experiences gained in the six phases of the Roundtable, we have developed a maturity model that has a specific focus in or supporting companies with the implementation of product social metrics. The matrix can be used to answer questions like:• Where is my organisation at present?• Where do we want to go from here?• What do we need to do to progress in maturity?
3.1 Levels of development in the maturity matrixAs described in paragraph 1.2, the Capability maturity matrix puts the level of maturity on the horizontal axis and the required capabilities on the vertical axis.
3.1.1 The levels of maturity (x axis)The PSM-CMM matrix reflects the specific capability developments required in the different application levels of product social metrics. It contains 5 levels, which are being described on the x-axis of the PSM-CMM; starting from doing the first ad-hoc case via the formalization of the processes, towards the measurement of (a part) of the portfolio to the integration in the business and decision-making processes. The highest level defined is continuous improvement, reflecting the expectation, that the requirements of stakeholders will continue to be more stringent in the future. In Figure 3.2 the relationship between table 3.2 and 3.3 are reflected.
Levels of maturity Description
Ad-hoc Companies are aware that there is value in the assessment of social impacts and they are exploring what specific value there is for the company. Usually the company start with a first pilot or case study, often after reading the Handbook or following a training. Some experience is gained with data tools. Often LCA experts are involved
Formalised Several case studies have been done and formal access is obtained with a variety of data tools. Processes are Formalised in parts of the organisation. Engagement with departments outside the LCA department.
Measured There is a target on which and how many product application region combinations (PARCs) are assessed via Product Social Metrics. Data collection methods and analyses are enhanced, and previous collected data are well managed
Continuous Improvement Companies aim to stay at the forefront and move forwards with innovative new steps and methodology improvements. Clear value is reached by transparency in value chains and product benefits. Since stakeholder requirements will change overtime a need for continuous improvement is clear.
Table 3.1 Five levels of maturity

21
3.1.2 The required capabilities (y-axis)On the vertical axis of the PSM-CMM, the key required capabilities that need to be developed are listed. It basically forms a checklist of key areas that determine the level that a company is at. It lists the items that have to be considered when a company is moving towards further implementation.
Key areas of development
Description
Guiding coalition The person or team that is in charge of the implementation of social metrics in the company.
Level of understanding of social impacts
From basic understanding to full understanding of social impacts of all the products from the company.
Level of cooperation internally and externally
Usually companies start only internally and then involve a few first-tier suppliers. In later stages the involvement with external and internal parties increases.
Steps of an assessment A company usually starts with a small number of steps and then either focuses on the end-use or the value chain. When social metrics is fully implemented the value chain, use-phase and end-of life of products are assessed.
Data collection methods Starts from input/output databases and internal information towards fully automated data-collection
Incorporation in decision making
Development towards balanced decision making on positive and negative social and environmental impact
Level of reporting and communication
In the first two levels the companies usually do not report externally. From then on communication is gradually expanded towards a full dialogue with external stakeholders
Table 3.2. Key areas of development
22
Ad-Hoc Formalised Measured Continuous improvement
Guiding coalition
Few in-house experts to perform assessment. Usually not more than two other departments involved. Often started from the LCA department
LCA department in the lead involvement of innovation (R&D) and marketing department
Centralized coordination of implementation of the methodology with the focus on efficiency and consistency. Business leading, involvement of corporate strategy department.
Multi-disciplinary team with full support from company board and executives, with a focus on methodology improvements
Level of understanding of social impacts
Risk identification mainly, basic and limited to specific aspects, experts and selected groups. Or aimed at assessment of specific user topic.
Deeper insight, knowledge and intelligence on current risks and emerging issues. Basic topics are accepted and implemented. High understanding of key issues and functions, sufficient in other issues/functions.
Full understanding and assessment of positive and negative social impacts throughout the complete life cycle of all products in the full company organization
Specific in-depth experts for material impacts per business group.
Level of collaboration intern and external
Involvement of LCA dept/CSR department and one/few other departments, e.g. R&D/product development
Application in silos e.g., in product development or supply chain management.
Along the full supply chain in a Formalised set-up
Collaboration and dialogue with key internal and external stakeholders to ensure broad input.
Steps of assessment
Hot spot identification -Focus on one or limited number of lifecycle stages and limited number of stakeholder groups
Hot-spot identification and several full analyses, experience with all stakeholder groups
Full life-cycle analysis on targeted part of the product portfolio
Complete coverage of total product portfolio and their full lifecycle
Data collection methods
Generic/less advanced databases and data collection tools. Publicly available information
Input- output databases. Data input from T1 suppliers
Comprehensive databases existing, common (automated) data exchange regions exists. Use of integrated tools to have visibility in supply chain on relevant topics
Automated within own tools and databases (secure robust information and reliable data). Connection of all industries, creation of common datasets, commitment for joint activities for improvements
Incorporation in decision making
Not done Growing application and acceptance of results. Growing relevance to business.
Integrated in portfolio management systems. Explain how product social metrics is integrated in decision-making. Results support improvement programs and business value. Provide case examples of how social metrics have influenced decision-making processes.
Balanced decision making on positive and negative social and environmental impact throughout the complete life cycle of all products. Social improvements are key aspect for improvements of companies along the value chain
Level of reporting and communication
Limited, mainly internally or communicate that you participate in a group to learn about the method. In some benefits on user topics can be communicated.
Reporting on specific activities. Publication of cases. Comment on the ambition level of coverage over time (i.e., explain why the target level is e.g., 25%)
KPI’s are clear and transparent Progress via targets is reported. Communication on level of coverage and ambitions.
Full transparency in reporting on progress via targets and the methodology and processes used. External assurance on quality, accuracy and representativeness of results. Dialogue with external stakeholders
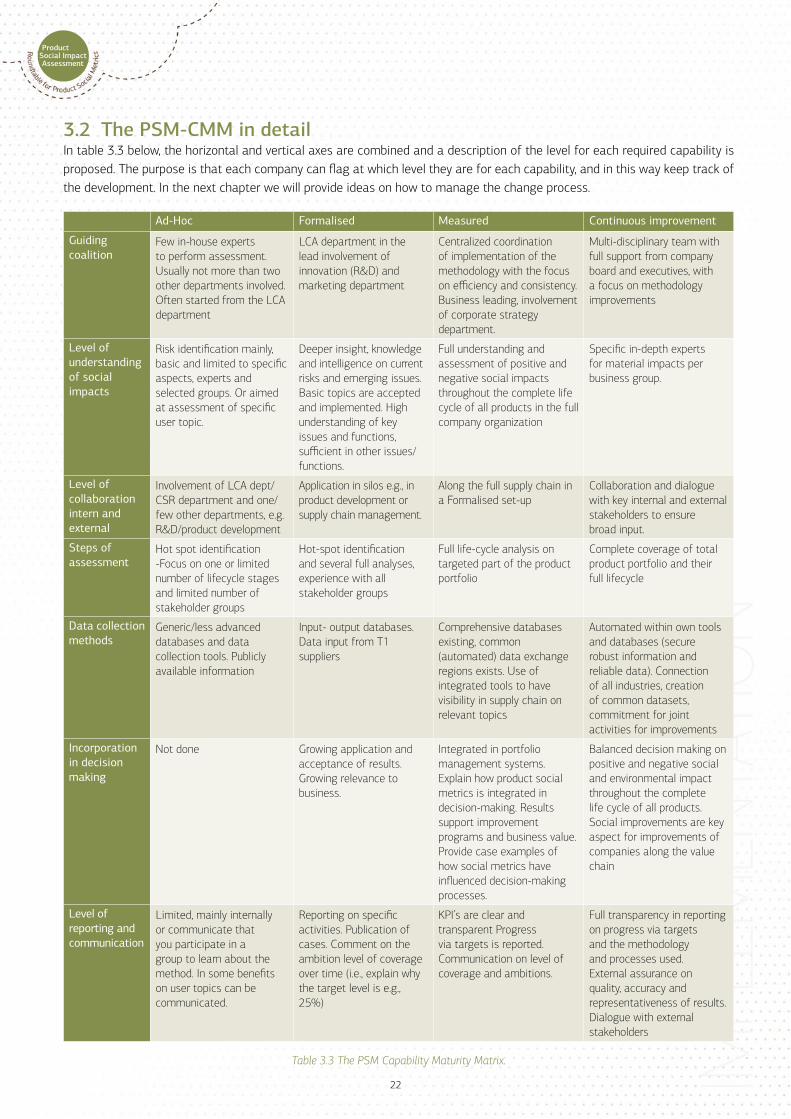
3.2 The PSM-CMM in detailIn table 3.3 below, the horizontal and vertical axes are combined and a description of the level for each required capability is proposed. The purpose is that each company can flag at which level they are for each capability, and in this way keep track of the development. In the next chapter we will provide ideas on how to manage the change process.
Table 3.3 The PSM Capability Maturity Matrix.
23
4 The Capability Maturity implementation process Implementing product social metrics in an organization requires the knowledge and skills of change-managemengt. During Phase 6 the members of the Roundtable used the 8 steps process of change-model of Kotter, alongside to the Natural Step ABCD Framework as inspiration to guide us through this change process.
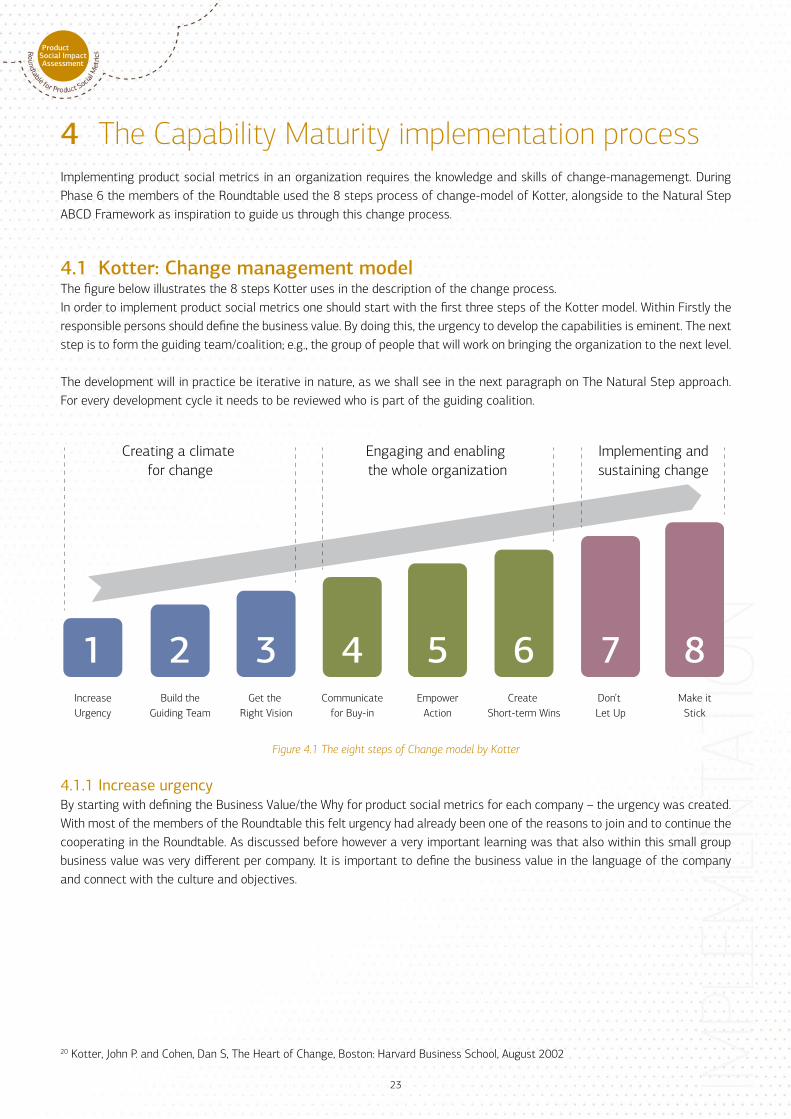
4.1 Kotter: Change management modelThe figure below illustrates the 8 steps Kotter uses in the description of the change process. In order to implement product social metrics one should start with the first three steps of the Kotter model. Within Firstly the responsible persons should define the business value. By doing this, the urgency to develop the capabilities is eminent. The next step is to form the guiding team/coalition; e.g., the group of people that will work on bringing the organization to the next level.
The development will in practice be iterative in nature, as we shall see in the next paragraph on The Natural Step approach. For every development cycle it needs to be reviewed who is part of the guiding coalition.
1 2 3IncreaseUrgency
Build theGuiding Team
Creating a climate for change
Engaging and enabling the whole organization
Implementing andsustaining change
Get the Right Vision
4Communicate
for Buy-in
5Empower
Action
6Create
Short-term Wins
7Don’t Let Up
8Make it
Stick
Figure 4.1 The eight steps of Change model by Kotter
4.1.1 Increase urgencyBy starting with defining the Business Value/the Why for product social metrics for each company – the urgency was created. With most of the members of the Roundtable this felt urgency had already been one of the reasons to join and to continue the cooperating in the Roundtable. As discussed before however a very important learning was that also within this small group business value was very different per company. It is important to define the business value in the language of the company and connect with the culture and objectives.
20 Kotter, John P. and Cohen, Dan S, The Heart of Change, Boston: Harvard Business School, August 2002
24
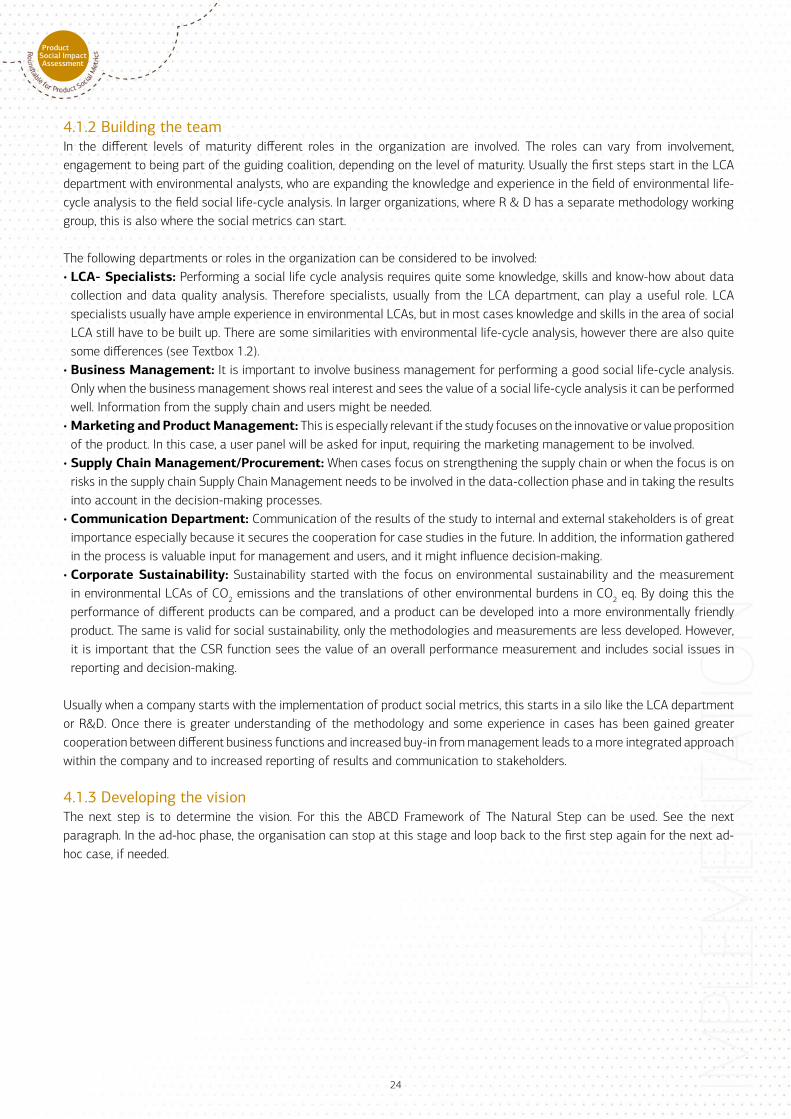
4.1.2 Building the teamIn the different levels of maturity different roles in the organization are involved. The roles can vary from involvement, engagement to being part of the guiding coalition, depending on the level of maturity. Usually the first steps start in the LCA department with environmental analysts, who are expanding the knowledge and experience in the field of environmental life-cycle analysis to the field social life-cycle analysis. In larger organizations, where R & D has a separate methodology working group, this is also where the social metrics can start.
The following departments or roles in the organization can be considered to be involved: • LCA- Specialists: Performing a social life cycle analysis requires quite some knowledge, skills and know-how about data
collection and data quality analysis. Therefore specialists, usually from the LCA department, can play a useful role. LCA specialists usually have ample experience in environmental LCAs, but in most cases knowledge and skills in the area of social LCA still have to be built up. There are some similarities with environmental life-cycle analysis, however there are also quite some differences (see Textbox 1.2).
• Business Management: It is important to involve business management for performing a good social life-cycle analysis. Only when the business management shows real interest and sees the value of a social life-cycle analysis it can be performed well. Information from the supply chain and users might be needed.
• Marketing and Product Management: This is especially relevant if the study focuses on the innovative or value proposition of the product. In this case, a user panel will be asked for input, requiring the marketing management to be involved.
• Supply Chain Management/Procurement: When cases focus on strengthening the supply chain or when the focus is on risks in the supply chain Supply Chain Management needs to be involved in the data-collection phase and in taking the results into account in the decision-making processes.
• Communication Department: Communication of the results of the study to internal and external stakeholders is of great importance especially because it secures the cooperation for case studies in the future. In addition, the information gathered in the process is valuable input for management and users, and it might influence decision-making.
• Corporate Sustainability: Sustainability started with the focus on environmental sustainability and the measurement in environmental LCAs of CO2 emissions and the translations of other environmental burdens in CO2 eq. By doing this the performance of different products can be compared, and a product can be developed into a more environmentally friendly product. The same is valid for social sustainability, only the methodologies and measurements are less developed. However, it is important that the CSR function sees the value of an overall performance measurement and includes social issues in reporting and decision-making.
Usually when a company starts with the implementation of product social metrics, this starts in a silo like the LCA department or R&D. Once there is greater understanding of the methodology and some experience in cases has been gained greater cooperation between different business functions and increased buy-in from management leads to a more integrated approach within the company and to increased reporting of results and communication to stakeholders.
4.1.3 Developing the visionThe next step is to determine the vision. For this the ABCD Framework of The Natural Step can be used. See the next paragraph. In the ad-hoc phase, the organisation can stop at this stage and loop back to the first step again for the next ad-hoc case, if needed.

25
4.1.4 Moving to next stepsWhen the ambition is set to develop further to the next level in the Maturity Matrix, it is important to have another look at the vision/desired state and assess the baseline/current state and the gap between the two. This will determine the actions that need to be taken to reach the desired state. For this another guiding coalition might be needed. More departments/roles will need to be involved and more attention is now necessary to develop more understanding and involvement from other departments. Very important is also the step to show short-term wins or “low hanging fruit”.
These can be the following:1. Identifications of risks in the supply chain that were not known or considered before2. Identifications of positive benefits for users in the use-phase
The last two steps of the Kotter model are especially important at the more advanced levels of the maturity matrix (measured and continuous improvement). Then it is important that there are persons responsible for continuing the focus on improving and utilizing the methodology and that also in cases where it does not work out as expected the benefits of the learnings are explained.
4.2 Self-assessment by the use of The Natural Step ABCD Framework The ABCD Framework® of The Natural Step21 (TNS) can be helpful to reach the full implementation of social metrics. It helps in growing from one level to the next. The Framework consists of four steps, which are repeated from level to level, when a company progresses and develops its maturity.
In the Roundtable, we asked companies to formulate the vision for the year 2030 and also to describe an intermediate target for 2023. In this way a vision is formed describing on which level the company aims to be.
Figure 4.2 ABCD Framework of The Natural Step
21 https://thenaturalstep.org/approach/

26
4.2.1 Step 1: A = Awareness and Visioning: The question that was asked is: “Where do you want to be with social metrics in 2030 and 2023?”By formulating the vision Step A of the TNS Framework is done. A stands for Awareness and it means that in this step you will develop an understanding of how the company foresees and plans to define product social metrics within the company, and what that will mean for stakeholders. This step will lead to a common understanding of the goal. By doing this the vision on what success will look like in the future is built within the organisation. It is important that the team, that is doing this, is encouraged to set ambitious goals, even if it is known that it will take a few years to achieve these goals. By doing this it will unleash innovation and release the company from preconceived limitations.
4.2.2 Step 2: B = Baseline Mapping. The end result of step 2 is a “gap analysis” of how your current activities are running compared to the vision you have for the coming years. In this way the critical issues and opportunities for change are identified.
Mapping the “Baseline”, is done through questions such as: • How much experience do you have with the application of product social metrics in case-studies• Who is currently involved with the application of PSM?• What (data) tools do you have experience with?• Is PSM applied in decision-making?
The results of the companies with this visioning and baseline exercise are shown in chapter 5.4
After the company has identified the gap between where the company stands today (the current reality) and where you want to go (vision) the next step is to think about what solutions there are to bridge this gap. The maturity matrix can then be used to determine the next activities and steps that can be taken within each area of development.
4.2.3 Step 3. C= Creative solutionsIn this step you determine via the actions you plan to take how to go from the current reality to the desired state. The team that is responsible for the implementation (the guiding coalition) is asked to brainstorm about solutions for the issues highlighted in the Baseline mapping. It is important to look backwards from the vision and to develop strategies to develop the capability areas and skills toward the desired goal. This is called back casting and it prevents people from developing strategies that just solve the problems of today. Instead, you begin with the end in mind and move towards the shared vision of the desired situation. Each action taken or planned provides a platform for further improvement.
27
4.2.4 Step 4. D= Priority settingOnce the opportunities and potential solutions are identified in the “C” step, the measures will be prioritized. It is important to start with what will move the organization to the desired outcome in the fastest way. This step supports an effective, step-by-step implementation and action planning. At this stage companies can pick the low hanging fruit that are fairly easy to implement and offer a rapid return on investment in order to build internal support and excitement for the process.
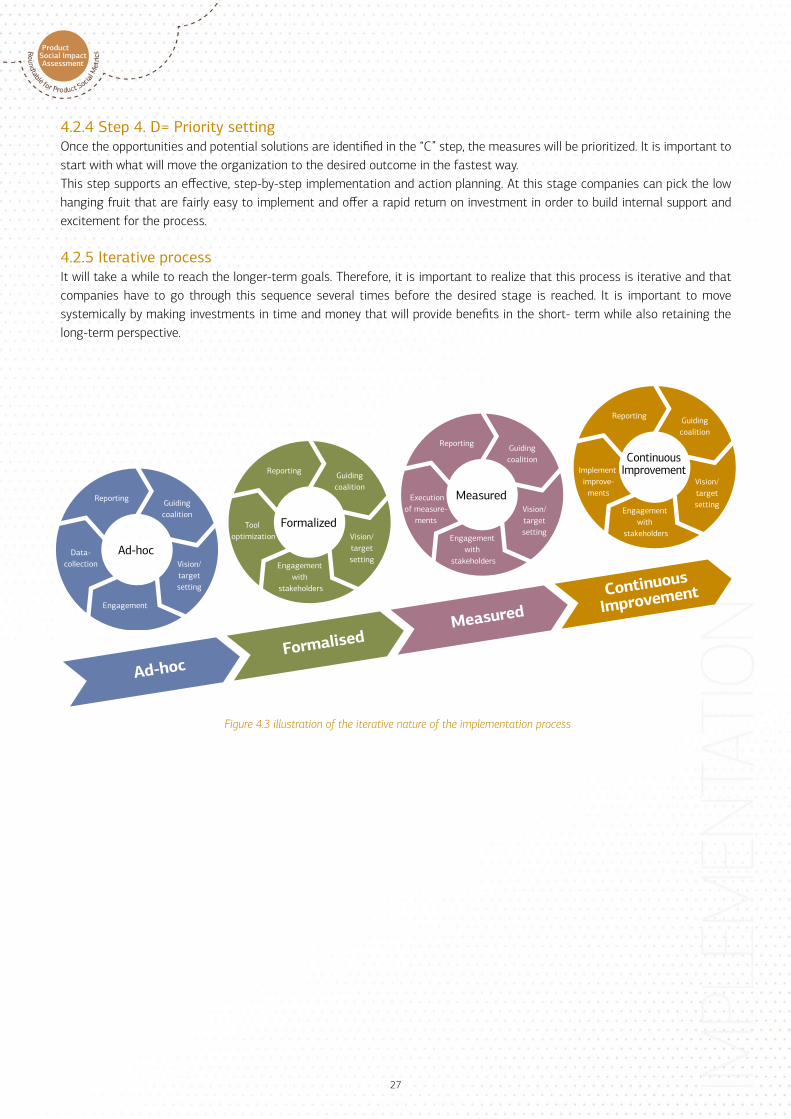
4.2.5 Iterative processIt will take a while to reach the longer-term goals. Therefore, it is important to realize that this process is iterative and that companies have to go through this sequence several times before the desired stage is reached. It is important to move systemically by making investments in time and money that will provide benefits in the short- term while also retaining the long-term perspective.
Ad-hocVision/targetsetting
Guidingcoalition
FormalizedVision/targetsetting
Guidingcoalition
MeasuredVision/targetsetting
Guidingcoalition Continuous
ImprovementVision/targetsetting
Engagement
Engagement with
stakeholders
Engagement with
stakeholders
Engagement with
stakeholders
Data-collection
Tool optimization
Execution of measure-
ments
Implement improve-
mentsReporting
Reporting
Reporting
Reporting Guidingcoalition
Figure 4.3 illustration of the iterative nature of the implementation process
Ad-hocFormalised
MeasuredContinuous
Improvement
28
5 Learnings from the case studies and CMM The objective of this chapter is to link the approaches above with the experiences the companies had and have in their activities around product social metrics. In this chapter we also will discuss the way the Capability Maturity evolved during the case studies.
5.1 Short overview of the cases and main learnings
During phase 6 the following members developed case studies using the PSIA Handbook. The summaries of some of the cases are in separate short reports and can be found in part 2 of this report and as separate reports on the website. This provided the opportunity to learn from each company where they are or how they developed by doing the case study.
5.1.1 CorbionCorbion performed a complete assessment with the title:
“Social impact of meat extended shelf life solutions- Corbion Learning journey”
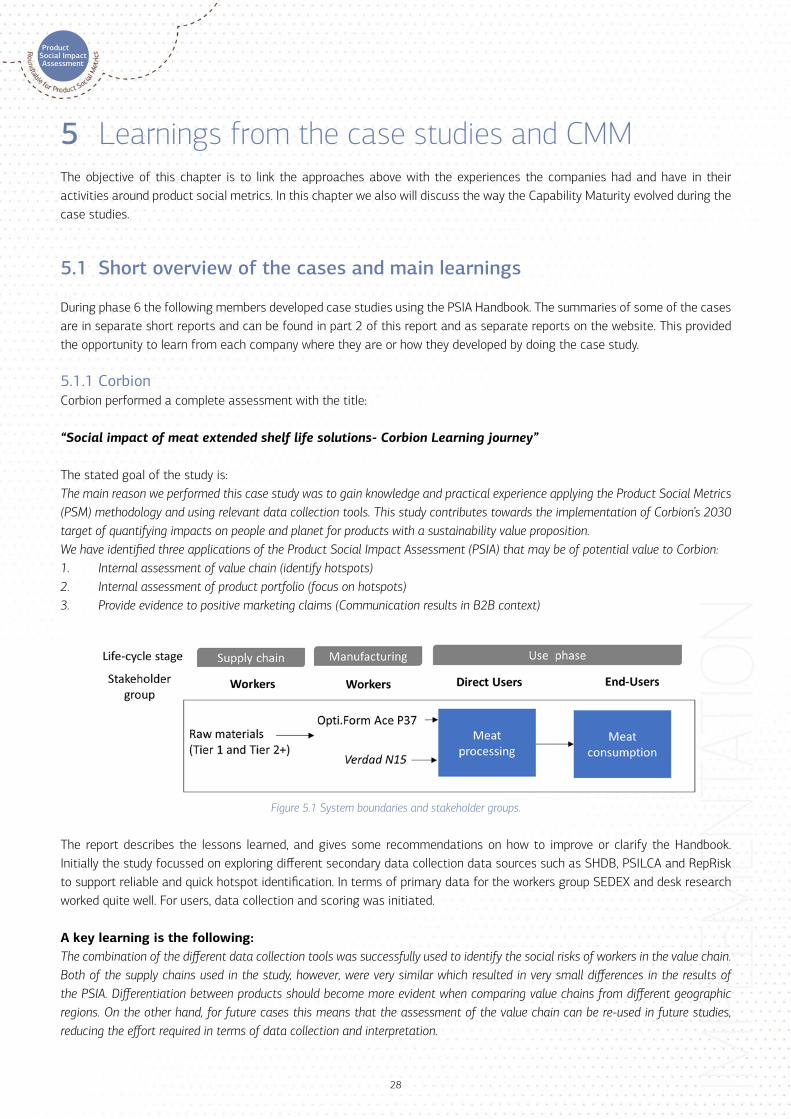
The stated goal of the study is:The main reason we performed this case study was to gain knowledge and practical experience applying the Product Social Metrics (PSM) methodology and using relevant data collection tools. This study contributes towards the implementation of Corbion’s 2030 target of quantifying impacts on people and planet for products with a sustainability value proposition.We have identified three applications of the Product Social Impact Assessment (PSIA) that may be of potential value to Corbion:1. Internal assessment of value chain (identify hotspots) 2. Internal assessment of product portfolio (focus on hotspots) 3. Provide evidence to positive marketing claims (Communication results in B2B context)
Figure 5.1 System boundaries and stakeholder groups.
The report describes the lessons learned, and gives some recommendations on how to improve or clarify the Handbook. Initially the study focussed on exploring different secondary data collection data sources such as SHDB, PSILCA and RepRisk to support reliable and quick hotspot identification. In terms of primary data for the workers group SEDEX and desk research worked quite well. For users, data collection and scoring was initiated.
A key learning is the following:The combination of the different data collection tools was successfully used to identify the social risks of workers in the value chain. Both of the supply chains used in the study, however, were very similar which resulted in very small differences in the results of the PSIA. Differentiation between products should become more evident when comparing value chains from different geographic regions. On the other hand, for future cases this means that the assessment of the value chain can be re-used in future studies, reducing the effort required in terms of data collection and interpretation.
29
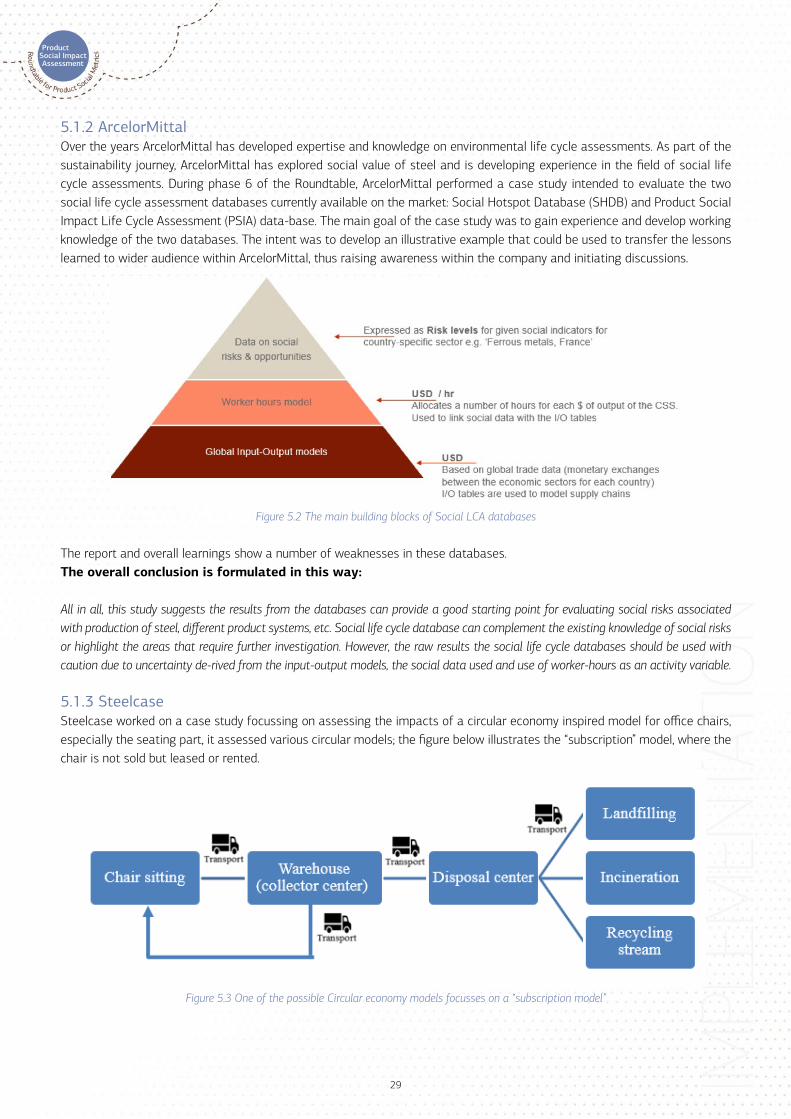
5.1.2 ArcelorMittalOver the years ArcelorMittal has developed expertise and knowledge on environmental life cycle assessments. As part of the sustainability journey, ArcelorMittal has explored social value of steel and is developing experience in the field of social life cycle assessments. During phase 6 of the Roundtable, ArcelorMittal performed a case study intended to evaluate the two social life cycle assessment databases currently available on the market: Social Hotspot Database (SHDB) and Product Social Impact Life Cycle Assessment (PSIA) data-base. The main goal of the case study was to gain experience and develop working knowledge of the two databases. The intent was to develop an illustrative example that could be used to transfer the lessons learned to wider audience within ArcelorMittal, thus raising awareness within the company and initiating discussions.
Figure 5.2 The main building blocks of Social LCA databases
The report and overall learnings show a number of weaknesses in these databases. The overall conclusion is formulated in this way:
All in all, this study suggests the results from the databases can provide a good starting point for evaluating social risks associated with production of steel, different product systems, etc. Social life cycle database can complement the existing knowledge of social risks or highlight the areas that require further investigation. However, the raw results the social life cycle databases should be used with caution due to uncertainty de-rived from the input-output models, the social data used and use of worker-hours as an activity variable.
5.1.3 SteelcaseSteelcase worked on a case study focussing on assessing the impacts of a circular economy inspired model for office chairs, especially the seating part, it assessed various circular models; the figure below illustrates the “subscription” model, where the chair is not sold but leased or rented.
Figure 5.3 One of the possible Circular economy models focusses on a “subscription model”

30
Such models clear impacts both the workers (refurbishing old seating can imply quite different working conditions compared to producing new chairs) and the users, who may experience different levels of comfort, or even impacts on privacy if data is somehow collected on the way the chair is used.
Collecting these data from refurbishment companies and users proves to be quite a challenge, but the preliminary conclusion so far is:
Overall, the outcome from this case study is that there is a very direct relationship between circular business models and the creation of new jobs as well as the creation of skills and knowledge, which leads to connections with the social impacts presented in the Handbook. The ‘Users’ stakeholder group may not be as affected by new business models when utilizing the social impacts in the Handbook 2018 methodology.
Data is lacking at the moment to fully assess the social impacts of ‘Users’ and ‘Workers’ in the three scenarios presented. The next steps are to determine what information is available within Steelcase through the Eco’Services business to understand more fully the refurbishment operations, as well as the disposal center impacts. By better understanding what we already have internally, we can then perform a more formal literature review of refurbishment and subscription models, as available.
5.1.4 DSMWith the newest version of the Handbook, DSM has initiated several studies on different product groups to test the methodology and engage the organization to understand the improved social impact assessment tool and identify benefits of its use. The product categories include materials such as recycled polyamide from fishing nets collected from the Indian Ocean, bio-based material from castor oil sourced from India and rapeseed sourced from Western Europe.Next to conducting the environmental impact assessment of the recycled polyamide from fishing nets, an assessment on social indicators has identified that the product has an extended positive social impact in terms of job creation and the development of new skills and knowledge of people working in the supply chain (i.e. collecting, sorting, cleaning and processing fishing nets)22.
Figure 5.4 Value chain mapping.
The learnings from these studies are helping to refine the process of applying product social metrics by aligning three level of assurance:1. Measures implemented at the organisational level. This relates to Business Code of Conduct, purchasing and Suppliers Code
of Conduct.2. Measures to ensure methodology is available (‘People+ Tool”) This supports teams to identify hotspots and take action.3. Measures to ensure a clear process to assess Product Social Metrics; this refers to the Plan-Do Check Act procedures for
all stakeholders around this project.
Main learning from the studies and implementation process:It is important to have both internal and external stakeholders on board, because challenges may arise when the results are communicated and interpreted. A benefit of conducting the assessment involving internal stakeholders is the engagement of different functions within the company which gives the opportunity to break down silos and combine different expertise to best assess the risk indicators. With the involvement of external stakeholders, e.g. customers, DSM was able to exchange knowledge about how risk indicators are evaluated, which other social indicators and stakeholders are relevant. It gives the opportunity for collaboration and strengthens external stakeholder relations.
Workers and local communities
Supplier polymer
DSM Engineering Plastics Customer
22 More information on https://www.dsm.com/markets/engineering-plastics/en/products/akulon/product-info/portfolio/akulon-repurposed.html
and on https://uk.reuters.com/video/2019/08/05/eco-surfboards-made-from-the-oceans-tras?videoId=583706132

31
5.1.5 NestléNestlé already explored several approaches using several methodologies to assess social impacts of different products and projects. The key issue Nestlé wanted to address this period was to link the scales in the Handbook to impact valuation. This will enable to link social programs to societal and business value generation in a financial unit. The intention is to present two outcomes:• The direct business costs or benefits for Nestlé as they occur today, but aren’t visible in the financial statements.• The costs or benefits to society, that could be allocated to Nestlé in the future (e.g. increased insurance fees for work-related
diseases, or an a government support on training programs that increase the productivity of supply chain workers).
Unfortunately the case study was delayed, but a short exploration was conducted in using the Handbook scales to assess and apply valuation on the Global Youth initiative . The results are too premature to publish, but the overall conclusions are:• There is a good match between the social topics defined in the Handbook and the issues that need to be addressed; there
are three components: • Income component: – 1.2 Remuneration for workers – 3.4 Employment in local communities – 4.1 Meeting basic needs for Small-scale entrepreneurs • Potential future additional income due to education (apprenticeships): – 1.2 Remuneration for workers • Reduced time to employment (Internships and traineeships): – 1.2 Remuneration for workers – 3.4 Employment in local communities • An experimental link between the health outcomes and the income levels provided a first idea how the 5- point scale
can be linked to valuation.Based on this there will be another case study in the following period.
5.1.6 BASFBASF did not develop a specific case study for the Roundtable, but has already established a formalised procedure to do assessments in a regular and streamlined mode. Here is what BASF says:
At BASF more and more, strategic decision-making processes require holistic sustainability assessments including social impacts. We developed our Social Analysis within the SEEbalance® method, see figure 5.6, based on the guidelines of the Handbook. A harmonized method that delivers meaningful results help decision-makers in their work to consider sustainability aspects based on a sound methodology. As it is common today to consider environmental impacts, it will be standard to consider social impacts as well. Furthermore, Social Analysis identifies improvement opportunities and can support the definition of priorities of activities.
The Social Analysis that BASF applies, delivers completely new findings because the approach is significantly different to the classical LCA approach and not just a repetition of an LCA with different figures. We extended that approach to agro business as well with the AgBalance method. Both methods are implemented by the sustainability strategy department and is run all over the world with the same approaches. That ensures the same mode of work and allows the comparison of findings as well as the collaboration with different sustainability centers in the world. Sustainability Strategy has the worldwide responsibility for the assessment methods and will implement applicable, accepted and harmonized methods based on different standards. ISO standards can play here an important role in the future. Furthermore, the workload must be acceptable, to generate a relatively high output of studies per year at reasonable costs. The results must be transferred to easy understandable final results to give guidance for non-experts as well.

32
The Social Analysis: • Follows the life cycle approach• Identifies social hot spots in the value chain• Allows a comparative assessment of different alternatives• Provides transparency on social risks and supports decision-making processes
• Use a scale-based approach for the risk assessment with four risk categories analog to databases or other initiatives
• Links Hot Spot Assessment results to UN Sustainability Development Goals (SDGs)
Figure 5.5 Illustration of SEEbalance® in a nutshell
5.2 The current and future state of capability development at the member companies
During the development of the cases companies exchanged views and ideas on how to self-assess their current and the desired future capability development. Below we summarise some of the findings and report what the companies are planning, the company inputs in the tables are in random order, to ensure confidentiality is kept. Please note that these were the results of thought exercises, and not formally approved by the management of the companies.
5.2.1 Guiding coalitionIn most cases the guiding coalition is in the team were also the LCA experts are (this differs per company).All companies have been describing how in 2023 or 2030 this needs to be strengthened, but there are differences in how companies see the best leader of the coalition. We got the following inputs:
Current baseline Target 2023 Ambition 2030
Corporate governance and implementation through corporate requirements and targets (BLS)
Innovation and marketing leading via added value for BGs. Sustainable portfolio management system linked through all relevant departments
Continuous improvement
Corporate sustainability Corporate sustainability Corporate sustainability
R&D, Corp Sust, Public Affairs, Purchasing As current, plus finance As in 2023, plus strategy per business/brand
R&D and Corporate Responsibility Corporate strategy team Corporate strategy team
Corporate Sustainability/Social Innovation Inside Product DevelopmentInside Procurement (?)
Table 5.1 How members see the development of the guiding coalition
5.2.2 Level of understanding of social impactsThe way social impacts have been defined is in general the reference for all members.
Nestlé has worked over a number of years with a range of approaches and has done or commissioned some case studies in order to experiment with these. One approach has been a case study based on the approach developed by Bo Weidema, who expresses all impacts in terms of DALY. Another experiment was in assessing the impacts of the traineeship into a monetary evaluation.
Low risk
High risk
Medium risk
Very high risk

33
Several comments were received that the Handbook is not clear enough on how to understand and apply a number of performance indicators; the case study of Corbion mentions a few bottlenecks. We also believe the Handbook should be expanded to incorporate some form of valuation as currently it is not possible to aggregate over social topics per supply chain actor.
Current baseline Target 2023 Ambition 2030
Understanding of social impacts/aspects based on overall sustainability knowledge – knowledge concentrated within a few teams
More widespread understanding of social impacts within R&D
Continuous improvement
No specific expertise internally.
High level of understanding of social topics and impacts, based on generic CSR/Sustainability knowledge.
Read the handbook & performed a few cases.
Two in-house experts to perform the assessment
Broad understanding of the social impacts (risks and positive impacts) of our product portfolio.
Multiple in house experts to perform the assessment
High in key corporate groups and selected BG functions. Limited to none in most of the rest of the organization
High in key corporate and BG functions (innovation, M&S, sourcing etc.). Sufficient level of awareness in other functions
Specific in-depth experts for material impacts per BG
Basic and Limited to specific aspects Basic topics are accepted and implemented Comprehensive databases existing, common data exchange for companies and regions exist
Table 5.2 How members see the development of understanding the impacts
5.2.3 Level of collaboration internally and externallyThere is a well-developed awareness of the need to connect to other internal departments and external stakeholders and to formalise this.
Current baseline Target 2023 Ambition 2030
R&D, innovation management, manufacturing community, M&S, Sourcing, branding & communication, HR involved ad-hoc. Current internal engagement not structurally optimized. Program in place for 2019External engagement with RTPSM, WBCSD, NGOs etc.
Sustainable portfolio management system embedded in relevant functions to assess impacts at key decision phasesImproved engagement with T1 suppliers, strategic customers and partners. On-going cultivation of key contacts with external experts and agencies
Full internal engagement, structured customer engagement, targeted consumer/general public engagement
Internal departments listed above and investor relations, BG and corporate management teams. Customers, consumers, suppliers, investors, shareholders, NGOs, rating agencies
As current As current
In specific cases Along the supply chain in a Formalised set-up Connection of all industries, creation of common datasets. Commitment for joint activities for improvements
Finance, Purchasing (int)Suppliers, Collaborations on IV/True Cost (ext)
Investors, banks, NGOs (ext) Governments/policy makers
Table 5.3 How members see the development of the internal and external cooperation
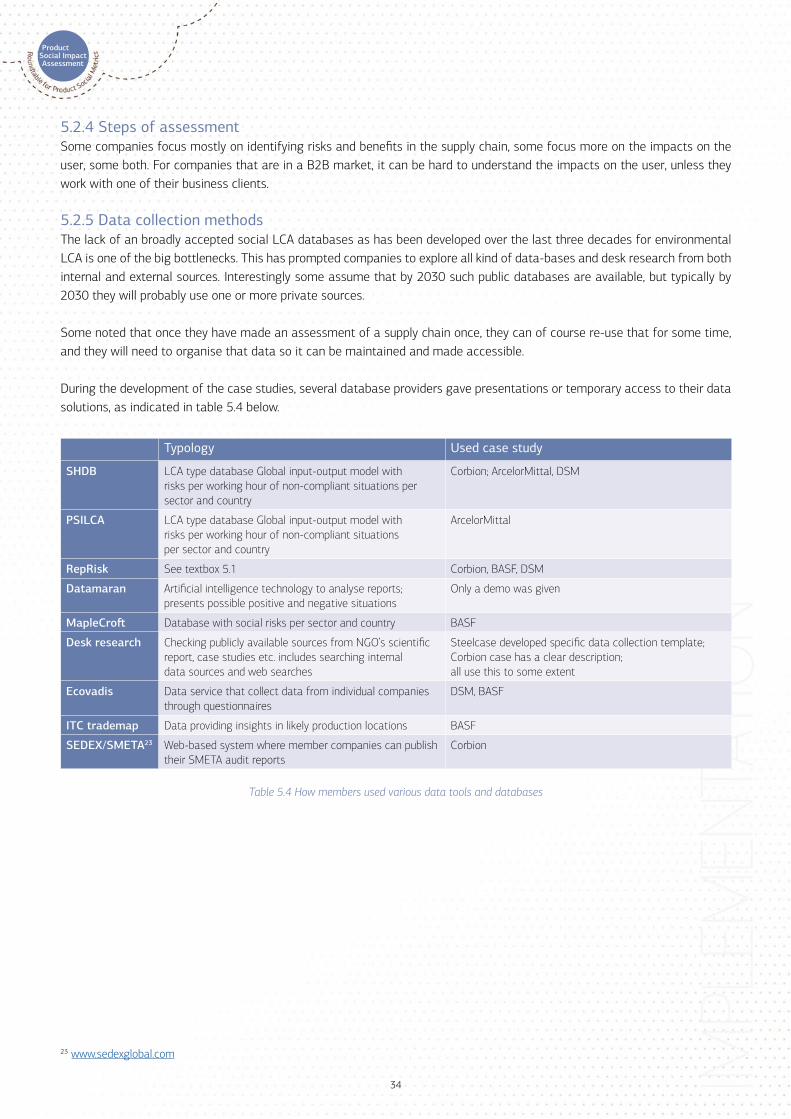
34
5.2.4 Steps of assessmentSome companies focus mostly on identifying risks and benefits in the supply chain, some focus more on the impacts on the user, some both. For companies that are in a B2B market, it can be hard to understand the impacts on the user, unless they work with one of their business clients.
5.2.5 Data collection methodsThe lack of an broadly accepted social LCA databases as has been developed over the last three decades for environmental LCA is one of the big bottlenecks. This has prompted companies to explore all kind of data-bases and desk research from both internal and external sources. Interestingly some assume that by 2030 such public databases are available, but typically by 2030 they will probably use one or more private sources.
Some noted that once they have made an assessment of a supply chain once, they can of course re-use that for some time, and they will need to organise that data so it can be maintained and made accessible.
During the development of the case studies, several database providers gave presentations or temporary access to their data solutions, as indicated in table 5.4 below.
Typology Used case study
SHDB LCA type database Global input-output model with risks per working hour of non-compliant situations per sector and country
Corbion; ArcelorMittal, DSM
PSILCA LCA type database Global input-output model with risks per working hour of non-compliant situations per sector and country
ArcelorMittal
RepRisk See textbox 5.1 Corbion, BASF, DSM
Datamaran Artificial intelligence technology to analyse reports; presents possible positive and negative situations
Only a demo was given
MapleCroft Database with social risks per sector and country BASF
Desk research Checking publicly available sources from NGO’s scientific report, case studies etc. includes searching internal data sources and web searches
Steelcase developed specific data collection template; Corbion case has a clear description; all use this to some extent
Ecovadis Data service that collect data from individual companies through questionnaires
DSM, BASF
ITC trademap Data providing insights in likely production locations BASF
SEDEX/SMETA23 Web-based system where member companies can publish their SMETA audit reports
Corbion
Table 5.4 How members used various data tools and databases
23 www.sedexglobal.com

35
The illustration 5.6 below summarises nicely how BASF uses a set of data tools.
Figure 5.6 Example of the application of product social metrics to guide investment decisions at BASF;
the names refer to data tools used; these are also described in chapter 3 of the Handbook
Current baseline Target 2023 Ambition 2030
Good internal processes for own data and key value chain risksDeveloping data input from T1 suppliers and key customers/partners
Automated internal data collection processes. Comprehensive database of T1 suppliers and key customers data. Improved insight into data further impacts up and down the value chain (beyond T1)
Publicly available SLCA databases to support own data gathering processes
Publicly available informationSedex, SMETA audit reportsSupplier code, specific questionnairesinput-output databases (PSILCA and SHDB)
Publicly available informationSedex, SMETA audit reports, other audit reportsSpecific databases to be determined (e.g. Maplecroft, RepRisk)Use of integrated tools to have visibility in supply chain on the relevant topics (e.g. Tracegains)
Publicly available informationSedex, SMETA audit reports, other audit reportsState of art databasesUse of integrated tools to have visibility in supply chain on the relevant topics (e.g. Tracegains)
Literature + internal departments + Databases like SHDB+ Data Collection system (like SupplyShift)
Fully developed internal database
Table 5.5 How members see the development of the access to data
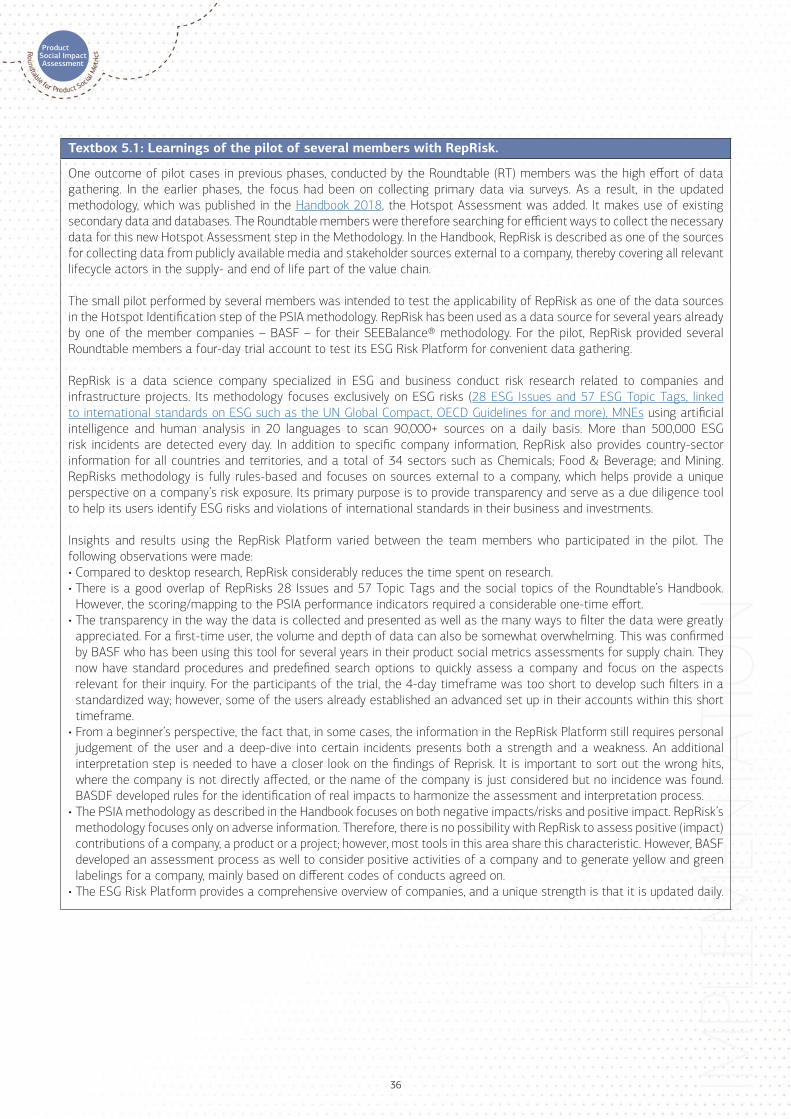
36
Textbox 5.1: Learnings of the pilot of several members with RepRisk.
One outcome of pilot cases in previous phases, conducted by the Roundtable (RT) members was the high effort of data gathering. In the earlier phases, the focus had been on collecting primary data via surveys. As a result, in the updated methodology, which was published in the Handbook 2018, the Hotspot Assessment was added. It makes use of existing secondary data and databases. The Roundtable members were therefore searching for efficient ways to collect the necessary data for this new Hotspot Assessment step in the Methodology. In the Handbook, RepRisk is described as one of the sources for collecting data from publicly available media and stakeholder sources external to a company, thereby covering all relevant lifecycle actors in the supply- and end of life part of the value chain.
The small pilot performed by several members was intended to test the applicability of RepRisk as one of the data sources in the Hotspot Identification step of the PSIA methodology. RepRisk has been used as a data source for several years already by one of the member companies – BASF – for their SEEBalance® methodology. For the pilot, RepRisk provided several Roundtable members a four-day trial account to test its ESG Risk Platform for convenient data gathering.
RepRisk is a data science company specialized in ESG and business conduct risk research related to companies and infrastructure projects. Its methodology focuses exclusively on ESG risks (28 ESG Issues and 57 ESG Topic Tags, linked to international standards on ESG such as the UN Global Compact, OECD Guidelines for and more), MNEs using artificial intelligence and human analysis in 20 languages to scan 90,000+ sources on a daily basis. More than 500,000 ESG risk incidents are detected every day. In addition to specific company information, RepRisk also provides country-sector information for all countries and territories, and a total of 34 sectors such as Chemicals; Food & Beverage; and Mining. RepRisks methodology is fully rules-based and focuses on sources external to a company, which helps provide a unique perspective on a company’s risk exposure. Its primary purpose is to provide transparency and serve as a due diligence tool to help its users identify ESG risks and violations of international standards in their business and investments.
Insights and results using the RepRisk Platform varied between the team members who participated in the pilot. The following observations were made: • Compared to desktop research, RepRisk considerably reduces the time spent on research. • There is a good overlap of RepRisks 28 Issues and 57 Topic Tags and the social topics of the Roundtable’s Handbook.
However, the scoring/mapping to the PSIA performance indicators required a considerable one-time effort.• The transparency in the way the data is collected and presented as well as the many ways to filter the data were greatly
appreciated. For a first-time user, the volume and depth of data can also be somewhat overwhelming. This was confirmed by BASF who has been using this tool for several years in their product social metrics assessments for supply chain. They now have standard procedures and predefined search options to quickly assess a company and focus on the aspects relevant for their inquiry. For the participants of the trial, the 4-day timeframe was too short to develop such filters in a standardized way; however, some of the users already established an advanced set up in their accounts within this short timeframe.
• From a beginner’s perspective, the fact that, in some cases, the information in the RepRisk Platform still requires personal judgement of the user and a deep-dive into certain incidents presents both a strength and a weakness. An additional interpretation step is needed to have a closer look on the findings of Reprisk. It is important to sort out the wrong hits, where the company is not directly affected, or the name of the company is just considered but no incidence was found. BASDF developed rules for the identification of real impacts to harmonize the assessment and interpretation process.
• The PSIA methodology as described in the Handbook focuses on both negative impacts/risks and positive impact. RepRisk’s methodology focuses only on adverse information. Therefore, there is no possibility with RepRisk to assess positive (impact) contributions of a company, a product or a project; however, most tools in this area share this characteristic. However, BASF developed an assessment process as well to consider positive activities of a company and to generate yellow and green labelings for a company, mainly based on different codes of conducts agreed on.
• The ESG Risk Platform provides a comprehensive overview of companies, and a unique strength is that it is updated daily.

37
Textbox 5.1 (continued): Learnings of the pilot of several members with RepRisk.
• Especially larger companies have a good coverage in RepRisk due to their saliency vis-à-vis media and stakeholders. RepRisk and the Institute of Applied Information Technology of Zurich University of Applied Sciences (ZHAW) have also launched an innovation project for automatic supply chain monitoring.
• The RepRisk Risk Index (RRI) score gives a very useful indication for a high number of companies whether there are any ESG risks linked to the company that is assessed. Customized scores are also available that can be tailored to a user’s specific ESG policies.
• If a company is not yet exposed to ESG risks but listed in RepRisk, RepRisk will identify it. If a company is not present in the RepRisk Platform, it is easy to put in a request to add this company to a Watchlist for monitoring purposes. This is seen as a large advantage of the RepRisk Platform.
Overall learnings:Overall RepRisk is a valuable tool to assist in the Hotspot assessment for companies in the value chain that are known by name and where there is no primary data (e.g., via EcoVadis) available. There is a good coverage/alignment on the social topics of the Handbook with the social topics in the ESG Risk Platform. The ESG Risk Platform is valuable in establishing a more efficient and systematic way of data collection in order to support decision-making.
5.2.6 Incorporation in decision makingThe common element is the ambition to support decision making in R&D processes, for instance in the gate stage model. This means the ambition is to develop better products form a social sustainability point of view. Portfolio analysis is also mentioned. This means the drivers mentioned in chapter 2 are also recognisable here.
Current baseline Target 2023 Ambition 2030
Non-Existent Formalised Continuous Improvement
In some cases applied All important decisions consider social aspects
Social improvements are key aspects for improvements of companies along the value chain
Not done Innovation portfolio/stage gate process Innovation portfolio/stage gate process
Supports BLS program and targets. Growing application, acceptance of results is good but relevance to business not always clear
Integrated in Sustainable Portfolio Management systems. Results supporting improvement programs and business value
Continuous improvement
Not done To some extent social aspects will be incorporated in the R&D decision making via the Sustainable Innovation tool
it will depend on the quality of data/trust-worthiness and ability to make conclusions → how well this sector will develop in the next few years.
Table 5.6 How members see the development of the incorporation in decision-making
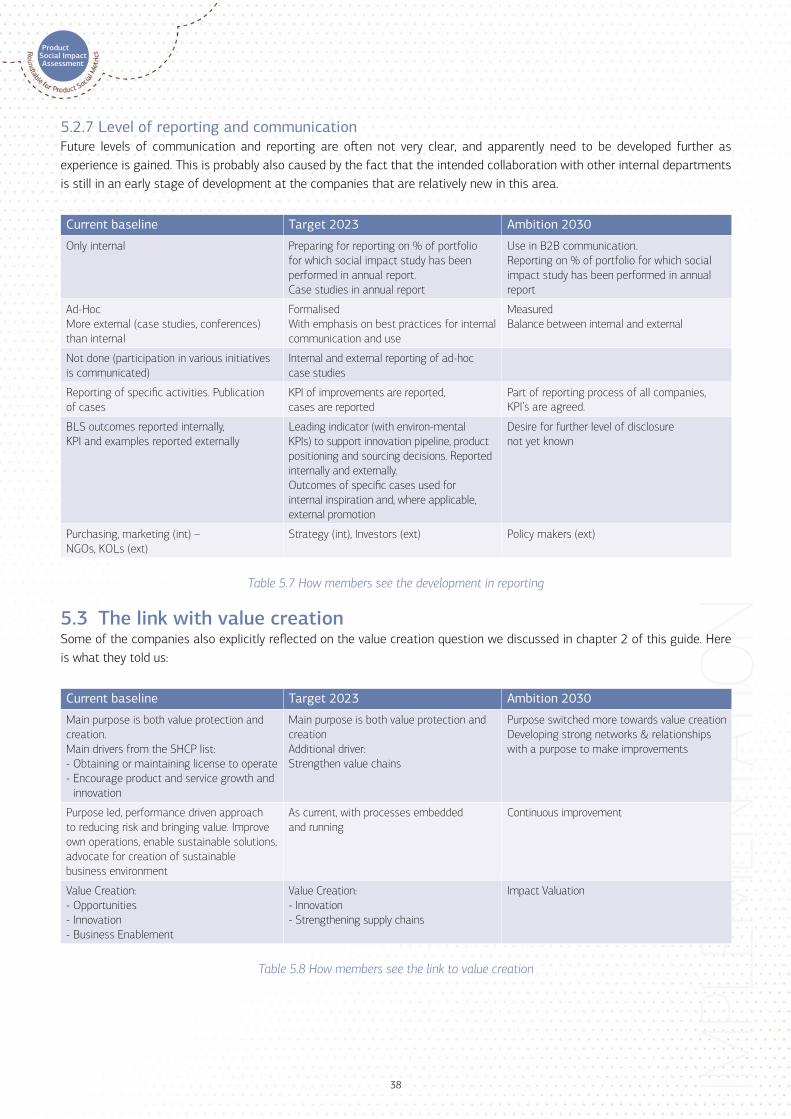
38
5.2.7 Level of reporting and communicationFuture levels of communication and reporting are often not very clear, and apparently need to be developed further as experience is gained. This is probably also caused by the fact that the intended collaboration with other internal departments is still in an early stage of development at the companies that are relatively new in this area.
Current baseline Target 2023 Ambition 2030
Only internal Preparing for reporting on % of portfolio for which social impact study has been performed in annual report. Case studies in annual report
Use in B2B communication. Reporting on % of portfolio for which social impact study has been performed in annual report
Ad-HocMore external (case studies, conferences) than internal
FormalisedWith emphasis on best practices for internal communication and use
Measured Balance between internal and external
Not done (participation in various initiatives is communicated)
Internal and external reporting of ad-hoc case studies
Reporting of specific activities. Publication of cases
KPI of improvements are reported, cases are reported
Part of reporting process of all companies, KPI’s are agreed.
BLS outcomes reported internally, KPI and examples reported externally
Leading indicator (with environ-mental KPIs) to support innovation pipeline, product positioning and sourcing decisions. Reported internally and externally.Outcomes of specific cases used for internal inspiration and, where applicable, external promotion
Desire for further level of disclosure not yet known
Purchasing, marketing (int) – NGOs, KOLs (ext)
Strategy (int), Investors (ext) Policy makers (ext)
Table 5.7 How members see the development in reporting
5.3 The link with value creationSome of the companies also explicitly reflected on the value creation question we discussed in chapter 2 of this guide. Here is what they told us:
Current baseline Target 2023 Ambition 2030
Main purpose is both value protection and creation.Main drivers from the SHCP list: - Obtaining or maintaining license to operate - Encourage product and service growth and
innovation
Main purpose is both value protection and creationAdditional driver: Strengthen value chains
Purpose switched more towards value creation Developing strong networks & relationships with a purpose to make improvements
Purpose led, performance driven approach to reducing risk and bringing value. Improve own operations, enable sustainable solutions, advocate for creation of sustainable business environment
As current, with processes embedded and running
Continuous improvement
Value Creation:- Opportunities- Innovation- Business Enablement
Value Creation:- Innovation- Strengthening supply chains
Impact Valuation
Table 5.8 How members see the link to value creation
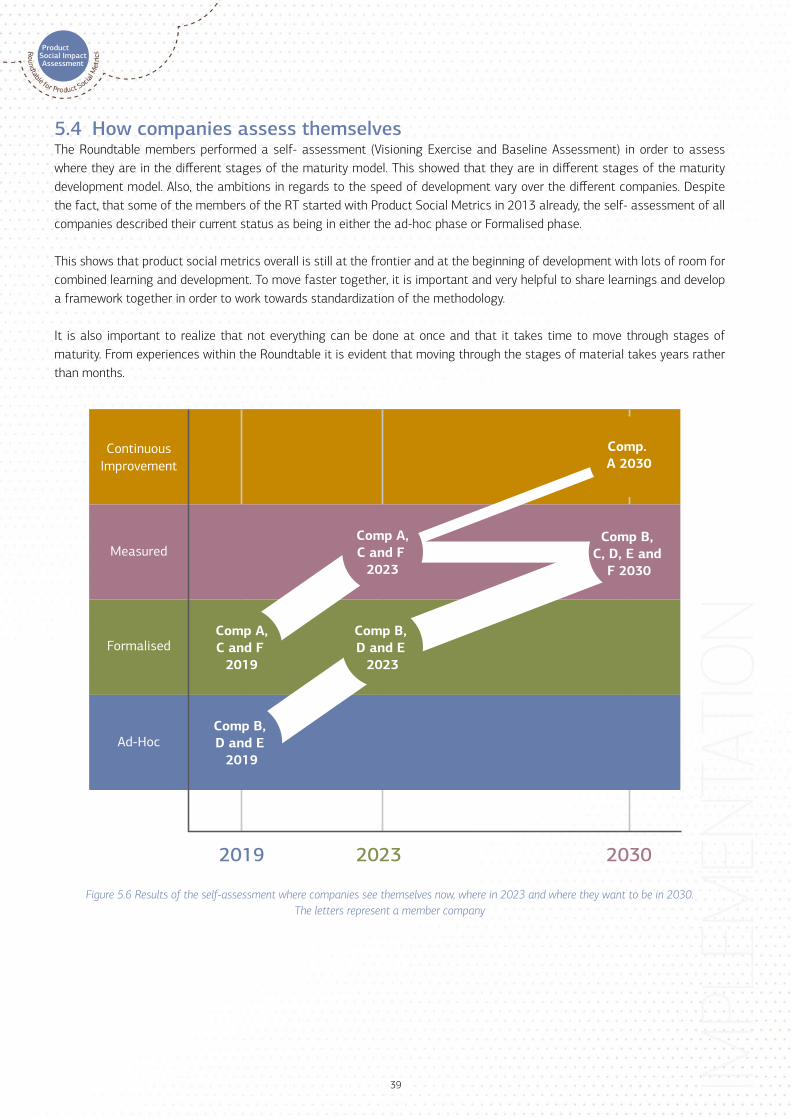
39
5.4 How companies assess themselvesThe Roundtable members performed a self- assessment (Visioning Exercise and Baseline Assessment) in order to assess where they are in the different stages of the maturity model. This showed that they are in different stages of the maturity development model. Also, the ambitions in regards to the speed of development vary over the different companies. Despite the fact, that some of the members of the RT started with Product Social Metrics in 2013 already, the self- assessment of all companies described their current status as being in either the ad-hoc phase or Formalised phase.
This shows that product social metrics overall is still at the frontier and at the beginning of development with lots of room for combined learning and development. To move faster together, it is important and very helpful to share learnings and develop a framework together in order to work towards standardization of the methodology.
It is also important to realize that not everything can be done at once and that it takes time to move through stages of maturity. From experiences within the Roundtable it is evident that moving through the stages of material takes years rather than months.
ContinuousImprovement
2019 2023
Ad-Hoc
Formalised
Measured
2030
Comp A,C and F
2023
Comp A,C and F
2019
Comp B, D and E
2019
Comp B, D and E
2023
Comp B, C, D, E and
F 2030
Comp. A 2030
Figure 5.6 Results of the self-assessment where companies see themselves now, where in 2023 and where they want to be in 2030. The letters represent a member company
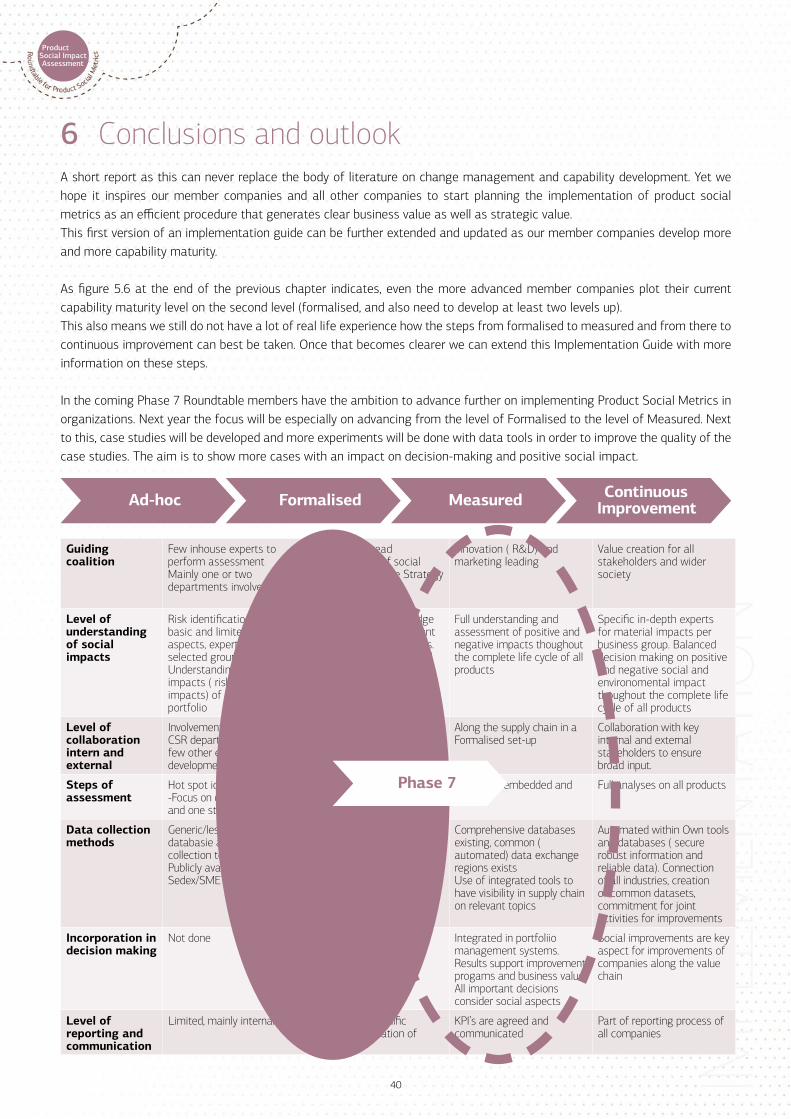
40
6 Conclusions and outlook A short report as this can never replace the body of literature on change management and capability development. Yet we hope it inspires our member companies and all other companies to start planning the implementation of product social metrics as an efficient procedure that generates clear business value as well as strategic value.This first version of an implementation guide can be further extended and updated as our member companies develop more and more capability maturity.
As figure 5.6 at the end of the previous chapter indicates, even the more advanced member companies plot their current capability maturity level on the second level (formalised, and also need to develop at least two levels up). This also means we still do not have a lot of real life experience how the steps from formalised to measured and from there to continuous improvement can best be taken. Once that becomes clearer we can extend this Implementation Guide with more information on these steps.
In the coming Phase 7 Roundtable members have the ambition to advance further on implementing Product Social Metrics in organizations. Next year the focus will be especially on advancing from the level of Formalised to the level of Measured. Next to this, case studies will be developed and more experiments will be done with data tools in order to improve the quality of the case studies. The aim is to show more cases with an impact on decision-making and positive social impact.
Guiding coalition
Few inhouse experts to perform assessmentMainly one or two departments involved
More widespread understanding of social impacts, Corporate Strategy Team involved
Innovation ( R&D) and marketing leading
Value creation for all stakeholders and wider society
Level of understanding of social impacts
Risk identification mainly, basic and limited to specific aspects, experts and selected groupsUnderstanding of social impacts ( risks and positive impacts) of the product portfolio
Deeper insight, knowledge and intelligence on current risks and emerging issues. Basic topics are accepted and implemented. High in key functions, sufficient in other functions
Full understanding and assessment of positive and negative impacts thoughout the complete life cycle of all products
Specific in-depth experts for material impacts per business group. Balanced decision making on positive and negative social and environomental impact thoughout the complete life cycle of all products
Level of collaboration intern and external
Involvement of LCA dept./CSR department and one/few other e.g. R&D/product development
Application in silos e.g., in product development or supply chain management.
Along the supply chain in a Formalised set-up
Collaboration with key internal and external stakeholders to ensure broad input.
Steps of assessment
Hot spot identicication -Focus on one lifecycle stage and one stakeholder group
Hots spot identification and several full analyses
Processes embedded and running
Full analyses on all products
Data collection methods
Generic/less advanced databasie and data collection toolsPublicly available informationSedex/SMETA reports
Input- output databasesData input from T1 suppliers
Comprehensive databases existing, common ( automated) data exchange regions existsUse of integrated tools to have visibility in supply chain on relevant topics
Automated within Own tools and databases ( secure robust information and reliable data). Connection of all industries, creation of common datasets, commitment for joint activities for improvements
Incorporation in decision making
Not done Growing application and acceptance or results. Growing relevance to business
Integrated in portfoliio management systems. Results support improvement progams and business value. All important decisions consider social aspects
Social improvements are key aspect for improvements of companies along the value chain
Level of reporting and communication
Limited, mainly internallly Reporting of spedific activites. Publication of cases
KPI’s are agreed and communicated
Part of reporting process of all companies
Ad-hoc Formalised Measured Continuous Improvement
Phase 7

This Implementation Guide has been prepared by PRé Sustainability
For more than twenty years PRé Sustainability has been at the forefront of life cycle thinking and has built on knowledge and experience in sustainability metrics and impact assessments to provide state of the art methods, consultancy and software tools. Internationally, leading organisations work with PRé to integrate sustainability into their product assessment and development systems in order to create business growth and value. PRé Sustainability has offices in the Netherlands and a global partner network to support large international or multi-client projects. PRé Sustainability is a trademark of PRé Consultants BV.
Please direct all questions to the PRé Sustainability office in the Netherlands.
PRé SustainabilityStationsplein 121 Phone +31 (0)33 455 50 223818 LE Amersfoort www.pre-sustainability.comThe Netherlands [email protected]
More background information about the Handbook, the Methodology Report, the Implementation Guide and the development process is available on www. Product-social-impact-assessment.com
Members of the Roundtable for Product Social Metrics (2018-2019):