Home | Pan American Silver - Technical Report for …...Pan American Silver Corp. (“Pan...
99
Technical Report for the Dolores Property, Chihuahua, Mexico Effective date: 31 December 2016 Prepared by: Martin Wafforn, P. Eng. Senior Vice President, Technical Services and Process Optimization Christopher Emerson, FAusIMM Vice President, Business Development and Geology Americo Delgado, P. Eng. Director, Metallurgy
Transcript of Home | Pan American Silver - Technical Report for …...Pan American Silver Corp. (“Pan...

Technical Report for the Dolores Property, Chihuahua, Mexico
Effective date: 31 December 2016
Prepared by:
Martin Wafforn, P. Eng. Senior Vice President, Technical Services and Process Optimization
Christopher Emerson, FAusIMM Vice President, Business Development and Geology
Americo Delgado, P. Eng. Director, Metallurgy

Pan American Silver Corp.
March 2017 1 of 98
Contents 1 Summary ........................................................................................................................................... 8
1.1 Introduction, property description, and ownership ..................................................................... 8
1.2 Geology and mineralization .......................................................................................................... 8
1.3 Status of exploration, development, and operations ................................................................... 9
1.4 Mineral resource and reserve estimates ...................................................................................... 9
1.5 Mining ......................................................................................................................................... 11
1.5.1 Mining methods .......................................................................................................................... 11
1.6 Infrastructure .............................................................................................................................. 11
1.7 Mineral processing and recovery methods ................................................................................ 11
1.8 Costs and economic analyses...................................................................................................... 12
1.9 Environmental, social, and community impact .......................................................................... 13
1.10 Conclusions and recommendations ............................................................................................ 13
2 Introduction .................................................................................................................................... 15
3 Reliance on other experts ............................................................................................................... 17
4 Property description and location .................................................................................................. 18
4.1 Location, issuer’s interest, mineral tenure, and surface rights .................................................. 18
4.2 Royalties, back-in rights, payments, agreements, and encumbrances ...................................... 20
4.3 Environmental liabilities ............................................................................................................. 20
4.4 Permits ........................................................................................................................................ 20
4.5 Significant factors and risks ........................................................................................................ 21
5 Accessibility, climate, local resources, infrastructure, and physiography ...................................... 22
5.1 Physiography and climate ........................................................................................................... 22
5.2 Accessibility, local resources, population centres, and transport .............................................. 22
5.3 Surface rights .............................................................................................................................. 22
5.4 Power and water ......................................................................................................................... 22
5.5 Infrastructure .............................................................................................................................. 23
6 History ............................................................................................................................................. 24
7 Geological setting and mineralization ............................................................................................ 25
7.1 Regional geology ......................................................................................................................... 25
7.2 Local geology ............................................................................................................................... 26

Pan American Silver Corp.
March 2017 2 of 98
7.3 Property geology ......................................................................................................................... 27
7.3.1 Lithostratigraphy ......................................................................................................................... 27
7.3.2 Intrusions .................................................................................................................................... 29
7.3.3 Structure ..................................................................................................................................... 30
7.3.4 Alteration .................................................................................................................................... 30
7.4 Mineralization ............................................................................................................................. 31
8 Deposit types .................................................................................................................................. 33
9 Exploration ...................................................................................................................................... 34
9.1 Exploration by Minefinders from 1993 to 2012.......................................................................... 34
9.2 Exploration by Pan American from 2012 to present .................................................................. 34
10 Drilling ............................................................................................................................................. 35
10.1 Drilling summary and database .................................................................................................. 35
10.2 Drilling by Minefinders from 1996 to 2012 ................................................................................. 36
10.3 Drilling by Pan American from 2012 to present ......................................................................... 36
10.4 Material impact on the accuracy and reliability of drilling results ............................................. 36
10.5 Conclusions and recommendations ............................................................................................ 37
11 Sample preparation, analyses, and security ................................................................................... 38
11.1 Sampling by Minefinders from 1996 to 2012 ............................................................................. 38
11.1.1 On-site sample preparation and security ................................................................................... 38
11.1.2 Laboratory sample preparation and analytical methods ............................................................ 38
11.1.3 Quality assurance and quality control ........................................................................................ 39
11.2 Sampling by Pan American from 2012 to present ...................................................................... 39
11.2.1 On-site sample preparation and security ................................................................................... 39
11.2.2 Laboratory sample preparation and analytical methods ............................................................ 40
11.2.3 Quality assurance and quality control ........................................................................................ 40
Certified standards .............................................................................................................................. 40
Blanks .................................................................................................................................................. 40
Duplicates............................................................................................................................................ 40
11.3 Bulk density ................................................................................................................................. 41
11.4 Conclusions and recommendations ............................................................................................ 41
12 Data verification .............................................................................................................................. 42

Pan American Silver Corp.
March 2017 3 of 98
12.1 Geology data reviews .................................................................................................................. 42
12.2 Mine engineering data reviews .................................................................................................. 42
12.3 Metallurgy data reviews ............................................................................................................. 42
12.4 Data adequacy ............................................................................................................................ 42
13 Mineral processing and metallurgical testing ................................................................................. 43
13.1 Introduction and previous work ................................................................................................. 43
13.2 Testing from 2012 to 2016 .......................................................................................................... 43
13.2.1 Pulp agglomeration study ........................................................................................................... 43
13.2.2 Cyanide leaching tests................................................................................................................. 44
13.2.3 Comminution and pilot plant tests ............................................................................................. 45
13.2.4 Load/permeability tests .............................................................................................................. 45
13.3 Metallurgical recovery model ..................................................................................................... 46
13.3.1 Heap leach................................................................................................................................... 46
13.3.2 Pulp agglomeration ..................................................................................................................... 47
13.4 Material issues and deleterious elements .................................................................................. 47
13.5 Conclusions ................................................................................................................................. 47
13.6 Recommendations ...................................................................................................................... 48
14 Mineral resource estimates ............................................................................................................ 49
14.1 Disclosure .................................................................................................................................... 49
14.2 Available data, preparation, and validation ................................................................................ 49
14.3 Geological interpretation and modelling .................................................................................... 50
14.4 Geostatistics ................................................................................................................................ 51
14.5 Variograms and grade interpolation ........................................................................................... 52
14.6 Block model ................................................................................................................................. 52
14.7 Bulk density ................................................................................................................................. 53
14.8 Estimation validation .................................................................................................................. 53
14.9 Confidence classification ............................................................................................................. 53
14.10 Planned dilution and loss ............................................................................................................ 53
14.11 Value estimates and mining constraints ..................................................................................... 54
14.12 Mineral resource tabulation ....................................................................................................... 55
14.13 Recommendations ...................................................................................................................... 56

Pan American Silver Corp.
March 2017 4 of 98
15 Mineral reserve estimates .............................................................................................................. 57
15.1 Disclosure .................................................................................................................................... 57
15.2 Planned dilution and loss ............................................................................................................ 57
15.3 Value estimates ........................................................................................................................... 57
15.4 Geotechnical parameters ............................................................................................................ 57
15.5 Pit design ..................................................................................................................................... 58
15.6 Underground design ................................................................................................................... 59
15.7 Mineral reserve tabulation ......................................................................................................... 60
15.8 Recommendations ...................................................................................................................... 60
16 Mining methods .............................................................................................................................. 62
16.1 Open pit operations .................................................................................................................... 62
16.1.1 Mining methods .......................................................................................................................... 62
16.1.2 Geotechnical and hydrological parameters ................................................................................ 62
16.1.3 Production and process rates and expected mine life ............................................................... 63
16.1.4 Waste mining .............................................................................................................................. 63
16.1.5 Mining fleet and machinery ........................................................................................................ 64
16.1.6 Recommendations ...................................................................................................................... 64
16.2 Underground operations ............................................................................................................ 65
16.2.1 Mining methods .......................................................................................................................... 65
16.2.2 Geotechnical parameters ............................................................................................................ 66
Geotechnical characterization ............................................................................................................ 66
Geotechnical recommendations ......................................................................................................... 66
16.2.3 Production and process rates and expected mine life ............................................................... 67
16.2.4 Waste mining .............................................................................................................................. 67
16.2.5 Mining fleet and machinery ........................................................................................................ 67
16.2.6 Recommendations ...................................................................................................................... 68
17 Recovery methods .......................................................................................................................... 69
17.1 Heap leach flow sheet ................................................................................................................. 69
17.2 Pulp agglomeration flow sheet ................................................................................................... 69
17.2.1 Plant design ................................................................................................................................. 70
17.2.2 Equipment and specifications ..................................................................................................... 71

Pan American Silver Corp.
March 2017 5 of 98
17.3 Power and water ......................................................................................................................... 74
18 Project infrastructure ...................................................................................................................... 75
18.1 Logistics ....................................................................................................................................... 75
18.2 Processing facilities ..................................................................................................................... 75
18.3 Auxiliary facilities ........................................................................................................................ 76
18.4 Waste storage and stockpile facilities ......................................................................................... 76
19 Market studies and contracts ......................................................................................................... 77
19.1 Contracts and marketing ............................................................................................................. 77
19.2 Review by the Qualified Person .................................................................................................. 77
20 Environmental studies, permitting, and social or community impact ............................................ 78
20.1 Environmental factors ................................................................................................................. 78
20.2 Environmental studies ................................................................................................................ 78
20.3 Pan American’s environmental policy ........................................................................................ 79
20.4 Permitting factors ....................................................................................................................... 79
20.5 Waste disposal ............................................................................................................................ 79
20.6 Site monitoring............................................................................................................................ 80
20.7 Water management .................................................................................................................... 80
20.8 Environmental certification ........................................................................................................ 80
20.9 Social and community factors ..................................................................................................... 80
20.10 Project reclamation and closure ................................................................................................. 81
20.11 Expected material environmental issues .................................................................................... 81
21 Capital and operating costs............................................................................................................. 82
21.1 Open pit mining costs ................................................................................................................. 82
21.2 Underground mining costs .......................................................................................................... 82
21.3 Processing costs .......................................................................................................................... 83
22 Economic analysis ........................................................................................................................... 85
22.1 Estimated life of mine plan ......................................................................................................... 85
22.2 Estimated cash flow forecast ...................................................................................................... 85
22.3 Estimated taxes, duties, and royalties ........................................................................................ 85
22.4 Assumptions ................................................................................................................................ 86
22.5 Sensitivity .................................................................................................................................... 86

Pan American Silver Corp.
March 2017 6 of 98
23 Adjacent properties ........................................................................................................................ 89
24 Other relevant data and information ............................................................................................. 90
25 Interpretation and conclusions ....................................................................................................... 91
25.1 Mineral resources and reserves .................................................................................................. 91
25.2 Mineral processing, metallurgical testing, and recovery methods............................................. 91
25.3 Mining and financial .................................................................................................................... 92
25.4 Environment and community ..................................................................................................... 93
26 Recommendations .......................................................................................................................... 94
26.1 Mineral resources and reserves .................................................................................................. 94
26.2 Mineral processing, metallurgical testing, and recovery methods............................................. 94
26.3 Mining and financial .................................................................................................................... 94
27 References ...................................................................................................................................... 95
Tables
Table 1.1 Dolores mineral resources as at December 31, 2016 ............................................................. 10 Table 1.2 Dolores mineral reserves as at December 31, 2016 ............................................................... 10 Table 2.1 Responsibilities of each qualified person ............................................................................... 16 Table 4.1 Mining concession details ....................................................................................................... 19 Table 10.1 Drillhole summary ............................................................................................................... 35 Table 13.1 Heap leach metallurgical recovery model .......................................................................... 46 Table 13.2 Heap leach metallurgical recovery kinetic model ............................................................... 46 Table 13.3 Pulp agglomeration metallurgical recovery model ............................................................. 47 Table 13.4 Pulp agglomeration metallurgical recovery kinetic model ................................................. 47 Table 14.1 Metallurgical recoveries by material type and process route ............................................ 54 Table 14.2 Economic parameters ......................................................................................................... 54 Table 14.3 Cost parameters .................................................................................................................. 55 Table 14.4 Dolores mineral resources as at December 31, 2016 ......................................................... 55 Table 15.1 Dolores mineral reserves as at December 31, 2016 ........................................................... 60 Table 16.1 Underground mining physicals summary ........................................................................... 66 Table 16.2 Major underground equipment .......................................................................................... 68 Table 17.1 Equipment specifications .................................................................................................... 72 Table 17.2 Pulp agglomeration reagent requirements ........................................................................ 74 Table 21.1 Open pit sustaining and operating costs ............................................................................ 82 Table 21.2 Underground initial and sustaining costs ........................................................................... 82 Table 21.3 Underground operating costs ............................................................................................. 83 Table 21.4 Pulp agglomeration initial and sustaining capital costs ...................................................... 83

Pan American Silver Corp.
March 2017 7 of 98
Table 21.5 Processing facility operating costs ...................................................................................... 84 Table 22.1 Processing and marketing parameters for the economic model........................................ 86 Table 22.2 Annual production schedule and cash flow forecast .......................................................... 88
Figures
Figure 4.1 Property location map ........................................................................................................ 18 Figure 4.2 Mining concessions and surface rights ............................................................................... 19 Figure 7.1 Tectono-stratigraphic terranes of Mexico .......................................................................... 25 Figure 7.2 Local geology map ............................................................................................................... 26 Figure 7.3 Stratigraphic and structural relations cartoon .................................................................... 27 Figure 7.4 Simplified Property geological map .................................................................................... 28 Figure 10.1 Drillhole location map ......................................................................................................... 35 Figure 13.1 Agglomerates formed from ground and filtered ore .......................................................... 44 Figure 14.1 Cross section of resource estimate, reserve pit design, and drillholes .............................. 50 Figure 14.2 Plan of mineralized trends .................................................................................................. 51 Figure 15.1 Reserve pit design ............................................................................................................... 58 Figure 15.2 Underground design ........................................................................................................... 59 Figure 17.1 Pulp agglomeration flow sheet ........................................................................................... 71 Figure 17.2 Pulp agglomeration plant layout ......................................................................................... 71 Figure 18.1 Mine infrastructure plan ..................................................................................................... 75

Pan American Silver Corp.
March 2017 8 of 98
1 Summary
1.1 Introduction, property description, and ownership This technical report refers to the Dolores property (the “Property” or “Dolores”), an open pit and underground silver-gold mine located in Chihuahua state, Mexico, approximately 250 kilometres (“km”) west of the city of Chihuahua. Pan American Silver Corp. (“Pan American”) owns the Property through its wholly owned subsidiary, Compañía Minera Dolores S.A. de C.V.
This technical report has been prepared to disclose relevant information about the Property which has resulted from mineral resource and reserve delineation drilling, updated mineral resource and reserve estimates, and an expansion of the Dolores mine currently underway to include a pulp agglomeration treatment option of the ore, and an underground mine to extract ore from beneath the planned pit limits.
1.2 Geology and mineralization Dolores occurs within the Sierra Madre Occidental volcanic belt, a metallogenic terrane well known for its epithermal precious metal deposits. The lower part of the arc comprises late Cretaceous to early Tertiary calc-alkaline batholiths and equivalent volcanosedimentary rocks referred to as the 'Lower Volcanic Series'. They represent magmatic activity about 80 to 40 million years ago and were followed by two periods of major ignimbrite eruption in the early Oligocene and early Miocene. Collectively these constitute the 'Upper Volcanic Series'.
The most important faults, from west to east, are the Chupacabras, San Francisco, and East faults. The San Francisco Fault and its footwall host most of the mineralization at Dolores. The immediate footwall and hangingwall of the San Francisco Fault form a 500 metre (“m”) wide northwest-striking corridor of igneous intrusions broadly following the fault.
Silver and gold mineralization at Dolores is hosted in north-northwest trending hydrothermal breccias and sheeted vein zones in the order of 5 m to 10 m wide. Most high grade mineralization occurs along three major structures that provided the conduit for metal-bearing fluids. Silver and gold mineralization identified on the surface at Dolores lies over an area 4,000 m long and up to 1,000 m wide. The extent of mineralization at depth and along strike has not yet been fully defined.
The highest grade mineralization occurs within the San Francisco Breccia, a well-defined and continuous hydrothermal breccia and stockwork zone that occurs in the immediate footwall of the post-mineral San Francisco Fault. The breccia trends further away from the fault towards the north until it joins a second major breccia zone known as the Alma Maria Breccia.
Hydrothermal breccias carry the highest silver and gold grades and pass outward into vein stock works. The veins are thin, rarely over 30 mm, and tend to occur as sheeted swarms. Economically mineable grades occur where the veins are sufficiently closely spaced.

Pan American Silver Corp.
March 2017 9 of 98
1.3 Status of exploration, development, and operations Pan American acquired the Dolores mine as part of the acquisition of Minefinders Corp. Ltd. (“Minefinders”) at the end of March 2012 and assumed control of mining operations in April 2012. As at December 31, 2016, approximately 25.4 million ounces of silver and 584,000 ounces of gold have been produced from modern operations at Dolores.
The central part of the silver-gold mineralization is well defined by nearly 1,400 drillholes. Diamond drilling takes place on an annual basis, testing the open regions of the deposit at depth and towards the south, and infilling existing patterns to upgrade the confidence categories of mineral resource and reserve estimates.
The mine infrastructure comprises the open pit and underground mine workings, processing facilities, heap leach pads, medium grade ore stockpiles, waste storage facilities, workshops, laboratories, storage facilities, offices, drill core and logging sheds, water and power lines, access roads, a light aircraft landing strip, an employee and construction camp, and recreational facilities. The pulp agglomeration plant is under construction and will be comprised of crushing, grinding, thickening, filtration, mixing, agglomeration, reagent, and auxiliary facilities.
The mine is currently expanding to include the development of a new 1,500 tonnes per day (“tpd”) capacity underground mine and the construction of a pulp agglomeration plant for processing the higher grade mined ore. The underground mine is scheduled to reach full production by the end of 2017 and the pulp agglomeration plant is planned to start operating in the second half of 2017.
1.4 Mineral resource and reserve estimates Pan American updates mineral resources and reserves on an annual basis following reviews of metal price trends, operational performance and costs experienced in the previous year, and forecasts of production and costs over the life of mine. Pan American conducts infill and near-mine drilling through much of the year.
The drillhole data cut-off date for the commencement of the geological interpretation and the mineral resource estimate was September 30, 2016 and the effective date of the mineral resource estimate is December 31, 2016. Mineral resources for Dolores as at December 31, 2016 are shown in Table 1.1. This tabulation includes open pit resources constrained within a mineral reserve pit design, underground resources below the reserve pit constrained within stope designs, and low grade stockpiled material. The mineral resources have been depleted for mining and stockpiles have been inventoried as at December 31, 2016. There are no known mining, metallurgical, environmental, permitting, legal, title, taxation, socio-economic, marketing, political, or other factors or risks that could materially affect the potential development of the mineral resources.

Pan American Silver Corp.
March 2017 10 of 98
Table 1.1 Dolores mineral resources as at December 31, 2016
Classification Tonnes (Mt) Ag ppm Ag contained metal (Moz) Au ppm Au contained metal (koz)
Measured 1.9 13 0.8 0.22 13.8
Indicated 3.2 24 2.5 0.43 44.0
Measured + Indicated
5.1 20 3.3 0.35 57.8
Inferred 1.7 37 2.0 1.01 54.6
Notes: Mineral resources do not have demonstrated economic viability. Totals may not add up due to rounding. Mineral resource estimates were prepared under the supervision of or were reviewed by Christopher Emerson, FAusIMM, Vice President, Business Development and Geology of Pan American. Mineral resources have been estimated using pulp agglomeration and/or heap leaching metal recovery and cost parameters. Metal prices used for the mineral resource estimate were $25 per ounce of silver and $1,400 per ounce of gold. Mineral resources are in addition to mineral reserves.
Mineral reserves for Dolores as at December 31, 2016, comprising open pit reserves constrained within a reserve pit and underground stopes, as well as stockpiled economic material, are shown in Table 1.2. The mineral reserves have been depleted for mining and stockpiles have been inventoried as at December 31, 2016. Mineral reserve estimates are based on assumptions that include mining, metallurgical, infrastructure, permitting, taxation, and economic parameters. Increasing costs and taxation and a fall in metal prices will have a negative impact on the estimation of mineral reserves. There are no known factors that may have a material impact on the estimate of mineral reserves at Dolores.
Table 1.2 Dolores mineral reserves as at December 31, 2016
Classification Tonnes (Mt) Ag ppm Ag contained metal (Moz) Au ppm Au contained metal (koz)
Proven 41.6 27 36.1 0.77 1,034.9
Probable 22.5 25 17.9 0.65 472.4
Proven + Probable
64.1 26 54.0 0.73 1,507.3
Notes: Totals may not add up due to rounding. Mineral reserve estimates were prepared under the supervision of or were reviewed by Martin Wafforn, P. Eng., Senior Vice President, Technical Services and Process Optimization of Pan American. Mineral reserves have been estimated using pulp agglomeration and/or heap leaching metal recovery and cost parameters. Metal prices used for the mineral reserve estimate were $18.50 per ounce of silver and $1,300 per ounce of gold.

Pan American Silver Corp.
March 2017 11 of 98
1.5 Mining
1.5.1 Mining methods Mining at Dolores has been ongoing since 2008 using conventional open pit methods with excavators, shovels, loaders, and haul trucks. Ore grade control drilling in the open pit is carried out to provide closer spaced sample data for a grade control estimate, which is used to mark out the ore and waste mining boundaries. Ore and waste are usually blasted separately to minimize ore loss, dilution, and material misclassification.
Underground mining of the deposit by long hole open stoping methods will occur concurrently with open pit mining. Full production is scheduled to be achieved by the end of 2017 and will be completed at approximately the same time as the open pit. After mining, the stopes will be filled with either cemented or uncemented rock fill.
1.6 Infrastructure The mine infrastructure comprises the open pit and underground mine workings, processing facilities, heap leach pads, medium grade ore stockpiles, waste storage facilities, conveyor systems, ponds, a power generation plant, a 115 kV power line connection to the national grid, and maintenance shops and warehouses.
The pulp agglomeration plant is under construction and will be comprised of crushing, grinding, thickening, filtration, mixing, agglomeration, reagent, and auxiliary facilities.
1.7 Mineral processing and recovery methods Broken ore is trucked to a crushing plant and crushed to a particle size of 80% of the particles passing (“P80”) 6.3 mm at a nominal rate of 16,200 tpd. The crushed ore product is conveyed to the leach pads via an overland conveyor system and placed on the pads using portable grasshopper conveyors and a radial stacking system. Drip and sprayer systems apply sodium cyanide solution to the heap leach pads for metal leaching.
When completed in mid 2017, the pulp agglomeration process will operate in an integrated fashion with the heap leach processing facilities. High grade run of mine material will crushed to P80 12.8 mm and milled in a rod mill and a Vertimill to P80 0.425 mm. The milled slurry will be pumped to a filter feed tank and dewatered in pressure filters to produce a filter cake with approximately 15% moisture. The filter cake will be broken, mixed with cement, blended with coarse medium grade ore, and tumbled in an agglomerator drum to form agglomerate balls. The agglomerate balls will be combined with crushed medium grade ore and conveyed to the heap leach pads.
The pregnant leach solution containing the dissolved silver and gold is pumped from the bottom of the pads to the Merrill-Crowe plant and processed through the circuit to trigger the precipitation of the silver and gold, and then the precipitate is pressed and dried. The dried material is melted in

Pan American Silver Corp.
March 2017 12 of 98
a furnace to form doré bars. The bars are transported to a third party refinery in North America for final recovery. The mine operates a closed circuit processing system without tailings facilities.
1.8 Costs and economic analyses For the open pit operation, sustaining capital expenditures are estimated to total $32.9 million over the remaining mine life, including general and administrative expenses (“G&A”). Mining costs are estimated to total $432.0 million to mine 240.4 million total ore and waste tonnes, including the cost of stockpiling and re-handling stockpiles over the life of the mine. G&A costs are estimated to total $156.2 million.
For the underground operation, the estimated capital cost is estimated at $82.3 million over the life of mine. Of this, $23.5 million can be considered initial capital, which includes costs incurred in 2017 and the cost of additional fleet capacity as the mine develops. The remaining sustaining capital is for development to access the stoping areas and equipment rebuilds. The total operating cost over the life of mine is $122.3 million, which equates to $29.97 per tonne of ore mined.
The initial capital cost estimate for the completion of design engineering, procurement, construction, and start-up of the pulp agglomeration plant is expected to be in the order of $73.0 million. Construction of the plant is underway and some of the capital expenditures occurred in 2016. Sustaining capital is estimated at $77.0 million, including $67.5 for heap leach pad expansion, $6.3 million for the processing plant, $1.7 million for the pulp agglomeration plant, and $1.5 million for the pad pumping system upgrade.
Processing operating costs are estimated at $469.3 million, including $251.4 million for crushing and heap leaching of coarse medium grade ore, $199.2 million for high grade ore processed through the pulp agglomeration plant, $15.2 million for solution recirculation and processing in the final years, and $3.5 million for Pad 1 material re-handling. Open pit and underground mining is estimated to be completed in 2024 while stacking of stockpiled material on the leach pads will continue for another two years. Thereafter a further three years of solution recirculation and precious metal extraction will follow during leach-down of silver and gold from the heap leach pads. Unit costs are $5.17 per tonne of ore for the coarse medium grade ore and $12.86 per tonne of ore for the pulp agglomeration high grade ore. The total produced ounces accounting for metallurgical recovery is estimated at 43.2 million ounces of silver and 1.1 million ounces of gold.
The life of mine plan for the mineral reserves as at December 31, 2016 is for processing a total of 52.6 million tonnes of ore from the open pit mine, 4.1 million tonnes of ore from the underground mine, and 7.4 million tonnes of ore currently placed on stockpiles and awaiting processing. The open pit mining requires the removal of 187.7 million tonnes of waste to access the ore, for a strip ratio of 1 ore to 3.6 waste. Crushing occurs at a rate of 16,200 tpd until mid-2017 following the completion of the pulp agglomeration plant and underground mine development, when the processing rate will increase to 20,000 tpd rate starting in 2018, including 14,400 tpd in the crushing circuit and 5,600 tpd in the pulp agglomeration circuit.

Pan American Silver Corp.
March 2017 13 of 98
The operating cash flow is estimated to total $807.0 million, which is comprised of an estimated revenue of $2,288.4 million, $1,179.9 million in operating costs, $16.3 million in smelting and refining charges, $71.2 million relating to Special Mining Duty of 7.5% applied to EBITDA, $11.4 million relating to the Extraordinary Mining Duty of 0.5% applied to the sales of gold and silver, $64.4 million on royalties payable to RG Mexico Inc., $11.4 million in reclamation expenditures net of salvage value, and $126.7 million in income taxes. After accounting for capital expenditures, the total net cash flow for the operation is estimated to be $584.2 million. The after tax NPV at a 6% discount rate is estimated at $432.4 million.
1.9 Environmental, social, and community impact The most significant environmental liabilities include surface disturbance and reclamation liabilities and issues related to the stability and containment system of heap leach Pad 1, which developed prior to Pan American’s acquisition of the Property. The pad has been stabilized and Pan American has implemented additional contingency measures in and around the heap leach pads.
An extensive program of community engagement activities is in place, including information sessions, infrastructure works, and educational and training programs for local people that have resulted in the establishment of several small businesses. Unskilled workers are sourced from nearby small villages, and the company has recruiting and training programs in place to develop the mining skills of the local workforce.
There are no known environmental or social issues that could materially impact the mine’s ability to extract the mineral resources or reserves.
1.10 Conclusions and recommendations Pan American acquired the Dolores mine in 2012 as part of the acquisition of Minefinders. Pan American has operated the mine since then, and has engaged in investments including building heap leach pad capacity, connecting the mine to the Chihuahua electrical grid with a power line, and the expansion currently underway to develop the underground mine and build the pulp agglomeration plant.
This technical report demonstrates that the mineral reserves in the mine plan are economic with the forecast metal prices and other assumptions. Based on the current mineral reserves, the mine is projected to continue to produce silver and gold until 2029.
There are no known drilling, sampling, or recovery factors that could materially impact the reliability of the drilling results used to estimate mineral resources and reserves. Pan American intends to continue annual near-mine diamond drilling programs to test the southern and down dip extents of the currently defined mineralization and to conduct regular infill drilling of the deposit to upgrade mineral resource and reserve confidence categories. Pan American will continue the sampling protocols and will monitor the issue encountered with some of the certified standards, as discussed in Section 11.2.3.

Pan American Silver Corp.
March 2017 14 of 98
There are no known significant risks and uncertainties that could reasonably be expected to affect the reliability or confidence in the mineral resource and reserve estimates. Pan American routinely conducts reconciliation of the reserve model to the grade control model and to the heap leach feed conveyor weight meter and sampler in order to monitor actual mine versus model performance.
Pan American will continue to monitor the stability of the pit walls on a routine basis with assistance from a geotechnical consultant. The geotechnical stope design parameters for the underground mine will be updated by a geotechnical consultant when sufficient development has been done within the mineralized zone to allow for analysis. Annual estimated costs for geotechnical monitoring, consulting support, drilling, testing, and instrumentation as necessary is in the order of $180,000.
For the heap leach only operation, the metallurgical recovery model created for the mineral resource and reserve estimate assumes gold recoveries of 77.9% for oxide and 68.3% for sulphide ores, and silver recoveries of 42.1% for oxide and 61.1% for sulphide ores. The kinetic model assumes a two year period to achieve ultimate gold recovery and ten to eleven years to achieve ultimate silver recovery for the oxides, and sulphides, respectively.
The metallurgical recovery model created for the pulp agglomeration of high grade mineralization assumes gold recoveries of 90.0% for oxide and 80.7% for sulphide material and silver recoveries of 58.7% for oxide and 78.8% for sulphide material. The kinetic model assumes a one year period to achieve ultimate gold recovery and two and three years to achieve ultimate silver recovery for oxide and sulphide material, respectively.
The load / permeability tests confirm the use of cement at 25 kg/t of milled ore to provide assurance that the agglomerates will remain stable in the heap leach stack at heights of up to 150 m. The pilot plant, including rod mill, filtration, and agglomeration, has provided a good degree of confidence for the sizing and design of the circuit.
Recommendations for additional metallurgical test work include load/permeability tests with full scale plant samples at the mine site to determine the permeability of the agglomerates under load charge to optimize the cement addition requirements. The cost of this test work is estimated at $39,000. Once operational, monthly column leach tests of samples from the pulp agglomeration plant will be conducted.
The operating cost assumptions for the underground mine and the pulp agglomeration plant will be updated when sufficient operational data is available.

Pan American Silver Corp.
March 2017 15 of 98
2 Introduction This technical report has been prepared by Pan American in compliance with the disclosure requirements of Canadian National Instrument 43-101 (“NI 43-101”), to disclose relevant information about the Dolores Property. This information has resulted from additional mineral resource and reserve delineation drilling, updated mineral resource and reserve estimates, and an expansion of the Dolores mine currently underway to include a pulp agglomeration treatment option of the ore and an underground mine to extract economic material from beneath the current pit limits.
The effective date of this technical report is December 31, 2016. The drilling data cut-off date for the geological interpretation and mineral resource estimation is September 30, 2016. The economic analysis to determine the appropriate cut-off values for reporting mineral resources and reserves was complete by December 31, 2016, and the in situ mineral resources and reserves were depleted for mining and stockpiles were inventoried as at December 31, 2016. No new material information has become available between these dates and the signature date given on the certificate of the qualified persons.
Pan American is a silver mining and exploration company listed on the Toronto (TSX:PAAS) and NASDAQ (NASDAQ:PAAS) stock exchanges.
Unless otherwise stated, information, data, and illustrations contained in this report or used in its preparation have been provided by Pan American for the purpose of this technical report. This technical report was prepared by Martin Wafforn, P. Eng., Senior Vice President, Technical Services and Process Optimization for Pan American, Christopher Emerson, FAusIMM, Vice President, Business Development and Geology for Pan American, and Americo Delgado, P. Eng., Director, Metallurgy for Pan American. Messrs. Wafforn, Emerson, and Delgado are qualified persons (“Qualified Persons”) as defined by NI 43-101 and are not independent of Pan American. The responsibilities of each co-author are provided in Table 2.1.
Mr. Wafforn visits the Dolores mine two or three times annually as part of his duties with Pan American. His most recent site visits were from December 5 to 7, 2016, on October 27, 2016, and from September 13 to 16, 2016. During these visits, Mr. Wafforn reviewed the operational open pit mine plan, actual mine operation data, the development advance and plans for the underground mine, the power line project, consultant’s geotechnical reports, mine budget plans, reserve to grade control to actual reconciliations, the site layout and logistics for mining and processing, safety protocols and indicators, the environmental layout, and general business performance.
Mr. Emerson visited Dolores from September 2 to 4, 2015, April 19 to 22, 2016, and on October 27, 2016. During these visits Mr. Emerson reviewed the exploration drilling, sampling, and sample security protocols, drill core and the core cutting and storage facilities, bench and surface mapping, cross sections, the operational mine plan, actual mine operation data, grade control protocols, mining leases, site access, surface rights information, and general business performance.

Pan American Silver Corp.
March 2017 16 of 98
Mr. Delgado visited the Property seven times in 2012 and 2013. His most recent site visits were from May 19 to 23, 2014 and from July 6 to 13, 2015. During those visits, Mr. Delgado reviewed the pulp agglomeration plant location, pilot plant testing and procedures, operational data, the heap leach facilities and expansion plans, the stacking system and stacking plans, water facilities, crushing plant facilities, metallurgical and analytical lab procedures, and general business performance.
Table 2.1 Responsibilities of each qualified person
Qualified Person Responsible for sections
Martin Wafforn, P. Eng. Senior Vice President, Technical Services and Process Optimization
1: Summary; 2: Introduction; 3: Reliance on Other Experts; 4: Property Description and Location; 5: Accessibility, Climate, Local Resources, Infrastructure and Physiography; 12: Data Verification; 15: Mineral Reserve Estimates; 16: Mining Methods; 19: Market Studies and Contracts; 20: Environmental Studies, Permitting and Social or Community Impact; 21: Capital and Operating Costs; 22: Economic Analysis; 24: Other relevant data and information; 25: Interpretation and Conclusions; 26: Recommendations; 27: References
Christopher Emerson, FAusIMM, Vice President, Business Development and Geology
1: Summary; 2 :Introduction; 6: History; 7: Geological Setting and Mineralization; 8: Deposit Types, 9: Exploration; 10: Drilling; 11: Sample Preparation, Analyses and Security; 12: Data Verification: 14: Mineral Resource Estimates; 23: Adjacent Properties; 25: Interpretation and Conclusions; 26: Recommendations
Americo Delgado, P. Eng., Director, Metallurgy
1: Summary; 2: Introduction; 12: Data Verification; 13:Mineral Processing and Metallurgical Testing; 17: Recovery Methods; 18: Project Infrastructure; 21: Capital and Operating Costs; 25: Interpretation and Conclusions; 26: Recommendations
Unless otherwise stated, all units are in metric and currencies are expressed in United States dollars. Project data coordinates are in a local coordinate based on a transformation relative to the Mexico 97 geoid.

Pan American Silver Corp.
March 2017 17 of 98
3 Reliance on other experts The Qualified Persons responsible for this technical report have not relied on the reports, opinions, and statements of other experts for the preparation of this technical report.

Pan American Silver Corp.
March 2017 18 of 98
4 Property description and location
4.1 Location, issuer’s interest, mineral tenure, and surface rights The Dolores mine is located in the state of Chihuahua, Mexico, approximately 250 km west of the city of Chihuahua, at 29°00’ North, 108°32’ West. Pan American has 100% ownership of the Dolores mine and the mining concessions, through its wholly owned subsidiary, Compañía Minera Dolores S.A. de C.V. A Google map of the Property location is shown in Figure 4.1.
Figure 4.1 Property location map
The Property mineral rights are held under three contiguous mining concessions with a total area of 27,700 hectares covering the entire mineral resources and reserves and surface infrastructure. Pan American makes the required payments to maintain the mining concessions and has agreements in place granting surface rights and legal access to the mining operations, and to Pan American’s knowledge, all obligations required for the conduct of mining operations at Dolores are currently in good standing. Details of the mining concessions are shown in Table 4.1. A plan of the mining concessions and surface rights relative to the pit outline as at December 31, 2016 is shown in Figure 4.2.
50 km

Pan American Silver Corp.
March 2017 19 of 98
Table 4.1 Mining concession details
Figure 4.2 Mining concessions and surface rights
Claim name Claim number Area (ha) Expiry date
Silvia 217587 2,866 August 20, 2052 Unificacion Real Cananea 227028 1,920 December 12, 2039
Dolores 221593 22,914 March 3, 2054

Pan American Silver Corp.
March 2017 20 of 98
4.2 Royalties, back-in rights, payments, agreements, and encumbrances A net smelter return of 2% on silver production and 3.25% on gold production is payable to RG Mexico Inc., a subsidiary of Royal Gold Inc. There are no other known back-in rights, payments, agreements, or encumbrances in place.
4.3 Environmental liabilities The most significant environmental liabilities associated with the Property include surface disturbance and reclamation liabilities and issues related to the stability and containment system of heap leach Pad 1, which developed prior to Pan American’s acquisition of the Property. A tear in the liner of Pad 1 developed in June 2010 following movement in the stability berm and significant leakage was collected by the leak collection system. Minefinders ceased stacking and irrigation on Pad 1 and relocated approximately 2 million tonnes of ore to heap leach Pad 2. The pad under the excavated material was examined and stabilized with an additional retaining wall structure, and the damaged liner was repaired. No sodium cyanide was detected in the downstream surface and ground water sampling points as a result of the failure, and continued soil and water sampling below Pad 1 has confirmed that no residual cyanide is present.
Approximately 6.4 million tonnes of ore remain in a stable state on Pad 1, awaiting transfer to another operational pad. Full remediation of the Pad 1 liner system will be required as the life of mine plan and leach pad capacity estimates indicate that the pad area will be required for use in the future. The additional costs associated with moving the ore and reconstructing the pad, as well as the additional metal production from the partially spent ore currently on Pad 1, have been accounted for in the life of mine plan.
Pan American has implemented additional contingency measures in and around the heap leach pads, including the installation of well riser type over-liner solution collection systems, additional under drain and leak collection systems, and a network of containment, monitoring, and demonstration wells. Pan American also engages in construction and expansions to the pads after application of rigorous quality control to both the design and construction of the facilities.
The surface disturbance and reclamation liabilities are addressed under Pan American’s project reclamation and closure plan, which is discussed in Section 20.10.
4.4 Permits Pan American holds all necessary environmental and operating permits for the development and operation of the mine and is in compliance with Mexican law.
The Mexican Secretariat of Environment and Natural Resources (“SEMARNAT”) approved permit applications for the construction and operation of Dolores, including an Environmental Impact Study or Manifestation (“MIA”), a Technical Justification Study for Change of Land-Use, and an Environmental Risk Study in April 2006. These studies include a full assessment of the environmental and social impacts of the mine and environmental management plans, which describe the ongoing management and environmental monitoring programs.

Pan American Silver Corp.
March 2017 21 of 98
Other principal permits include an Accident Prevention Program, a Surface Water Extraction Authorization, an MIA for an underground exploration ramp, and a Waste Management Plan. A permit for the construction and operation of the pulp agglomeration plant was obtained in 2016.
There are some minor boundary differences between the MIA and Change of Land Use permits that occur in various areas of the Dolores site, including the location of the pulp agglomeration plant. The resolution of the boundary differences will be the subject of a “regularization” process that is not anticipated to have a material impact on the operation of the pulp agglomeration plant. Permits for the operation of the underground mine are currently in progress. These permits are renewed regularly and as far as Pan American is aware, all of the permits required for the mine and processing operations are in good standing.
Modifications to the existing permits will be necessary to obtain authorization for future activities such as adjustments to the life of mine open pit operations, waste rock facilities, and leach pads. Any modification application for these activities will require an updated MIA, Environmental Risk Assessment, and Technical Justification Study for Land Use Change. The required technical baseline studies and impact assessment for these updates would be based on the extensive monitoring database that has been developed, and conducted by an independent environmental consultant. Due to the minor changes in footprint and the overall impacts that these changes imply, as well as the current good standing of the existing permits, it is expected that the necessary permit modifications could be completed within standard regulatory timeframes of five to eight months.
4.5 Significant factors and risks There are no known significant factors or risks that may affect access, title, or the right or ability to conduct mining, processing, and exploration at Dolores.

Pan American Silver Corp.
March 2017 22 of 98
5 Accessibility, climate, local resources, infrastructure, and physiography
Information in this section is referenced and updated from Chlumsky, et. al. (2011).
5.1 Physiography and climate The topography at the mine site is rugged, with elevations ranging from 1,200 m to 2,000 m above sea level. The vegetation ranges from thorn scrub and cactus to oak and pine forests at higher elevations. Average annual temperatures are 18° C, with annual lows of -10° C and high of 45° C. Annual precipitation averages around 250 mm, with much of it occurring between July and September as brief heavy rainstorms. Short-lived snowfall is common in December and January. Mining and exploration work may be carried out year round.
5.2 Accessibility, local resources, population centres, and transport The main road access to the Property is via 92 km of unpaved roads leading north from Federal Highway 16, near Yepachic, Chihuahua. An unpaved landing strip suitable for light aircraft is located about 8 km from the mine and provides access for personnel. The nearest major population centre is the city of Chihuahua, located 250 km to the east. Employees travel to the mine either by road or by light aircraft, while materials come by road.
The local economy is based on logging, ranching, and subsistence farming. The company sources unskilled workers from nearby small villages, and has recruiting and training programs in place to develop the local workforce. Much of the mine workforce is sourced from the town of Ciudad Madera located 50 km east of Dolores, the city of Chihuahua, and the city of Hermosillo in the state of Sonora, located 350 km to the west. Both Sonora and Chihuahua states have an established mining culture and provide a pool of experienced workers, as well as vendors and contractors who provide services to the site.
5.3 Surface rights Ejido Huizopa owns the majority of the surface rights on the Property. An ejido is an area of communal land registered with the National Agrarian Registry of Mexico and parcelled out to community members for agricultural use. Pan American has surface rights agreements with Ejido Huizopa and with several individual members of the Ejido Huizopa dating from November 2006, which allows for irrevocable access and the right to carry out exploration and mining activities for a term of 15 years with a right to extend for a further 15 years. These surface rights provide sufficient access to the mining operations and facilities.
5.4 Power and water Water for the operations is sourced from wells, pit and underground dewatering activities, the nearby Tutuaca River, and from the Chabacan dam. In recent years, the water supply from mine dewatering and precipitation on the leach pads and Chabacan Dam catchment has been sufficient for process needs without requiring any extraction from the Tutuaca River. The Chabacan dam reservoir has a capacity of 1.2 million m3 and provides storm water control as well as primary water

Pan American Silver Corp.
March 2017 23 of 98
storage. The permitted water usage from the Tutuaca River is 2.0 million m3 per annum at a maximum rate of 64 litres per second and the water extraction permit remains in good standing should it be required in the future.
A 115 kV, 98 km long power line connected to the Mexican national grid in 2016 supplies power to the mine and is sufficient for the current needs of the operation. Back up power is available on site by six 1,800 kilowatt (“kW”) Cummins and two 1,200 kW Caterpillar diesel generators. The total power requirements of the operations including the open pit and underground operations and processing facilities is estimated at 17 MW, although this may increase if the water pumping requirements in the underground are more than currently projected. A rented generating set is currently providing the additional temporary requirements for the construction of the pulp agglomeration plant. Projected power requirements in the future will be met by new grid infrastructure currently under construction.
5.5 Infrastructure The infrastructure includes the typical components of an operating open pit and underground mine, including the mine workings, the processing facilities, heap leach pads, medium grade ore stockpiles, waste rock storage facilities, surface ventilation fans servicing the underground workings, workshops, laboratories, storage facilities, offices, drill core and logging sheds, water and power lines, access roads, a light aircraft landing strip, an employee and construction camp, and recreational facilities. A plan of the infrastructure on the Property is shown in Figure 18.1.

Pan American Silver Corp.
March 2017 24 of 98
6 History Information in this section is referenced and updated from Chlumsky, et. al. (2011).
Placer mining began in the region of the Dolores mine in the 1860s and was followed by lode mining in 1898. A power line from the town of Madera was installed in 1915, and a 25 tpd stamp mill began treating the Dolores ore until the mill was destroyed by fire in early 1929. Only sporadic production occurred from 1929 to 1931, after which there are no records of any historical production. Incomplete mining records from between 1922 and 1931 indicate that approximately 372,000 tonnes of ore containing over 116,000 ounces of gold and 6 million ounces of silver were produced from several underground operations, including Dolores.
The Property lay idle until 1993 when Minefinders began acquiring a land position in the district. Minefinders began a full exploration program in November 1995 and commenced diamond drilling and reverse circulation drilling in September 1996. In July 1996, Minefinders granted Echo Bay Mines (“Echo Bay”) an option in the Property, and Echo Bay commenced drilling, sampling, environmental data collection, and metallurgical testing. Minefinders bought back the option, including the information collected by Echo Bay, in October 1997.
A number of historical mineral resource estimates have been prepared for the Property since 1997. In 2003, Minefinders commenced a feasibility study to evaluate various process options and in June 2005 disclosed a mineral reserve estimate and the results of a technically and financially feasible operation involving open pit mining operations and heap leaching of silver and gold. Minefinders then undertook detailed engineering and optimization of the mine plan as well as updates to the mineral resource and reserve estimates.
Construction of the mine began at the end of 2006, with the commissioning period completed in January 2009. The processing facilities included a crushing plant, conveying and stacking facilities, leach pads, solution ponds, and Merrill-Crowe and refining facilities. The first doré was produced in November 2008 and commercial production began in May 2009. During the 2008 to 2011 period, Minefinders mined 25.5 million tonnes and stacked 18.3 million tonnes of ore on the leach pads, producing 210,660 ounces of gold and 6.2 million ounces of silver. The remaining medium grade material is stored in stockpiles for later treatment.
Pan American acquired the Property from Minefinders at the end of March 2012 and assumed control of mining operations in April 2012. Pan American has operated the mine since then, and has built increased heap leach pad capacity, connected the mine to the Chihuahua electrical grid with a power line, and is currently expanding the mine to develop the underground mine and build the pulp agglomeration plant. The expansion project is on schedule for anticipated commissioning of the pulp agglomeration plant by mid-2017 and underground operations reaching full design capacity by the end of 2017.
As at December 31, 2016, approximately 25.4 million ounces of silver and 584,000 ounces of gold have been produced from modern operations at Dolores.

Pan American Silver Corp.
March 2017 25 of 98
7 Geological setting and mineralization Information in this section is referenced from Pratt (2013).
7.1 Regional geology Pre-Tertiary rocks in northern and mid-Mexico comprise a jigsaw of oceanic and island arc terranes (Campa and Coney, 1983). Figure 7.1 shows a regional map of the northwest trending tectono-stratigraphic terranes of Mexico, as redrawn from Campa and Coney (1983). Strike-slip movement played an important role in assembling the terranes and continue to the present day.
Dolores is located within the Sierra Madre Occidental volcanic belt, an arc formed by eastward subduction of the Pacific Plate. The Sierra Madre is a metallogenic terrane well known for its epithermal precious metal deposits. The lower part of the arc comprises late Cretaceous to early Tertiary calc-alkaline batholiths and equivalent volcanosedimentary rocks referred to as the 'Lower Volcanic Supergroup' or 'Lower Volcanic Series'. They represent magmatic activity during the Laramide orogeny (about 80 to 40 million years ago) and were followed by two periods of major ignimbrite eruption in the early Oligocene and early Miocene. Collectively these constitute the 'Upper Volcanic Supergroup' or 'Series'. Minor andesite/basalt flows and rhyolitic domes accompanied the ignimbrites. Many Mexican low sulphidation epithermal deposits probably developed during the first ignimbrite phase, in a window between 40 and 27 million years ago (Camprubí et. al., 2003).
Figure 7.1 Tectono-stratigraphic terranes of Mexico

Pan American Silver Corp.
March 2017 26 of 98
7.2 Local geology The local geology shown in Figure 7.2 is based on the 1:250,000 Madera (H12-9) and Tecoripa (H12-12) sheets produced by the Servicio Geológico Mexicano.
Bedding dips are mostly sub horizontal and gently undulating. The maps show a strong north-northwest structural grain defined by many faults, some with apparent normal offsets. Some of these regional faults likely had a syn-depositional history, controlling local basins.
Dolores lies about 42 km north-northeast of the Mulatos high sulphidation epithermal gold deposits and 82 km north-northwest of Pinos Altos. Pinos Altos, a low sulphidation epithermal vein system, lies on the northeast rim of the Ocampo Caldera. This 30 km diameter caldera hosts a district of epithermal gold-silver deposits, including the Ocampo mine.
Figure 7.2 Local geology map

Pan American Silver Corp.
March 2017 27 of 98
7.3 Property geology
7.3.1 Lithostratigraphy Field observations indicate that the contacts between the Lower and Upper Volcanic Series comprise mostly faults, as shown in Figure 7.3 (not to scale). The most important faults, from west to east, are the Chupacabras, San Francisco, and East faults. The San Francisco and its footwall host most of the mineralization on the Property.
Figure 7.3 Stratigraphic and structural relations cartoon
Lower Volcanic Series A simplified geological map of the Property is shown in Figure 7.4. The Lower Volcanic Series consists of a lower andesitic sequence overlain by latites. The main andesitic outcrop forms a wide strip of alternating dark and light green units between the San Francisco and East faults. It is the main host for mineralization and is cut by a swarm of north-northwest striking dikes. Dark green units comprise massive, porphyritic andesite and basaltic andesite with feldspar and clinopyroxene phenocrysts. The light units are either strongly amygdaloidal andesite or monomict andesitic breccias (autobreccias and transported volcanic breccias). Peperite forms at the bases of some andesite by the interaction of igneous rock and wet sediments. Other rock types in the Lower Volcanic Series include thin acid welded and crystal-rich tuffs, as well as bedded sandstones between andesite lava flows.

Pan American Silver Corp.
March 2017 28 of 98
Figure 7.4 Simplified Property geological map

Pan American Silver Corp.
March 2017 29 of 98
The andesitic sequence is overlain by several massive porphyritic latites, with minor tuffaceous sediments. Their geometry is tabular and stratiform and likely formed as lava flows and/or sills. The main outcrop forms a wide strip between the Chupacabras and San Francisco Faults. The latites are about 250 m thick and the base is apparently conformable. Latite crops out extensively around the heap leach pads and forms cliffs at Cerro Colorado (shown in Figure 7.3). It also occurs widely on the west side of the San Francisco Fault, up to the Chupacabras Fault. It forms most of the high west wall of the open pit.
Fresh latite is purplish grey and comprises isolated feldspar phenocrysts within a very fine grained groundmass. The rock is locally flow banded, but to a much lesser extent than the latite dikes at Dolores. The latites are widely hydrothermally altered and weather like a plutonic rock, with onionskin form, or are friable and crumbly, with a red colour caused by extensive hematite alteration of disseminated pyrite. The source of the latite is unclear. There is no obvious 'root' to indicate a volcanic neck or eruptive center. However, they are texturally identical to the swarm of latite dikes at Dolores. Overbay et. al. (2001) suggests they may have been erupted from a diorite-diatreme complex present in the pit.
Upper Volcanic Series The Upper Volcanic Series comprises a bimodal sequence of rhyolite/obsidian, basalt, pumice-rich lapilli tuffs and volcaniclastic rocks of possible caldera margin origin. It is well exposed on the two main access roads to the mine and is preserved west of the Chupacabras Fault. The tabular or lens-shaped rhyolites show widespread, flat-lying flow banding. Scattered perlitic obsidian layers in the rhyolite contain large spherulites with drusy zeolites, quartz, and minor amethyst.
The amygdaloidal and oxidised basalts are probably thin lava flows, and have peperitic bases. The geological map shown in Figure 7.4 shows all other lithologies as volcaniclastics (labelled “Volc”). These comprise crystal tuffs, green non-welded pumice-rich lapilli tuffs, crystal-rich sandstones, and conglomerates with a mostly sub horizontal orientation.
The topographically, and stratigraphically, highest rocks comprise a thick porphyritic andesite flow (labelled “UAnd” in Figure 7.4), which is overlain by a basalt underlying the Dolores airstrip.
The Baucarit Formation comprises polymict conglomerates, sandstones, and scattered basalts. To the east of the East fault, the formation sits directly on latites of the Lower Volcanic Series, and the Upper Volcanic Series appears to be absent, an indication of the importance of fault control on sedimentation and volcanism at Dolores.
7.3.2 Intrusions The immediate footwall and hangingwall of the San Francisco Fault form a 500 m wide northwest-striking corridor of igneous intrusions broadly following the fault. However, there is a tendency for dikes to strike slightly clockwise and there are also some splits and north-northeast jogs.
There is a great variety of intrusive types and field relations indicate that some are pre- and post-mineralization. There are no isotopic dates, but the intrusions are probably of Eocene to Oligocene

Pan American Silver Corp.
March 2017 30 of 98
age and are broadly contemporaneous with mineralization. The rocks with the most plutonic character occur in the central area of the deposit, where a steep-sided barren microdiorite stock, 500 m in diameter, straddles the San Francisco Fault. Coinciding with high grade mineralization, it comprises weakly porphyritic diorite and marginal parts comprise porphyritic quartz diorite with potassium feldspar-rich aplitic groundmass. Age relations are not clear, but it appears to be cut by latite dikes. Exposures in the pit walls show very complex intrusive relationships, including diorite chilled against possibly intrusive andesite. Deep drilling shows a range of intrusive types in this area, including porphyritic granodiorite and an unusual amygdaloidal porphyritic andesite. Probable diatreme occurs in drill holes, but does not appear to crop out. Overbay et. al. (2001) suggests that some of the intrusions pass upwards into flow-domes.
The dike swarm at Dolores is dominated by latite. This phase cuts the plutonic and sub volcanic rocks and is clearly younger. It comprises strongly flow-banded rock, with isolated feldspar phenocrysts, oriented parallel to the dike contacts, generally dipping steeply west. The latite dikes are visually indistinguishable from the latite lavas of the Lower Volcanic Series, which is an obstacle to geological interpretation. There were clearly several pulses of intrusion as evidenced by the presence of xenoliths of early latite varieties within later latites. The latite is in turn cut by late andesite dikes with a strong trachytic texture.
7.3.3 Structure The sequence at Dolores is broadly flat lying and suffered no significant compressional deformation after the Late Cretaceous. The major faults show large post-Pliocene (post-Baucarit) normal offsets. However, complications in the stratigraphic sequence indicate an older history. Subtle changes in dip, internal angular unconformities, wedges, and missing strata all imply that the major faults controlled sedimentation and volcanism.
The Chupacabras Fault throws down rocks to the west by about 200 m to 400 m while the East Fault drops the Baucarit Formation down to the east by about 350 m. The San Francisco Fault throws down latite lavas by about 300 m to 500 m to the west and is marked by a corridor of dikes and stocks. The overall geometry is therefore horst-like. The Upper Volcanic Series appears much thicker to the west of Chupacabras.
Although each major fault has an apparent normal offset, there is also evidence of strike-slip movement. The clockwise orientation of dikes relative to faults, along with north-northeast dike jogs, suggests a component of dextral strike-slip during intrusion and mineralization. All of the principal faults suffered major post-mineral (post-Pliocene) reactivation. The San Francisco Fault shows smectite-rich gouge with milled vein fragments, locally with amethyst. Fabrics within the foliated gouge confirm mostly normal offsets.
7.3.4 Alteration The andesitic rocks of the Lower Volcanic Series show widespread, locally intense, propylitic alteration (chlorite + epidote + calcite + pyrite). Epidote is locally abundant (>15%), giving rocks a skarn-like appearance. The wide distribution of propylitic alteration suggests it is semi-regional,

Pan American Silver Corp.
March 2017 31 of 98
perhaps due to burial metamorphism. Propylitic alteration also affects the dioritic rocks of the stock-diatreme complex.
In contrast, the low sulphidation system created advanced argillic (pyrite + clay) alteration of the latite lavas of the Lower Volcanic Series. Pyrite commonly replaces original biotite phenocrysts. The suite of clay minerals include montmorillonite, smectite, kaolinite, sericite, and illite. Advanced argillic alteration is directly correlated to the distance of the mineralized structures as a function of structure size, vein widths, and the presence of hydrothermal breccias. The alteration dies out abruptly in the west, probably along a steep front, between the Chupacabras and San Francisco Faults. At deeper levels, light green sericite haloes occur around veins and hydrothermal breccias.
The principal and most important alteration is silicification, which increases with the presence of mineralization, and ranges from weak to strong, pervasive, massive, residual, and pseudo-vuggy.
7.4 Mineralization Silver and gold mineralization at Dolores is hosted in north-northwest trending hydrothermal breccias and sheeted vein zones in the order of 5 m to 10 m wide. Most high grade mineralization occurs along three major structures that provided the conduit for metal-bearing hydrothermal fluids. Silver and gold mineralization identified on the surface at Dolores lies over an area 4,000 m long and up to 1,000 m wide, at elevations ranging between 1,100 m to 1,700 m above sea level. The extent of mineralization at depth and along strike has not yet been fully defined.
The highest grade mineralization occurs within the San Francisco Breccia, a well-defined and continuous hydrothermal breccia and stockwork zone that occurs in the immediate footwall of the post-mineral San Francisco Fault. The breccia trends further away from the fault towards the north until it joins a second major breccia zone known as the Alma Maria Breccia. Other high grade zones split and re-join, forming diamond-shaped structures and steeply pitching mineralization shoots. The San Francisco Fault marks a profound drop in grade and the hangingwall is mostly devoid of silver and gold mineralization.
A sub-vertically pitching mineralization shoot occurs where the San Francisco and Alma Maria Breccias meet, parallel to the intersection. Clearly, this was a site of increased permeability for hydrothermal fluids. High grades also occur in the diorite stock-diatreme complex in the pit. The diorite formed an ideal brittle host for fracture, allowing more extensive brecciation and stock working. It may also have been the main upflow centre for hydrothermal fluids.
Mineralization is generally associated with quartz and may be composed primarily of iron oxides, silver sulphosalts, electrum, and native gold in the oxidized zone and with pyrite, silver sulphides, native silver, visible gold, galena, and sphalerite deeper in the sulphide zone. Local acanthite and visible gold occur in a variety of settings, including hydrothermal crackle breccias and in thin quartz-dominated veins. Hydrothermal breccias carry the highest silver and gold grades and vary from crackle to very milled types. Crackle types were more permeable and they commonly show coarse quartz + sulphide (pyrite, sphalerite, and galena) + fluorite gangue. They pass outward into vein

Pan American Silver Corp.
March 2017 32 of 98
stock works. Hydrothermal breccias commonly include veins of quartz, quartz-calcite, fluorite, and anhydrite and mostly developed after the sheeted vein swarms. Some diffuse areas of sugary, silicified rock with coarse adularia and high silver and gold grades also occur.
Most veins at Dolores are relatively simple, with only weak crustiform texture. They comprise euhedral comb quartz and commonly show aggregates of very fine grained drusy quartz. They are thin, rarely over 30 mm, and tend to occur as sheeted swarms. Economically mineable grades occur where the veins are sufficiently closely spaced.
Vein fill progresses from high temperature (>200oC) minerals, such as epidote, to low temperature (150oC to 200oC) minerals such as colloform chalcedony, adularia, amethyst, laumontite, and other zeolites. Geopetal structures occur in some veins and indicate high levels in the epithermal system. The proximity of high and low temperature minerals suggests rapid cooling of fluids, perhaps due to uplift or a rapidly waning hydrothermal system. The presence of zeolites indicates very alkaline fluids.
Base metal sulphides appear to increase at depth, with widespread coarsely crystalline sphalerite, galena and minor chalcopyrite. Base metal sulphides are particularly abundant in the deeper parts of the stock-diatreme complex in the pit. The most dominant sulphide mineral accompanying the mineralization is pyrite, in concentrations of between 1% and 2%, with intense pyritization of approximately 6% at the lithological contacts.

Pan American Silver Corp.
March 2017 33 of 98
8 Deposit types Information in this section is referenced from Pratt (2013).
Dolores is a low sulphidation epithermal deposit with strong structural control. Northeast-striking faults, perpendicular to the structural grain, locate many mineral deposits in the Sierra Madre Occidental. However, regional controls at Dolores are unclear where mineralized faults are north-northwest striking. There is no apparent transverse structure apparent on geological maps or satellite imagery. The mineralized structures have a typical Sierra Madre, or Laramide, trend, a direction probably inherited from the basement of elongate terranes.
Local structural controls are better understood. Sometime after eruption of the Upper Volcanic Series, there was a northeast-southwest extensional regime, with a component of dextral strike-slip, creating dilation on northwest-striking faults. It also caused local dilational jogs that allowed emplacement of dikes, hydrothermal breccias, and sheeted veins. It is likely that the diorite stock-diatreme complex was the main heat engine that drove the hydrothermal system and provided the source of metals. It may have also been emplaced into a space created by a dilational jog. Geopetal structures and low temperature minerals suggest Dolores developed close to the original surface and has not been strongly eroded.
High silver and gold grades occur over a wide vertical interval at Dolores. This is unusual for most low sulphidation epithermal deposits, which tend to have narrow vertical intervals of high grade.
Lithology was important for localizing high grade. Although the principal control on fluids was through-going semi-regional faults (San Francisco and Alma Maria), some host rocks were ideal for fracturing. Others were ductile and less amenable to mineralization. For example, historic workings in the East Dike targeted a hydrothermal breccia hosted by a latite dike that disappears where the structure passes into country rocks. This, and many other examples, highlights the importance of brittle host rocks. Latite dikes were ideal while the surrounding andesites were a poorer host.
Vein textures, the occurrence of adularia, and the simple sulphide mineralogy confirm Dolores is a low sulphidation epithermal deposit although it lacks the typical complex crustiform banding found in most low sulphidation veins (e.g. Hishikari in Japan and Kupol in Russia). This implies relatively few mineralizing and boiling events in the conduits. Local advanced argillic alteration along the East fault suggests the potential presence of high sulphidation-type mineralization. There are examples of high sulphidation gold deposits in the area, for example, Mulatos, located about 42 km south-southwest (Staude, 2001).
Major post-mineral offsets of up to 500 m occurred on the principal faults at Dolores. Mineralization effectively sealed the San Francisco structure. Therefore, the focus of post-mineral movement jumped west by up to 100 m. This resulted in a major fault zone, dominated by milled and foliated smectitic rock. A significant concealed epithermal system may occur in the deep part of the hangingwall.

Pan American Silver Corp.
March 2017 34 of 98
9 Exploration Information in this section is referenced and updated from Pincock, Allen, & Holt (2002).
9.1 Exploration by Minefinders from 1993 to 2012 Minefinders acquired the Property in 1993 and began a reconnaissance surface exploration program, assisted by aerial photographs taken in 1995, a 3 m resolution digital topography map sourced from air photographs covering 20 km2, and satellite imagery. Staff geologists carried out surface mapping and sampling, and contractors completed the geophysical programs.
Four mapping campaigns defining the general structural and geological trends of the mineralized systems were completed, including an initial 1:5000 scale map covering 12 km2, followed up by more detailed mapping at 1:2000 scale covering 3 km2, and two structural mapping campaigns covering over 4 km2 at 1:1000 and 1:500 scales.
Over 13,000 rock samples were taken from surface outcrops, including 9,882 samples taken as 5 m long continuous samples along road cuts or sample lines cut perpendicular to the strike of the deposit. Channel samples were taken in the accessible portions of the underground workings. In workings parallel to the strike of the deposit, samples were selected from across the backs at 5 m intervals at lengths averaging 2 m wide and up to 4 m wide. For other areas of the workings, 2 m long continuous samples were taken along the ribs.
Geophysical surveys undertaken for Minefinders by Quantech Consulting Inc. of Reno, Nevada included 14,900 m of induced polarization/resistivity surveys and total field magnetic surveys, run across the strike of the deposit.
The results of the surface exploration work as well as ore microscopy, metal ratio studies, and petrographic analyses were used to identify potential drill targets.
None of the sample assay data collected from these surface and underground sampling campaigns has been used in the estimation of the current mineral resources and reserves.
9.2 Exploration by Pan American from 2012 to present Since Pan American acquired the Property, staff and consulting structural geologists have carried out near mine surface geological and structural mapping, and surface sampling on the continuity of the San Francisco and Alma Maria structures. Near mine diamond drilling exploration campaigns are ongoing. Approximately 33,000 m of drill core has been re-logged to better define the controls on mineralization, alteration, and to update the geological interpretation.

Pan American Silver Corp.
March 2017 35 of 98
10 Drilling
10.1 Drilling summary and database Most of the drilling centres over the strike length of the currently defined mineral resources and reserves. A summary of the drillhole data available at the drillhole data cut-off date of September 30, 2016 for the commencement of the geological interpretation is shown in Table 10.1. A plan showing the location of the drillholes is shown in Figure 10.1. A cross section is shown in Figure 14.1, which shows the relative orientation and spacing of drillholes on a typical section.
Table 10.1 Drillhole summary
Year Operator Hole type Number of holes Metres
1997 Echo Bay Reverse circulation 68 12,949.45
1998 – 2010 Minefinders Reverse circulation 328 58,608.31
2014 – 2016 Pan American Reverse circulation 79 7,425.00
1996 – 1997 Echo Bay Diamond core 110 25,981.90
1998 – 2012 Minefinders Diamond core 541 182,410.72
2012 – 2016 Pan American Diamond core 270 89,266.56
Total 1,396 376,641.94
Figure 10.1 Drillhole location map

Pan American Silver Corp.
March 2017 36 of 98
10.2 Drilling by Minefinders from 1996 to 2012 Minefinders drilled using a combination of reverse circulation and diamond drilling methods, with holes mostly oriented perpendicular to the strike of the deposit and spaced roughly 25 m apart.
The diameter of the diamond drillholes was either HQ or NQ. The diameter of the reverse circulation holes was not well documented but appears to be either 4 ½ or 5 ½ inches. The majority of collar surveys were taken with a total station or multi-station GPS survey instrument, while the remaining holes were surveyed relative to previously surveyed holes using a tape measure and Brunton compass. About 70% of the holes were surveyed down the hole using a Tropari single shot camera tool for reverse circulation holes and an Ausmin or Sperry-Sun single shot camera for diamond drillholes, at downhole intervals of around 50 m. The remainder of the holes were not surveyed.
10.3 Drilling by Pan American from 2012 to present From 2012 to 2014, Pan American used two Boart Longyear LF90 diamond drill rigs and one hybrid diamond drill rig, and then switched in 2014 to two Sandvik DE710 diamond drill rigs. Underground drilling began in 2016 using two Boart Longyear LM-75 machines. The drilling contractor is Rock Drill Mining of Aguascalientes, Mexico. The hole diameter varies from PQ, HQ, and NQ. Drilling recovery is good, approximately greater than 95%, and additives such as bentonite are used whenever necessary to improve core recovery and to regulate drilling pressure.
The drillhole collars are set up in the field prior to drilling by the mine survey department using total station survey equipment or a differential GPS when necessary, and by laying out the front and back sights with stakes and flagging tape. Collar coordinate surveys are taken of the drillhole by the mine surveyors using total station methods, and downhole surveys are taken with a Reflex Multi-shot instrument on average every 25 m down the hole. The bearing and dip at the collar is determined by the mine survey department using total station survey equipment to survey a point at the collar and another point along the drill rod.
10.4 Material impact on the accuracy and reliability of drilling results Pan American is aware of a number of potential issues with the drilling protocols for some of the drillholes in the database. These include the use of reverse circulation drilling, which may result in a less reliable sample than diamond drillholes, particularly when the sample is wet, the orientation of some of the drillholes down the dip of mineralization, and absent or insufficiently spaced downhole surveys in some of the drillholes.
However, Pan American believes these potential issues are unlikely to have a material impact on the accuracy and reliability of the drilling results and the mineral resource and reserve estimates. There are a large number of drillholes present over the deposit, and reliable drillholes confirm the results of potentially biased drillholes. There is only a negligible difference in the silver and gold grades and thicknesses of the mineralized zones encountered by reverse circulation and diamond drillholes drilled in close proximity to each other. The removal of down dip drillholes from the geological interpretation and the grade estimation technique has mitigated the effect of poorly

Pan American Silver Corp.
March 2017 37 of 98
oriented drillholes, and there appears to be no significant difference in the location of the mineralized zones encountered by surveyed and by un-surveyed drillholes.
Regular reconciliation reviews comparing close spaced grade control drillhole data against the mineral resource and reserve estimates have reasonably confirmed the location, orientation, and grades of the mineralized zones as defined by the exploration drillholes. These factors relating to the reliability of the sample data have been considered when applying confidence categories to the current mineral resource and reserve estimates.
Since acquiring the Property, Pan American has undertaken measures to ensure the data used for the estimation of mineral resources and reserves is reliable and collected using industry best practice. This includes orienting holes perpendicular with mineralization and taking downhole surveys at frequent intervals down every hole.
10.5 Conclusions and recommendations There are no known drilling, sampling, or recovery factors that could materially impact the reliability of the drilling results. Pan American intends to continue annual near-mine diamond drilling programs to test the southern and down dip extents of the currently defined mineralization and to conduct regular infill drilling of the deposit to upgrade mineral resource and reserve confidence categories.

Pan American Silver Corp.
March 2017 38 of 98
11 Sample preparation, analyses, and security
11.1 Sampling by Minefinders from 1996 to 2012
11.1.1 On-site sample preparation and security For reverse circulation drillholes, Minefinders selected one sample over the interval of each 5 foot drill rod length. For holes drilled under dry conditions, the broken rock fragments were collected in a bucket, divided into two equal sample pairs with a splitter, and bagged. Under wet conditions, the broken rock fragments were divided with a wet splitter into two equal sample pairs in two buckets. Flocculant was added to the buckets and the buckets were placed in tubs to settle the fine material and then bagged. The weight of the dry and wet samples varied from 10 kg to 13 kg.
One sample was sent to the laboratory for analysis and the other pair was retained on site for reference. A portion of the reference sample was stored in plastic chip trays and logged for geological features. The geological logging included codes for lithology, colour, and breccia type. Strength ratings were assigned for brecciation, fractures, vein composition, alteration type, oxidation nature, and oxide and sulphide minerals.
Diamond drillholes were logged, photographed, split in half, and sampled in a secure core logging facility at the Property. The geological log included all the data collected for reverse circulation holes as well as core recovery, rock quality designation (“RQD”), and structural features. Core was split in half with a manual core splitter, with one half sent to the laboratory for preparation and analysis and the other half retained in the core tray for reference. The sampling length was frequently 2 m.
Samples were collected by truck from the Property site by the commercial sample preparation laboratory in use at the time, which included Bondar-Clegg (since acquired by ALS) of Chihuahua, Mexico, ALS of Hermosillo, Mexico, or Inspectorate of Hermosillo, Mexico.
11.1.2 Laboratory sample preparation and analytical methods Samples were dried and crushed to 70% passing minus 2 mm in either jaw or roll crushers, then reduced to 1 kg weight by splitting in a riffle splitter, then pulverized to 85% passing less than 75 microns (“µm”). The pulverized material was then split to a 150 gram (“g”) pulp sample weight.
Between 1996 and 2002, the pulverized samples were sent for geochemical analyses by air to ALS of Vancouver, Canada and from 2002 onwards, the period covering the majority of the drillholes in the database, to Inspectorate of Reno, USA. ALS of Vancouver is an accredited laboratory that conforms to the requirements of CAN-P-1579, CAN-P-4E (ISO/IEC 17025:2005) and Inspectorate conforms to the requirements of ISO-9001:2008.
At the analytical laboratory, a 30 g subset was assayed for gold using fire assay with atomic absorption finish. Any sample with a grade greater than 1 ppm gold was re-assayed using fire assay with gravimetric finish.

Pan American Silver Corp.
March 2017 39 of 98
Prior to 2001, samples were assayed for silver using Aqua Regia digestion with atomic absorption finish, until metallurgical test work at McClelland Laboratories Inc. (“MLI”) found that the Aqua Regia digestion technique may have been under-reporting silver values, likely because of poor digestion of silver halide minerals. Minefinders implemented a campaign to re-assay approximately 9,000 retained pulps from drillhole and underground channel samples for silver using multi-acid digestion with atomic absorption finish, which resulted in a grade increase of 59% for oxidized samples, 22% in mixed oxide-sulphide samples, and 19% in sulphide samples. The database prioritizes assays by analytical method first by fire assay with gravimetric finish, then fire assay with atomic absorption finish, then multi-acid digest with atomic absorption finish, and finally Aqua Regia digest with atomic absorption finish.
11.1.3 Quality assurance and quality control Minefinders submitted standard reference material and blank material to the laboratory to independently test for accuracy and contamination of the assays determined by the laboratory. No duplicates were submitted. Standards were submitted at a frequency that varied from between one standard per every two drillholes up to 16 standards per drillhole, for an overall frequency of approximately one standard per 20 samples.
From 1997, Minefinders submitted three standards comprised of mineralized material sourced from the Property, which were prepared and certified for gold by Bondar-Clegg. In 2002, Minefinders used four standards comprised of mineralized material from site that were prepared and certified for both silver and gold by Inspectorate Laboratories.
Blanks, comprised of material believed to be unmineralized and sourced from overburden or the upper parts of drillholes, were submitted in 1997 and from between 2004 and 2009, at a frequency of approximately 1 blank per 80 samples.
The results of the data are problematic to assess, as record keeping and standard identification numbering on the log sheets was poor, no coherent QAQC database was maintained, and no regular QAQC reports are available for review. Pan American’s review of the results of the silver and gold standards shows unacceptably wide grade variation, likely the result of poor standard preparation. Blanks failed in the order of 4% for gold and 3% for silver.
11.2 Sampling by Pan American from 2012 to present
11.2.1 On-site sample preparation and security Diamond drillholes are logged, photographed, halved, and sampled in a secure core logging facility at the Property. The drill core is cut in half with a diamond bladed saw, and samples are selected with respect to geological features, at 2 m lengths or less. The samples are collected weekly from site by SGS of Durango, Mexico and driven to the laboratory for sample preparation and analysis. SGS Durango conforms to the requirements of the ISO/IEC 17025 standard for the analytical methods employed for the Dolores samples.

Pan American Silver Corp.
March 2017 40 of 98
11.2.2 Laboratory sample preparation and analytical methods The samples are crushed to 2 mm in size and split with a riffle splitter to obtain a 250 g sub-sample, then pulverized to 75 µm. Samples are analysed for gold using fire assay with atomic absorption finish, and any sample with a grade greater than 10 ppm Au is re-assayed using fire assay with gravimetric finish. Silver is assayed using three acid digest with atomic absorption finishing methods, and any sample with a grade greater than 300 ppm Ag is re-assayed by fire assay with gravimetric finish.
11.2.3 Quality assurance and quality control Since acquiring the Property, Pan American has implemented an industry standard QAQC program including the submission of certified standards, blanks, and duplicate samples to the laboratory and reviewing the results regularly to ensure that appropriate and timely action is taken in the event of a QAQC failure. The protocol for the submission of QAQC samples is 5% each of blanks, certified standards, and duplicate samples. The actual submission rate achieved to date is 5% each of blanks and standards, and 7% duplicates.
Certified standards To date, 1,655 samples from 12 different certified standards were submitted to the laboratory with the drill samples. Of these 12 standards, eight have been analysed a sufficient number of times to meaningfully assess the results. For gold, the standards performed better than expected at the first and second standard deviations, but performed 2.2% worse than expected at three standard deviations. For silver, the standards performed better than expected at the first and second standard deviations but 1.3% worse than expected at three standard deviations. Some standards performed much worse than others, with high failure rates, bias, and data cyclicity, and Project geologists are monitoring the performance of these standards. Overall, the results are acceptable and indicate reasonable accuracy at the laboratory.
Blanks To date, 1,949 blanks were submitted to the laboratory with the drill samples. There were 1.2% failures for gold and 0.8% failures for silver, indicating little concern for sample contamination at the laboratory.
Duplicates To date, 860 field duplicates comprising the second half of the drill core, 1,298 coarse reject duplicates, and 4,426 duplicate pulps were sent to the laboratory with the drill samples. Sample grade precision is problematic at Dolores given the mineralization style and highly variable sample grades over short distances. Following Long’s (1998) ranked half absolute relative difference criteria, the pulp duplicates have moderately poor precision for gold and poor precision for silver. Coarse reject duplicates and field duplicates both have poor precision for gold and silver. In general, while laboratory issues may be a potential contributor to the poor precision noted in the duplicate data, the highly variable nature of mineralization is considered to be the main cause.

Pan American Silver Corp.
March 2017 41 of 98
11.3 Bulk density Minefinders measured bulk density using the water immersion method from 296 paraffin sealed drill core samples. Since 2012, Pan American has selected samples from geologically and spatially representative locations. The samples were measured for bulk density by ALS of Vancouver, Canada, using the water displacement method on wax-coated samples. To date, 1,008 bulk density measurements are available, and the results are discussed in Section 14.7.
11.4 Conclusions and recommendations No effective QAQC program was in place at the Property prior to 2012 to assess the accuracy, precision, and contamination of drillhole sample grades, and some of Pan American’s standards are showing problematic results. Despite this, the risk of any material error or bias in the sample grades is considered to be low, given that the samples were prepared and analysed at certified, international commercial laboratories and the lack of a material difference between the grade of exploration samples and the current grade control samples. The opinion of the Qualified Person responsible for this section of the technical report is that the sample preparation, analytical, and security procedures followed for the samples are sufficient and reliable for the purpose of the mineral resource and reserve estimates.
Pan American will continue with the sampling, assaying, and QAQC protocols currently in place. Project geologists will monitor the results experienced in a few of the certified standards. A recommendation is made to increase the number of bulk density measurements in the underground locations of the mineral resource and reserve.

Pan American Silver Corp.
March 2017 42 of 98
12 Data verification
12.1 Geology data reviews Prior to and following the acquisition of the Property from Minefinders, Pan American undertook extensive geological data verification reviews. These reviews included compiling the available information and conducting reviews of downhole surveys in the database against the original photographic disks, visual reviews of the drill hole location in mining software, reviews of the drillhole collar coordinates against the surveyed topography, and extensive reviews of the assays in the database. The assay reviews included checking around 2,600 assays in the database against the original assay certificate, with particular attention paid to samples with relatively high silver and gold grades and unusual gold to silver ratios. A minor number of discrepancies were noted and corrected. Since acquiring the property, Pan American routinely undertakes reviews of the assay and geology database and monitors reconciliation between the mineral reserve estimate, the grade control estimate, and mine production data.
In the opinion of the Qualified Person, the data used to estimate mineral resources and reserves are sufficiently reliable for those purposes.
12.2 Mine engineering data reviews Pan American routinely undertakes reviews of the mine engineering data, including the mining fleet and mine operational and production data, grade control data including dilution and ore loss, geotechnical and hydrological studies, pit wall and underground stability data, waste disposal requirements, environmental and community factors, the heap leach operations and production data, the development of the life of mine plan including production and recovery rates, capital and operating costs for the mine and processing facilities, transportation, logistics, power and water consumption and future requirements, taxation and royalties, and the parameters and assumptions used in the economic model.
In the opinion of the Qualified Person, the data, assumptions, and parameters used to estimate mineral resources and reserves are sufficiently reliable for those purposes.
12.3 Metallurgy data reviews Pan American routinely undertakes reviews of metallurgical test work of monthly composites, operational data and performance, heap leach operations, and production data. In the opinion of the Qualified Person, the data and assumptions used to estimate the metallurgical recovery model for the mineral resource and reserve estimates are sufficiently reliable for those purposes.
12.4 Data adequacy It is the opinion of the Qualified Persons responsible for the preparation of this technical report that the data used to support the conclusions presented here are adequate for the purposes of the mineral resource and reserve estimates.

Pan American Silver Corp.
March 2017 43 of 98
13 Mineral processing and metallurgical testing
13.1 Introduction and previous work Between 1996 and 2005, Minefinders undertook test work and studies to determine the optimal flow sheet and processing conditions for the Dolores ores. Column leach testing on a range of mineralization grades, lithologies, and ore types from the Dolores deposit yielded gold recoveries ranging between 51% and 94%, and silver recoveries between 23% and 74%, at a particle size of P80 6.3 mm. The flowsheet selected included primary crushing of ore followed by secondary and tertiary crushing in closed circuit with screens to produce a final crushed product of P80 6.3 mm, conveying the crushed product and stacking on the heap leach pad via a conveyor stacking system for leaching with sodium cyanide. Processing capacity was designed at 18,000 tpd with 90% availability of the crushing plant. The recovery of metals from the pregnant leach solution follows the Merrill-Crowe process with precipitation of metal ions using zinc dust followed by the removal of trace amounts of mercury in retort ovens and smelting of the precipitate to produce doré bars.
13.2 Testing from 2012 to 2016 Following acquisition of the mine in April 2012, Pan American established a metallurgical test program and selected 521 drill core samples from core drillhole samples to represent the deposit in terms of grade, ore type (oxidation state), and lithology in the proportions expected to be processed during the life of mine.
13.2.1 Pulp agglomeration study In mid-2012 Pan American began a preliminary economic assessment of three alternative process options including a pulp agglomeration followed by heap leaching option, a grinding and leaching in tanks option, and a flotation/cyanidation option. The three options were compared to the 16,200 tpd heap leach only process and involved a high-level assessment of treatment rates, metal recovery, required particle size reduction, the necessity and cost of any tailing disposal system, operating costs, and initial capital requirements. Pulp agglomeration was selected as the most attractive treatment option based on higher metallurgical recoveries, improved recovery kinetics, lower capital and operating costs, and the absence of tailings.
Pulp agglomeration is the process of grinding high grade ore (the “pulp”), combining with cement, and tumbling to form round balls in the order of ½ inch to 1 inches in diameter. In this process, the fine ore and cement particles are tumbled together in a drum at a controlled moisture content and feed rate and begin to stick together, forming balls. As the tumbling continues, additional material adheres to the balls (the “agglomerates”). The cement acts as a binder to hold the particles together and gives the agglomerates strength to prevent them from crumbling under the weight of material stacked on top of them. This is important to prevent the fine material from being washed to the solution collection drains and to maintain good permeability for percolation of cyanide solution down through the heap. The agglomerates remain very porous and the increased surface area of the ground particles allows for better contact of the cyanide solution on the surface of the precious metal-bearing minerals. This in turn results in increased metallurgical recoveries and improved

Pan American Silver Corp.
March 2017 44 of 98
metal recovery kinetics compared to only coarse crushing and heap leaching. A photograph of the pulp agglomerates is shown in Figure 13.1.
Figure 13.1 Agglomerates formed from ground and filtered ore
13.2.2 Cyanide leaching tests The 521 samples as well as 15 composite samples prepared for previous metallurgical test work by Minefinders were subjected to cyanide solubility tests and analysis of manganese, lead, zinc, total sulphur, and sulphide sulphur content at MLI. The testing conditions were optimized using the composite samples with the objective of maximizing metal extraction with respect to leach time, cyanide concentration, and solids density. Shake tests were performed to measure the solubility of gold and silver by cyanide, which averaged 72% and 66%, respectively.
Column leach tests were conducted on each high grade and medium grade composite at a P80 6.3 mm feed size to determine baseline recoveries for the heap leach only process and on each high grade composite representing the high grade pulp agglomeration feed. For these tests, the high grade composite was ground to P80 425 µm, pre-leached at 3,000 ppm sodium cyanide for one hour to simulate the cyanide solution contact time in the mills and during filtration, then agglomerated with 20 kg/t cement and leached at 1,000 ppm sodium cyanide. Column leach testing on the range of mineralization (including oxide and sulphide) from Dolores deposit yielded gold recoveries ranging between 84% and 90% and silver recoveries between 76% and 85% at a particle size of P80 425 µm. The results show that the extraction from pulp agglomerated composites relative to the baseline column leach test ranges from 12% to 14% higher in gold recovery and from 16% to 20% higher in silver recovery, and that sodium cyanide consumption of the agglomerated material compared with the baseline is around 50% lower.

Pan American Silver Corp.
March 2017 45 of 98
13.2.3 Comminution and pilot plant tests Comminution tests were first conducted in 2013 in a 19” diameter continuous pilot rod mill at Metso’s pilot milling facility in York, Pennsylvania. In 2013, a 4’ by 8’ rod mill pilot plant was installed at the Property to verify the data obtained in the Metso pilot mill tests and to provide the design parameters for the pulp agglomeration comminution circuit. The results of the milling pilot plant are considered indicative of rod mill performance at the considered grinds. The criteria for the selection of the rod mill considers the highest operating work index of 22.4 kW hours per tonne obtained from three test runs within expected feed and product sizes. The average rod mill work index was 17.8 kW hours per tonne and the average ball mill work index was 18.7 kW hours per tonne, a measure that indicates that the ores are moderately hard.
For Vertimill assessment, a jar mill test was conducted and the results extrapolated for the circuit design. Based on the results from Metso, a VTM 1500-WB Vertimill was recommended for the pulp agglomeration circuit at a processing rate of 256 tonnes per hour with a final product of P80 1,700 µm or a maximum of 2,000 µm.
In 2015, a filter press pilot plant, including a mixer and agglomeration drum, was commissioned at the Property to confirm filtration design parameters and to provide samples for agglomeration, and was operated with the rod mill pilot plant. Samples from the range of ore types obtained from the heap leach crushing plant were ground at the rod mill pilot plant. The samples ranged from P80 of 403 µm to P80 of 505 µm and showed excellent filterability with shorter feeding times compared with bench scale testing. The filter cakes tended to be thixotropic and require cake blowing. The residual moisture was generally less than 15% and was achieved without difficulties.
13.2.4 Load/permeability tests Load/permeability tests at Geo-Logic Associates of Grass Valley, California were conducted to determine the optimal ratio of medium grade to high grade ore, the necessary moisture content of the filter cake and agglomerates, and the optimal cement addition and blending points. Samples were selected from the range of ore types from drill core and broken ore processed at the mine. The drillhole samples were prepared at MLI and samples from the mine ore were ground in the mill pilot plant and filtered in the filter press pilot plant at the mine. Testing was conducted on leached and un-leached agglomerates, as well as on samples of crushed ore for baseline comparisons.
Mixing techniques were investigated and additional steps were considered for the processing of pulp agglomerates, including adding a de-lumper, adding coarse medium grade material during mixing, and a cement mixer before the agglomeration drum.
Hydraulic conductivities of the agglomerates were generally greater than 110 litres per hour per m2 and measured at simulated heap stack heights of up to 150 m. The agglomerates were prepared from high grade filter cake material at a nominal 425 µm with less than 15% moisture content, thoroughly blended with cement at 25 kg/t of high grade ore, agglomerated, and then mixed with medium grade material at sizes between 6.3 and 9 mm.

Pan American Silver Corp.
March 2017 46 of 98
13.3 Metallurgical recovery model
13.3.1 Heap leach The metallurgical recovery model for the heap leach operation used for the December 31, 2016 mineral resource and reserve estimates is shown in Table 13.1. The recovery model was developed using the results of the tests at a particle size of 6.3 mm and cyanide concentrations of 1.0 g of sodium cyanide per litre.
The metallurgical recovery model was supplemented with a silver and gold leaching kinetic model developed from the kinetics of column leach tests, the ratio of ore placed on the heap leach pad relative to the added solution, and metal recoveries. Based on the topography of the heap leach pads, the current treatment rate, the quantity of solution applied to heap leaching, and considering the current metal production, a solid to liquid time schedule was estimated for use in the kinetic model equation. The kinetic model is shown in Table 13.2.
Table 13.1 Heap leach metallurgical recovery model
Ore type Gold recovery (%) Silver recovery (%)
Oxide 77.9 42.1 Sulphide 68.3 61.1
Table 13.2 Heap leach metallurgical recovery kinetic model
Year
Oxide Sulphide
Au recovery % Ag recovery % Au recovery % Ag recovery %
1 70.8 23.2 61.3 34.4
2 7.1 7.7 7.0 10.6
3 3.1 4.1
4 2.1 2.9
5 1.6 2.2
6 1.3 1.7
7 1.2 1.5
8 1.0 1.4
9 0.8 1.1
10 0.1 1.0
11 0.2
Total 77.9 42.1 68.3 61.1

Pan American Silver Corp.
March 2017 47 of 98
13.3.2 Pulp agglomeration The pulp agglomeration metallurgical recovery model used for the December 31, 2016 mineral resource and reserve estimates is shown in Table 13.3. The recovery model was calculated by adding the difference in recoveries of the column leach test results at 425 µm and the results of the same sample at 6.3 mm to the heap leach recovery model. The kinetic model was developed using the same methodology as for heap leaching and the results are shown in Table 13.4.
Table 13.3 Pulp agglomeration metallurgical recovery model
Ore type Gold recovery % Silver recovery %
Oxide 90.0 58.7
Sulphide 80.7 78.8
Table 13.4 Pulp agglomeration metallurgical recovery kinetic model
Year
Oxide Sulphide
Au recovery % Ag recovery % Au recovery % Ag recovery %
1 90.0 54.5 80.7 66.1
2 4.2 9.9
3 2.8
Total 90.0 58.7 80.7 78.8
13.4 Material issues and deleterious elements There are no known material issues and the operation is not subject to any negative impact of deleterious elements. The mine operates a closed circuit processing system without tailings facilities and produces a doré product.
13.5 Conclusions For the heap leach only operation, column leach testing on a range of mineralization grades, lithologies, and ore types from the Dolores deposit yielded gold recoveries ranging between 51% and 94%, and silver recoveries between 23% and 74%, at a particle size of P80 6.3 mm. The metallurgical recovery model created for the mineral resource and reserve estimate assumes gold recoveries of 77.9% for oxide and 68.3% for sulphide ores, and silver recoveries of 42.1% for oxide and 61.1% for sulphide ores. The kinetic model created for the mineral reserve estimate assumes a two year period to achieve ultimate gold recovery, and ten and eleven years to achieve ultimate silver recovery for the oxides and sulphides, respectively.
For the pulp agglomeration operation, column leach testing on the range of mineralization (including oxide and sulphide) from Dolores deposit yielded gold recoveries ranging between 84%

Pan American Silver Corp.
March 2017 48 of 98
and 90% and silver recoveries between 76% and 85% at a particle size of P80 425 µm. The metallurgical recovery model created for the pulp agglomeration of high grade mineralization used in the mineral resource and reserve estimate assumes gold recoveries of 90.0% for oxide and 80.7% for sulphide material and silver recoveries of 58.7% for oxide and 78.8% for sulphide material, at a particle size of P80 425 µm. The kinetic model created for pulp agglomeration assumes a one year period to achieve ultimate gold recovery, and two and three years to achieve ultimate silver recovery for oxide and sulphide material, respectively.
The load / permeability tests confirm the use of cement at 25 kg/t of milled ore to provide assurance that the agglomerates will remain stable in the heap leach stack at heights of up to 150 m.
The pilot plant, including rod mill, filtration, and agglomeration, has provided a good degree of confidence for the sizing and design of the circuit.
13.6 Recommendations Recommendations for additional metallurgical test work include load/permeability tests with full scale plant samples at the mine site to determine the permeability of the agglomerates under load charge to optimize the cement addition requirements. The cost of this test work is estimated at $39,000.
In addition to continuing with routine monthly column leach tests from the heap leach operation, it is also recommended to include monthly column leach tests of samples from the pulp agglomeration plant after commissioning of the plant.

Pan American Silver Corp.
March 2017 49 of 98
14 Mineral resource estimates
14.1 Disclosure Pan American updates mineral resources on an annual basis following reviews of metal price trends, operational performance and costs experienced in the previous year, and forecasts of production and costs over the life of mine. Pan American conducts infill and near-mine drilling through much of the year. The drillhole data cut-off date for the commencement of the annual geological interpretation was September 30, 2016 and the effective date of the mineral resource estimate is December 31, 2016. No new material information has become available between the effective date and the signature date given on the certificates of the Qualified Persons.
Mineral resources were prepared by Pan American staff under the supervision of and reviewed by Christopher Emerson, FAusIMM, Vice President, Business Development and Geology of Pan American Silver, who is a Qualified Person as that term is defined by NI 43-101.
There are no known environmental, permitting, legal, title, taxation, socio-economic, marketing, political, or other relevant factors that could materially affect the potential development of the mineral resources. Mineral resources that are not mineral reserves do not have demonstrated economic viability. Mineral resources reported here are in addition to mineral reserves.
14.2 Available data, preparation, and validation The available drillhole data includes collar coordinates, downhole survey information, silver and gold assays, multi-element assays for a subset of the drillholes, and codes for lithology, structural features, alteration, mineralization, and oxidation, all in Microsoft Excel format. This data was imported into Datamine format and desurveyed into three dimensional drillhole traces. The drillhole data was reviewed and corrected as necessary for any errors.
Some of Minefinders’ drillholes were drilled down the dip of the mineralized trends, which provides unreliable grade and intersection width information. Pan American removed the majority of these drillholes from the geological interpretation and the estimation of mineral resources and reserves. A few down dip holes were retained for the interpretation where no other nearby supporting drillholes oriented perpendicular to the mineralized trends are present.
A cross section of the drillholes indicating the relative orientation and spacing of drillholes on a typical section at 53000 m North is shown in Figure 14.1.

Pan American Silver Corp.
March 2017 50 of 98
Figure 14.1 Cross section of resource estimate, reserve pit design, and drillholes
14.3 Geological interpretation and modelling Three dimensional interpretations were made of the lithology and oxidation codes on the drillholes. These interpretations were wireframed and used to code the drillhole data and the block model for the respective features.
Mineralization at the Property occurs in numerous structurally controlled parallel trends oriented to the northwest and mostly dipping steeply to the southwest. Three dimensional mineralized envelopes for open pit mineral resources and reserves were prepared around spatially continuous trends of composite samples greater than 0.30 ppm gold equivalent, using a gold to silver ratio of 1:70. This resulted in the creation of 35 spatially distinct mineralized trends at areas referred to as San Francisco, Alma Maria, Mid Zone, and the East Dike. These interpretations were wireframed and used to back-code the drillhole data and the block model for 35 mineralized grade estimation domains, as well as the surrounding unmineralized domain. A plan of the interpreted mineralized trends at the 1525 m elevation is shown in Figure 14.2. The widths of the narrower zones are in the order of 5 m wide, while the wider zones are in the order of 150 m wide.
Some of the mineralized zones occur at depths that cannot be mined economically by open pit methods, and may be accessed from underground. Interpretations of 29 spatially continuous

Pan American Silver Corp.
March 2017 51 of 98
mineralized trends at San Francisco, Alma Maria, and the East Dike were made using a 1.25 ppm gold equivalent cut-off.
Figure 14.2 Plan of mineralized trends
14.4 Geostatistics As the majority of the samples within the mineralized domains were selected at intervals at or less than 2 m intervals, all samples were composited to 2 m intervals to ensure equal weighting of sample grades during the grade estimate.
Mean composited grades within the 35 open pit estimation domains range from 0.15 ppm Au to 1.38 ppm Au, and from 14 ppm Ag to 66 ppm Ag. The mean composited grade of all composites in all domains is 0.77 ppm Au and 34 ppm Ag. San Francisco and Alma Maria are the two volumetrically largest estimation domains, and comprise 61% of the mineral resource and reserve material, with

Pan American Silver Corp.
March 2017 52 of 98
mean composited grades of 0.78 ppm Au and 33 ppm Ag at San Francisco and 0.97 ppm Au and 36 ppm Ag at Alma Maria.
The coefficient of variation is relatively high at 5.3 for gold and 3.4 for silver at San Francisco and 3.7 for gold and 3.1 for silver at Alma Maria. Because the mineralization at Dolores is characterized by highly variable silver and gold grades over short distances, multiple indicator kriging was selected as the grade interpolation method for those domains with sufficient numbers of sample composites to support the creation of multiple variograms at various grade bins.
Mean composited grades within the 29 underground estimation domains range from 0.65 ppm Au to 4.47 ppm Au, and from 17 ppm Ag to 209 ppm Ag. The mean of all composites in all domains is 2.50 ppm Au and 84 ppm Ag.
Top cuts of extreme silver and gold grades were reviewed by domain, with respect to the log histogram, gold and silver scatter plots, and the spatial location of the extreme grades relative to neighbouring grades. Top cuts were applied where necessary to reduce the influence of high grade values unsupported by similar surrounding sample grades.
14.5 Variograms and grade interpolation Experimental variograms were calculated on each grade estimation domain to assess whether sufficient drillhole intersections were present to produce reasonable multiple indicator variograms. In the open pit region, reasonable multiple indicator variograms were obtained in the largest of the mineralized trend each at San Francisco, Alma Maria, and the Mid Zone. For the remainder of the mineralized domains, a single variogram for all samples in the largest of the domains in each trend was calculated and applied to the remainder of the domains in each trend planned for ordinary kriged estimates. A single variogram was calculated and applied to the ordinary kriged estimate in the waste domain.
The 12 indicator variograms parameters for silver and gold were applied to the multiple indicator kriging estimate for the three multiple indicator kriged grade estimation domains, and the ordinary kriged variogram parameters for silver and gold were applied to the remaining mineralized domains and the waste domain. Variogram models were oriented according to the strike and dip of each domain. The range and direction of continuity obtained from the 70th percentile Au indicator bin was used to define the search ellipse. Three searches were applied using a minimum of eight and a maximum of 24 composites to return an estimate to the parent block.
14.6 Block model A block size of 12.5 m x 12.5 m x 7.5 m was chosen with respect to the average drillhole spacing, using sub-cells to obtain a better volumetric fit within the wireframes. The model was coded using the interpretation wireframes for lithology, grade estimation domain, and oxidation. The resulting block model was depleted for previous open pit mining as at December 31, 2016 as well as estimated volumes of historically mined underground material.

Pan American Silver Corp.
March 2017 53 of 98
14.7 Bulk density Bulk density values measured from the 1,008 samples range from 2.0 to 3.03 g/cm3, and have a mean of 2.58 g/cm3. The variability of the bulk density values is relatively low and there is no meaningful correlation between bulk density and any geological or spatial features, except for base metal content. Bulk density was applied to the block model using a nearest neighbour estimate to honour the local bulk density variability.
14.8 Estimation validation The estimates were validated by domain by comparing the global declustered mean composite grades with the mean of the estimated grades, and by comparing the local composite grade trends with estimated grade trends on slice or “swath” plots. These reviews show the estimated grades reasonably reflect the variability of the composite grades. Only a few small domains with few input sample grades showed poor comparisons, and this was considered in the confidence classification.
Pan American routinely conducts reconciliation of the reserve model to the grade control model and to the heap leach feed conveyor weight meter and sampler to monitor actual versus model performance. Reconciliation of the mineral resource estimate to mine production over the three years between 2014 and 2016 is excellent, with the resource estimate predicting differences in tonnes by -2%, gold grade by 2%, silver grade by 0%, gold ounces by 0%, and silver ounces by -2%.
14.9 Confidence classification The estimate was classified into spatially continuous measured, indicated, and inferred categories by preparing three dimensional interpretation wireframes around the drillhole patterns and coding the estimate for classification category with the wireframes. Measured resources were assigned at the central and upper zones of the deposit where drillhole spacing is in the order of 25 m or less, surrounded by indicated resources where drillholes are more widely spaced at the lower and outer regions of the deposit, in the order of 50 m or less, with inferred resources at depth and in regions with wide but regularly spaced drillholes. The interpretation of the mineralized zones is restricted to regions with drillhole data and little projection of the interpretations beyond data is present.
14.10 Planned dilution and loss For the open pit block model, the sub-celled model was re-blocked to 12.5 m x 12.5 m x 7.5 m using a process that eliminates sub-cells formed at the boundaries of the wireframe interpretation and incorporates the grade of sub-cells on the boundaries into the grade of the re-blocked cell. On the contact of the economically mineralized zones with the surrounding uneconomic material, this process dilutes the grades of any cells with a majority of the volume lying within the economic interpretation, by incorporating the estimated grade of the neighbouring uneconomic material into the re-block cell. The quantity of dilution added in this process is dependent upon the width and orientation of the mineralized zone relative to the block, and on average, resulted in the application of around 30% dilution. No ore loss was accounted for prior to the reserve pit design.
For the underground block model, a 3 m minimum mining width was assumed and additional planned dilution of 0.25 m was applied to each of the hangingwall and footwall, using the estimated

Pan American Silver Corp.
March 2017 54 of 98
grade of the waste material. In stopes greater than 5 m wide, additional dilution was added to ensure a minimum total external dilution of 10%. Mining recovery of 92% was assumed to account for expected losses incurred during mining.
14.11 Value estimates and mining constraints For open pit mineral resources, a value per tonne was applied to each block based on grade, metallurgical recovery, mineral resource metal prices, and costs including refining, transportation, royalties, processing, G&A, and leach pad sustaining capital. Processing costs and metallurgical recoveries were estimated using the combined heap leach / pulp agglomeration treatment process. A reserve pit design using mineral reserve metal prices was created for constraining both mineral resources and reserves.
For underground mineral resources, a net smelter return (“NSR”) value was calculated for each block using the same assumptions used for the open pit. All underground material is assumed to be processed through the pulp agglomeration plant. Potentially mineable stope shapes were generated using Deswik stope optimizer software based on geometrical, geotechnical, and economic NSR cut-off value constraints. The metallurgical recoveries are shown in Table 14.1, the economic parameters for silver and gold are shown in Table 14.2, and the cost parameters are shown in Table 14.3.
Table 14.1 Metallurgical recoveries by material type and process route
Process route Ore type Gold recovery (%) Silver recovery (%)
Heap leach Oxide 77.9 42.1
Sulphide 68.3 61.1
Pulp agglomeration Oxide 90.0 58.7
Sulphide 80.7 78.8
Table 14.2 Economic parameters
Item Units Silver Gold
Mineral reserve sale price $ per ounce 18.50 1,300
Mineral resource sale price $ per ounce 25.00 1,400
Refining cost $ per ounce 0.25 0.68
Transportation cost $ per ounce 0.11 0.11
Refining recovery % 99.800 99.813
Royalty to RG Mexico % 2.00 3.25
Extraordinary mining duty to government % 0.50 0.50

Pan American Silver Corp.
March 2017 55 of 98
Table 14.3 Cost parameters
Item Units Cost
Processing heap leach $ per tonne ore 5.19
Processing pulp agglomeration $ per tonne ore 12.99
Site G&A heap leach $ per tonne ore 2.74
Site G&A pulp agglomeration $ per tonne ore 2.74
Leach pad sustaining capital $ per tonne ore 1.07
Open pit mining cost $ per tonne 1.89 with an increase/decrease of 0.01 per tonne per bench below/above the 1455 level
Underground mining cost $ per tonne 30.00
14.12 Mineral resource tabulation Mineral resources for Dolores as at December 31, 2016, are shown in Table 14.4. This tabulation includes in situ potentially economic material at metal prices of $25 per ounce of silver and $1,400 per ounce of gold, classified as measured, indicated, and inferred, constrained within the mineral reserve pit design, underground resources below the reserve pit and constrained within stope designs, and low grade previously mined stockpiled material. The in situ mineral resources have been depleted for mining and stockpiles have been inventoried as at December 31, 2016.
There are no known mining, metallurgical, environmental, permitting, legal, title, taxation, socio-economic, marketing, political, or other factors or risks that could materially affect the potential development of the mineral resources. Mineral resources that are not mineral reserves do not have demonstrated economic viability. Mineral resources reported here are in addition to mineral reserves.
Table 14.4 Dolores mineral resources as at December 31, 2016
Location Classification Tonnes (Mt) Ag ppm Ag contained metal (Moz)
Au ppm Au contained metal (koz)
Open pit Measured 1.6 10 0.5 0.18 9.4
Indicated 2.1 9 0.6 0.19 12.7
Measured + Indicated
3.7 9 1.1 0.19 22.2
Inferred 0.7 21 0.5 0.26 5.6
Underground Measured 0.1 51 0.2 0.85 3.6
Indicated 1.0 54 1.8 0.93 31.3
Measured + 1.2 54 2.0 0.92 34.8

Pan American Silver Corp.
March 2017 56 of 98
Location Classification Tonnes (Mt) Ag ppm Ag contained metal (Moz)
Au ppm Au contained metal (koz)
Indicated
Inferred 1.0 47 1.5 1.51 49.0
Stockpiles Measured 0.2 15 0.1 0.13 0.8
Indicated - - - - -
Measured + Indicated
0.2 15 0.1 0.13 0.8
Inferred - - - - -
All Measured 1.9 13 0.8 0.22 13.8
Indicated 3.2 24 2.5 0.43 44.0
Measured + Indicated
5.1 20 3.3 0.35 57.8
Inferred 1.7 37 2.0 1.01 54.6
Notes: Mineral resources do not have demonstrated economic viability. Totals may not add up due to rounding. Mineral resource estimates were prepared under the supervision of or were reviewed by Christopher Emerson, FAusIMM, Vice President, Business Development and Geology of Pan American. Mineral resources have been estimated using pulp agglomeration and/or heap leaching metal recovery and cost parameters. Mineral resources have been estimated using metal prices of $25 per ounce of silver and $1,400 per ounce of gold. Mineral resources are in addition to mineral reserves.
14.13 Recommendations No significant recommendations are made to improve the quality of the mineral resource estimate methodology. Pan American intends to continue with annual diamond drilling programs and to continue ongoing infill drilling, particularly in the portion of the deposit that will be mined using underground mining methods, to collect closer spaced drillhole information. Exploration diamond drilling is expected to be concentrated on defining the southern strike extent of the deposit and in improving the confidence in the estimate at depth. The geological interpretation and mineral resource estimate will continue to be updated annually to include additional diamond drilling undertaken during the year and to deplete for the previous years’ mining. Reviews of the geological interpretation against grade control drilling will continue to be undertaken on a regular basis to verify the reliability of the resource estimate.

Pan American Silver Corp.
March 2017 57 of 98
15 Mineral reserve estimates
15.1 Disclosure Pan American updates mineral reserves on an annual basis following reviews of metal price trends, operational performance and costs experienced in the previous year, and forecasts of production and costs over the life of the mine. The mineral reserve is based on measured and indicated mineral resources estimated as at December 31, 2016. The effective date of the mineral reserve estimate is December 31, 2016. No other new material information has become available between the effective date and the signature date given on the certificates of the Qualified Persons.
Mineral reserve estimates were prepared by Pan American technical staff under the supervision of and reviewed by Martin Wafforn, P. Eng., Senior Vice President, Technical Services and Process Optimization of Pan American, who is a Qualified Person as that term is defined by NI 43-101.
Mineral reserve estimates are based on assumptions that include mining, metallurgical, infrastructure, permitting, taxation, and economic parameters. Increasing costs and taxation and lower metal prices will have a negative impact on the quantity of estimated mineral reserves. There are no other known factors that may have a material impact on the estimate of mineral reserves.
15.2 Planned dilution and loss Planned dilution and loss was considered as described in section 14.10.
15.3 Value estimates For open pit mineral reserves, a value per tonne was applied to each block based on grade, metallurgical recovery, mineral reserve metal prices, and costs including refining, transportation, royalties, processing, G&A, and leach pad sustaining capital. Processing costs and metallurgical recoveries were estimated using the combined heap leach / pulp agglomeration treatment process. The metallurgical recoveries are shown in Table 14.1, the economic parameters for silver and gold are shown in Table 14.2, and the cost parameters are shown in Table 14.3.
For underground mineral reserves, an NSR value was calculated for each block using the same assumptions used for the open pit, and assumed that all underground material will be processed through the pulp agglomeration plant.
15.4 Geotechnical parameters Golder Associates Inc. of Tucson, Arizona, USA, provided their recommendations for the geotechnical parameters for the open pit design, following their review of the available data and the rock conditions (Golder, 2013b), which is discussed in more detail in Section 16.2.2. Surface weathering and/or intense argillic alteration occurs to a depth of around 30 m. Benches above 30 m should be constructed with production bench heights of 7.5 m with 6.2 m wide catch benches located on each bench (separated by 7.5 m vertically). The bench face angle should be 60° resulting in an inter-ramp angle of 35°.

Pan American Silver Corp.
March 2017 58 of 98
Golder Associates Ltd. of Burnaby, British Columbia, Canada, provided their recommendations for underground stope design, following their review of the available data (Golder, 2013c), which is discussed in more detail in Section 16.2.2. The quality of the mineralized rock beneath and outside of the pit limits potentially mined by underground methods is good to very good. Golder suggests that the proposed average stope dimensions of 15 m wide by 100 m long by 25 m high are achievable in this good quality rock. However, larger stopes up to planned widths of 35 m may need to be split in two and sequentially mined and backfilled.
15.5 Pit design An optimized pit shell was prepared following the geotechnical parameters provided by Golder using Whittle software on mineral resource blocks classified as measured and indicated that have a positive value at mineral reserve metal prices. Roadways and other adjustments were made to the optimized pit shell using Minesight software to complete the pit design. The resulting pit develops in a series of phased outward expansions, comprising triple benches of 7.5 m high each and 9.1 m wide catch berms. A 24 m wide catch berm has been included in the design of the high west wall to mitigate the risk of failure. Below the weathering profile at a depth of 30 m, the inter-ramp angle of the final pit wall and for the internal phases has been designed at 52° as it is assumed that presplit blasting will be used for internal phases. The pit extends around 2,500 m in length trending to the northwest, and is about 750 m wide. A plan view of the ultimate pit is shown in Figure 15.1.
Figure 15.1 Reserve pit design

Pan American Silver Corp.
March 2017 59 of 98
15.6 Underground design For the underground stope shapes, a 3 m minimum mining width was assumed and additional planned dilution of 0.25 m was applied to both the hangingwall and footwall, using the estimated grade of the waste material. In stopes greater than 5 m wide, additional dilution was added to ensure a minimum total external dilution of 10%. Mining recovery of 92% was assumed to account for expected losses in the backfill and the open stoping mining method.
Potentially mineable stope shapes were generated using Deswik stope optimizer software based on geometrical, geotechnical, and economic NSR cut-off value constraints. The geometry and shape constraints were based on the geotechnical recommendations and used maximum stope lengths of 25 m and maximum stope heights of 25 m. The inventory within these stopes were further refined to exclude material in the crown pillars, in spatial outliers, within poor geometric shapes, and any other unmineable stopes. A plan view of the underground development and stopes relative to the final pit design is shown in Figure 15.2.
Figure 15.2 Underground design

Pan American Silver Corp.
March 2017 60 of 98
15.7 Mineral reserve tabulation Mineral reserves for Dolores as at December 31, 2016, comprising in situ material classified as proven and probable reserves constrained within a reserve pit and underground stopes designed using metal prices of $18.50 per ounce of silver and $1,300 per ounce of gold, as well as previously mined stockpiled economic material, are shown in Table 15.1. The in situ mineral reserves have been depleted for mining and stockpiles have been inventoried as at December 31, 2016.
Mineral reserve estimates are based on assumptions that include mining, metallurgical, infrastructure, permitting, taxation, and economic parameters. Increasing costs and taxation and a fall in metal prices will have a negative impact on the estimation of mineral reserves. There are no known factors that may have a material impact on the estimate of mineral reserves at Dolores.
Table 15.1 Dolores mineral reserves as at December 31, 2016
Location Classification Tonnes (Mt)
Ag ppm Ag contained metal (Moz)
Au ppm
Au contained metal (koz)
Open pit Proven 33.1 27 28.9 0.88 935.8
Probable 19.5 20 12.3 0.49 305.1
Proven + Probable 52.6 24 41.2 0.73 1,240.9
Underground Proven 1.1 81 2.8 1.28 44.3 Probable 3.0 58 5.6 1.73 167.2
Proven + Probable 4.1 64 8.4 1.61 211.5
Stockpiles Proven 7.4 18 4.3 0.23 54.9 Probable - - - - -
Proven + Probable 7.4 18 4.3 0.23 54.9
All Proven 41.6 27 36.1 0.77 1,034.9 Probable 22.5 25 17.9 0.65 472.4
Proven + Probable 64.1 26 54.0 0.73 1,507.3
Notes: Totals may not add up due to rounding. Mineral reserve estimates were prepared under the supervision of or were reviewed by Martin Wafforn, P. Eng., Senior Vice President, Technical Services and Process Optimization of Pan American. Mineral reserves have been estimated using metal prices of $18.50 per ounce of silver and $1,300 per ounce of gold.
15.8 Recommendations Mine staff will continue to monitor the stability of the pit walls on a routine basis with assistance from a geotechnical consultant. The geotechnical stope design parameters for the underground mine will be updated by a geotechnical consultant when sufficient development has been done within the mineralized zone to allow for analysis. Annual estimated costs for geotechnical

Pan American Silver Corp.
March 2017 61 of 98
monitoring, consulting support, drilling, testing, and instrumentation as necessary is in the order of $180,000.
The operating costs assumptions for the underground mine and the pulp agglomeration plant will be updated when sufficient operational data is available.

Pan American Silver Corp.
March 2017 62 of 98
16 Mining methods
16.1 Open pit operations
16.1.1 Mining methods Mining at Dolores has been ongoing since 2008 using conventional open pit methods with excavators, shovels, loaders, and haul trucks. The minimum mining unit is 7 m x 14 m x 7.5 m. Ore grade control drilling is carried out using angled reverse circulation drilling to provide closer spaced sample data for a grade control estimate, which is used to mark out the ore and waste mining boundaries. The grade control holes are oriented perpendicular to the strike of the deposit on sections spaced every 15 m along strike and every 10 m to 15 m across strike. Drillholes are approximately 43 m long, which results in a vertical span of 30.2 m, equal to four bench heights. The holes pattern is offset with 25% of the holes drilled from each bench to provide full coverage. The reverse circulation drillholes are logged for lithology and oxidation and sampled every 2 m.
Ore and waste material is drilled and blasted using 135 mm diameter, 8.5 m deep blast holes spaced 4.5 m along strike and 4.5 m across strike, charged with ammonium nitrate fuel oil (“ANFO”). Ore and waste are usually blasted separately and a blast movement monitoring system is in place to minimize ore loss, dilution, and material misclassification.
16.1.2 Geotechnical and hydrological parameters Golder Associates Inc. of Arizona, USA, made recommendations for the geotechnical parameters for the open pit design, following their review of the rock conditions at site (Golder, 2013a). Golder supervised the drilling of three oriented diamond drillholes to extend the geotechnical database in the north and south of the southwest wall.
Golder classified the rocks present in the mining area into two major lithology types including a latite group consisting of non-welded latite tuff, breccias, flows, dikes, and sills, and an andesite group consisting of andesite volcanics, porphyry intrusives, and diorite intrusives. The structural model consists of a dominant structural fabric striking 330° and dipping steeply to the west that pre-dates mineralization and cuts through both major lithology groups. Faults following this trend typically comprise normal faults dipping to the southwest. Conjugate normal faults and reverse faults dipping to the northeast are also present. A weak orthogonal system of normal and wrench faults striking east-west are also part of the major structural model. Minor structures including joints and veins typically follow the major structural trends, and a joint set dipping to the northeast at a shallower angle than the overall fabric is present within the pit.
The geomechanical model includes the data collected from nine oriented diamond drillholes, 30 unconfined compression tests, six disk tension tests, 11 triaxial compression tests, 43 uniaxial compressive strength tests, and four direct shear tests of saw cut joints in the drill core. The tests on the drill core indicate good to very good rock quality and that the structural conditions are generally favourable for the development of steep inter-ramp slopes in all sectors of the pit except

Pan American Silver Corp.
March 2017 63 of 98
within the upper weathered zone and other surface areas affected by intense argillic weathering of the rock, which generally occurs to a depth of approximately 30 m below the surface.
Hydrogeological studies indicate generally low permeability of the rock mass with very steep groundwater gradients towards the steep sided drainage valleys, likely following faults, fractures, and other geological boundaries. The groundwater elevation varies from 1,400 m to 1,575 m above mean sea level.
Golder recommended production bench heights of 7.5 m with 7.5 m wide catch benches located after each bench for mining areas within 30 m of the surface, and catch benches located each third bench or each 22.5 m vertically for mining areas below 30 m. For pre-split and trim mining, the recommended catch bench width is 9.1 m, with a bench face angle of 70° and an inter-ramp angle of 52°. For buffered blasting, the recommended catch bench width is 9.5 m with a bench face angle of 67° and an inter-ramp angle of 50°.
The mine conducts routine geotechnical monitoring and geological pit mapping, and has completed a program of oriented geotechnical drillholes targeted at the ultimate pit walls. A geotechnical consultant, W. K. Walker, P.E. of Tucson, Arizona, USA, undertook geological pit mapping and a review of bench and inter-ramp slope stability in 2015, which confirm Golder’s findings.
16.1.3 Production and process rates and expected mine life The open pit life of mine plan is based on the open pit mineral reserves presented in Section 15.7 and has been developed with all mining sourced from the planned open pit design, feeding the crushing plant, pulp agglomeration plant, and heap leach system at a rate of 18,500 tpd. The material will follow either the pulp agglomeration process route or the heap leach only process route depending on ore grade. In the life of mine plan, the annual mining rate is held at close to the current rate of 43 million tonnes of ore and waste for the next three years then declines thereafter, with mining completed in 2024. The pulp agglomeration plant starts operating in the second half of 2017 and ramps up to its full capacity of 5,600 tpd by the end of the year. Stacking of crushed ore on the heap leach pads is completed in 2026. Production from residual leach-down of silver and gold from the heap leach pads is projected to continue through 2029. The projected mine life may increase if additional mineral resources are defined and can be converted to mineral reserves.
The open pit has been designed with multiple phases to allow for earlier access to higher grade ore in the pit and to provide a smoothed mining schedule that minimizes peak open pit mining fleet requirements. Where excess ore is available in the mine plan, the mine will stockpile lower grade material for processing later in the mine life.
16.1.4 Waste mining Open pit waste mining is estimated to average a rate of 33.8 million tonnes per annum through 2020, then declines until completed in 2024. Waste mining in the life of mine plan totals 187.7 million tonnes from 2017, for a strip ratio of 1 to 3.6. The majority of the waste will be stored to the south of the pit. The mining sequence is planned to focus on the higher grade material in the south

Pan American Silver Corp.
March 2017 64 of 98
of the pit with waste material stored in the east waste rock facility. When the last phase of mining in the south is completed, mining will switch to the north part of the pit with some of the waste stored inside the pit and the remainder at the north waste rock facility.
16.1.5 Mining fleet and machinery The mining fleet operated by Pan American includes nine Komatsu HD785-5 78 tonne capacity haul trucks, three Caterpillar 777F 91 tonne capacity haul trucks, five Caterpillar 777G 91 tonne capacity haul trucks, two Komatsu PC3000-6 shovels, two Komatsu PC1250SP-8 excavators, one Komatsu WA900-3A wheel loader, one Caterpillar 992K wheel loader, one Caterpillar 988K wheel loader, two Komatsu D375A-5 and one Komatsu D155AX-6 bulldozers, two Komatsu WD500-3 wheel dozers, two Komatsu GD825A-2 bladed road graders, one Komatsu GD555-3A motor grader, five Atlas Copco DM-45E blast hole drill rigs, one Atlas Copco DM780D blast hole drill rig, and one Schramm T450WS reverse circulation drill rig.
The mining fleet operated by the site mining contractor, PEAL, includes two Komatsu PC1250 excavators, one Komatsu PC2000 shovel, ten Caterpillar 777F 91 tonne capacity haul trucks, two Atlas Copco blast hole drill rigs, one Caterpillar 16H bladed road grader, one Caterpillar D10T and one Caterpillar D8T bulldozers, one water truck, one diesel re-fuel truck, and a flatbed work truck.
The mine plan has been designed to maintain the current fleet of company owned and contractor owned trucks, which will be sufficient to meet maximum production requirements.
16.1.6 Recommendations Pan American will continue to optimize blasting patterns, and monitoring blast movements and pit slope stability. Recommendations have been made for additional geotechnical work (Walker, 2015), including:
• Review drill core and core photographs in the final upper pit slopes to obtain RQD data and drill additional geomechanical core holes if necessary to gain full coverage. Review overall slope stability and revise the overall slope stability analysis if required.
• Prioritize the testing of natural fracture surfaces in future testing programs, as to date only saw-cut rock has been used to determine fracture shear strength.
• Prioritize additional laboratory testing of diorite, depending on the requirements and overall slope stability review.
• Avoid pushing material over the crest of pit benches and operationally minimize the overbank.
• Continually observe the orientation, length, and location of continuous major structures as mining progresses and extend the geological and geotechnical model beyond the ultimate pit crest to understand the behaviour of the overall slopes.

Pan American Silver Corp.
March 2017 65 of 98
16.2 Underground operations
16.2.1 Mining methods The underground mine will operate concurrently with open pit mining and will be completed at approximately the same time. The mining method is open stoping, mostly oriented longitudinally, which takes into account the competent ground conditions and the requirement to tight fill stopes beneath the open pit. Golder (2014) advised that stope heights of 25 m, widths of 15 m, and lengths of up to 100 m will be stable. Avoca long hole mining will be used for stopes with widths from 3.5 m to 7 m, longitudinal long hole stopes will be used for stopes from 7 m to 15 m wide, and transverse long hole stopes will be used for stopes greater than 15 m wide. The average stope width is 5.0 m. There are localized areas with stope widths between 10 m and 20 m, and these are mined using a primary and secondary sequence with cemented fill. The average stope length used in the design is 25 m.
The stopes are planned to be mined up into the completed open pit, or will be mined and tight filled prior to mining by open pit methods. The sections of the pit that are used for in-pit waste rock dumping will not be mined from beneath and will be left as crown pillars. The necessary backfill material will comprise both cemented and uncemented rock fill. Cemented fill will be used in the thicker parts of the deposit where the mining method uses primary and secondary stoping sequences. The cemented rock fill will be prepared from a cement slurry prepared in a mixer, discharged onto mine waste in a mixing pit, and mixed with a front end loader bucket.
Sill drifts will be developed along strike and spaced 25 m apart vertically. The sill drifts are designed at 4.5 m high to accommodate long hole drills and remote control scoop trams. Footwall drives will be developed parallel to the ore drives to allow bypass access for stope backfill and to provide egress points along the extents of each level. The footwall and ore drives will be linked by nominal 20 m long crosscuts that act as draw points during stope development and as backfill tip heads during filling.
Access to the underground workings from the surface is via a ramp that approaches from the east of the pit. The ramp acts as a fresh air intake and is independent of the open pit. Alternate accesses will be developed over the life of mine from the final stages of the open pit, and these interactions will be scheduled to allow for in pit dumping of waste from the final mining stages of the northern phases of the open pit. The underground workings immediately below the planned open pit will be accessed by ramps extending from the southern underground workings and by short adits from the completed sections of the open pit. The total length of all lateral development in the plan is estimated at 51 km. Decline development is nominally 5.5 m wide by 5.5 m high.
The underground mine plan requires an estimated 280 m3 per second of airflow to safely ventilate the mine. Upcast return air raises fitted with surface fan installations will act as return air exhausts. The access decline serves as the primary intake supplemented by a downcast fresh air raise to maintain velocities in the decline within acceptable limits. A dedicated fresh air drive and return air drive connects the ventilation shafts to the mining horizon.

Pan American Silver Corp.
March 2017 66 of 98
A summary of the physicals developed from the mine plan are shown in Table 16.1.
Table 16.1 Underground mining physicals summary
Item Units Value
Stope ore kt 3,510
Development ore kt 572
Development waste kt 2,381
Lateral development m 51,041
Vertical development m 2,269
16.2.2 Geotechnical parameters
Geotechnical characterization Golder (2013c) provided geotechnical input into the underground mine design, building on the recommendations they had previously provided for the open pit mine (Golder, 2013b). Nine geotechnical drillholes completed for the open pit studies were supplemented by the review of RQD data and core photographs from exploration drillholes. Golder identified no major features or structures near the planned underground mine and believes that structural features will not adversely impact underground stability and that underground stopes will not adversely influence overall pit wall stability. Assessments of the rock mass, including uniaxial compressive strength tests, RQD and discontinuity spacing measurements, the condition of the discontinuities, and ground water conditions, indicates that the rock quality is generally good to very good. The data do not suggest any variability in rock quality related to lithology, mineralization, or alteration. The intact rock strength is considered generally very strong, at greater than 100 megapascals, based on uniaxial compressive strength tests.
The review of the drillhole photographs indicates consistently good quality rock with the exception of a single anomalous drillhole that shows poor quality, highly fractured rock. The reasons for the condition of this hole are unknown. Other holes nearby, however, indicate good quality rock, and the ground conditions in the anomalous drillhole appear to be localized to that one hole.
Based on the geotechnical information determined from core logging and strength testing, and from the observations of the drill core photographs, Golder concluded that the quality of all the mineralized rock beneath and outside the pit limits that might be mined by underground methods, is good to very good.
Geotechnical recommendations Based on the geotechnical characterization, underground stope dimensions of approximately 15 m wide by 100 m long by 25 m high are considered achievable.
Mesh and pattern bolting is the recommended ground support for stope development. 2.4 m long bolts at a spacing of 1.5 m across the back and ribs to within 2 m of the sill were assumed. Routine

Pan American Silver Corp.
March 2017 67 of 98
shotcrete is not considered necessary, but may be required in localized areas if poor quality rock is encountered. Some limited cable bolting of the backs may be necessary. Parallel drilling and controlled blasting techniques will be necessary, especially immediately adjacent to the hangingwall contact, to ensure the walls are not undercut on the levels.
The good quality rock, stable pit conditions, and the limited lengths of planned underground stopes indicate that underground stopes that will be subsequently intersected by the pit, or are located immediately below the open pit, should not have a destabilizing impact on the pit walls if the stopes are backfilled tightly with cemented backfill immediately after they are excavated.
Underground stope stability will require an adequate crown pillar between the open pit and the stopes during mining of each stope. Golder recommends that the stopes are mined and completely backfilled before the pit approaches within approximately 30 m of the stopes to avoid any adverse interaction developing between the open stopes and the pit. Following tight filling of the stopes, open pit mining will advance through the crown pillar to achieve full extraction of the reserve.
16.2.3 Production and process rates and expected mine life An underground schedule based on the underground mine plan targets a feed rate of 1,500 tpd to the pulp agglomeration circuit in tandem with the higher grade component of the feed from the open pit. Monthly development rates range between 570 m and 730 m during full production. The schedule indicates full production achieved by the end of 2017, with a mine life of approximately 8 years. The underground mine is estimated to provide feed to the pulp agglomeration plant until the end of 2024.
16.2.4 Waste mining Underground waste mining rates of approximately 300,000 to 400,000 tonnes per year are scheduled until the sixth year of mining, and are negligible thereafter. Waste will be utilized for stope backfill where possible, or hauled to surface waste dumps. An average of 150,000 tonnes of waste backfill will be sourced from the surface each year for stope backfill.
16.2.5 Mining fleet and machinery The underground mine is being developed by a mining contractor in the short term, primarily using a fleet of mining equipment provided by the contractor. Pan American owns two 50 tonne underground haul trucks, a 15 tonne scoop tram, and three portable refuge stations and will purchase mining equipment for production. The planned fleet of mobile equipment is shown in Table 16.2. The life of mine plan includes sustaining capital to overhaul and replace major equipment including drills, trucks, and loaders according to accrued service hours, while ancillary equipment and light vehicles will be replaced according to age.

Pan American Silver Corp.
March 2017 68 of 98
Table 16.2 Major underground equipment
Item Maximum fleet
Development drill 4
Bolting drill 2
Production drill 2
Underground dump truck 2
Ejector truck for rock fill haulage 3
Scoop tram 6
Blasting utility truck 1
Telescopic handler 2
Secondary ventilation fans 8
Portable refuge chamber 3
16.2.6 Recommendations Key recommendations include:
• Additional studies of potential water inflow and water pumping requirements. • Advancing the level of geotechnical knowledge as underground development progresses in the
mineralized zone. • Update the design of the interface between the underground and open pit operations as the
open pit life of mine plan changes. • Continue to track and update the operating cost estimates for the underground mine.

Pan American Silver Corp.
March 2017 69 of 98
17 Recovery methods
17.1 Heap leach flow sheet Broken ore is trucked to the crushing plant and crushed to a particle size of P80 6.3 mm in a three stage crushing circuit with a recirculating load at a nominal rate of 16,200 tpd. The crushed ore is sampled at regular intervals by a sample tower, conveyed to the leach pads via an overland conveyor system, and placed on the pads using portable grasshopper conveyors and a radial stacking system. Sodium cyanide solution is prepared in the Merrill-Crowe plant, pumped to the leach pads, and applied using drip and sprayer systems.
Metal recoveries are a function of solution flow rates, cyanide concentration, and time, and the metal leaching period can cover years, continuing as subsequent lifts are placed on the pads. Gravity collectors and/or vertical perforated steel pipes (well risers) fitted with internal pumps transfer the pregnant leach solution containing the dissolved silver and gold from the bottom of the leach piles to the pregnant solution pond and the Merrill-Crowe plant. The solution is clarified, de-oxygenated, and processed through a Merrill-Crowe circuit at a rate of approximately 1,300 m3 per hour. The clarified and de-oxygenated silver and gold cyanide solution is added to zinc dust, which triggers the precipitation of the silver and gold. The remaining barren cyanide solution is recycled back to the heap leach pad for continued processing, while the zinc, gold, and silver precipitate in suspension is pumped to filter presses and dried. Retort ovens remove trace amounts of mercury from the precipitate, then it is mixed with fluxes and melted in a furnace to form doré bars. The bars are cleaned, assayed, weighed, and transported to a third party refinery in North America for final recovery. The doré bars typically contain between 1% and 5% gold and 95% to 99% silver, with generally less than 1% impurities. The metals recovery circuit has the capacity to produce approximately 200,000 ounces of gold and 7.5 million ounces of silver, for 8 million ounces of doré annually.
The heap leach process is a closed circuit without tailings facilities and there is no release to the environment.
17.2 Pulp agglomeration flow sheet The pulp agglomeration plant will operate in an integrated fashion with the heap leach processing facilities. The flow sheet (KCA, 2016) is shown in Figure 17.1. High grade ore will be stockpiled on the run of mine pad, separated from the medium grade ore. The high grade feed will be tipped into a bin using front end loaders at a rate of 5,600 tpd. The feed will be recovered from the bin by a vibrating grizzly feeder and delivered to a primary jaw crusher (Metso C-160), and the discharge conveyed to a vibrating screen. Screen oversize will pass through a cone crusher (Metso HP-800) in a closed loop to produce a rod mill feed with a P80 of 12.8 mm. The screen undersize will report to a conveyor and radial stacker for depositing onto a fine feed stockpile. The material will be recovered from this stockpile via multiple reclaim feeders and a reclaim tunnel conveyor system to feed the rod mill (Nordberg 13’ by 18’8”).
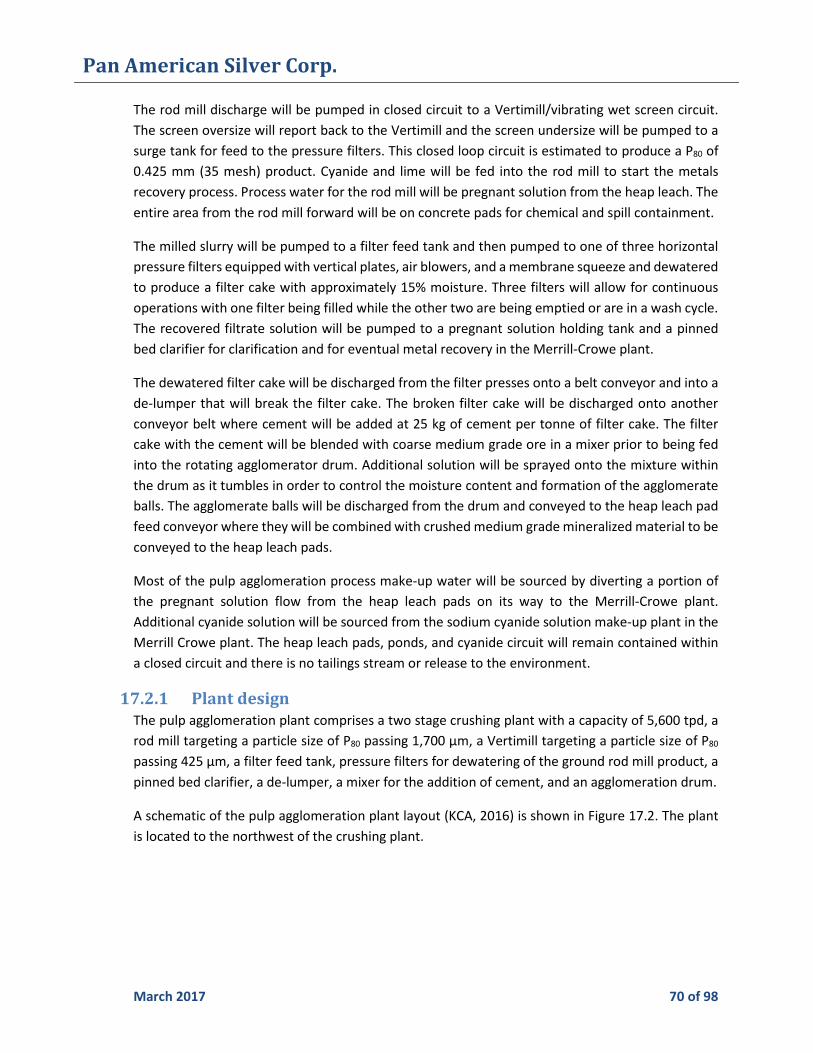
Pan American Silver Corp.
March 2017 70 of 98
The rod mill discharge will be pumped in closed circuit to a Vertimill/vibrating wet screen circuit. The screen oversize will report back to the Vertimill and the screen undersize will be pumped to a surge tank for feed to the pressure filters. This closed loop circuit is estimated to produce a P80 of 0.425 mm (35 mesh) product. Cyanide and lime will be fed into the rod mill to start the metals recovery process. Process water for the rod mill will be pregnant solution from the heap leach. The entire area from the rod mill forward will be on concrete pads for chemical and spill containment.
The milled slurry will be pumped to a filter feed tank and then pumped to one of three horizontal pressure filters equipped with vertical plates, air blowers, and a membrane squeeze and dewatered to produce a filter cake with approximately 15% moisture. Three filters will allow for continuous operations with one filter being filled while the other two are being emptied or are in a wash cycle. The recovered filtrate solution will be pumped to a pregnant solution holding tank and a pinned bed clarifier for clarification and for eventual metal recovery in the Merrill-Crowe plant.
The dewatered filter cake will be discharged from the filter presses onto a belt conveyor and into a de-lumper that will break the filter cake. The broken filter cake will be discharged onto another conveyor belt where cement will be added at 25 kg of cement per tonne of filter cake. The filter cake with the cement will be blended with coarse medium grade ore in a mixer prior to being fed into the rotating agglomerator drum. Additional solution will be sprayed onto the mixture within the drum as it tumbles in order to control the moisture content and formation of the agglomerate balls. The agglomerate balls will be discharged from the drum and conveyed to the heap leach pad feed conveyor where they will be combined with crushed medium grade mineralized material to be conveyed to the heap leach pads.
Most of the pulp agglomeration process make-up water will be sourced by diverting a portion of the pregnant solution flow from the heap leach pads on its way to the Merrill-Crowe plant. Additional cyanide solution will be sourced from the sodium cyanide solution make-up plant in the Merrill Crowe plant. The heap leach pads, ponds, and cyanide circuit will remain contained within a closed circuit and there is no tailings stream or release to the environment.
17.2.1 Plant design The pulp agglomeration plant comprises a two stage crushing plant with a capacity of 5,600 tpd, a rod mill targeting a particle size of P80 passing 1,700 µm, a Vertimill targeting a particle size of P80 passing 425 µm, a filter feed tank, pressure filters for dewatering of the ground rod mill product, a pinned bed clarifier, a de-lumper, a mixer for the addition of cement, and an agglomeration drum.
A schematic of the pulp agglomeration plant layout (KCA, 2016) is shown in Figure 17.2. The plant is located to the northwest of the crushing plant.

Pan American Silver Corp.
March 2017 71 of 98
Figure 17.1 Pulp agglomeration flow sheet
Figure 17.2 Pulp agglomeration plant layout
17.2.2 Equipment and specifications The specifications for the pulp agglomeration plant are shown in Table 17.1.

Pan American Silver Corp.
March 2017 72 of 98
Table 17.1 Equipment specifications
Item Unit Value
Crusher run of mine feed size F98, mm 800
Combined crusher utilization and availability % 75
Crusher throughput Tonnes per hour 311
Primary crusher feeder
Type
Make and model
Vibrating grizzly
Hewitt Robins 60 x 30 – 2E13
Primary crusher Type
Make and model
Installed power
kW
Jaw
Metso C160
261
Secondary screen
Type Make and model
Dimensions: width x length
m
Inclined vibrating double deck Metso MF 2473-2
2.44 x 7.3
Secondary crusher
Type Make and model
Power: operating and installed
kW
Standard head cone Metso HP800
339 and 450
Crushed ore stacker
Type
Rate: nominal and design Belt width
Dry t/h mm
Radial stacker with stinger
311 and 373 762
Rod Mill
Make and model
Feed size
Product size Diameter and length
Motor rating
Mill operating density
F80, mm
P80, µm m
kW
% w/w
Nordberg 13’ x 18’8”
12.8
1,700 3.96 and 5.69
1,119
70
Vertimill
Make and model Feed size
F80, mm
Metso VTM 1500-WB 1,560

Pan American Silver Corp.
March 2017 73 of 98
Item Unit Value
Product size
Motor rating
Mill operating density
P80, µm
kW
% w/w
425
1,500
65 to 75
Screen
Quantity and type Make and model
Size: width x length
Aperture size
m
m
1 oversize Derrick W56-168R-4
1.52 x 4.27
1.0
Filter
Quantity and type Make and model
Plate size
m
3 filter presses Diemme GHT 2500-F16
2.5 x 2.5
Filter feed tank
Quantity and type
Working volume Size, diameter and height
m3 m
1 carbon steel agitated
2,572 14.85 x 16.05
Clarification
Quantity, make, and model
Material
Working volume Size, diameter and height
m3 m
1 pinned-bed Delkor
Carbon steel
71.6 4.5 x 5
De-lumper
Quantity, make, and model
2 Franklin Miller DC3256LP-HD
Filter cake mixer
Quantity, make, and model
1 BHS-Sonthofen DKXC 7300
Agglomeration drum Quantity, make, and model
1 Sepro 860-AD-01

Pan American Silver Corp.
March 2017 74 of 98
The estimated reagent requirements are shown in Table 17.2.
Table 17.2 Pulp agglomeration reagent requirements
Item Unit Value
Pebble lime
Addition rate
Silo capacity
kg/t
t
1.15
20
Sodium cyanide briquettes
Consumption
kg/t
0.5
Portland type II cement (dry)
Addition rate
Silo capacity
kg/t
t
25
200
17.3 Power and water Water for the operations is sourced from wells, pit and underground dewatering activities, the nearby Tutuaca River, and from the Chabacan dam. In recent years, the water supply from mine dewatering and precipitation on the leach pads and Chabacan Dam catchment has been sufficient for process needs without requiring any extraction from the Tutuaca River.
A 115 kV, 98 km long power line connected to the Mexican national grid in 2016 supplies power to the mine and is sufficient for the current needs of the operation. Back up power is available on site by six 1,800 kilowatt (“kW”) Cummins and two 1,200 kW Caterpillar diesel generators. The total power requirements of the operations including the open pit and underground operations and processing facilities is estimated at 17 MW, although this may increase if the water pumping requirements in the underground are more than currently projected. A rented generating set is currently providing the additional temporary requirements for the construction of the pulp agglomeration plant. Projected power requirements in the future will be met by new grid infrastructure currently under construction.

Pan American Silver Corp.
March 2017 75 of 98
18 Project infrastructure A plan of the current site facilities is shown in the photograph in Figure 18.1.
Figure 18.1 Mine infrastructure plan
18.1 Logistics The main road access to the Property is via 92 km of unpaved roads leading north from Federal Highway 16, near Yepachic, Chihuahua. Access for personnel is provided by an unpaved landing strip suitable for light aircraft, located about 8 km from the mine.
18.2 Processing facilities The crushing facilities include run of mine stockpiles of material awaiting crushing and a three stage crushing plant. Crushing facilities at the pulp agglomeration plant include a run of mine ore pad, a

Pan American Silver Corp.
March 2017 76 of 98
vibrating grizzly feeder, a primary jaw crusher, a secondary screen and a secondary cone crusher, a sample tower, belt conveyors, a dust suppression system, a tramp iron magnet, and feeders discharging to the crushed ore stockpile.
The infrastructure for the grinding area include a stockpile reclaim and rod mill feed belt conveyor, a rod mill, a scalping screen, a Vertimill, mill discharge and associated pumps, a metal detector and magnet, piping, instrumentation, platforms and support structures, and control room.
The infrastructure for the filtration facilities include a filter feed surge tank and agitator, filter feed pumps, three filter presses, filter cake conveyors, filtrate tank, automatic samplers, pinned bed clarifier, filtrate pump, piping, instrumentation, and platforms and support structures.
The infrastructure for the mixing facilities includes a de-lumper, mixer, cement silo, conveyors, instrumentation, platforms, a sampler, and support structures. The infrastructure for the agglomeration facilities include an agglomeration drum, process solution sprayers, instrumentation, platforms, support structures, and conveyors.
A series of fixed and portable conveyor belts transport the crushed material to heap leach pads. An expanded pumping system is under construction to optimize the use of sodium cyanide.
The Merrill-Crowe plant includes clarifier filters, two vacuum towers, a zinc cone, filter presses, cyanide preparation area, cyanide storage area, pumps, piping, instrumentation, platforms, and support structures including control room, kitchenette, changing rooms, and washrooms. The smelting facility includes a retort, a furnace, ventilation system, security system, platforms, and support structures.
The infrastructure for the reagent facilities include tanks, mixers, pumps, metering pumps, piping, instrumentation, platforms and support structures, storage facilities, two overhead travelling cranes, and splitters. The facilities have the capacity to store a two day supply of cement and a one month supply of lime and sodium cyanide.
18.3 Auxiliary facilities A power generation plant is located to the west of the ponds and maintenance shops and warehouses are located near the mine offices. A 115 kV, 98 km long power line connected to the Mexican national grid in 2016 supplies power to the mine and is sufficient for the current needs of the operation. Back up power is available on site by six 1,800 kilowatt (“kW”) Cummins and two 1,200 kW Caterpillar diesel generators. The facilities also include compressed air, power supply, and process solution and water management systems. Surface ventilation fans mounted on concrete footings are installed on raises exhausting return air from the underground operation.
18.4 Waste storage and stockpile facilities Three waste storage facilities are located to the north, west, and south of the open pit mine workings. Approximately a dozen stockpiles of medium grade ore are located around the mine workings to allow for the preferential crushing and stacking of higher grade ore.

Pan American Silver Corp.
March 2017 77 of 98
19 Market studies and contracts
19.1 Contracts and marketing Dolores has a contract in place with a mining contractor, PEAL Mexico of Hermosillo, Mexico, to undertake an agreed upon amount of mining per year, most of which takes place in the waste areas.
Dolores has contracts in place with Asahi Refining USA Inc. of Salt Lake City, Utah, Republic Metals Corporation of Miami, Florida, and Met-Mex Peñoles S.A. de C.V. of Torreon, Mexico, for refining the doré produced on site. The doré is transported to these facilities where it is refined to the London Good Delivery specification, which is defined as a minimum of 995.0 parts per thousand of fine gold and a minimum of 999.0 parts per thousand of silver. Once refined, the good delivery gold and silver is sold on the international market to bullion banks, financial institutions, and traders. To date, no issues have been encountered in securing the sale of the refined metal from Dolores or for the doré produced at Pan American’s other two mines operating in Mexico. No forward sales or hedging takes place at this time.
19.2 Review by the Qualified Person Martin Wafforn, the Qualified Person responsible for this section of the technical report, has reviewed the contract terms, rates, and charges for the production and sale of the silver and gold produced at Dolores, and consider them sufficient to support the assumptions made in this technical report.

Pan American Silver Corp.
March 2017 78 of 98
20 Environmental studies, permitting, and social or community impact
20.1 Environmental factors The most significant environmental liabilities associated with the Property include surface disturbance and reclamation liabilities and issues related to the stability and containment system of heap leach Pad 1, which developed prior to Pan American’s acquisition of the Property. A tear in the liner of Pad 1 developed in June 2010 following movement in the stability berm and significant leakage was collected by the leak collection system. Minefinders ceased stacking and irrigation on Pad 1 and relocated approximately 2 million tonnes of ore to heap leach Pad 2. The pad under the excavated material was examined and stabilized with an additional retaining wall structure, and the damaged liner was repaired. No sodium cyanide was detected in the downstream surface and ground water sampling points as a result of the failure, and continued soil and water sampling below Pad 1 has confirmed that no residual cyanide is present.
Approximately 6.4 million tonnes of ore remain in a stable state on Pad 1, awaiting transfer to another operational pad. Full remediation of the Pad 1 liner system will be required as the life of mine plan and leach pad capacity estimates indicate that the pad area will be required for use in the future. The additional costs associated with moving the ore and reconstructing the pad, as well as the additional metal production from the partially spent ore currently on Pad 1, have been accounted for in the life of mine plan.
Pan American has implemented additional contingency measures in and around the heap leach pads, including the installation of well riser type over-liner solution collection systems, additional under drain and leak collection systems, and a network of containment, monitoring, and demonstration wells. Pan American also engages in construction and expansions to the pads after application of rigorous quality control to both the design and construction of the facilities.
The surface disturbance and reclamation liabilities are addressed under Pan American’s project reclamation and closure plan, which is discussed in Section 20.10.
20.2 Environmental studies A full suite of environmental baseline studies was completed by Minefinders as part of its original permit application for the construction of the mine. Pan American has continued environmental monitoring in and around the mine and continues to add to the environmental database.
Static and kinetic testing was conducted during the feasibility and permitting phases of the mine development in order to ascertain potential for acid generation in the waste and ore materials. That work determined that only a small portion of the waste is potentially acid generating and no specific measures to manage waste or ore deposition were required. Pan American is reviewing the representativity of the samples tested against the current mineral resource and reserve estimate and mine plan, and will conduct new sampling and testing to increase the available data and to improve the understanding of potential acid and metal leaching issues during operation and post-closure.

Pan American Silver Corp.
March 2017 79 of 98
20.3 Pan American’s environmental policy Pan American has committed to operate all mines and develop new projects in an environmentally responsible manner. The existing environmental conditions at each site are evaluated and Pan American strives to minimize and mitigate environmental impacts of mining and processing operations by applying prudent design and operating practices, and by educating employees and contractors who work at company facilities. Pan American has an environmental policy that all employees and contractors are required to follow.
20.4 Permitting factors Pan American holds all necessary environmental and operating permits for the development and operation of the mine and processing facilities and is in compliance with Mexican law.
SEMARNAT approved permit applications for the construction and operation of the mine, including an MIA, a Technical Justification Study for Change of Land-Use, and an Environmental Risk Study in April 2006. These studies include a full assessment of the environmental and social impacts of the mine and environmental management plans, which describe the ongoing management and environmental monitoring programs.
Other principal permits include an Accident Prevention Program, a Surface Water Extraction Authorization, an MIA for an underground exploration ramp, and a Waste Management Plan. A permit for the construction of the pulp agglomeration facility was obtained in 2016. These permits are renewed regularly and as far as Pan American is aware, all of the permits required for the mine and processing operations are in good standing.
There are some minor boundary differences between the MIA and Change of Land Use permits that occur in various areas of the Dolores site, including the location of the pulp agglomeration plant. The resolution of the boundary differences will be the subject of a “regularization” process that is not anticipated to have a material impact on the operation of the pulp agglomeration plant.
Modifications to the existing permits will be necessary to obtain authorization for future activities such as adjustments to the life of mine open pit operations, waste rock facilities, and leach pads. Any modification application for these activities will require an updated MIA, Environmental Risk Assessment, and Technical Justification Study for Land Use Change. The required technical baseline studies and impact assessment for these updates would be based on the extensive monitoring database that has been developed, and conducted by an independent environmental consultant. Due to the minor changes in footprint and the overall impacts that these changes imply, as well as the current good standing of the existing permits, it is expected that the necessary permit modifications could be completed within standard regulatory timeframes of five to eight months.
20.5 Waste disposal Mine waste is deposited in three constructed waste rock facilities located around the pit, one of which has reached full capacity. Environmental permits include an allowance for another facility that is not currently planned for use, in preference of expanding two of the existing facilities. The

Pan American Silver Corp.
March 2017 80 of 98
changes to the projected waste rock facility layouts are covered in a modification application to the current environmental permits that are currently being evaluated by SEMARNAT. The life of mine plan also contemplates storing some waste in the southern portion of the open pit mine when mining has been completed in that area.
The mine operates a closed circuit processing system without tailings facilities.
20.6 Site monitoring The mine operates an extensive monitoring program that includes surface and groundwater, waste, air quality, noise, flora and fauna, and socio-economics. There has been no material effect on the cost of any modifications to the existing, future, or post-closure monitoring programs as a result of the expanded operations.
20.7 Water management Water for the operations is sourced from wells, pit and underground dewatering activities, the nearby Tutuaca River, and from the Chabacan dam. In recent years, the water supply from mine dewatering and precipitation on the leach pads and Chabacan Dam catchment has been sufficient for process needs without requiring any extraction from the Tutuaca River. The Chabacan dam reservoir has a capacity of 1.2 million m3 and provides storm water control as well as primary water storage. The permitted water usage from the Tutuaca River is 2.0 million m3 per annum at a maximum rate of 64 litres per second, and the water extraction permit remains in good standing should it be required in the future. No modification to the permits are anticipated to supply any mining and processing expansions. Process water is recycled and the mine has essentially no discharge except for effluent from domestic waste water treatment plants servicing the offices and camp.
20.8 Environmental certification The Dolores mine voluntarily participates in the Mexican Federal Environmental Protection Authority’s (“PROFEPA”) Clean Industry Program that involves independent verification of compliance with all environmental permits and the implementation of good practice environmental management procedures and practices.
20.9 Social and community factors The majority of the surface rights on the Property are owned by Ejido Huizopa. An ejido is an area of communal land registered with the National Agrarian Registry of Mexico and parcelled out to community members for agricultural use. The Dolores mine has surface rights agreements with Ejido Huizopa and with several individual members of the ejido dating from November 2006 which allows for irrevocable access and the right to carry out exploration and mining activities for a term of 15 years with a right to extend for a further 15 years. These surface rights provide sufficient access to the mining operations, waste storage areas, heap leach pad areas, and other facilities. The agreement provided for relocation of the old village of Dolores, which formerly occupied an area directly over the southern end of the deposit. Construction of the new town and relocation of all families from within the Property area was completed by the end of 2009.

Pan American Silver Corp.
March 2017 81 of 98
The Dolores community relations team implements an extensive program of community engagement activities including information sessions, infrastructure works, and educational and training programs for the local people that have resulted in the establishment of several small businesses. Unskilled workers are sourced from nearby small villages, and Pan American has recruiting and training programs in place to develop the mining skills of the local workforce. Dolores is recognized as a Socially Responsible Enterprise by the Mexican Center for Philanthropy.
Pan American, through its Corporate Social Responsibility Policy, has committed to operating all of its mines in harmony with the communities where they are located, and to continually improve standards of social responsibility and to make a positive difference in the surrounding communities by fostering sustainable development.
20.10 Project reclamation and closure A closure cost estimate for Dolores was prepared in 2012 according to Pan American’s standard methodology, which employs the State of Nevada approved Standardized Reclamation Cost Estimator (“SRCE”) model. This estimate includes consideration of all surface disturbance and reclamation liability at the site and is updated on an annual basis. The Dolores SRCE model includes demolition of all site infrastructure, re-grading of waste rock facilities, rinsing and covering leach pads, and complete re-vegetation of the site. The current life of mine model estimates the undiscounted value of reclamation costs or environmental liability for the Property to be approximately $31.4 million. Reclamation bonds are not currently a legal requirement in Mexico.
20.11 Expected material environmental issues There are no known environmental or social issues that could materially impact the mine’s ability to extract the mineral resources or reserves.

Pan American Silver Corp.
March 2017 82 of 98
21 Capital and operating costs
21.1 Open pit mining costs Sustaining capital expenditures for the open pit operation are estimated to total $32.9 million over the remaining mine life. This includes an estimated $29.2 million for mining, primarily for the rebuild and replacement of the mining equipment fleet and $3.7 million for G&A. No capitalization of waste mining or pre-stripping strategy has been assumed.
A mining rate to provide 18,500 tpd of ore is assumed for the estimate of operating costs. Mining costs are estimated to total $432.0 million to mine 240.4 million total ore and waste tonnes, including stockpiling and re-handling costs over the life of the mine. G&A charges are estimated to total $156.2 million over the life of mine. A summary of the costs are shown in Table 21.1.
Table 21.1 Open pit sustaining and operating costs
Item Cost $M
Mining 29.2
G&A 3.7
Total sustaining costs 32.9
Mining 432.0
G&A 156.2
Total operating costs 588.2
21.2 Underground mining costs Capital costs for the mobile equipment were estimated using data from other underground studies in Mexico and elsewhere. Over the life of mine, the estimated capital cost is $82.3 million, excluding equipment already obtained. Of this, $23.5 million can be considered initial capital, which includes costs incurred in 2017 and the cost of additional fleet capacity as the mine develops. The sustaining capital is for stope access development and equipment rebuilds. All primary access declines, ventilation raises, and cross cuts are capitalized, while level development is capitalized until full production is achieved. Level stope access development is treated as an operating expense thereafter. A summary of the estimated initial and sustaining capital costs is shown in Table 21.2.
Table 21.2 Underground initial and sustaining costs
Item Initial cost $M Life of mine sustaining cost $M
Capital development 14.2 44.0
Mobile equipment 3.5 11.3
Supervision/staff 2.7 0
Infrastructure 1.3 0
Diamond drilling 1.8 0

Pan American Silver Corp.
March 2017 83 of 98
Item Initial cost $M Life of mine sustaining cost $M
Total 23.5 55.3
The operating cost model was developed for the underground using fundamental productivity assumptions for the nominated equipment combined with physicals from the schedule to build up fleet size and fleet utilization values. This was combined with unit operating costs for the equipment, unit costs for material, and labour costs, which were derived from, in some cases, first principals, and in other cases, previous similar studies or operational experience at Dolores.
Based on the underground mining schedule, the total operating cost over the life of mine is estimated to be $122.3 million, which equates to $29.97 per tonne of ore mined. Operating costs include all underground mining costs, up to the delivery of the ore to the crusher stockpile, or waste to the final backfill or waste rock facility location. Operating costs are estimated to be expended at an annual rate of between $14 and $23 million when in full production. A summary of the operating cost items is shown in Table 21.3.
Table 21.3 Underground operating costs
Item Total cost $M Average annual cost $M
$ per tonne ore
Development 80.7 12.6 19.78
Stoping 41.6 5.9 10.19
Total 122.3 18.5 29.97
21.3 Processing costs The initial capital cost estimate for design engineering, procurement, construction, and start-up of the pulp agglomeration plant is expected to be in the order of $73.0 million. Construction of the plant is underway and some of the capital expenditures occurred in 2016. Initial capital spending estimated to occur in 2017 is in the order of $30.0 million for the pulp agglomeration plant and $0.5 million for completion of the overland conveyor installation at the heap leach pad. Sustaining capital is estimated at $77.0 million, including $67.5 million for heap leach pad expansion, $6.3 million for the processing plant, $1.7 million for the pulp agglomeration plant, and $1.5 million for the pad pumping system upgrade. A breakdown of the costs is shown in Table 21.4.
Table 21.4 Pulp agglomeration initial and sustaining capital costs
Item Cost $M
Initial capital
Pulp agglomeration plant 30.0
Overland conveyor installation 0.5
Total initial capital 30.5
Sustaining capital

Pan American Silver Corp.
March 2017 84 of 98
Item Cost $M
Heap leach pad expansion 67.5
Process plant 6.3
Pulp agglomeration plant 1.7
Pad pumping system upgrade 1.5
Total sustaining capital 77.0
For the estimate of operating costs, the operation is assumed to mine, crush, and convey material to the heap leach pads at the rate of 16,200 tpd until the pulp agglomeration plant begins operation in mid-2017. Thereafter, throughput at the pulp agglomeration plant will ramp up for the remainder of 2017, and beginning in 2018 and for the remaining life of mine, the pulp agglomeration plant will process 5,600 tpd and the crushing plant will process 14,400 tpd.
Operating costs for the heap leach operation treating 16,200 tpd are known from the existing operation while operating costs for the pulp agglomeration plant were developed from equipment manuals and vendor recommendations, operational experience and costs of the current operations, supplies and reagent costs, and test work results. Power costs were estimated based on motor size, power demand for the processing areas, and projected power unit costs. Wear and media costs were estimated based on test work results and databases, as well as actual consumption and costs at Dolores. Reagents and consumables were derived from test work results and actual consumption at the mine. Labour cost estimates are based on actual current rates at the operation. When the pulp agglomeration plant reaches a processing rate of 5,600 tpd and the crushing plant processes 14,400 tpd, costs for common facilities such as the heap leach pads and Merrill Crowe plant will be shared proportionally.
Processing operating costs are estimated at $469.3 million, including $251.4 million for crushing and heap leaching of coarse medium grade ore, $199.2 million for high grade ore processed through the pulp agglomeration plant, $15.2 million for solution recirculation and processing in the final years, and $3.5 million for Pad 1 material re-handling. Unit costs are $5.17 per tonne of ore for the coarse medium grade ore and $12.86 per tonne of ore for the pulp agglomeration high grade ore. A detailed breakdown of the operating costs is shown in Table 21.5.
Table 21.5 Processing facility operating costs
Item Total cost $M
Average annual cost
$ per tonne of ore
Ore direct to heap leach pads 251.4 27.1 5.17
Ore through pulp agglomeration 199.2 26.6 12.86
Solution recirculation 15.2
Pad 1 re-handling 3.5
Total operating cost 469.3 53.7 7.32

Pan American Silver Corp.
March 2017 85 of 98
22 Economic analysis
22.1 Estimated life of mine plan The life of mine plan for the mineral reserves as at December 31, 2016 is for processing a total of 52.6 million tonnes of ore from the open pit mine, 4.1 million tonnes of ore from the underground mine, and 7.4 million tonnes of stockpiled ore awaiting processing. The open pit ore mining rate varies annually from between 5.9 million to 7.8 million tonnes until 2024. The open pit mining requires the removal of 187.7 million tonnes of waste to access the ore, for a strip ratio of 1 to 3.6.
The underground mine reaches full production by the end of 2017, with a target of 1,500 tpd of ore from both development and stope sources. Due to interactions between development and stope sequencing, annual underground production varies between 510,000 tonnes and 600,000 tonnes until the end of 2024.
Processing of stockpiles continues until 2026 and metal recovery from the heap leach pads extends to 2029. The total produced ounces accounting for metallurgical recovery is estimated at 43.2 million ounces of silver and 1.1 million ounces of gold.
Crushing occurs at a rate of 16,200 tpd until mid-2017 following the completion of the pulp agglomeration plant and underground mine development, when the processing rate will increase to 20,000 tpd rate, including 14,400 tpd in the crushing circuit and 5,600 tpd in the pulp agglomeration circuit.
The estimated annual production schedule and annual cash flow forecast for the life of mine are shown in Table 22.2.
22.2 Estimated cash flow forecast The operating cash flow is estimated to total $807.0 million, which is comprised of an estimated revenue of $2,288.4 million, $1,179.9 million in operating costs, $16.3 million in smelting and refining charges, $71.2 million relating to Special Mining Duty of 7.5% applied to EBITDA, $11.4 million relating to the Extraordinary Mining Duty of 0.5% applied to the sales of gold and silver, $64.4 million on royalties payable to RG Mexico Inc., $11.4 million in reclamation expenditures net of salvage value, and $126.7 million in income taxes. After accounting for capital expenditures, the total net cash flow for the operation is estimated to be $584.2 million. The after tax NPV at a 6% discount rate is estimated at $432.4 million. The internal rate of return (“IRR”) is positive but as most of the capital has already been expended, the IRR is not relevant and is not presented. Similarly, the payback period is also not presented.
22.3 Estimated taxes, duties, and royalties The principal taxes of Mexico affecting Dolores include income tax, the Special and Extraordinary Mining Duties, annual fees for holding mineral properties, various payroll and social security taxes, and a refundable value added tax. Total taxes, mining duties, and mining duties payable to the government are forecast at $209.4 million.

Pan American Silver Corp.
March 2017 86 of 98
On October 31, 2013, the Mexican government enacted two new mining duties that became effective January 1, 2014, including a Special Mining Duty of 7.5% applied to EBITDA and an Extraordinary Mining Duty of 0.5% applied to sales of gold, silver, and platinum.
A net smelter return of 2.0% on silver and 3.25% on gold is payable to RG Mexico Inc., a subsidiary of Royal Gold Inc. Over the remaining life of the mine, royalties payable to RG Mexico Inc. are estimated to total $64.4 million.
22.4 Assumptions Justification for mining and processing costs is given in Section 21. As the life of mine plan considers only mineral reserves, no exploration expenses have been considered. Estimates of the processing and selling costs associated with ore treatment for the economic model are shown in Table 22.1.
Table 22.1 Processing and marketing parameters for the economic model
Parameter Units Heap at 14,400 tpd
Pulp agglomeration at 5,600 tpd
Processing costs
Process cost (with grid power including site G&A expenses and heap sustaining capital) $ per tonne 9.00 16.80
Selling costs
Gold price $ per ounce 1,300 1,300
Silver price $ per ounce 18.50 18.50
Payable gold % 99.85 99.85
Payable silver % 99.8 99.8
Refining charge silver $ per ounce 0.25 0.25
Transport $ per ounce doré 0.10 0.10
Gold royalty % 3.75 3.75
Silver royalty % 2.50 2.50
22.5 Sensitivity The sensitivity of the NPV at a 6% discount rate at variations in metal prices, operating costs, and metal grades were considered. At metal prices of $17.0 per ounce of silver and $1,200 per ounce of gold, the NPV is $347.6 million. At $20.0 per ounce of silver and $1,400 per ounce of gold, the NPV is $516.6 million.

Pan American Silver Corp.
March 2017 87 of 98
At $18.50 per ounce of silver and $1,300 per ounce of gold, and 10% increases to operating costs, the NPV is $373.8 million. At 10% reductions in operating costs, the NPV is $490.5 million. At the same metal prices and at 10% decreases to silver and gold grades, the NPV is $324.2 million. At 10% increases to silver and gold grades, the NPV is $539.9 million.
The economics of the current mine plan remain robust at the considered sensitivities to variations in the metal price, operating costs, and ore grades.

Pan American Silver Corp.
March 2017 88 of 98
Table 22.2 Annual production schedule and cash flow forecast
Units 2017 2018 2019 2020 2021 2022 2023 2024 2025 2026 2027 2028 2029 2030 - 2033 LOM
Mined - open pit ore tonnes Mt 6.40 6.27 6.75 6.77 6.75 7.81 5.99 5.88 0 0 0 0 0 0 52.63 Mined - underground ore tonnes Mt 0.06 0.53 0.59 0.60 0.58 0.60 0.60 0.51 0 0 0 0 0 0 4.08 Mined - total ore tonnes Mt 6.47 6.81 7.34 7.37 7.34 8.41 6.59 6.39 0 0 0 0 0 0 56.72 Mined - open pit waste tonnes Mt 33.92 33.98 34.50 32.99 18.52 14.15 7.49 12.18 0 0 0 0 0 0 187.72 Strip ratio - 5.3 5.4 5.1 4.9 2.7 1.8 1.3 2.1 0 0 0 0 0 0 3.6 Processed - open pit crusher tonnes (including stockpiles) Mt 5.47 5.26 5.26 5.27 5.26 5.26 5.26 5.27 5.91 0.41 0 0 0 0 48.61 Processed - open pit pulp agglomeration tonnes (including stockpiles) Mt 1.03 1.50 1.50 1.50 1.50 1.50 1.50 1.39 0 0 0 0 0 0 11.41
Processed - underground pulp agglomeration tonnes Mt 0 0.60 0.59 0.60 0.58 0.60 0.60 0.51 0 0 0 0 0 0 4.08 Processed - total ore tonnes (including stockpiles) Mt 6.50 7.35 7.34 7.37 7.34 7.35 7.35 7.17 5.91 0.41 0 0 0 0 64.10 Processed - open pit crusher ore Ag grade ppm 26 20 21 21 13 13 14 16 18 18 0 0 0 0 18 Processed - open pit crusher ore Au grade ppm 0.50 0.40 0.41 0.38 0.58 0.56 0.51 0.40 0.22 0.22 0 0 0 0 0.44 Processed - open pit pulp agglomeration ore Ag grade ppm 50 58 63 66 34 32 36 43 0 0 0 0 0 0 48 Processed - open pit pulp agglomeration ore Au grade ppm 1.66 1.61 1.31 1.09 2.17 2.86 1.32 1.37 0 0 0 0 0 0 1.68 Processed - underground pulp agglomeration ore Ag grade ppm 0 75 64 73 64 61 62 47 0 0 0 0 0 0 64 Processed - underground pulp agglomeration ore Au grade ppm 0 1.79 1.84 1.35 1.43 1.69 1.54 1.65 0 0 0 0 0 0 1.61 Processed - Total ore Ag grade ppm 30 32 33 34 21 21 22 23 18 18 0 0 0 0 26 Processed - Total ore Au grade ppm 0.69 0.76 0.71 0.61 0.97 1.12 0.76 0.68 0.22 0.22 0 0 0 0 0.73 Recovered - open pit crusher ore Ag Moz 3.42 2.94 2.74 2.64 2.04 1.78 1.71 1.70 1.93 0.89 0.49 0.34 0.25 0 22.87 Recovered - open pit crusher ore Au koz 63.89 49.68 47.72 45.14 64.29 65.35 59.86 48.12 30.43 4.74 0.21 0 0 0 479.43 Recovered - open pit pulp agglomeration ore Ag Moz 0.97 2.13 2.32 2.50 1.47 1.25 1.33 1.46 0.22 0.05 0 0 0 0 13.71 Recovered - open pit pulp agglomeration ore Au koz 36.62 70.38 50.95 42.48 84.29 111.25 51.81 49.95 0 0 0 0 0 0 497.73 Recovered - underground pulp agglomeration ore Ag Moz 0 0.95 0.94 1.10 0.97 0.93 0.94 0.66 0.11 0.02 0 0 0 0 6.62 Recovered - underground pulp agglomeration ore Au koz 0 27.72 28.22 21.06 21.61 26.35 23.93 21.80 0 0 0 0 0 0 170.69 Recovered - total Ag Moz 4.39 6.01 6.01 6.24 4.48 3.97 3.98 3.82 2.26 0.96 0.49 0.34 0.25 0 43.20 Recovered - Total Au koz 100.51 147.78 126.89 108.67 170.19 202.95 135.60 119.88 30.43 4.74 0.21 0 0 0 1,147.85 Revenue $M 211.65 302.93 275.76 256.32 303.81 336.77 249.52 226.21 81.27 23.86 9.25 6.37 4.70 0 2,288.42 Operating cost $/t 143.07 161.63 171.47 165.89 133.17 121.90 104.89 102.82 44.53 18.46 4.01 4.01 4.01 0 1,179.87 Capital cost $/t 75.79 25.94 15.72 14.35 26.11 29.94 16.75 10.35 6.87 0.94 0 0 0 0 222.76 Taxes and royalties $M 10.01 18.64 15.17 19.27 52.20 70.39 43.81 37.28 4.97 1.00 0.60 0.31 0.15 0.0 273.80 Smelting and refining charges $M 1.66 2.27 2.26 2.34 1.72 1.54 1.52 1.45 0.84 0.35 0.18 0.13 0.09 0 16.34 Reclamation expenditures $M 0 0 0 0 0 0 0 0 -2.00 0.69 1.00 1.00 5.00 5.75 11.44 Cash flow $M -18.88 94.45 71.14 54.46 90.61 113.00 82.56 74.31 26.06 2.43 3.46 0.92 -4.56 -5.75 584.21

Pan American Silver Corp.
March 2017 89 of 98
23 Adjacent properties There is no relevant information on adjacent properties to report.

Pan American Silver Corp.
March 2017 90 of 98
24 Other relevant data and information There is no additional information to report.
Pan American Silver Corp.
March 2017 91 of 98
25 Interpretation and conclusions Pan American acquired the Dolores mine in 2012 as part of the acquisition of Minefinders. Pan American has operated the mine since then, and has engaged in investments including building heap leach pad capacity, connecting the mine to the Chihuahua electrical grid with a power line, and the expansion currently underway to develop the underground mine and build the pulp agglomeration plant.
This technical report demonstrates that the mineral reserves in the mine plan are economic with the forecast metal prices and other assumptions. Based on the current mineral reserves, the mine is projected to continue to produce silver and gold until 2029. This projected mine life may increase if additional mineral resources are defined and can be converted to mineral reserves.
25.1 Mineral resources and reserves There are no known drilling, sampling, or recovery factors that could materially impact the reliability of the drilling results used to estimate mineral resources and reserves. Pan American intends to continue annual near-mine diamond drilling programs to test the southern and down dip extents of the currently defined mineralization and to conduct regular infill drilling of the deposit to upgrade mineral resource and reserve confidence categories.
There are no known significant risks and uncertainties that could reasonably be expected to affect the reliability or confidence in the mineral resource and reserve estimates. Pan American routinely conducts reconciliation of the reserve model to the grade control model and to the heap leach feed conveyor weight meter and sampler in order to monitor actual mine versus model performance.
25.2 Mineral processing, metallurgical testing, and recovery methods Broken ore is trucked to a crushing plant and crushed to P80 6.3 mm at a nominal rate of 16,200 tpd. The crushed ore product is conveyed to the leach pads via an overland conveyor system and placed on the pads using portable grasshopper conveyors and a radial stacking system. Drip and sprayer systems apply sodium cyanide solution to the heap leach pads for metal leaching.
The pulp agglomeration plant will be operational by mid-2017 and will ramp up to full capacity by the end of the year. At that point, the treatment rate will increase from roughly 16,500 to 20,000 tpd by processing the high grade portion of the mined material through a pulp agglomeration treatment plant and conveying the agglomerated material with the crushed lower grade portion of the mined material to the heap leach pads.
The pregnant leach solution containing the dissolved silver and gold is pumped from the bottom of the pads to the Merrill-Crowe plant and processed through the circuit to trigger the precipitation of the silver and gold, and then the precipitate is pressed and dried. The dried material is melted in a furnace to form doré bars. The bars are transported to a third party refinery in North America for final recovery. The mine operates a closed circuit processing system without tailings facilities.

Pan American Silver Corp.
March 2017 92 of 98
For the heap leach only operation, the metallurgical recovery model created for the mineral resource and reserve estimate assumes gold recoveries of 77.9% for oxide and 68.3% for sulphide ores, and silver recoveries of 42.1% for oxide and 61.1% for sulphide ores. The kinetic model assumes a two year period to achieve ultimate gold recovery and ten to eleven years to achieve ultimate silver recovery for the oxides, and sulphides, respectively.
The metallurgical recovery model created for the pulp agglomeration of high grade mineralization assumes gold recoveries of 90.0% for oxide and 80.7% for sulphide material and silver recoveries of 58.7% for oxide and 78.8% for sulphide material. The kinetic model assumes a one year period to achieve ultimate gold recovery and two and three years to achieve ultimate silver recovery for oxide and sulphide material, respectively.
The load / permeability tests confirm the use of cement at 25 kg/t of milled ore to provide assurance that the agglomerates will remain stable in the heap leach stack at heights of up to 150 m. The pilot plant, including rod mill, filtration, and agglomeration, has provided a good degree of confidence for the sizing and design of the circuit.
25.3 Mining and financial For the open pit operation, sustaining capital expenditures are estimated to total $32.9 million over the remaining mine life, including G&A. Mining costs are estimated to total $432.0 million to mine 240.4 million total ore and waste tonnes, including the cost of stockpiling and re-handling stockpiles over the life of the mine. G&A costs are estimated to total $156.2 million.
For the underground operation, the estimated capital cost is estimated at $82.3 million over the life of mine. Of this, $23.5 million can be considered initial capital, which includes all costs incurred until 2018 and the cost of additional fleet capacity as the mine develops. The remaining sustaining capital is for development to access the stoping areas. The total operating cost over the life of mine is $122.3 million, which equates to $29.97 per tonne of ore mined.
The initial capital cost estimate for the completion of design engineering, procurement, construction, and start-up of the pulp agglomeration plant is expected to be in the order of $73.0 million. Construction of the plant is underway and some of the capital expenditures occurred in 2016. Sustaining capital is estimated at $77.0 million, including $67.5 for heap leach pad expansion, $6.3 million for the processing plant, $1.7 million for the pulp agglomeration plant, and $1.5 million for the pad pumping system upgrade.
Processing operating costs are estimated at $469.3 million, including $251.4 million for crushing and heap leaching of coarse medium grade ore, $199.2 million for high grade ore processed through the pulp agglomeration plant, $15.2 million for solution recirculation and processing in the final years, and $3.5 million for Pad 1 material re-handling. Open pit and underground mining is estimated to be completed in 2024 while stacking of stockpiled material on the leach pads will continue for another two years. Thereafter a further three years of solution recirculation and precious metal extraction will follow during leach-down of silver and gold from the heap leach pads.

Pan American Silver Corp.
March 2017 93 of 98
Unit costs are $5.17 per tonne of ore for the coarse medium grade ore and $12.86 per tonne of ore for the pulp agglomeration high grade ore. The total produced ounces accounting for metallurgical recovery is estimated at 43.2 million ounces of silver and 1.1 million ounces of gold.
The life of mine plan for the mineral reserves as at December 31, 2016 is for processing a total of 52.6 million tonnes of ore from the open pit mine, 4.1 million tonnes of ore from the underground mine, and 7.4 million tonnes of ore currently placed on stockpiles and awaiting processing. The open pit mining requires the removal of 187.7 million tonnes of waste to access the ore, for a strip ratio of 1 to 3.6. Crushing occurs at a rate of 16,200 tpd until mid-2017 following the completion of the pulp agglomeration plant and underground mine development, when the processing rate will increase to 20,000 tpd rate starting in 2018, including 14,400 tpd in the crushing circuit and 5,600 tpd in the pulp agglomeration circuit.
The operating cash flow is estimated to total $807.0 million, which is comprised of an estimated revenue of $2,288.4 million, $1,179.9 million in operating costs, $16.3 million in smelting and refining charges, $71.2 million relating to Special Mining Duty of 7.5% applied to EBITDA, $11.4 million relating to the Extraordinary Mining Duty of 0.5% applied to the sales of gold and silver, $64.4 million on royalties payable to RG Mexico Inc., $11.4 million in reclamation expenditures net of salvage value, and $126.7 million in income taxes. After accounting for capital expenditures, the total net cash flow for the operation is estimated to be $584.2 million. The after tax NPV at a 6% discount rate is estimated at $432.4 million.
25.4 Environment and community The most significant environmental liabilities include surface disturbance and reclamation liabilities and issues related to the stability and containment system of heap leach Pad 1, which developed prior to Pan American’s acquisition of the Property. The pad has been stabilized and Pan American has implemented additional contingency measures in and around the heap leach pads. Only a small portion of the waste is potentially acid generating and no specific measures to manage waste or ore deposition are required.
There are no known environmental or social issues that could materially impact the mine’s ability to economically extract the mineral resources or reserves.

Pan American Silver Corp.
March 2017 94 of 98
26 Recommendations
26.1 Mineral resources and reserves Pan American intends to continue with annual diamond drilling programs and to continue ongoing infill drilling, particularly in the portion of the deposit that will be mined using underground mining methods, to collect closer spaced drillhole information. Exploration diamond drilling is expected to be concentrated on defining the southern strike extent of the deposit and in improving the confidence in the estimate at depth. The geological interpretation will continue to be updated annually to include additional diamond drilling undertaken during the year. Reviews of the geological interpretation against grade control drilling will continue to be undertaken on a regular basis to verify the reliability of the resource and reserve estimate.
26.2 Mineral processing, metallurgical testing, and recovery methods Recommendations for additional metallurgical test work include load/permeability tests with full scale plant samples at the mine site to determine the permeability of the agglomerates under load charge to optimize the cement addition requirements. The cost of this test work is estimated at $39,000.
In addition to continuing with routine monthly column leach tests from the heap leach operation, monthly column leach tests of samples from the pulp agglomeration plant after commissioning of the plant are also recommended.
26.3 Mining and financial Key recommendations include additional studies of potential water inflow and water pumping requirements, advancing the level of geotechnical knowledge as underground development progresses in the mineralized zones, updating the design of the interface between the underground and open pit operations as the open pit life of mine plan changes, and tracking and updating the operating cost estimates for the underground mine and pulp agglomeration plant. Annual estimated costs for geotechnical monitoring, consulting support, drilling, testing, and instrumentation as necessary are in the order of $180,000.

Pan American Silver Corp.
March 2017 95 of 98
27 References Author Title
Campa, M. F. and Coney P. J., 1983
Tectono-stratigraphic terranes and mineral resource distributions in Mexico. Canadian Journal of Earth Sciences, 20, 1040-1051.
Camprubí, A., Ferrari, L., Cosca, M. A., Cardellach, E., and Canals, À. 2003
Ages of epithermal deposits in Mexico: regional significance and links with the evolution of Tertiary volcanism. Economic Geology, 98, 1029-1037.
Chlumsky, Armbrust, and Meyer, LLC., 2011
NI 43-101 Technical Report Dolores Gold-Silver Project Chihuahua, Mexico. Technical Report prepared for Minefinders Corporation Ltd., September 30 2011.
Golder, 2013a Initial Assessment of Stability of Proposed Underground Mining. Email message sent June 15, 2013.
Golder, 2013b Review of Inter-ramp Slope Angle, Dolores Mine, Chihuahua, Mexico. Internal report prepared for Pan American Silver, August 2013.
Golder, 2013c Geotechnical Characterization for Underground Mining, Dolores Project. Internal report prepared for Pan American Silver, October 2013.
KCA, 2016 Pulp agglomeration flow sheet and facility layout. Email message sent March 8, 2017.
Long, S. D., 1998 Practical Quality Control Procedures in Mineral Inventory Estimation. Explor. Mining. Geol. 7 (1-2) pp 117-127.
Overbay, W., Page, T., Krasowski, D., Bailey, M., and Matthews, T., 2001
Geology, Structural Setting, and Mineralization of the Dolores District, Chihuahua, Mexico. In Special Publication No. 8 Society of Economic Geologists, 71-85.
Pincock, Allen & Holt, 2002 Audit of Resources at the Dolores Gold – Silver Project Chihuahua, Mexico. Technical report prepared for Minefinders Corporation Ltd, December 2, 2002.
Pratt, W., 2013 Internal report on Dolores geology and deposit types prepared for Pan American Silver, August 2013.
Staude, J-M., 2001 Geology, geochemistry and formation of Au-(Cu) mineralization and advanced argillic alteration in the Mulatos District, Sonora, Mexico. In: New Mines and Discoveries in Mexico and Central America. Special Publication No. 8. Society of Economic Geologists. 199-216.
Walker, W. K., 2015 Geologic pit mapping and bench and inter-ramp slope stability review for the Dolores open pit silver mine. Internal report prepared for Pan American Silver, December 2015.

Pan American Silver Corp.
March 2017 96 of 98
Date, signatures, and certificates
CERTIFICATE of QUALIFIED PERSON
I, Mr. Christopher Emerson, Vice President, Business Development and Geology of Pan American Silver Corp., 1500-625 Howe St, Vancouver, BC, V6C 2T6, Canada do hereby certify that:
a) I am the co-author of the technical report titled “Technical Report for the Dolores Property, Chihuahua, Mexico”, with an effective date of December 31, 2016 (the “Technical Report”).
b) I graduated with a Bachelor of Engineering in Industrial Geology from Camborne School of Mines, Exeter University, England, in 1998 and earned my Master of Science in Mineral Exploration from Leicester University in 2000. I am a Fellow of the Australasian Institute of Mining and Metallurgy (FAusIMM) and a Fellow of the Geological Society of London (FGS). I have worked as a geologist in both mining and exploration for the past 17 years since my graduation from Leicester University.
c) I have read the definition of ‘Qualified Person’ set out in National Instrument 43 101 (“the “Instrument”) and certify that by reason of my education, affiliation with a professional association and past relevant work experience, I fulfil the requirements of a ‘Qualified Person’ for the purposes of the Instrument.
d) I am responsible for the preparation of the sections of the Technical Report as detailed in Table 2.1 – Responsibilities of each Qualified Person.
e) I am currently employed as the Vice President, Business Development and Geology for Pan American Silver Corp., the owner of the Dolores Property, and by reason of my employment, I am not considered independent of the issuer as described in Section 1.5 of the Instrument.
f) I have had prior involvement with the Dolores Property that is the subject of the Technical Report; I am an employee of Pan American Silver Corp. and have conducted site visits to the Dolores Property, including as described in Section 2 – Introduction of the Technical Report, and most recently on October 27, 2016.
g) I have read the Instrument and Form 43 101F1, and the Technical Report has been prepared in compliance with the Instrument and that form.
h) As of the effective date of the Technical Report, to the best of my knowledge, information and belief, the Technical Report contains all the scientific and technical information that is required to be disclosed to make the Technical Report not misleading.
Dated at Vancouver, British Columbia, this 21st day of March, 2017.
“Signed and sealed”
Christopher Emerson, FAusIMM

Pan American Silver Corp.
March 2017 97 of 98
CERTIFICATE of QUALIFIED PERSON
I, Martin Wafforn, Senior Vice President, Technical Services and Process Optimization of Pan American Silver Corp., 1500-625 Howe St, Vancouver, BC, V6C 2T6, Canada do hereby certify that:
a) I am the co-author of the technical report titled “Technical Report for the Dolores Property, Chihuahua, Mexico”, with an effective date of December 31, 2016 (the “Technical Report”).
b) I graduated with a Bachelor of Science in Mining degree from the Camborne School of Mines in Cornwall, England in 1980. I am a Professional Engineer in good standing with The Association of Professional Engineers and Geoscientists of the Province of British Columbia. I am also a Chartered Engineer in good standing in the United Kingdom. My experience is primarily in the areas of mining engineering and I have worked as an engineer in the mining industry for a total of 35 years since my graduation from the Camborne School of Mines.
c) I have read the definition of ‘qualified person’ set out in National Instrument 43 101 (“the “Instrument”) and certify that by reason of my education, affiliation with a professional association and past relevant work experience, I fulfil the requirements of a ‘qualified person’ for the purposes of the Instrument.
d) I am responsible for the preparation of the sections of the Technical Report as detailed in Table 2.1 - Responsibilities of each Qualified Person.
e) I am currently employed as the Senior Vice President, Technical Services and Process Optimization for Pan American Silver Corp., the owner of the Dolores Property, and by reason of my employment, I am not considered independent of the issuer as described in Section 1.5 of the Instrument.
f) I have had prior involvement with the Dolores Property that is the subject of the Technical Report; I am an employee of Pan American Silver Corp. and have conducted site visits to the Dolores Property, including as described in Section 2 – Introduction of the Technical Report, and most recently from September 13 to 16, 2016.
g) I have read the Instrument and Form 43 101F1, and the Technical Report has been prepared in compliance with the Instrument and that form.
h) As of the effective date of the Technical Report, to the best of my knowledge, information and belief, the Technical Report contains all the scientific and technical information that is required to be disclosed to make the Technical Report not misleading.
Dated at Vancouver, British Columbia, this 21st day of March, 2017.
“Signed and sealed”
Martin Wafforn, P. Eng.

Pan American Silver Corp.
March 2017 98 of 98
CERTIFICATE of QUALIFIED PERSON
I, Americo Delgado, Director, Metallurgy of Pan American Silver Corp., 1500-625 Howe St, Vancouver, BC, V6C 2T6, Canada, do hereby certify that:
a) I am the co-author of the technical report titled “Technical Report for the Dolores Property, Chihuahua, Mexico”, with an effective date of December 31, 2016 (the “Technical Report”).
b) I graduated with a Master of Science in Metallurgical and Material Engineering from the Colorado School of Mines in Golden, Colorado, in 2007, and with a Bachelor of Science in Metallurgical Engineering degree from the Universidad Nacional de Ingenieria, Lima, Peru, in 2000. I am a Professional Engineer in good standing with the Association of Professional Engineers and Geoscientists of the Province of British Columbia. My experience is primarily in the areas of metallurgy and mineral processing engineering and I have worked as a metallurgist in the mining industry for a total of 17 years since my graduation from the Universidad Nacional de Ingenieria.
c) I have read the definition of ‘qualified person’ set out in National Instrument 43 101 (“the “Instrument”) and certify that by reason of my education, affiliation with a professional association and past relevant work experience, I fulfil the requirements of a ‘qualified person’ for the purposes of the Instrument.
d) I am responsible for the preparation of the sections of the Technical Report as detailed in Table 2.1 - Responsibilities of each Qualified Person.
e) I am currently employed as the Director, Metallurgy for Pan American Silver Corp., the owner of the Dolores Property, and by reason of my employment, I am not considered independent of the issuer as describe in Section 1.5 of the Instrument.
f) I have had prior involvement with the Dolores Property that is the subject of the Technical Report; I am an employee of Pan American Silver Corp. and have conducted site visits to the Dolores Property, including as described in Section 2 – Introduction of the Technical Report, and most recently from May 19 to 23, 2014.
g) I have read the Instrument and Form 43 101F1, and the Technical Report has been prepared in compliance with the Instrument and that form.
h) As of the effective date of the Technical Report, to the best of my knowledge, information and belief, the Technical Report contains all the scientific and technical information that is required to be disclosed to make the Technical Report not misleading.
Dated at Vancouver, British Columbia, this 21st day of March, 2017.
“Signed and sealed”
Americo Delgado, P. Eng.