Home ovulation tests and stress in women trying to conceive: a
14
ORIGINAL ARTICLE Infertility Home ovulation tests and stress in women trying to conceive: a randomized controlled trial S. Tiplady 1, * , G. Jones 2 , M. Campbell 2 , S. Johnson 1 , and W. Ledger 3 1 Scientific and Medical Affairs, SPD Development Company Limited, Bedford MK44 3UP, UK 2 School of Health and Related Research, University of Sheffield, Sheffield S14DA, UK 3 Obstetrics and Gynaecology, University of New South Wales, Sydney, NSW 2052, Australia *Correspondence address. [email protected] Submitted on May 17, 2012; resubmitted on September 12, 2012; accepted on September 17, 2012 study question: Does the use of a digital home ovulation test have any effect on the level of stress in women seeking to conceive? summary answer: No difference was found in levels of stress between women using digital ovulation tests to time intercourse com- pared with women who were trying to conceive without any additional aids: in addition, their use did not negatively impact time to concep- tion in users but may provide additional benefits, including an increased understanding of the menstrual cycle, reassurance and confidence in focusing conception attempts to the correct time in the cycle. what is known already: It has been suggested that timing of intercourse in such a way that it coincides with ovulation by using ovulation tests can lead to emotional distress; however, no study has been conducted to investigate this hypothesis specifically, until now. study design, size and duration: The study was performed over two complete menstrual cycles as a prospective, rando- mized, controlled trial including quantitative and qualitative methods. The intervention (test) group were given digital ovulation tests to time intercourse to the most fertile time of the cycle and the control group were provided with the current National Institute for Health and Clinical Excellence guidelines for increasing the chances of conception (intercourse every 2–3 days) and asked not to use any additional methods to time when ovulation occurs. participants/materials, setting and methods: A total of 210 women who were seeking to conceive were recruited from the general UK population. A total of 115 women were randomized to the test group and 95 to the control group through block random- ization. The positive and negative affect schedule (PANAS) and the Perceived Stress Scale (PSS) were used to measure subjective stress levels, the Short-Form 12 health survey was used as a measure of general health and well-being and urine samples were measured for biochemical markers of stress including urinary cortisol. Qualitative data were collected in the form of a telephone interview upon study completion. main results and the role of chance: There was no evidence for a difference either in total stress as measured using the PSS or in total positive or negative affect using the PANAS questionnaire between the test and control groups at any time point for the duration of the study. During cycle 1, for example, on Day 6, the difference in total stress score (test–control) was 20.62 [95% confidence interval (CI) 22.47 to 1.24] and on the day of the LH surge, it was 0.53 (95% CI 21.38 to 2.44). In addition, no correlation was observed between time trying to conceive and levels of stress, or between age and levels of stress, and no evidence was found to show that stress affected whether or not a pregnancy was achieved. There is also no evidence that the biochemistry measurements are related to whether a pregnancy was achieved or of a difference in biochemistry between the treatment groups. The use of digital ovulation tests did not negatively affect time to conception and with an adequately sized study, could potentially show improvement. To ensure that the results of this study were not affected by chance, we used a number of different methods for measuring stress, each of which had been independently validated. limitations and reasons for caution: Randomization occurred before the start of the study because of the need to provide the ovulation tests in readiness for Day 6 of the first cycle. As a consequence, a number of women fell pregnant during this period (22 and 13 in the test and control groups, respectively). A further 15 women were either lost to follow-up or withdrew consent prior to study start. Pregnancy rate was higher overall in the test group, so to ensure that there were sufficient data from women who failed to become pregnant in the test group, we implemented an additional biased recruitment. This second cohort may have been different from the first, although no significant dif- ferences were observed between the two phases of recruitment for any of the information collected upon admission to the study. & The Author 2012. Published by Oxford University Press. This is an Open Access article distributed under the terms of the Creative Commons Attribution License (http://creativecommons.org/licenses/by-nc/3.0/), which permits non- commercial reuse, distribution, and reproduction in any medium, provided the original work is properly cited. For commercial re-use, please contact [email protected]. Human Reproduction, Vol.28, No.1 pp. 138–151, 2013 Advanced Access publication on October 18, 2012 doi:10.1093/humrep/des372 Downloaded from https://academic.oup.com/humrep/article-abstract/28/1/138/596463 by guest on 04 April 2019
Transcript of Home ovulation tests and stress in women trying to conceive: a

ORIGINAL ARTICLE Infertility
Home ovulation tests and stressin women trying to conceive: arandomized controlled trialS. Tiplady1,*, G. Jones2, M. Campbell2, S. Johnson1, and W. Ledger3
1Scientific and Medical Affairs, SPD Development Company Limited, Bedford MK44 3UP, UK 2School of Health and Related Research,University of Sheffield, Sheffield S14DA, UK 3Obstetrics and Gynaecology, University of New South Wales, Sydney, NSW 2052, Australia
*Correspondence address. [email protected]
Submitted on May 17, 2012; resubmitted on September 12, 2012; accepted on September 17, 2012
study question: Does the use of a digital home ovulation test have any effect on the level of stress in women seeking to conceive?
summary answer: No difference was found in levels of stress between women using digital ovulation tests to time intercourse com-pared with women who were trying to conceive without any additional aids: in addition, their use did not negatively impact time to concep-tion in users but may provide additional benefits, including an increased understanding of the menstrual cycle, reassurance and confidence infocusing conception attempts to the correct time in the cycle.
what is known already: It has been suggested that timing of intercourse in such a way that it coincides with ovulation by usingovulation tests can lead to emotional distress; however, no study has been conducted to investigate this hypothesis specifically, until now.
study design, size and duration: The study was performed over two complete menstrual cycles as a prospective, rando-mized, controlled trial including quantitative and qualitative methods. The intervention (test) group were given digital ovulation tests to timeintercourse to the most fertile time of the cycle and the control group were provided with the current National Institute for Health andClinical Excellence guidelines for increasing the chances of conception (intercourse every 2–3 days) and asked not to use any additionalmethods to time when ovulation occurs.
participants/materials, setting and methods: A total of 210 women who were seeking to conceive were recruitedfrom the general UK population. A total of 115 women were randomized to the test group and 95 to the control group through block random-ization. The positive and negative affect schedule (PANAS) and the Perceived Stress Scale (PSS) were used to measure subjective stress levels, theShort-Form 12 health survey was used as a measure of general health and well-being and urine samples were measured for biochemical markersof stress including urinary cortisol. Qualitative data were collected in the form of a telephone interview upon study completion.
main results and the role of chance: There was no evidence for a difference either in total stress as measured using the PSSor in total positive or negative affect using the PANAS questionnaire between the test and control groups at any time point for the duration of thestudy. During cycle 1, for example, on Day 6, the difference in total stress score (test–control) was 20.62 [95% confidence interval (CI) 22.47to 1.24] and on the day of the LH surge, it was 0.53 (95% CI 21.38 to 2.44). In addition, no correlation was observed between time trying toconceive and levels of stress, or between age and levels of stress, and no evidence was found to show that stress affected whether or not apregnancy was achieved. There is also no evidence that the biochemistry measurements are related to whether a pregnancy was achieved orof a difference in biochemistry between the treatment groups. The use of digital ovulation tests did not negatively affect time to conceptionand with an adequately sized study, could potentially show improvement. To ensure that the results of this study were not affected bychance, we used a number of different methods for measuring stress, each of which had been independently validated.
limitations and reasons for caution: Randomization occurred before the start of the study because of the need to providethe ovulation tests in readiness for Day 6 of the first cycle. As a consequence, a number of women fell pregnant during this period (22 and 13 inthe test and control groups, respectively). A further 15 women were either lost to follow-up or withdrew consent prior to study start. Pregnancyrate was higher overall in the test group, so to ensure that there were sufficient data from women who failed to become pregnant in the testgroup, we implemented an additional biased recruitment. This second cohort may have been different from the first, although no significant dif-ferences were observed between the two phases of recruitment for any of the information collected upon admission to the study.
& The Author 2012. Published by Oxford University Press.This is an Open Access article distributed under the terms of the Creative Commons Attribution License (http://creativecommons.org/licenses/by-nc/3.0/), which permits non-commercial reuse, distribution, and reproduction in any medium, provided the original work is properly cited. For commercial re-use, please contact [email protected].
Human Reproduction, Vol.28, No.1 pp. 138–151, 2013
Advanced Access publication on October 18, 2012 doi:10.1093/humrep/des372
Dow
nloaded from https://academ
ic.oup.com/hum
rep/article-abstract/28/1/138/596463 by guest on 04 April 2019
wider implications of the findings: Women who seek medical advice while trying to conceive should not be discouraged byhealth care professionals from using digital ovulation tests in order to time intercourse. The cohort of women recruited to this study initially hadno evidence of infertility and were looking to conceive in a non-medical setting. A separate study to assess the impact of home ovulation tests in asubfertile population would be of interest and complementary to the present study.
study funding/competing interests: This study was funded by SPD Swiss Precision Diagnostics, GmbH, manufacturer ofClearbluew pregnancy and ovulation tests. SPD Development Company Ltd is a wholly owned subsidiary of SPD Swiss Precision DiagnosticsGmbH; together referred to as SPD.
trial registration number: NCT01084304 (www.clinicaltrials.gov).
Key words: stress / ovulation tests / cortisol / questionnaire / timed intercourse
IntroductionBecoming pregnant is often not straightforward and it has been esti-mated that one in seven couples in the UK suffer from difficulty in con-ceiving (NICE, 2004). There are a myriad of causes for failing toconceive quickly, but a simple factor that is easily corrected is ensuringthat intercourse occurs during the fertile window. Conception is mostlikely to occur when intercourse takes place on the day before or onthe day of ovulation (Wilcox et al., 2000) and studies have shown thatwith fertility-focused intercourse, conception is likely to occur morequickly (Hilgers et al., 1992; Gnoth et al. 2002; Stanford, et al.,2002; Robinson et al., 2007). There are two main reasons whycouples may incorrectly time intercourse, firstly because they areunaware of the most appropriate time in their cycle (Zinaman et al.,2012) and secondly, the clinical prediction that the fertile windowusually occurs between Days 10 and 17 of the menstrual cycle isoften not correct (Wilcox et al., 2000; Stanford et al., 2002; Robinsonand Ellis, 2007). This is because although normally cycling women havea mean cycle length of 27–28 days, the range both within andbetween individuals is considerably longer and has been reported tobe as high as 36 days (Creinen et al., 2004; Johnson et al., 2009).Home ovulation tests are a simple and popular method for timingintercourse via the daily monitoring of urinary LH levels in order todetect the LH surge that occurs �24–36 h prior to ovulation(WHO, 1980; Singh et al., 1984; Collins, 1985; Behre et al., 2000).
It has been suggested that timing of intercourse so as to coincide itwith ovulation by using ovulation tests or other fertility awareness-basedmethods can lead to emotional distress. The current National Institutefor Health and Clinical Excellence (NICE) guidelines state that coupleswho are concerned about their fertility should be informed that sexualintercourse every 2–3 days optimizes the chances of pregnancy. Theguidelines also state that timing of intercourse so as to coincide it withovulation causes stress and is not recommended (NICE, 2004). The evi-dence supporting this statement in the guidelines is limited to a retro-spective observational study of 26 patients undergoing infertilitytreatment, where it was found that events associated with lack of con-ception or loss of pregnancy, such as a negative pregnancy test, onsetof menses, ectopic pregnancy or miscarriage, were in fact emotionallymore difficult (Kopitzke et al., 1991). Indeed, failure to become pregnantis likely to be the greatest cause of stress when a woman is trying to con-ceive (Severy et al., 2006). It is also reasonable to suggest that attemptsto undertake frequent intercourse for the duration of the cycle (NICE,2004) may prove excessively demanding and thus as emotionally challen-ging as timing intercourse to the fertile period.
The advancement in ease of use and accuracy of home ovulationtest devices, in particular the introduction of digital displays, meansthat women now find it easier to interpret the results of thesetests, which can in turn lead to greater certainty (Johnson et al.,2011). In addition, many women have a poor understanding of theirmenstrual cycle and the timing of ovulation (Zinaman et al., 2012).Home ovulation test devices can help build awareness and knowledgeof oneself during attempts to conceive as well as help to empower andengage women to take control of their own fertility (Brown et al.,1987; Blackwell et al., 2003).
We conducted this study in response to the misunderstanding andconfusion surrounding whether such products promote stress. Theaim of this study was to compare levels of stress in women seekingto conceive while using digital home ovulation tests compared withwomen who were provided with the NICE clinical guidelines on in-creasing the chances of conception. We hypothesized that therewould be no measurable difference in the level of stress associatedwith either method of trying to conceive as for both intercourse isdetermined by instruction and not necessarily by choice.
Stress and negative emotions can be expressed via biochemicaland/or behavioural channels, which allow them to be measured in anumber of ways including psychological questionnaires, biochemicalmarkers and qualitative interview techniques. Questionnaires areuseful tools to measure subjective phenomena such as symptomsand quality of life and biomarkers are chemical indicators of biologicalstate. Both are useful tools for measuring baseline information and inevaluating change over time while qualitative techniques are useful inexploring common themes arising from in-depth discussions. Cortisolis a well-established biomarker associated with increased levels ofstress (Miki and Sudo, 1998; Nicolson, 2008; Nepomnaschy et al.,2011), and there are several psychological questionnaires that arewell-validated and commonly used for observing both specific andnon-specific stress in clinical settings. All three of these measureswere incorporated into this randomized, controlled study.
Materials and Methods
Study design and recruitmentThe study was performed as a prospective, randomized controlled trial in-cluding quantitative and qualitative methods. The study protocol wasapproved by SPD ethics committee. Volunteers were recruited via anadvert placed on the Clearblue UK website, which attracted 550responses. Detailed information about the study was provided to the
Home ovulation tests and stress 139D
ownloaded from
https://academic.oup.com
/humrep/article-abstract/28/1/138/596463 by guest on 04 April 2019

volunteers and written informed consent was obtained before the com-mencement of the study.
A total of 210 volunteers were recruited from the UK population (21February–5 December 2010). The inclusion criteria were women livingin the UK who were aged between 18 and 40 years, having regular men-strual bleeds and wishing to become pregnant. Excluded were womenwho had been using hormonal contraception in the last 3 months,women currently undergoing fertility treatment or investigation, womenwho had previously been diagnosed as infertile, anyone with a history ofdepression, anxiety or panic attacks and anyone dependant on eitherdrugs or alcohol. Women who had previously used ovulation tests werenot excluded from participating in the study.
Study population, sample size andrandomizationSince the variability of stress was unknown, a pragmatic decision was takento recruit 75 subjects per group, which was feasible in the time period andwould give 80% power to detect a difference of 0.4 SDs at 5% significancelevel, which is a moderate effect size. Kopitzke et al. (1991) demonstrateda difference in stress in women trying to conceive based on a sample sizeof 26. Initially, 150 volunteers were recruited to the study and these wererandomized equally either into the test or into the control group throughblock randomization. Test-group volunteers used the Clearblue DigitalHome Ovulation Test for the duration of the study. They were asked tobegin testing on Day 6 of their cycle regardless of their normal cyclelength. Control-group volunteers were asked not to identify their timeof ovulation using methods such as ovulation testing or basal body tem-perature measurements and instead were advised of the NICE guidelineson how to increase the chances of conception, i.e. that sexual intercourseevery 2–3 days for the duration of the cycle is likely to increase thechances of conception. It was the volunteers’ choice as to whether ornot they followed these guidelines. On completion of the study, thecontrol-group volunteers were provided with Clearblue Digital HomeOvulation Tests as an incentive for complete participation.
Upon completion of the study by the initial 150 volunteers, it was foundthat there were more pregnancies than expected (44 and 26 in total forthe test and the control groups, respectively). This resulted in fewer ques-tionnaires and urine samples being available from ovulation test users whofailed to become pregnant while on the study, so that there was insufficientpower to ascertain a true representation of levels of stress in this groupcompared with the control group. Therefore, an additional cohort (60volunteers in total) was recruited in the same way as the main study,only randomization was weighted at a ratio of 2:1 into the test group inorder to enrich the data in this group. This resulted in a final study popu-lation of 210 volunteers with 115 randomized to the test group and 95 tothe control group.
Randomization schedules were generated using the STATA software bya statistician who was not directly involved in the recruitment of the study.Un-blinding of the study did not take place until statistical analysis of thedata was complete.
Study protocolUpon admission to the study, a brief medical history was collected fromeach volunteer, including demographic information, obstetric and gynaeco-logical history as well as information regarding their general health. Oncerecruited, volunteers were assigned to a randomization group by the studyco-ordinator, sent the required study materials and asked to begin in theirnext menstrual cycle. For some volunteers, this resulted in a pregnancybeing achieved prior to the start of Cycle 1. These were known as ‘Pre-cycle 1 pregnancies’. Volunteers were asked to collect first morningurine samples and to complete a range of questionnaires at specific time
points over two complete menstrual cycles according to the schedule pre-sented in Fig. 1. Levels of stress were determined both biochemically andby questionnaire. The additional measurement at time point 6 in Cycle 3was included to ensure that all participants completed two full cycles,while on the study and to ensure that pregnancy rate in Cycle 2 couldbe captured. This time point also allowed levels of stress to return to base-line where necessary after receiving the news that pregnancy had not beenachieved after two cycles of trying to conceive while on the study.
Quantitative data collectionThe questionnaires used were the Perceived Stress Scale (PSS) (Cohenet al, 1983), the positive and negative affect schedule (PANAS) (Watsonet al., 1988) and the Short Form-12 Health Survey (SF-12) (Ware andSherbourne, 1992). The biochemical marker of stress was urinary cortisol,which is a well-established stress indicator (Nakamura et al., 2008). In add-ition, urinary estrone-3-glucuronide (E3G) was analysed as a marker of es-trogen status as levels of this marker are known to be associated withdepression and anxiety (Lokuge et al., 2011).
The PSS questionnaire is a measure of the degree to which situations inone’s life are appraised as stressful. Items were designed to highlight howunpredictable, uncontrollable and overloaded respondents find their lives.The instrument uses a 5-point Likert scale rating from ‘0 ¼ never’ to ‘4 ¼very often’. Scores can range from 0 to 40, with higher scores indicating ahigher level of perceived stress (Cohen et al., 1983). The mean score for anormative sample of females completing the PSS questionnaire is 13.7+6.6 (Cohen and Williamson, 1998).
The PANAS questionnaire consists of 10 positive affects (PA), (inter-ested, excited, strong, enthusiastic, proud, alert, inspired, determined, at-tentive and active) and 10 negative affects (NA), (distressed, upset, guilty,scared, hostile, irritable, ashamed, nervous, jittery and afraid). Participantsare asked to rate items on a scale from 1 to 5, on the basis of the strengthof emotion where ‘1 ¼ very slightly or not at all’ and ‘5 ¼ extremely’. Forboth of the PANAS domains, scores can range between 10 and 50. Ahigher score on the positive domain indicates greater PA (e.g. they arehappier). However, a higher score on the negative domain indicatesgreater NA (e.g. they are more depressed) (Watson et al., 1988). The val-idity and reliability of the PANAS questionnaire and its relationshipbetween other measures of depression and anxiety was determined byCrawford and Henry (2004) where the mean score for a normativesample of females completing the PANAS questionnaire was 30.62 (SD7.89) for PA and 16.68 (SD 6.37) for NA. The PSS and PANAS question-naires were completed at time points 1–6 as shown in Fig. 1.
Finally, the SF-12 is a brief, well-validated and reliable generic question-naire for capturing general health status and outcome information. TheSF-12 health survey is one of the most widely cited measures of functionalhealth status. The UK female population have been found to have scoresof 49.54 and 49.17 for the physical and mental attributes, respectively,using the SF-36 version 2 questionnaire (Jenkinson et al., 1999). TheSF-12 questionnaire used in this study has been shown to yield comparablescores with the SF-36 questionnaire in both general and specific popula-tions. It was completed at baseline (time point 1) by all study volunteersand again at the end of the study (time point 6) only by the volunteerswho did not get pregnant.
First morning urine samples were collected at time points 2–6 usingsample collection pots containing sodium azide as a preservative. Uponreceipt of samples at the study site, they were added to a centralsample database, aliquoted and stored at 2808C until analysis. All theurine samples were analysed for cortisol and E3G using fully validated im-munoassay systems and normalized for urine volume using creatininemeasurements.
140 Tiplady et al.
Dow
nloaded from https://academ
ic.oup.com/hum
rep/article-abstract/28/1/138/596463 by guest on 04 April 2019

Cortisol was measured using the Access 2 auto-analyser system fromBeckman Coulter (High Wycombe, UK). The sensitivity of this urineassay is 0.4 mg/dl (11 nmol/l). Intra-assay % coefficient of variance(CV)s were 6.7, 4.4 and 4.4 and inter-assay %CVs were 7.9, 6.0 and 6.4at low, medium and high concentrations, respectively. E3G analysis wascarried out using a competitive immunoassay that was developed forurine samples by SPD for use on the DELFIA auto-analyzer system from
Perkin Elmer (Waltham, Massachusetts) (Miro et al., 2005). The sensitivityof this urine assay is 0.076 ng/ml. Intra-assay %CVs were 2.1, 2.0 and 2.5and inter-assay %CVs were 0.7, 0.9 and 1.0 at low, medium and high con-centrations, respectively. Creatinine analysis was also carried out to enablevolume correction of the markers indicative of stress. This measurementwas made using the ABX Pentra 400 analyser from Horiba (Kyoto,Japan). The sensitivity of this urine assay is 1.39 mg/dl (123 mmol/l).
Figure 1 Schedule of events and numbers of volunteers at each time point during the study. In total, 354 women were able to be contacted toparticipate in the study. Of those, 255 volunteers were eligible to participate and 45 did not return their consent. This left a final study populationof 210. Reasons for withdrawal from the study include: no longer trying to conceive (n ¼ 6), unable to carry out the study (n ¼ 4), health reasons(n ¼ 10), protocol violation (n ¼ 3), unwanted randomization to the control group (n ¼ 2) and no reason given (n ¼ 2). LTFU, lost to follow-up(n ¼ 19). *1 volunteer did not provide complete data prior to randomization. Day of predicted ovulation for the control group was based on self-reported average cycle length information collected upon admission to the study.
Home ovulation tests and stress 141D
ownloaded from
https://academic.oup.com
/humrep/article-abstract/28/1/138/596463 by guest on 04 April 2019

Intra-assay %CVs were 3.3, 0.6 and 0.5 and inter-assay %CVs were 6.0,1.9 and 1.8 at low, medium and high concentrations, respectively.
Qualitative data collectionUpon completion of the study, individual, semi-structured telephone inter-views were carried out with all the study participants to gain feedback onthe use of the ovulation test, attitude to trying to conceive and furtherinsight into their emotional wellbeing. The interview schedule comprisedof both closed and open-ended questions. Interviews ranged from 10 to30 min in length.
Data analysis of the interviews was carried out using a thematic ap-proach (Marshall and Rossman, 1999), which is widely used in qualitativeresearch. This enables data sources to be analysed in terms of the principalconcepts or themes. These themes were then developed by the analyst,to enable the data to be reduced to key ideas.
Statistical analysisThe standardized psychological questionnaires (PSS, PANAS and SF-12)were coded following the scoring systems for each instrument and sum-marized using descriptive statistics. Mean questionnaire scale scores forthe volunteers were given for each time point. Summary measures wereused to examine the profile of stress over time between the baselineand remaining time point assessments (Matthews et al., 1990). Amixed-effects model was applied to the scores over time. Sensitivity ana-lyses were also performed to check the robustness of the conclusions,given the nature and number of missing data values in this study. Imput-ation methods were used to assess the effect of missing data due to attri-tion. Logistic regression was used to assess whether biochemical andpsychological measures of stress can predict whether a subsequent con-ception will occur. Log transformation of the biochemical marker mea-surements was conducted to stabilize variance. The demographic datacaptured at recruitment were also analysed to examine the influence ofage and time spent trying to conceive on stress levels over the durationof the study.
A principal components analysis (PCA) was also applied to the stressscores and to the biochemical measures of stress, categorizing the subjectson their demographic characteristics. Finally, Kaplan–Meier analysis wasused to estimate time-to-event (i.e. conception) distributions in the twotreatment groups and odds ratios were calculated.
Results
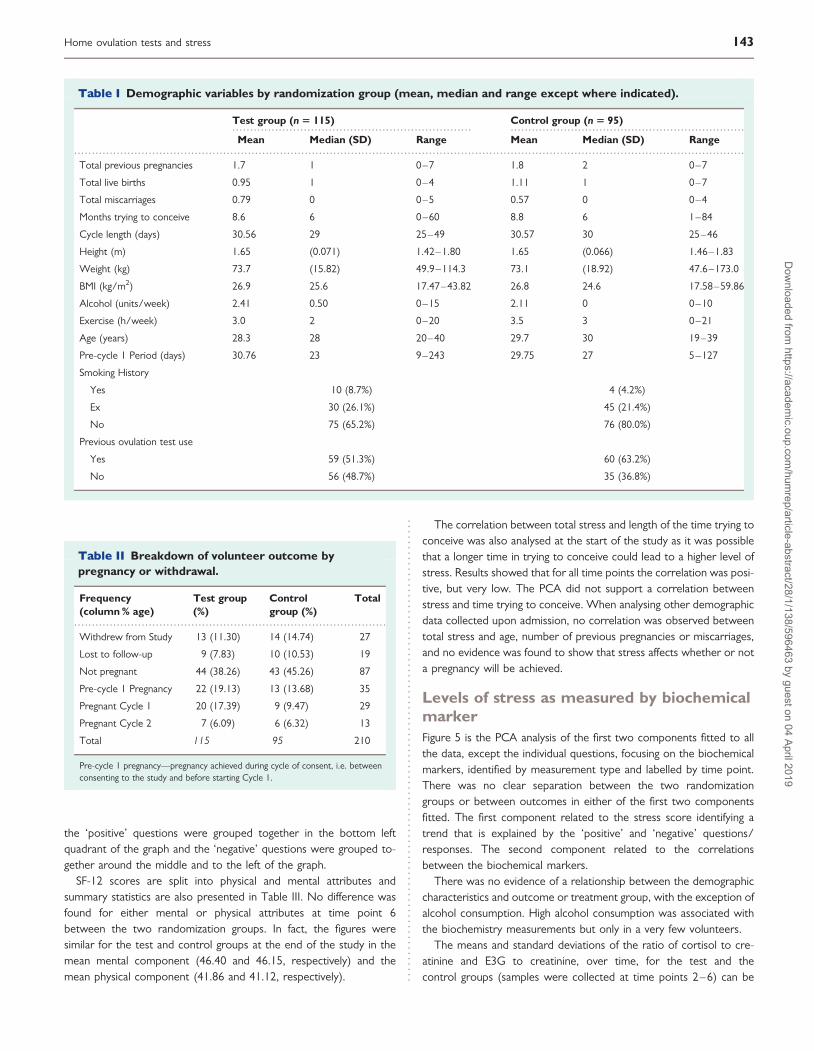
Study populationThe mean age of 210 volunteers participating in the study was28.87 years (range:19–40). The mean self-reported menstrualcycle length was 30.54 days (range: 25–49) and on average thestudy volunteers had been trying to conceive for 8.7 months(range: 0–84). Table I shows the various demographic variablesby randomization group.
All the 210 women were randomized and of these 35 (16.7%) didnot begin the study because of becoming pregnant prior to the start ofCycle 1 ‘Pre-cycle 1 pregnancy’ and a further 20 withdrew from thestudy or were lost to follow-up before the study started as detailedin Fig. 1. Of the remaining 155 volunteers, 87 (56.1%) completedthe study without achieving a pregnancy and 42 (27.1%) achieved apregnancy either during Cycle 1 (n ¼ 29) or during Cycle 2 (n ¼13). The remaining 26 (16.8%) volunteers were lost to follow-up orwithdrew from the study for various reasons as detailed in Fig. 1.
During recruitment, over a quarter of volunteers (28.1%) believedtheir cycle length to be the text book 28 days. Data available fromall the volunteers up until the point at which they left the studywere used.
Pregnancy ratesTable II gives the outcomes of the study by pregnancy status or with-drawal. For those randomized, 43% achieved a pregnancy in the testgroup, compared with 30% in the control. Excluding those whobecame pregnant and who were lost to follow-up before the startof the study, the rates were 31% and 22% for the test and thecontrol groups, respectively. Kaplan–Meier estimates of time-to-event(i.e. conception) are shown in Figs 2 and 3 for all the subjects(intention-to-treat analysis) and for the subjects present at the startof the study (per protocol analysis) respectively.
Odds ratio was calculated for women who completed the study,excluding Pre-cycle 1 pregnancy individuals and those who were lostto follow-up prior to the start of the study. This analysis showedthat the odds of getting pregnant in the test group was 1.59 [95% con-fidence interval (CI): 0.7652, 3.038] compared with the control group.Analysing the full study population (intention-to-treat), the odds ofgetting pregnant in the test group were found to be 1.77 (95% CI:0.9992, 3.1585) compared with the control group.
Levels of stress as measured by questionnaireIn order to analyse the questionnaire data, comparisons were madebetween the women in the test group and those in the controlgroup. Volunteers were categorized according to outcome: thosewho completed the study without getting pregnant, those who gotpregnant in Cycle 1 of the study, those who got pregnant in Cycle 2of the study, those who got pregnant before the study began andthose who were exited from the study for other reasons, such as with-drawn consent or lost to follow-up (this outcome was labelled‘other’). Logistic regression analysis was used to assess whetherstress can predict pregnancy. Results were analysed for total stress,which was determined using the PSS and for total PA and NA asdetermined by the PANAS questionnaire.
Table III shows summary statistics for total stress and total PA andNA scores at all time points of the study. There was no evidence of adifference in total stress, total PA or total NA between the test andthe control groups or between the different outcome groups andno evidence of a change in levels over time. This finding was also sup-ported by the PCA, which found no substantive relationships betweenrandomization group, study outcome, time point or any indices ofstress measured.
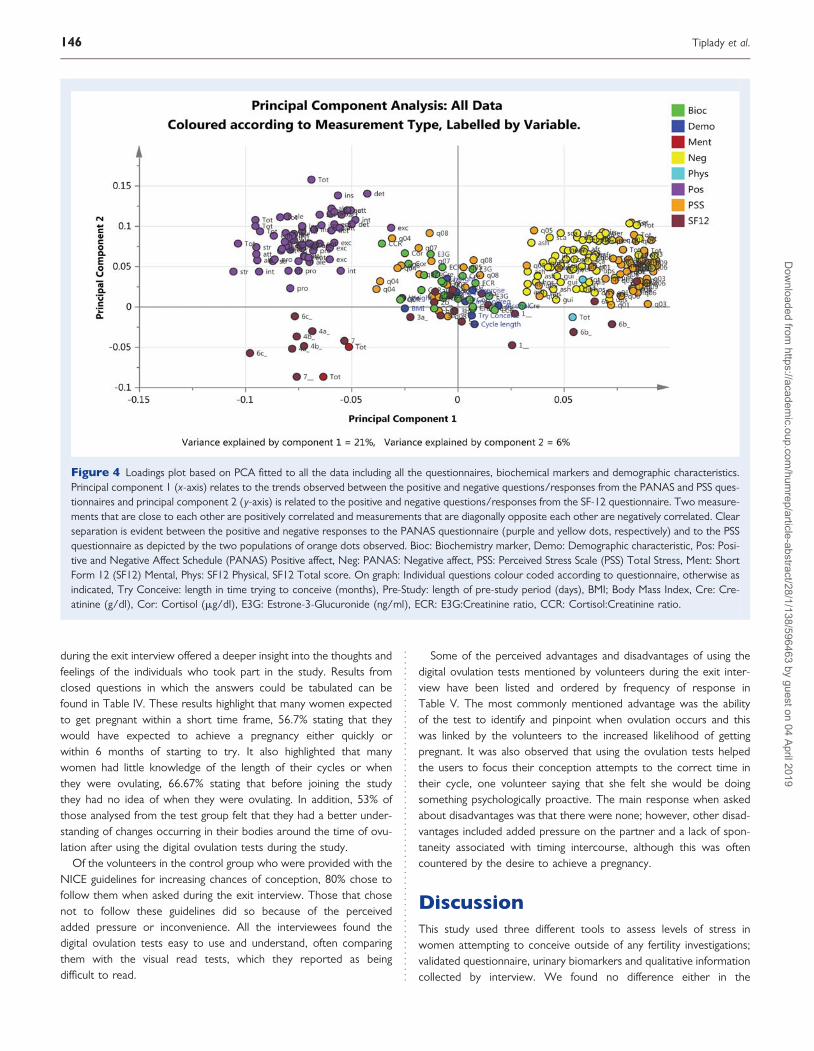
Figure 4 shows PCA analysis of the first two components fitted toall the data, including all the questions from the questionnaires, thedemographic characteristics and the biochemical markers, identifiedby measurement type and labelled by time point. The first componentidentified a trend that is explained by the ‘positive’ and ‘negative’ ques-tions/responses to the PANAS and PSS questionnaires and thesecond component identified a difference (or separation) betweenthe SF-12 questions/responses and the other measurements. The‘positive’ questions were negatively correlated with the ‘negative’questions and appear on opposite sides of the graph. The questionsfrom the SF-12 scale were grouped in the bottom half of the graph;
142 Tiplady et al.
Dow
nloaded from https://academ
ic.oup.com/hum
rep/article-abstract/28/1/138/596463 by guest on 04 April 2019
the ‘positive’ questions were grouped together in the bottom leftquadrant of the graph and the ‘negative’ questions were grouped to-gether around the middle and to the left of the graph.
SF-12 scores are split into physical and mental attributes andsummary statistics are also presented in Table III. No difference wasfound for either mental or physical attributes at time point 6between the two randomization groups. In fact, the figures weresimilar for the test and control groups at the end of the study in themean mental component (46.40 and 46.15, respectively) and themean physical component (41.86 and 41.12, respectively).
The correlation between total stress and length of the time trying toconceive was also analysed at the start of the study as it was possiblethat a longer time in trying to conceive could lead to a higher level ofstress. Results showed that for all time points the correlation was posi-tive, but very low. The PCA did not support a correlation betweenstress and time trying to conceive. When analysing other demographicdata collected upon admission, no correlation was observed betweentotal stress and age, number of previous pregnancies or miscarriages,and no evidence was found to show that stress affects whether or nota pregnancy will be achieved.
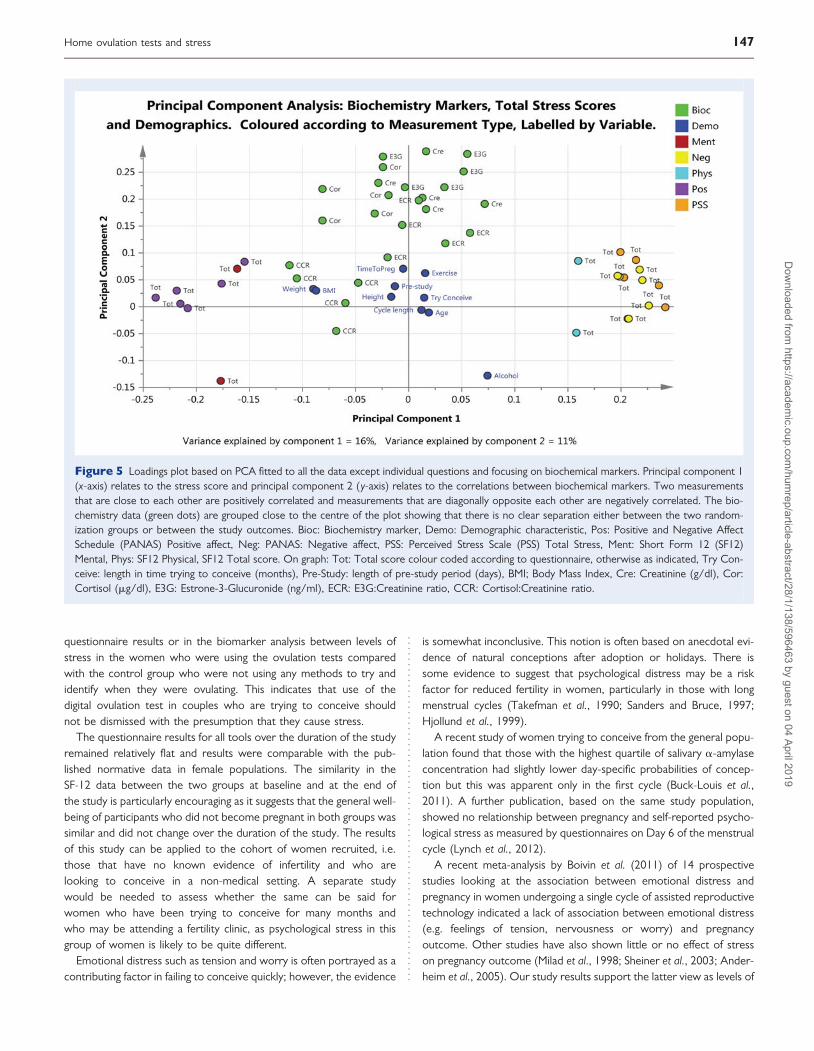
Levels of stress as measured by biochemicalmarkerFigure 5 is the PCA analysis of the first two components fitted to allthe data, except the individual questions, focusing on the biochemicalmarkers, identified by measurement type and labelled by time point.There was no clear separation between the two randomizationgroups or between outcomes in either of the first two componentsfitted. The first component related to the stress score identifying atrend that is explained by the ‘positive’ and ‘negative’ questions/responses. The second component related to the correlationsbetween the biochemical markers.
There was no evidence of a relationship between the demographiccharacteristics and outcome or treatment group, with the exception ofalcohol consumption. High alcohol consumption was associated withthe biochemistry measurements but only in a very few volunteers.
The means and standard deviations of the ratio of cortisol to cre-atinine and E3G to creatinine, over time, for the test and thecontrol groups (samples were collected at time points 2–6) can be
................................................................... ..................................................................
.............................................................................................................................................................................................
Table I Demographic variables by randomization group (mean, median and range except where indicated).
Test group (n 5 115) Control group (n 5 95)
Mean Median (SD) Range Mean Median (SD) Range
Total previous pregnancies 1.7 1 0–7 1.8 2 0–7
Total live births 0.95 1 0–4 1.11 1 0–7
Total miscarriages 0.79 0 0–5 0.57 0 0–4
Months trying to conceive 8.6 6 0–60 8.8 6 1–84
Cycle length (days) 30.56 29 25–49 30.57 30 25–46
Height (m) 1.65 (0.071) 1.42–1.80 1.65 (0.066) 1.46–1.83
Weight (kg) 73.7 (15.82) 49.9–114.3 73.1 (18.92) 47.6–173.0
BMI (kg/m2) 26.9 25.6 17.47–43.82 26.8 24.6 17.58–59.86
Alcohol (units/week) 2.41 0.50 0–15 2.11 0 0–10
Exercise (h/week) 3.0 2 0–20 3.5 3 0–21
Age (years) 28.3 28 20–40 29.7 30 19–39
Pre-cycle 1 Period (days) 30.76 23 9–243 29.75 27 5–127
Smoking History
Yes 10 (8.7%) 4 (4.2%)
Ex 30 (26.1%) 45 (21.4%)
No 75 (65.2%) 76 (80.0%)
Previous ovulation test use
Yes 59 (51.3%) 60 (63.2%)
No 56 (48.7%) 35 (36.8%)
........................................................................................
Table II Breakdown of volunteer outcome bypregnancy or withdrawal.
Frequency(column % age)
Test group(%)
Controlgroup (%)
Total
Withdrew from Study 13 (11.30) 14 (14.74) 27
Lost to follow-up 9 (7.83) 10 (10.53) 19
Not pregnant 44 (38.26) 43 (45.26) 87
Pre-cycle 1 Pregnancy 22 (19.13) 13 (13.68) 35
Pregnant Cycle 1 20 (17.39) 9 (9.47) 29
Pregnant Cycle 2 7 (6.09) 6 (6.32) 13
Total 115 95 210
Pre-cycle 1 pregnancy—pregnancy achieved during cycle of consent, i.e. betweenconsenting to the study and before starting Cycle 1.
Home ovulation tests and stress 143D
ownloaded from
https://academic.oup.com
/humrep/article-abstract/28/1/138/596463 by guest on 04 April 2019
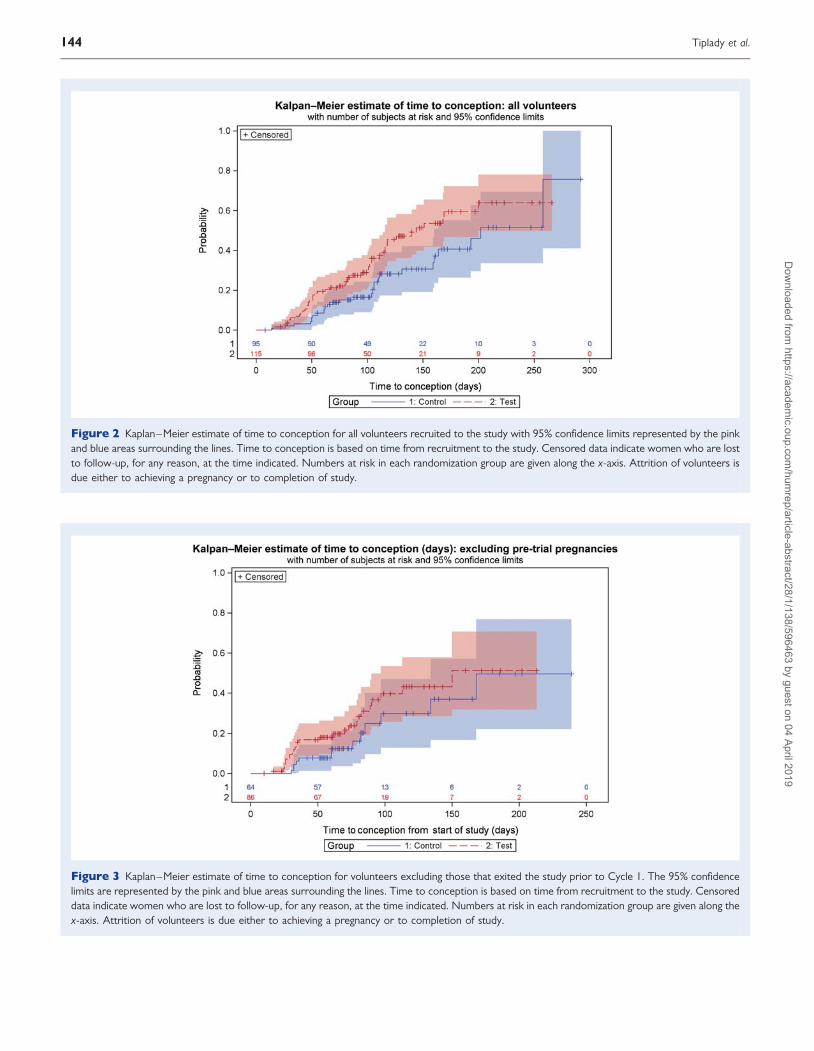
Figure 2 Kaplan–Meier estimate of time to conception for all volunteers recruited to the study with 95% confidence limits represented by the pinkand blue areas surrounding the lines. Time to conception is based on time from recruitment to the study. Censored data indicate women who are lostto follow-up, for any reason, at the time indicated. Numbers at risk in each randomization group are given along the x-axis. Attrition of volunteers isdue either to achieving a pregnancy or to completion of study.
Figure 3 Kaplan–Meier estimate of time to conception for volunteers excluding those that exited the study prior to Cycle 1. The 95% confidencelimits are represented by the pink and blue areas surrounding the lines. Time to conception is based on time from recruitment to the study. Censoreddata indicate women who are lost to follow-up, for any reason, at the time indicated. Numbers at risk in each randomization group are given along thex-axis. Attrition of volunteers is due either to achieving a pregnancy or to completion of study.
144 Tiplady et al.
Dow
nloaded from https://academ
ic.oup.com/hum
rep/article-abstract/28/1/138/596463 by guest on 04 April 2019
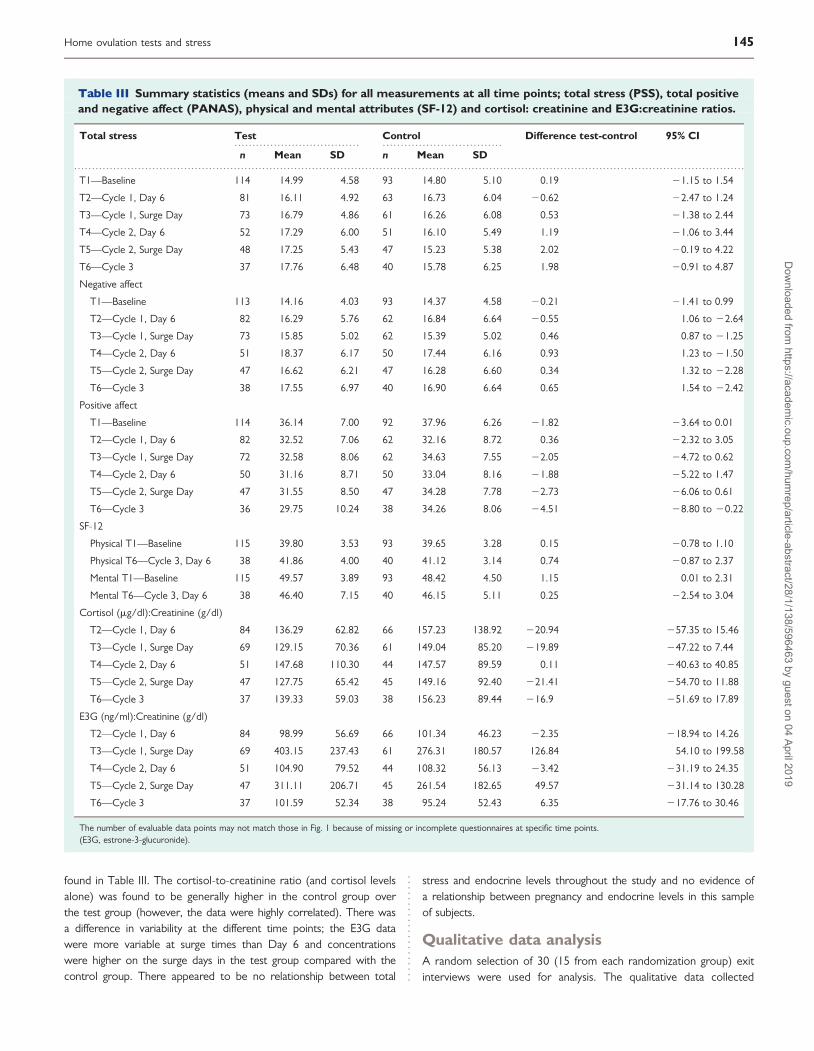
found in Table III. The cortisol-to-creatinine ratio (and cortisol levelsalone) was found to be generally higher in the control group overthe test group (however, the data were highly correlated). There wasa difference in variability at the different time points; the E3G datawere more variable at surge times than Day 6 and concentrationswere higher on the surge days in the test group compared with thecontrol group. There appeared to be no relationship between total
stress and endocrine levels throughout the study and no evidence ofa relationship between pregnancy and endocrine levels in this sampleof subjects.
Qualitative data analysisA random selection of 30 (15 from each randomization group) exitinterviews were used for analysis. The qualitative data collected
................................... .................................
.............................................................................................................................................................................................
Table III Summary statistics (means and SDs) for all measurements at all time points; total stress (PSS), total positiveand negative affect (PANAS), physical and mental attributes (SF-12) and cortisol: creatinine and E3G:creatinine ratios.
Total stress Test Control Difference test-control 95% CI
n Mean SD n Mean SD
T1—Baseline 114 14.99 4.58 93 14.80 5.10 0.19 21.15 to 1.54
T2—Cycle 1, Day 6 81 16.11 4.92 63 16.73 6.04 20.62 22.47 to 1.24
T3—Cycle 1, Surge Day 73 16.79 4.86 61 16.26 6.08 0.53 21.38 to 2.44
T4—Cycle 2, Day 6 52 17.29 6.00 51 16.10 5.49 1.19 21.06 to 3.44
T5—Cycle 2, Surge Day 48 17.25 5.43 47 15.23 5.38 2.02 20.19 to 4.22
T6—Cycle 3 37 17.76 6.48 40 15.78 6.25 1.98 20.91 to 4.87
Negative affect
T1—Baseline 113 14.16 4.03 93 14.37 4.58 20.21 21.41 to 0.99
T2—Cycle 1, Day 6 82 16.29 5.76 62 16.84 6.64 20.55 1.06 to 22.64
T3—Cycle 1, Surge Day 73 15.85 5.02 62 15.39 5.02 0.46 0.87 to 21.25
T4—Cycle 2, Day 6 51 18.37 6.17 50 17.44 6.16 0.93 1.23 to 21.50
T5—Cycle 2, Surge Day 47 16.62 6.21 47 16.28 6.60 0.34 1.32 to 22.28
T6—Cycle 3 38 17.55 6.97 40 16.90 6.64 0.65 1.54 to 22.42
Positive affect
T1—Baseline 114 36.14 7.00 92 37.96 6.26 21.82 23.64 to 0.01
T2—Cycle 1, Day 6 82 32.52 7.06 62 32.16 8.72 0.36 22.32 to 3.05
T3—Cycle 1, Surge Day 72 32.58 8.06 62 34.63 7.55 22.05 24.72 to 0.62
T4—Cycle 2, Day 6 50 31.16 8.71 50 33.04 8.16 21.88 25.22 to 1.47
T5—Cycle 2, Surge Day 47 31.55 8.50 47 34.28 7.78 22.73 26.06 to 0.61
T6—Cycle 3 36 29.75 10.24 38 34.26 8.06 24.51 28.80 to 20.22
SF-12
Physical T1—Baseline 115 39.80 3.53 93 39.65 3.28 0.15 20.78 to 1.10
Physical T6—Cycle 3, Day 6 38 41.86 4.00 40 41.12 3.14 0.74 20.87 to 2.37
Mental T1—Baseline 115 49.57 3.89 93 48.42 4.50 1.15 0.01 to 2.31
Mental T6—Cycle 3, Day 6 38 46.40 7.15 40 46.15 5.11 0.25 22.54 to 3.04
Cortisol (mg/dl):Creatinine (g/dl)
T2—Cycle 1, Day 6 84 136.29 62.82 66 157.23 138.92 220.94 257.35 to 15.46
T3—Cycle 1, Surge Day 69 129.15 70.36 61 149.04 85.20 219.89 247.22 to 7.44
T4—Cycle 2, Day 6 51 147.68 110.30 44 147.57 89.59 0.11 240.63 to 40.85
T5—Cycle 2, Surge Day 47 127.75 65.42 45 149.16 92.40 221.41 254.70 to 11.88
T6—Cycle 3 37 139.33 59.03 38 156.23 89.44 216.9 251.69 to 17.89
E3G (ng/ml):Creatinine (g/dl)
T2—Cycle 1, Day 6 84 98.99 56.69 66 101.34 46.23 22.35 218.94 to 14.26
T3—Cycle 1, Surge Day 69 403.15 237.43 61 276.31 180.57 126.84 54.10 to 199.58
T4—Cycle 2, Day 6 51 104.90 79.52 44 108.32 56.13 23.42 231.19 to 24.35
T5—Cycle 2, Surge Day 47 311.11 206.71 45 261.54 182.65 49.57 231.14 to 130.28
T6—Cycle 3 37 101.59 52.34 38 95.24 52.43 6.35 217.76 to 30.46
The number of evaluable data points may not match those in Fig. 1 because of missing or incomplete questionnaires at specific time points.(E3G, estrone-3-glucuronide).
Home ovulation tests and stress 145D
ownloaded from
https://academic.oup.com
/humrep/article-abstract/28/1/138/596463 by guest on 04 April 2019
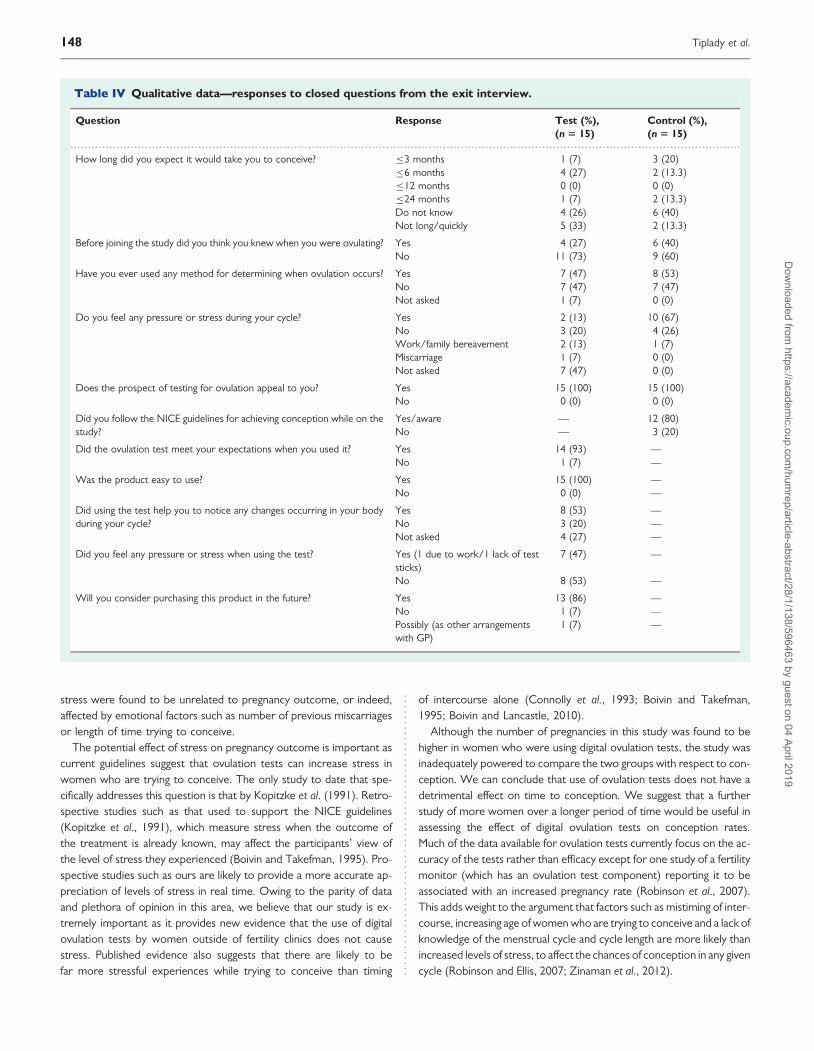
during the exit interview offered a deeper insight into the thoughts andfeelings of the individuals who took part in the study. Results fromclosed questions in which the answers could be tabulated can befound in Table IV. These results highlight that many women expectedto get pregnant within a short time frame, 56.7% stating that theywould have expected to achieve a pregnancy either quickly orwithin 6 months of starting to try. It also highlighted that manywomen had little knowledge of the length of their cycles or whenthey were ovulating, 66.67% stating that before joining the studythey had no idea of when they were ovulating. In addition, 53% ofthose analysed from the test group felt that they had a better under-standing of changes occurring in their bodies around the time of ovu-lation after using the digital ovulation tests during the study.
Of the volunteers in the control group who were provided with theNICE guidelines for increasing chances of conception, 80% chose tofollow them when asked during the exit interview. Those that chosenot to follow these guidelines did so because of the perceivedadded pressure or inconvenience. All the interviewees found thedigital ovulation tests easy to use and understand, often comparingthem with the visual read tests, which they reported as beingdifficult to read.
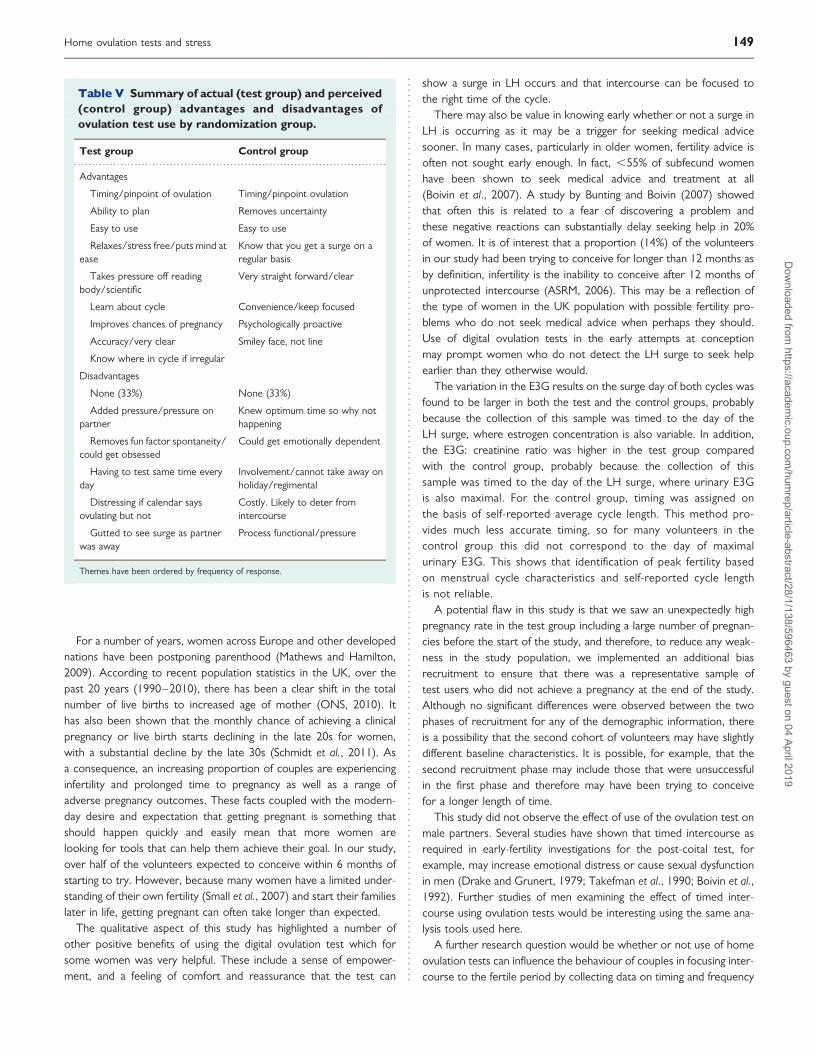
Some of the perceived advantages and disadvantages of using thedigital ovulation tests mentioned by volunteers during the exit inter-view have been listed and ordered by frequency of response inTable V. The most commonly mentioned advantage was the abilityof the test to identify and pinpoint when ovulation occurs and thiswas linked by the volunteers to the increased likelihood of gettingpregnant. It was also observed that using the ovulation tests helpedthe users to focus their conception attempts to the correct time intheir cycle, one volunteer saying that she felt she would be doingsomething psychologically proactive. The main response when askedabout disadvantages was that there were none; however, other disad-vantages included added pressure on the partner and a lack of spon-taneity associated with timing intercourse, although this was oftencountered by the desire to achieve a pregnancy.
DiscussionThis study used three different tools to assess levels of stress inwomen attempting to conceive outside of any fertility investigations;validated questionnaire, urinary biomarkers and qualitative informationcollected by interview. We found no difference either in the
Figure 4 Loadings plot based on PCA fitted to all the data including all the questionnaires, biochemical markers and demographic characteristics.Principal component 1 (x-axis) relates to the trends observed between the positive and negative questions/responses from the PANAS and PSS ques-tionnaires and principal component 2 (y-axis) is related to the positive and negative questions/responses from the SF-12 questionnaire. Two measure-ments that are close to each other are positively correlated and measurements that are diagonally opposite each other are negatively correlated. Clearseparation is evident between the positive and negative responses to the PANAS questionnaire (purple and yellow dots, respectively) and to the PSSquestionnaire as depicted by the two populations of orange dots observed. Bioc: Biochemistry marker, Demo: Demographic characteristic, Pos: Posi-tive and Negative Affect Schedule (PANAS) Positive affect, Neg: PANAS: Negative affect, PSS: Perceived Stress Scale (PSS) Total Stress, Ment: ShortForm 12 (SF12) Mental, Phys: SF12 Physical, SF12 Total score. On graph: Individual questions colour coded according to questionnaire, otherwise asindicated, Try Conceive: length in time trying to conceive (months), Pre-Study: length of pre-study period (days), BMI; Body Mass Index, Cre: Cre-atinine (g/dl), Cor: Cortisol (mg/dl), E3G: Estrone-3-Glucuronide (ng/ml), ECR: E3G:Creatinine ratio, CCR: Cortisol:Creatinine ratio.
146 Tiplady et al.
Dow
nloaded from https://academ
ic.oup.com/hum
rep/article-abstract/28/1/138/596463 by guest on 04 April 2019
questionnaire results or in the biomarker analysis between levels ofstress in the women who were using the ovulation tests comparedwith the control group who were not using any methods to try andidentify when they were ovulating. This indicates that use of thedigital ovulation test in couples who are trying to conceive shouldnot be dismissed with the presumption that they cause stress.
The questionnaire results for all tools over the duration of the studyremained relatively flat and results were comparable with the pub-lished normative data in female populations. The similarity in theSF-12 data between the two groups at baseline and at the end ofthe study is particularly encouraging as it suggests that the general well-being of participants who did not become pregnant in both groups wassimilar and did not change over the duration of the study. The resultsof this study can be applied to the cohort of women recruited, i.e.those that have no known evidence of infertility and who arelooking to conceive in a non-medical setting. A separate studywould be needed to assess whether the same can be said forwomen who have been trying to conceive for many months andwho may be attending a fertility clinic, as psychological stress in thisgroup of women is likely to be quite different.
Emotional distress such as tension and worry is often portrayed as acontributing factor in failing to conceive quickly; however, the evidence
is somewhat inconclusive. This notion is often based on anecdotal evi-dence of natural conceptions after adoption or holidays. There issome evidence to suggest that psychological distress may be a riskfactor for reduced fertility in women, particularly in those with longmenstrual cycles (Takefman et al., 1990; Sanders and Bruce, 1997;Hjollund et al., 1999).
A recent study of women trying to conceive from the general popu-lation found that those with the highest quartile of salivary a-amylaseconcentration had slightly lower day-specific probabilities of concep-tion but this was apparent only in the first cycle (Buck-Louis et al.,2011). A further publication, based on the same study population,showed no relationship between pregnancy and self-reported psycho-logical stress as measured by questionnaires on Day 6 of the menstrualcycle (Lynch et al., 2012).
A recent meta-analysis by Boivin et al. (2011) of 14 prospectivestudies looking at the association between emotional distress andpregnancy in women undergoing a single cycle of assisted reproductivetechnology indicated a lack of association between emotional distress(e.g. feelings of tension, nervousness or worry) and pregnancyoutcome. Other studies have also shown little or no effect of stresson pregnancy outcome (Milad et al., 1998; Sheiner et al., 2003; Ander-heim et al., 2005). Our study results support the latter view as levels of
Figure 5 Loadings plot based on PCA fitted to all the data except individual questions and focusing on biochemical markers. Principal component 1(x-axis) relates to the stress score and principal component 2 (y-axis) relates to the correlations between biochemical markers. Two measurementsthat are close to each other are positively correlated and measurements that are diagonally opposite each other are negatively correlated. The bio-chemistry data (green dots) are grouped close to the centre of the plot showing that there is no clear separation either between the two random-ization groups or between the study outcomes. Bioc: Biochemistry marker, Demo: Demographic characteristic, Pos: Positive and Negative AffectSchedule (PANAS) Positive affect, Neg: PANAS: Negative affect, PSS: Perceived Stress Scale (PSS) Total Stress, Ment: Short Form 12 (SF12)Mental, Phys: SF12 Physical, SF12 Total score. On graph: Tot: Total score colour coded according to questionnaire, otherwise as indicated, Try Con-ceive: length in time trying to conceive (months), Pre-Study: length of pre-study period (days), BMI; Body Mass Index, Cre: Creatinine (g/dl), Cor:Cortisol (mg/dl), E3G: Estrone-3-Glucuronide (ng/ml), ECR: E3G:Creatinine ratio, CCR: Cortisol:Creatinine ratio.
Home ovulation tests and stress 147D
ownloaded from
https://academic.oup.com
/humrep/article-abstract/28/1/138/596463 by guest on 04 April 2019
stress were found to be unrelated to pregnancy outcome, or indeed,affected by emotional factors such as number of previous miscarriagesor length of time trying to conceive.
The potential effect of stress on pregnancy outcome is important ascurrent guidelines suggest that ovulation tests can increase stress inwomen who are trying to conceive. The only study to date that spe-cifically addresses this question is that by Kopitzke et al. (1991). Retro-spective studies such as that used to support the NICE guidelines(Kopitzke et al., 1991), which measure stress when the outcome ofthe treatment is already known, may affect the participants’ view ofthe level of stress they experienced (Boivin and Takefman, 1995). Pro-spective studies such as ours are likely to provide a more accurate ap-preciation of levels of stress in real time. Owing to the parity of dataand plethora of opinion in this area, we believe that our study is ex-tremely important as it provides new evidence that the use of digitalovulation tests by women outside of fertility clinics does not causestress. Published evidence also suggests that there are likely to befar more stressful experiences while trying to conceive than timing
of intercourse alone (Connolly et al., 1993; Boivin and Takefman,1995; Boivin and Lancastle, 2010).
Although the number of pregnancies in this study was found to behigher in women who were using digital ovulation tests, the study wasinadequately powered to compare the two groups with respect to con-ception. We can conclude that use of ovulation tests does not have adetrimental effect on time to conception. We suggest that a furtherstudy of more women over a longer period of time would be useful inassessing the effect of digital ovulation tests on conception rates.Much of the data available for ovulation tests currently focus on the ac-curacy of the tests rather than efficacy except for one study of a fertilitymonitor (which has an ovulation test component) reporting it to beassociated with an increased pregnancy rate (Robinson et al., 2007).This adds weight to the argument that factors such as mistiming of inter-course, increasing age of women who are trying to conceive and a lack ofknowledge of the menstrual cycle and cycle length are more likely thanincreased levels of stress, to affect the chances of conception in any givencycle (Robinson and Ellis, 2007; Zinaman et al., 2012).
.............................................................................................................................................................................................
Table IV Qualitative data—responses to closed questions from the exit interview.
Question Response Test (%),(n 5 15)
Control (%),(n 5 15)
How long did you expect it would take you to conceive? ≤3 months 1 (7) 3 (20)≤6 months 4 (27) 2 (13.3)≤12 months 0 (0) 0 (0)≤24 months 1 (7) 2 (13.3)Do not know 4 (26) 6 (40)Not long/quickly 5 (33) 2 (13.3)
Before joining the study did you think you knew when you were ovulating? Yes 4 (27) 6 (40)No 11 (73) 9 (60)
Have you ever used any method for determining when ovulation occurs? Yes 7 (47) 8 (53)No 7 (47) 7 (47)Not asked 1 (7) 0 (0)
Do you feel any pressure or stress during your cycle? Yes 2 (13) 10 (67)No 3 (20) 4 (26)Work/family bereavement 2 (13) 1 (7)Miscarriage 1 (7) 0 (0)Not asked 7 (47) 0 (0)
Does the prospect of testing for ovulation appeal to you? Yes 15 (100) 15 (100)No 0 (0) 0 (0)
Did you follow the NICE guidelines for achieving conception while on thestudy?
Yes/aware — 12 (80)No — 3 (20)
Did the ovulation test meet your expectations when you used it? Yes 14 (93) —No 1 (7) —
Was the product easy to use? Yes 15 (100) —No 0 (0) —
Did using the test help you to notice any changes occurring in your bodyduring your cycle?
Yes 8 (53) —No 3 (20) —Not asked 4 (27) —
Did you feel any pressure or stress when using the test? Yes (1 due to work/1 lack of teststicks)
7 (47) —
No 8 (53) —
Will you consider purchasing this product in the future? Yes 13 (86) —No 1 (7) —Possibly (as other arrangementswith GP)
1 (7) —
148 Tiplady et al.
Dow
nloaded from https://academ
ic.oup.com/hum
rep/article-abstract/28/1/138/596463 by guest on 04 April 2019
For a number of years, women across Europe and other developednations have been postponing parenthood (Mathews and Hamilton,2009). According to recent population statistics in the UK, over thepast 20 years (1990–2010), there has been a clear shift in the totalnumber of live births to increased age of mother (ONS, 2010). Ithas also been shown that the monthly chance of achieving a clinicalpregnancy or live birth starts declining in the late 20s for women,with a substantial decline by the late 30s (Schmidt et al., 2011). Asa consequence, an increasing proportion of couples are experiencinginfertility and prolonged time to pregnancy as well as a range ofadverse pregnancy outcomes. These facts coupled with the modern-day desire and expectation that getting pregnant is something thatshould happen quickly and easily mean that more women arelooking for tools that can help them achieve their goal. In our study,over half of the volunteers expected to conceive within 6 months ofstarting to try. However, because many women have a limited under-standing of their own fertility (Small et al., 2007) and start their familieslater in life, getting pregnant can often take longer than expected.
The qualitative aspect of this study has highlighted a number ofother positive benefits of using the digital ovulation test which forsome women was very helpful. These include a sense of empower-ment, and a feeling of comfort and reassurance that the test can
show a surge in LH occurs and that intercourse can be focused tothe right time of the cycle.
There may also be value in knowing early whether or not a surge inLH is occurring as it may be a trigger for seeking medical advicesooner. In many cases, particularly in older women, fertility advice isoften not sought early enough. In fact, ,55% of subfecund womenhave been shown to seek medical advice and treatment at all(Boivin et al., 2007). A study by Bunting and Boivin (2007) showedthat often this is related to a fear of discovering a problem andthese negative reactions can substantially delay seeking help in 20%of women. It is of interest that a proportion (14%) of the volunteersin our study had been trying to conceive for longer than 12 months asby definition, infertility is the inability to conceive after 12 months ofunprotected intercourse (ASRM, 2006). This may be a reflection ofthe type of women in the UK population with possible fertility pro-blems who do not seek medical advice when perhaps they should.Use of digital ovulation tests in the early attempts at conceptionmay prompt women who do not detect the LH surge to seek helpearlier than they otherwise would.
The variation in the E3G results on the surge day of both cycles wasfound to be larger in both the test and the control groups, probablybecause the collection of this sample was timed to the day of theLH surge, where estrogen concentration is also variable. In addition,the E3G: creatinine ratio was higher in the test group comparedwith the control group, probably because the collection of thissample was timed to the day of the LH surge, where urinary E3Gis also maximal. For the control group, timing was assigned onthe basis of self-reported average cycle length. This method pro-vides much less accurate timing, so for many volunteers in thecontrol group this did not correspond to the day of maximalurinary E3G. This shows that identification of peak fertility basedon menstrual cycle characteristics and self-reported cycle lengthis not reliable.
A potential flaw in this study is that we saw an unexpectedly highpregnancy rate in the test group including a large number of pregnan-cies before the start of the study, and therefore, to reduce any weak-ness in the study population, we implemented an additional biasrecruitment to ensure that there was a representative sample oftest users who did not achieve a pregnancy at the end of the study.Although no significant differences were observed between the twophases of recruitment for any of the demographic information, thereis a possibility that the second cohort of volunteers may have slightlydifferent baseline characteristics. It is possible, for example, that thesecond recruitment phase may include those that were unsuccessfulin the first phase and therefore may have been trying to conceivefor a longer length of time.
This study did not observe the effect of use of the ovulation test onmale partners. Several studies have shown that timed intercourse asrequired in early-fertility investigations for the post-coital test, forexample, may increase emotional distress or cause sexual dysfunctionin men (Drake and Grunert, 1979; Takefman et al., 1990; Boivin et al.,1992). Further studies of men examining the effect of timed inter-course using ovulation tests would be interesting using the same ana-lysis tools used here.
A further research question would be whether or not use of homeovulation tests can influence the behaviour of couples in focusing inter-course to the fertile period by collecting data on timing and frequency
........................................................................................
Table V Summary of actual (test group) and perceived(control group) advantages and disadvantages ofovulation test use by randomization group.
Test group Control group
Advantages
Timing/pinpoint of ovulation Timing/pinpoint ovulation
Ability to plan Removes uncertainty
Easy to use Easy to use
Relaxes/stress free/puts mind atease
Know that you get a surge on aregular basis
Takes pressure off readingbody/scientific
Very straight forward/clear
Learn about cycle Convenience/keep focused
Improves chances of pregnancy Psychologically proactive
Accuracy/very clear Smiley face, not line
Know where in cycle if irregular
Disadvantages
None (33%) None (33%)
Added pressure/pressure onpartner
Knew optimum time so why nothappening
Removes fun factor spontaneity/could get obsessed
Could get emotionally dependent
Having to test same time everyday
Involvement/cannot take away onholiday/regimental
Distressing if calendar saysovulating but not
Costly. Likely to deter fromintercourse
Gutted to see surge as partnerwas away
Process functional/pressure
Themes have been ordered by frequency of response.
Home ovulation tests and stress 149D
ownloaded from
https://academic.oup.com
/humrep/article-abstract/28/1/138/596463 by guest on 04 April 2019

of intercourse. However, this type of information is difficult to collectaccurately and can make participation over-cumbersome for thevolunteers taking part with risk to overall study compliance and its in-clusiveness to volunteers.
In summary, this study has shown that there is no difference in levelsof stress between women using home ovulation tests and women whoare trying to conceive having been provided with the NICE guidelineson increasing the chances of conception. The suggested benefits of useof home ovulation detection kits include possible reduction in time topregnancy, improved understanding of ovarian and menstrual cyclesand positive reinforcement of reproductive health. Women whowish to use these tests as an aid to conception should not be discour-aged because of unfounded suggestions that they increase stress levelsamong users.
AcknowledgementsThe authors express their gratitude to all the volunteers who partici-pated in the study and to Hilary Wood for her help in the analysis ofthe qualitative interview data. They also thank Christopher Shreevesand Kenneth Lai for their contribution in collating the study question-naire and sample databases.
Authors’ rolesS.J. and W.L. made substantial contribution to the concept and studydesign. S.T. contributed to execution of the study and acquisition ofthe data as well as drafting of the manuscript. G.J. and M.C. wereinvolved with data analysis and interpretation. All the authors madesubstantial contributions to revising the article critically for importantintellectual content and final approval of the version to be published.
FundingThis study was funded by SPD Swiss Precision Diagnostics, GmbH,manufacturer of Clearblue pregnancy and ovulation tests. SPDDevelopment Company Ltd is a wholly owned subsidiary of SPDSwiss Precision Diagnostics GmbH; together referred to as SPD.Funding to pay the Open Access publication charges for this articlewas provided by SPD Development Company Limited, a whollyowned subsidiary of SPD Swiss Precision Diagnostics GmbH.
Conflict of interestS.T. and S.J. are employees of SPD Development Company Limited.W.L. is an independent clinician, who did not receive consultancyfees for his intellectual contribution to this study, but continues toprovide paid consultancy to SPD
ReferencesAmerican Society for Reproductive Medicine (ASRM) Practice Committee.
Definition of ‘infertility’. Fertil Steril 2006;86(Suppl 4):S228.Anderheim L, Holter H, Bergh C, Moller A. Does psychological stress affect
the outcome of in vitro fertilization? Hum Reprod 2005;20:2969–2975.Behre H, Kuhlage J, Gasner C, Sonntag B, Schem C, Schneider H,
Nieschlag E. Prediction of ovulation by urinary hormone measurements
with the home use ClearPlan Fertility Monitor: comparison withtransvaginal ultrasound scans and serum hormone measurements. HumReprod 2000;15:2478–2482.
Blackwell LF, Brown JB, Vigil P, Gross B, Sufi S, d’Arcangues C. Hormonalmonitoring of ovarian activity using the ovarian monitor, Part 1. Validationof home and laboratory results obtained during ovulatory cycles bycomparison with radioimmunoassay. Steroids 2003;68:465–476.
Boivin J, Lancastle D. Medical waiting periods: imminence, emotions andcoping. Women’s Health 2010;6:59–69.
Boivin J, Takefman J. Stress level across stages of in vitro fertilisation insubsequently pregnant and nonpregnant women. Fertil Steril 1995;64:802–810.
Boivin J, Takefman J, Brender W, Tulandi T. The effects of female sexualresponse in coitus on early reproductive processes. J Behav Med 1992;15:509–518.
Boivin J, Bunting L, Collins J, Nygren G. International estimates of infertilityprevalence and treatment-seeking: potential need and demand forinfertility medical care. Hum Reprod 2007;22:1506–1512.
Boivin J, Griffiths E, Venetis C. Emotional distress in infertile women andfailure of assisted reproductive technologies: meta-analysis ofprospective psychosocial studies. Br Med J 2011;342(d223):1–9.
Brown J, Blackwell L, Billings J, Conway B, Cox R, Garrett G, Holmes J,Smith M. Natural family planning. Am J Obstet Gynecol 1987;157:1082–1089.
Buck Louis G, Lum K, Sundaram R, Chen Z, Kim S, Lynch C,Schisterman E, Pyper C. Stress reduces conception probabilitiesacross the fertile window: evidence in support of relaxation. FertilSteril 2011;95:2184–2189.
Bunting L, Boivin J. Decision-making about seeking medical advice in aninternet sample of women trying to get pregnant. Hum Reprod 2007;22:1662–1668.
Cohen S, Williamson G. Perceived stress in a probability sample of theUnited States. In: Spacapan S, Scamp S (eds). The Social Psychology ofHealth: Claremont Symposium on Applied Social Psychology. NewburyPark, CA: Sage Publications, 1998, 31–67.
Cohen S, Kamarch T, Mermelstein R. A global measure of perceivedstress. J Health Soc Behav 1983;24:385–396.
Collins W. Hormonal indices of ovulation and the fertile period. AdvContracept 1985;1:279–294.
Connolly K, Edelmann R, Bartlett H, Cooke I, Lenton E, Pike S. Anevaluation of counselling for couples undergoing treatment for in-vitrofertilisation. Hum Reprod 1993;8:1332–1338.
Crawford J, Henry J. The positive and negative affect schedule(PANAS): construct validity, measurement properties and normativedata in large a large non-clinical sample. Br J Clin Psychol 2004;43:245–265.
Creinin M, Keverline SandMeyn L. How regular is regular? An analysis ofmenstrual cycle regularity. Contraception 2004;70:289–292.
Drake T, Grunert G. A cyclic pattern of sexual dysfunction in the fertilityinvestigation. Fertil Steril 1979;32:542–545.
Gnoth C, Frank-Herrmann P, Freundl G. Opinion: natural familyplanning and the management of infertility. Arch Gynecol Obstet 2002;267:67–71.
Hilgers T, Daly K, Prebil A, Hilgers S. Cumulative pregnancy rates inpatients with apparently normal fertility and fertility-focusedintercourse. J Reprod Med 1992;37:864–866.
Hjollund N, Jenson T, Bonde J, Henriksen T, Andersson A, Kolstad H,Skakkebaek N, Olsen J. Distress and reduced fertility: a follow-upstudy of first-pregnancy planners. Fertil Steril 1999;72:47–53.
Jenkinson C, Stewart-Brown S, Peterson S, Paice C. Assessment of theSF-36 version 2 in the United Kingdom. J Epidemiol Community Health1999;53:46–50.
150 Tiplady et al.
Dow
nloaded from https://academ
ic.oup.com/hum
rep/article-abstract/28/1/138/596463 by guest on 04 April 2019

Johnson S, Miro F, Barrett S, Ellis J. Levels of urinary human chorionicgonadotrophin (hCG) following conception and variability ofmenstrual cycle length in a cohort of women attempting to conceive.Curr Med Res Opin 2009;25:741–748.
Johnson S, Ellis J, Godbert S, Ali S, Zinaman M. Comparison of a digitalovulation test with three popular line ovulation tests to investigateuser accuracy and certainty. Expert Opin Med Diagn 2011;5:467–473.
Kopitzke E, Berg B, Wilson J, Owens D. Physical and emotional stressassociated with components of the infertility investigation: perspectivesof professionals and patients. Fertil Steril 1991;55:1137–1143.
Lokuge S, Frey B, Foster J, Soares C, Steiner M. Depression inwomen: windows of vulnerability and new insights into the linkbetween estrogen and serotonin. J Clin Psychiatry 2011;72:e1563–e1569.
Lynch C, Sundaram R, Buck-Louis G, Lum K, Pyper C. Are increased levelsof self-reported psychosocial stress, anxiety, and depression associatedwith fecundity? Fertil Steril 2012;98:453–458.
Marshall C, Rossman G. Designing Qualitative Research, 3rd edn. London:Sage, UK, 1999.
Mathews T, Hamilton B. 2009. Delayed childbearing: more women arehaving their first child later in life. NCHS Data Brief 21 [online]Available at: ,http://www.cdc.gov/nchs/data/databriefs/db21.pdf.(10 August 2012, date last accessed).
Matthews JNS, Altman DG, Campbell MJ, Royston P. Analysis of serialmeasurements in medical research. Br Med J 1990;300:230–235.
Miki K, Sudo A. Effect of urine pH, storage time and temperature onstability of catecholamines, cortisol and creatinine. Clin Chem 1998;44:1759–1762.
Milad M, Klock S, Moses S, Chatterton R. Stress and anxiety do not resultin pregnancy wastage. Hum Reprod 1998;13:2296–2300.
Miro F, Parker S, Aspinall L, Coley J, Perry P, Ellis J. Sequential classificationof endocrine stages during reproductive aging in women: the FREEDOMstudy. Menopause 2005;12:281–290.
Nakamura K, Sheps S, Arck P. Stress and reproductive failure: pastnotions, present insights and future directions. J Assist Reprod Genet2008;25:47–62.
National Institute for Clinical Excellence (NICE) Clinical Guideline, 2004.Fertility: assessment and treatment for people with fertility problems.[online] Available at: ,http://publications.nice.org.uk/fertility-cg11.
(13 March 2012, date last accessed).Nepomnaschy P, Altman R, Watterson R, Co C, McConnell D,
England B. Is cortisol excretion independent of menstrual cycle day?A longitudinal evaluation of first morning urinary specimens. PLoSONE 2011;6:e18242.
Nicolson N. Measurement of cortisol. In: Luecken L, Gallo L (eds).Handbook of Physiological Research Methods in Health Psychology.Thousand Oaks, CA: Sage Publications, 2008, 37–74.
Office for National Statistics (ONS). 2010. Live births in England andWales by characteristics of mother 2010. [online] Available at: ,http://www.ons.gov.uk/ons/index.html. (13 March 2012, date lastaccessed).
Robinson J, Ellis J. Mistiming of intercourse as a primary cause of failure toconceive: results of a survey on use of a home-use fertility monitor. CurrMed Res Opin 2007;23:301–306.
Robinson J, Wakelin M, Ellis J. Increased pregnancy rate with use of theClearblue Easy Fertility Monitor. Fertil Steril 2007;87:329–334.
Sanders K, Bruce N. A prospective study of psychosocial stress and fertilityin women. Hum Reprod 1997;12:2324–2329.
Schmidt L, Sobotka T, Bentzen J, Andersen A. Demographic and medicalconsequences of the postponement of parenthood. Hum Reprod Update2011;18:29–43.
Severy L, Robinson J, Findley-Klein C, McNulty J. Acceptability of a homemonitor used to aid in conception: psychosocial factors and coupledynamics. Contraception 2006;73:65–71.
Sheiner E, Sheiner E, Potashnik G, Carel R, Shoham-Vardi I. Therelationship between occupational psychological stress and femalefertility. Occup Med 2003;53:265–269.
Singh M, Baxena B, Rathnam P. Clinical validation of enzyme immunoassayof human luteinizing hormone (hLH) in the detection of thepre-ovulatory luteinizing hormone (LH) surge in urine. Fertil Steril1984;41:210–217.
Small C, Manatunga A, Marcus M. Validity of self-reported menstrual cyclelength. Ann Epidemiol 2007;17:163–170.
Stanford J, White G, Hatasaka H. Timing intercourse to achievepregnancy: current evidence. Obstet Gynecol 2002;100:1333–1341.
Takefman J, Brender W, Boivin J, Tulandi T. Sexual and emotional adjustmentof couples undergoing infertility investigation and the effectiveness ofpreparatory information. J Psychosom Obstet Gynecol 1990;11:275–290.
Ware J, Sherbourne C. The MOS 36-item short-form health survey(SF-36). I. Conceptual framework and item selection. Med Care 1992;30:473–483.
Watson D, Clark L, Tellegen A. Development and validation of briefmeasures of positive and negative affect: the PANAS scales. J PersSoc Psychol 1988;54:1063–1070.
WHO Task force on Methods for Determination of the Fertile Period.Temporal relationships between ovulation and defined changes in theconcentration of plasma estradiol-17b, luteinising hormone, folliclestimulating hormone and progesterone. I. Probit analysis. Am J ObstetGynaecol 1980;138:383–390.
Wilcox A, Dunson D, Baird D. The timing of the ‘fertile window’ in themenstrual cycle: day specific estimates from a prospective study. BrMed J 2000;321:1259–1262.
Zinaman M, Johnson S, Ellis J, Ledger W. Accuracy of perception of ovulationday in women trying to conceive. Curr Med Res Opin 2012;28:1–6.
Home ovulation tests and stress 151D
ownloaded from
https://academic.oup.com
/humrep/article-abstract/28/1/138/596463 by guest on 04 April 2019