Home Depot Situation Analysis 5471644 -...
36
Situation Analysis: Home Depot Samantha Dintsch Rebecca Harris Camille Harvey Natalie Townsend Mary Carlie Vaughn Natalie White
Transcript of Home Depot Situation Analysis 5471644 -...

Situation Analysis: Home Depot
Samantha Dintsch
Rebecca Harris
Camille Harvey
Natalie Townsend
Mary Carlie Vaughn
Natalie White

2
Introduction 1
Industry Overview 4-8
Client Profile: The Home Depot 9-11
Competitor Analysis: Lowe’s
Comparative Analysis
12
13
Secondary Competitor Analysis: Sears and WalMart 14
Consumer Analysis 15
Quantitative Research
Qualitative Research
Marketing/Communications Recommendations
Appendix I: Survey
Appendix II: Qualitative Guide
Reference List
16-19
20-
T a b l e O f C o n t e n t s

3
I n t r o d u c t i o n
A s the largest home improvement store in the United States, The Home Depot has made a name for itself in the home im-provement industry. With the recent decline in the home im-
provement industry and increased competition from Lowe’s, The Home Depot must innovate in order to maintain its place in the market. By analyzing the home improvement market and competition within the market, The Home Depot can gain insight into industry trends and market its brand accordingly. The following report will explore the home improvement industry as a whole, The Home Depot and its competitors, and the consumer base.
B y highlighting valuable information about the home improvement industry, the industry overview pro-vides the information necessary to begin researching
The Home Depot. The Industry Overview also illustrates how The Home Depot compares to its competitors. Key points in the Indus-try Overview are the history of the industry, industry size, advertising expenditures, growth Industry Overview are The Home Depot’s primary and secondary competitors, social and cultural trends, the effect of the economic environment on the industry, regulatory and legal issues, and new developments within the home improvement industry. Following the Industry Overview is the Client Profile and Competitor Analysis. This section is very important because it not only provides information about The Home Depot’s history, sales, and marketing mix, but it also provides the same information about The Home Depot’s primary com-petitor, Lowe’s.
T he final section of the situation analysis is the Consumer Analy-sis. In order for The Home Depot’s marketing efforts to be suc-cessful it must be aware of its target market. This section ana-
lyzes consumer trends in the home improvement industry, highlighting the demographics and psychographics that comprise the overall target
market.
B y looking at all the different aspects of the home improvement industry, we can better recognize The Home Depot’s role within the industry. Knowing the details of the industry is cru-
cial to implementing the correct marketing strategy in order to main-tain The Home Depot’s place in the market.
T o gain further information about females atti-tudes and beliefs of The Home Depot, our group designed and conducted a survey. We hand dis-
tributed the survey in locations such as The Home Depot, Lowe’s, WalMart, Sears, Bed, Bath and Beyond. The ulti-mate goal of this survey was to discover information on the following research objectives: To measure the target
market's current, past (last 12 months) or future (next 12 months) home improvement projects or plans, to assess the target market's attitudes and beliefs about home improvement retailers, to assess the target mar-ket's attitudes and beliefs about The Home Depot, to assess the target market’s attitudes and beliefs about Lowe’s in comparison to your cli-ent, to measure the target market's The Home Depot usage, and to iden-tify if there are consumer behavioral differences in age, gender, income, etc.
A fter the survey was conducted there was still some lack of in-formation and gaps in fully understanding the home improve-ment consumers. Therefore we conducted six personal inter-
views to fill in those gaps, gain further consumer insight and attitudes towards The Home Depot. These personal interviews allowed more flexibility and probing than the survey. These interview questions di-rectly addressed the needed information to conclude the findings from the quantitative research.

4
T he home improvement industry be-gan primarily with many local hard-ware stores, such as Lowe’s North
Wilkesboro Hardware Store. Lucious S. Lowe opened this small store in North Carolina in 1921. After his death, his son, Jim Lowe and war veteran friend, Carl Buchan, took over the business. They expanded the business and created the first official Lowe’s Home Improvement store in 1946 in North Caro-lina.1 The home improvement industry boomed after World War II. In 1949, Arthur Levitt and sons created the first modern sub-division in Long Island. War veterans pur-
chased the homes and since they all looked alike, the homeowners sought out hardware stores to buy items that would create indi-viduality. A U.S. census showed that home re-pair/improvement boomed from 1982 to 1992. Overall, Lowe’s dominated the industry until the 1980s.2 Due to the popularity of the industry, Bernie Marcus and Arthur Blank founded The Home Depot in 1978 . They opened their first store in Atlanta, Georgia in 1979. In 1980, The Home Depot introduced the first “Do It Yourself” workshop. This cre-ated a phenomenon within the home im-provement industry.
Now, the home improvement indus-try is one of the most thriving industries in The United States.3 The Home Depot and Lowe’s have even expanded their locations to Canada and in 2006 The Home Depot ac-quired a twelve store chain in China. The suc-cess of the home improvement industry is based largely on the boom that was gener-ated by WWII veterans and the first subdivi-sion that was created from the post-war ef-forts.2 Ever since this boom, The Home De-pot and Lowe’s have been the two main play-ers that comprise the Home Improvement Industry.
H i s t o r y
1921
North Wilkesboro-Hardware Store
opened
1946
First Lowe’s Home Im-provement Store opened in
North Carolina
1949
First Subdivision cre-ated by Arthur Levitt
1978
Home Depot was founded
1979
First Home Depot opened in GA
1980
Home Depot offered first Do-It-Yourself
program
1961
Lowe’s went public on NASDAQ
1981
Home Depot went public on NASDAQ
2006
Home Depot acquired stores in China
2007
Lowe’s opened first store in
Canada
Ind
ustry
Ove
rvie
wIn
du
stry
Ove
rvie
w
Figure : 1
Source: HomeDepot.com

5
A s shown in Graph 1, the sales in the home improvement industry are steadily increasing. Since
2000, its revenues increased from $176 bil-lion to $306 billion in 2007.4 The Home Depot is the largest home retail center con-trolling 42-46% of the market. The primary competitor for The Home Depot is Lowe’s because it sells the same products as The Home Depot and also appeals to the same target market. Lowe’s controls the second
largest portion of the market with 27-30%.5 One secondary competitor for The Home Depot is Wal-Mart because it offers a variety of home improvement products such as: paint, tools, and hardware for a low price. Sears is also a secondary com-petitor because it offers tools along with appliances and electronics that could be purchased at The Home Depot. The Home Depot spent
more than $1.1 million on adver-tising in 2005 and 2006. Spending less than The Home Depot, Lowe’s invested $778 thousand in adver-tising in 2005 and $838 thousand in 2006. When combined, these two companies make up almost 80% of the home improvement retail mar-ket. Graph 2 reveals the overall trend of advertis-
ing expenditures among the home improve-ment industry.6
Advertising Spending
0
200
400
600
800
1,000
1,200
2006 2005Year
Ad
ve
rtis
ein
g d
oll
ars
sp
en
t (t
ho
usa
nd
s)
Graph: 2 Source: Leading National Advertisers
Graph: 1 Source: NHRA
I n d u s t r y S i z e
Total Retail Sales by Home Improvement Retailers
0
50
100
150
200
250
300
350
2000 2001 2002 2003 2004 2005 2006 2007
Year
Sa
les
(in
bil
lio
ns)
Ind
ustr
y O
ve
rvie
wIn
du
str
y O
ve
rvie
w
“Longer terms, trends underlying the home
improvement industry remain favorable for
continued sales and market share growth.”
-Arthur Blank 9

6
According to the North American Retail Hardware Association’s annual report, the home improvement industry is mature.4 At this mature stage, the industry is well established , sales volumes have peaked, costs are very low, competition is increasing, and stores strive to differ from the competition with the products offered. It still shows a positive growth as demonstrated by retail sales, fea-tured in Graph 1.
According to Figure 2, quarterly income statements from the larg-est market shareholders in the industry, The Home Depot and Lowe’s, show the most money is spent on home improvement dur-ing the second and third quarters. Statements report that during the second quarter, The Home Depot was most profitable and earned $21,585 million in profit. It was the least profitable in the fourth quarter with sales of $18,961 million. Lowe’s was most prof-itable in the third quarter with sales of $14,166 million while its lowest sales, $10,405 million, occurred in the first quarter.7
The growth potential for the home improvement industry is neu-tral. The housing market has been on a decline for nearly two years and is not predicted to show any improvement through 2008. Al-though the housing market is low, there is still hope for the home improvement industry due to the fact that home ownership has re-
mained healthy. Since ownership has remained positive and home-owners view their homes as investments and therefore spend more on improvement than renters do, this should continue to drive market growth. According to market research firm Global Insight, the total home improvement products market in the U.S. was esti-mated to have declined to $308.9 billion in 2007, from $312.9 bil-lion in 2006. However, it is projected to advance to $394.1 billion by 2012, a 5.0% compound annual growth rate. 8
Graph 3 shows that the real domestic growth product (GDP) de-creased 2.9% in 2006 to 2.2% in 2007, which leads economists to believe that the GDP will fall another 1.9% in 2008.10 Some of the factors that may account for the decline in GDP could be: the ever
S e a s o n a l i t y
S t a g e i n P r o d u c t L i f e C y c l e In
du
stry
Ove
rvie
wIn
du
stry
Ove
rvie
w
Quarter Lowe’s The Home Depot
1. Ending Jan 07 Quarter
$10,405 $20,265
2. Ending Apr 07 Quarter
$12,172 $21,585
3. Ending Jul 07 Quarter
$14,166 $19,144
4. Ending Oct 07 Quarter
$11,566 $18,961
Quarterly Income Statements: Home Depot and Lowe’s (millions)
G r o w t h & P o t e n t i a l F o r e c a s t
Figure: 2 Source: hoovers.com
T h e E c o n o m y GDP Decline
7
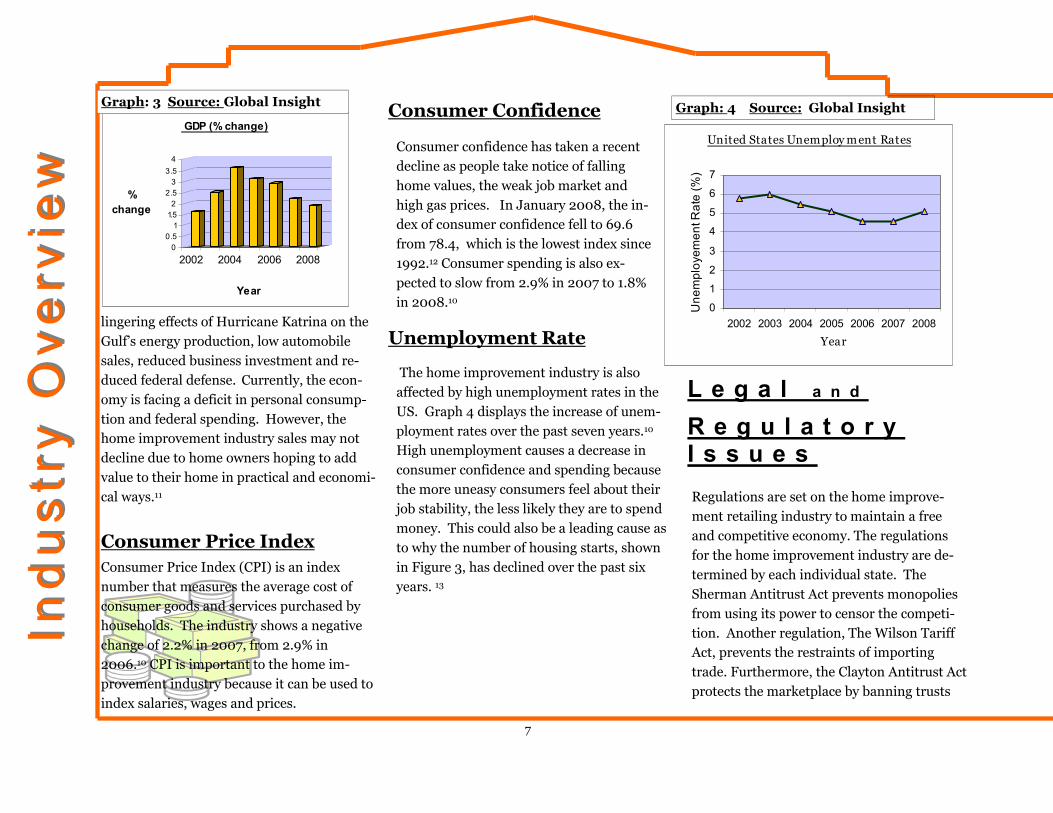
lingering effects of Hurricane Katrina on the Gulf’s energy production, low automobile sales, reduced business investment and re-duced federal defense. Currently, the econ-omy is facing a deficit in personal consump-tion and federal spending. However, the home improvement industry sales may not decline due to home owners hoping to add value to their home in practical and economi-cal ways.11
Consumer Price Index (CPI) is an index number that measures the average cost of consumer goods and services purchased by households. The industry shows a negative change of 2.2% in 2007, from 2.9% in 2006.10 CPI is important to the home im-provement industry because it can be used to index salaries, wages and prices.
Consumer confidence has taken a recent decline as people take notice of falling home values, the weak job market and high gas prices. In January 2008, the in-dex of consumer confidence fell to 69.6 from 78.4, which is the lowest index since 1992.12 Consumer spending is also ex-pected to slow from 2.9% in 2007 to 1.8% in 2008.10
The home improvement industry is also affected by high unemployment rates in the US. Graph 4 displays the increase of unem-ployment rates over the past seven years.10 High unemployment causes a decrease in consumer confidence and spending because the more uneasy consumers feel about their job stability, the less likely they are to spend money. This could also be a leading cause as to why the number of housing starts, shown in Figure 3, has declined over the past six years. 13
Regulations are set on the home improve-ment retailing industry to maintain a free and competitive economy. The regulations for the home improvement industry are de-termined by each individual state. The Sherman Antitrust Act prevents monopolies from using its power to censor the competi-tion. Another regulation, The Wilson Tariff Act, prevents the restraints of importing trade. Furthermore, the Clayton Antitrust Act protects the marketplace by banning trusts
00.5
11.52
2.53
3.5
4
% change
2002 2004 2006 2008
Year
GDP (% change)
Consumer Price Index
Unemployment Rate
Ind
ustr
y O
ve
rvie
wIn
du
str
y O
ve
rvie
w
L e g a l a n d
R e g u l a t o r y I s s u e s
Consumer Confidence United States Unemploy m ent Rates
0
1
2
3
4
5
6
7
2002 2003 2004 2005 2006 2007 2008
Year
Une
mpl
oyem
ent R
ate
(%)
Graph: 3 Source: Global Insight Graph: 4 Source: Global Insight

8
board of directors, fixed prices, etc. to con-trol the supply and price of products to gain a monopoly. These regulations are put in place to ensure that the general public is provided with the best prices, quality and to maintain competition between busi-nesses.14 Since the highest complaint in the industry among consumers is home im-provement fraud, The Federal Trade Com-mission, the National Association of Home Builders Remodelors™ Council and the National Association of Consumer Agency Administrators have created a kit called “Home Improvement: Tools You Can Use,” which lists several tips for hiring a contrac-tor and avoiding home improvement fraud.15
The main factor in how consumers make their home improvement purchasing deci-sions is based on their level of income and the allocated budget for home improve-ment products and projects. The larger the budget, the more choices consumers have regarding the durability and finish of the products they choose. Therefore, the amount of money that consumers have to spend on their purchases not only increases demand for improvement products but will also affect the range of products offered.11
The main two customers in the industry are:
• Do-It –Yourself
• Do-It-For-Me
These are social considerations for the in-dustry to remember in order to provide the best customer service and products. 16
The Do-It-Yourself Market (DIY) is a large customer group in the home improvement industry where consumers purchases sup-plies and complete their own projects. This is a driving trend for the industry that ac-counts for approximately 40% of the total market. To increase spending among DIY consumers, home improvement retailers have started to provide in store customer assistance and websites specifically for DIY projects.16
Housing Market (number of housing starts in thousands of units per year)
2002 2003 2004 2005 2006 2007
2 ,20 0
1 ,9 00
1 ,70 0
1 ,50 0
1 ,300
1 ,100
Ind
ustry
Ove
rvie
wIn
du
stry
Ove
rvie
w
Figure: 3
Source: Standard and Poors
S o c i e t a l & C u l t u r a l i s -s u e s
Do-It-Yourself

9
T he Do-It-For-Me
Market (DIFM) is
a large home im-
provement industry group in
which consumers purchase
supplies and hire a third-
party to complete the project
for them. This market is pre-
dicted to increase with the
retirement of many baby boomers, which
should lead to continuous home improvement
spending.16
A s America’s baby boomer popula-
tion gets older, they are increas-
ing their spending. Baby boomers
are responsible for more than half of all
home improvement expenditures, today.
They are expected to increase their spend-
ing on home improvement projects after
their kids have moved out. Within the home
improvement industry, they are expected to
influence the do-it-for me service category.
Additionally, this popula-
tion is likely to drive an
increase in existing home
sales as many of them ei-
ther look to downsize or
acquire a second vacation
or retirement home. These
scenarios should have a positive im-
pact on the home improvement in-
dustry.11
O ver the last few years, buying
environment ally friendly prod-
ucts for the home has become an
increasingly important consideration for
homeowners looking to make "green" im-
provements to their living space. Consum-
ers feel the need to add environmentally
friendly, “green,” products and practices to
their homes in order to make it healthier
and more comfortable. The industry’s main
stores, The Home Depot and
Lowe’s, have added “green” prod-
ucts such as flooring, lighting, pan-
eling, materials such as paint and
varnish, appliances, heating and
cooling systems, and electronics.
As the
world adjusts to
“going green,”
the Home Im-
provement In-
dustry is adjust-
ing to provide
environmen-
tally friendly products and options for the
consumer. 20, 27
S o c i e t a l & C u l t u r a l i s s u e s
Ind
us
try
Ov
erv
iew
Ind
us
try
Ov
erv
iew
Baby Boomers Green Movement
Do-It-For Me

10
H i s t o r y
Clie
nt P
rofile
Clie
nt P
rofile
1990: Surpassed Lowe’s as top home
improvement industry seller
1978: Corporation founded by Marcus
and Banks
1980: First how-to product training seminars began
2000: Launched
online store
1986: Had 56 operating stores and reached $1 billion in sales
2005: Launched “Rebuilding Hope
and Homes” for Katrina victims
2006: Extended stores to China
Figure: 4 Source: HomeDepot.com 1984: Had 19 operating stores and
sales of $256 million
1981: Company went public on
NASDAQ
H ome Depot was founded on June 22, 1978 in Atlanta Georgia. It was started by two entre-
preneurs, pictured in Figure 5, Bernie Marcus and Ar-thur Blank. Marcus and Blank found them-selves without jobs after the change in management at the Handy Dan home center chain. Marcus and Blank decided to open their own home improvement store. From the begin-ning, the employees at Home Depot recog-nized the importance of customer service.
The em-ployees had vast knowledge of all their prod-
ucts and even offered “how to” clinics to consumers.
By 1984, the company was operating 19 stores and reported
sales of $256 million, a 118% increase from 1983. In
1986, The Home Depot’s sales reached the $1 billion mark, and the com-pany was operating 50 retail outlets. Home Depot surpassed Lowe’s in sales in 1989 to
become the largest home-repair chain in the US.17
“Bernie and I picked our-selves up, and we mapped
out Home Depot on a napkin in our favorite coffee shop.”
-Arthur Blank 18
Figure: 5
Source: referenceforbusiness.com

11
The revenues for The Home Depot are rising slowly but steadily. From 2002 to 2007, the sales have increased from $55 million a year to more than $90 million a year. As shown by Graph 5, sales beginning to level off is an indication that The Home Depot is in the mature stage of the product life cycle.19
The ad expenditures for The Home Depot have increased from $1,109 million in 2005 to $1,118 million in 2006, shown in Graph 2, page 4. Although The Home Depot has a solid consumer base, advertising is important so it doesn’t lose sales to the competitors. The increase in money spent on advertising corresponds to the increase in the revenues for The Home Depot. 6
Figure 6 indicates that television dominated the media allocation for The Home Depot in 2006. Outdoor advertising held the lowest part of the media allocation. The Home Depot shows its advertisements on
television to reach the largest number of its target audience.6
The share of voice shows where the advertising dollars are best being spent. The share of voice is the total percentage of advertising that The Home Depot possesses within the home improvement industry. Figure 8 shows that in 2005 The Home Depot held 71% of the market share, then dropped down to 57% in 2006. 6
The Home Depot reports that one key to its success is treating people well. The company executes this important principle within the com-pany by urging associates to be creative, express their ideas, take risks, acknowledging and rewarding good performances, and teaching its em-ployees in order to grow. Most importantly, the company wants custom-ers to feel as if they are number one when they enter any of The
Share of Voice
Positioning
Media Allocation
The Home Depot - 2006 Media Allocation (Percentage)
7%
21%
50%
21%
0%
1%
Magazines
Newspapers
Television
Radio
Outdoor
Internet
Sales C
lie
nt
Pro
file
Cli
en
t P
rofi
le Graph: 5 Source: Standard and Poor’s
Figure: 6 Source: Ad Age
Revenues for the Fiscal Year Ending January
020,00040,00060,00080,000
100,000
2002 2003 2004 2005 2006 2007
Year
Sales (in millions )
Advertising Expenditures

12
C
lien
t Pro
fileC
lien
t Pro
file
Home Depot stores. The Home Depot strives to provide excellent cus-tomer service by providing customers with information that will maxi-mize all of the benefits of products purchased. Its eight core values are giving back, excellent customer service, creating shareholder value, en-trepreneurial spirit, taking care of their people, respect for all people, doing the right thing, and building strong relationships.21
The Home Depot announced in April 2007 that it would offer more environmentally friendly products. There were more than 2,500 prod-ucts included in this announcement ranging from front-loading wash-ing machines to water efficient toilets, to programmable thermostats. The Home Depot’s slogan for Eco Options is “Improve your Home. And the Environment.”22
Since females will most likely remodel, The Home Depot has targeted them by making the interior of its store softer, adding more kitchen lay-outs, and an assortment of appliances.33
Much of The Home Depot’s advertising is about showing the feeling of satisfaction homeowners get from home improvement. The ad to the right shows a young woman being convinced that it is possible for her to retile her floors, despite her doubting hus-band. The Home Depot’s ads show the power of the brand and how associates can help regular people accomplish great things in their home.
There are several links available on the company’s homepage that offer addi-
tional advice and services aimed at the dif-ferent target audiences that shop at The Home Depot. It offers a link that is tar-geted at DIY consumers. This link has online workshops that the DIY consumer
can view from the privacy of their own home. There is also a link, shown to the left, providing information, maps, and pictures of the philanthropic work that The Home Depots has been doing with Habitat for Humanity in the rebuilding of homes after Hurri-cane Katrina. The Home Depot also has a com-plete website, shown above, dedicated to the NASCAR sponsorship it has with Tony Stewart’s
number 20 racing team.
Recently, for the Home Depot, there has been a Public Relations offen-sive to help protect the environment. This campaign is aimed at all con-sumers to become actively interested in environmental issues and sup-port environmental causes. The need for this Public Relations cam-paign is due to the world population expanding and the depletion of natural resources.20
Creative Strategy
New Developments
Share of Voice
Year Brand To-tal
Maga-zine
News-paper
TV Ra-dio
Out-door
Inter-net
‘06 57% 51% 54% 51%
70% 77% 27%
43% 49% 46% 49%
30% 23% 73%
‘05 71% 70% 53% 53%
67% 53% 23%
29% 30% 67% 67%
53% 67% 77%
Figure: 8 Source:Leading National Advertisers

13
Lowe’s is the primary competitor for the
Home Depot because they are the closest
competitor in terms of net sales, share of
voice, number of stores in the United States.
Lowe’s Home Improvement stores began with
Lucious S. Lowe. He opened North Wilkes-
boro Hardware Store in North Carolina in
1921. in 1946, Lowe and his sons expanded
the business and opened the first Lowe’s.
Lowe’s held the number one spot in the Home
Improvement Industry until 1978 , and they
are now second to The Home Depot. They
have over 1,500 operating stores within the
US. 1
Since 2002, Lowe’s has consistently increased
its amount of sales every year. Graph 7 shows
the exact amounts of increase from 2002 to
2006. 23
Lowe’s allocates the majority of its advertising
expenditures on the medium of television.
The second largest advertising expense is
newspapers. Internet is the only medium on
which Lowe’s spends more advertising dollars
compared to Home Depot.6
Lowe’s advertising expenditures are less than
The Home Depot. In 2006, Lowe’s increased
their advertising expense to $835.thousand,
but The Home Depot still spent $279.6 thou-
sand more. Graph 8 gives a visual representa-
tion of the numbers above.6
Lowe’s promotes a warm, family friendly im-
age and gives a feeling of connection through
their slogan, “Lets build something together.”
Lowe’s is invested in the well being of the
communities they service. Lowe’s Charitable
and Educational Foundation recently an-
nounced their donation of $500,000 to the
YMCA in Toronto.24 Their contributions fo-
cus on education, community renovation, and
the construction of safe and affordable hous-
ing. To ensure the satisfaction of customers,
Lowe’s web page provides information on in-
stallation, credit options, and protection
plans. 25
• December 10, 2007: Opened first three
stores in Canada. Three more to open by
first of February 2008.
•Earned Environmental Excellence Award
from the EPA’s SmartWay Transport Part-
nership through their attempts to lower
green house gas emissions by decreasing car-
bon dioxide emissions on the highway.26,27
Co
mp
eti
tor
Co
mp
eti
tor
An
aly
sis
An
aly
sis
Lowe's Net Sales 2002-2006
0
10
20
30
40
50
2002
2003
2004
2005
2006
Year
Amount of Net Sales
(billions)
Net Sales
% Change
Sales
Media Allocation
History
Advertising Expenditures
Advertising Expenditures
0.00200.00400.00600.00800.00
1,000.001,200.00
2005 2006
Year of Expenditure
Amount of Money
spent (thousand)
The HomeDepotLow e's
Creative Strategy
Positioning
New Developments
Graph: 7 Source: Shareholder.com
Graph: 8 Source: Ad Advantage

14
T he Home Depot and Lowe’s are the major companies that comprise the Home Improvement Industry. Fig-
ure 9 demonstrate the differences between the two companies. As depicted in the table, Home Depot has more weekly visits from customers, larger sales, more stores, stores in more countries, more employees, and is ranked higher in the FORTUNE 500 List than Lowe’s.
Co
mp
ara
tive
An
aly
sis
Co
mp
ara
tive
An
aly
sis
Figure 9 Source: The Home Depot, Lowe’s. Hoovers.com The Home Depot Lowe’s
Photo
Year Founded 1978 1946
Number of weekly visits
22+ million 14 million
Slogan You can do it. We can help.
Let’s Build Something Together
2006 Sales $90.8 billion $46.9 billion
2006 number of stores
2,074 1,385
Stores outside of US
Canada, Puerto Rico, US Virgin Islands,
Mexico, China
Canada
Number of prod-ucts available
40,000 in store 40,000 in store
Number of employ-ees
364,000 215,000
Number of stores opening in 2008
55 120
FORTUNE® 500 List
Ranked #17 Ranked #45
DIY Workshops Of-fered
Yes Yes

15
We have identified Sears and WalMart as
secondary competitors because they each
pose a threat to Home Depot’s sales by tar-
geting a similar market and having similar
services or products.
Sears, Roebuck and Co. is the leader of the
U.S home appliance market. It is also a leader
in retail sales for tools, lawn and garden
equipment, and home electronics. Sears’
stores carry top names like Kenmore, Crafts-
man, and Die Hard; brands that can not be
found at other retailers.28 Known for its ex-
tensive service and repair plans, Sears pro-
vides the country with the largest product
repair service. Sears rivals Home Depot for
sales based upon their vast appliance selec-
tion, top brand names, home service and re-
pairs. Although Sears’ product selection ex-
tends beyond home appliances, their com-
mitment to service, protection, and installa-
tion services place them in the arena of home
improvement retail and therefore make them
an indirect competitor of The Home Depot.29
WalMart grossed $348,650 million this past
year.30 WalMart is competition for The
Home Depot because they provide hardware
tools and home appliances amongst their
broad selection of products. With an empha-
sis on customer service, WalMart offers
paint, gardening supplies, and tools at a low
price. Known as one of the original “super-
centers,” consumers view WalMart as their
one stop shop for groceries, beauty supplies,
electronics, and hardware materials.31 The
convenience of finding everything in one lo-
cation is attracting busy consumers more and
more. As a result of the totality of WalMart
shopping centers, Home Improvement cen-
ters like The Home Depot might be less ap-
pealing to consumers in need of small home
repairs or tool purchases.
Simmons Market Research Bureau (SMRB) is
a syndicated research company that gathers
and displays information from many differ-
ent sources to assist companies in how to bet-
ter understand its target consumers. This
information for The Home Depot has been
categorized into different demographics,
psychographics and geographics. With these
facts, the SMRB has divided the sample into
DIY consumers versus DIFM consumers, ex-
penditures on home improvement and re-
modeling in the past versus remodeling in the
future. The samples represent those 21 and
older.
Men and women are most likely to spend
$251-$999 on home improvements. As age
increases, the money spent on home im-
provement also increases. Caucasians and
African Americans are most likely to spend
$251-$999 on home improvements. As to be
expected, as the household income increases
so does the likelihood of people spending
more money on home improvements.
Secondary Competitors
Consumer Analysis
Total Expenditures

16
Females (106) are above average and held
52% of the sample to have remodeled in the
past 12 months. More than average males
(104) held 51% of the sample in planning to
remodel in the next 12 months, furthermore
men have more influence in the purchase of
remodeling products at 55%.32 Ages 35-44
are most likely to have completed a project
in the last 12 months with 27% and 31% are
also most likely to remodel in the next 12
months. Caucasians, held 86% of the sam-
ple, are most likely to have remodeled in the
past and 85% plan to remodel in the future;
while all other races have below average
index numbers to complete any project.
People who attended college for less than 1-
3 years held 30% of the sample to have re-
modeled in the past 12 months and held
31% in planning to remodel in the future.
People with and income of $150,000-
$249,000 had the highest percentage for
planning to remodel, making them most
likely to remodel. Overall, the Midwest is
the most likely to have completed projects
in the past or to complete projects in the
future.35
Females (109), people ages 45-65 (140 and
132), college graduates, and the Northeast-
ern region (124) are most likely to be DIFM
customers. Males (103), people ages 25-44
(126 and 130), those who attended college
for less than 1-3 years, and the Midwestern
region (above 100) are most likely to be DIY
customers. Households with an income
$60,000-$99,999 are most likely to be DIY
customers. Consequently, households with
incomes above $250,000 are most likely to
be DIFM customers.36
According to the interpretation of the Sim-
mon’s Market Research Bureau, The Home
Depot should focus on white females, ages
35-54, with an income above $60, 000 from
the Midwest region. With this target mar-
ket, the Census Bureau predicts that The
Home Depot will market to a white popula-
tion of 239,746,254, a female population of
151,886,332, an age population of roughly
84,082,929 (the ages used were 25-44 in
order to estimate this population), and a
regional population of 66,388,795.
DIY vs. DIFM
Target Market
Home Remodeling: Last 12 months vs. Plan in the next 12 months

17
T o gain further information about females’ attitudes and beliefs about The Home Depot, our group designed and conducted a survey. The ultimate goal of the this survey was to discover information on the following research objectives:
• To assess the target market's attitudes/beliefs about home improvement retailers.
• To assess the target market's attitudes/beliefs about The Home Depot.
• To assess the target market’s attitudes/beliefs about Lowe’s in comparison to The Home Depot.
• To measure the target market's The Home Depot usage.
• To identify if there are age, gender, income, etc. variable differences for the above categories.
Qu
an
tita
tiv
e R
es
ea
rch
Qu
an
tita
tiv
e R
es
ea
rch
Research Objectives
W e went to different retail locations where we handed out our survey for respondents to com-plete. The sample for the survey was all adults 21
years and older who had completed a home improvement pro-ject in the last 12 months, who were currently involved in a home improvement project or planned to complete a home improvement project within the next 12 months. The sample size for the survey was 97. The data collection method is shown to the right in Figure 10. With our chosen survey method, self-administered intercept, we reduced bias by not going online or using a telephone method . Therefore, non-respondent error was reduced because self administered inter-cept is more personal and evoked better participation. Also, we clearly identified ourselves as students to reduce auspices bias. Overall, the only bias that could have resulted from our survey would have been interviewer bias because ultimately our presence could have influenced some respondents.
Name Location How survey con-ducted
# of surveys completed Methods
Sam Sears Self-administered intercept
15
Rebecca Target Self-administered intercept
15
Camille Lowe’s Self-administered intercept
15
Natalie T. WalMart Self-administered intercept
15
Mary Carlie Home Depot Self-administered intercept
15
Natalie W. Bed, Bath and Beyond
Self-administered intercept
15
Proposed Design Survey
T he method that we used was self administered intercept. Figure 11, to the right on page 17, shows which questions in our survey answered certain research objectives. Our proposed survey con-sisted of 28 variables.
Figure 10

18
Efforts to Reduce Survey Design Bias
I n order to assure the most accurate information possible, we took the following precautions in de-signing our survey.
1. We did not assume that the respondents partici-pated in home improvement projects because we asked screening questions at the beginning to verify that they were 21 or older and met the criteria to give their opin-ions on the home improvement industry. We also screened by asking if those who participated in the sur-vey had experience with The Home Depot.
2. To made sure not to combine two questions, we eliminated the word “and” in order to prevent confu-sion.
3. We kept questions short and the survey brief to maintain the respondent’s attention.
4. We used clear, understandable language.
5. Demographic and sensitive questions were kept until the end, with the exception of screening questions, to ensure greater coopera-tion throughout the survey.
6. We placed demographic questions at the end, along with fairly broad choice options to ensure more accurate responses to personal questions, such as age and income.
7. Filter questions were used to save the respondent from confusion and eliminate irrelevant questions.
8. We did not use leading questions that suggested any answer as right or wrong.
9. We provided extensive instructions on how to complete the survey to enhance accurate data collection.
10. We provided mutually exclusive/non over-lapping ranges to reduce confusion.
11. We grouped like scales to simplify the survey.
12. We provided all possible response choices by using the tried and true Likert scale with five available options and provided blanks labeled “other” when necessary .
Research Objective Survey Question Number(s)
To measure the target market’s current, past (last 12 months) or future (next 12 months) home improve-ment projects or plans.
2
To assess the target market’s attitudes/beliefs about home improvement retailers.
3, 4, 17
To assess the target market’s attitudes/beliefs about The Home Depot.
7, 8, 11
To assess the target market’s attitudes/beliefs about Lowe’s in comparison to your client.
12, 13, 14, 15, 16
To measure the target market’s The Home Depot us-age.
5, 6, 9, 10
To identify if there are age, gender, income, etc. vari-able differences for the above measures.
1, 18, 19, 20
Figure 11
Qu
an
titativ
e R
es
ea
rch
Qu
an
titativ
e R
es
ea
rch
19
Q
ua
nti
tati
ve
Re
se
arc
hQ
ua
nti
tati
ve
Re
se
arc
h
Results and Discussion
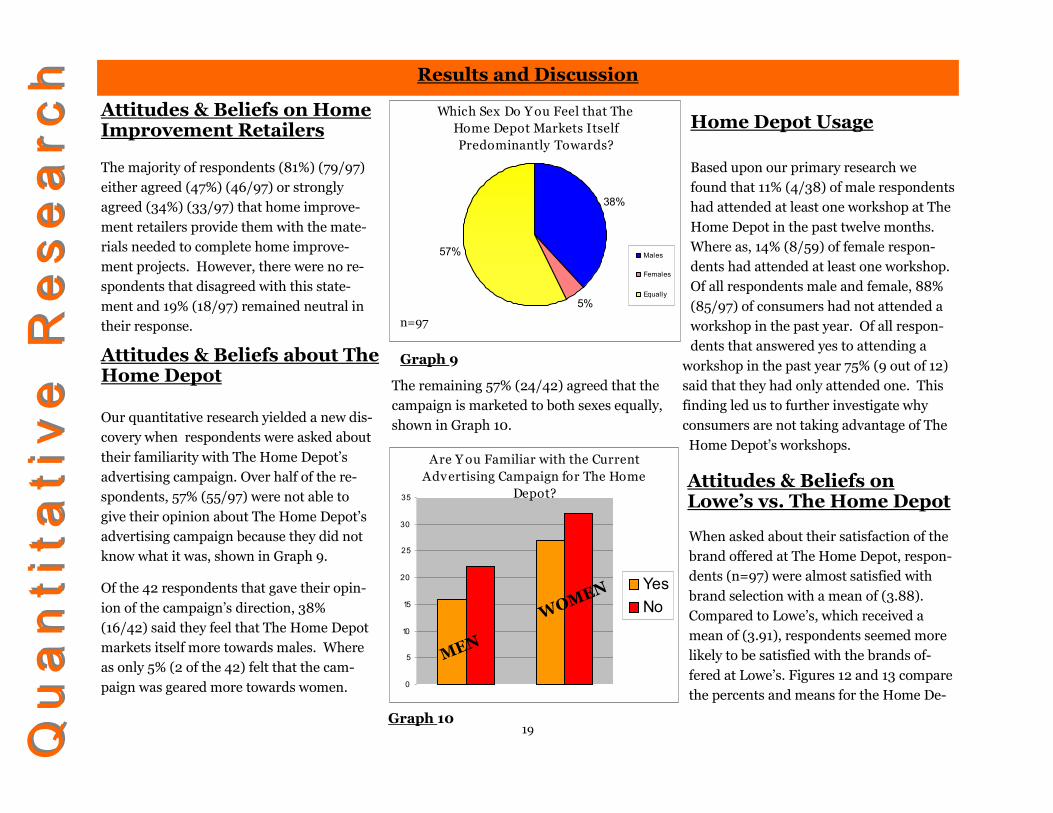
The majority of respondents (81%) (79/97) either agreed (47%) (46/97) or strongly agreed (34%) (33/97) that home improve-ment retailers provide them with the mate-rials needed to complete home improve-ment projects. However, there were no re-spondents that disagreed with this state-ment and 19% (18/97) remained neutral in their response.
Our quantitative research yielded a new dis-covery when respondents were asked about their familiarity with The Home Depot’s advertising campaign. Over half of the re-spondents, 57% (55/97) were not able to give their opinion about The Home Depot’s advertising campaign because they did not know what it was, shown in Graph 9.
Of the 42 respondents that gave their opin-ion of the campaign’s direction, 38% (16/42) said they feel that The Home Depot markets itself more towards males. Where as only 5% (2 of the 42) felt that the cam-paign was geared more towards women.
The remaining 57% (24/42) agreed that the campaign is marketed to both sexes equally, shown in Graph 10.
Based upon our primary research we found that 11% (4/38) of male respondents had attended at least one workshop at The Home Depot in the past twelve months. Where as, 14% (8/59) of female respon-dents had attended at least one workshop. Of all respondents male and female, 88% (85/97) of consumers had not attended a workshop in the past year. Of all respon-dents that answered yes to attending a
workshop in the past year 75% (9 out of 12) said that they had only attended one. This finding led us to further investigate why consumers are not taking advantage of The Home Depot’s workshops.
When asked about their satisfaction of the brand offered at The Home Depot, respon-dents (n=97) were almost satisfied with brand selection with a mean of (3.88). Compared to Lowe’s, which received a mean of (3.91), respondents seemed more likely to be satisfied with the brands of-fered at Lowe’s. Figures 12 and 13 compare the percents and means for the Home De-
Attitudes & Beliefs on Home Improvement Retailers
Attitudes & Beliefs about The Home Depot
Home Depot Usage Which Sex Do Y ou Feel that The
Home Depot Markets Itself Predominantly Towards?
38%
5%
57% Males
Females
Equally
Are Y ou Familiar with the Current Advertising Campaign for The Home
Depot?
0
5
10
15
20
25
30
35
YesNo
MEN
WOMEN
Attitudes & Beliefs on Lowe’s vs. The Home Depot
Graph 9
Graph 10
n=97

20
Qu
an
titativ
e R
es
ea
rch
Qu
an
titativ
e R
es
ea
rch
Lowe’s. In terms of cleanliness and layout, The Home Depot once again received a slightly lower mean. On average, respon-dents said they were almost satisfied with the layout (mean of 3.82) and almost satis-fied with the cleanliness of The Home De-pot (3.81). Respondents on average were much closer to being satisfied with the lay-out of Lowe’s (3.97). However, Lowe’s scored a mean of (4.02) in store cleanliness, which was considerably higher than the mean for The Home Depot. These results showed us that on average consumers are less satisfied with the overall appearance and environment of The Home Depot.
There was a significant difference in gender and respondents that had visited a Lowe’s store. Significantly more females (12%) (7/59) than males (0%), had not visited a
Lowe’s home improvement center in the past twelve months (Chi Square= 4.859,d.f.1; Sig=.028).
Attribute 1 2 3 4 5 Mean
Convenience of location
0 11.1% 29% 33% 27% 3.76
Cleanliness of store
0 0% 22% 93% 7% 4.02
Customer ser-vice
0 4% 28% 50% 18% 3.81
Products of-fered
0 1% 24% 50% 24% 3.98
Brands offered 0 2% 28% 47% 23% 3.91
Pricing of products
0 8% 31% 50% 11% 3.64
Attributes 1 2 3 4 5 Mean
Convenience of location
3% 8% 20% 45% 24% 3.78
Cleanliness of store
1% 7% 22% 50% 21% 3.81
Customer ser-vice
0 8% 29% 41% 22% 3.76
Products of-fered
0 3% 19% 52% 27% 4.02
Brands offered 0 3% 25% 54% 19% 3.88
Pricing of products
0 7% 34% 49% 10% 3.62
Percent and Means for The Home Depot Percent and Means for Lowe’s
*On a scale from 1 to 5, 1 being Very Dissatisfied to 5 being Very Satisfied
Variable Differences
Significant Differences between Men and Women
Percentages
Measure Men Women Chi-Square Value
Significance
Respondents who have visited a Lowe’s store.
100% 88% 4.859 .028
Figure 12 Figure 13

21
C
on
su
me
r In
sig
hts
Co
ns
um
er
Ins
igh
ts Purpose
Methods
Figure 13
W e used structured personal interviews to gain further insight into consumer behavior. The reason we used the personal interview was be-
cause it is a private, face to face conversation. This gave us the opportunity to tailor questions to specific respondents. We felt that this was the best suited technique for our re-search because it allowed us to probe open-ended ques-tions that explored our objectives, and allowed the respon-dent to provide the interviewer with more personal and thorough answers.
We addressed our objectives through personal interviews that each group member conduct.ed, shown in Figure 13. Each group member personally interviewed a man or woman who met the general requirements to participate in our research. We located willing participants outside of a Knoxville location of The Home Depot. We asked those subjects who agreed to participate in our research pre-pared interview questions. The interviews were conducted on April 10, 2008.
T he purpose of using qualitative research was to collect and provide insights and explanations directly from the respondents, shown in Figure 14. Using qualitative research helped the researcher understand the data from quantitative research and gain a more in depth perspective of the consumer’s attitudes, motivations and feelings in their responses. The purpose of our qualitative
research was to gain insight into the following objectives:
• To determine why consumers did not take advantage of DIY workshops at The Home Depot.
• To determine why consumers were less than satisfied with the brands offered at The Home Depot.
• To determine why many consumers do not have knowledge of The Home Depot’s advertising campaigns.
• To determine why consumers were less satisfied with the cleanliness and layout of The Home Depot when compared to Lowe’s.
Name Location How interview conducted
# of interviews completed
Sam The Home Depot Self-administered intercept
1
Rebecca The Home Depot Self-administered intercept
1
Camille The Home Depot Self-administered intercept
1
Natalie T. The Home Depot Self-administered intercept
1
Mary Carlie The Home Depot Self-administered intercept
1
Natalie W. The Home Depot Self-administered intercept
1

22
C
on
su
me
r Ins
igh
tsC
on
su
me
r Ins
igh
ts
Survey Design
Methods used to Reduce Survey Design Bias
O verall, there were general limitations in our conducted qualitative research. Small sample size prevented population generalizations and interpretations of the
data were more subjective than quantitative data. This directly correlated to the personal interview technique because the inter-views were sensitive interviewer bias, problems with data analy-sis, and overall generalization. To overcome limitations, each group member was aware of possible interview bias and ques-tions were prepared and practiced extensively, prior to the inter-views. Group members were also aware that the data is subjec-tive and may not represent The Home Depot consumers as a whole. To avoid any incorrect generalizations, additional inter-views could have been conducted if it seemed that responses were skewed in any particular interviews.
To analyze the results we met as a group and compared each member’s findings. We took those findings and applied them to our previously stated objectives. Additionally, we went back to our quantitative research and compared it to our qualitative re-search and determined how representative of the population our respondents were.
Research Objectives Survey Question Number(s)
To determine why con-sumers did not take ad-vantage of DIY workshops at The Home Depot.
5, 6, 7
To determine why con-sumers were less than sat-isfied with the brands of-fered at The Home Depot.
18, 19, 20, 25
To determine why many consumers did not have knowledge of The Home Depot’s advertising cam-paigns.
13, 14, 15, 16, 17
To determine why con-sumers were less satisfied with the cleanliness and layout of The Home Depot when compared to Lowe’s.
8, 9, 10, 11, 21, 22, 23
Figure 14

23
C
on
su
me
r In
sig
hts
Co
ns
um
er
Ins
igh
ts
F rom our quantitative research we discovered 4 main themes to fur-ther examine in our qualitative
research. The themes identi-fied were: (1) To determine why consumers do not take advantage of DIY workshops at The Home Depot. (2) To determine why consumers are less than satisfied with the brands and products offered at The Home Depot. (3) To determine why many consumers have no knowledge of The Home Depot’s advertising cam-paign. (4) To determine why consumers are less than satisfied with the cleanliness and layout of The Home Depot. Direct quotes taken from personal interviews conducted are used to further elaborate and Figure 15 shows a profile of the re-spondents.
O ur respon-dents wanted
DIY workshops to be offered at different times of the day.
Many people are too busy to attend the workshops that are held on the weekends. “Workshops seem to only be offered on
Saturdays, when I am working on projects at home.” (Male, 56) This would allow a more diverse group of people to at-tend; such as parents who have children in school, people who work on the weekends, or peo-ple who cannot attend until
after work. Most respondents agree that television is the best way to reach them and that advertisements for DIY work-shops should be created to raise aware-ness and provide information to increase attendance.
A lthough our primary research suggested that respondents pre-ferred Lowe’s brands over those
of The Home Depot, our in-depth interviews revealed that those who frequent The Home De-pot are actually quite satisfied with the brand selections offered. One
respondent voiced this opinion by saying, “Home Depot was the only place that I was able to find a certain grout cleaner. It was so wonderful that I told all my friends about it!” (Female, 50)
Also when questioned about eco-friendly products and brands, respondents said that going green did affect their purchase choices and will continue to affect them in the future as they become more environ-mentally aware.
A ll respondents agreed that cleanliness was very important to them in terms of creating a
positive shopping experience. General cleanliness was mentioned as an issue; however the overwhelming consensus from our respondents was that The Home
DIY Workshops
“Workshops seem to only be of-
fered on Saturdays, when I am
working on projects at home.”
-Male, 56
Brand Offering
“I can’t recall a Home Depot ad off the top of my head, but I remember seeing that Lowe’s one with the bear during the championship basketball game.”
-Male, 36
Cleanliness and Layout

24
C
on
su
me
r Ins
igh
tsC
on
su
me
r Ins
igh
ts
Depot had a “warehouse” feel to it that negatively influenced the perception of how clean the store was. “The warehouse atmosphere appears cluttered and rugged, I wouldn’t say it is unclean, how-ever.” (Female, 50)
This quote showed that Lowe’s has a more effective advertising campaign that cre-ates top of the mind awareness with its consumers.
M uch like the survey respon-dents from our primary re-search, questionnaire partici-
pants were not aware of The Home De-pot’s advertising campaign. Question-naire responses varied, however, a com-mon theme was that The Home Depot’s
advertisements are simply not memora-ble. A 36 year old male said, “I can’t recall a Home Depot ad off the top of my head, but I remember seeing that Lowe’s one with the bear during the championship basketball game.”
Knowledge of The Home Depot’s Advertisement
“The warehouse atmosphere appears
cluttered and rugged, I wouldn’t say it
is unclean, however”.
-Female, 50
Personal Interview Respondents
Interviewer Respondent
Sam Dintsh Male, 36
Rebecca Harris Male, 56
Camille Harvey Female, 50
Natalie Townsend Female, 32
Mary Carlie Vaughn Male, 45
Natalie White Female, 38

25
M a r k e t i n g R e c o m m e n d a t i o n sM a r k e t i n g R e c o m m e n d a t i o n s
E ven though many of the interview-ees were not familiar with The Home Depot’s advertising cam-
paign, the respondents that were familiar with the campaign stated that the advertise-ments were targeted specifically towards males. Therefore, The Home Depot needs to
develop more female friendly advertise-ments to gain a larger female consumer population. The cam-paign should show the advantages that Home Depot offers for fe-males and be shown
through female dominated media. This me-dia would include print ads in Women's Day and First, television ads on Oxygen, con-tinuing sponsoring shows on TLC and Life-time, and on the internet.
A finding within our research shows the overwhelming lack of partici-pation in the Do-It-Yourself work-
shops. Hardly any males or females had ever participated in the workshops that The Home Depot offers. Home Depot boasts the slogan of "You Can Do It, We Can Help," therefore, their DIY workshops should be in popular demand and utilized by more consumers. Therefore, an overall change needs to be made beginning with new activities that are gender specific. This could be achieved by splitting the month up and organizing female activities (for example: gardening tips, simple home re-pairs, crafting, projects and workshops for kids ) on two weekends and the other two weekends for male activities (for example: building tips, plumbing tips, lawn care and home repairs). These DIY workshops should also be better advertised through local radio, newspa-pers., and television.
A s our quantitative findings show, many of the respondents had con-cerns about the layout and cleanli-
ness of The Home Depot. The survey con-cluded that overall Lowe's had a better lay-out and was thought to be a cleaner store . Therefore, small adjustment s should be made to the store layout in order to provide
customers with a more efficient and easier way to find prod-ucts . Also, cleanliness seems like a store specific characteris-tic, every store in every location should uphold the Home Depot name and image. Therefore, each store should be held ac-countable for maintaining a respectable and clean store ap-pearance. A simple statement
to store managers readdressing the cleanli-ness and encouraging the standards of a Home Depot store should help address the cleanliness issue.
t o T h e H o m e D e p o tt o T h e H o m e D e p o t Create A New Female Focused Advertising Campaign
Create New DIY Workshop Activities
Re-vamp Store and Maintain Clean Store Environment

26
A huge problem for one of our per-sonal interviewees was that The Home Depot did not stand behind
their products. One respondent went into further detail about not being able to attain a broken part for a kitchen faucet and do to the lack of employee help and product avail-ability she had to buy a completely new fau-
cet, which cost her more than she planned on spending. Therefore, The Home Depot needs to stand behind the brands they offer, have extra parts to fix and maintain these products and develop proper customer ser-vice relations in order to make customers happy in any situation.
A ccording to our personal inter-views , not many customers are familiar with the eco-friendly
products and brands offered by The Home Depot but do share interests in “Going Green.” Since, the "Go Green" Movement is gaining momentum across the United States being a part of this movement would gain credibility among those who are switching over to a more "green" lifestyle. Also, offering these products and brands is one way to stand out from the other home improvement competitors, mainly Lowe's. Therefore, The Home Depot should address the topic of global warming and products offered to "Go Green". One way to launch this specific idea would be to have a highly publicized Earth Day Sale, putting eco-friendly products on clearance and con-tinue their Arbor day sales in order to pro-mote more planting.
Overall, The Home Depot should focus on better advertisement distribution to make the general public more aware of their cor-poration. On top of a female focused cam-paign, The Home Depot’s general campaign should reach a larger audience and the ad-vertisements should be more memorable to its audience.
Develop Better Customer Relations
Focus on More Eco-friendly Products and Advertisements
Create More Memorable Advertisements to a Larger Audience

27
A
ppen
dix
1: S
urve
yA
ppen
dix
1: S
urve
y
Hom
e Im
prov
emen
t Ind
ustry
Opi
nion
Sur
vey
This survey is being conducted by an advertising research class at the University of Ten-
nessee. Your participation will help us to better understand the attitudes and opinions of
consumers in the home improvement industry.
Please read the following questions and respond by circling the corresponding answer as
it pertains to you.
Are
you
21
or o
lder
?
Yes
N
o
Hav
e yo
u co
mpl
eted
a h
ome
impr
ovem
ent p
roje
ct in
Y
es
No
the
past
12
mon
ths,
are
you
cur
rent
ly in
volv
ed in
a h
ome
impr
ovem
ent p
roje
ct, o
r do
you
pla
n on
sta
rtin
g a
hom
e
impr
ovem
ent p
roje
ct in
the
next
12
mon
ths?
If y
ou
an
swer
ed “
No
” to
on
e o
r b
oth
of
the
abo
ve q
ues
tio
ns,
th
is c
on
clu
des
yo
ur
elig
ibil
ity
for
com
ple
tin
g th
is s
urv
ey.
Th
ank
yo
u f
or
you
r ti
me
and
par
tici
pat
ion
. If
you
an
swer
ed
“Yes
” to
bo
th o
f th
ese
qu
esti
on
s, p
leas
e m
ove
fo
rwar
d t
o q
ues
tio
n 1
an
d c
om
ple
te t
he
sur-
vey.
On
a s
cale
of
1-5
wit
h 1
bei
ng
stro
ngl
y d
isag
ree
and
5 b
ein
g st
ron
gly
agre
e,
p
leas
e n
ote
yo
ur
per
son
al o
pin
ion
s to
war
ds
the
foll
ow
ing
stat
emen
ts.
1.
Hom
e im
prov
emen
t ret
aile
rs in
gen
eral
pro
vide
nec
essa
ry m
ater
ials
to c
ompl
ete
hom
e im
prov
emen
t pro
-je
cts.
Str
ongl
y D
isag
ree
1 2
3 4
5 St
rong
ly A
gree
2.
The
dec
line
in th
e ec
onom
y ha
s af
fect
ed y
our
hom
e im
prov
emen
t pur
chas
ing
b
ehav
ior.
Stro
ngly
Dis
agre
e 1
2 3
4 5
Stro
ngly
Agr
ee
3.
Hav
e yo
u ev
er v
isit
ed a
Hom
e D
epot
sto
re?
Y
es
N
o
If y
es, c
on
tin
ue
to q
ues
tio
n 4
If
no
, sk
ip t
o q
ues
tio
n 1
2.

28
.4.
How
man
y ti
mes
in th
e pa
st tw
elve
mon
th h
ave
you
visi
ted
The
Hom
e D
epot
?
(P
leas
e ch
eck
on
e b
ox
on
ly)
0
1-3
4-6
7-10
1
1 or
mor
e
5.
Bas
ed o
n a
sati
sfac
tion
sca
le o
f 1-5
, 1 b
eing
ver
y un
sati
sfie
d an
d 5
bein
g ve
ry s
atis
fied
, how
wou
ld y
ou r
ate
Th
e H
om
e D
epo
t in
the
follo
win
g ca
tego
ries
bas
ed u
pon
your
per
sona
l exp
erie
nce?
Ver
y U
nsat
isfi
ed
V
ery
Sati
sfie
d
Con
veni
ence
of L
ocat
ion
1
2
3
4
5
Cle
anlin
ess
of S
tore
1
2
3
4
5
Cus
tom
er S
ervi
ce
1
2
3
4
5
Pro
duct
Off
erin
g
1
2
3
4
5
Bra
nd O
ffer
ing
1
2
3
4
5
Pri
cing
of P
rodu
cts
1
2
3
4
5
6.
The
layo
ut o
f a H
ome
Dep
ot s
tore
allo
ws
me
to e
asily
find
the
prod
ucts
I n
eed.
Stro
ngly
Dis
agre
e 1
2 3
4 5
Stro
ngly
Agr
ee
7.
Hav
e yo
u ev
er a
tten
ded
a w
orks
hop
at T
he H
ome
Dep
ot?
Yes
No
If y
ou
an
swer
ed “
Yes
” to
qu
esti
on
7 p
leas
e m
ove
on
to
qu
esti
on
8. I
f yo
u a
nsw
ered
“N
o”
ple
ase
skip
to
qu
esti
on
9.
8. H
ow m
any
wor
ksho
ps h
ave
you
atte
nded
at T
he H
ome
Dep
ot?
(P
leas
e ch
eck
on
e b
ox
on
ly)
0
1
2
3
4 o
r m
ore
9. O
n a
scal
e of
1 to
10
, wit
h 10
bei
ng th
e hi
ghes
t, h
ow w
ould
you
rat
e yo
ur o
vera
ll ex
peri
ence
wit
h T
he H
ome
Dep
ot?
(Ple
ase
circ
le c
orr
esp
on
din
g n
um
ber
)
1
2
3
4
5
6
7
8
9
1
0
10.
Hav
e yo
u ev
er v
isit
ed a
Low
e’s
stor
e?
Y
es
N
o
If
you
an
swer
ed “
Yes
,” c
on
tin
ue
to q
ues
tio
n 1
1. I
f “N
o,”
sk
ip t
o q
ues
tio
n 1
5.
11.
How
man
y ti
mes
in th
e pa
st tw
elve
mon
th h
ave
you
visi
ted
Low
e’s?
0 1
-3
4
-6
7
-10
11
or m
ore

29
A
ppen
dix
1: S
urve
yA
ppen
dix
1: S
urve
y
12.
Onc
e ag
ain,
bas
ed o
n a
sati
sfac
tion
sca
le o
f 1-5
wit
h 1
bein
g ve
ry u
nsat
isfi
ed a
nd 5
bei
ng v
ery
sati
sfie
d, h
ow
wou
ld y
ou r
ate
the
follo
win
g as
pect
s of
Lo
we’
s?
Ver
y U
nsat
isfi
ed
V
ery
Sati
sfie
d
Con
veni
ence
of L
ocat
ion
1
2
3
4
5
Cle
anlin
ess
of S
tore
1
2
3
4
5
Cus
tom
er S
ervi
ce
1
2
3
4
5
Pro
duct
Off
erin
g
1
2
3
4
5
Bra
nd O
ffer
ing
1
2
3
4
5
Pri
cing
of P
rodu
cts
1
2
3
4
5
13.
The
layo
ut o
f Low
e’s
allo
ws
me
to e
asily
find
the
prod
ucts
I n
eed.
St
rong
ly D
isag
ree
1 2
3 4
5 St
rong
ly A
gree
14.
On
a sc
ale
of 1
to 1
0, w
ith
10 b
eing
the
high
est,
how
wou
ld y
ou r
ate
your
ov
eral
l exp
erie
nce
wit
h Lo
we’
s?
(Ple
ase
circ
le c
orr
esp
on
din
g n
um
ber
)
1
2
3
4
5
6
7
8
9
10
15.
If y
ou w
ere
to c
hoos
e on
e of
the
follo
win
g re
taile
rs to
mee
t you
r ho
me
impr
ovem
ent n
eeds
inst
ead
of T
he
Hom
e D
epot
whi
ch w
ould
it b
e? (
If o
ther
, ple
ase
pro
vid
e th
e re
tail
er)
W
alm
art
L
owe’
s
S
ears
Oth
er_
__
__
__
__
__
16.
Are
you
fam
iliar
wit
h th
e cu
rren
t adv
erti
sing
cam
paig
n fo
r T
he H
ome
Dep
ot?
□
Yes
□N
o
If y
ou
an
swer
ed y
es t
o t
he
abo
ve q
ues
tio
n, p
leas
e co
nti
nu
e to
on
to
qu
esti
on
17.
If
you
an
-sw
ered
no
to
qu
esti
on
16
, ple
ase
skip
to
qu
esti
on
18
.
17.
Do
you
feel
that
The
Hom
e D
epot
mar
kets
itse
lf m
ore
tow
ards
:
□ M
ales
□ F
emal
es
□ B
oth
sexe
s fa
irly
the
sam
e
Ple
ase
read
all
th
e an
swer
ch
oic
e fo
r q
ues
tio
n 1
8 b
efo
re a
nsw
erin
g, t
hen
ch
eck
th
e co
rre-
spo
nd
ing
bo
x, i
f o
ther
, ple
ase
exp
lain
.

30
18.
Whi
ch o
f the
follo
win
g be
st d
escr
ibes
you
r liv
ing
situ
atio
n?
□ I o
wn
my
resi
den
cy.
□
I ren
t my
resi
den
cy.
19.
Ple
ase
circ
le y
our
gend
er.
M
ale
Fe
mal
e
20.
Ple
ase
chec
k th
e bo
x co
rres
pond
ing
to y
our
age
rang
e.
21-
34
35
-49
50
-64
65 o
r gr
eate
r
21.
Wha
t is
your
mar
ital
sta
tus?
□
Sing
le
□
Mar
ried
□D
ivor
ced
22.
Ple
ase
chec
k th
e re
gion
of t
he U
nite
d St
ates
that
bes
t rep
rese
nts
your
cu
rren
t res
iden
cy?
□ N
orth
east
□ S
outh
east
□ M
idw
est
□ S
outh
wes
t
□ W
est
□ I
do
not l
ive
in th
e U
nite
d St
ates
.
23.
Ple
ase
chec
k yo
ur a
nnua
l inc
ome
□ U
nder
$24
,999
□ $
25,0
00
-$49
,999
□ $
50,0
00
-$74
,999
□ $
75,0
00
-$99
,999
_ $
100
,00
0 o
r gr
eate
r
Tha
nk
you
for
com
plet
ing
this
sur
vey.
You
r in
form
atio
n w
ill b
e us
ed fo
r re
sear
ch p
urpo
ses
only
and
will
rem
ain
conf
iden
tial
.

31
Th
e H
om
e D
epo
t In
terv
iew
Gu
ide
Inte
rvie
wer
Nam
e _
__
__
__
__
__
__
__
__
__
__
__
__
__
__
__
__
__
__
__
__
__
__
__
__
Bac
kgro
und
Info
rmat
ion
on I
nter
view
ee:
Age
__
__
__
__
__
__
__
__
__
__
__
__
__
__
Rac
e/E
thni
city
__
__
__
__
__
__
__
__
__
__
__
__
Gen
der
__
__
__
__
__
__
__
__
__
__
__
__
_
L
ocat
ion
of I
nter
view
__
__
__
__
__
__
__
__
__
_
Th
ank
s ag
ain
fo
r ag
reei
ng
to p
arti
cip
ate
in t
his
per
son
al i
nte
rvie
w. W
e w
ill
star
t w
ith
so
me
bas
ic
qu
esti
on
s ab
ou
t yo
ur
Ho
me
Dep
ot
exp
erie
nce
.
1. W
hy d
id y
ou c
hoos
e to
vis
it T
he H
ome
Dep
ot to
day?
2. D
escr
ibe
wha
t a u
sual
trip
to T
he H
ome
Dep
ot w
ould
ent
ail.
3. A
bout
how
muc
h ti
me
wou
ld y
ou u
sual
ly s
pend
at a
Hom
e D
epot
loca
tion
?
4. H
ow m
any
tim
es h
ave
you
visi
ted
a H
ome
Dep
ot lo
cati
on w
ithi
n th
e pa
st m
onth
?
5. A
re y
ou a
war
e th
at T
he H
ome
Dep
ot o
ffer
s D
IY w
orks
hops
?
6. H
ave
you
ever
par
tici
pate
d in
a D
IY w
orks
hop
at T
he H
ome
Dep
ot?
If n
o, w
hy?
If y
es, d
id y
ou fi
nd it
hel
pful
?
Whe
ther
you
att
ende
d or
not
how
did
you
find
out
abo
ut D
IY w
orks
hops
?
7. W
hat w
ould
mot
ivat
e yo
u to
att
end
a D
IY w
orks
hop?
8.
How
eas
y is
it fo
r yo
u to
find
the
prod
ucts
you
cam
e to
look
for?
App
endi
x 2:
Qua
litat
ive
Gui
deA
ppen
dix
2: Q
ualit
ativ
e G
uide

32
9. H
ow o
ften
do
you
have
to a
sk fo
r he
lp fi
ndin
g a
prod
uct?
10.
How
fam
iliar
are
you
wit
h th
e la
yout
of T
he H
ome
Dep
ot?
11.
Wha
t do
you
like
abou
t the
layo
ut o
f The
Hom
e D
epot
?
12.
How
do
you
feel
abo
ut th
e si
ze o
f The
Hom
e D
epot
? (T
oo la
rge,
too
smal
l)
13.
Are
you
fam
iliar
wit
h T
he H
ome
Dep
ot’s
adv
erti
sing
cam
paig
n? I
f no,
why
not
?
14.
Wha
t’s th
e la
st H
ome
Dep
ot a
dver
tise
men
t you
saw
?
15.
Wha
t eff
ect d
id s
eein
g th
at a
dver
tise
men
t hav
e on
you
?
16.
Do
you
feel
like
The
Hom
e D
epot
’s a
dver
tisi
ng c
ampa
ign
is d
irec
ted
tow
ards
you
?
17.
Whi
ch m
edia
cha
nnel
wou
ld b
est r
each
you
for
The
Hom
e Im
prov
emen
t adv
erti
sem
ents
? (r
adio
, tel
evis
ion,
mag
azin
es, n
ewsp
aper
, int
erne
t)
18.
Des
crib
e yo
ur fe
elin
gs to
war
ds th
e va
riet
y of
bra
nds
offe
red
at T
he H
ome
Dep
ot.
19.
Are
the
bran
ds o
ffer
ed im
port
ant t
o yo
u?
20.
Do
you
shop
bra
nd s
peci
fica
lly?
21.
Des
crib
e yo
ur fe
elin
gs o
n th
e cl
eanl
ines
s of
The
Hom
e D
epot
.
22.
How
impo
rtan
t is
clea
nlin
ess
in a
hom
e im
prov
emen
t sto
re to
you
?
23.
Wha
t wou
ld y
ou s
ugge
st to
impr
ove
the
clea
nlin
ess
of T
he H
ome
Dep
ot?
24.
As
a m
ale/
fem
ale
is T
he H
ome
Dep
ot y
our
num
ber
one
choi
ce in
term
s of
a H
ome
Impr
ovem
ent s
tore
?
25.
How
impo
rtan
t are
eco
-fri
endl
y pr
oduc
ts/b
rand
s to
you
?
26.
How
has
the
econ
omy
affe
cted
you
r ho
me
impr
ovem
ent p
urch
asin
g be
havi
or?
27.
Wha
t do
you
like
abou
t The
Hom
e D
epot
?
28.
Wha
t do
you
disl
ike
abou
t The
Hom
e D
epot
?
29.
Wha
t im
prov
emen
ts w
ould
you
sug
gest
to T
he H
ome
Dep
ot?

33
A
ppen
dix
2: A
dver
tisem
ents
App
endi
x 2:
Adv
ertis
emen
ts
Due
to th
e lo
w a
mou
nt o
f sur
vey
resp
onde
nts
that
wer
e fa
mili
ar w
ith
The
Hom
e D
e-po
t adv
erti
sem
ents
,. T
hese
pri
nt a
dver
tise
men
ts w
ere
show
n to
per
sona
l int
ervi
ewee
s w
hen
aske
d to
dis
cuss
the
late
st H
ome
Dep
ot a
ds th
ey h
ad s
een.
1. L
aw
n/T
ract
or
Ad
vert
isem
ent
2.
Sn
ow
Th
row
er A
dve
rtis
emen
t
The
se tw
o ad
vert
isem
ents
sho
w H
ome
Dep
ot p
rodu
cts,
but
als
o ha
ve o
nly
mal
es a
s th
e su
bjec
t usi
ng th
ese
prod
ucts
.

34
3.
Ca
bin
et A
dve
rtis
emen
t

35
1. “Our Heritage.” Lowe’s. 24 February 2008. http://lowes.mediaroom.com.
2. “History of Home Improvement.” Lowe’s 24 February 2008. www.lowes.com.
3. “Our History.” The Home Depot. 24 February 2008. http://corporate.homedepot.com.
4. Jensen, Chris and Dan Tratensek. “Retail D-I-Y Market Profile: 2007 Annual Report.” December 2007 . www.nrha.org.
5. “Key Competitors: Major Players.” IBIS World. 19 Nov 2007., www.ibisworld.com.
6. “Leading National Advertisers: Marketer Profiles Yearbook.” Advertising Age Datacenter. pgs. 10, 46-47, and 61-62.
7. “Quarterly Income Statements.” The Home Depot and Lowes. Hoovers. www.hoovers.com.
8. Souers, Michael. “Sub-Industry Review: Home Improvement Retail.” Standard & Poor’s. 13 February 2008.. www.netadvatage.standardandpoors.com.
9. Blank, Arthur. Quote. http://thinkexist.com.
10. “Summary Macro-Economic Indicators.” http://myinsight.globalinsight.com.
11. “Retail Home Improvement.” Henry Fund Research. The University of Iowa: Henry B. Tippie School of Management. pg. 1-4.
12. “Consumer Confidence.” pg. 21 Marshall Place Associates. www.marshallplace.com.
13. Wyss, David. “Trends and Projections.” Standards & Poor’s. www.netadvantage.standardandpoors.com.
14. “US Home Centers Industry Market Research Report.” “Legal and Regulations.” IBIS World. www.isbisworld.com.
15. “Consumer Education Campaign to Combat Home Improvement Fraud.” Federal Trade Commission. 23 October 1 998. www.ftc.gov.
16. “Market Characteristics.” IBIS World. 19 Nov 2007. www.ibisworld.com.
17. “The Home Depot Corporate Timeline.” The Home Depot. 3 Jan 2007. http://corporate.homedepot.com.
18. Blank, Arthur. Quote. http://lemonadestories.com.
19. “Home Depot Revenues.” Standard & Poor’s. 25 February 2008. www.netadvantage.standardandpoors.com.
20. “Creativity Strategy.” www.homedepot.com
References

36
21. “Orange-Blooded: The Home Depot’s Core Values.” The Home Depot. http://corporate.homedepot.com.
22. Dugas, Christine and Jayne O’Donnell. “More Retailers Go For Green – The Eco Kind.” USA Today. 18 April 2007. www.usatoday.com.
23. “Lowe’s Annual Reports.” Lowe’s. 2002-2006. www.shareholder.com.
24. “Lowe’s Expands Internationally, Open First Canadian Stores.” Lowe’s. www.lowes.mediaroom.com.
25. “Commitment to Community.” Lowe’s. www.lowes.com.
26. “Lowe’s to Build Flatbed Distribution Center.” Lowe’s. www.lowes.mediaroom.com.
27. “Lowe’s Earns Smartway Environmental Excellence Award.” Lowe’s. www.lowes.mediaroom.com.
28. “Sears Holding Corporation.” Sears. www.searsholdings.com.
29. “Repairs?” Sears. www.sears.com.
30. “Key Wal-mart Financials.” Wal-mart Company Overview. Hoovers. www.hoovers.com.
31. “The Wal-mart Weekly: Competing with The Home Depot and Lowe’s.” 4 May 2007. Blogging Stocks. www.bloggingstocks.com.
32. “Gender Confusion.” Chain Store Age, 79. 31 July 2003. http://serach.rdsinc.com.
33. Jones, Sandra. “Home Depot Aims to Woo Women.” Crain’s Chicago Business. Regional Business News Database.
34. “Total Expenditures: NCS Fall 2003 Adults Full Year (Jan03-Sept03)” Choices 3 Crosstabulation Report. SMRB 2004.
35. “Interior and Exterior Remolding: NCS Fall 2003 Adults Full Year (Jan03-Sept03)”. Choices 3 Crosstabulation Re- port. SMRB 2004.
36. “Do-It-Yourself vs. Do-It-For-Me: NCS Fall 2003 Adults Full Year (Jan03-Sept03).” Choices 3 Crosstabulation Re port. SMRB 2004.