home away from home : a survey of oldage homes and inmates
55
1 August 2000 HOME AWAY FROM HOME : A SURVEY OF OLDAGE HOMES AND INMATES IN KERALA S. Irudaya Rajan Working Paper No. 306
-
Upload
nguyenhanh -
Category
Documents
-
view
214 -
download
0
Transcript of home away from home : a survey of oldage homes and inmates

1
August 2000
HOME AWAY FROM HOME :A SURVEY OF OLDAGE HOMES
AND INMATES IN KERALA
S. Irudaya Rajan
Working Paper No. 306

2

3
HOME AWAY FROM HOME: A SURVEY OF OLDAGE
HOMES AND INMATES IN KERALA
S. Irudaya Rajan
Centre for Development Studies
Thiruvananthapuram
August 2000

4
ABSTRACT
Population ageing is the ultimate consequence of demographic
transition. As Kerala is ahead of the rest of the country in fertility
transition by 25 years, the ageing scenario of Kerala is of particular
interest. This paper has the following objectives: (a) To assess the ageing
senario in Kerala by districts; (b) To examine the socio-economic
conditions of elderly, especially pensioners, beggars and those elderly
living in institutions; (c) To map out the old age home scenario throughout
the country; (d) To assess the profile of existing oldage homes in Kerala
and (e) To assess the profile of inmates in all oldage homes in Kerala.
JEL Classification: J13, J14, J18, H55.
Key Words: Kerala, elderly, beggars, Kerala, pensioners, migration,
oldage homes

5
Introduction
Population ageing is the ultimate consequence of demographic
transition. The final stage of demographic transition stands for fewer
births and deaths. As Kerala is ahead of the rest of the country in fertility
transition by 25 years, the ageing scenario of Kerala is of particular
interest. For instance, on an average, a Kerala woman ends up producing
only 2 children throughout her reproductive span. A child born today in
Kerala is expected to have a life span of 70 years. According to the
findings of the Kerala Migration Study, Kerala’s population is 31.4
millions with an annual growth rate of 1.1 per cent (Zachariah, Mathew
and Irudaya Rajan, 1999; 2000)
The aged Aging is generally defined as consisting of population
above 60 years of age. Some demographers also distinguish categories
of the old: young old (60-69 years), old old (70-79 years), oldest old
(80-89 years) and the extreme old (90+ years).
Data Sources and Objectives
For background information, this paper has depended on the 1991
census and 1998 Kerala Migration Survey data. The assessment of old

6
age homes in Kerala has been attempted on the basis of the survey
conducted by the Madras Institute on Ageing and Helpage India
(Krishnan Nair, 1995; Helpage India, 1998). Extensive use has also been
made of the findings of Kerala Oldage Home Survey (KOLDS) and
Kerala Oldage Home Inmates Survey (KOLDINS) conducted by the
present author.
This paper has the following objectives:
(a) To assess the ageing scenario in Kerala by districts
(b) To examine the socio-economic conditions of elderly,
especially pensioners, beggars and those elderly living in
institutions.
(c) To map out the oldage home scenario throughout the country
(d) To assess the profile of existing oldage homes in Kerala and
(e) To assess the profile of inmates in all oldage homes in Kerala.
Emerging Ageing Scenario In Kerala
According to the 1991 census, there were 56.88 million elderly
(60+) in India representing 6.8 per cent of the country’s population. The
old old (70+) accounted for 21.07 million and the oldest old (80+)
numbered around 6.37 million. Among elderly women, 54 per cent of
young old, 67 per cent of the old old and 70 per cent of the oldest old are
widows (Irudaya Rajan, Mishra and Sarma, 1999; 2000). The statistics
are quite different in Kerala compared to India (Irudaya Rajan and
Zachariah, 1998; Irudaya Rajan and Mishra, 1997; Irudaya Rajan,
1999).
According to the 1961 census, the number of elderly aged 60 and
above was just 1 million which increased to 2.6 millions in 1991 (a

7
160% increase). According to our projections, the number of elderly in
Kerala is expected to reach 7.2 millions by 2021 (a 180% increase) and
11.9 millions in 2051 (a 65% increase). The change in proportion of the
elderly in Kerala is even more spectacular. Their proportion was around
9 per cent in 1991 but it is expected to increase to 20 per cent in 2021
and 37 per cent in 2051. The decennial growth rate among elderly during
1981-91 was 3 per cent and is likely to continue at the same level for the
next few decades (more details, see Table 1).
The old old population (70+) was just 1 million in 1991. The results
of our projections indicate that the number of old old will reach 3.2
million by 2021 (a 222% increase) and 7.4 million by 2051 (a 130%
increase). Their proportion, which was just 2 per cent in 1961, doubled
in 1991 and will again double in 2021, reaching 23 per cent in 2051.
Between 1961-91, the decadal growth rate among the oldest old hovered
around 3 per cent, and is expected to register a growth rate of around 4
per cent in the next four decades (Table 1).
The oldest old (80+) in Kerala was just 290,000 in 1991 and are
expected to increase to 1 million in 2021 (a 258 % increase) and further
to 3.3 million by 2051 (a 213% increase). The proportion of the oldest
old in Kerala accounted for just 1 per cent in 1991, which is expected to
increase to 3 per cent in 2021 and further to 10 per cent in 2051. One of
the most interesting characteristics of the oldest old is their growth rate.
The growth rate among the oldest old is higher than that of the young
old and the old old is expected to remain so during the next half of the
21st century. In fact, among all the conventional age groups (0-4, 5-9 ..
80+), the highest growth rate is registered among the old, especially the
old old (Table 1).

8
District Level Situation
Among all the districts in Kerala, according to 1991 census, the
highest number of elderly was enumerated in Thrissur district, followed
by Ernakulam. The lowest was found in Wayanad. In all, eight districts
in Kerala have enumerated over 200,000 elderly population. On the other
hand, if we are looking at the proportion of the elderly, the highest
proportion is reported for Pathanamthitta district (60 plus, 70 plus and
80 plus), followed by Alappuzha and Kottayam districts. According to
the 1991 census, only four districts in Kerala have reported one-tenth of
their population as old. However, according to the Kerala Migration Study
(1998), the Pathanamthitta district is still leading with 16 per cent (See
Table 2).
There were more female elderly in Kerala compared to male elderly
in all districts except Idukki in 1991. The proportion of male elderly was
8.4 and it was 9.4 for females. In 1998, both males and females have
crossed the 10 per cent mark. In 1991, 3 districts have reported the
proportion as above 10 for males and the number of districts belonging
to this category have gone to 9 in 1998. The same number for females
was 5 districts in 1991 and moved to 10 districts in 1998 respectively
(Table 3).
Non-Workers Among the Aged
Indian census provides data on non-workers by categories such as
household duties, students, beggars, dependants, pensioners, rentiers,
and elderly living in institutions. In this paper, we shall discuss three
categories of non workers in Kerala by districts: elderly living in
institutions, beggars and pensioners. Work participation rates among
elderly by sex and sectors were discussed in an earlier work by the author.
(Irudaya Rajan, 1999).

9
Elderly in Institutions (not only in old age homes but also in
charitable institutions throughout the country and those who live in jails)
are included within the scope of this paper.
Elderly beggars included because these beggars when they
become very old or sick, are picked up from the streets by charitable,
religious and other non-governmental organisations. The present elderly
beggars are the potential future candidates for membership of oldage
home.
Pensioners among elderly receive regular means in the form of
pensions for service rendered in the past. Oldage homes which have
emerged in the early 1990s in Kerala are reportedly looking for inmates
with regular incomes, including pensioners. Some pensioners, especially
those who lose their life partners, and thus become single-member
households (children being away due to migration), would like to move
to oldage homes.
According to the 1991 census, 8700 males and 7450 females were
enumerated as inmates in institutions in Kerala. Among them, 1590
males and 1690 females were above 60 years. In other words, of the
persons enumerated as living in institutions, 18 percent of males and 23
percent of females were above 60 years of age. There were more female
elderly living in institutions compared to males. The district wise situation
of course is different. In Kottayam, 70 percent of males in the institutions
were elderly, followed by Pathanamthitta. In the case of females,
Alappuzha accounts for the highest proportion of female elderly living
in institutions, followed by Kottayam and Kollam. Among the elderly in
Kerala, 12 males and 13 females per 10000 elderly live in institutions.
Kottayam has reported the highest number for both males and females
(Table 4).

10
There were more male beggars compared to females (4580 and
3260 respectively) in Kerala as of 1991. However, beggars among elderly
males and females numbered 1680 and 1190 respectively. Why there are
more male elderly beggars than female elderly? Probably, older females
can do some type of household work and may also work as domestic
servants in oldage. The highest number of male and female beggars was
found in Thrissur district. The percentage of male and female elderly
beggars to total beggars in Kerala was 37. However, the percentage varies
between district to district. The highest proportion of male elderly beggars
was found in Wayanad (56) whereas the highest proportion of female
elderly beggars was found in Ernakulam. The number of beggars per
10000 elderly population in Kerala worked out to be 14 for males and 9
for females. Wayanad district leads the rest in this respect with 48 for
males and 24 for females respectively (Table 5).
Another interesting information available from census reports is
regarding pensioners of all ages. These pensioners are not the ones who
receive social assistance in old age. According to the 1991 census, Kerala
had 230,660 male pensioners and 77,660 female pensioners. Among
them, 150,910 male pensioners and 51,190 female pensioners were aged
60 and above (Table 6). As the retirement age in Kerala is still 55 years,
the number of pensioners in Kerala at present will be over 3 lakhs. The
highest number of male elderly pensioners was found in
Thiruvanathapuram (20180), followed by Ernakulam (19510) and
Thrissur (15130). On the other hand, the highest number of female
pensioners was enumerated in Thrissur (6050), followed by Kozhikode
(5460) and Alappuzha (5290). The lowest number of male pensioners
was observed in Wayanad (880) whereas the lowest female pensioners
was found in Idukki (110). The number of pensioners per 10000 elderly
population of Kerala consisted of 1259 persons for males and 365 persons
for females. The highest number (1594) was found in Ernakulam for

11
male elderly and the highest number (464) was observed in Kozhikode
for females.
Oldage Homes in India: A State-Wise Profile
Development of institutional care for the handicapped, infirm and
aged persons in India has a long history. The first oldage home in India
is supposed to have been started in the early 18th century but information
is available only from 1782. Today such services are provided mainly
by non-governmental agencies, particularly the religious charitable
organisations. The Central and State governments still play only a very
negligible role in providing care to the deprived sections of society.
According to the survey conducted by the Madras Institute of
Ageing, there were 529 oldage homes in India in 1995 (Krishnan Nair,
1995). Helpage India has reported that there were 700 oldage homes in
1998 (Helpage India, 1998). Our discussion is based on data released by
the Madras Institute on Ageing.
India had only 96 oldage homes before 1950, another 94 were
added in the next two decades (1951-70). During the next two decades,
there was a rapid expansion in the number of old age homes in the country
(Table 7). As of 1995, Kerala State led the rest of the country with 102
oldage homes, followed by Tamil Nadu (94) and Maharashtra (65). One
out of every 5 oldage homes in India is located in Kerala. South India
(Kerala, Tamil Nadu, Karnataka and Andhra Pradesh) accounts for 275
oldage homes forming 52 per cent of the total. Why are the oldage homes
flourishing in South India? It requires another study.
As pointed out earlier, oldage homes are run by various agencies -
secular organisations, religious groups (Hindu, Muslim, Christian),
government and others. Taking the country as a whole, secular
organisations run 224 oldage homes (42%), followed by Christian

12
agencies with 216 (40%) oldage homes. Of the 216 oldage homes
maintained by Christian agencies, 82 are located in Kerala, 42 in Tamil
Nadu and 21 in Goa. Though Hindu organisations credited with 21 oldage
homes, they manage none in Kerala. The Government - Central and State
- is responsible for only 10 oldage homes in the entire country. Muslim
agencies maintain only one oldage home in India and it is located in
Kozhikode district of Kerala. However, the Kerala scenario is different
compared to other states. Of the 102 oldage homes in Kerala, 82 are
managed by Christian agencies (80%), and the rest by non-religious
organisations (Table 8).
In keeping with the cultural and religious traditions prevailing in
India, there are separate oldage homes for males and females while some
oldage homes are meant for the poor aged and destitutes. Others
concentrate on the sick and handicapped. There are 16 oldage homes
catering exclusively to males, 4 are meant for aged, 13 for poor aged
and destitutes and 3 for sick and handicapped. Oldage home run for
females number 87 - 34 for aged, 42 for poor aged and destitutes and 11
for sick and handicapped. The institutions which admit both male and
female elderly are large in number. Among the 306 homes in this category,
141 are run exclusively for aged, 136 for the poor aged and the destitutes
and 29 for the sick and the handicapped. Kerala has 18 oldage homes
catering to the needs of poor aged and destitute females and 28 oldage
homes established for both sexes of the same category (Table 9).
As discussed earlier, around 83 per cent of oldhomes in the country
are managed by secular (non-religious) and Christian organisations. How
many of them accommodate the elderly free of cost? How many old age
homes operate on a payment basis? How many homes combine business
and charity? Interestingly, three-fourths of the oldage homes run by
Christian organisations offer free accommodation as against one-half in

13
the case of secular organisation (Table 10). The number of oldage homes
run on payment basis is much higher among secular organisations (45)
than Christian institutions (27). Almost an equal number of both
institutions (around 30) accommodate elderly on free as well as payment
basis. Out of 376 oldage homes for which the relevant information is
available, 62% provide free accommodation.
The Madras Institute of Ageing survey also reported the number
of inmates of 398 oldage homes in India. Accordingly in 1995, 21,214
elderly lived in oldage homes. 1120 males lived in homes exclusively
meant for males, 2759 females meant for females only and the remaining
were taken care of in oldage homes where both males and female were
admitted. Of the 21,214 elderly persons, Kerala oldage homes accounted
for 22% and South India accounted for 59% (Table 11). With the above
background in mind, let us assess the Kerala Oldage Home Survey and
Kerala Oldage Home Inmates Survey, 1999.
Kerala Oldage Home Survey, 1999
Two surveys were conducted simultaneously throughout Kerala
to study the profile of oldage homes as well as their inmates. The survey
was obviously necessitated by the paucity of reliable data on oldage
homes in Kerala. The State Planning Board, for instance, in its latest
annual economic review devotes only one small paragraph to institutional
care of the aged although the report runs into several hundred pages.
According to the Economic Review (1998), ‘In Kerala at present
institutional care is provided to about 54418 persons, of which 44728
are orphan children’ (Economic Review, 1998, Page 165) In an appendix
table, the details of the institutional care listed for elderly are as
follows:

14
Name of Scheme Nature of Care Year of No of persons
Starting benefited
Care Home Welfare and 1957 100
Thiruvanathapuram Rehabilitation of the
old age and ex-convicts
Oldage Homes
Kollam For providing physical 1995-96 100
Kottayam social, psychological
Kannur and economic support
Kasaragod for the aged
Pathanamthitta
Ernakulam
Thrissur
Malappuram
Kozhikode
The economic review says that there are institutions run by
voluntary organisations for the welfare of aged but provide no details
about the functioning of such organisations.
In this context, it is felt to undertake a profile of old age homes as
well as inmates of all oldage homes in Kerala. According to the Kerala
Oldage Home Survey (hereafter referred as KOLDS) conducted by the
author in 1999, the number of old age homes in Kerala is 134 (Names of
all oldage homes arranged by districts are available in appendix 1),
including nine oldage homes established by the state government during
1995-96 (State Planning Board, Economic Review 1998). The Madras
Institute of Ageing (1995) has reported 109 oldage homes in Kerala while
Helpage India (1998) reports 123 oldage homes in Kerala; the highest
number of such homes (31) is found in Kottayam district, followed by

15
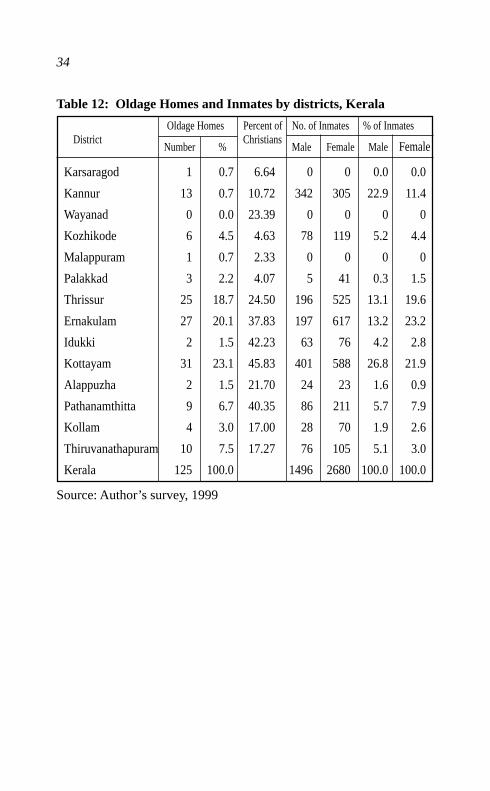
Ernakulam (27) and Thrissur (25). (For details of oldage homes in other
districts, see Table 12). Kottayam, Ernakulam and Thrissur districts
together account for 62 per cent of oldage homes in Kerala; Wayanad is
the only district in Kerala having no oldage home. A profile of oldage
homes in Kerala is presented in Table 13. As most of the oldage homes
are run by Christian organisations in Kottayam, we looked at the religious
composition of population in Kottayam. Among the fourteen districts of
Kerala, Kottayam has the highest concentration of Christian population
(46%).
As per KOLDS, there were in Kerala only 19 oldage homes in
1950; 17 homes were added between 1950-69 and 60 homes between
1970-89. During the last 8 years, 38 oldage homes were established in
Kerala which included 9 oldage homes started by the government (Table
14). Currently, at least 5 new oldage homes are coming up every year
and it is likely to increase to 10 in the years to come. Among the 125
oldage homes, 13 homes are run only for males and another 48 for females
only. Almost 55 percent of oldage homes accommodates both elderly
men and women; 36 per cent admits only females. Almost half the oldage
homes in Thrissur caters to the needs of elderly women only, followed
by Ernakulam and Kottayam (Table 15).
About 73 per cent of oldage homes are run by Christian
organisations, followed by 13 per cent by other non-governmental
organisations. Government runs only 13 oldage homes (Remember, 9
oldage homes were initiated in only 1995-1996). In Kottayam which
has the second highest number of oldage homes in the country, second
only to Greater Mumbai district of Maharashthra, 27 out of a total of 31
homes oldage homes (87%) are managed by Christian organisations.
The corresponding percentages are 63 and 72 for Ernakulam and Thrissur
districts respectively (Table 16).

16
The running of an oldage home requires a certain manpower to
look after the elderly. According to KOLDS, 871 persons were employed
by 125 oldage homes (9 oldage homes run by the government refused to
provide any information on their working without an explicit permission
from the state government). Thus, on an average, each oldage homes
provides employment to 7 persons; 30% of them work in the kitchen,
24% is primarily in providing nursing care and another 30% per cent in
supervision (Table 17). While work in the kitchen and supervision require
only limited formal education, geriatric nursing care needs special
training. Kerala should concentrate on special geriatric training to take
care of the elderly; incidentally it generates additional employment
opportunities for women. Special care for each age-group of the elderly
has to be carefully planned (eg. oldest old, extreme old, centenerians,
physically handicapped in old age, bedridden elderly, mentally retarded,
depressed elderly and dementia patients). Who are the normal caregivers
for elderly at usual residence rather than old age homes? In most cases,
it is the women (wife or daughter-in-law as parents normally reside
with their sons) who suffers most. As the elderly men (80+) are likely to
have wives who belong to age group 70+, they cannot expect their wives
to provide much help. And since young working women are on the
increase, they cannot be expected to extend nursing care of the aged in
their home and hence, it is time, Kerala exploited this opportunity to
generate more employment among women. As the growth of oldage
homes and elderly are on the increase, we could naturally expect some
gains in the employment front. During the course of my visit to oldage
homes, I have found that many elderly help each other in kitchen and
other activities of the oldage homes.
As per KOLDS, altogether 4176 elderly persons live in oldage
homes totalling 125. Among them, 36 per cent (1496) are males and 64
per cent (2680) females (Table 18). If we add the nine old homes started

17
by the government, the total number of inmates would increase to 5076
(as each of them accommodates about 100 persons). As Kottayam has
the highest number of oldage homes, followed by Ernakulam and
Thrissur, more elderly persons are taken care of in these districts. Among
males, 27% of elderly males are reported in Kottayam district (401)
followed by Kannur district (342). Among females, Ernakulam leads
with first rank (23%), followed by Kottayam.
The survey listed facilities available in the oldage homes with a
view to formulate measures to further improve their living conditions of
the elderly. The following five questions were addressed to the
management of the oldage homes :
1. Do you have a vehicle? 2. Do you have a telephone?
3. Do you have a library? 4. Do you offer facilities for recreation?
5. Do you have a medical doctor at your disposal for emergency?
The replies to the questionnaire showed that 72% of oldage homes
had telephones, 65 % had a library, 82% provided recreation facilities
and 84% had a doctor to attend to the medical care of the inmates; only
18% of the old age homes owned a vehicle. Interestingly, while Kottayam,
Alappuzha and Pathanamthitta districts reported 100% medical facility,
no oldage homes in Pathanamthitta had a vehicle. Three-fourths of the
oldage homes in Pathanamthitta, Ernakulam, Kottayam and Kozhikode
districts, had telephone connection in oldage homes. Recreation is cent
per cent in Pathanamthitta and Alappuzha (Table 19).
Kerala Oldage Home Inmates Survey (KOLDIN)
Although the inmates of the 125 reporting old age homes numbered
4176, it has been possible to interview only 3362 elderly. 814 elderly
could not be interviewed for reasons such as mental retardation and other
18
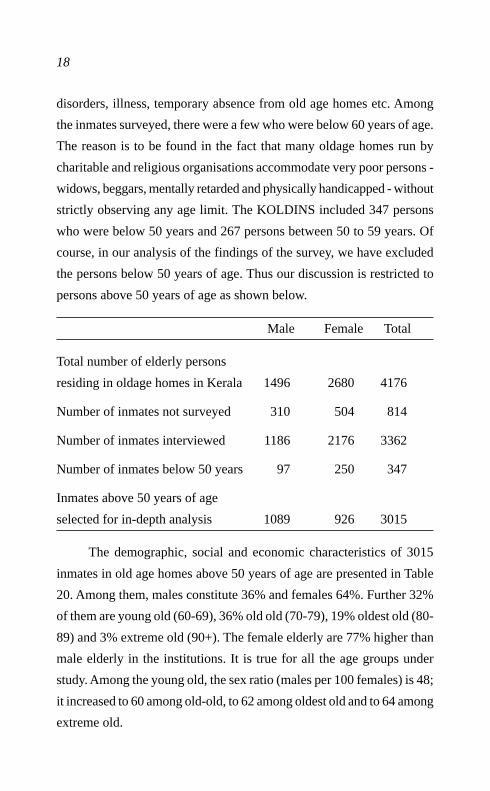
disorders, illness, temporary absence from old age homes etc. Among
the inmates surveyed, there were a few who were below 60 years of age.
The reason is to be found in the fact that many oldage homes run by
charitable and religious organisations accommodate very poor persons -
widows, beggars, mentally retarded and physically handicapped - without
strictly observing any age limit. The KOLDINS included 347 persons
who were below 50 years and 267 persons between 50 to 59 years. Of
course, in our analysis of the findings of the survey, we have excluded
the persons below 50 years of age. Thus our discussion is restricted to
persons above 50 years of age as shown below.
Male Female Total
Total number of elderly persons
residing in oldage homes in Kerala 1496 2680 4176
Number of inmates not surveyed 310 504 814
Number of inmates interviewed 1186 2176 3362
Number of inmates below 50 years 97 250 347
Inmates above 50 years of age
selected for in-depth analysis 1089 926 3015
The demographic, social and economic characteristics of 3015
inmates in old age homes above 50 years of age are presented in Table
20. Among them, males constitute 36% and females 64%. Further 32%
of them are young old (60-69), 36% old old (70-79), 19% oldest old (80-
89) and 3% extreme old (90+). The female elderly are 77% higher than
male elderly in the institutions. It is true for all the age groups under
study. Among the young old, the sex ratio (males per 100 females) is 48;
it increased to 60 among old-old, to 62 among oldest old and to 64 among
extreme old.

19
In the married and divorced category, number of males are high
whereas never married and widowed category, there are more females.
Almost 44% of the elderly are not married and another 8% belong to
divorced and separated categories. 38% of elderly are widows or
widowers. Among males, 41% belong to the never married group
followed by widowers (26%). In the case of females, 46% are ‘never
married’ and another 44% are widows.
Socio-economic characteristics: According to KOLDINS, 72% of
elderly in institutions are Christians, followed by Hindus with 26%.
Though the inmates of most institutions were willing to reveal their
religious identity, some (333 out of 3015) preferred not to do so in the
case of ‘caste’. Among the elderly (2682), 13% of the elderly are Nairs,
followed by Ezhavas with 7% and Scheduled Castes and Tribes with
2%.
Among the institutionalised elderly, 6% owned houses (7% for
males and 6% for females) and 4% also owned land in addition to houses
(5% for males and 3% for females). Thus it is not always the poor and
destitute only who stay in oldage homes. One would expect the number
of such elderly to increase as more private oldage homes catering to the
needs of the middle or upper class come to be organised.
Financial Support: In many of the oldage homes, inmates are not
charged for their maintenance; about 90% of the inmates reported that
they did not pay for their lodging and boarding. Interestingly, 7% of
them met their costs of maintenance out of their past savings (pensions
etc), 2% were supported by their own children and another 2% by
relatives. As stated earlier, Kerala has 150,910 male pensioners and
51,190 female pensioners aged 60 and above. Some of them during their
extreme oldage might move into oldage homes thus causing an increase
in the demand for old age homes. It was noted that in some of the free

20
oldage homes run by government or religious and charitable
organisations, there existed waiting lists. One of the oldage home in
Kerala in which I visited, has a provision for 20 widows. But the actual
number of inmates are 25 and they have at least 10 members in the
waiting list. They can take any new entrants only if one of the inmates
die.
To the question, ‘do you like the environment at oldage home’,
while 82% of the inmates reported that it was alright, 16% answered
that they liked the environment very much. Only 1% reported that the
environment in oldage home was ‘bad’.
Reasons for joining oldage homes: What are the reasons for joining
an oldage home. Our survey results are as follows:
No one to take care at home: 67%
Children are away: 1%
Problems with children: 8%
Own preference: 19%
Other reasons: 5%
Most of the inmates in oldage ended up there because of no one to
take care at home. When you talk to those inmates who stated as own
preference in detail, they also indirectly indicate children are away and
no one to care at home as main reasons. Migration of children also play
an important role in pushing their old parents to oldage homes.
Children are supposed to be caregivers to their parents in oldage.
The rationale of high fertility or the widespread preference for at least
one male child arises basically out of security in oldage. 63% of the
inmates of oldage homes have no children (as stated earlier, some of
them are not married). Some of the women have lost their husbands and

21
living children (Table 21). However, 37% of inmates have living adult
children. Of the 1125 elderly who had living children, 23% had one
living child, another 23% had two children, 20% had 3 children and
34% had four and more children. The situation is quite different for males
and females. Among males, 28% had one child and it is only 17% for
females. The proportion is higher for males and with 4 and above children.
The percentages for male and female elderly are 37 and 31 respectively.
More results on this aspect are worth reporting. The percentage of
elderly who had one living son residing in oldage home is 48% and the
corresponding percent for one living daughter is 41. The results clearly
indicate that even those who have children (male or female), are left
alone to fend for themselves; eventually at least some of them move into
oldage homes.
Inmates of oldage homes were also asked to furnish information
regarding place of residence of their children (Table 22). The place of
residence was classified as follows: residing within the same district,
residing in other districts but within Kerala, residing in other states of
India, and residing abroad. In respect of the elderly who had at least one
child, 46% resided within the district, 40% in another district within
Kerala, 10% outside Kerala but within India and another 5% in abroad.
Almost 55% of children have migrated from the district. Of the 1125
elderly who had children, the total number of living children reported
by them is 3195. On an average, the elderly had 2.8 living children to
support them in their oldage. Among the 3195 children, 45% live in the
same district, 42% in the other districts of Kerala, 9% within India and
4% in abroad.

22
References
Zachariah, K. C, E. T Mathew and S. Irudaya Rajan (1999) Migration
in Kerala State, India: Dimensions, Determinants and
Consequences. Working Paper I, September, Centre for
Development Studies, Thiruvanathapuram.
Zachariah, K. C, E. T Mathew and S. Irudaya Rajan (2000) Migration in
Kerala State, India: Dimensions, Determinants and
Consequences. Working Paper II, May, Centre for DevelopmentStudies, Thiruvanathapuram.
Krishnan Nair (eds) (1995) Care of the Elderly: Directory of
Organisations Caring for the Elderly in India. Centre for the
Welfare of the Aged, Madras Institute on Ageing.
Helpage Age India (1998) Directory of Oldage Homes in India. Research
and Development Division, Helpage India. New Delhi.
Irudaya Rajan, S, U. S Mishra and P. S Sarma (1999) India’s Elderly:
Burden or Challenge? Sage Publications, New Delhi.
Irudaya Rajan, S, U. S Mishra and P. S Sarma (2000) "Ageing in India:
Retrospect and Prospect." Indian Journal of Social Science,
Volume 2, No.1.
Irudaya Rajan, S and K. C. Zachariah (1998) "Long Term Implicationsof Low Fertility in Kerala, India." Asia Pacific Population
Journal, Volume 13, No.3, Pp. 41-66.
Irudaya Rajan, S and U. S Mishra (1997) " Population Aging: Causesand Consequences." Chapter 12, Pp. 222-236 in K. C Zachariah
and S Irudaya Rajan (eds). Kerala’s Demographic Transition:
Determinants and Consequences. Sage Publications, New Delhi.
Irudaya Rajan(1999) "Ageing and Social Security." Chapter 3, Pp. 49-
71, In B. A. Prakash (ed). Kerala’s Economic Development: Issues
and Problems. Sage Publications, New Delhi.

23
Table 1: Demographic Profile of Aged in Kerala
Number (‘000) Proportion to Growth ratetotal population (percent)
60+ 70+ 80+ 60+ 70+ 80+ 60+ 70+ 80+
1961 986 363 85 5.13 1.89 0.44 — — —
1971 1328 496 125 6.18 2.31 0.58 2.98 3.12 3.86
1981 1910 712 186 7.45 2.78 0.73 3.63 3.62 3.97
1991 2574 1001 290 8.85 3.44 1.00 2.98 3.41 4.44
2001 3487 1572 449 10.98 4.95 1.41 3.04 4.51 4.37
2011 4884 2260 708 14.37 6.65 2.08 3.37 3.63 4.55
2021 7205 3223 1039 20.44 9.14 2.95 3.89 3.55 3.84
2031 10001 4906 1538 28.24 13.85 4.34 3.28 4.20 3.92
2041 11584 6758 2401 33.59 19.59 6.96 1.47 3.20 4.45
2051 11861 7439 3256 36.61 22.96 10.05 0.24 0.96 3.05
Note: Compiled by the author for the periods 1961 to 1991 using theIndian Censuses; The figures for the years from 2001 to 2051 are extractedfrom the projections done at the Centre for Development Studies, byS. Irudaya Rajan and K. C. Zachariah (for details of the projections, seeIrudaya Rajan and K. C. Zachariah, 1998).

24
Table 2: Proportion of Elderly by Districts, Kerala: The 1991 census
and the KMS, 1998.
District The 1991 Census The 1998 KMS
60+ 70+ 80+ 60+ 70+ 80+
Karsaragod 7.06 2.60 0.65 8.35 2.71 0.50
Kannur 8.43 3.25 0.86 9.44 3.46 0.74
Wayanad 6.20 2.19 0.58 7.47 3.08 0.62
Kozhikode 8.33 3.14 0.86 10.56 3.84 0.62
Malappuram 6.53 2.29 0.62 7.79 2.80 0.75
Palakkad 8.92 3.42 0.94 11.50 4.42 1.35
Thrissur 10.02 4.05 1.19 11.32 4.30 1.25
Ernakulam 9.40 3.86 1.21 12.67 4.96 0.98
Idukki 6.84 2.60 1.76 7.57 2.16 0.39
Kottayam 10.63 4.61 1.51 12.69 4.65 1.40
Alappuzha 11.08 4.19 1.17 13.44 5.68 1.13
Pathanamthitta 12.04 5.15 1.75 15.56 6.77 1.76
Kollam 8.89 3.40 1.04 11.38 4.42 0.93
Thiruvanathapuram 8.49 3.13 0.82 10.90 4.11 0.82
Kerala 8.85 3.44 1.00 10.88 4.14 0.97
Source: Calculated from the 1991 census and 1998 Kerala MigrationStudy.

25
Table 3: Proportion of Elderly by Districts and Sex, Kerala: The
1991 census and the KMS, 1998.
District The 1991 Census (60+) The 1998 KMS (60+)
Male Female Male Female
Karsaragod 6.97 7.14 8.03 8.63
Kannur 7.85 8.97 8.67 10.23
Wayanad 6.10 6.30 7.36 7.58
Kozhikode 7.78 8.88 10.05 11.05
Malappuram 6.22 6.81 7.85 7.73
Palakkad 8.39 9.42 11.72 11.30
Thrissur 9.26 10.71 10.53 12.03
Ernakulam 8.66 10.15 12.09 13.26
Idukki 6.87 6.80 8.85 6.05
Kottayam 10.26 11.00 12.75 12.64
Alappuzha 10.35 11.77 13.86 13.04
Pathanamthitta 11.97 12.11 17.53 13.73
Kollam 8.51 9.26 10.74 11.99
Thiruvanathapuram 8.00 8.96 10.64 11.14
Kerala 8.37 9.32 10.73 11.03
Source: Same as Table 2.

26
Table 4: Elderly in Institutions by Districts, Kerala, 1991
% of elderly % of elderly Institutional(60+) to total live in elderlyPopulation Institutions to per 10000
(1991) total institutional elderlyPopulation Population
Male Female Male Female Male Female
Karsaragod 6.97 7.14 25.00 0.00 2.7 0.0
Kannur 7.85 8.97 14.91 16.67 19.7 5.8
Wayanad 6.10 6.30 0.00 0.00 0.0 0.0
Kozhikode 7.78 8.88 7.85 6.45 14.8 3.4
Malappuram 6.22 6.81 11.11 8.33 1.1 0.9
Palakkad 8.39 9.42 26.67 16.67 4.1 2.6
Thrissur 9.26 10.71 18.10 23.02 17.3 21.0
Ernakulam 8.66 10.15 28.57 27.33 14.7 33.0
Idukki 6.87 6.80 0.00 10.53 0.0 5.6
Kottayam 10.26 11.00 68.88 30.00 32.0 26.9
Alappuzha 10.35 11.77 43.33 45.24 25.7 15.8
Pathanamthitta 11.97 12.11 50.00 25.93 10.2 18.9
Kollam 8.51 9.26 12.82 34.62 5.0 8.0
Thiruvanathapuram 8.00 8.96 7.73 8.20 12.0 3.7
Kerala 8.37 9.32 18.28 22.68 12.3 12.7
Note: Calculated by the author, based on 1991 census.

27
Table 5: Elderly Beggars by Districts, Kerala, 1991
% of elderly % of elderly Beggars per(60+) to total beggars 10000Population to total elderly
(1991) beggars Population
Male Female Male Female Male Female
Karsaragod 6.97 7.14 22.73 12.50 13.5 5.2
Kannur 7.85 8.97 37.84 15.00 16.2 3.0
Wayanad 6.10 6.30 55.56 50.00 47.7 24.2
Kozhikode 7.78 8.88 28.26 10.00 12.9 1.7
Malappuram 6.22 6.81 38.46 25.00 16.0 9.3
Palakkad 8.39 9.42 43.40 50.00 23.8 18.2
Thrissur 9.26 10.71 36.49 41.82 22.2 15.1
Ernakulam 8.66 10.15 42.11 53.85 6.5 4.9
Idukki 6.87 6.80 21.43 41.67 8.0 13.9
Kottayam 10.26 11.00 36.67 28.57 11.7 4.0
Alappuzha 10.35 11.77 37.50 50.00 8.9 5.0
Pathanamthitta 11.97 12.11 21.43 44.44 8.7 5.4
Kollam 8.51 9.26 40.74 33.33 10.9 7.8
Thiruvanathapuram 8.00 8.96 48.15 50.00 11.2 13.5
Kerala 8.37 9.32 36.68 36.50 14.0 8.7
Note: Calculated by the author, based on 1991 census.

28
Table 6: Elderly Pensioners by Districts, Kerala, 1991
% of elderly % of elderly Pensioners per District (60+) to total pensioners 10000
Population to total elderly(1991) pensioners Population
Male Female Male Female Male Female
Karsaragod 6.97 7.14 67.23 64.71 747.0 142.8
Kannur 7.85 8.97 62.96 71.93 1322.1 437.1
Wayanad 6.10 6.30 72.13 65.63 419.4 203.3
Kozhikode 7.78 8.88 68.00 70.45 1383.5 464.9
Malappuram 6.22 6.81 66.84 68.80 812.7 298.1
Palakkad 8.39 9.42 69.24 73.07 1318.6 452.3
Thrissur 9.26 10.71 67.67 65.05 1243.8 397.6
Ernakulam 8.66 10.15 73.13 61.83 1594.2 337.9
Idukki 6.87 6.80 59.68 5.82 490.3 30.6
Kottayam 10.26 11.00 62.25 59.65 1079.1 304.5
Alappuzha 10.35 11.77 62.42 70.44 1417.1 439.0
Pathanamthitta 11.97 12.11 57.37 58.66 1297.9 343.5
Kollam 8.51 9.26 62.19 63.67 1133.4 325.7
Thiruvanathapuram 8.00 8.96 64.08 61.25 1736.1 394.8
Kerala 8.37 9.32 65.43 64.63 1259.1 365.0
Note: Calculated by the author, based on 1991 census.

29
Table 7: Oldage Homes in India, 1995
States
Before 1951- 1971- 1981- 1991- N.A Total % 1950 70 80 90 95
Andhra Pradesh 6 4 14 20 2 5 46 10.0
Delhi 3 4 2 0 1 1 10 2.2
Goa 5 6 6 4 1 0 22 4.8
Gujarat 5 8 4 3 2 1 22 4.8
Karnataka 7 6 8 6 0 1 27 5.8
Kerala 24 19 28 18 2 10 92 19.9
Madhya Pradesh 2 2 4 6 0 0 14 3.0
Maharashtra 16 12 13 10 3 11 54 11.7
Tamil Nadu 16 14 20 34 6 4 90 19.4
Uttar Pradesh 1 5 1 4 0 4 11 2.4
West Bengal 5 7 9 13 0 19 34 7.
Other States and 6 7 11 18 0 10 41 8.9
Union Territories
All India 96 94 120 136 17 66 463 100.0
20.7 20.3 25.9 29.4 3.7 – 100.0
Source: Tabulated by the author from the following publication:
Madras Institute on Ageing. 1995. Care for Elderly.

30
Table 8: Oldage Homes in India by its Auspices, 1995
States Secular Hindu Muslim Christian Govt Others Total %-
Andhra Pradesh 34 1 0 11 0 5 51 9.6
Delhi 4 0 0 4 2 1 11 2.1
Goa 0 1 0 21 0 0 22 4.2
Gujarat 19 2 0 0 0 2 23 4.4
Karnataka 9 1 0 16 0 2 28 5.3
Kerala 11 0 1 82 1 7 102 19.3
Madhya Pradesh 6 2 0 6 0 0 14 2.6
Maharashtra 34 5 0 16 0 10 65 12.3
Tamil Nadu 45 5 0 42 0 2 94 17.7
Uttar Pradesh 6 1 0 5 0 3 15 2.8
West Bengal 29 1 0 5 0 18 53 10.0
Other States and 27 2 0 8 7 7 51 9.7
Union Territories
All India 224 21 1 216 10 57 529 100.0
42.3 4.0 0.2 40.8 1.9 10.8 100.0
Source: Same as Table 7

31
Table 9: Oldage Homes by Sex and types of admission, 1995
State Male Female Both
A PA&D S&H A PA&D S&H A PA&D S&H
Andhra Pradesh - - - 3 2 - 4 17 6
Delhi - - - 1 2 - - - -
Goa 1 - - 8 0 1 12 - -
Gujarat 1 - - 1 - - 15 - 2
Karnataka - - - - 1 - 10 13 1
Kerala - 5 2 9 18 6 17 28 8
Madhya Pradesh - 1 - - 1 - 4 7 -
Maharashtra 1 1 - 4 3 1 13 18 2
Tamil Nadu - 5 1 3 7 - 27 34 3
Uttar Pradesh - - - 2 1 - 8 - 1
West Bengal 1 1 - 3 3 - 7 6 3
Other States and 0 - - - 4 3 24 13 3
Union Territories
All India 4 13 3 34 42 11 141 136 29
Notes: A = Aged; PA&D = Poor aged and Destitute; S&H = Sick and Handicapped
Source: Same as Table 7.

32
Table 10: Mode of Services of Oldage Homes by Auspices, 1995
State Secular Christian Total
F P B N.A F P B N.A F P B N.A
Andhra Pradesh 15 1 5 - 10 - - - 22 1 5 4
Delhi - - - 2 1 - 2 - 2 1 4 1
Goa - - - - 3 10 7 1 3 11 7 1
Gujarat 11 2 3 1 - - - - 13 2 2 3
Karnataka 2 2 5 1 10 4 1 1 12 6 7 3
Kerala 1 4 3 - 73 7 4 - 74 10 6 7
Madhya Pradesh 3 - 2 - 5 - - 1 8 - 3 1
Maharashtra 12 14 3 2 9 1 6 - 21 17 11 12
Tamil Nadu 17 13 5 - 31 1 7 2 44 15 12 4
Uttar Pradesh 2 - 2 2 - 3 2 - 2 4 4 4
West Bengal 9 6 3 1 3 1 1 - 11 7 3 12
Other States and 14 3 3 1 7 - - - 22 3 1 6
Union Territories
All India 86 45 34 10 153 27 30 5 234 77 65 58
Notes: F = Free; P = Paid; B = Both; N.A = Not Available
Source: Same as Table 7.

33
Table 11: Number of Elderly in Oldage Homes, 1995
State Male Female Both Total Total N.A
Elderly Homes
Andhra Pradesh - 140 1564 1704 32 5
Delhi - 122 175 297 6 2
Goa 20 166 415 601 22 -
Gujarat 75 130 928 1133 18 3
Karnataka - 43 2057 2100 27 1
Kerala 445 1211 3122 4778 90 9
Madhya Pradesh 10 15 509 534 12 1
Maharashtra 135 319 2294 2748 49 13
Tamil Nadu 260 140 3476 3876 70 6
Uttar Pradesh - 23 345 368 11 4
West Bengal 175 295 862 1332 25 14
Other States and - 155 1588 1743 36 6
Union Territories
All India 1120 2759 17335 21214 398 65
Source: Same as Table 7.
34
Table 12: Oldage Homes and Inmates by districts, Kerala
Oldage Homes Percent of No. of Inmates % of Inmates
District
Number % Christians
Male Female Male Female
Karsaragod 1 0.7 6.64 0 0 0.0 0.0
Kannur 13 0.7 10.72 342 305 22.9 11.4
Wayanad 0 0.0 23.39 0 0 0 0
Kozhikode 6 4.5 4.63 78 119 5.2 4.4
Malappuram 1 0.7 2.33 0 0 0 0
Palakkad 3 2.2 4.07 5 41 0.3 1.5
Thrissur 25 18.7 24.50 196 525 13.1 19.6
Ernakulam 27 20.1 37.83 197 617 13.2 23.2
Idukki 2 1.5 42.23 63 76 4.2 2.8
Kottayam 31 23.1 45.83 401 588 26.8 21.9
Alappuzha 2 1.5 21.70 24 23 1.6 0.9
Pathanamthitta 9 6.7 40.35 86 211 5.7 7.9
Kollam 4 3.0 17.00 28 70 1.9 2.6
Thiruvanathapuram 10 7.5 17.27 76 105 5.1 3.0
Kerala 125 100.0 1496 2680 100.0 100.0
Source: Author’s survey, 1999

35
Table 13: Old Age Homes Profile, Kerala, 1999
Number of Old age Homes: 134
For Whom
Males only: 13
Females only: 48
Both sexes: 73
Number of Inmates
Males: 1946
Female: 3130
Total: 5076
Management
Government: 13
Christians: 98
Private and others: 23
Working for Old age homes
Food Preparation and Distribution: 269
Nursing services: 214
Administration: 265
Watchman: 35
Other work: 98
Total: 881
Availability of Facilities and Services
Vehicles : 23
Telephone : 90
Medical Doctor: 105
Library and reading room: 81
Recreation: 103
Source: Author’s Survey

36
Table 14: Growth of Oldage Homes in the districts of Kerala
District <1950 1950-59 1960-69 1970-79 1980-89 After1990
Thiruvanathapuram 0.0 30.0 10.0 30.0 0.0 30.0
Kollam 0.0 0.0 33.3 66.7 0.0 0.0
Pathanamthitta 12.5 12.5 12.5 25.0 12.5 25.0
Alappuzha 50.0 0.0 0.0 0.0 0.0 50.0
Kottayam 9.1 9.1 9.1 33.3 21.2 18.2
Ernakulam 24.0 4.0 8.0 20.0 24.0 20.0
Thrissur 29.2 0.0 0.0 12.5 37.5 20.8
Palakkad 0.0 33.3 0.0 33.3 33.3 0.0
Kozhikode 20.0 0.0 0.0 20.0 20.0 40.0
Kannur 0.0 0.0 0.0 33.3 25.0 41.7
Kerala 15.2 7.2 6.4 25.6 22.4 23.2
Source: Author’s Survey
Table 15: Oldage Homes for Whom by districts of Kerala.
Districts Males Only Females Only Both Sex Total
Thiruvanathapuram 0 4 6 10
Kollam 0 2 1 3
Pathanamthitta 0 2 6 8
Alappuzha 0 0 2 2
Kottayam 2 10 21 33
Ernakulam 2 10 13 25
Thrissur 4 13 7 24
Palakkad 0 1 2 3
Kozhikode 1 3 1 5
Kannur 4 3 5 12
Kerala 13 48 64 125
Source: Author’s Survey

37
Table 16: Oldage Homes by Ownership by districts
District Government Religious Private Others Total
Thiruvanathapuram 10.0 50.0 0.0 40.0 100
Kollam 0.0 100.0 0.0 0.0 100
Pathanamthitta 0.0 100.0 0.0 0.0 100
Alappuzha 50.0 50.0 0.0 0.0 100
Kottayam 0.0 15.2 0.0 84.8 100
Ernakulam 0.0 64.0 12.0 24.0 100
Thrissur 4.2 75.0 4.2 16.7 100
Palakkad 33.3 66.7 0.0 0.0 100
Kozhikode 0.0 60.0 20.0 20.0 100
Kannur 0.0 100.0 0.0 0.0 100
Kerala 3.2 57.6 4.0 34.4 100
Source: Author’s Survey
Table 17: Manpower to look after the oldage homes by districts
District Food Nur- Adminis- Watch- Others Totalsing tration man
Trivandrum 17 8 14 12 12 63
Kollam 7 8 4 4 0 23
Pathanamthitta 31 12 24 2 11 80
Alapuzha 2 2 4 0 3 11
Kottayam 87 52 72 6 20 237
Ernakulam 59 48 48 5 26 186
Thrissur 36 41 48 4 17 146
Palakkadu 4 4 3 0 1 12
Kozhikode 8 8 6 1 6 29
Kannur 18 21 42 1 2 84
Kerala 269 204 265 35 98 871
Source: Author’s Survey

38
Table 18: Oldage Home Inmates by Sex (%)
District Males Females Total
Thiruvananthapuram 42.0 58.0 100
Kollam 28.6 71.4 100
Pathanamthitta 29.0 71.0 100
Alapuzha 51.1 48.9 100
Kottayam 41.0 59.0 100
Ernakulam 24.3 75.7 100
Thrissur 27.2 72.8 100
Palakkad 10.9 89.1 100
Kozhikode 39.6 60.4 100
Kannur 52.9 47.1 100
Kerala 35.8 64.2 100
Source: Author’s Survey
Table 19: Facilities Available at Oldage Home by Districts
Percentage of oldhomes having facilities such as
District
Vehicle Telephone Doctor Library Recreation
Thiruvanathapuram 30.0 70.0 60.0 70.0 70.0
Kollam 0.0 66.7 66.7 66.7 33.3
Pathanamthitta 0.0 87.5 100.0 87.5 100.0
Alappuzha 0.0 50.0 100.0 100.0 100.0
Kottayam 10.0 86.7 100.0 86.7 96.7
Idukki 0.0 50.0 100.0 100.0 50.0
Ernakulam 26.9 76.9 84.6 53.8 88.5
Thrissur 29.2 62.5 75.0 58.3 79.2
Palakkad 0.0 33.3 66.7 33.3 66.7
Kozhikode 40.0 80.0 80.0 20.0 60.0
Kannur 8.3 50.0 75.0 41.7 66.7
Kerala 18.4 72.0 84.0 64.8 82.4
Source: Author’s Survey

39
Table 20: Demographic, Social and Economic Characteristics of
Inmates of Old age homes in Kerala
Age Male Female Total
50-59 106 161 26760-69 315 663 97870-79 412 692 110480-89 224 360 58490-99 31 48 79100+ 1 2 3Total 1089 1926 3015Marital StatusNever married 444 894 1338Married 189 98 287Widow/Widower 286 854 1140Divorced/Separated 170 80 250Total 1089 1926 3015ReligionHindus 394 401 795Muslims 11 15 26Christians 675 1494 2169Others 9 16 25Total 1089 1926 3015CommunitySc/ST 30 34 64Nair 175 164 339Ezhava 90 105 195Christians 641 1425 2066Others 153 198 351Total 1089 1926 3015House OwnershipYes 74 105 179No 1015 1821 2836Total 1089 1926 3015Land OwnershipYes 53 64 117No 1036 1862 2898Total 1089 1926 3015

40
Table 21: Reasons for Joining Old age Homes by Inmates
Reasons Male Female Total
Nobody to take care at Home 665 1351 2016
Children are away 11 19 30
Problems with children 110 143 253
Own Preference 237 329 566
Others 66 84 150
Total 1089 1926 3015
Table 22: Inmates by Number of Living Sons and Daughters
Male Female Total
No Children 574 1316 1890
Both Sexes
1 88 169 257
2 115 143 258
3 120 109 229
4+ 192 189 381
Total 515 610 125
Sons
1 185 226 411
2 135 148 283
3 61 50 111
4+ 29 27 56
Total 410 451 861
Daughters
1 167 192 359
2 143 130 273
3 80 81 161
4+ 42 48 90
Total 432 451 883

41
Table 23: Residence status of Inmates’ Living children
With in With in With in Abroad TotalDistrict Kerala India
Child 1 489 423 107 52 1071
Child 2 368 352 81 32 833
Child 3 264 253 50 18 585
Child 4 166 150 33 12 361
Child 5 83 85 24 3 195
Child 6 40 40 5 1 86
Child 7 19 21 2 1 43
Child 8 12 7 1 0 20
Child 9 1 0 0 0 1
Total 1442 1331 303 119 3195

42
Appendix I
Names and Addresses of Old age Homes in Kerala
Thiruvanathapuram
Care Home, Chackai, Thiruvanathapuram, 695 024.
Sree Karthika Thirunal Lakshmibhai Geriatric Centre, Poojappura,Thiruvanathapuram, 695 012.
Mitranikethan, Vellanadu, Thiruvanathapuram, 695 543.
Santhi Bhavan, Bethany Convent, Kuravankonam, Thiruvanathapuram,695 003.
Anpu Nilayam, Anpu Nilayam Building, L M S Compound,Cheruvarakonam, Parassala, 695 502.
Ananda Nilayam, Orphanage & Widows Home, Manacadu Post,Kuriyathy, Thiruvanathapuram, 695 009.
Bethel Gram, Bethany for the Aged, Church of South India South KeralaDiocese, L M S Compound, Thiruvanathapuram, 695 033.
Eventide Home, Eventide Home Society for Senior Citizens Edavakkodu,Parottukonam, Thiruvanathapuram, 695 017.
Muthunayagam home for the aged, Plamoodu, PattomThiruvanathapuram, 695 018.
SNV Women’s Association Home for the Aged, Saradagiri, Varkala P.O,Thiruvanathapuram.
Santhigiri Ashramam, Koliyakode, P.O, Venjaramood,Thiruvanathapuram, 695 607.
Saranalayam Home for the Aged, Kenreha, TC 16/519 Jagathy,Thiruvanathapuram, 695 014.
Sree Mahaganapathy Sevashram,Vattiyoor Kavu, P.O,Thiruvanathapuram, 695 013.
Swayam Prakash Ashramam, Engineering College, P.O,Thiruvanathapuram, 695 016.
Kollam
International Centre for Study and Development, Valakam, Kollam,691 532.Bharain Centre Senior Citizens Home, Karamcode P.O, Kollam,691 579.

43
Mar Baselios Santhi Bhavan, Thalavoor, P.O, Kollam, 691 514.
Assissi Vinayalaya, Kottiyam, Kollam.
Pathanamthitta
Snehabhavan, Kompady, Manjada P.O, Thiruvalla, Pathanamthitta,
689 105.
Ayoor Carmel Agathimandiram,Velliyara P.O, Thiruvalla Pathanamthitta,689 612.
Marthoma Suvisesha Sangam, Visranthi Bhavan, Thiruvalla,Pathanamthitta.
Snehasadhan, Pallimala, Kuttoor P.O, Thiruvalla, Pathanamthitta,
689 106.
Juhanon Marthoma Metropoliatha Jubilee Memorial Agathi Mandiram,Anaparampal, Edathua.P.O, Thiruvalla, Pathanamthitta, 689 573.
Dharmagiri Mandiram, Kumbanad.P.O, Thiruvalla, Pathanamthitta,
689 547.
Daivaparipalana Bhavan, Kunnanthanam, Pathanamthita.
Rural Development Project, Nellimukal, Adoor, Pathanamthitta.
The Charitable Society of the Daughters of St. Joseph, St. Joseph’sConvent, Palackalthakidi, P.O, Thiruvalla, Pathanamthitta, 689 581.
Alleppey
St. Joseph’s Poor Home, Punnapra.P.O, Alleppey, 688 004.
Rajiv Gandhi Memorial Old Home for The Coir Workers, Kerala CoirWorkers Welfare Fund Board, North of Collectorate, Alleppey, 688 011.
Kottayam.
Abhaya Bhavan, Keezhakunnu, P.O, Kottayam, 686 002.
Devidan Centre, Ozanam Society, Ozanam Bhavan, Palai, 686 575.
Visranthi Bhavan, Kottayam.
St. Joseph’s Old Age Home, Sachnothamapuram, P.O, Kurichi, Kottayam.
St. Joseph’s Deva Bhavan, Vellilppally, Ramapuram Bazar, Kottayam,686 576.
St.Vincent Providence House, Sisters of the Destitute, Palai, Kottayam,686 575.

44
Asha Bhavan, Nenment, Velanilam P.O. Via. Mundakayam, Kottayam,680 514.
Snehagiri Institution – Amla Bhawan, T V Puram, Vaikom, Kottayam,686 606.
Daya Bhavan, Karror, P.O, Palai, Kottayam, 686 590.
Sevagram Avedana Bhavan Hospice, Pothy, Thalayolaprambu, P.O,Kottayam.
Rose Bhavan, Monippally P.O. Palai, Kottayam, 686 636.
St.Vincent Poor Home, Changanacherry, Kottayam, 686 101.
Mundakapadam Mandiram, Manganam, P.O, Kottayam, 686 108.
Assisi Gram, Secular Franciscan Order of Changanacherry diocese,Ammanchery, Amalagiri, P.O, Kottayam, 686 036.
Assisi Home for the Aged Women, Kollad, Kottayam, 686 029.
St. Johns Home for the Aged, Poozhikol, P.O, Kaduthuruthy, Kottayam,686 604.
Santhinilayam, Snehagiri Missionary Sisters, Yenthayar P.O,Mundakayam (via), Kottayam, 686 514.
Ashakendram Trust, Kadavil Building, Kanjikuzhy, Kottayam, 686 004.
Navajeevan Trust, Villoonni, P.O, Kottayam.
Don Bosco Poor Home, Kadanadu P.O, Palai, Kottayam, 686 653.
Bishop Tharayil Memorial Home for the Aged, Thellakom.P.O,Kottayam, 686 016.
Society of St.Vincent De Paul-St.Mary’s Conference, Kozhuvanal.P.O,Kottayam, 686 523.
Reksha Bhavan, Snehagiri Missionary Sisters, Maniamkulam,Chennad.P.O, Kottayam, 686 582.
Karunalayam, Gandhinagar.P.O, Kottayam, 686 008.
M.G.M Abhaya Bhavan, Pothenpuram.P.O, Pampady, Kottayam,
686 502.
Bhagya Bhavan, Home for the Destitutes, Little Lourdes Institution,Kindangoor, Kottayam- 689 612.
Abhaya Kendram Cancer Centre, St. Joseph’s Convent, GandhiNagar.P.O, Kottayam.
Karuna Aged Home, Kumarakom, Kottayam.

45
Santhi Retirement Home, Kottaramattom, Palai.P.O, Kottayam.
Old Age Home, Rose Bhawan, Cheeukallel, Homipally, P.O, Kottayam.
Mercy Home, Clare Nagar, Thidanad P.O, Kottayam, 686 123.
Amala Sadanam, Deepthi Centre, Jyothi Province, Aruvithura, Kottayam.
Athurasraman Women’s Retirement Home, Women’s Wing,Athurasramam, Schivothampuram, P.O, Kotttayam.
St. Joseph’s Home for the Aged, Moonilavu, P.O, Kottayam.
St Vincent De Paul Home for the Aged, Society of St. Vincent De Paul,Palai, P.O, Kottayam.
Bethanaya Home, Visranthi Bhavan, Kuzhimattom, P.O, Kottayam,
686 533.
Idukki
Pratheeksha Bhavan, Kattappana South P.O, Idukki, 685 515
Sneha Bhavan, Payankulam, Mailacompu, P.O, Thodupuzha, 685 584.
Ernakulam
Vanaprastha, Sree Ramakrishna Sevasramam, Azad Road, Kallor, Cochin,682 017.
The Salvation Army, E. B. L. Hospital, Varikol, P.O, Puthencruz,Ernakulam, 682 308.
Shanthigiri Old Age Home, NDA Road, H.M.T Colony, Kalamassery,Ernakulam, 683 503.
St. Joseph’s Poor Home, Peringuzha, Perumballoor, P.O, Muvattupuzha(via), Ernakulam, 686 661.
Guardian Angel Retirement Home, Airapuram, Keezhillam, P.O,Ernakulam, 683 541.
Nirmala Bhavan, Home for the Aged and Destitute, Karumalloor,Thattampady P.O, Alwaye, Ernakulam, 683 511.
Santhom Snehalayam, Malayinkeezhu, Koyhamangalam, Ernakulam,686 691.
Ernakulam Women’s Service Society, Peechingpanambu, EdappallyNorth, Ernakulam.
St. Simon Home for the Aged, Servants of The Cross, Carmel Dayara,Kandanad, P.O, Ernakulam, 682 305.

46
Bethsada Nursing Home, Bethsada, P.O, Vengola, Perumbavoor,Ernakulam, 683554.
Santhi Bhavan Old Age and Infirm Home, S.H.Convent, Karukuttu,Ernakulam, 683 576.
Deya Bhavan, St. Germains Convent, Chengal, Kalady P.O, Ernakulam,683 574.
Karuna Bhavan, Clarist Convent, Srimoolanagaram, Ernakulam, 683 580
Chavara Sadanam, Srimoola Nagaram, Ernakulam, 683 580.
St.Joseph Asylum for the Aged, Holy Family Carmelite Convent,Kothamangalam, Ernakulam, 686 691.
Karunalayam, Sisters of the Destitute, B.M.College, P.O, Thirkkakara,682 021.
Home for the Destitute, Perumanur, Kochi, 682 015.
Little Flower Poor House, Narakal, Vaippin, Ernakulam, 682 505.
Carmal Home for Old Age, Varapuzha,Varapuzha Landing P.O,Ernakulam, 683 517.
Sainic Ashram, Janatha Road, Palarivattom, Cochin, 682 025.
Sneha Sadan Trust, St. Teresa Convent, Arakuzha P.O, Movattupuzha,Ernakulam, 686 672.
St.Teresa’s Mercy Home, Banerji Road, Kacheripady, Ernakulam,
682 018.
Augstin Nivas, Home for the Aged, Chunagam Veli, Erumathala P.O,Aluva, 683 105.
Mount Shalom, Koothattukulam, Ernakulam.
Assisi Bhavan, Puthen Velikara, Ernakulam, 683 594.
Karunya Bhavan, Home for the Aged Women, Puthenvelikara,Ernakulam, 683 594.
House of Providence, Old Age Home, Ernakulam, Kochi, 682 018.
Home for the Aged and Infirm, Chunangamvely, Erumathala, P.O, Aluva,Ernakulam, 683105.
St Joesph’s Waifs’ Home, Vely, Kochi, 682 001.
Sisters of the Destitute, Anandha Bhavan, Home for the Aged,Kurichilakode, Kodnad, Ernakulam, 683 544.
Old age Home, Moovattupuzha Municipality, Moovattupuzha,Ernakulam.

47
Anana Bhavan, Sisters of the Destitute, Kurichilakode, Kodanad,
683 544.
Sneha Bhavan, Vayojangaramam, Sneha Sishrushalayam, South Chitter,Kochi, Ernakulam, 682 027.
St. Joseph’s Provincilate Assisi, Mercy Home, Karukutty, P.O,Ernakulam.
Trichur
Jatinna Bhavan, Poyya, Mala, 680 733.
St.Joseph’s Home for the Aged, Puliyilakunnu, Ashtamichira, P.O,Trichur, 680 731.
St. Joseph’s Home, Pulliazhy, Trichur, 680 012.
House of Providence, Pius XII Jubilee Memorial, Irinjalakuda, Trichur,680 121.
Good Shepherd Home for the Aged, Ponnore, P. O, Parapur (via), Trichur,680 552.
St. Anthony’s Sanketham, Pariyaram, P.O, Chalakudy (via), Trichur,
680 721.
Dayasadan, Karunalaya Charity Convent, Chittissery, P.O, Pudukad (via),Tirchur, 680 391.
Assissi Nilayam, Marathakkara, P.O, Ollur, Trichur, 680 320.
Sree Ravivarma Mandiram, Nellikunnu, Trichur, 680 005.
St.George Asha Bhavan, Anandapuram, Trichur.
Santhi Sadanam, New Market Road, Irinjalakuda, Trichur, 680 121
Bethel Ashram Old People’s Home, Mission Quarters, Trichur, 680 001.
Vridha Mandiram, Ramavarmapuram, Trichur.
Holy Family Home for the Aged, Mannuthy, P.O, Trichur, 680 651.
Snehalayam, Mundathicode, Trichur.
Pope John Paul Peace Home, Peringandoor, P.O, Ambalapuram, Trichur,680 581.
Sneha Bhavan, Near Bishop House,Trichur.
Home of Love, Mulayam, Trichur.
Christ Villa Poor Home, Ramavarmapuram, P.O, Trichur, 680 831.
Home for the Aged and Infirm, Karuna Bhavan, Sisters of the Destitute,Mala, Trichur, 680 732.

48
Vanaprastha Nilayam, Hind Navotthana Pratishtan, Vyasatapovanam.P.O,Vyasagiri, 680 623.
Mareena Home for the Aged, St. Anne’s Charitable Institute, West Fort,Trichur, 680 004.
Fatima Bhavan, Fatima F C Convent, Poyya, P.O, Trichur, 680 773.
Pius XII Jubilee Memorial House of Providence, Irinjalkuda, Trichur,680 121.
Abhaya Sadan, Mariyapuram, Anchery P.O, Trichur, 680 006.
Palakkadu
Mercy Home for the Aged Destitute, Mercy College, Palakkad,
678 006.
Home for Physically Handicapped, Koduvayoor, Palakkad, 678 005.
C. S. I. Old Peoples Home, The North Kerala Diocesan CharitiesAssociation, Vadakkanchary, P.O, Palakkad, 678 683.
Chinmaya Seva Nilayam, A Unit of Chinmaya Seva Trust, Kerala,Krishna Gardens, Pilakkavu, P.O, Kalladathur, Palakkad, 680 020.
Darul Masakeen, Ottapalam, Markazu Ishaathil Islamiya Trust, Thottkara,P.O, Palakkadu.
Kozhikode
The Poor Homes Society, West Hill, Calicut, 673 005.
Homage, 33/709, A R. Camp Road, Marikunnu, P O, Calicut, 673 012.
Mea Home, Home for the Aged Women, Sellere, Malaparambu, Calicut,673 009.
Mercy Home, Missionaries of Charity, Marikunnu P O, Calicut,
673 012.
J.D.T Islam Orphange Committee, Marikunnu, P.O, Calicut, 673 012.
Kannur
St.Antony’s Sanketham, Periyaram P.O, Kannur.
Mercy Home, F.C Convent, Kunnoth, Kilianthra P.O, Iritty, Kannur, 670706.
Divya Karunya Ashram, Oduvally, Chundakkunnu, Kannur 670 581.
St. Joseph’s Disabled Centre, Muthalappara, Ariyil P O, Kannur.

49
Sneha Bhavan, St.Stephen Charitable Society, Alachery, Chittariparamba,Kannur.
Karunya Bhavan, Home for the Aged, Snehagiri Missionary Sisters,Karunapuram, Thadikkadavu, P.O, Kannur, 670 581.
Assissi Home, Deena Bhavan, Mariyapuram, Pariyaram, Kannur.
Nirmalalayam Aged home, Madi P.O, Kannur, 670 304.
Amala Bhavan, Pikunnu P. O, Kannur, 670 004
Prathyusa Bhavan, Pallikunnu P .O, Kannur.
Devidan Centre, Kolayad P O, Tellicherry, Kannur, 670 648.
Karunalayam, Bishop S Valloppilly Jubilee Memorial Home For TheAged, Chemperi P.O, Kannur, 670 632.
Dinasevanasabha, Snehaniketan Social Centre, St. Joseph’s Centre forDisabled, Muthalapara, Ariyil, P.O, Pattuvam (via), Kannur, 670 143.
Franciscan Clarist Convent, Kunnoth, Kilianthra, P.O, Iritty (via), Kannur,670 076.
Saranalayam, Lioness District project, Kannur.
Sree Maha Ganapathy Sevasram, Kannur.
Kasaragode
Y’s Nivas, Chittarikkal, Kasaragode, 671 326.

50
CENTRE FOR DEVELOPMENT STUDIES
LIST OF WORKING PAPERS
(From 1991 onwards)
MRIDUL EAPEN Hantex: An Economic Appraisal.September, 1991, W.P.242
SUNIL MANI Government Intervention in Commercial Crop Development:A Case of Flue Cured Virginia Tobacco.November, 1991, W.P.243
K. PUSHPANGADAN Wage Determination in a Casual Labour Market: TheCase Study of Paddy Field Labour in Kerala.January, 1992, W.P.244
K.N. NAIR & S.P. PADHI Dynamics of Land Distribution: An AlternativeApproach and Analysis with Reference to Kerala.January, 1992, W.P.245
THOMAS ISAAC Estimates of External Trade Flows of Kerala - 1975-76 and1980-81.March, 1992, W.P.246
THOMAS ISAAC, RAM MANOHAR REDDY, NATA DUVVURRY Re-gional Terms of Trade for the State of Kerala.March, 1992, W.P.247
P. MOHANAN PILLAI Constraints on the Diffusion of Innovations in Kerala:A Case Study of Smokeless Chulas.March, 1992, W.P.248
R. ANANDRAJ Cyclicality in Industrial Growth in India: An ExploratoryAnalysis.April, 1992, W.P.249
T.M. THOMAS ISAAC, RAM MANOHAR REDDY, NATA DUVVURYBalance of Trade, Remittance and Net Capital Flows: An Analysis ofEconomic Development in Kerala since independence.October, 1992, W.P.250
M. KABIR, T.N. KRISHNAN Social Intermediation and Health Transition:Lessons from Kerala,October, 1992, W.P.251

51
SUNIL MANI, P. NANDAKUMAR Aggregate Net Financial Flows to India:The Relative Importance of Private Loan vis-a-vis Foreign Direct In-vestments.August, 1993, W.P.252
PULAPRE BALAKRISHNAN Rationale and the Result of the CurrentStabilisation Programme.November, 1993, W.P.253
K.K. SUBRAHMANIAN, P. MOHANAN PILLAI Modern Small Industryin Kerala: A Review of Structural Change and Growth Performance.January, 1994, W.P.254
DILIP M.MENON Becoming Hindu and Muslim : Identity and Conflict inMalabar 1900-1936.January, 1994, W.P.255
D. NARAYANA Government Intervention in Commodity Trade: An Analysisof the Coffee Trade in India.January, 1994, W.P.256
K.J. JOSEPH, P. NANDAKUMAR On the Determinants of Current AccountDeficits: A Comparative Analysis of India, China and South Korea.January, 1994, W.P.257
K.K. SUBRAHMANIAN, K.J. JOSEPH Foreign Control and Export Inten-sity of Firms in Indian Industry.February, 1994, W.P.258
PULAPRE BALAKRISHNAN, K. PUSHPANGADAN Total Factor Produc-tivity Growth in Indian Manufacturing - A Fresh Look.April 1994, W.P.259
D. NARAYANA, K.N. NAIR Role of the Leading Input in Shaping Institu-tions: Tendency in the Context of Irrigation Uncertainty.May, 1994, W.P.260
G. MURUGAN, K. PUSHPANGADAN Pricing of Drinking Water: An Ap-plication of Coase Two-part Tariff.December, 1994 W.P.261
MOHANAN PILLAI On the Mexican Crisis.December, 1995, W.P.262
SUNIL MANI Financing Domestic Technology Development through the Ven-ture Capital Route.December, 1995, W.P.263

52
T.T. SREEKUMAR Peasants and Formal Credit in Thiruvithamcore: TheState Institutions and Social Structure 1914-1940.December, 1995 W.P.264
AMITABH Estimation of the Affordability of Land for Housing Purposes inLucknow City, Uttar Pradesh (India): 1970-1990.March, 1996. W.P.265
K. PUSHPANGADAN, G. MURUGAN, K. NAVANEETHAM Travel Time,User Rate & Cost of Supply: Drinking Water in Kerala, India:June 1996. W.P.266
K.J. JOSEPH Structural Adjustment in India: A Survey of Recent Studies &Issues for Further Research,June 1996 W.P.267
D. NARAYANA Asian Fertility Transition: Is Gender Equity in Formal Occu-pations an Explanatory Factor?October, 1996 W.P.268
D. NARAYANA, SAIKAT SINHAROY Import and Domestic Production ofCapital Goods from Substitution to Complementarity,October 1996. W.P.269
NEW SERIES
W.P. 270 ACHIN CHAKRABORTY On the Possibility of a Weighting Sys-tem for Functionings December 1996
W.P. 271 SRIJIT MISHRA Production and Grain Drain in two inland Re-gions of Orissa December 1996
W.P. 272 SUNIL MANI Divestment and Public Sector Enterprise Reforms,Indian Experience Since 1991 February 1997
W.P. 273 ROBERT E. EVENSON, K.J. JOSEPH Foreign Technology Li-censing in Indian Industry : An econometric analysis of the choiceof partners, terms of contract and the effect on licensees’ perform-ance March 1997
W.P. 274 K. PUSHPANGADAN, G. MURUGAN User Financing & Col-lective action: Relevance sustainable Rural water supply in India.March 1997.
W.P. 275 G. OMKARNATH Capabilities and the process of DevelopmentMarch 1997
W. P. 276 V. SANTHAKUMAR Institutional Lock-in in Natural ResourceManagement: The Case of Water Resources in Kerala, April 1997.

53
W. P. 277 PRADEEP KUMAR PANDA Living Arrangements of the Elderlyin Rural Orissa, May 1997.
W. P. 278 PRADEEP KUMAR PANDA The Effects of Safe Drinking Waterand Sanitation on Diarrhoeal Diseases Among Children in RuralOrissa, May 1997.
W.P. 279 U.S. MISRA, MALA RAMANATHAN, S. IRUDAYA RAJANInduced Abortion Potential Among Indian Women, August 1997.
W.P. 280 PRADEEP KUMAR PANDA Female Headship, Poverty andChild Welfare : A Study of Rural Orissa, India, August 1997.
W.P. 281 SUNIL MANI Government Intervention in Industrial R & D, SomeLessons from the International Experience for India, August 1997.
W.P. 282 S. IRUDAYA RAJAN, K. C. ZACHARIAH Long Term Implica-tions of Low Fertility in Kerala, October 1997.
W.P. 283 INDRANI CHAKRABORTY Living Standard and EconomicGrowth: A fresh Look at the Relationship Through the Non- Para-metric Approach, October 1997.
W.P. 284 K. P. KANNAN Political Economy of Labour and Development inKerala, January 1998.
W.P. 285 V. SANTHAKUMAR Inefficiency and Institutional Issues in theProvision of Merit Goods, February 1998.
W.P. 286 ACHIN CHAKRABORTY The Irrelevance of Methodology andthe Art of the Possible : Reading Sen and Hirschman, February 1998.
W.P. 287 K. PUSHPANGADAN, G. MURUGAN Pricing with ChangingWelfare Criterion: An Application of Ramsey- Wilson Model to Ur-ban Water Supply, March 1998.
W.P. 288 S. SUDHA, S. IRUDAYA RAJAN Intensifying Masculinity of SexRatios in India : New Evidence 1981-1991, May 1998.
W.P. 289 JOHN KURIEN Small Scale Fisheries in the Context ofGlobalisation, October 1998.
W.P. 290 CHRISTOPHE Z. GUILMOTO, S. IRUDAYA RAJAN RegionalHeterogeneity and Fertility Behaviour in India, November 1998.
W.P. 291 P. K. MICHAEL THARAKAN Coffee, Tea or Pepper? FactorsAffecting Choice of Crops by Agro-Entrepreneurs in NineteenthCentury South-West India, November 1998

54
W.P. 292 PRADEEP KUMAR PANDA Poverty and young Women's Em-ployment: Linkages in Kerala, February, 1999.
W.P. 293 MRIDUL EAPEN Economic Diversification In Kerala : A Spa-
tial Analysis, April, 1999.
W.P. 294 K. P. KANNAN Poverty Alleviation as Advancing Basic HumanCapabilities: Kerala's Achievements Compared, May, 1999.
W.P. 295 N. SHANTA AND J. DENNIS RAJA KUMAR Corporate Statis-
tics: The Missing Numbers, May, 1999.
W.P. 296 P.K. MICHAEL THARAKAN AND K. NAVANEETHAM
Population Projection and Policy Implications for Education:ADiscussion with Reference to Kerala, July, 1999.
W.P. 297 K.C. ZACHARIAH, E. T. MATHEW, S. IRUDAYA RAJAN
Impact of Migration on Kerala's Economy and Society, July, 1999.
W.P. 298 D. NARAYANA, K. K. HARI KURUP, Decentralisation of theHealth Care Sector in Kerala : Some Issues, January, 2000.
W.P. 299 JOHN KURIEN Factoring Social and Cultural Dimensions intoFood and Livelihood Security Issues of Marine Fisheries; A CaseStudy of Kerala State, India, February, 2000.
W.P. 300 D. NARAYANA Banking Sector Reforms and the EmergingInequalities in Commercial Credit Deployment in India, March, 2000.
W.P. 301 P. L. BEENA An Analysis of Mergers in the Private CorporateSector in India, March, 2000.
W.P. 302 K. PUSHPANGADAN, G. MURUGAN, Gender Bias in aMarginalised Community: A Study of Fisherfolk in Coastal Kerala,May 2000.
W.P. 303 K. C. ZACHARIAH, E. T. MATHEW, S. IRUDAYA RAJAN ,Socio-Economic and Demographic Consequenes of Migration inKerala, May 2000.
W.P. 304 K. P. KANNAN, Food Security in a Regional Perspective; A Viewfrom 'Food Deficit' Kerala, July 2000.
W.P. 305 K. N. HARILAL, K.J. JOSEPH, Stagnation and Revival of KeralaEconomy: An Open Economy Perspective, August 2000.

This work is licensed under a Creative Commons Attribution – NonCommercial - NoDerivs 3.0 Licence. To view a copy of the licence please see: http://creativecommons.org/licenses/by-nc-nd/3.0/