Home About Us Professional Public Search Contact Ustabbacooo
72
-
Upload
ravipachauri -
Category
Documents
-
view
215 -
download
2
Transcript of Home About Us Professional Public Search Contact Ustabbacooo


10 all the age-groups (Tables K31 & U31). Prevalence was higher in rural areas as compared to urban areas in both sexes in different age-

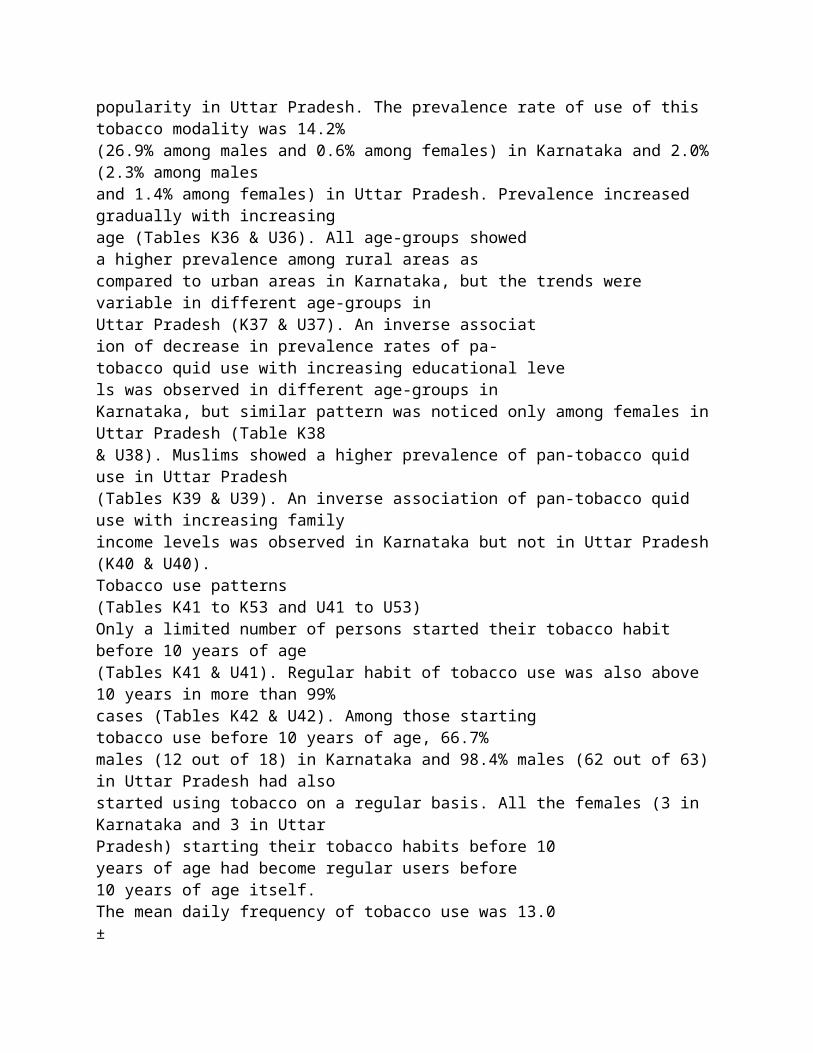
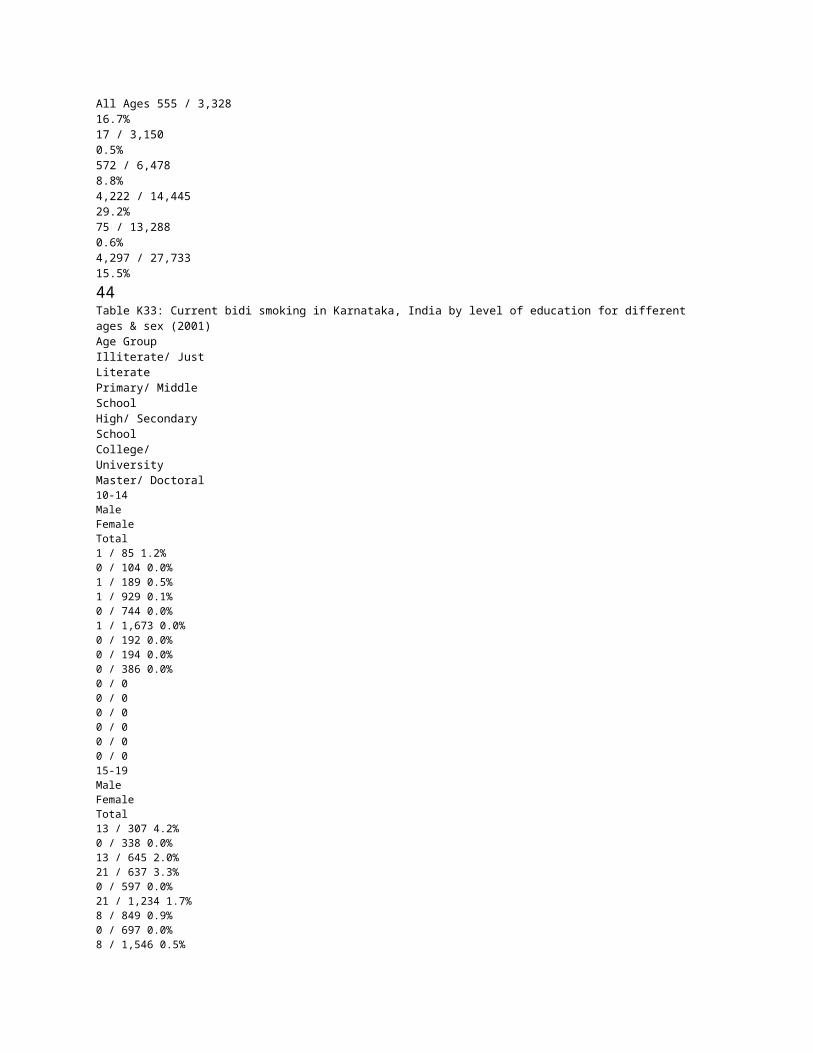
groups (Tables K32 & U32). Most age-groups in both sexes, in both States, showed a trend of decreasing prevalence rate with increasing educational levels (Tables K33 & U33). A similar inverse association of decrease in prevalence of bidi smoking with increasing family income levels was observed in both States among men (Tables K35 & U35). Prevalence of bidi smoking was slightly higher among Muslim males as compared to Hindu males in Uttar Pradesh (Tables K34 & U34). Current use of pan-tobaccoquid (Tables K36 to K40 and U36 to U40) Pan-tobacco quid was found to be fairly popular in Karnataka but had limited popularity in Uttar Pradesh. The prevalence rate of use of this tobacco modality was 14.2% (26.9% among males and 0.6% among females) in Karnataka and 2.0% (2.3% among males and 1.4% among females) in Uttar Pradesh. Prevalence increased gradually with increasing age (Tables K36 & U36). All age-groups showed a higher prevalence among rural areas as compared to urban areas in Karnataka, but the trends were variable in different age-groups in Uttar Pradesh (K37 & U37). An inverse association of decrease in prevalence rates of pa-tobacco quid use with increasing educational levels was observed in different age-groups in Karnataka, but similar pattern was noticed only among females in Uttar Pradesh (Table K38 & U38). Muslims showed a higher prevalence of pan-tobacco quid use in Uttar Pradesh (Tables K39 & U39). An inverse association of pan-tobacco quid use with increasing family income levels was observed in Karnataka but not in Uttar Pradesh (K40 & U40). Tobacco use patterns(Tables K41 to K53 and U41 to U53) Only a limited number of persons started their tobacco habit before 10 years of age (Tables K41 & U41). Regular habit of tobacco use was also above 10 years in more than 99% cases (Tables K42 & U42). Among those starting tobacco use before 10 years of age, 66.7% males (12 out of 18) in Karnataka and 98.4% males (62 out of 63) in Uttar Pradesh had also started using tobacco on a regular basis. All the females (3 in Karnataka and 3 in Uttar Pradesh) starting their tobacco habits before 10 years of age had become regular users before 10 years of age itself. The mean daily frequency of tobacco use was 13.0 ±9.7 in Karnataka (14.9 times/ day among males & 7.5 times/ day among females) and 9.1 ±6.5 in Uttar Pradesh (10.0 times/ day among males & 7.9 times/ day among females). A higher proportion of young tobacco-users consumed tobacco 5 or less number of times, but adults commonly used 6 or
more times a day (Tables K43 & U43). Overall 73.6% males and 51.2% females used tobacco 6 or more times a day in Karnataka. Proportion of tobacco usage 6 or more times a day among males and females in Uttar Pradesh was 75.0% and 61.8% respectively. Frequency of smoking was observed to follow similar patterns among the two sexes in Karnataka, but a slightly higher proportion of males used tobacco 6 or more times a day in Uttar Pradesh (Tables K44 & U44). Cigarette smoking was mainly limited to menfolk and 36.6% and 55.2% of them used it 6 or more times a day in Karnataka and Uttar Pradesh, respectively (Tables K45 & U45). About 89% persons in Karnataka smoked bidis 6 or more times a day. In Uttar Pradesh, the proportion of bidi use 6 or more times a day was 87.2% among males and 74.8% among females (Tables K46 & U46). Duration of use of tobacco products increased with increasing age (Tables K47 & U47). Among respondents above 40 years of age, 93.3% in Karnataka and 91.6% in Uttar Pradesh had used it for more than 10 years. About two-third cigarette users among males had consumed it for more than 10 years (Tables K48 & U48). Among bidi users, 79.9% males 11and 83.5% females in Karnataka had consumed it for more than 10 years, whereas in Uttar Pradesh, 70.7% of male and 76.7% of female bidi users consumed it for more than 10 years (Table K49 & U49). Men seemed to be evenly distributed between less than 10 years and more than 10 years’ use categories for smokeless tobacco, in both the States, but a higher proportion of women had used these products for more than 10 years (Tables K50 & U50). The monthly mean expenditure on tobacco products was observed to be Rs. 103.9 in Karnataka and Rs. 80.3 in Uttar Pradesh. Most of the tobacco users, cigarette smokers and bidi smokers, spent less than Rs. 200 per month in both the States (Tables K51 to K53 and U51 to U53) with a slightly higher expenditure on cigarettes. Attitude towards tobacco products (K54 to K59 and U54 to U59)In Karnataka, 18.4% of males and 9.3% of females had ever considered tobacco cessation, but 4.0% males and 2.2% of females could quit the habit. In Uttar Pradesh, 3.5% of males and 1.4% of females ever contemplated cessation, but only 5 males and 1 female (<0.1%) could quit the habit. Among those everconsidering cessation, 59.4% in Karnataka and 63.0% in Uttar Pradesh were currently interested in quitting (Tables K54 and U54). Among males, long term health impact was the commonest reason for considering tobacco quitting (Tables K55 and U55). Economic impactof tobacco use was the second commonest reason in Karnataka, but occupied 4th
position in Uttar Pradesh. Ranking of reasons for considering quitting by females was similar to males in Karntka, but moral/ religious reasons followed by long-term health impacts were commonest reasons in Uttar Pradesh (Tables K56 and U56). During the last one year, 948 tobacco users (9.4%) in Karnataka and 321 tobacco users (3.1%) in Uttar Pradesh had tried quitting,with about two-third in Karnataka and about
93% making more than one effort (Tables K57 and U57). Among tobacco users reporting attempts at tobacco cessation in the past, more than 60% in Karnataka and 88% in Uttar Pradesh had made more than one attempt (Tables K58 and U58). Self determination was the chosen method in most of the cases (Tables K59 and U59). Tobacco use among parents (K60 to K61 and U60 to U61) In Karnataka, at-least one of the parents was reported to be a tobacco user among 68.3% male and 74.3% female tobacco users. Tobacco use by a parent was reported by 49.8% male and 45.2% female never-users of tobacco. In Uttar Pradesh, parental tobacco use was reported by 73.8% male and 60.3% females tobacco users, in contrast with 66.4% male and 59.9% female never-users of tobacco. The difference in parental tobacco use status among users and never-users was higher in higher age groups in Karnataka. Knowledge of harmful effects of tobacco(Tables K62 to K71 and U62 to U71)In Karnataka, 61.7% of tobacco users and 78.0% of never-users reported knowledge of at least one harmful effect of tobacco. In Uttar Pradesh, 90.8% of tobacco users and 88.7% of never-users reported knowledge of harmful effect of tobacco. Cancers was the commonest response in all age groups in both the States, both amongst users as well as non-users of tobacco, followed by respiratory diseases, heart diseases and stroke. There was very little difference in type of harmful effects when the tobacco users as well as non-users were considered according to sex, urban/ rural status, family income or religion. Second-hand smoke was considered to be harmful for adults by 57.1% male tobacco users and 26.6% female tobacco users in Karnataka, while in Uttar Pradesh, 95.2% male and 92.7% female tobacco users considered it harmful. Second hand smoke was considered to be harmful for children by 56.4% male & 26.4% female tobacco users in Karnataka and 95.3% male & 93.7% female tobacco users in Uttar Pradesh. The proportion of never-users of 12 tobacco considering second-hand smoke to be harmful for adults was 77.7% males & 67.0% females in Karnataka and 93.9% males & 92.4% females in Uttar Pradesh. It was considered to be harmful for children by 77.2% male & 66.8% female never-users of tobacco in Karnataka, and 94.5% male & 92.7% female never-users in Uttar Pradesh. Overall, 61.3% male & 38.0% female tobacco users and 75.0% male & 69.6% never-users of tobacco in Karnataka, felt that spending money on tobacco products makes people poorer. In Uttar Pradesh, 80.2% male & 74.3%female tobacco users and 79.3% male & 80.1% female tobacco users felt that expenditure on tobacco makes people poorer (Tables K70 to K71 and U70 to U71). The pattern of responses did not seem to differ according to age.
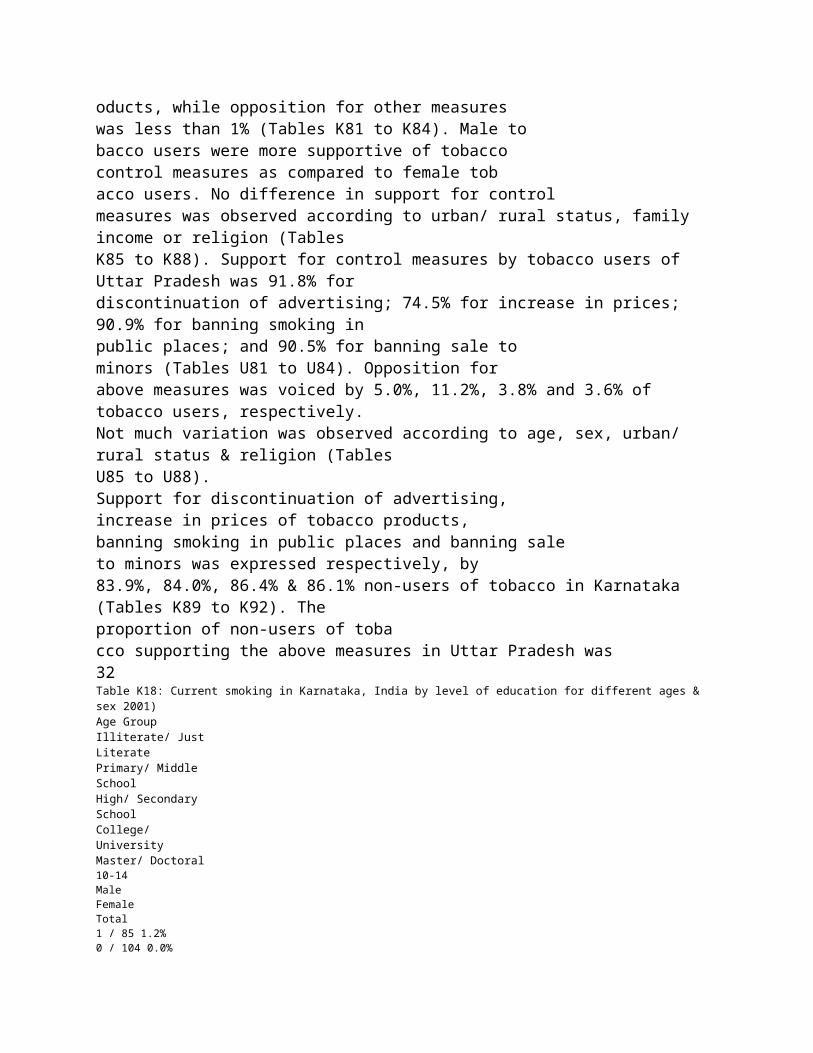
Perception of tobacco use and tobacco industry(Tables K72 to K80 and U72 to U80) All kind of tobacco users in Karnataka feltthat its use was relaxing, with the second commonest response being sophisticated. About 7% of tobacco users found the habit to be repulsive while a small proportion (0.4%) of tobacco users considered it to be immoral. Responses were not different according to type of tobacco use and age. About 54% of never-users of tobacco considered the habit to be repulsive followed by 20.3% considering it to be foolish and 2.8% taking it as immoral. About 18% of never-users also responded that the habit was either relaxing or sophisticated ormanly or was fun. Tobacco users in Uttar Pradesh felt that its use was fun (30.5%), relaxing (26.9%) or sophisticated (22.7%). About 17% of tobacco users considered it to be foolish, with 4.6% thinking it to be repulsive and 1.2% as immoral. Responses were similar according to different modalities of tobacco use. However among never-users of tobacco, 29.3% considered it to be foolish, 24.2% thought it was fun and 22.4% felt it was relaxing. The common responses in decreasing order about perception about tobacco industry included, revenue generation, harm to economy, provision of jobs and killing citizens in both the States. The order of responses was not different according to age, sex, urban/ rural status or family income level. Opinion on measures for tobacco control(Tables K81 to K96 and U81 to U96) Among tobacco using respondents in Karntaka, 77.9% supported discontinuation of advertising and sponsorship by tobacco industry; 75.8% supported increase in prices of tobacco products; 79.9% supported banning ofsmoking in public places; and 80.5% supported banning of sale to minors. About one-fifth (between 19.0% and 21.5% for different questions) of respondents had no opinion on variouscontrol measures. About 3% of tobacco users opposed increase in prices of tobacco products, while opposition for other measures was less than 1% (Tables K81 to K84). Male tobacco users were more supportive of tobacco control measures as compared to female tobacco users. No difference in support for control measures was observed according to urban/ rural status, family income or religion (Tables K85 to K88). Support for control measures by tobacco users of Uttar Pradesh was 91.8% for discontinuation of advertising; 74.5% for increase in prices; 90.9% for banning smoking in public places; and 90.5% for banning sale to minors (Tables U81 to U84). Opposition for above measures was voiced by 5.0%, 11.2%, 3.8% and 3.6% of tobacco users, respectively.
Not much variation was observed according to age, sex, urban/ rural status & religion (Tables U85 to U88). Support for discontinuation of advertising, increase in prices of tobacco products, banning smoking in public places and banning sale to minors was expressed respectively, by 83.9%, 84.0%, 86.4% & 86.1% non-users of tobacco in Karnataka (Tables K89 to K92). The proportion of non-users of tobacco supporting the above measures in Uttar Pradesh was 32 Table K18: Current smoking in Karnataka, India by level of education for different ages & sex 2001) Age Group Illiterate/ Just Literate Primary/ Middle School High/ Secondary School College/ University Master/ Doctoral 10-14 Male Female Total 1 / 85 1.2% 0 / 104 0.0% 1 / 189 0.5% 1 / 929 0.1% 0 / 744 0.0% 1 / 1,673 0.1% 0 / 192 0.0% 0 / 194 0.0% 0 / 386 0.0% 0 / 0 0 / 0 0 / 0 0 / 0 0 / 0 0 / 0 15-19 Male Female Total 14 / 307 4.6% 0 / 338 0.0% 14 / 645 2.2% 21 / 637 3.3% 0 / 597 0.0% 21 / 1,234 1.7% 9 / 849 1.1% 0 / 697 0.0% 9 / 1,546 0.6% 1 / 326 0.3% 0 / 253 0.0% 1 / 579 0.2% 0 / 0 0 / 0 0 / 0 20-24 Male Female Total 63 / 375 16.8%
3 / 739 0.4% 66 / 1,114 5.9% 59 / 587 10.1% 0 / 595 0.0% 59 / 1,182 5.0% 39 / 630 6.2% 0 / 469 0.0% 41 / 1,099 3.7% 15 / 464 3.2% 0 / 215 0.0% 15 / 679 2.2% 0 / 29 0.0% 0 / 12 0.0% 0 / 41 0.0% 25-29 Male Female Total 149 / 528 28.2% 4 / 1,012 0.4% 153 / 1,540 9.9% 133 / 594 22.4% 1 / 547 0.2% 134 / 1,141 11.7% 78 / 480 16.3% 1 / 327 0.3% 77 / 807 9.5% 35 / 384 9.1% 0 / 150 0.0% 35 / 534 6.6% 2 / 32 6.3% 0 / 12 0.0% 2 / 44 4.5% 30-34 Male Female Total 2234 / 554 40.3% 4 / 965 0.4% 227 / 1,519 14.9% 153 / 459 33.3% 1 / 410 0.2% 154 / 869 17.7% 91 / 341 26.7% 1 / 177 0.6% 90 / 518 17.4% 56 / 290 19.3% 1 / 76 1.3% 57 / 366 15.6% 0 / 28 0.0% 0 / 1 0.0% 0 / 29 0.0% 35-39 Male Female Total 3157 / 663 47.5% 5 / 1,213 0.4% 320 / 1,876 17.1% 240 / 536 44.8% 2 / 430 0.5% 242 / 966 25.1% 93 / 280 33.2% 0 / 147 0.0% 93 / 427 21.8% 38 / 209 18.2% 1 / 58 1.7% 39 / 267 14.6% 4 / 21 19.0% 0 / 3 0.0%
4 / 24 16.7% 40-44 Male Female Total 377 / 728 51.8% 9 / 1,005 0.9% 386 / 1,733 22.3% 213 / 453 47.0% 3 / 362 0.8% 216 / 815 26.5% 92 / 224 41.1% 2 / 92 2.2% 94 / 316 29.7% 44 / 173 25.4% 2 / 29 6.9% 46 / 202 22.8% 0 / 9 0.0% 0 / 5 0.0% 0 / 14 0.0% 45-49 Male Female Total 345 / 630 54.8% 9 / 858 1.0% 354 / 1,488 23.8% 257 / 466 55.2% 2 / 249 0.8% 259 / 715 36.2% 91 / 246 37.0% 0 / 59 0.0% 89 / 305 29.2% 42 / 137 30.7% 1 / 14 7.1% 43 / 151 28.5% 2 / 13 15.4% 0 / 0 2 / 13 15.4% 50-54 Male Female Total 367 / 650 56.5% 14 / 899 1.6% 381 / 1,549 24.6% 168 / 332 50.6% 0 / 147 0.0% 168 / 479 35.1% 55 / 138 39.9% 2 / 34 5.9% 55 / 172 32.0% 28 / 86 32.6% 0 / 8 0.0% 28 / 94 29.8% 1 / 12 8.3% 0 / 2 0.0% 1 / 14 7.1% 55-59 Male Female Total 213 / 352 60.5% 8 / 438 1.8% 221 / 790 28.0% 118 / 211 55.9% 0 / 67 0.0% 118 / 278 42.4% 35 / 90 38.9% 0 / 13 0.0%
35 / 103 34.0% 10 / 41 24.4% 0 / 13 0.0% 10 / 54 18.5% 0 / 1 0.0% 0 / 0 0 / 1 0.0% 60-64 Male Female Total 335 / 562 59.6% 7 / 712 1.0% 342 / 1,274 26.8% 109 / 225 48.4% 1 / 80 1.3% 110 / 305 36.1% 40 / 75 53.3% 1 / 11 9.1% 37 / 86 43.0% 6 / 33 18.2% 0 / 3 0.0% 6 / 36 16.7% 2 / 5 40.0% 0 / 0 2 / 5 40.0% 65-69 Male Female Total 128 / 235 54.5% 5 / 276 1.8% 133 / 511 26.0% 51 / 109 46.8% 0 / 29 0.0% 51 / 138 37.0% 12 / 38 31.6% 1 / 6 16.7% 12 / 44 27.3% 4 / 16 25.0% 0 / 0 4 / 16 25.0% 0 / 0 0 / 0 0 / 0 70+ Male Female Total 185 / 448 41.3% 7 / 509 1.4% 192 / 957 20.1% 44 / 162 27.2% 0 / 29 0.0% 44 / 191 23.0% 11 / 44 25.0% 0 / 2 0.0% 11 / 46 23.9% 2 / 18 11.1% 0 / 2 0.0% 2 / 20 10.0% 0 / 2 0.0% 0 / 0 0 / 2 0.0% All Ages Male Female Total 2,715 / 6,117 44.4% 75 / 9,068 0.8%

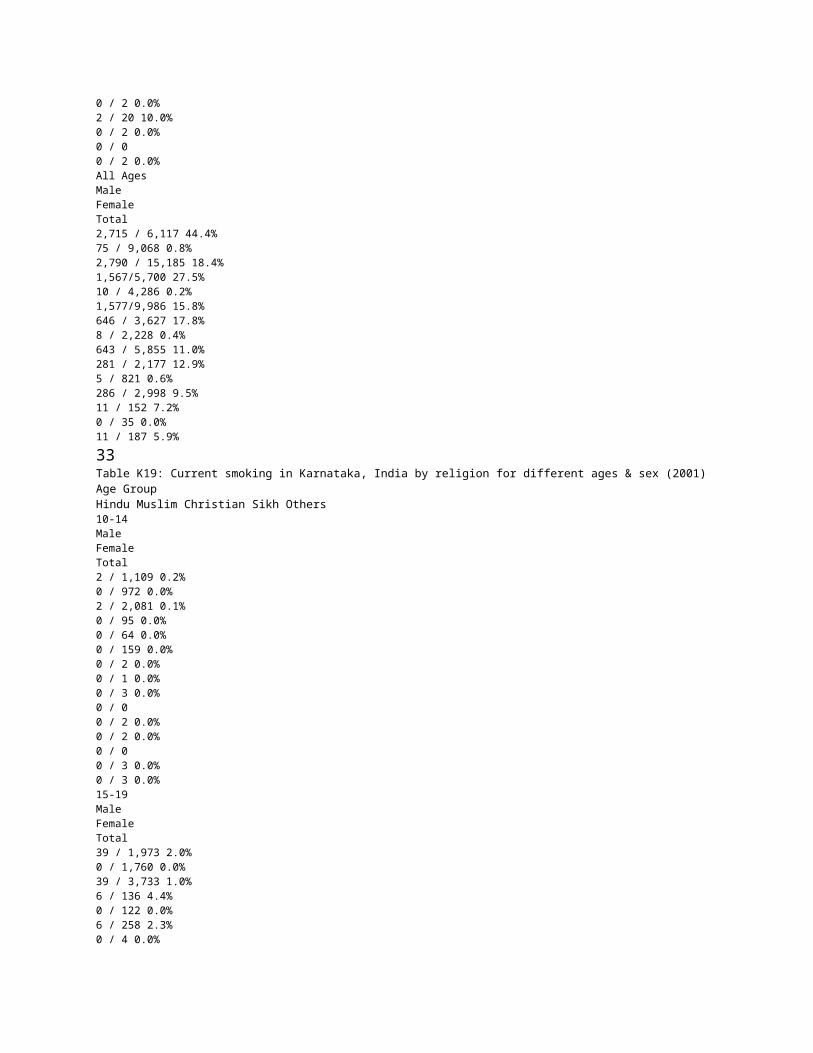
2,790 / 15,185 18.4% 1,567/5,700 27.5% 10 / 4,286 0.2% 1,577/9,986 15.8% 646 / 3,627 17.8% 8 / 2,228 0.4% 643 / 5,855 11.0% 281 / 2,177 12.9% 5 / 821 0.6% 286 / 2,998 9.5% 11 / 152 7.2% 0 / 35 0.0% 11 / 187 5.9%
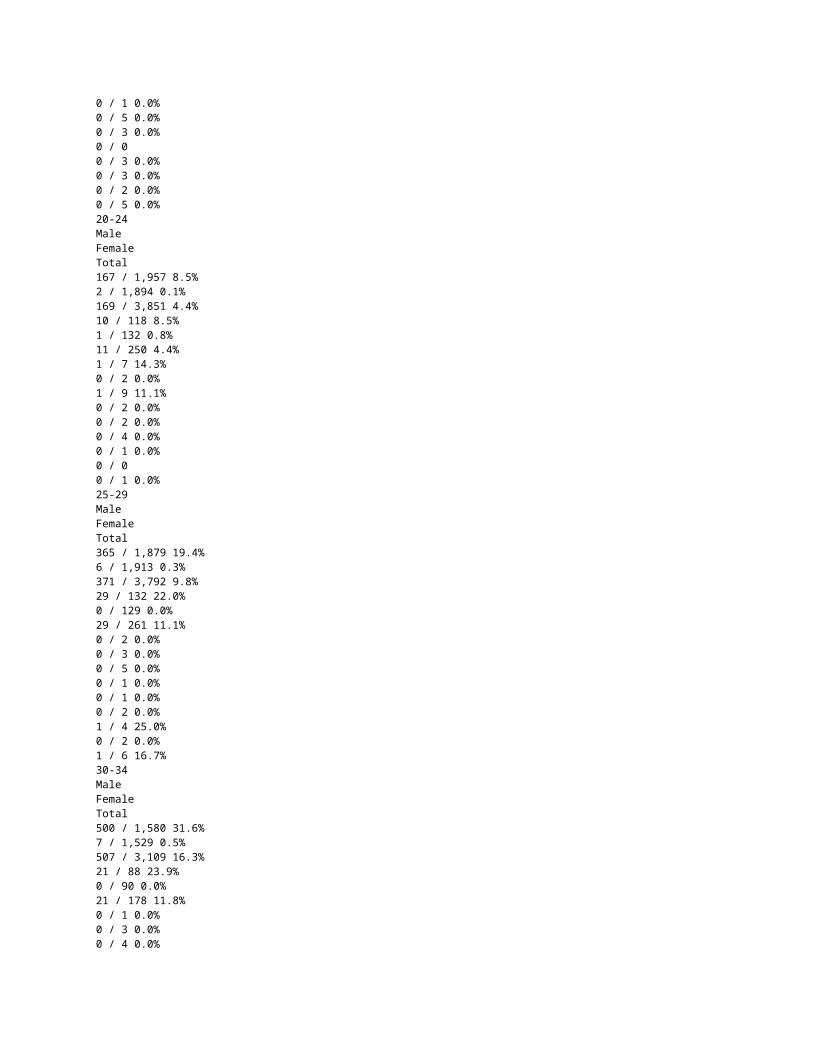
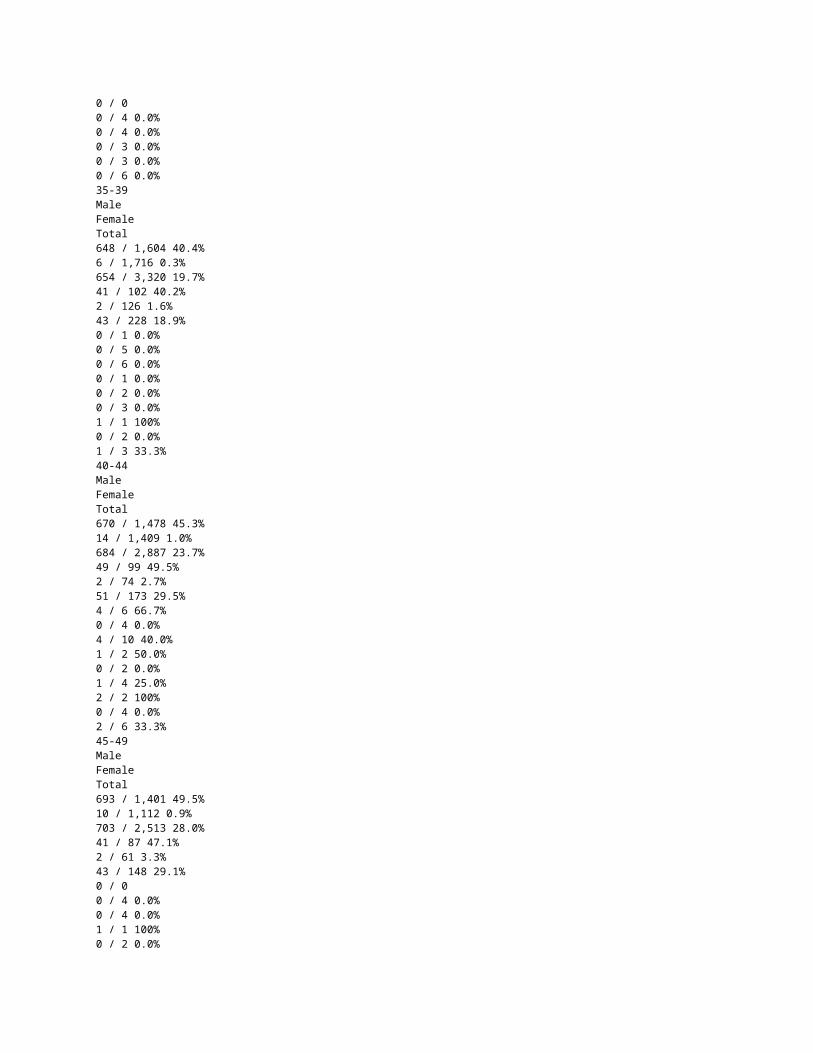
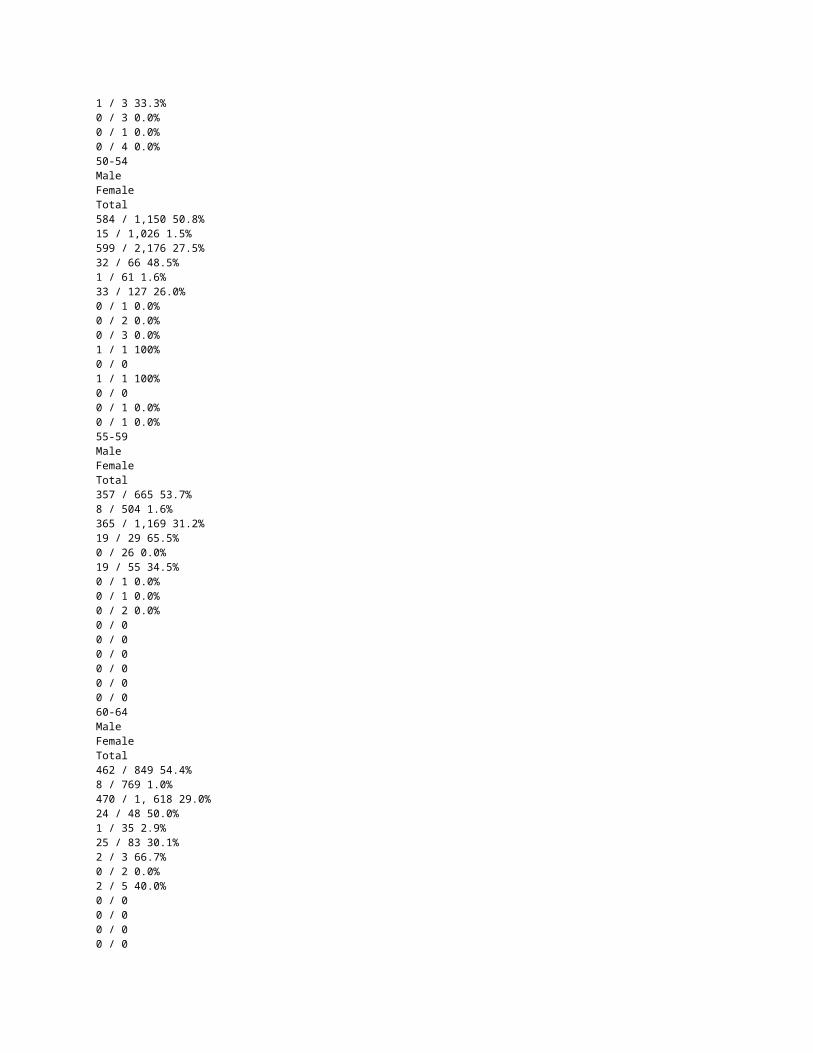
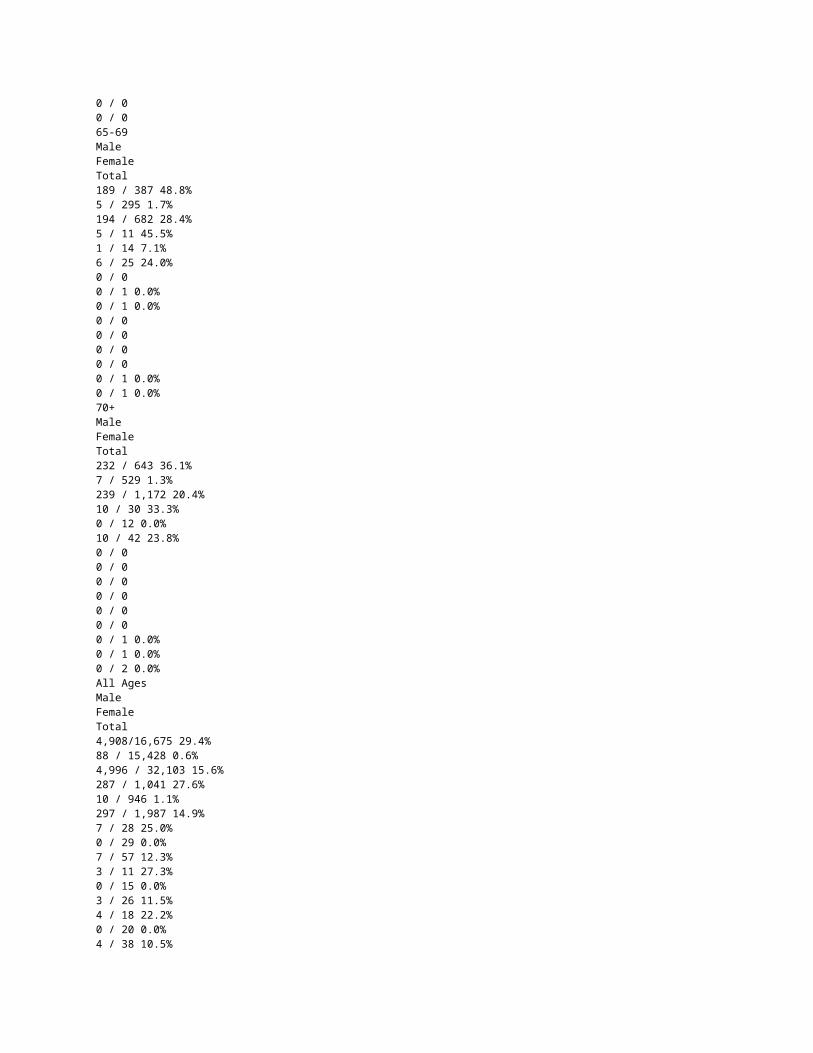
33Table K19: Current smoking in Karnataka, India by religion for different ages & sex (2001) Age Group Hindu Muslim Christian Sikh Others 10-14 Male Female Total 2 / 1,109 0.2% 0 / 972 0.0% 2 / 2,081 0.1% 0 / 95 0.0% 0 / 64 0.0% 0 / 159 0.0% 0 / 2 0.0% 0 / 1 0.0% 0 / 3 0.0% 0 / 0 0 / 2 0.0% 0 / 2 0.0% 0 / 0 0 / 3 0.0% 0 / 3 0.0% 15-19 Male Female Total 39 / 1,973 2.0% 0 / 1,760 0.0% 39 / 3,733 1.0% 6 / 136 4.4% 0 / 122 0.0% 6 / 258 2.3% 0 / 4 0.0% 0 / 1 0.0% 0 / 5 0.0% 0 / 3 0.0% 0 / 0 0 / 3 0.0% 0 / 3 0.0% 0 / 2 0.0% 0 / 5 0.0% 20-24 Male Female Total 167 / 1,957 8.5% 2 / 1,894 0.1% 169 / 3,851 4.4% 10 / 118 8.5% 1 / 132 0.8% 11 / 250 4.4% 1 / 7 14.3% 0 / 2 0.0% 1 / 9 11.1% 0 / 2 0.0%

0 / 2 0.0% 0 / 4 0.0% 0 / 1 0.0% 0 / 0 0 / 1 0.0% 25-29 Male Female Total 365 / 1,879 19.4% 6 / 1,913 0.3% 371 / 3,792 9.8% 29 / 132 22.0% 0 / 129 0.0% 29 / 261 11.1% 0 / 2 0.0% 0 / 3 0.0% 0 / 5 0.0% 0 / 1 0.0% 0 / 1 0.0% 0 / 2 0.0% 1 / 4 25.0% 0 / 2 0.0% 1 / 6 16.7% 30-34 Male Female Total 500 / 1,580 31.6% 7 / 1,529 0.5% 507 / 3,109 16.3% 21 / 88 23.9% 0 / 90 0.0% 21 / 178 11.8% 0 / 1 0.0% 0 / 3 0.0% 0 / 4 0.0% 0 / 0 0 / 4 0.0% 0 / 4 0.0% 0 / 3 0.0% 0 / 3 0.0% 0 / 6 0.0% 35-39 Male Female Total 648 / 1,604 40.4% 6 / 1,716 0.3% 654 / 3,320 19.7% 41 / 102 40.2% 2 / 126 1.6% 43 / 228 18.9% 0 / 1 0.0% 0 / 5 0.0% 0 / 6 0.0% 0 / 1 0.0% 0 / 2 0.0% 0 / 3 0.0% 1 / 1 100% 0 / 2 0.0% 1 / 3 33.3% 40-44 Male Female Total 670 / 1,478 45.3% 14 / 1,409 1.0% 684 / 2,887 23.7% 49 / 99 49.5%

2 / 74 2.7% 51 / 173 29.5% 4 / 6 66.7% 0 / 4 0.0% 4 / 10 40.0% 1 / 2 50.0% 0 / 2 0.0% 1 / 4 25.0% 2 / 2 100% 0 / 4 0.0% 2 / 6 33.3% 45-49 Male Female Total 693 / 1,401 49.5% 10 / 1,112 0.9% 703 / 2,513 28.0% 41 / 87 47.1% 2 / 61 3.3% 43 / 148 29.1% 0 / 0 0 / 4 0.0% 0 / 4 0.0% 1 / 1 100% 0 / 2 0.0% 1 / 3 33.3% 0 / 3 0.0% 0 / 1 0.0% 0 / 4 0.0% 50-54 Male Female Total 584 / 1,150 50.8% 15 / 1,026 1.5% 599 / 2,176 27.5% 32 / 66 48.5% 1 / 61 1.6% 33 / 127 26.0% 0 / 1 0.0% 0 / 2 0.0% 0 / 3 0.0% 1 / 1 100% 0 / 0 1 / 1 100% 0 / 0 0 / 1 0.0% 0 / 1 0.0% 55-59 Male Female Total 357 / 665 53.7% 8 / 504 1.6% 365 / 1,169 31.2% 19 / 29 65.5% 0 / 26 0.0% 19 / 55 34.5% 0 / 1 0.0% 0 / 1 0.0% 0 / 2 0.0% 0 / 0 0 / 0 0 / 0 0 / 0 0 / 0 0 / 0 60-64 Male

Female Total 462 / 849 54.4% 8 / 769 1.0% 470 / 1, 618 29.0% 24 / 48 50.0% 1 / 35 2.9% 25 / 83 30.1% 2 / 3 66.7% 0 / 2 0.0% 2 / 5 40.0% 0 / 0 0 / 0 0 / 0 0 / 0 0 / 0 0 / 0 65-69 Male Female Total 189 / 387 48.8% 5 / 295 1.7% 194 / 682 28.4% 5 / 11 45.5% 1 / 14 7.1% 6 / 25 24.0% 0 / 0 0 / 1 0.0% 0 / 1 0.0% 0 / 0 0 / 0 0 / 0 0 / 0 0 / 1 0.0% 0 / 1 0.0% 70+ Male Female Total 232 / 643 36.1% 7 / 529 1.3% 239 / 1,172 20.4% 10 / 30 33.3% 0 / 12 0.0% 10 / 42 23.8% 0 / 0 0 / 0 0 / 0 0 / 0 0 / 0 0 / 0 0 / 1 0.0% 0 / 1 0.0% 0 / 2 0.0% All Ages Male Female Total 4,908/16,675 29.4% 88 / 15,428 0.6% 4,996 / 32,103 15.6% 287 / 1,041 27.6% 10 / 946 1.1% 297 / 1,987 14.9% 7 / 28 25.0% 0 / 29 0.0% 7 / 57 12.3% 3 / 11 27.3% 0 / 15 0.0%
3 / 26 11.5% 4 / 18 22.2% 0 / 20 0.0% 4 / 38 10.5%
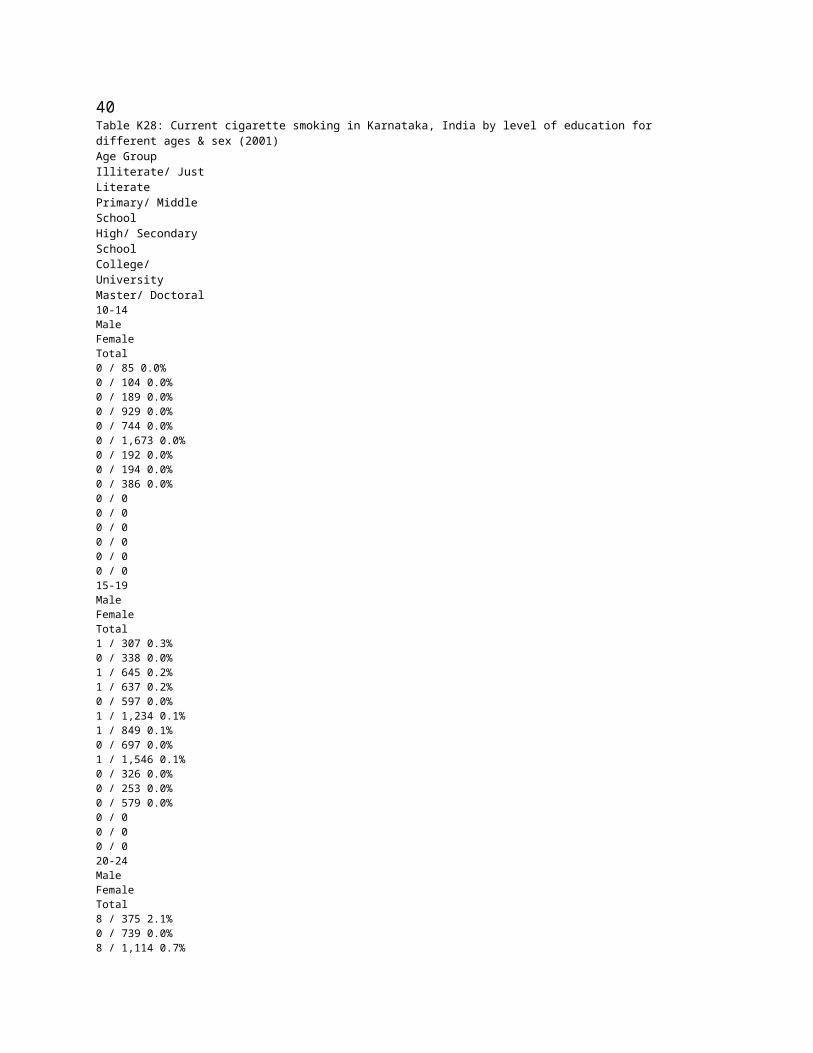
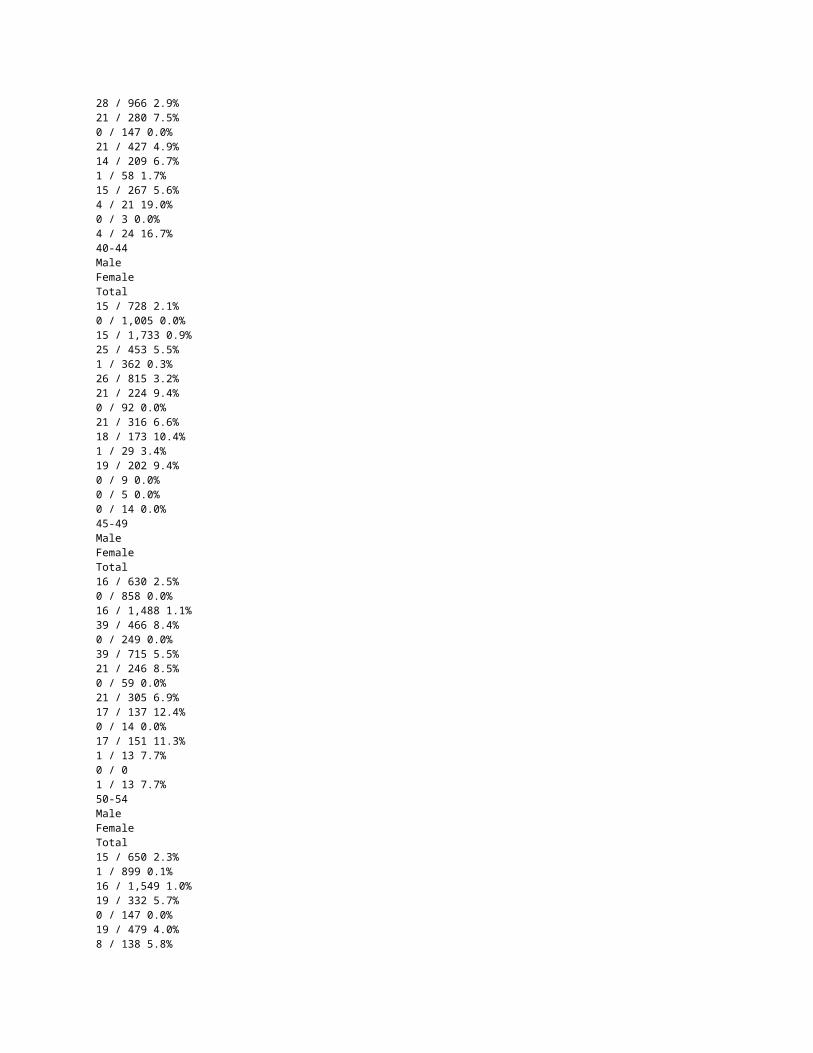
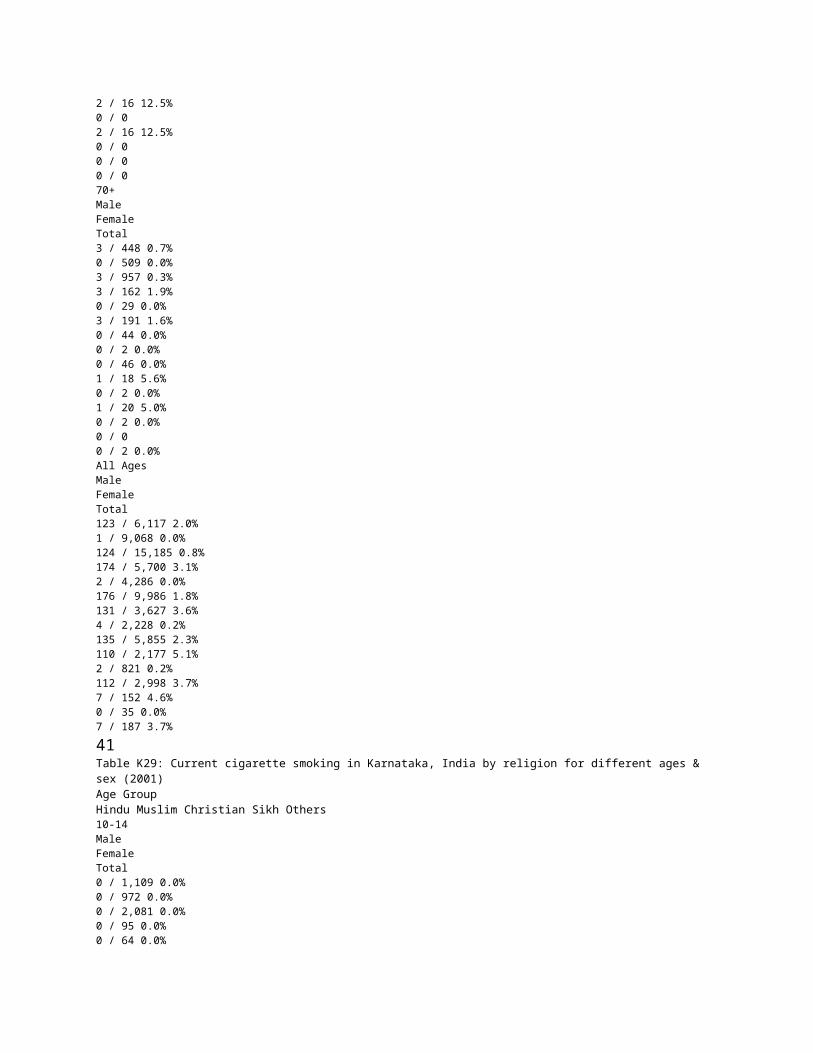
40 Table K28: Current cigarette smoking in Karnataka, India by level of education for different ages & sex (2001) Age Group Illiterate/ Just Literate Primary/ Middle School High/ Secondary School College/ University Master/ Doctoral 10-14 Male Female Total 0 / 85 0.0% 0 / 104 0.0% 0 / 189 0.0% 0 / 929 0.0% 0 / 744 0.0% 0 / 1,673 0.0% 0 / 192 0.0% 0 / 194 0.0% 0 / 386 0.0% 0 / 0 0 / 0 0 / 0 0 / 0 0 / 0 0 / 0 15-19 Male Female Total 1 / 307 0.3% 0 / 338 0.0% 1 / 645 0.2% 1 / 637 0.2% 0 / 597 0.0% 1 / 1,234 0.1% 1 / 849 0.1% 0 / 697 0.0% 1 / 1,546 0.1% 0 / 326 0.0% 0 / 253 0.0% 0 / 579 0.0% 0 / 0 0 / 0 0 / 0 20-24 Male Female Total 8 / 375 2.1% 0 / 739 0.0% 8 / 1,114 0.7% 10 / 588 1.7% 0 / 595 0.0% 10 / 1,182 0.8% 8 / 630 1.3% 0 / 469 0.0% 8 / 1,099 0.7% 4 / 464 0.9% 0 / 215 0.0%
4 / 679 0.6% 0 / 29 0.0% 0 / 12 0.0% 0 / 41 0.0% 25-29 Male Female Total 4 / 528 0.8% 0 / 1,012 0.0% 4 / 1,540 0.3% 13 / 594 2.2% 0 / 547 0.0% 13 / 1,141 1.1% 17 / 480 3.5% 1 / 327 0.3% 18 / 807 2.2% 12 / 384 3.1% 0 / 150 0.0% 12 / 534 2.2% 2 / 32 6.3% 0 / 12 0.0% 2 / 44 4.5% 30-34 Male Female Total 13 / 554 2.3% 0 / 965 0.0% 13 / 1,519 0.9% 16 / 459 3.5% 1 / 410 0.2% 17 / 869 2.0% 20 / 341 5.9% 1 / 177 0.6% 21 / 518 4.1% 21 / 290 7.2% 0 / 76 0.0% 21 / 366 5.7% 0 / 28 0.0% 0 / 1 0.0% 0 / 29 0.0% 35-39 Male Female Total 25 / 663 3.8% 0 / 1,213 0.0% 25 / 1,876 1.3% 28 / 536 5.2% 0 / 430 0.0% 28 / 966 2.9% 21 / 280 7.5% 0 / 147 0.0% 21 / 427 4.9% 14 / 209 6.7% 1 / 58 1.7% 15 / 267 5.6% 4 / 21 19.0% 0 / 3 0.0% 4 / 24 16.7% 40-44 Male Female Total 15 / 728 2.1% 0 / 1,005 0.0% 15 / 1,733 0.9% 25 / 453 5.5% 1 / 362 0.3%
26 / 815 3.2% 21 / 224 9.4% 0 / 92 0.0% 21 / 316 6.6% 18 / 173 10.4% 1 / 29 3.4% 19 / 202 9.4% 0 / 9 0.0% 0 / 5 0.0% 0 / 14 0.0% 45-49 Male Female Total 16 / 630 2.5% 0 / 858 0.0% 16 / 1,488 1.1% 39 / 466 8.4% 0 / 249 0.0% 39 / 715 5.5% 21 / 246 8.5% 0 / 59 0.0% 21 / 305 6.9% 17 / 137 12.4% 0 / 14 0.0% 17 / 151 11.3% 1 / 13 7.7% 0 / 0 1 / 13 7.7% 50-54 Male Female Total 15 / 650 2.3% 1 / 899 0.1% 16 / 1,549 1.0% 19 / 332 5.7% 0 / 147 0.0% 19 / 479 4.0% 8 / 138 5.8% 0 / 34 0.0% 8 / 172 4.7% 10 / 86 11.6% 0 / 8 0.0% 10 / 94 10.6% 0 / 12 0.0% 0 / 2 0.0% 0 / 14 0.0% 55-59 Male Female Total 6 / 352 1.7% 0 / 438 0.0% 6 / 790 0.8% 10 / 211 4.7% 0 / 67 0.0% 10 / 278 3.6% 8 / 90 8.9% 0 / 13 0.0% 8 / 103 7.8% 8 / 41 19.5% 0 / 13 0.0% 8 / 54 14.8% 0 / 1 0.0% 0 / 0 0 / 1 0.0% 60-64 Male Female
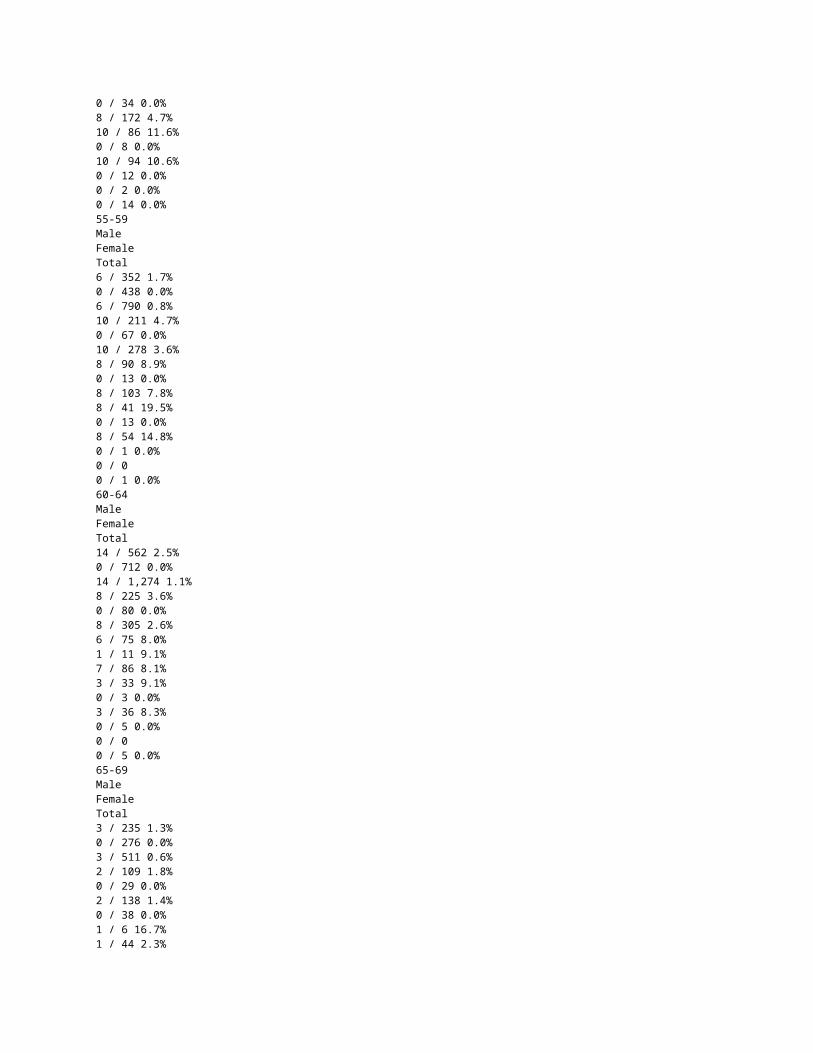
Total 14 / 562 2.5% 0 / 712 0.0% 14 / 1,274 1.1% 8 / 225 3.6% 0 / 80 0.0% 8 / 305 2.6% 6 / 75 8.0% 1 / 11 9.1% 7 / 86 8.1% 3 / 33 9.1% 0 / 3 0.0% 3 / 36 8.3% 0 / 5 0.0% 0 / 0 0 / 5 0.0% 65-69 Male Female Total 3 / 235 1.3% 0 / 276 0.0% 3 / 511 0.6% 2 / 109 1.8% 0 / 29 0.0% 2 / 138 1.4% 0 / 38 0.0% 1 / 6 16.7% 1 / 44 2.3% 2 / 16 12.5% 0 / 0 2 / 16 12.5% 0 / 0 0 / 0 0 / 0 70+ Male Female Total 3 / 448 0.7% 0 / 509 0.0% 3 / 957 0.3% 3 / 162 1.9% 0 / 29 0.0% 3 / 191 1.6% 0 / 44 0.0% 0 / 2 0.0% 0 / 46 0.0% 1 / 18 5.6% 0 / 2 0.0% 1 / 20 5.0% 0 / 2 0.0% 0 / 0 0 / 2 0.0% All Ages Male Female Total 123 / 6,117 2.0% 1 / 9,068 0.0% 124 / 15,185 0.8% 174 / 5,700 3.1% 2 / 4,286 0.0% 176 / 9,986 1.8% 131 / 3,627 3.6% 4 / 2,228 0.2% 135 / 5,855 2.3% 110 / 2,177 5.1% 2 / 821 0.2% 112 / 2,998 3.7%
7 / 152 4.6% 0 / 35 0.0% 7 / 187 3.7%
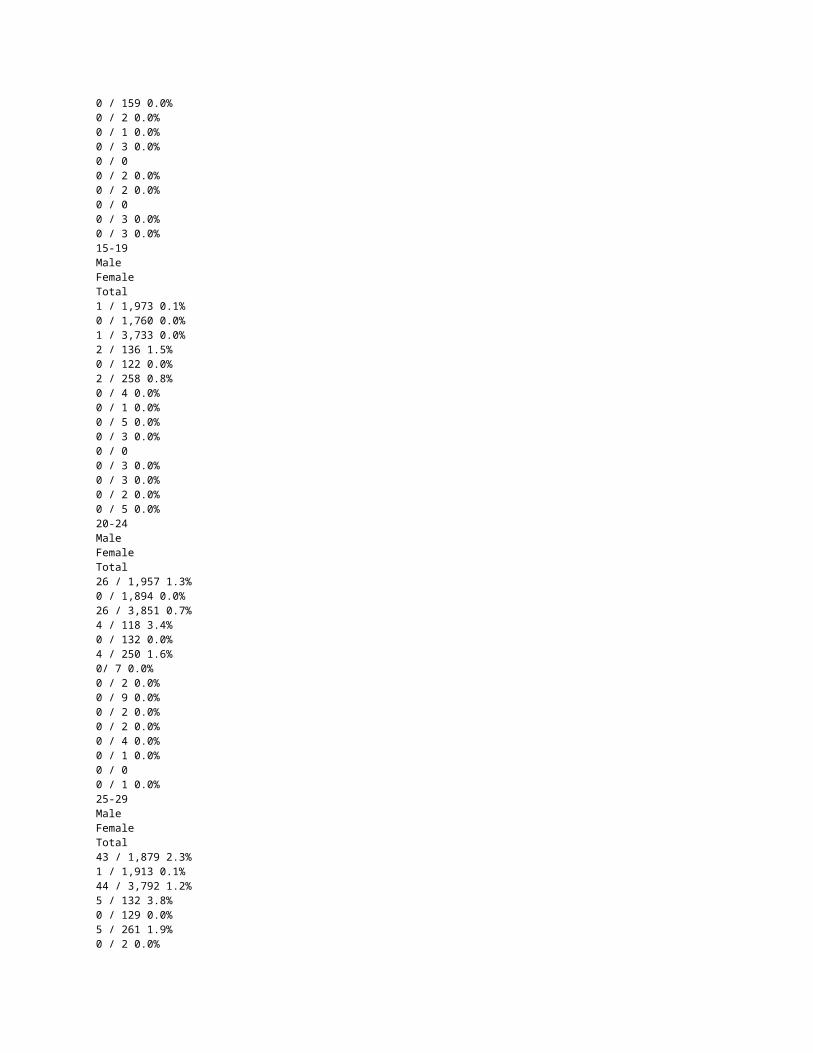
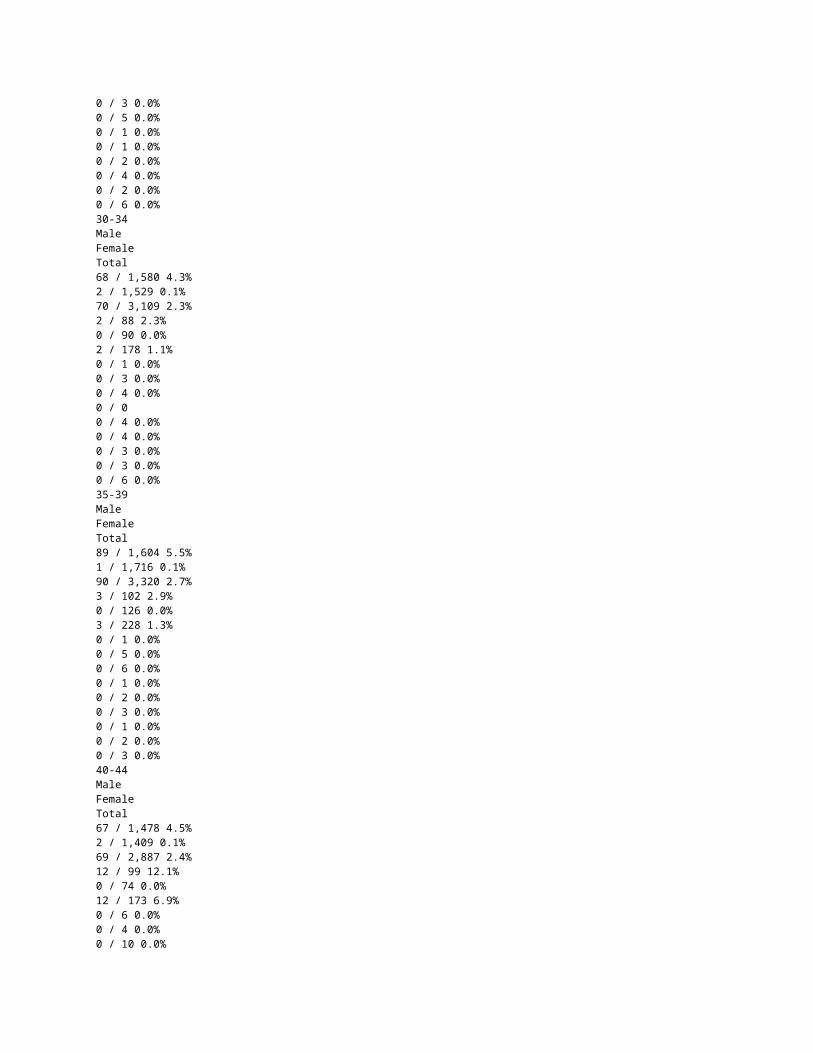
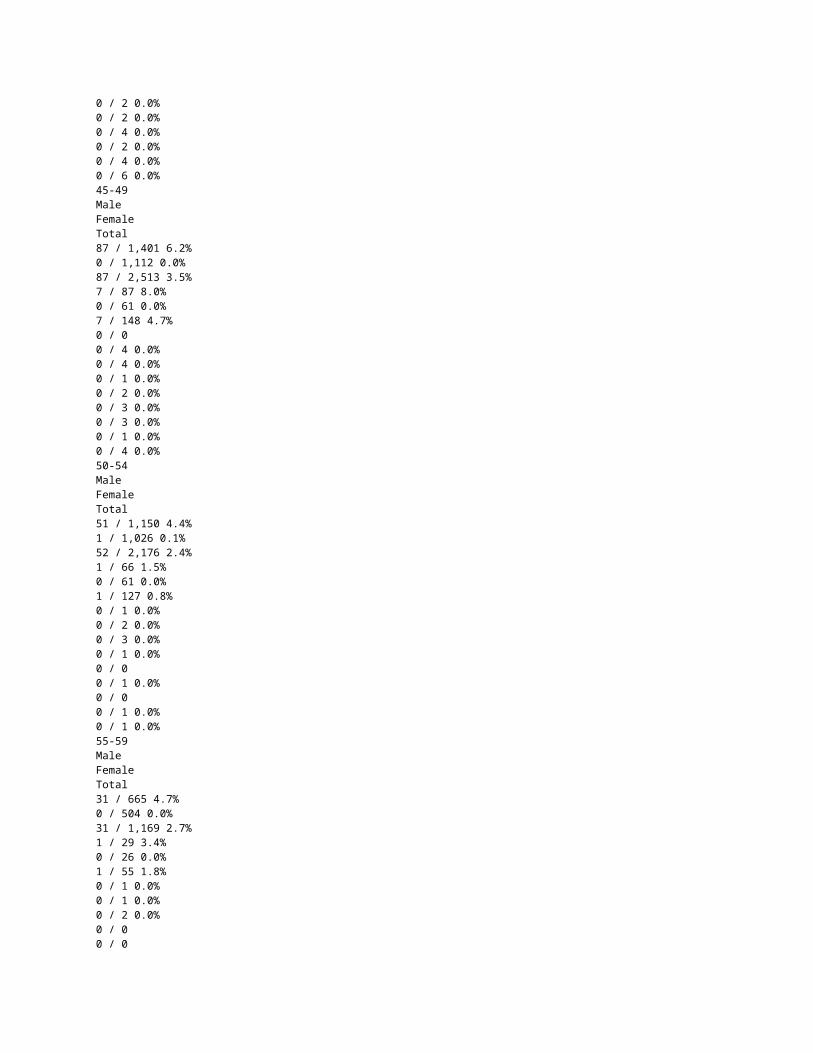
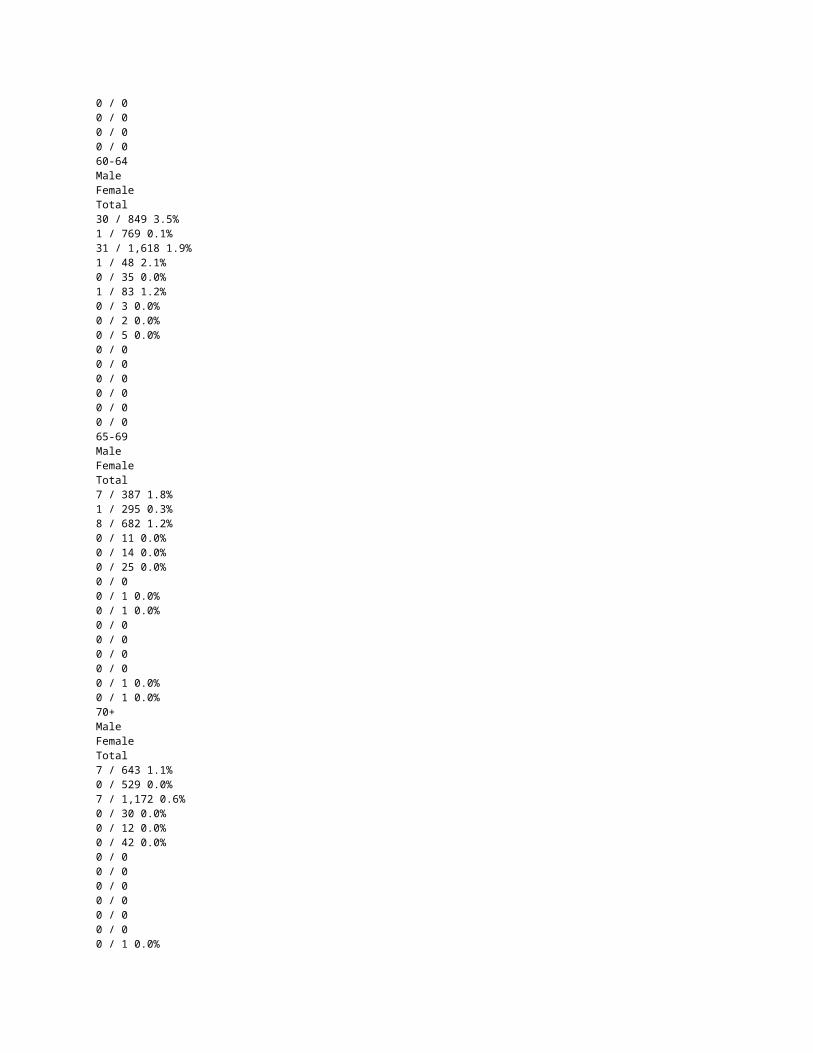
41Table K29: Current cigarette smoking in Karnataka, India by religion for different ages & sex (2001) Age Group Hindu Muslim Christian Sikh Others 10-14 Male Female Total 0 / 1,109 0.0% 0 / 972 0.0% 0 / 2,081 0.0% 0 / 95 0.0% 0 / 64 0.0% 0 / 159 0.0% 0 / 2 0.0% 0 / 1 0.0% 0 / 3 0.0% 0 / 0 0 / 2 0.0% 0 / 2 0.0% 0 / 0 0 / 3 0.0% 0 / 3 0.0% 15-19 Male Female Total 1 / 1,973 0.1% 0 / 1,760 0.0% 1 / 3,733 0.0% 2 / 136 1.5% 0 / 122 0.0% 2 / 258 0.8% 0 / 4 0.0% 0 / 1 0.0% 0 / 5 0.0% 0 / 3 0.0% 0 / 0 0 / 3 0.0% 0 / 3 0.0% 0 / 2 0.0% 0 / 5 0.0% 20-24 Male Female Total 26 / 1,957 1.3% 0 / 1,894 0.0% 26 / 3,851 0.7% 4 / 118 3.4% 0 / 132 0.0% 4 / 250 1.6% 0/ 7 0.0% 0 / 2 0.0% 0 / 9 0.0% 0 / 2 0.0% 0 / 2 0.0% 0 / 4 0.0% 0 / 1 0.0% 0 / 0 0 / 1 0.0% 25-29 Male Female Total 43 / 1,879 2.3%
1 / 1,913 0.1% 44 / 3,792 1.2% 5 / 132 3.8% 0 / 129 0.0% 5 / 261 1.9% 0 / 2 0.0% 0 / 3 0.0% 0 / 5 0.0% 0 / 1 0.0% 0 / 1 0.0% 0 / 2 0.0% 0 / 4 0.0% 0 / 2 0.0% 0 / 6 0.0% 30-34 Male Female Total 68 / 1,580 4.3% 2 / 1,529 0.1% 70 / 3,109 2.3% 2 / 88 2.3% 0 / 90 0.0% 2 / 178 1.1% 0 / 1 0.0% 0 / 3 0.0% 0 / 4 0.0% 0 / 0 0 / 4 0.0% 0 / 4 0.0% 0 / 3 0.0% 0 / 3 0.0% 0 / 6 0.0% 35-39 Male Female Total 89 / 1,604 5.5% 1 / 1,716 0.1% 90 / 3,320 2.7% 3 / 102 2.9% 0 / 126 0.0% 3 / 228 1.3% 0 / 1 0.0% 0 / 5 0.0% 0 / 6 0.0% 0 / 1 0.0% 0 / 2 0.0% 0 / 3 0.0% 0 / 1 0.0% 0 / 2 0.0% 0 / 3 0.0% 40-44 Male Female Total 67 / 1,478 4.5% 2 / 1,409 0.1% 69 / 2,887 2.4% 12 / 99 12.1% 0 / 74 0.0% 12 / 173 6.9% 0 / 6 0.0% 0 / 4 0.0% 0 / 10 0.0% 0 / 2 0.0% 0 / 2 0.0% 0 / 4 0.0% 0 / 2 0.0% 0 / 4 0.0%

0 / 6 0.0% 45-49 Male Female Total 87 / 1,401 6.2% 0 / 1,112 0.0% 87 / 2,513 3.5% 7 / 87 8.0% 0 / 61 0.0% 7 / 148 4.7% 0 / 0 0 / 4 0.0% 0 / 4 0.0% 0 / 1 0.0% 0 / 2 0.0% 0 / 3 0.0% 0 / 3 0.0% 0 / 1 0.0% 0 / 4 0.0% 50-54 Male Female Total 51 / 1,150 4.4% 1 / 1,026 0.1% 52 / 2,176 2.4% 1 / 66 1.5% 0 / 61 0.0% 1 / 127 0.8% 0 / 1 0.0% 0 / 2 0.0% 0 / 3 0.0% 0 / 1 0.0% 0 / 0 0 / 1 0.0% 0 / 0 0 / 1 0.0% 0 / 1 0.0% 55-59 Male Female Total 31 / 665 4.7% 0 / 504 0.0% 31 / 1,169 2.7% 1 / 29 3.4% 0 / 26 0.0% 1 / 55 1.8% 0 / 1 0.0% 0 / 1 0.0% 0 / 2 0.0% 0 / 0 0 / 0 0 / 0 0 / 0 0 / 0 0 / 0 60-64 Male Female Total 30 / 849 3.5% 1 / 769 0.1% 31 / 1,618 1.9% 1 / 48 2.1% 0 / 35 0.0% 1 / 83 1.2% 0 / 3 0.0% 0 / 2 0.0%
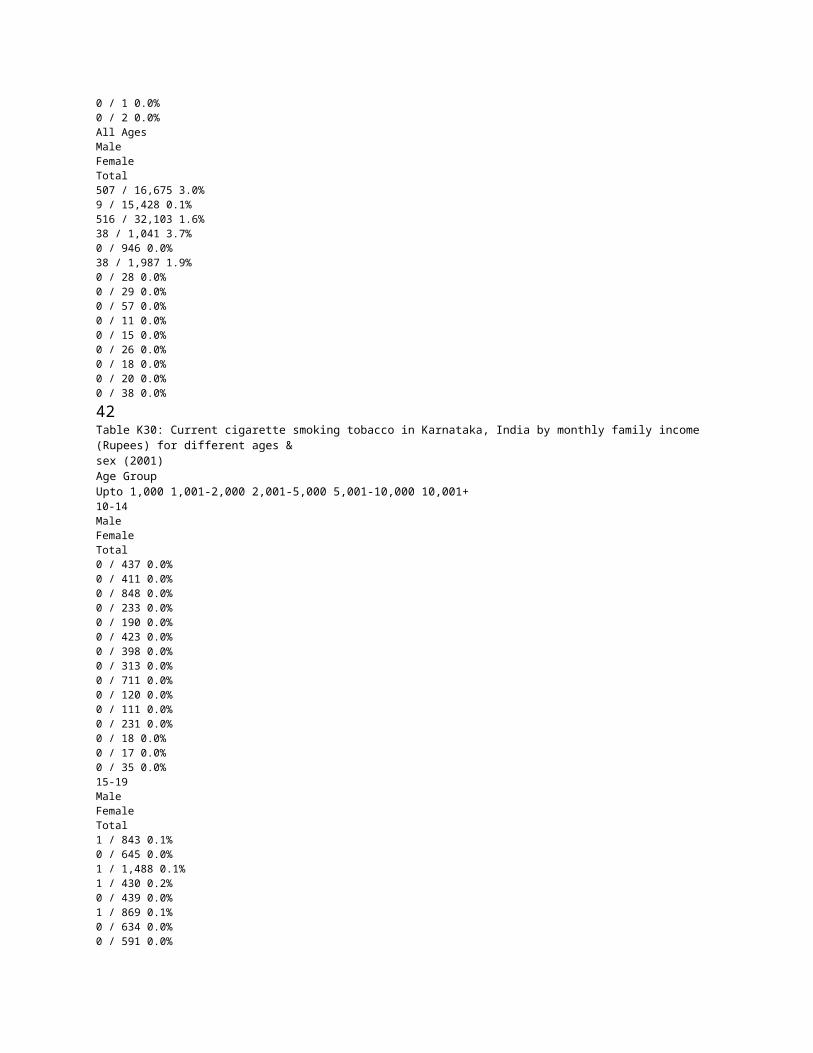
0 / 5 0.0% 0 / 0 0 / 0 0 / 0 0 / 0 0 / 0 0 / 0 65-69 Male Female Total 7 / 387 1.8% 1 / 295 0.3% 8 / 682 1.2% 0 / 11 0.0% 0 / 14 0.0% 0 / 25 0.0% 0 / 0 0 / 1 0.0% 0 / 1 0.0% 0 / 0 0 / 0 0 / 0 0 / 0 0 / 1 0.0% 0 / 1 0.0% 70+ Male Female Total 7 / 643 1.1% 0 / 529 0.0% 7 / 1,172 0.6% 0 / 30 0.0% 0 / 12 0.0% 0 / 42 0.0% 0 / 0 0 / 0 0 / 0 0 / 0 0 / 0 0 / 0 0 / 1 0.0% 0 / 1 0.0% 0 / 2 0.0% All Ages Male Female Total 507 / 16,675 3.0% 9 / 15,428 0.1% 516 / 32,103 1.6% 38 / 1,041 3.7% 0 / 946 0.0% 38 / 1,987 1.9% 0 / 28 0.0% 0 / 29 0.0% 0 / 57 0.0% 0 / 11 0.0% 0 / 15 0.0% 0 / 26 0.0% 0 / 18 0.0% 0 / 20 0.0% 0 / 38 0.0%
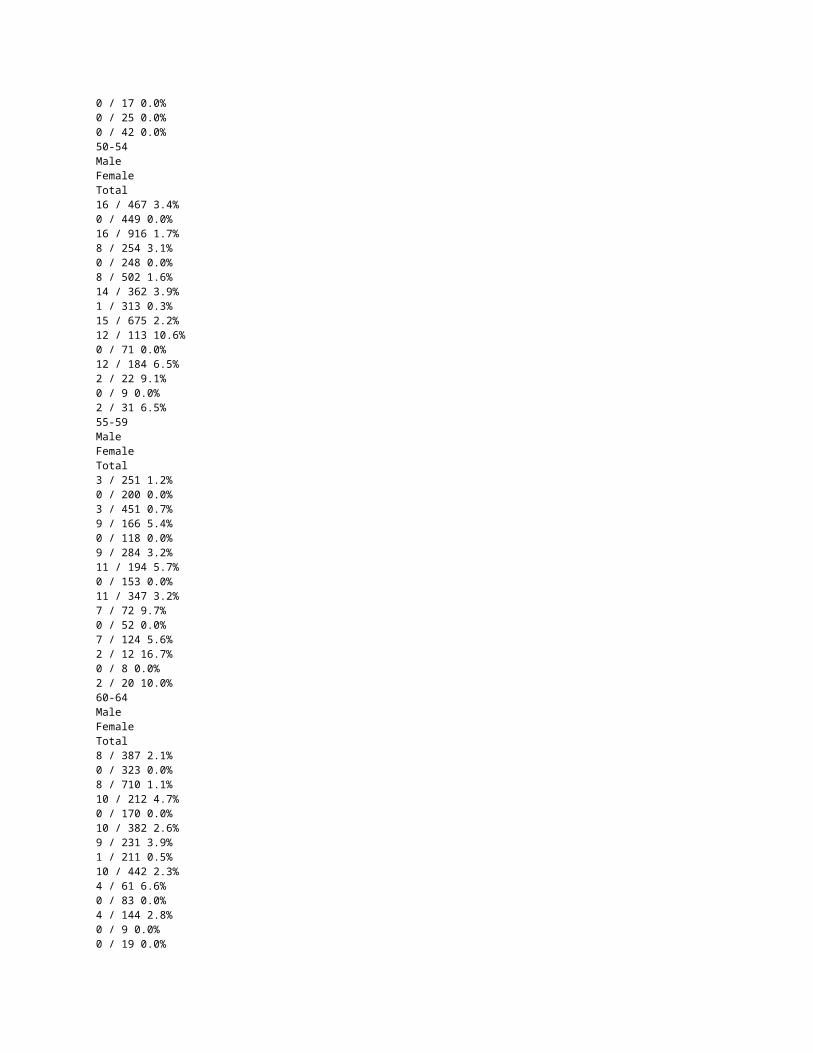
42 Table K30: Current cigarette smoking tobacco in Karnataka, India by monthly family income (Rupees) for different ages & sex (2001) Age Group Upto 1,000 1,001-2,000 2,001-5,000 5,001-10,000 10,001+
10-14 Male Female Total 0 / 437 0.0% 0 / 411 0.0% 0 / 848 0.0% 0 / 233 0.0% 0 / 190 0.0% 0 / 423 0.0% 0 / 398 0.0% 0 / 313 0.0% 0 / 711 0.0% 0 / 120 0.0% 0 / 111 0.0% 0 / 231 0.0% 0 / 18 0.0% 0 / 17 0.0% 0 / 35 0.0% 15-19 Male Female Total 1 / 843 0.1% 0 / 645 0.0% 1 / 1,488 0.1% 1 / 430 0.2% 0 / 439 0.0% 1 / 869 0.1% 0 / 634 0.0% 0 / 591 0.0% 0 / 1,225 0.0% 1 / 192 0.5% 0 / 193 0.0% 1 / 385 0.3% 0 / 20 0.0% 0 / 17 0.0% 0 / 37 0.0% 20-24 Male Female Total 10 / 711 1.4% 0 / 746 0.0% 10 / 1,457 0.7% 8 / 497 1.6% 0 / 425 0.0% 8 / 922 0.9% 6 / 629 1.0% 0 / 612 0.0% 6 / 1,241 0.5% 5 / 207 2.4% 0 / 209 0.0% 5 / 416 1.2% 1 / 41 2.4% 0 / 38 0.0% 1 / 79 1.3% 25-29 Male Female Total 13 / 782 1.7% 0 / 851 0.0% 13 / 1,633 0.8% 9 / 446 2.0% 0 / 450 0.0% 9 / 896 1.0% 20 / 577 3.5% 1 / 572 0.2% 21 / 1,149 1.8%
4 / 171 2.3% 0 / 142 0.0% 4 / 313 1.3% 2 / 42 4.8% 0 / 33 0.0% 2 / 75 2.7% 30-34 Male Female Total 23 / 672 3.4% 0 / 654 0.0% 23 / 1,326 1.7% 17 / 355 4.8% 1 / 349 0.3% 18 / 704 2.6% 24 / 478 5.0% 1 / 456 0.2% 25 / 934 2.7% 5 / 138 3.6% 0 / 137 0.0% 5 / 275 1.8% 1 / 29 3.4% 0 / 33 0.0% 1 / 62 1.6% 35-39 Male Female Total 26 / 657 4.0% 0 / 801 0.0% 26 / 1,458 1.8% 20 / 394 5.1% 0 / 360 0.0% 20 / 754 2.7% 33 / 474 7.0% 0 / 510 0.0% 33 / 984 3.4% 11 / 148 7.4% 1 / 157 0.6% 12 / 305 3.9% 2 / 36 5.6% 0 / 23 0.0% 2 / 59 3.4% 40-44 Male Female Total 26 / 682 3.8% 1 / 559 0.2% 27 / 1,241 2.2% 9 / 307 2.9% 0 / 322 0.0% 9 / 629 1.4% 28 / 450 6.2% 1 / 459 0.2% 29 / 909 3.2% 14 / 123 11.4% 0 / 132 0.0% 14 / 255 5.5% 2 / 25 8.0% 0 / 21 0.0% 2 / 46 4.3% 45-49 Male Female Total 21 / 567 3.7% 0 / 465 0.0% 21 / 1,032 2.0%
24 / 299 8.0% 0 / 261 0.0% 24 / 560 4.3% 35 / 476 7.4% 0 / 321 0.0% 35 / 797 4.4% 14 / 133 10.5% 0 / 108 0.0% 14 / 241 5.8% 0 / 17 0.0% 0 / 25 0.0% 0 / 42 0.0% 50-54 Male Female Total 16 / 467 3.4% 0 / 449 0.0% 16 / 916 1.7% 8 / 254 3.1% 0 / 248 0.0% 8 / 502 1.6% 14 / 362 3.9% 1 / 313 0.3% 15 / 675 2.2% 12 / 113 10.6% 0 / 71 0.0% 12 / 184 6.5% 2 / 22 9.1% 0 / 9 0.0% 2 / 31 6.5% 55-59 Male Female Total 3 / 251 1.2% 0 / 200 0.0% 3 / 451 0.7% 9 / 166 5.4% 0 / 118 0.0% 9 / 284 3.2% 11 / 194 5.7% 0 / 153 0.0% 11 / 347 3.2% 7 / 72 9.7% 0 / 52 0.0% 7 / 124 5.6% 2 / 12 16.7% 0 / 8 0.0% 2 / 20 10.0% 60-64 Male Female Total 8 / 387 2.1% 0 / 323 0.0% 8 / 710 1.1% 10 / 212 4.7% 0 / 170 0.0% 10 / 382 2.6% 9 / 231 3.9% 1 / 211 0.5% 10 / 442 2.3% 4 / 61 6.6% 0 / 83 0.0% 4 / 144 2.8% 0 / 9 0.0% 0 / 19 0.0% 0 / 28 0.0% 65-69
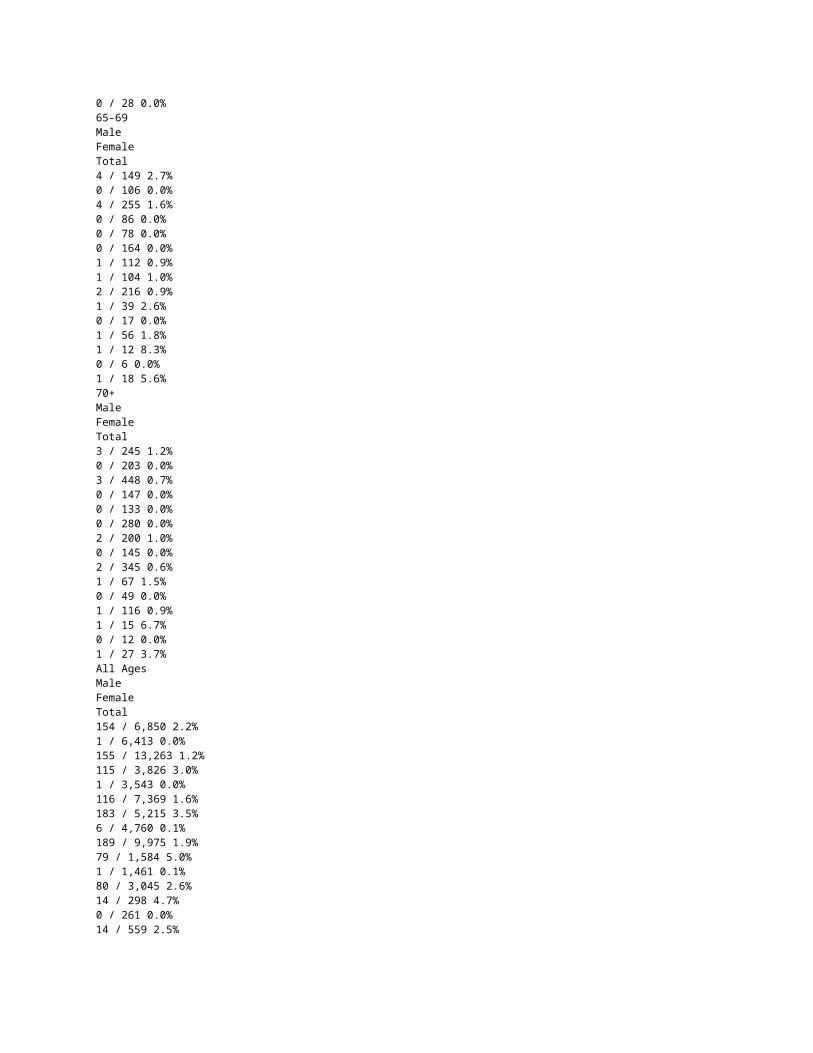
Male Female Total 4 / 149 2.7% 0 / 106 0.0% 4 / 255 1.6% 0 / 86 0.0% 0 / 78 0.0% 0 / 164 0.0% 1 / 112 0.9% 1 / 104 1.0% 2 / 216 0.9% 1 / 39 2.6% 0 / 17 0.0% 1 / 56 1.8% 1 / 12 8.3% 0 / 6 0.0% 1 / 18 5.6% 70+ Male Female Total 3 / 245 1.2% 0 / 203 0.0% 3 / 448 0.7% 0 / 147 0.0% 0 / 133 0.0% 0 / 280 0.0% 2 / 200 1.0% 0 / 145 0.0% 2 / 345 0.6% 1 / 67 1.5% 0 / 49 0.0% 1 / 116 0.9% 1 / 15 6.7% 0 / 12 0.0% 1 / 27 3.7% All Ages Male Female Total 154 / 6,850 2.2% 1 / 6,413 0.0% 155 / 13,263 1.2% 115 / 3,826 3.0% 1 / 3,543 0.0% 116 / 7,369 1.6% 183 / 5,215 3.5% 6 / 4,760 0.1% 189 / 9,975 1.9% 79 / 1,584 5.0% 1 / 1,461 0.1% 80 / 3,045 2.6% 14 / 298 4.7% 0 / 261 0.0% 14 / 559 2.5%
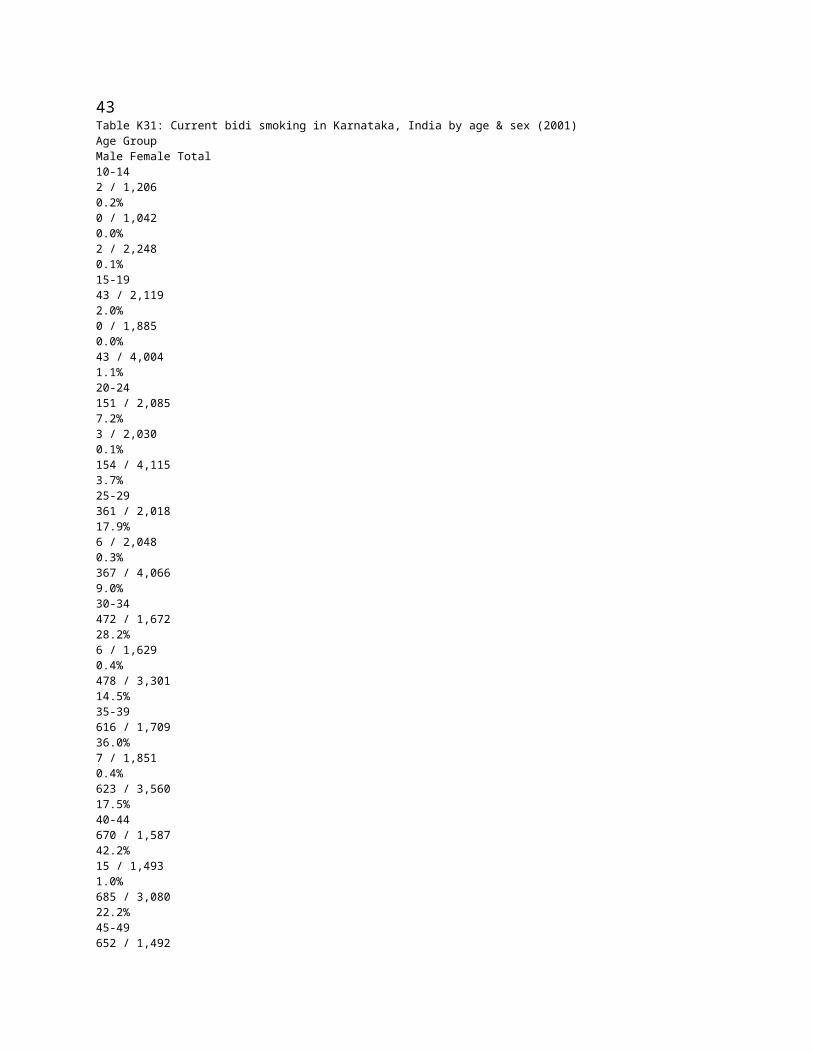
43Table K31: Current bidi smoking in Karnataka, India by age & sex (2001) Age Group Male Female Total 10-14 2 / 1,206 0.2% 0 / 1,042 0.0% 2 / 2,248 0.1% 15-19 43 / 2,119
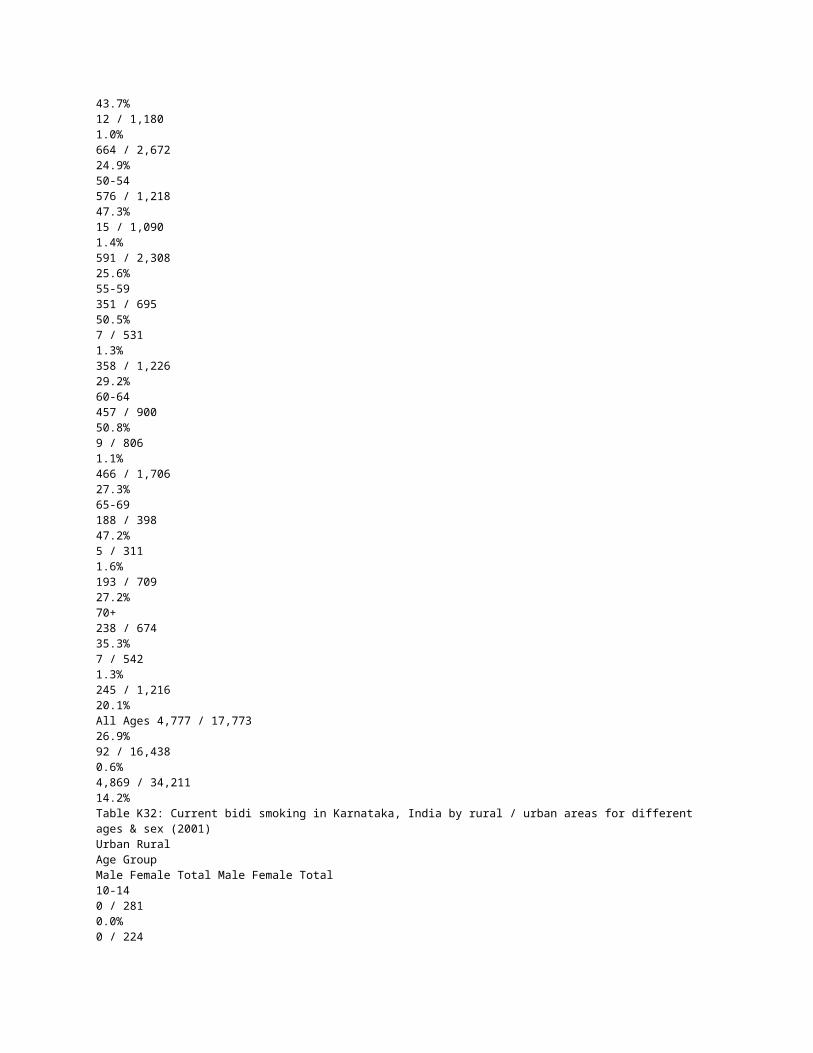
2.0% 0 / 1,885 0.0% 43 / 4,004 1.1% 20-24 151 / 2,085 7.2% 3 / 2,030 0.1% 154 / 4,115 3.7% 25-29 361 / 2,018 17.9% 6 / 2,048 0.3% 367 / 4,066 9.0% 30-34 472 / 1,672 28.2% 6 / 1,629 0.4% 478 / 3,301 14.5% 35-39 616 / 1,709 36.0% 7 / 1,851 0.4% 623 / 3,560 17.5% 40-44 670 / 1,587 42.2% 15 / 1,493 1.0% 685 / 3,080 22.2% 45-49 652 / 1,492 43.7% 12 / 1,180 1.0% 664 / 2,672 24.9% 50-54 576 / 1,218 47.3% 15 / 1,090 1.4% 591 / 2,308 25.6% 55-59 351 / 695 50.5% 7 / 531 1.3% 358 / 1,226 29.2% 60-64 457 / 900 50.8% 9 / 806 1.1%
466 / 1,706 27.3% 65-69 188 / 398 47.2% 5 / 311 1.6% 193 / 709 27.2% 70+ 238 / 674 35.3% 7 / 542 1.3% 245 / 1,216 20.1% All Ages 4,777 / 17,773 26.9% 92 / 16,438 0.6% 4,869 / 34,211 14.2% Table K32: Current bidi smoking in Karnataka, India by rural / urban areas for different ages & sex (2001) Urban Rural Age Group Male Female Total Male Female Total 10-14 0 / 281 0.0% 0 / 224 0.0% 0 / 505 0.0% 2 / 925 0.2% 0 / 818 0.0% 2 / 1,743 0.1% 15-19 5 / 419 1.2% 0 / 397 0.0% 5 / 816 0.6% 38 / 1,700 2.2% 0 / 1,488 0.0% 38 / 3,188 1.2% 20-24 17 / 432 3.9% 2 / 403 0.5% 19 / 835 2.3% 134 / 1,653 8.1% 1 / 1,627 0.1% 135 / 3,280 4.1% 25-29
37 / 366 10.1% 1 / 414 0.2% 38 / 780 4.9% 324 / 1,652 19.6% 5 / 1,634 0.3% 329 / 3,286 10.0% 30-34 46 / 278 16.5% 0 / 333 0.0% 46 / 611 7.5% 426 / 1,394 30.6% 6 / 1,296 0.5% 432 / 2,690 16.1% 35-39 74 / 313 23.6% 2 / 381 0.5% 76 / 694 11.0% 542 / 1,396 38.8% 5 / 1,470 0.3% 547 / 2,866 19.1% 40-44 87 / 325 26.8% 4 / 285 1.4% 91 / 610 14.9% 583 / 1,262 46.2% 11 / 1,208 0.9% 594 / 2,470 24.0% 45-49 75 / 305 24.6% 4 / 216 1.9% 79 / 521 15.2% 577 / 1,187 48.6% 8 / 964 0.8% 585 / 2,151 27.2% 50-54 76 / 233

32.6% 2 / 163 1.2% 78 / 396 19.7% 500 / 985 50.8% 13 / 927 1.4% 513 / 1,912 26.8% 55-59 42 / 113 37.2% 0 / 79 0.0% 42 / 192 21.9% 309 / 582 53.1% 7 / 452 1.5% 316 / 1,034 30.6% 60-64 41 / 108 38.0% 1 / 146 0.7% 42 / 254 16.5% 416 / 792 52.5% 8 / 660 1.2% 424 / 1,452 29.2% 65-69 20 / 57 35.1% 0 / 45 0.0% 20 / 102 19.6% 168 / 341 49.3% 5 / 266 1.9% 173 / 607 28.5% 70+ 35 / 98 35.7% 1 / 64 1.6% 36 / 162 22.2% 203 / 576 35.2% 6 / 478 1.3% 209 / 1,054 19.8% All Ages 555 / 3,328 16.7% 17 / 3,150

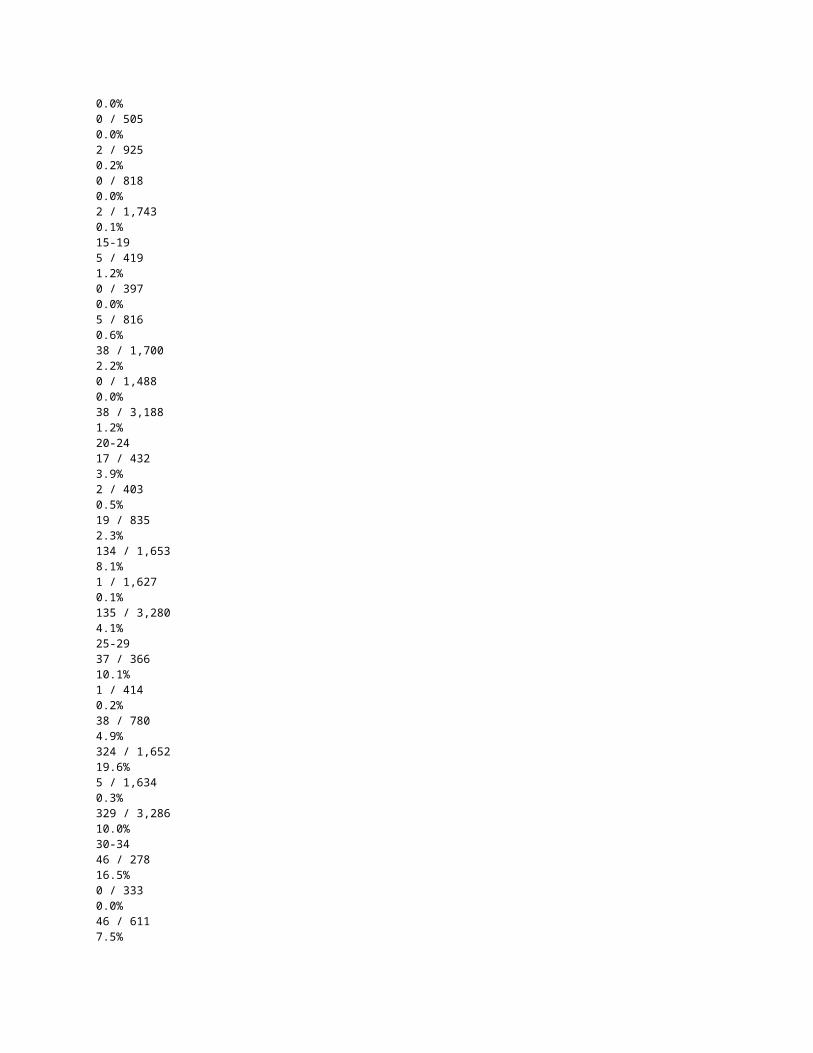
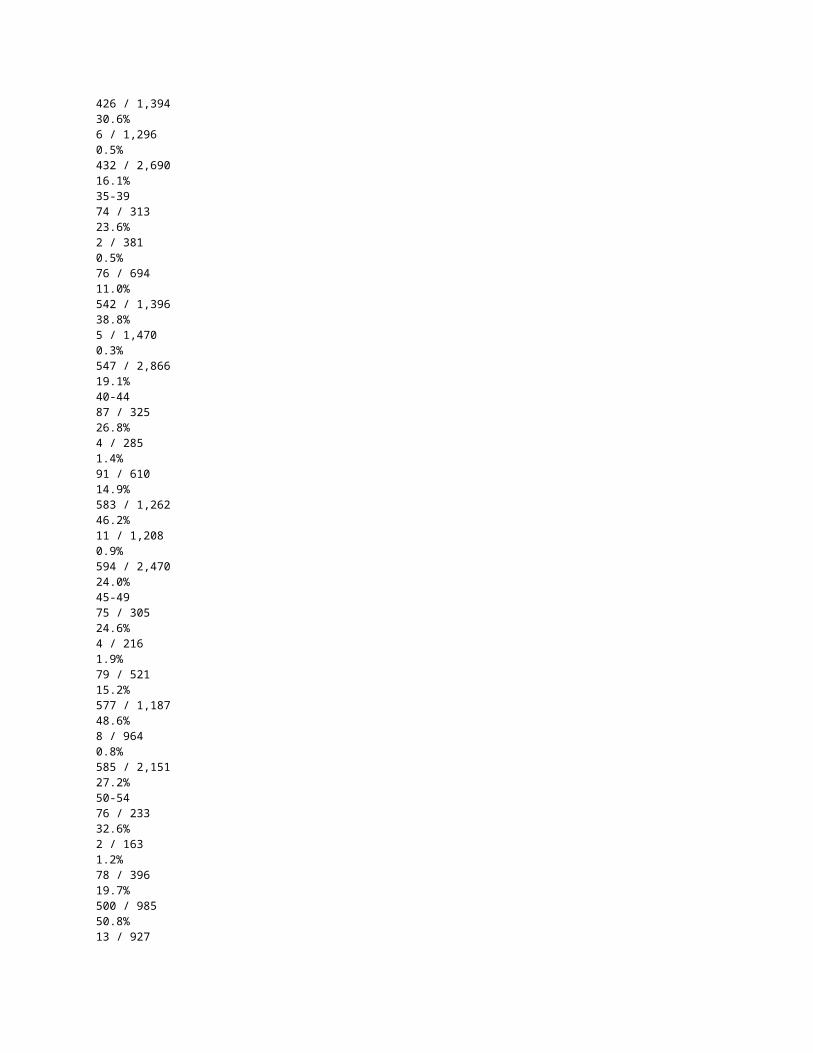
0.5% 572 / 6,478 8.8% 4,222 / 14,445 29.2% 75 / 13,288 0.6% 4,297 / 27,733 15.5% 44 Table K33: Current bidi smoking in Karnataka, India by level of education for different ages & sex (2001) Age Group Illiterate/ Just Literate Primary/ Middle School High/ Secondary School College/ University Master/ Doctoral 10-14 Male Female Total 1 / 85 1.2% 0 / 104 0.0% 1 / 189 0.5% 1 / 929 0.1% 0 / 744 0.0% 1 / 1,673 0.0% 0 / 192 0.0% 0 / 194 0.0% 0 / 386 0.0% 0 / 0 0 / 0 0 / 0 0 / 0 0 / 0 0 / 0 15-19 Male Female Total 13 / 307 4.2% 0 / 338 0.0% 13 / 645 2.0% 21 / 637 3.3% 0 / 597 0.0% 21 / 1,234 1.7% 8 / 849 0.9% 0 / 697 0.0% 8 / 1,546 0.5% 1 / 326 0.3% 0 / 253 0.0% 1 / 579 0.2% 0 / 0 0 / 0 0 / 0 20-24 Male Female Total 56 / 375 14.9% 3 / 739 0.4% 59 / 1,114 5.3% 51 / 587 8.7% 0 / 595 0.0%
51 / 1,182 4.3% 33 / 630 5.2% 0 / 469 0.0% 33 / 1,099 3.0% 11 / 464 2.4% 0 / 215 0.0% 11 / 679 1.6% 0 / 29 0.0% 0 / 12 0.0% 0 / 41 0.0% 25-29 Male Female Total 146 / 528 27.7% 4 / 1,012 0.4% 150 / 1,540 9.7% 124 / 594 20.9% 1 / 547 0.2% 125 / 1,141 11.0% 66 / 480 13.8% 1 / 327 0.3% 67 / 807 8.3% 24 / 384 6.3% 0 / 150 0.0% 24 / 534 4.5% 1 / 32 3.1% 0 / 12 0.0% 1 / 44 2.3% 30-34 Male Female Total 213 / 554 38.4% 4 / 965 0.4% 217 / 1,519 14.3% 143 / 459 31.2% 0 / 140 0.0% 143 / 869 16.5% 76 / 341 22.3% 1 / 177 0.6% 77 / 518 14.9% 40 / 290 13.8% 1 / 76 1.3% 41 / 366 11.2% 0 / 28 0.0% 0 / 1 0.0% 0 / 29 0.0% 35-39 Male Female Total 291 / 663 43.9% 5 / 1,213 0.4% 296 / 1,876 15.8% 220 / 536 41.0% 2 / 430 0.5% 222 / 966 23.0% 76 / 280 27.1% 0 / 147 0.0% 76 / 427 17.8% 28 / 209 13.4% 0 / 58 0.0% 28 / 267 10.5% 1 / 21 4.8% 0 / 3 0.0% 1 / 24 4.2% 40-44 Male Female
Total 364 / 728 50.0% 9 / 1,005 0.9% 373 / 1,733 21.5% 194 / 453 42.8% 3 / 362 0.8% 197 / 815 24.2% 82 / 224 36.6% 2 / 92 2.2% 84 / 316 26.6% 30 / 173 17.3% 1 / 29 3.4% 31 / 202 15.3% 0 / 9 0.0% 0 / 5 0.0% 0 / 14 0.0% 45-49 Male Female Total 331 / 630 52.5% 9 / 858 1.0% 340 / 1,488 22.8% 225 / 466 48.3% 2 / 249 0.8% 227 / 715 31.7% 68 / 246 27.6% 0 / 59 0.0% 68 / 305 22.3% 27 / 137 19.7% 1 / 14 7.1% 28 / 151 18.5% 1 / 13 7.7% 0 / 0 1 / 13 7.7% 50-54 Male Female Total 354 / 650 54.5% 13 / 899 1.4% 367 / 1,549 23.7% 154 / 332 46.4% 0 / 147 0.0% 154 / 479 32.2% 47 / 138 34.1% 2 / 34 5.9% 49 / 172 28.5% 20 / 86 23.3% 0 / 8 0.0% 20 / 94 21.3% 1 / 12 8.3% 0 / 2 0.0% 1 / 14 7.1% 55-59 Male Female Total 209 / 352 59.4% 7 / 438 1.6% 216 / 790 27.3% 109 / 211 51.7% 0 / 67 0.0% 109 / 278 39.2% 29 / 90 32.2% 0 / 13 0.0% 29 / 103 28.2% 4 / 41 9.8% 0 / 13 0.0% 4 / 54 7.4%
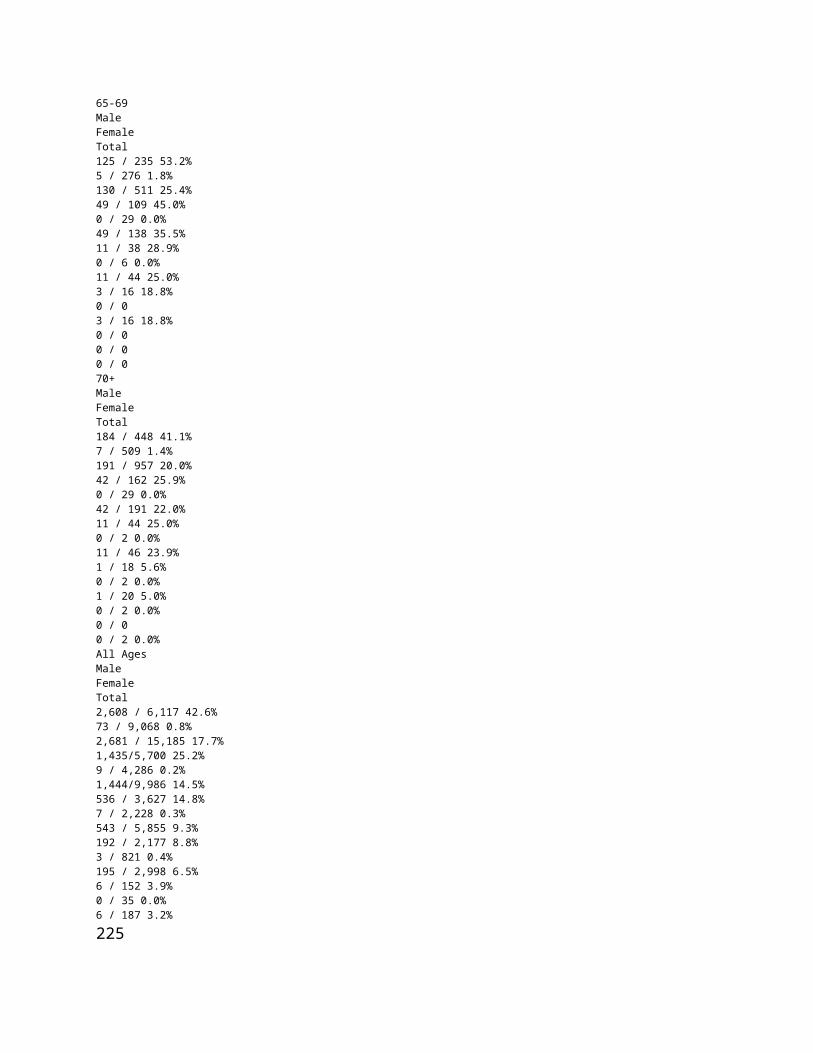
0 / 1 0.0% 0 / 0 0 / 1 0.0% 60-64 Male Female Total 321 / 562 57.1% 7 / 712 1.0% 328 / 1,274 25.7% 102 / 225 45.3% 1 / 80 1.3% 103 / 305 33.8% 29 / 75 38.7% 1 / 11 9.1% 30 / 86 34.9% 3 / 33 9.1% 0 / 3 0.0% 3 / 36 8.3% 2 / 5 40.0% 0 / 0 2 / 5 40.0% 65-69 Male Female Total 125 / 235 53.2% 5 / 276 1.8% 130 / 511 25.4% 49 / 109 45.0% 0 / 29 0.0% 49 / 138 35.5% 11 / 38 28.9% 0 / 6 0.0% 11 / 44 25.0% 3 / 16 18.8% 0 / 0 3 / 16 18.8% 0 / 0 0 / 0 0 / 0 70+ Male Female Total 184 / 448 41.1% 7 / 509 1.4% 191 / 957 20.0% 42 / 162 25.9% 0 / 29 0.0% 42 / 191 22.0% 11 / 44 25.0% 0 / 2 0.0% 11 / 46 23.9% 1 / 18 5.6% 0 / 2 0.0% 1 / 20 5.0% 0 / 2 0.0% 0 / 0 0 / 2 0.0% All Ages Male Female Total 2,608 / 6,117 42.6% 73 / 9,068 0.8% 2,681 / 15,185 17.7% 1,435/5,700 25.2% 9 / 4,286 0.2% 1,444/9,986 14.5%
536 / 3,627 14.8% 7 / 2,228 0.3% 543 / 5,855 9.3% 192 / 2,177 8.8% 3 / 821 0.4% 195 / 2,998 6.5% 6 / 152 3.9% 0 / 35 0.0% 6 / 187 3.2%
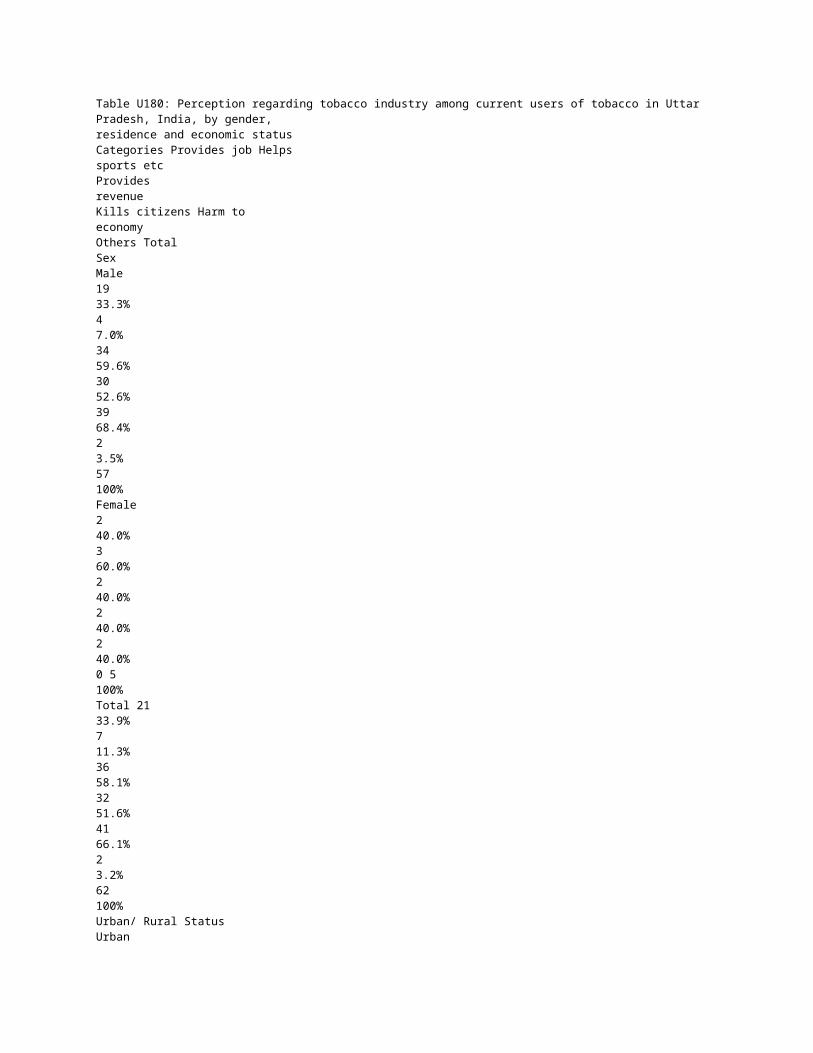
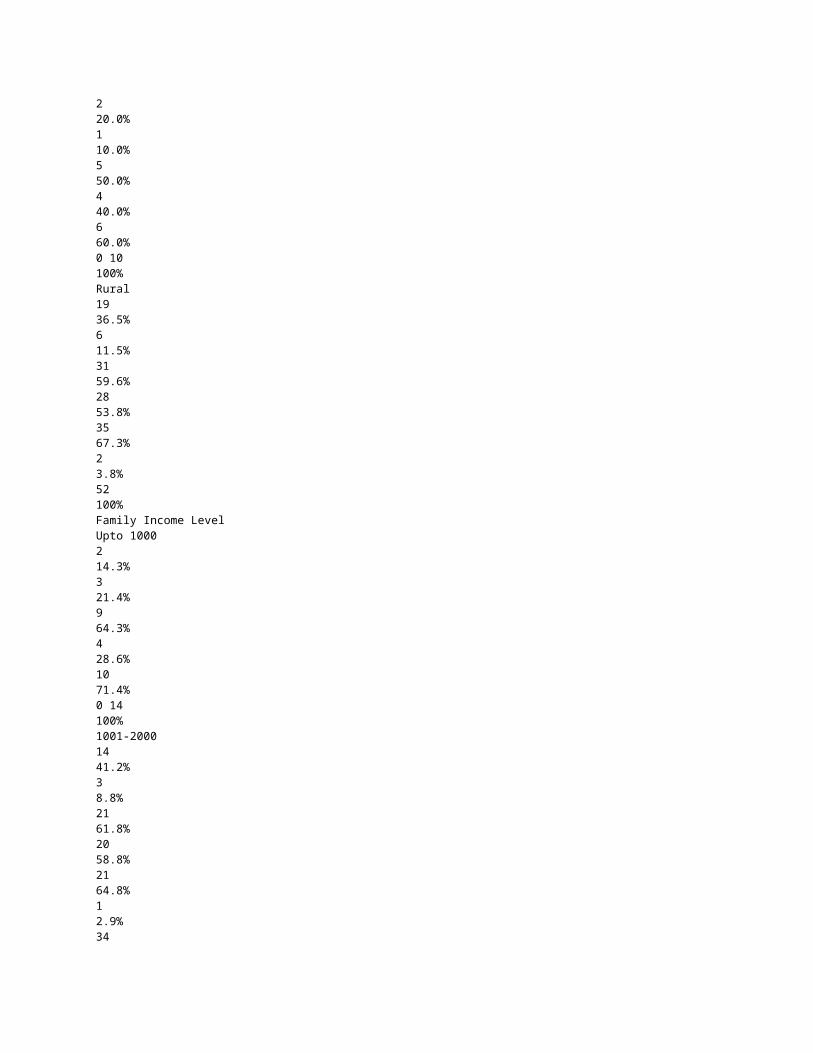
225Table U180: Perception regarding tobacco industry among current users of tobacco in Uttar Pradesh, India, by gender, residence and economic status Categories Provides job Helps sports etc Provides revenue Kills citizens Harm to economy Others Total Sex Male 19 33.3% 4 7.0% 34 59.6% 30 52.6% 39 68.4% 2 3.5% 57 100% Female 2 40.0% 3 60.0% 2 40.0% 2 40.0% 2 40.0% 0 5 100% Total 21 33.9% 7 11.3% 36 58.1% 32 51.6% 41 66.1% 2 3.2% 62 100% Urban/ Rural StatusUrban 2 20.0%
1 10.0% 5 50.0% 4 40.0% 6 60.0% 0 10 100% Rural 19 36.5% 6 11.5% 31 59.6% 28 53.8% 35 67.3% 2 3.8% 52 100% Family Income LevelUpto 1000 2 14.3% 3 21.4% 9 64.3% 4 28.6% 10 71.4% 0 14 100% 1001-2000 14 41.2% 3 8.8% 21 61.8% 20 58.8% 21 64.8% 1 2.9% 34 100% 2001-5000 2 20.0% 0 5 50.0% 6 60.0% 8 80.0% 1 10.0% 10
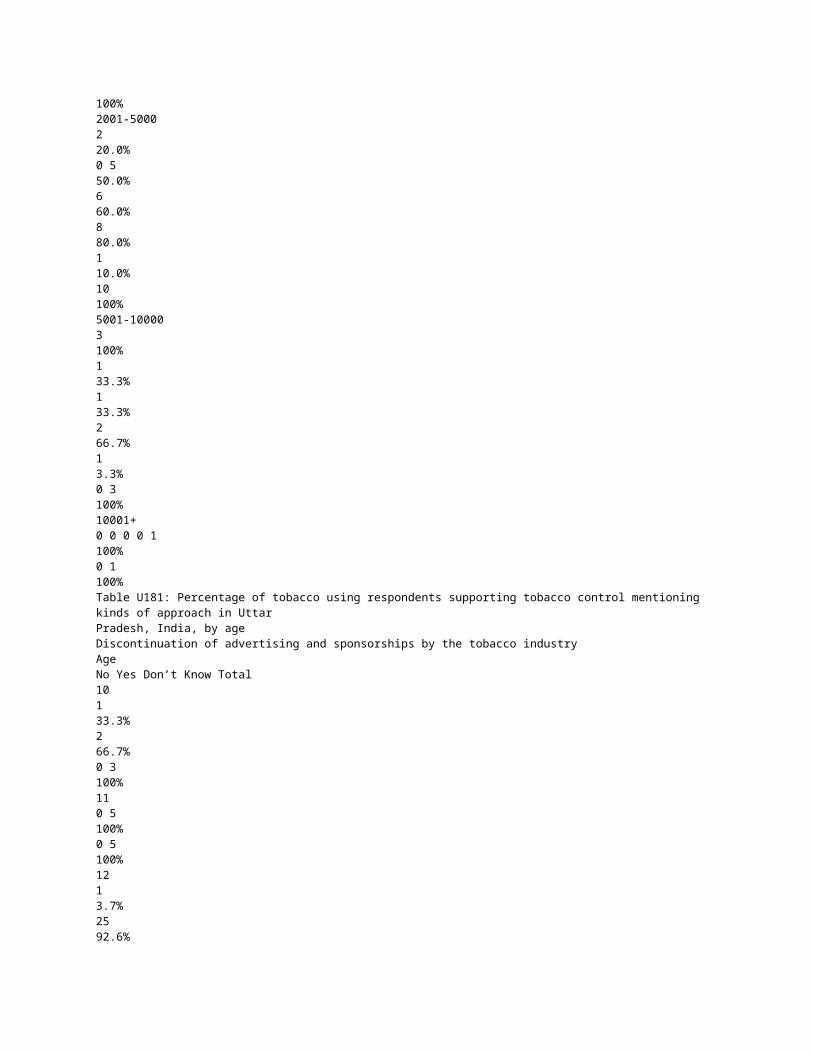
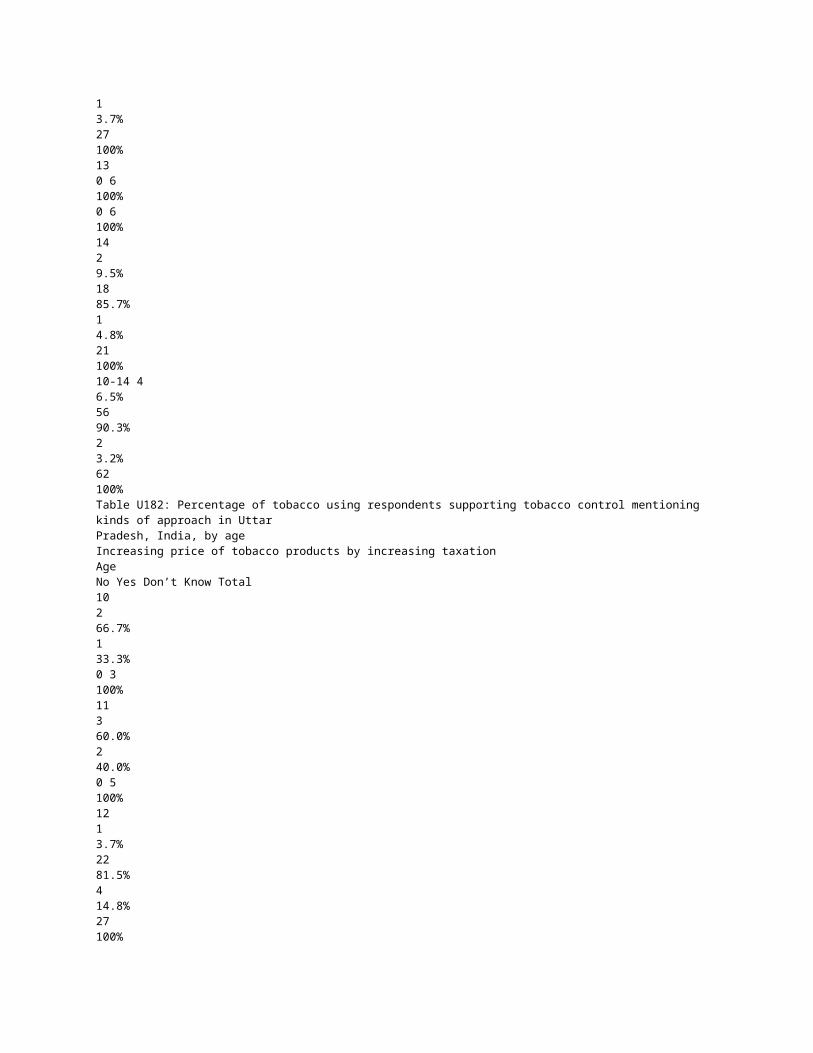
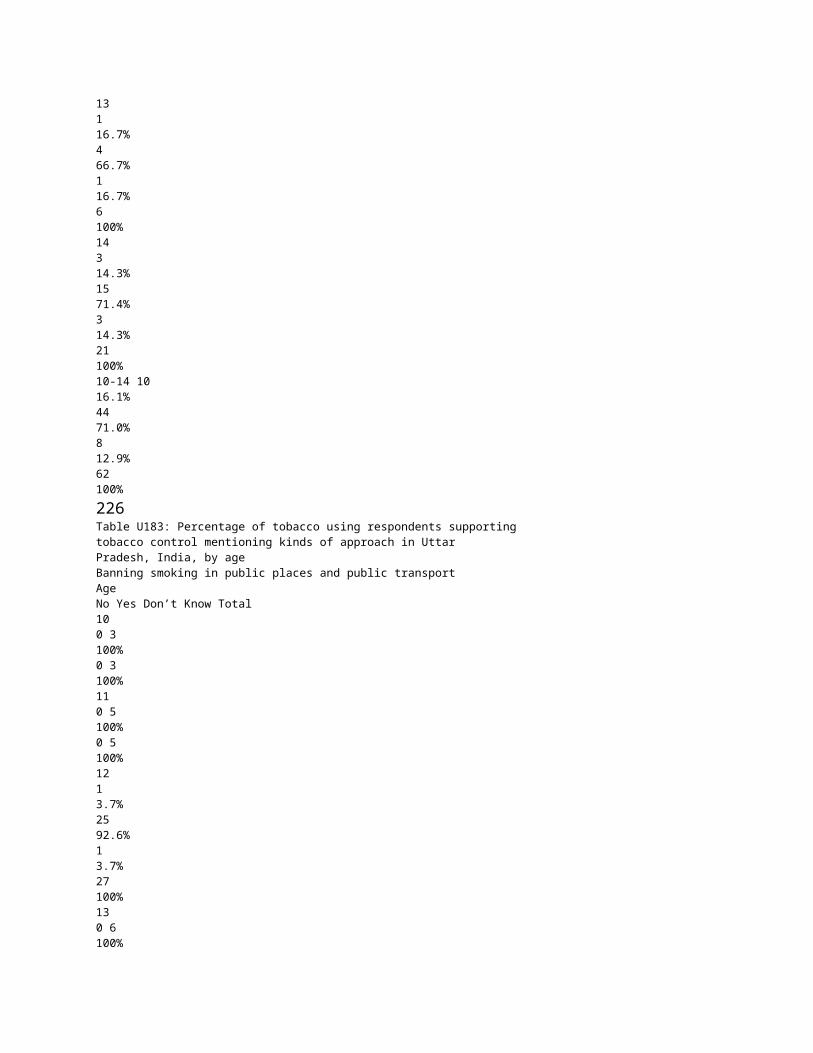
100% 5001-10000 3 100% 1 33.3% 1 33.3% 2 66.7% 1 3.3% 0 3 100% 10001+ 0 0 0 0 1 100% 0 1 100% Table U181: Percentage of tobacco using respondents supporting tobacco control mentioning kinds of approach in Uttar Pradesh, India, by age Discontinuation of advertising and sponsorships by the tobacco industry Age No Yes Don’t Know Total 10 1 33.3% 2 66.7% 0 3 100% 11 0 5 100% 0 5 100% 12 1 3.7% 25 92.6% 1 3.7% 27 100% 13 0 6 100% 0 6 100% 14 2 9.5% 18 85.7% 1 4.8% 21 100% 10-14 4 6.5% 56 90.3% 2 3.2% 62

100% Table U182: Percentage of tobacco using respondents supporting tobacco control mentioning kinds of approach in Uttar Pradesh, India, by age Increasing price of tobacco products by increasing taxation Age No Yes Don’t Know Total 10 2 66.7% 1 33.3% 0 3 100% 11 3 60.0% 2 40.0% 0 5 100% 12 1 3.7% 22 81.5% 4 14.8% 27 100% 13 1 16.7% 4 66.7% 1 16.7% 6 100% 14 3 14.3% 15 71.4% 3 14.3% 21 100% 10-14 10 16.1% 44 71.0% 8 12.9% 62 100% 226 Table U183: Percentage of tobacco using respondents supportingtobacco control mentioning kinds of approach in Uttar Pradesh, India, by age Banning smoking in public places and public transport Age No Yes Don’t Know Total 10 0 3 100% 0 3
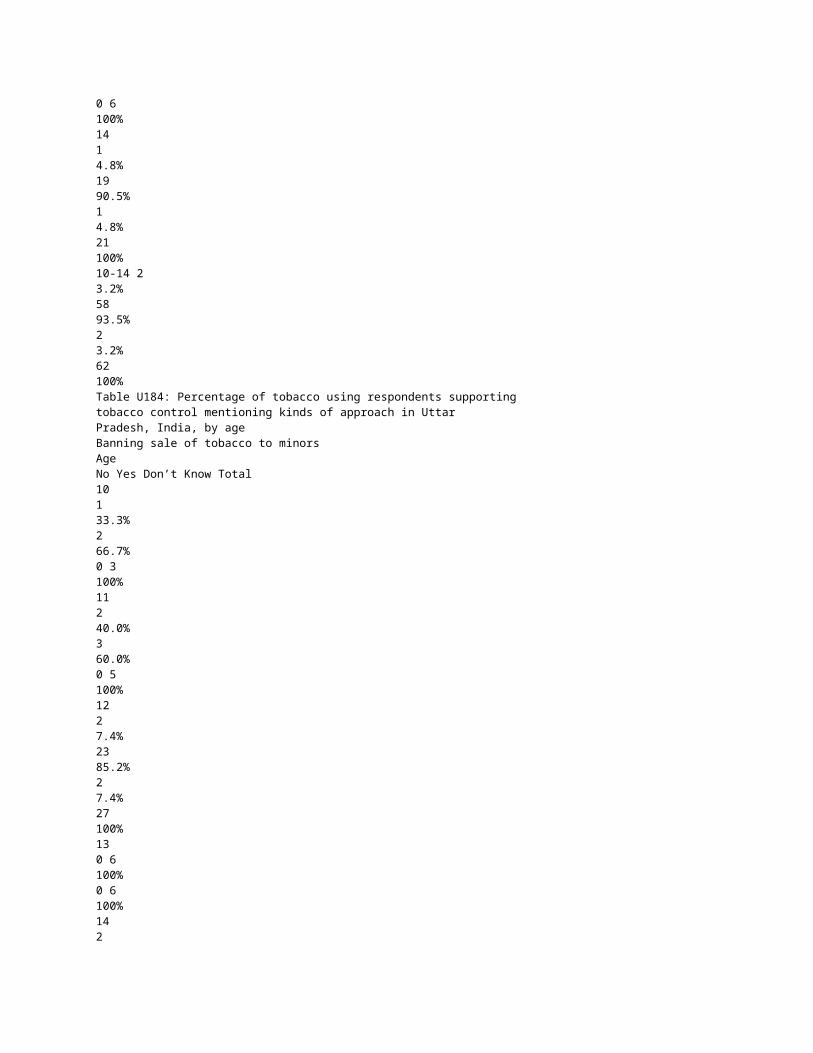
100% 11 0 5 100% 0 5 100% 12 1 3.7% 25 92.6% 1 3.7% 27 100% 13 0 6 100% 0 6 100% 14 1 4.8% 19 90.5% 1 4.8% 21 100% 10-14 2 3.2% 58 93.5% 2 3.2% 62 100% Table U184: Percentage of tobacco using respondents supportingtobacco control mentioning kinds of approach in Uttar Pradesh, India, by age Banning sale of tobacco to minors Age No Yes Don’t Know Total 10 1 33.3% 2 66.7% 0 3 100% 11 2 40.0% 3 60.0% 0 5 100% 12 2 7.4% 23 85.2% 2 7.4% 27 100%

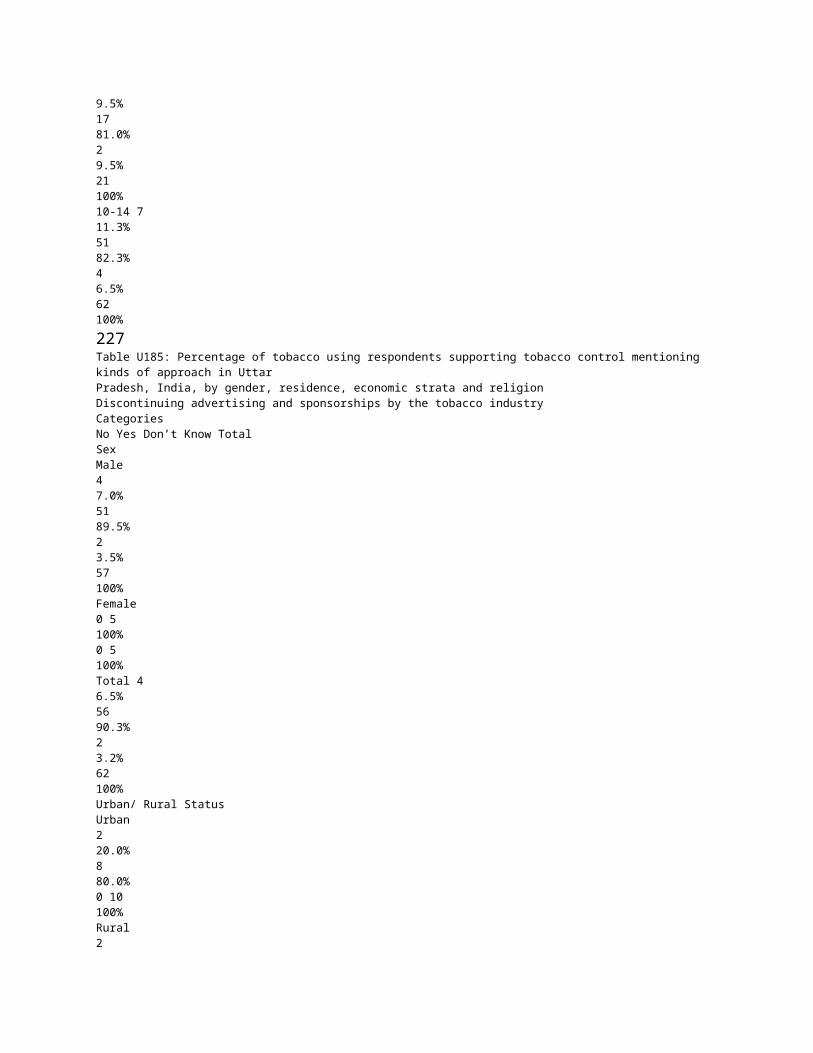
13 0 6 100% 0 6 100% 14 2 9.5% 17 81.0% 2 9.5% 21 100% 10-14 7 11.3% 51 82.3% 4 6.5% 62 100% 227Table U185: Percentage of tobacco using respondents supporting tobacco control mentioning kinds of approach in Uttar Pradesh, India, by gender, residence, economic strata and religion Discontinuing advertising and sponsorships by the tobacco industry Categories No Yes Don’t Know Total Sex Male 4 7.0% 51 89.5% 2 3.5% 57 100% Female 0 5 100% 0 5 100% Total 4 6.5% 56 90.3% 2 3.2% 62 100% Urban/ Rural StatusUrban 2 20.0% 8 80.0% 0 10 100% Rural 2 3.8% 48 92.3% 2 3.8%

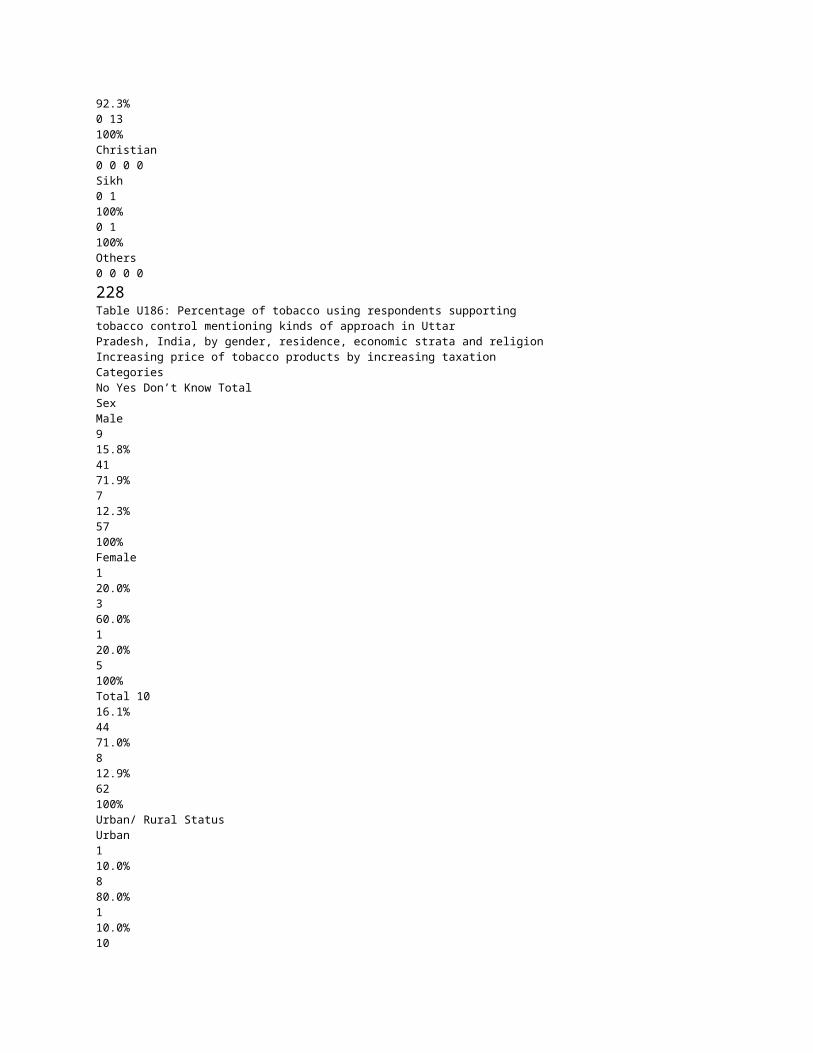
52 100% Family Income LevelUpto 1000 2 14.3% 11 78.6% 1 7.1% 14 100% 1001-2000 0 33 97.1% 1 2.9% 34 100% 2001-5000 2 20.0% 8 80.0% 0 10 100% 5001-10,000 0 3 100% 0 3 100% 10,001+ 0 1 100% 0 1 100% ReligionHindu 3 6.3% 43 89.6% 2 4.2% 48 100% Muslim 1 7.7% 12 92.3% 0 13 100% Christian 0 0 0 0 Sikh 0 1 100% 0 1 100% Others 0 0 0 0 228 Table U186: Percentage of tobacco using respondents supportingtobacco control mentioning kinds of approach in Uttar Pradesh, India, by gender, residence, economic strata and religion

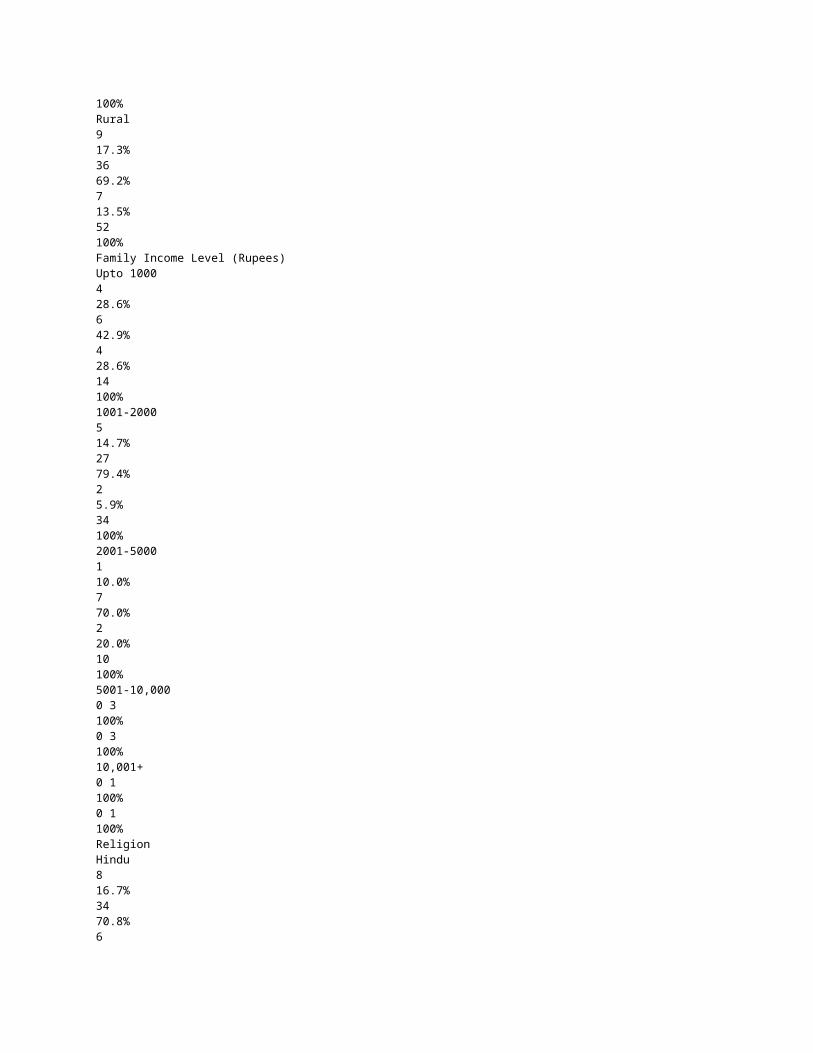
Increasing price of tobacco products by increasing taxation Categories No Yes Don’t Know Total Sex Male 9 15.8% 41 71.9% 7 12.3% 57 100% Female 1 20.0% 3 60.0% 1 20.0% 5 100% Total 10 16.1% 44 71.0% 8 12.9% 62 100% Urban/ Rural StatusUrban 1 10.0% 8 80.0% 1 10.0% 10 100% Rural 9 17.3% 36 69.2% 7 13.5% 52 100% Family Income Level (Rupees)Upto 1000 4 28.6% 6 42.9% 4 28.6% 14 100% 1001-2000 5 14.7% 27 79.4% 2 5.9%
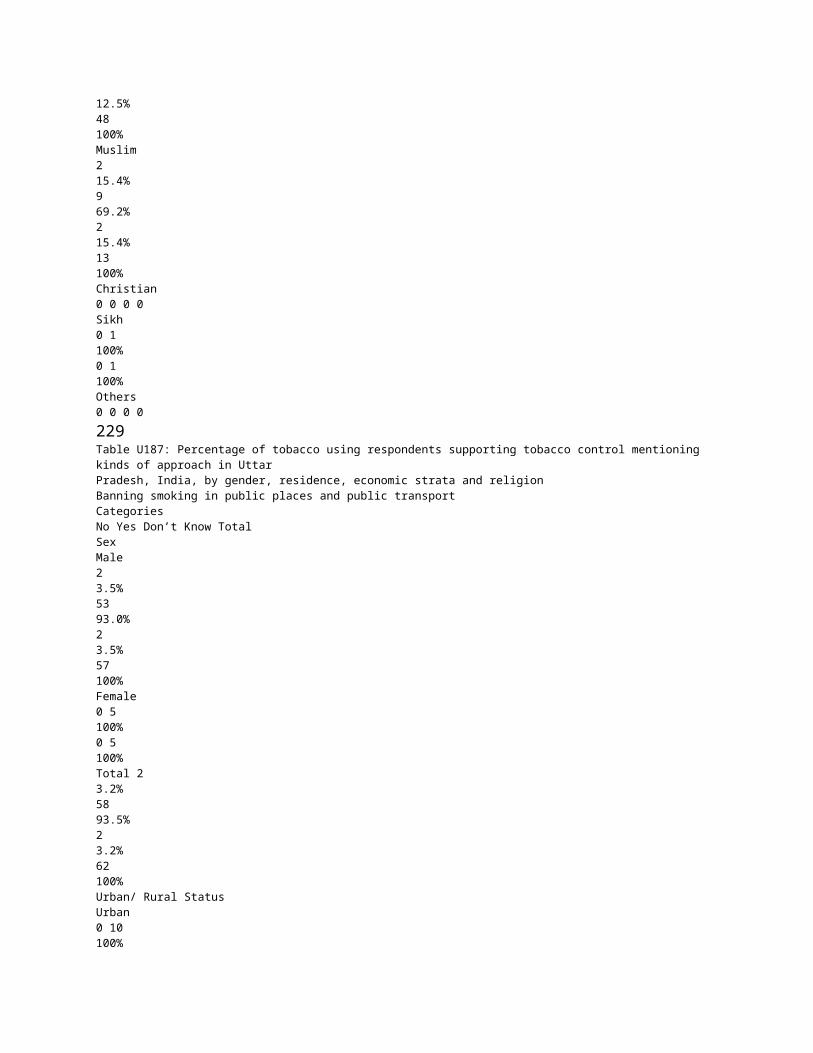
34 100% 2001-5000 1 10.0% 7 70.0% 2 20.0% 10 100% 5001-10,000 0 3 100% 0 3 100% 10,001+ 0 1 100% 0 1 100% ReligionHindu 8 16.7% 34 70.8% 6 12.5% 48 100% Muslim 2 15.4% 9 69.2% 2 15.4% 13 100% Christian 0 0 0 0 Sikh 0 1 100% 0 1 100% Others 0 0 0 0 229Table U187: Percentage of tobacco using respondents supporting tobacco control mentioning kinds of approach in Uttar Pradesh, India, by gender, residence, economic strata and religion Banning smoking in public places and public transport Categories No Yes Don’t Know Total Sex Male 2 3.5% 53 93.0% 2 3.5% 57 100% Female
0 5 100% 0 5 100% Total 2 3.2% 58 93.5% 2 3.2% 62 100% Urban/ Rural StatusUrban 0 10 100% 0 10 100% Rural 2 3.8% 48 92.3% 2 3.8% 52 100% Family Income Level (Rupees)Upto 1000 2 14.3% 12 85.7% 0 14 100% 1001-2000 0 32 94.1% 2 5.9% 34 100% 2001-5000 0 10 100% 0 10 100% 5001-10,000 0 3 100% 0 3 100% 10,001+ 0 1 100% 0 1 100% ReligionHindu 1 2.1% 45 93.8% 2 4.2% 48
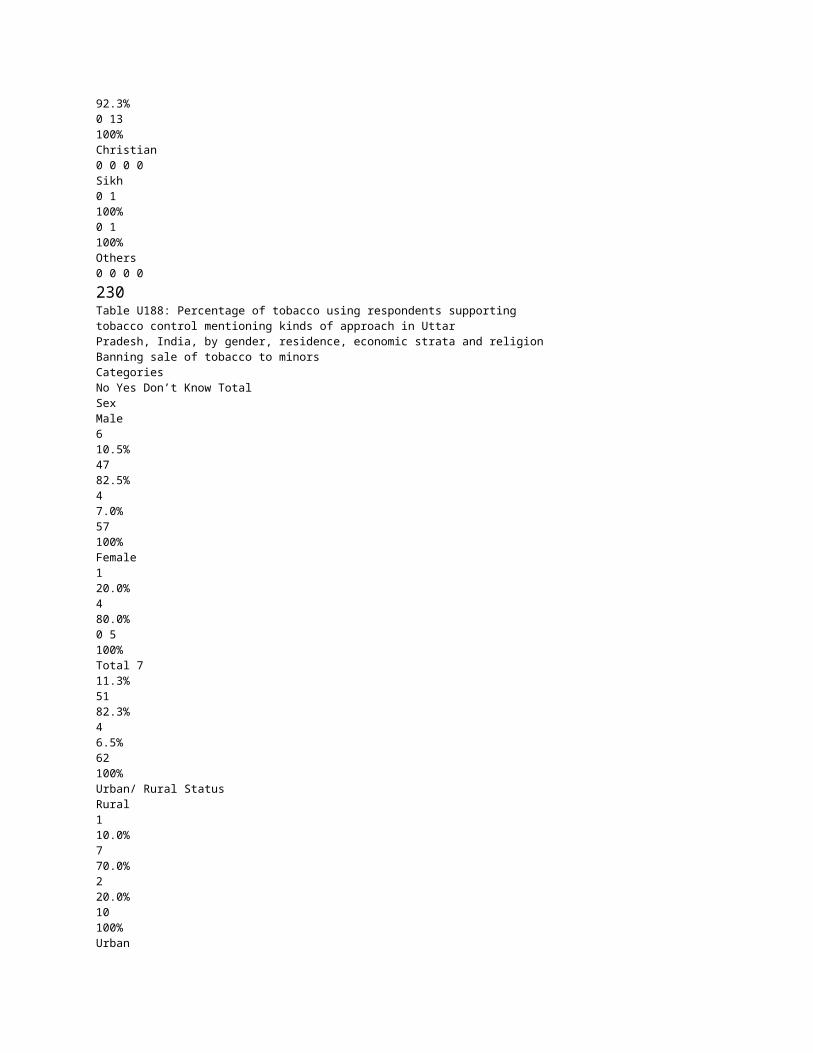
100% Muslim 1 7.7% 12 92.3% 0 13 100% Christian 0 0 0 0 Sikh 0 1 100% 0 1 100% Others 0 0 0 0 230 Table U188: Percentage of tobacco using respondents supportingtobacco control mentioning kinds of approach in Uttar Pradesh, India, by gender, residence, economic strata and religion Banning sale of tobacco to minors Categories No Yes Don’t Know Total SexMale 6 10.5% 47 82.5% 4 7.0% 57 100% Female 1 20.0% 4 80.0% 0 5 100% Total 7 11.3% 51 82.3% 4 6.5% 62 100% Urban/ Rural StatusRural 1 10.0% 7 70.0% 2 20.0% 10 100% Urban 6 11.5% 44 84.6% 2 3.8%
52 100% Family Income Level (Rupees)Upto 1000 3 21.4% 10 71.4% 1 7.1% 14 100% 1001-2000 3 8.8% 31 91.2% 0 34 100% 2001-5000 1 10.0% 7 70.0% 2 20.0% 10 100% 5001-10,000 0 2 66.7% 1 33.3% 3 100% 10,001+ 0 1 100% 0 1 100% ReligionHindu 6 12.5% 39 81.3% 3 6.3% 48 100% Muslim 1 7.7% 11 84.6% 1 7.7% 13 100% Christian 0 0 0 0 Sikh 0 1 100% 0 1 100%
Others 0 0 0 0 231Table U189: Percentage of never tobacco using respondents supporting tobacco control mentioning kinds of approach in Uttar Pradesh, India, by age Discontinuing advertising and sponsorships by the tobacco industry Age No Yes Don’t Know Total 10 46 10.4% 372 84.2% 24 5.4% 442 100% 11 21 5.6% 316 84.5% 37 9.9% 374 100% 12 53 6.2% 764 88.8% 43 5.0% 860 100% 13 24 6.2% 333 86.5% 28 7.3% 385 100% 14 46 7.7% 529 88.8% 21 3.5% 596 100% 10-14 190 7.2% 2,314 87.1% 153 5.8% 2,657 100% Table U190: Percentage of never tobacco using respondents supporting tobacco control mentioning kinds of approach in Uttar Pradesh, India, by age Increasing price of tobacco products by increasing taxation Age No Yes Don’t Know Total
10 60 13.6% 323 73.1% 59 13.3% 442 100% 11 30 8.0% 255 68.2% 89 23.8% 374 100% 12 81 9.4% 639 74.3% 140 16.3% 860 100% 13 43 11.2% 261 67.8% 81 21.0% 385 100% 14 74 12.4% 444 74.5% 78 13.1% 596 100% 10-14 288 10.8% 1,922 72.3% 447 16.8% 2,657 100% Table U191: Percentage of never tobacco using respondents supporting tobacco control mentioning kinds of approach in Uttar Pradesh, India, by age Banning smoking in public places and public transport Age No Yes Don’t Know Total 10 37 8.4% 372 84.2% 33 7.5% 442
100% 11 19 5.1% 319 85.3% 36 9.6% 374 100% 12 34 4.0% 768 89.3% 58 6.7% 860 100% 13 20 5.2% 341 88.6% 24 6.2% 385 100% 14 30 5.0% 526 8.3% 40 6.7% 596 100% 10-14 140 5.3% 2,326 87.5% 191 7.2% 2,657 100% Table U192: Percentage of never tobacco using respondents supporting tobacco control mentioning kinds of approach in Uttar Pradesh, India, by age Banning sale of tobacco to minors Age No Yes Don’t Know Total 10 26 5.9% 369 83.5% 47 10.6% 442 100% 11 22 5.9% 324 86.6% 28 7.5%
374 100% 12 41 4.8% 768 89.3% 51 5.9% 860 100% 13 17 4.4% 326 84.7% 42 10.9% 385 100% 14 25 4.2% 534 89.6% 37 6.2% 596 100% 10-14 131 4.9% 2,321 87.4% 205 7.7% 2,657 100% 232 Table U193: Percentage of never tobacco using respondents supporting tobacco control mentioning kinds of approach in Uttar Pradesh, India, by gender, residence, economic strata and religion Discontinuing advertising and sponsorships by the tobacco industry Categories No Yes Don’t Know Total Sex Male 119 6.4% 1,633 87.7% 111 6.0% 1,863 100% Female 71 8.9% 681 85.8% 42 5.3% 794 100% Total 190 7.2% 2,314 87.1%

153 5.8% 2,657 100% Urban/ Rural StatusUrban 36 9.3% 336 86.8% 15 3.9% 387 100% Rural 154 6.8% 1,978 87.1% 138 6.1% 2,270 100% Family Income Level Upto 1000 57 7.7% 611 82.1% 76 10.2% 744 100% 1001-2000 78 6.4% 1,106 90.4% 40 3.3% 1,224 100% 2001-5000 50 8.5% 506 86.1% 32 5.4% 588 100% 5001-10,000 5 5.6% 81 90.0% 4 4.4% 90 100% 10,001+ 0 10 90.9% 1 9.1% 11
100% ReligionHindu 144 6.7% 1,871 87.2% 131 6.1% 2,146 100% Muslim 45 8.9% 439 86.9% 21 4.2% 505 100% Christian 0 0 0 0 Sikh 1 16.7% 4 66.7% 1 16.7% 6 100% Others 0 0 0 0 233Table U194: Percentage of never tobacco using respondents supporting tobacco control mentioning kinds of approach in Uttar Pradesh, India, by gender, residence, economic strata and religion Increasing price of tobacco products by increasing taxation Categories No Yes Don’t Know Total Sex Male 185 9.9% 1,348 72.4% 330 17.7% 1,863 100% Female 103 13.0% 574 72.3% 117 14.7% 794 100% Total 288 10.8% 1,922 72.3% 447 16.8% 2,657 100%
Urban/ Rural Categories Urban 39 10.1% 280 72.4% 68 17.6% 387 100% Rural 249 11.0% 1,642 72.3% 379 16.7% 2,270 100% Family Income Level Upto 1000 84 11.3% 451 60.6% 209 28.1% 744 100% 1001-2000 115 9.4% 960 78.4% 149 12.2% 1,224 100% 2001-5000 83 14.1% 436 74.1% 69 11.7% 588 100% 5001-10,000 5 5.6% 67 74.4% 18 20.0% 90 100% 10,001+ 1 9.1% 8 72.7% 2 18.2% 11 100% Religion
Hindu 223 10.4% 1,565 72.9% 358 16.7% 2,146 100% Muslim 64 12.7% 354 70.1% 87 17.2% 505 100% Christian 0 0 0 0 Sikh 1 16.7% 3 50.0% 2 33.3% 6 100% Others 0 0 0 0 235Table U196: Percentage of never tobacco using respondents supporting tobacco control mentioning kinds of approach in Uttar Pradesh, India, by gender, residence, economic strata and religion Banning sale of tobacco to minors Categories No Yes Don’t Know Total Sex Male 86 4.6% 1,647 88.4% 130 7.0% 1,863 100% Female 45 5.7% 674 84.9% 75 9.4% 794 100% Total 131 4.9% 2,321 87.4% 205 7.7% 2,657 100% Urban/ Rural StatusUrban

12 3.1% 333 86.0% 42 10.9% 387 100% Rural 119 5.2% 1,988 87.6% 163 7.2% 2,270 100% Family Income LevelUpto 1000 47 6.3% 605 81.3% 92 12.4% 744 100% 1001-2000 40 3.3% 1,111 90.8% 73 6.0% 1,224 100% 2001-5000 41 7.0% 511 86.9% 36 6.1% 588 100% 5001-10,000 3 3.3% 84 93.3% 3 3.3% 90 100% 10,001+ 0 10 90.9% 1 9.1% 11 100% ReligionHindu 121 5.6% 1,859
86.6% 166 7.7% 2,146 100% Muslim 9 1.8% 458 86.6% 166 7.7% 505 100%
Christian 0 0 0 0 Sikh 1 16.7% 4 66.7% 1 16.7% 6 100% Others 0 0 0 0