BAR GRAPHS LINE PLOTS FREQUENCY TABLES HISTOGRAMS Lessons 6.4 and 6.5.
Upload
piers-terryCategory
view
221download
0
Holt Algebra 1
10-2 Frequency and Histograms
Describe the central tendency of a data set.Create stem-&-leaf plots and box-&-whisker plotsCreate frequency tables and histograms.
Objectives
Vocabulary
mean median rangemode box-and-whisker plotstem-and-leaf plotsfrequency tables and histograms

Holt Algebra 1
10-2 Frequency and Histograms
A measure of central tendency describes how data clusters around a value.
• The mean is the sum of the values in the set divided by the number of values in the set.
• The median the middle value when the values are in numerical order, or the mean of the two middle values if there are an even number of values.
• The mode is the value or values that occur most often. There may be one mode or more than one mode. If no value occurs more often than another, we say the data set has no mode.
The range of a set of data is the difference between the least and greatest values in the set. The range describes the spread of the data.
Holt Algebra 1
10-2 Frequency and Histograms
Example 1
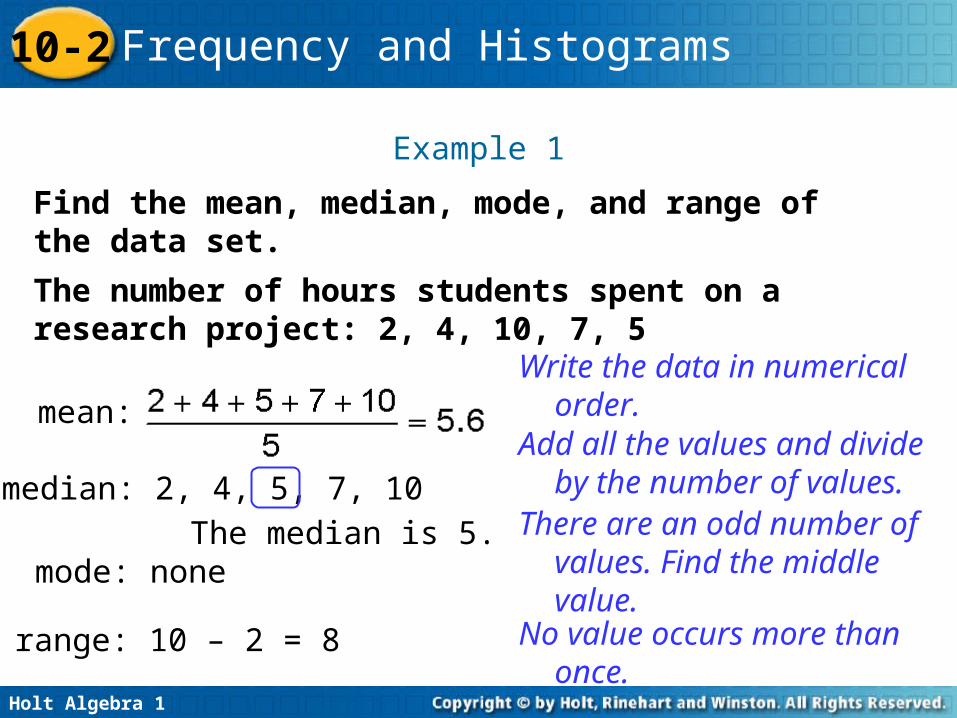
Find the mean, median, mode, and range of the data set.
The number of hours students spent on a research project: 2, 4, 10, 7, 5
median: 2, 4, 5, 7, 10The median is 5.
range: 10 – 2 = 8
mode: none
Write the data in numerical order.
Add all the values and divide by the number of values.
There are an odd number of values. Find the middle value.
No value occurs more than once.
mean:

Holt Algebra 1
10-2 Frequency and Histograms
Example 2 The temperature in degrees Celsius for two weeks are given below. Use the data to make a stem-and-leaf plot.
7, 32, 34, 31, 26, 27, 23, 19, 22, 29, 30, 36, 35, 31
Key: 1|9 means 19
Temperature in Degrees Celsius
The tens digits are the stems.
The ones digits are the leaves. List the leaves from least to greatest within each row.
Title the graph and add a key.
Stem Leaves
0 71 92 2 3 6 7 9 3 0 1 1 2 4 5 6
Holt Algebra 1
10-2 Frequency and Histograms
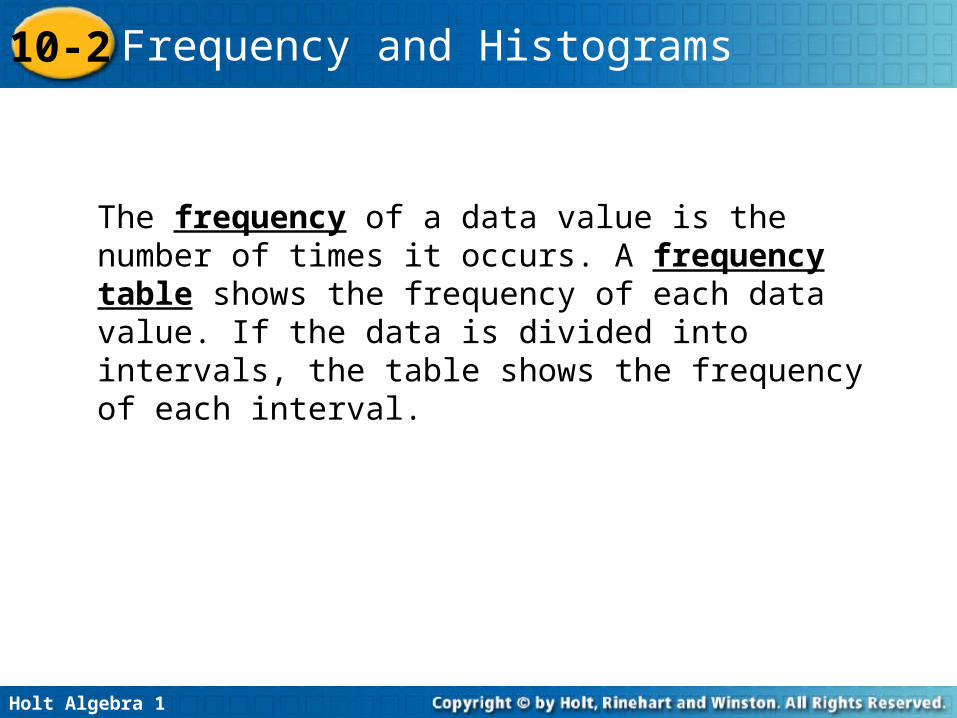
The frequency of a data value is the number of times it occurs. A frequency table shows the frequency of each data value. If the data is divided into intervals, the table shows the frequency of each interval.

Holt Algebra 1
10-2 Frequency and Histograms
Example 3: Making a Frequency Table
The numbers of students enrolled in Western Civilization classes at a university are given below. Use the data to make a frequency table with intervals.
12, 22, 18, 9, 25, 31, 28, 19, 22, 27, 32, 14
Step 1 Identify the least and greatest values.
The least value is 9. The greatest value is 32.

Holt Algebra 1
10-2 Frequency and Histograms
Example 3 Continued
Number Enrolled
Frequency
1 – 10 1
11 – 20 4
21 – 30 5
31 – 40 2
Enrollment in WesternCivilization Classes
Step 2 Divide the data into equal intervals.
For this data set, use an interval of 10.
Step 3 List the intervals in the first column of the table. Count the number of data values in each interval and list the count in the last column. Give the table a title.

Holt Algebra 1
10-2 Frequency and Histograms
A histogram is a bar graph used to display the frequency of data divided into equal intervals. The bars must be of equal width and should touch, but not overlap.

Holt Algebra 1
10-2 Frequency and Histograms
Example 4: Making a Histogram
Use the frequency table in Example 2 to make a histogram.
Step 1 Use the scale and interval from the frequency table.
Step 2 Draw a bar for the number of classes in each interval.
Number Enrolled
Frequency
1 – 10 1
11 – 20 4
21 – 30 5
31 – 40 2
Enrollment in WesternCivilization Classes
All bars should be the same width. The bars should touch, but not overlap.

Holt Algebra 1
10-2 Frequency and Histograms
Example 4 Continued
Step 3 Title the graphand label the horizontal and vertical scales.

Holt Algebra 1
10-2 Frequency and Histograms
Measures of central tendency describe how data tends toward one value. You may also need to know how data is spread out across several values.
Quartiles divide a data set into four equal parts. Each quartile contains one-fourth of the values in the set. The interquartile range (IQR) is the difference between the upper and lower quartiles. The IQR represents the middle half of the data.

Holt Algebra 1
10-2 Frequency and Histograms

Holt Algebra 1
10-2 Frequency and Histograms
A box-and-whisker plot can be used to show how the values in a data set are distributed. The minimum is the least value that is not an outlier. The maximum is the greatest value that is not an outlier. You need five values to make a box-and-whisker plot: the minimum, first quartile, median, third quartile, and maximum.

Holt Algebra 1
10-2 Frequency and Histograms
Example 5: Sports Application
The number of runs scored by a softball team at 19 games is given. Use the data to make a box-and-whisker plot.
3, 8, 10, 12, 4, 9, 13, 20, 12, 15, 10, 5, 11, 5, 10, 6, 7, 6, 11
Step 1 Order the data from least to greatest.
3, 4, 5, 5, 6, 6, 7, 8, 9, 10, 10, 10, 11, 11, 12, 12, 13, 15, 20
Step 2 Identify the five needed values and determine whether there are any outliers.

Holt Algebra 1
10-2 Frequency and Histograms
Example 5 Continued
3, 4, 5, 5, 6, 6, 7, 8, 9, 10, 10, 10, 11, 11, 12, 12, 13, 15, 20
Q1
6
Q3
12
Q2
10
Minimum
3
Maximum
20

Holt Algebra 1
10-2 Frequency and Histograms
Example 5 Continued
Half of the scores are between 6 and 12 runs per game. One-fourth of the scores are between 3 and 6. The greatest score earned by this team is 20.
0 8 16 24
Median
First quartile Third quartile
● ●●● ●
Minimum Maximum

Holt Algebra 1
10-2 Frequency and Histograms
NOTES
For the following test scores: 65,67,72,72,75,82,83,85, 86,88,91,91,93,94, 96, 97,98,99,99
1. Find the A) mean, B)median, C) mode D) range
3. Use the data to create a frequency table and frequency histogram
2. Use the data to create a stem and leaf plot
4. Use the data to create a box and whisker plot