HOCKEY STICKS AND BROKEN STICKS A DESIGN FOR...
56
HOCKEY STICKS AND BROKEN STICKS – A DESIGN FOR A SINGLE-TREATMENT , PLACEBO-CONTROLLED, DOUBLE-BLIND, RANDOMIZED CLINICAL TRIAL SUITABLE FOR CHRONIC DISEASES Hans Hockey & Kristian Brock Biometrics Matters Ltd, Hamilton, NZ & Cancer Research UK Clinical Trials Unit, Birmingham, UK [email protected] BBS-EFSPI meeting, Basel, 27 June 2018 1
Transcript of HOCKEY STICKS AND BROKEN STICKS A DESIGN FOR...

HOCKEY STICKS AND BROKEN STICKS –A DESIGN FOR A SINGLE-TREATMENT,
PLACEBO-CONTROLLED, DOUBLE-BLIND, RANDOMIZED CLINICAL TRIAL SUITABLE
FOR CHRONIC DISEASES
Hans Hockey & Kristian BrockBiometrics Matters Ltd, Hamilton, NZ
& Cancer Research UK Clinical Trials Unit, Birmingham, UK
BBS-EFSPI meeting, Basel, 27 June 2018 1

HOCKEY STICKS AND BROKEN STICKS –A DESIGN FOR A SINGLE-TREATMENT,
PLACEBO-CONTROLLED, DOUBLE-BLIND, RANDOMIZED CLINICAL TRIAL SUITABLE
FOR CHRONIC DISEASES
Hans Hockey & Kristian BrockBiometrics Matters Ltd, Hamilton, NZ
& Cancer Research UK Clinical Trials Unit, Birmingham, UK
BBS-EFSPI meeting, Basel, 27 June 2018 2

AbstractThis work is motivated and exemplified by a genetic disorder causing early onset diabetes, blindness and deafness, which is extremely rare, inevitably fatal and has no current direct treatment. While the standard placebo-controlled RCT is the gold standard required by the regulatory agency for a new proposed drug study, it is conjectured that potential study participants will prefer a design which guarantees that they are always assigned to the drug under study. A design is proposed which meets this patient need and hence probably increases recruitment and compliance. At the same time, it meets the requirement for full randomization. Analyses which follow naturally from this design are also described and were used in trial simulations for sample sizing and for examination of the effect of underlying assumptions. 3

Talk outline• Motivating example clinical trial• Hockey sticks and broken sticks• A proposed design• Summary
4
Presenter
Presentation Notes
No maths

Talk outline• Motivating example clinical trial
5

Wolfram Syndrome
6

7
Wolfram syndrome case study

The TreatWolfram study
8
Presenter
Presentation Notes
A drug repurposing study. Cheaper. Quicker. Already have safety / toxicity data.

The TreatWolfram study● Treatment with sodium valproate, an epilepsy drug● Double-blind, randomised, placebo-controlled trial● International (4 countries)● Children and adults● Endpoint: Visual acuity (VA) – logMAR● N=70 (2:1) gives 80% power to detect 50% lowerrate of progression in VA with mixed model analysis● VA will be assessed at baseline and every 6 monthst = (0, 0.5, 1.0, 1.5, 2.0, 2.5, 3.0) years
9

Talk outline• Motivating example clinical trial• Hockey sticks and broken sticks
11

12
What are hockey sticks and broken sticks?

13
What are hockey sticks and broken sticks?

14
This is not a hockey stick
with apologies to René Magritte

15
This is the most famous hockey stick

16
This is the most famous hockey stick

0 1 2 3 4 5 6 7 8 9
Study months
0
1
2
3
4
5
6
7
8
9
10
Res
pons
eSome data
17

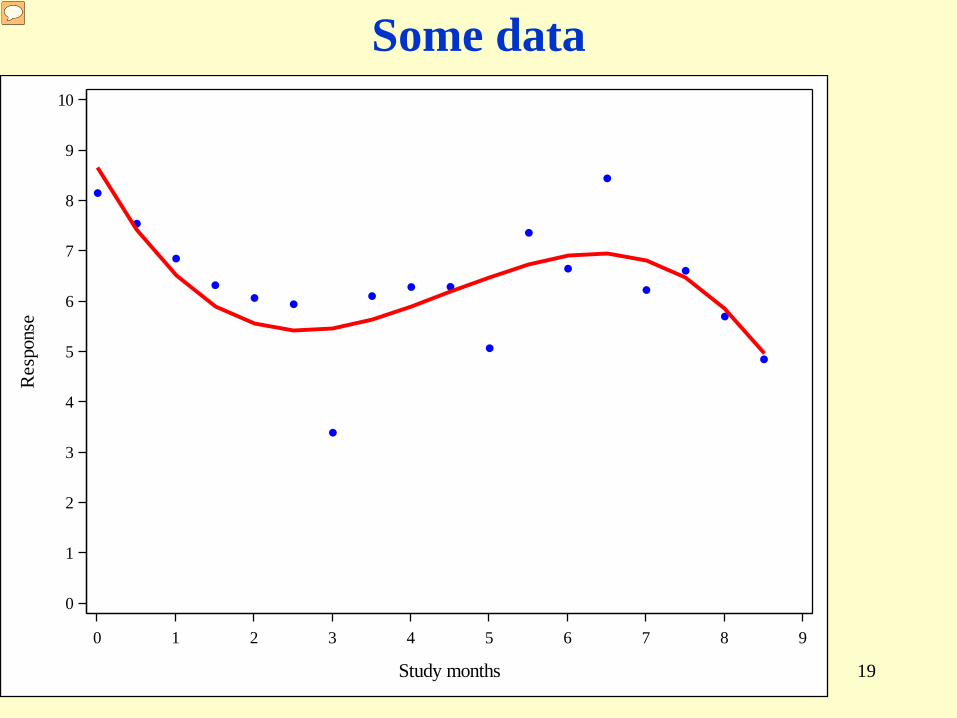
Some data
0 1 2 3 4 5 6 7 8 9
Study months
0
1
2
3
4
5
6
7
8
9
10
Res
pons
e
18
Presenter
Presentation Notes
Locally weighted scatterplot smoothing fit (loess)
Some data
0 1 2 3 4 5 6 7 8 9
Study months
0
1
2
3
4
5
6
7
8
9
10
Res
pons
e
19
Presenter
Presentation Notes
EMS=.765, 3 df Outlier?

Data for broken stick model?
0 1 2 3 4 5 6 7 8 9
Study months
0
1
2
3
4
5
6
7
8
9
10
Res
pons
e
Active Placebo Active
20
Presenter
Presentation Notes
N of 1 study

Data for broken stick model?
0 1 2 3 4 5 6 7 8 9
Study months
0
1
2
3
4
5
6
7
8
9
10
Res
pons
e
Active Placebo Active
21
Presenter
Presentation Notes
EMS=.652, error df = 14, Model df = 3

Data for broken stick model?
0 1 2 3 4 5 6 7 8 9
Study months
0
1
2
3
4
5
6
7
8
9
10
Res
pons
e
Active Placebo Active
22
Presenter
Presentation Notes
EMS=.627, error df = 15 Model df = 2

Data for broken stick model?
0 1 2 3 4 5 6 7 8 9
Study months
0
1
2
3
4
5
6
7
8
9
10
Res
pons
e
Active Placebo Active
23
Presenter
Presentation Notes
Not an outlier at all.

How to fit hockey stick models?model y = x; *simple linear model;
model y = x x2; *hockey stick model, one break;
x x2 y yhat300 0 4.75 4.71340 0 4.40 4.58400 0 4.52 4.38425 0 4.42 4.30460 0 4.10 4.18480 0 4.27 4.12500 0 . 4.05570 70 3.55 3.43600 100 2.90 3.16650 150 2.57 2.71675 175 2.21 2.49720 220 2.49 2.09800 300 1.39 1.38
24
Presenter
Presentation Notes
X=500 for plotting purposes only

How to fit hockey stick models with pivot point to be estimated?
proc nlin;
parameters Pivotx Pivoty SlopeBefore SlopeChange;
Before = (x le Pivotx)*(x - Pivotx);After = (x gt Pivotx)*(x - Pivotx);
model y = Pivoty + SlopeBefore*Before + SlopeChange*After;
run;
25

Talk outline• Motivating example clinical trial• Hockey sticks and broken sticks• A proposed design
28

Figure 1: What is the design and what is the model? Based on historical dataFigure 1: What is the design and what is the model? Based on historical data
-0.5 0.0 0.5 1.0 1.5 2.0 2.5 3.0 3.5
Year in study
-0.25
-0.20
-0.15
-0.10
-0.05
0.00
0.05
0.10
0.15
0.20
0.25
Shi
fted
VA

Figure 2: What is the current design and what is the model?Figure 2: What is the current design and what is the model?
-0.5 0.0 0.5 1.0 1.5 2.0 2.5 3.0 3.5
Year in study
-0.25
-0.20
-0.15
-0.10
-0.05
0.00
0.05
0.10
0.15
0.20
0.25
Shi
fted
VA

Figure 3: What is the proposed design and what is the model?Figure 3: What is the proposed design and what is the model?
-0.5 0.0 0.5 1.0 1.5 2.0 2.5 3.0 3.5
Year in study
-0.25
-0.20
-0.15
-0.10
-0.05
0.00
0.05
0.10
0.15
0.20
0.25
Shi
fted
VA

Figure 4: What is the proposed design and what is the model?Figure 4: What is the proposed design and what is the model?
-0.5 0.0 0.5 1.0 1.5 2.0 2.5 3.0 3.5
Year in study
-0.25
-0.20
-0.15
-0.10
-0.05
0.00
0.05
0.10
0.15
0.20
0.25
Shi
fted
VA

Figure 5: Simulation model based on treatment effect on slopeFigure 5: Simulation model based on treatment effect on slope
0 5 10 15 20 25 30 35
Age (years)
0.0
0.5
1.0
1.5
2.0
VA
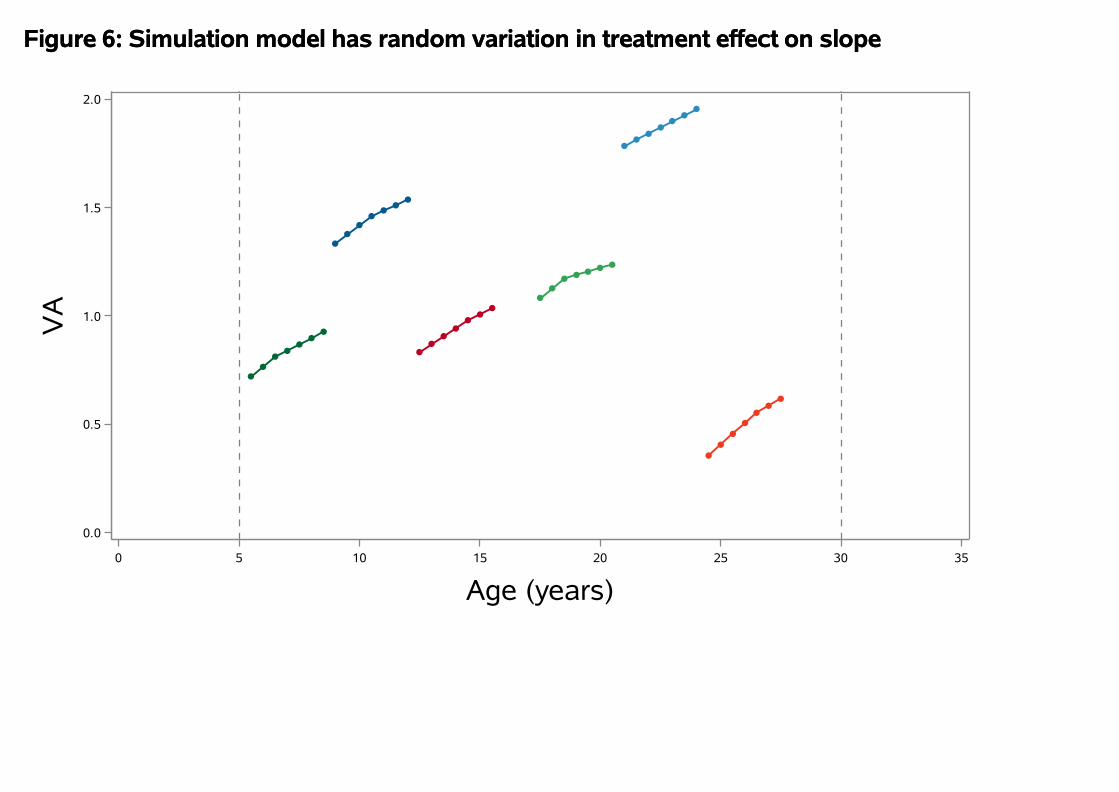
Figure 6: Simulation model has random variation in treatment effect on slopeFigure 6: Simulation model has random variation in treatment effect on slope
0 5 10 15 20 25 30 35
Age (years)
0.0
0.5
1.0
1.5
2.0
VA

Figure 7: Simulation model adds random error to each time of VA assessmentFigure 7: Simulation model adds random error to each time of VA assessment
0 5 10 15 20 25 30 35
Age (years)
0.0
0.5
1.0
1.5
2.0
VA

Figure 8: Simulated data shifted to age relative to treatment startFigure 8: Simulated data shifted to age relative to treatment start
-17.5 -15.0 -12.5 -10.0 -7.5 -5.0 -2.5 0.0 2.5 5.0 7.5 10.0 12.5 15.0 17.5
Age relative to treatment start
0.0
0.5
1.0
1.5
2.0
VA
-1.5 1.5

Figure 9: Simulated data shifted to study year over three yearsFigure 9: Simulated data shifted to study year over three years
-0.5 0.0 0.5 1.0 1.5 2.0 2.5 3.0 3.5
Year in study
-0.25
-0.20
-0.15
-0.10
-0.05
0.00
0.05
0.10
0.15
0.20
0.25
Shi
fted
VA

Figure 10: Simulated data shifted to year of treatment with underlying modelFigure 10: Simulated data shifted to year of treatment with underlying model
-2.0 -1.5 -1.0 -0.5 0.0 0.5 1.0 1.5 2.0
Year relative to treatment start
-0.25
-0.20
-0.15
-0.10
-0.05
0.00
0.05
0.10
0.15
0.20
0.25
Shi
fted
VA

Figure 11: Simulated data shifted to year of treatment with underlying modelFigure 11: Simulated data shifted to year of treatment with underlying model
-2.0 -1.5 -1.0 -0.5 0.0 0.5 1.0 1.5 2.0
Year relative to treatment start
-0.25
-0.20
-0.15
-0.10
-0.05
0.00
0.05
0.10
0.15
0.20
0.25
Shi
fted
VA

Figure 12: Simple hockey/broken stick model fitEffect Estimate SE DF t Value Pr > |t|SlopeChangeYear -0.04183 0.01279 39 -3.27 0.0023
Figure 12: Simple hockey/broken stick model fitEffect Estimate SE DF t Value Pr > |t|SlopeChangeYear -0.04183 0.01279 39 -3.27 0.0023
-2.0 -1.5 -1.0 -0.5 0.0 0.5 1.0 1.5 2.0
Year relative to treatment start
-0.25
-0.20
-0.15
-0.10
-0.05
0.00
0.05
0.10
0.15
0.20
0.25
Shi
fted
VA

Hockey stick model RC estimatesSolution for Fixed Effects
StandardEffect Estimate Error DF t Value Pr > |t|
0.001594 0.009252 5 0.17 0.87000.08741 0.01045 5 8.36 0.0004
Intercept TrtYear SlopeChangeYear -0.03953 0.01898 5 -2.08 0.0918
Solution for Random EffectsPt Std Err
Effect No Estimate Pred DF t Value Pr > |t|
Intercept 1 -0.01338 0.01176 24 -1.14 0.2668TrtYear 1 -0.01475 0.01383 24 -1.07 0.2967SlopeChangeYear 1 0.02897 0.02589 24 1.12 0.2742Intercept 2 -0.01072 0.01205 24 -0.89 0.3824TrtYear 2 -0.01212 0.01394 24 -0.87 0.3931SlopeChangeYear 2 0.02340 0.02638 24 0.89 0.3838Intercept 3 -0.00245 0.01149 24 -0.21 0.8330TrtYear 3 -0.00263 0.01311 24 -0.20 0.8424SlopeChangeYear 3 0.005263 0.02503 24 0.21 0.8353Intercept 4 0.009073 0.01176 24 0.77 0.4481TrtYear 4 0.01044 0.01383 24 0.75 0.4578SlopeChangeYear 4 -0.01992 0.02589 24 -0.77 0.4491Intercept 5 -0.00329 0.01205 24 -0.27 0.7871TrtYear 5 -0.00513 0.01394 24 -0.37 0.7161SlopeChangeYear 5 0.008071 0.02638 24 0.31 0.7622Intercept 6 0.02076 0.01149 24 1.81 0.0834TrtYear 6 0.02420 0.01311 24 1.85 0.0772SlopeChangeYear 6 -0.04578 0.02503 24 -1.83 0.0799
45

Figure 13: RC broken stick model with per patient predicted lines (random effect)Effect Estimate SE DF t Value Pr > |t|SlopeChangeYear -0.03953 0.01898 5 -2.08 0.0918
Figure 13: RC broken stick model with per patient predicted lines (random effect)Effect Estimate SE DF t Value Pr > |t|SlopeChangeYear -0.03953 0.01898 5 -2.08 0.0918
-2.0 -1.5 -1.0 -0.5 0.0 0.5 1.0 1.5 2.0
Year relative to treatment start
-0.25
-0.20
-0.15
-0.10
-0.05
0.00
0.05
0.10
0.15
0.20
0.25
Shi
fted
VA

Figure 14: Per patient (fixed effect) broken stick model predicted linesFigure 14: Per patient (fixed effect) broken stick model predicted lines
-2.0 -1.5 -1.0 -0.5 0.0 0.5 1.0 1.5 2.0
Year relative to treatment start
-0.25
-0.20
-0.15
-0.10
-0.05
0.00
0.05
0.10
0.15
0.20
0.25
Shi
fted
VA

Figure 15: RC broken stick model standardized to same initial slopeEffect Estimate SE DF t Value Pr > |t|SlopeChangeYear -0.03953 0.01898 5 -2.08 0.0918
Figure 15: RC broken stick model standardized to same initial slopeEffect Estimate SE DF t Value Pr > |t|SlopeChangeYear -0.03953 0.01898 5 -2.08 0.0918
-2.0 -1.5 -1.0 -0.5 0.0 0.5 1.0 1.5 2.0
Year relative to treatment start
-0.25
-0.20
-0.15
-0.10
-0.05
0.00
0.05
0.10
0.15
0.20
0.25
Shi
fted
VA

Figure 16: RC broken stick model standardized to same initial slope, with jitterEffect Estimate SE DF t Value Pr > |t|SlopeChangeYear -0.03953 0.01898 5 -2.08 0.0918
Figure 16: RC broken stick model standardized to same initial slope, with jitterEffect Estimate SE DF t Value Pr > |t|SlopeChangeYear -0.03953 0.01898 5 -2.08 0.0918
-2.0 -1.5 -1.0 -0.5 0.0 0.5 1.0 1.5 2.0
Year relative to treatment start
-0.25
-0.20
-0.15
-0.10
-0.05
0.00
0.05
0.10
0.15
0.20
0.25
Shi
fted
VA

Figure 17: Broken stick model fit with pivot point estimated (non-linear model)Parameter EstimatePivotx -212E-17
Figure 17: Broken stick model fit with pivot point estimated (non-linear model)Parameter EstimatePivotx -212E-17
-2.0 -1.5 -1.0 -0.5 0.0 0.5 1.0 1.5 2.0
Year relative to treatment start
-0.25
-0.20
-0.15
-0.10
-0.05
0.00
0.05
0.10
0.15
0.20
0.25
Shi
fted
VA

Figure 18: Broken stick model fit with pivot point estimated (non-linear mixed model)Parameter EstimatePivotx -0.00047
Figure 18: Broken stick model fit with pivot point estimated (non-linear mixed model)Parameter EstimatePivotx -0.00047
-2.0 -1.5 -1.0 -0.5 0.0 0.5 1.0 1.5 2.0
Year relative to treatment start
-0.25
-0.20
-0.15
-0.10
-0.05
0.00
0.05
0.10
0.15
0.20
0.25
Shi
fted
VA

Talk outline• Motivating example clinical trial• Hockey sticks and broken sticks• A proposed design• Summary
31

Figure 2: Current design
-0.5 0.0 0.5 1.0 1.5 2.0 2.5 3.0 3.5
Year in study
-0.25
-0.20
-0.15
-0.10
-0.05
0.00
0.05
0.10
0.15
0.20
0.25
Shi
fted
VA

Figure 3: Proposed design
-0.5 0.0 0.5 1.0 1.5 2.0 2.5 3.0 3.5
Year in study
-0.25
-0.20
-0.15
-0.10
-0.05
0.00
0.05
0.10
0.15
0.20
0.25
Shi
fted
VA

32
Consider a Hockey stick design when:
33
Consider a hockey stick design when:

34
Consider a hockey stick design when:
● No current treatment exists, but● Placebo is unethical, or having no placeboencourages recruitment● Randomization is mandatory● Meets patient preference● Study is longitudinal, because● Disease is chronic, long-term● Response is continuous, not greatly variable● Drug effect is more rapid than size of gap● (Endpoint data history available and valid helps)
Presenter
Presentation Notes
Not necessarily orphan. Having history allows quicker start on treatment

35
Simulations?Why?

35
Simulations?Why?
● Within-patient studies should be more powerful thanbetween-patient (and more informative of mechanism)● Realistic differential dropout simulation must favourhockey stick design● Equal replication of two treatments being comparedis more powerful than unequal replication ...

36
Three patients on either design (9 years total)1:2
1:1

References
Google:Broken stick modelsHockey stick model
Line segment regressionInterrupted time series (ITS)
....
37

Thank you for your attention!
38

Thank you for your attention!
This presentation has been brought to you by:
39