
HOBO Pendant G Data Logger (UA-004-64) White Paper · HOBO® Pendant® G Data Logger (UA-004-64)...
14
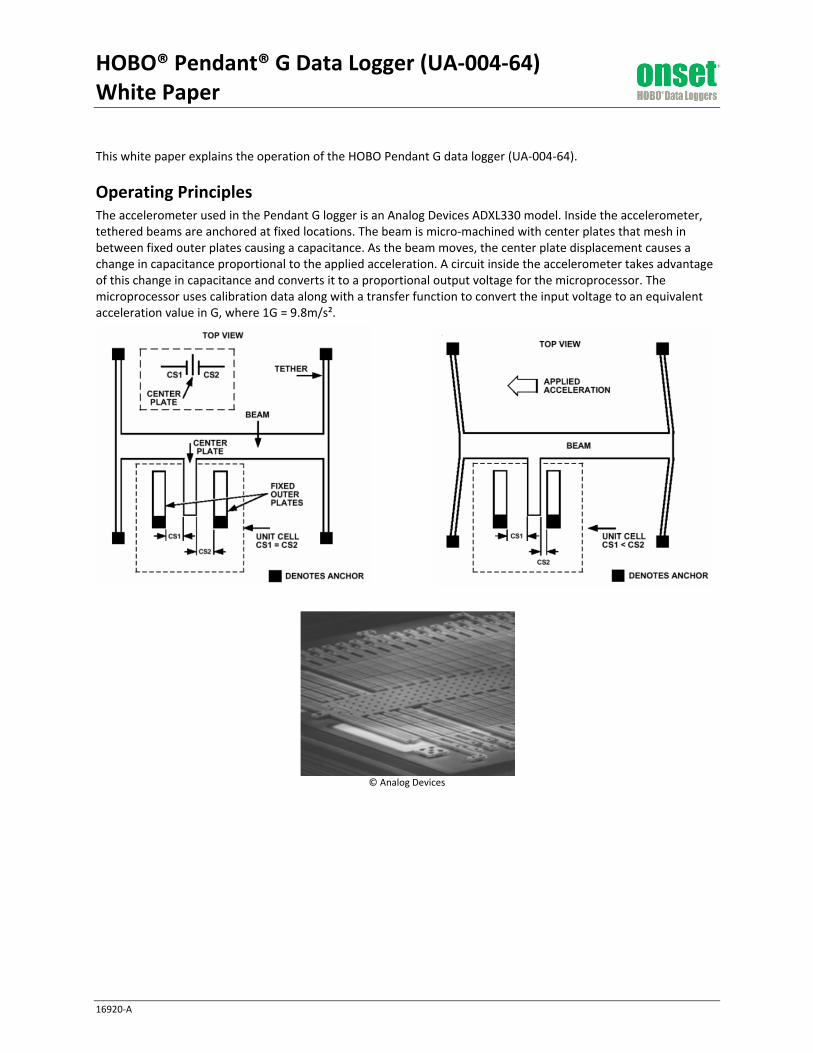
HOBO® Pendant® G Data Logger (UA-004-64) White Paper 16920-A This white paper explains the operation of the HOBO Pendant G data logger (UA-004-64). Operating Principles The accelerometer used in the Pendant G logger is an Analog Devices ADXL330 model. Inside the accelerometer, tethered beams are anchored at fixed locations. The beam is micro-machined with center plates that mesh in between fixed outer plates causing a capacitance. As the beam moves, the center plate displacement causes a change in capacitance proportional to the applied acceleration. A circuit inside the accelerometer takes advantage of this change in capacitance and converts it to a proportional output voltage for the microprocessor. The microprocessor uses calibration data along with a transfer function to convert the input voltage to an equivalent acceleration value in G, where 1G = 9.8m/s². © Analog Devices
Transcript of HOBO Pendant G Data Logger (UA-004-64) White Paper · HOBO® Pendant® G Data Logger (UA-004-64)...
HOBO® Pendant® G Data Logger (UA-004-64) White Paper
16920-A
This white paper explains the operation of the HOBO Pendant G data logger (UA-004-64).
Operating Principles The accelerometer used in the Pendant G logger is an Analog Devices ADXL330 model. Inside the accelerometer, tethered beams are anchored at fixed locations. The beam is micro-machined with center plates that mesh in between fixed outer plates causing a capacitance. As the beam moves, the center plate displacement causes a change in capacitance proportional to the applied acceleration. A circuit inside the accelerometer takes advantage of this change in capacitance and converts it to a proportional output voltage for the microprocessor. The microprocessor uses calibration data along with a transfer function to convert the input voltage to an equivalent acceleration value in G, where 1G = 9.8m/s².
© Analog Devices
HOBO Pendant G White Paper
1-800-LOGGERS 2 www.onsetcomp.com
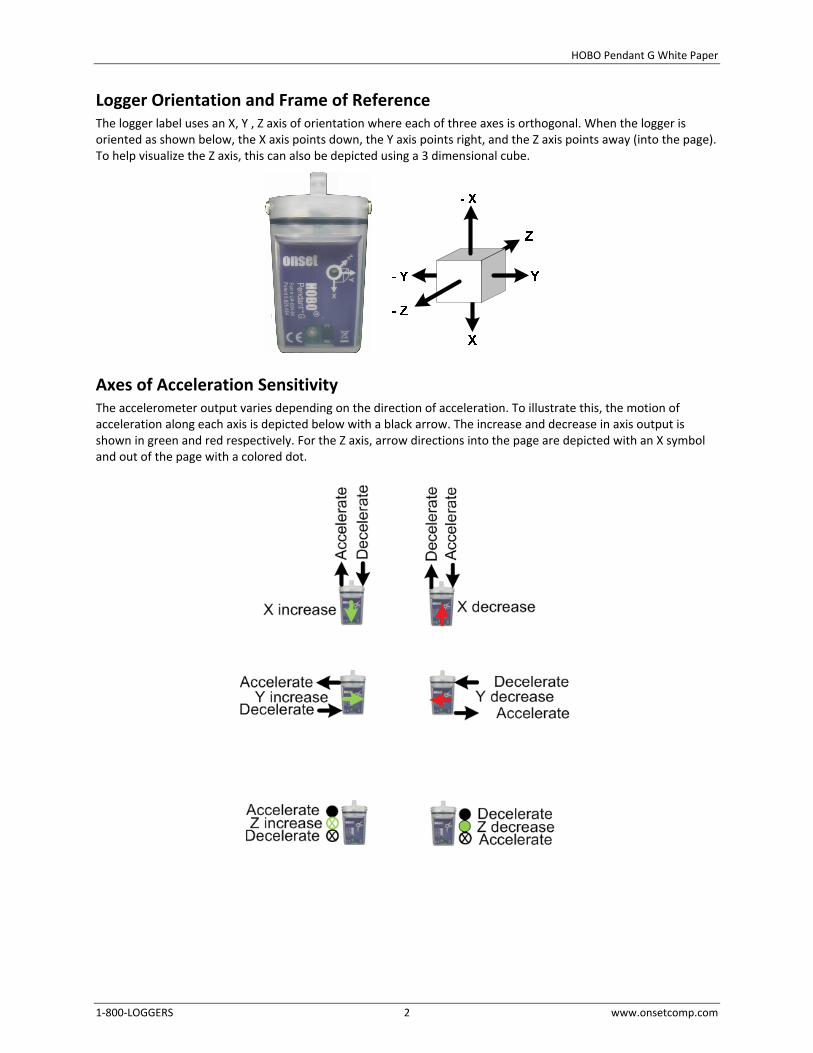
Logger Orientation and Frame of Reference The logger label uses an X, Y , Z axis of orientation where each of three axes is orthogonal. When the logger is oriented as shown below, the X axis points down, the Y axis points right, and the Z axis points away (into the page). To help visualize the Z axis, this can also be depicted using a 3 dimensional cube.
Axes of Acceleration Sensitivity The accelerometer output varies depending on the direction of acceleration. To illustrate this, the motion of acceleration along each axis is depicted below with a black arrow. The increase and decrease in axis output is shown in green and red respectively. For the Z axis, arrow directions into the page are depicted with an X symbol and out of the page with a colored dot.
HOBO Pendant G White Paper
1-800-LOGGERS 3 www.onsetcomp.com
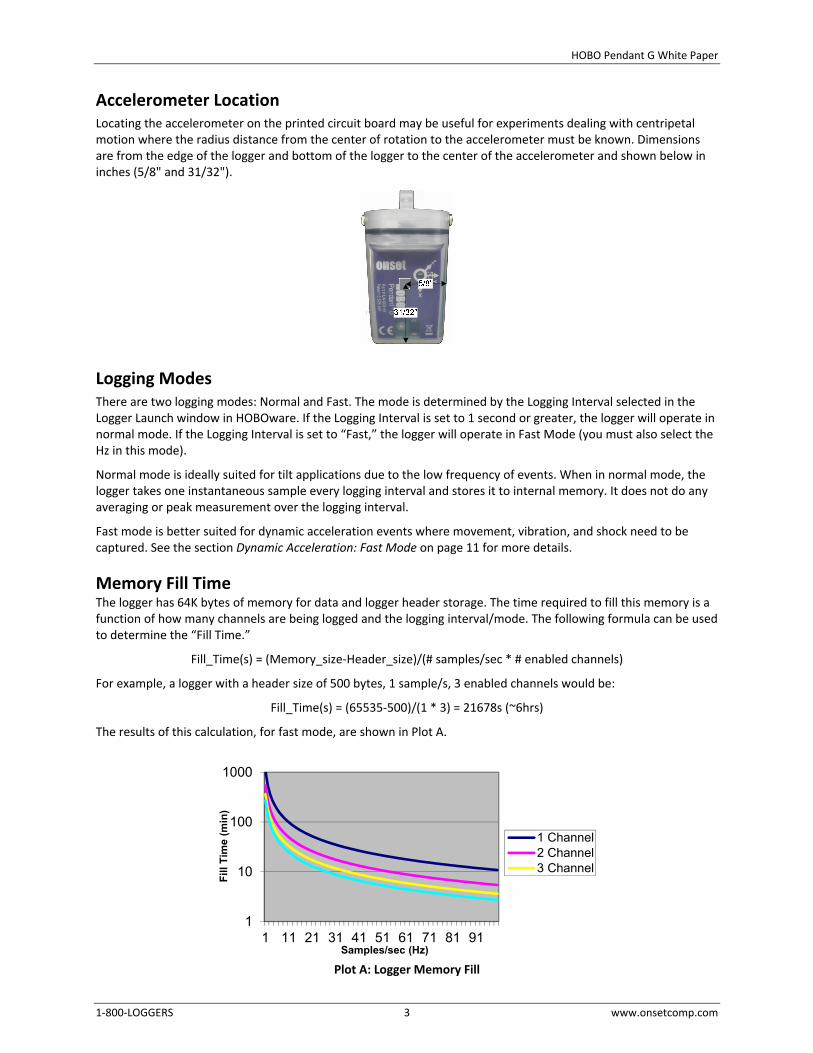
Accelerometer Location Locating the accelerometer on the printed circuit board may be useful for experiments dealing with centripetal motion where the radius distance from the center of rotation to the accelerometer must be known. Dimensions are from the edge of the logger and bottom of the logger to the center of the accelerometer and shown below in inches (5/8" and 31/32").
Logging Modes There are two logging modes: Normal and Fast. The mode is determined by the Logging Interval selected in the Logger Launch window in HOBOware. If the Logging Interval is set to 1 second or greater, the logger will operate in normal mode. If the Logging Interval is set to “Fast,” the logger will operate in Fast Mode (you must also select the Hz in this mode).
Normal mode is ideally suited for tilt applications due to the low frequency of events. When in normal mode, the logger takes one instantaneous sample every logging interval and stores it to internal memory. It does not do any averaging or peak measurement over the logging interval.
Fast mode is better suited for dynamic acceleration events where movement, vibration, and shock need to be captured. See the section Dynamic Acceleration: Fast Mode on page 11 for more details.
Memory Fill Time The logger has 64K bytes of memory for data and logger header storage. The time required to fill this memory is a function of how many channels are being logged and the logging interval/mode. The following formula can be used to determine the “Fill Time.”
Fill_Time(s) = (Memory_size-Header_size)/(# samples/sec * # enabled channels)
For example, a logger with a header size of 500 bytes, 1 sample/s, 3 enabled channels would be:
Fill_Time(s) = (65535-500)/(1 * 3) = 21678s (~6hrs)
The results of this calculation, for fast mode, are shown in Plot A.
Plot A: Logger Memory Fill
1
10
100
1000
1 11 21 31 41 51 61 71 81 91
Fill
Tim
e (m
in)
Samples/sec (Hz)
1 Channel2 Channel3 Channel
HOBO Pendant G White Paper
1-800-LOGGERS 4 www.onsetcomp.com
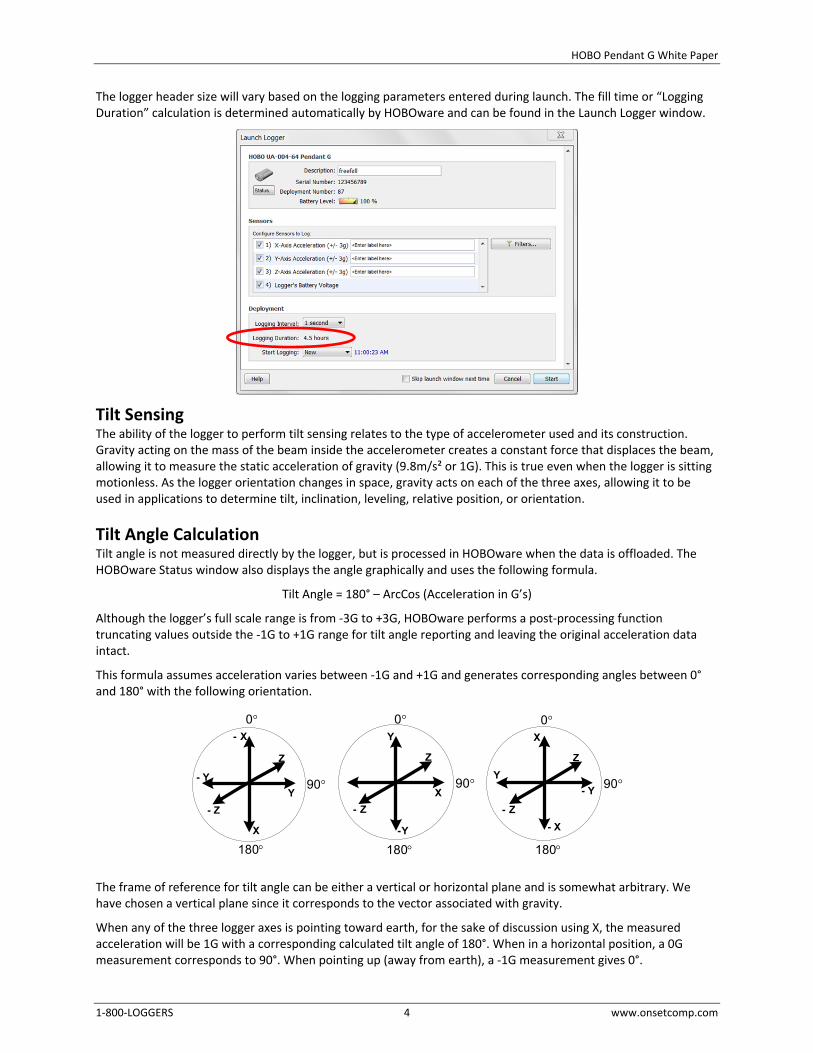
The logger header size will vary based on the logging parameters entered during launch. The fill time or “Logging Duration” calculation is determined automatically by HOBOware and can be found in the Launch Logger window.
Tilt Sensing The ability of the logger to perform tilt sensing relates to the type of accelerometer used and its construction. Gravity acting on the mass of the beam inside the accelerometer creates a constant force that displaces the beam, allowing it to measure the static acceleration of gravity (9.8m/s² or 1G). This is true even when the logger is sitting motionless. As the logger orientation changes in space, gravity acts on each of the three axes, allowing it to be used in applications to determine tilt, inclination, leveling, relative position, or orientation.
Tilt Angle Calculation Tilt angle is not measured directly by the logger, but is processed in HOBOware when the data is offloaded. The HOBOware Status window also displays the angle graphically and uses the following formula.
Tilt Angle = 180° – ArcCos (Acceleration in G’s)
Although the logger’s full scale range is from -3G to +3G, HOBOware performs a post-processing function truncating values outside the -1G to +1G range for tilt angle reporting and leaving the original acceleration data intact.
This formula assumes acceleration varies between -1G and +1G and generates corresponding angles between 0° and 180° with the following orientation.
- X
Z
- Z
X
Y
- Y
180°
90°
0°Y
Z
- Z
-Y
X
180°
90°
0°
- X
Z
- Z
X
Y
- Y
180°
90°
0°
The frame of reference for tilt angle can be either a vertical or horizontal plane and is somewhat arbitrary. We have chosen a vertical plane since it corresponds to the vector associated with gravity.
When any of the three logger axes is pointing toward earth, for the sake of discussion using X, the measured acceleration will be 1G with a corresponding calculated tilt angle of 180°. When in a horizontal position, a 0G measurement corresponds to 90°. When pointing up (away from earth), a -1G measurement gives 0°.
HOBO Pendant G White Paper
1-800-LOGGERS 5 www.onsetcomp.com
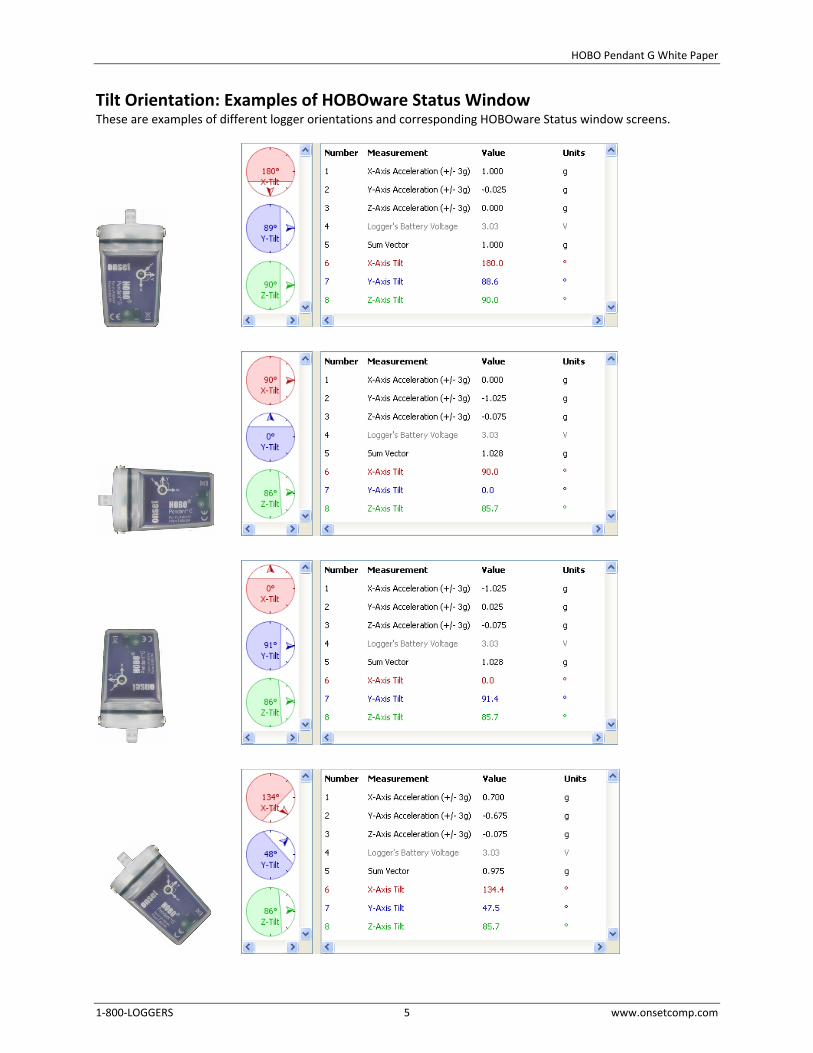
Tilt Orientation: Examples of HOBOware Status Window These are examples of different logger orientations and corresponding HOBOware Status window screens.
HOBO Pendant G White Paper
1-800-LOGGERS 6 www.onsetcomp.com
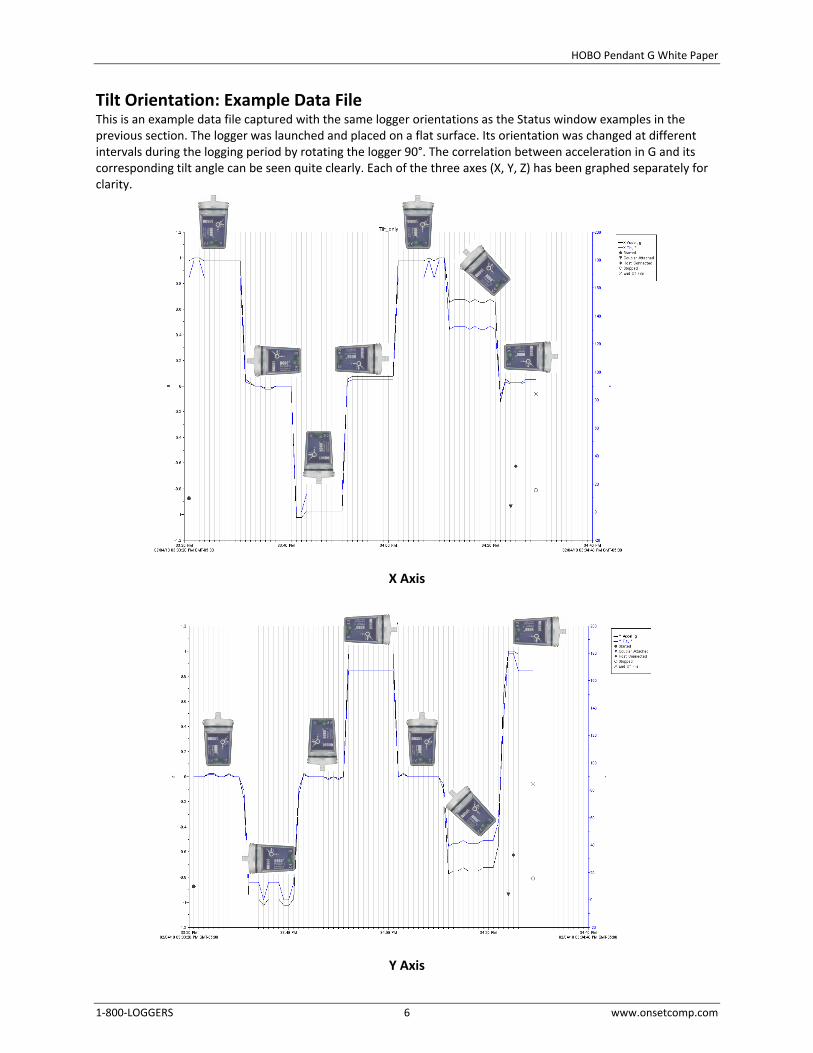
Tilt Orientation: Example Data File This is an example data file captured with the same logger orientations as the Status window examples in the previous section. The logger was launched and placed on a flat surface. Its orientation was changed at different intervals during the logging period by rotating the logger 90°. The correlation between acceleration in G and its corresponding tilt angle can be seen quite clearly. Each of the three axes (X, Y, Z) has been graphed separately for clarity.
X Axis
Y Axis
HOBO Pendant G White Paper
1-800-LOGGERS 7 www.onsetcomp.com
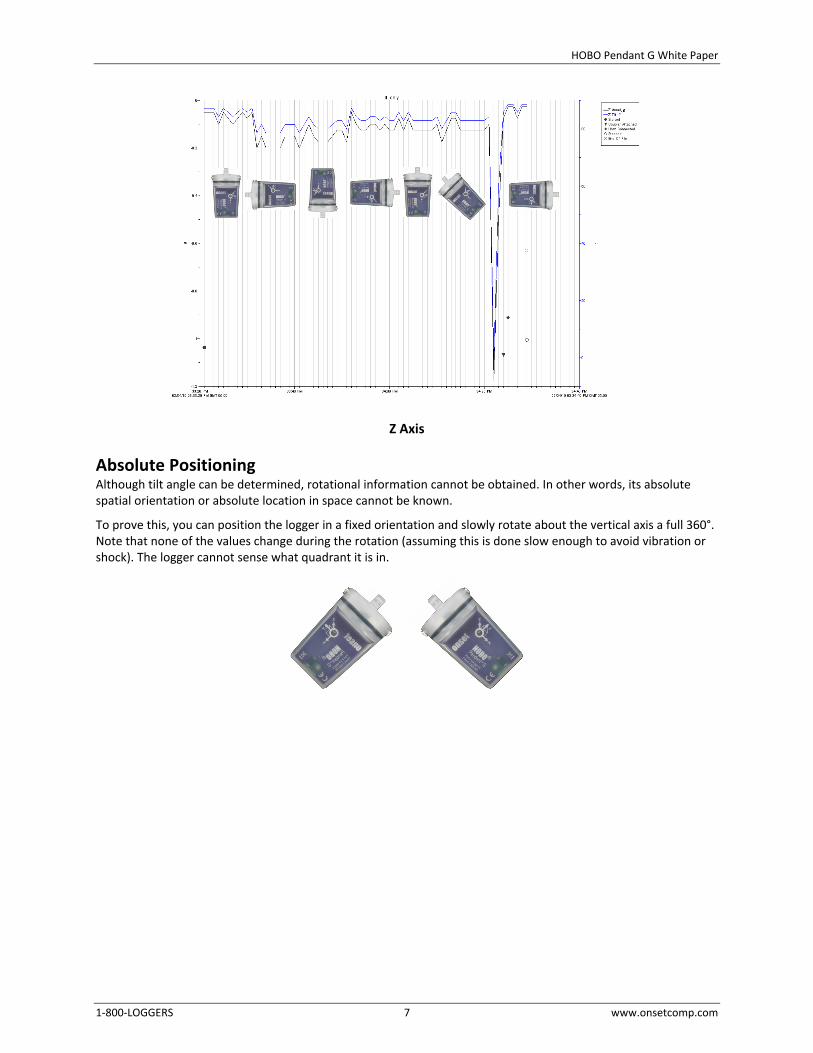
Z Axis
Absolute Positioning Although tilt angle can be determined, rotational information cannot be obtained. In other words, its absolute spatial orientation or absolute location in space cannot be known.
To prove this, you can position the logger in a fixed orientation and slowly rotate about the vertical axis a full 360°. Note that none of the values change during the rotation (assuming this is done slow enough to avoid vibration or shock). The logger cannot sense what quadrant it is in.
HOBO Pendant G White Paper
1-800-LOGGERS 8 www.onsetcomp.com
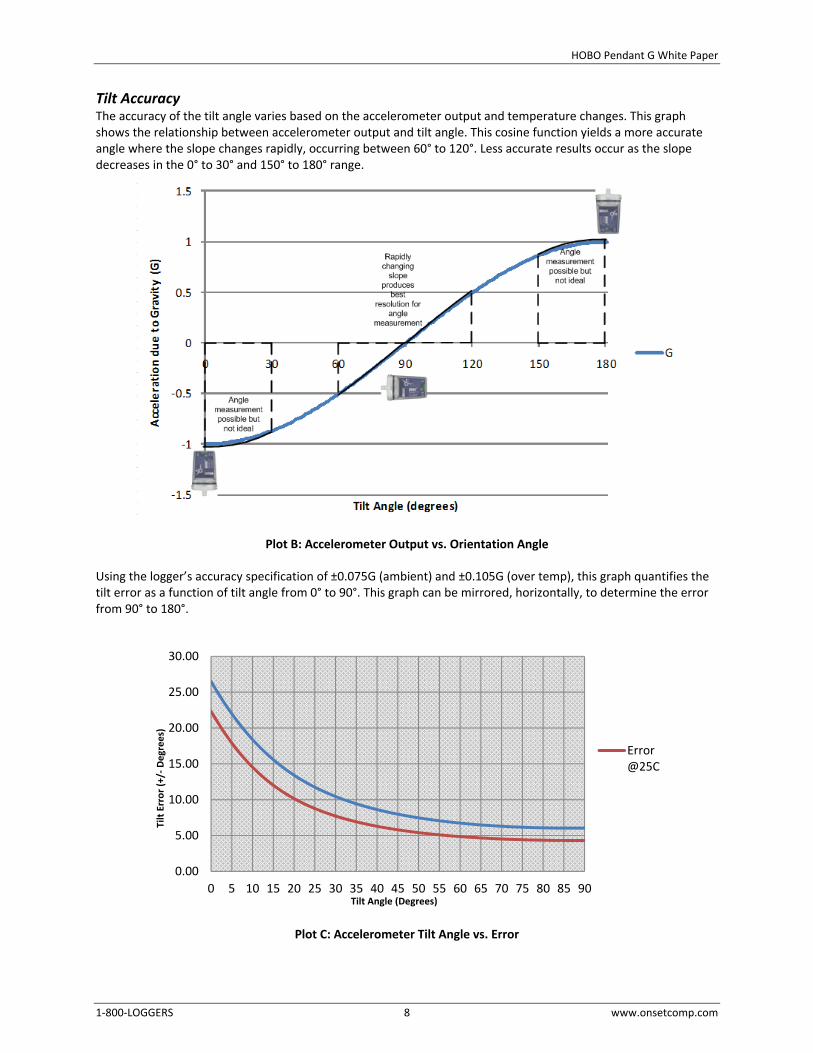
Tilt Accuracy The accuracy of the tilt angle varies based on the accelerometer output and temperature changes. This graph shows the relationship between accelerometer output and tilt angle. This cosine function yields a more accurate angle where the slope changes rapidly, occurring between 60° to 120°. Less accurate results occur as the slope decreases in the 0° to 30° and 150° to 180° range.
Plot B: Accelerometer Output vs. Orientation Angle
Using the logger’s accuracy specification of ±0.075G (ambient) and ±0.105G (over temp), this graph quantifies the tilt error as a function of tilt angle from 0° to 90°. This graph can be mirrored, horizontally, to determine the error from 90° to 180°.
Plot C: Accelerometer Tilt Angle vs. Error
0.00
5.00
10.00
15.00
20.00
25.00
30.00
0 5 10 15 20 25 30 35 40 45 50 55 60 65 70 75 80 85 90
Tilt
Erro
r (+/
-Deg
rees
)
Tilt Angle (Degrees)
Error@25C
HOBO Pendant G White Paper
1-800-LOGGERS 9 www.onsetcomp.com
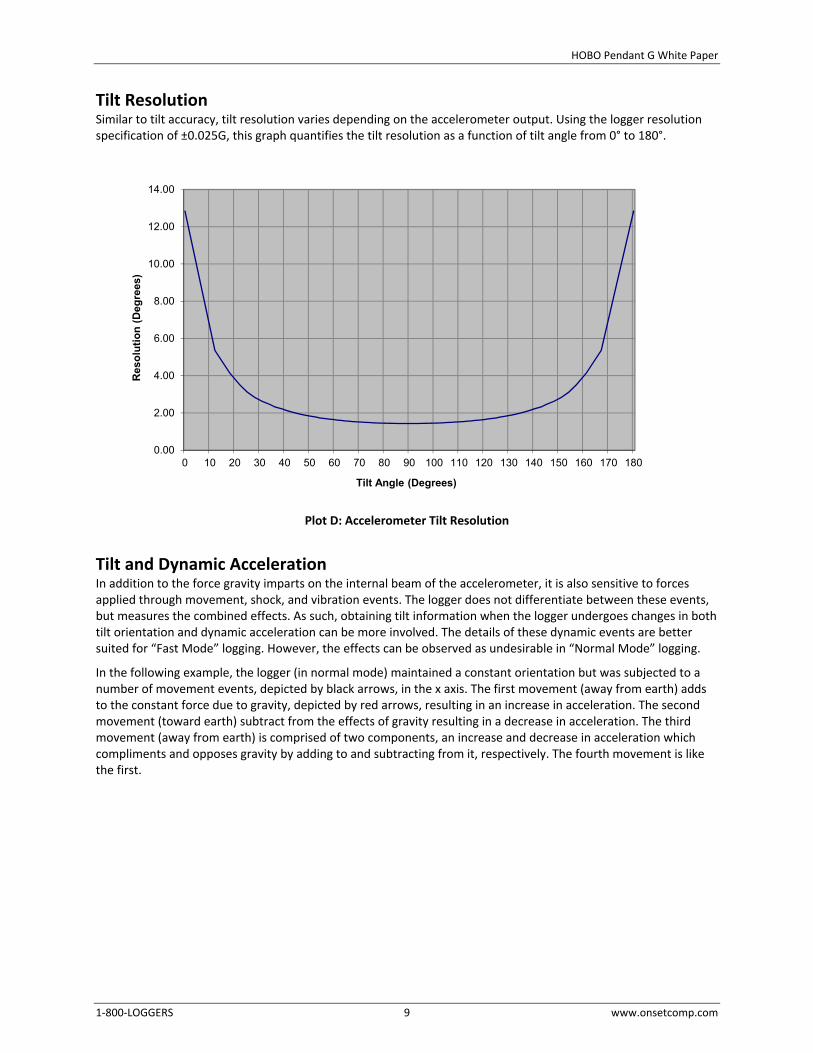
Tilt Resolution Similar to tilt accuracy, tilt resolution varies depending on the accelerometer output. Using the logger resolution specification of ±0.025G, this graph quantifies the tilt resolution as a function of tilt angle from 0° to 180°.
Plot D: Accelerometer Tilt Resolution
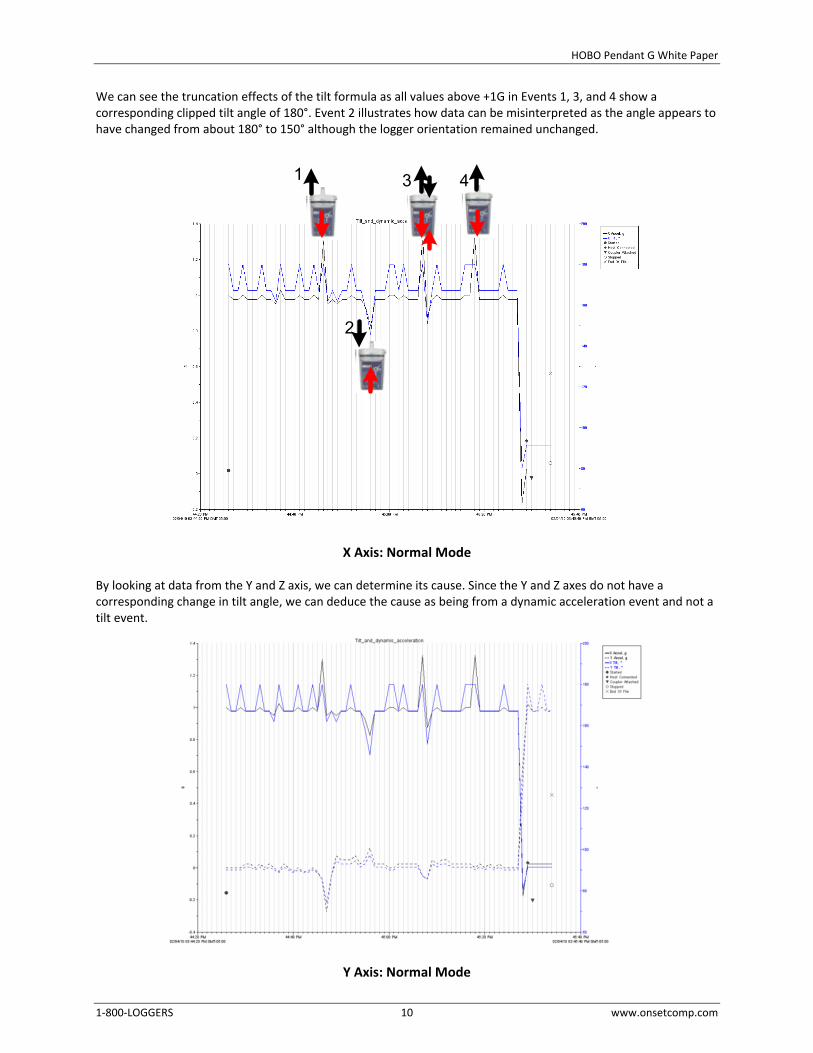
Tilt and Dynamic Acceleration In addition to the force gravity imparts on the internal beam of the accelerometer, it is also sensitive to forces applied through movement, shock, and vibration events. The logger does not differentiate between these events, but measures the combined effects. As such, obtaining tilt information when the logger undergoes changes in both tilt orientation and dynamic acceleration can be more involved. The details of these dynamic events are better suited for “Fast Mode” logging. However, the effects can be observed as undesirable in “Normal Mode” logging.
In the following example, the logger (in normal mode) maintained a constant orientation but was subjected to a number of movement events, depicted by black arrows, in the x axis. The first movement (away from earth) adds to the constant force due to gravity, depicted by red arrows, resulting in an increase in acceleration. The second movement (toward earth) subtract from the effects of gravity resulting in a decrease in acceleration. The third movement (away from earth) is comprised of two components, an increase and decrease in acceleration which compliments and opposes gravity by adding to and subtracting from it, respectively. The fourth movement is like the first.
0.00
2.00
4.00
6.00
8.00
10.00
12.00
14.00
0 10 20 30 40 50 60 70 80 90 100 110 120 130 140 150 160 170 180
Res
olu
tio
n (
Deg
rees
)
Tilt Angle (Degrees)
HOBO Pendant G White Paper
1-800-LOGGERS 10 www.onsetcomp.com
We can see the truncation effects of the tilt formula as all values above +1G in Events 1, 3, and 4 show a corresponding clipped tilt angle of 180°. Event 2 illustrates how data can be misinterpreted as the angle appears to have changed from about 180° to 150° although the logger orientation remained unchanged.
1
2
3 4
X Axis: Normal Mode
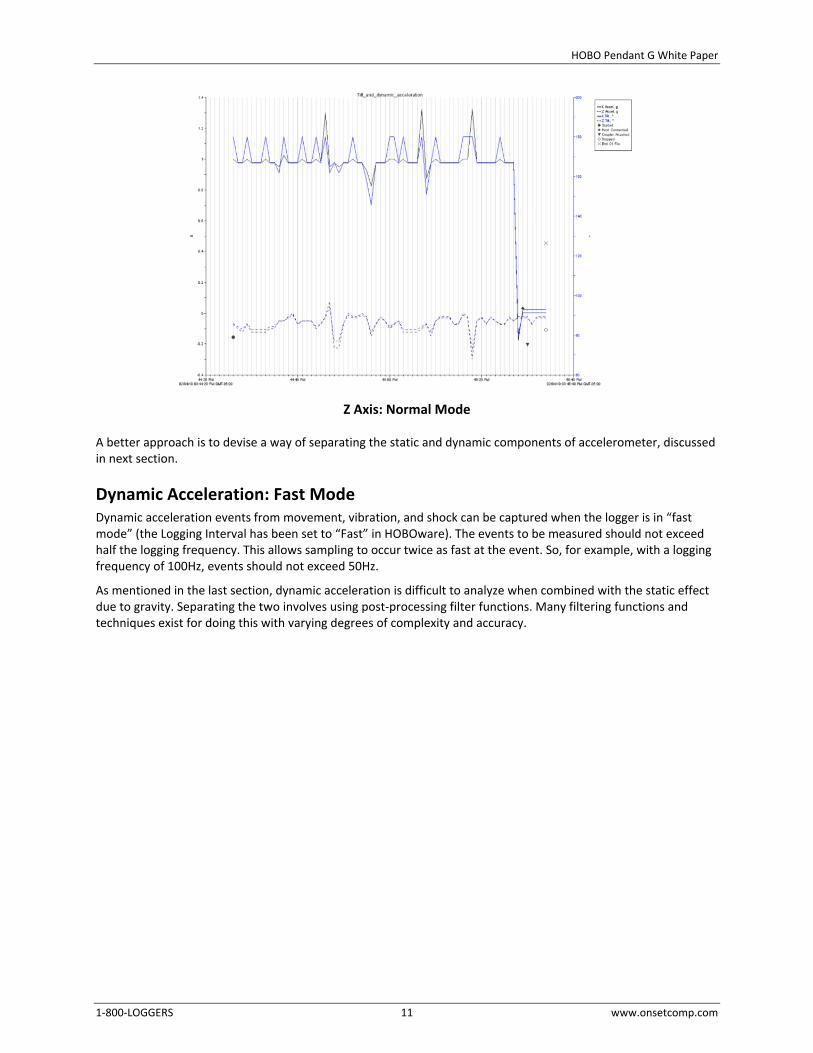
By looking at data from the Y and Z axis, we can determine its cause. Since the Y and Z axes do not have a corresponding change in tilt angle, we can deduce the cause as being from a dynamic acceleration event and not a tilt event.
Y Axis: Normal Mode
HOBO Pendant G White Paper
1-800-LOGGERS 11 www.onsetcomp.com
Z Axis: Normal Mode
A better approach is to devise a way of separating the static and dynamic components of accelerometer, discussed in next section.
Dynamic Acceleration: Fast Mode Dynamic acceleration events from movement, vibration, and shock can be captured when the logger is in “fast mode” (the Logging Interval has been set to “Fast” in HOBOware). The events to be measured should not exceed half the logging frequency. This allows sampling to occur twice as fast at the event. So, for example, with a logging frequency of 100Hz, events should not exceed 50Hz.
As mentioned in the last section, dynamic acceleration is difficult to analyze when combined with the static effect due to gravity. Separating the two involves using post-processing filter functions. Many filtering functions and techniques exist for doing this with varying degrees of complexity and accuracy.
HOBO Pendant G White Paper
1-800-LOGGERS 12 www.onsetcomp.com
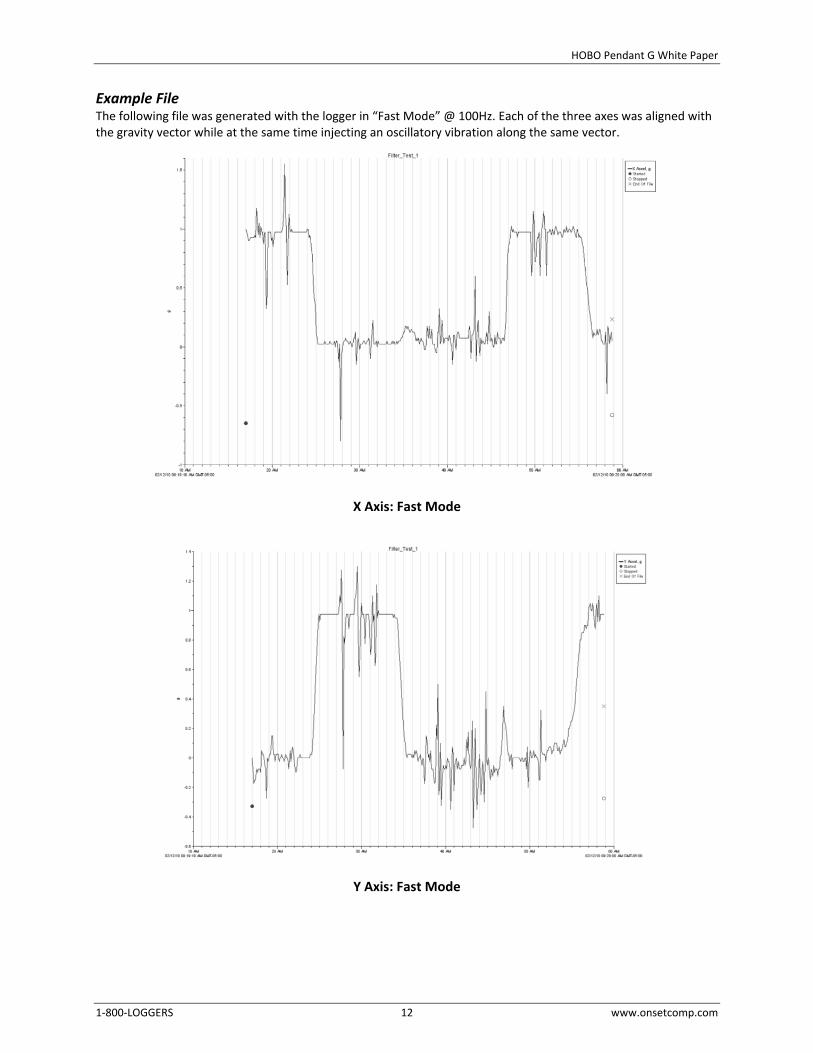
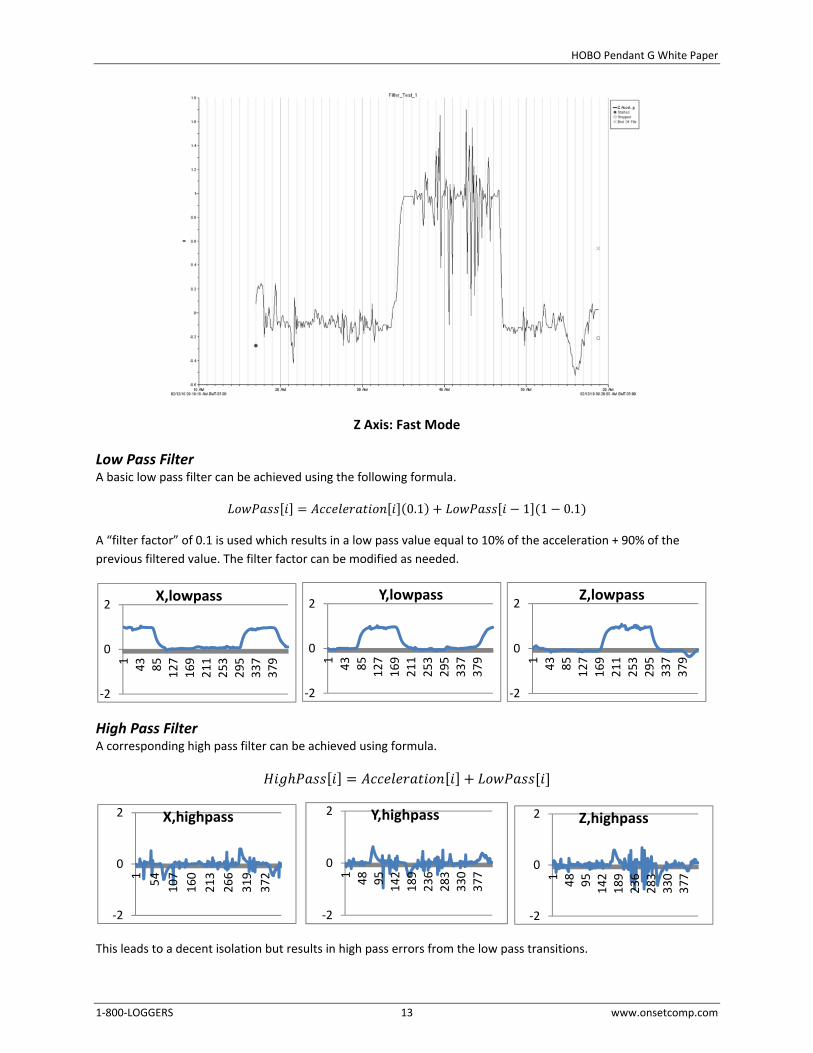
Example File The following file was generated with the logger in “Fast Mode” @ 100Hz. Each of the three axes was aligned with the gravity vector while at the same time injecting an oscillatory vibration along the same vector.
X Axis: Fast Mode
Y Axis: Fast Mode
HOBO Pendant G White Paper
1-800-LOGGERS 13 www.onsetcomp.com
Z Axis: Fast Mode
Low Pass Filter A basic low pass filter can be achieved using the following formula. [ ] = [ ] 0.1 + [ − 1] 1 − 0.1
A “filter factor” of 0.1 is used which results in a low pass value equal to 10% of the acceleration + 90% of the previous filtered value. The filter factor can be modified as needed.
High Pass Filter A corresponding high pass filter can be achieved using formula. ℎ [ ] = [ ] + [ ]
This leads to a decent isolation but results in high pass errors from the low pass transitions.
-2
0
2
1 43 85 127
169
211
253
295
337
379
X,lowpass
-2
0
2
1 43 85 127
169
211
253
295
337
379
Y,lowpass
-2
0
2
1 43 85 127
169
211
253
295
337
379
Z,lowpass
-2
0
2
1 54 107
160
213
266
319
372
X,highpass
-2
0
2
1 48 95 142
189
236
283
330
377
Y,highpass
-2
0
2
1 48 95 142
189
236
283
330
377
Z,highpass
HOBO Pendant G White Paper
1-800-LOGGERS (564-4377) • 508-759-9500 www.onsetcomp.com • [email protected]
© 2013 Onset Computer Corporation. All rights reserved. Onset, HOBO, Pendant, and HOBOware are trademarks or registered trademarks of Onset Computer Corporation.
Patent # 6,826,664 16920-A
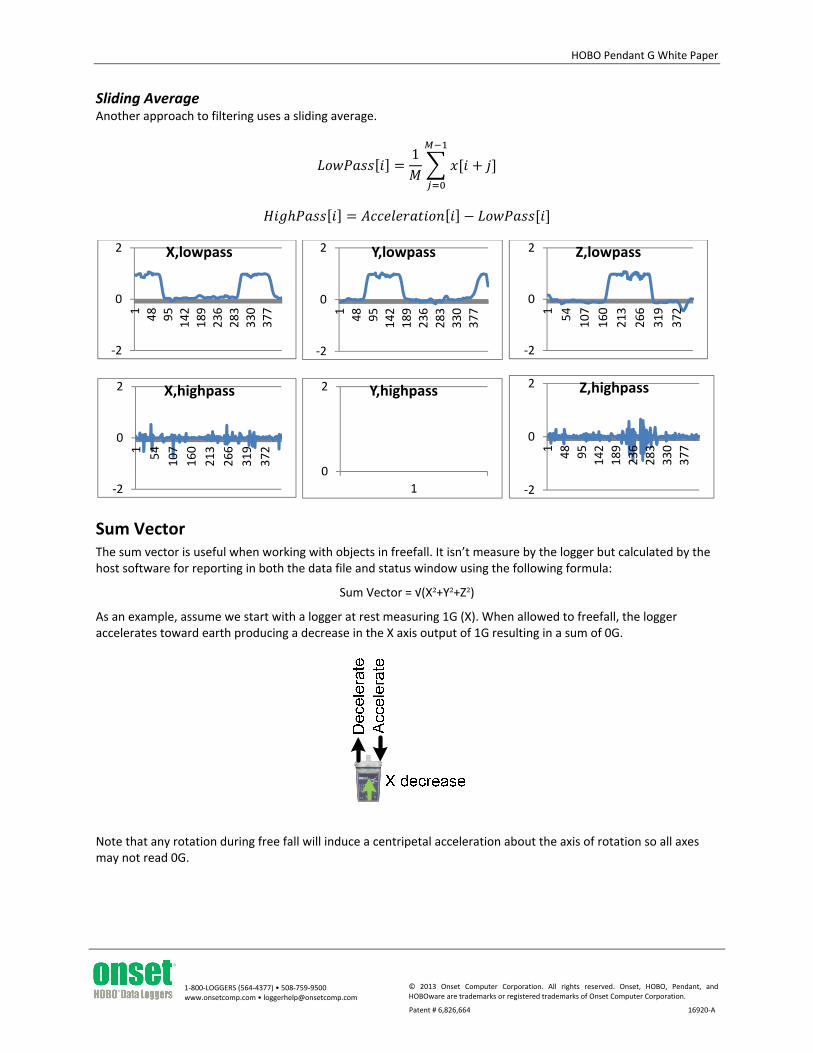
Sliding Average Another approach to filtering uses a sliding average.
[ ] = 1 [ + ] ℎ [ ] = [ ] − [ ]
Sum Vector The sum vector is useful when working with objects in freefall. It isn’t measure by the logger but calculated by the host software for reporting in both the data file and status window using the following formula:
Sum Vector = √(X²+Y²+Z²)
As an example, assume we start with a logger at rest measuring 1G (X). When allowed to freefall, the logger accelerates toward earth producing a decrease in the X axis output of 1G resulting in a sum of 0G.
Note that any rotation during free fall will induce a centripetal acceleration about the axis of rotation so all axes may not read 0G.
-2
0
2
1 48 95 142
189
236
283
330
377
X,lowpass
-2
0
2
1 48 95 142
189
236
283
330
377
Y,lowpass
-2
0
2
1 54 107
160
213
266
319
372
Z,lowpass
-2
0
2
1 54 107
160
213
266
319
372
X,highpass
0
2
1
Y,highpass
-2
0
2
1 48 95 142
189
236
283
330
377
Z,highpass